Hunter, NY Map & Demographics
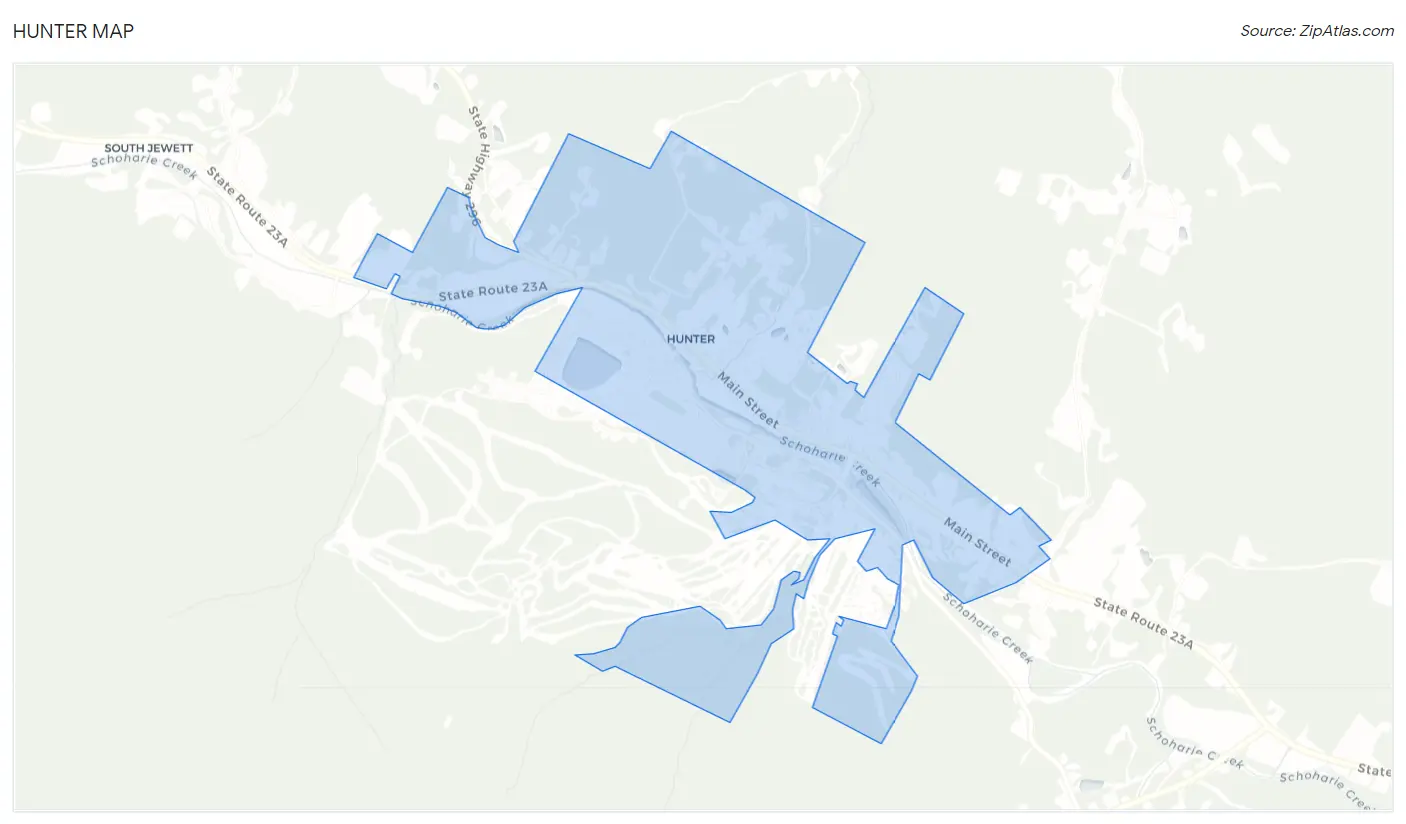
Hunter Map
Hunter Overview
$36,418
PER CAPITA INCOME
$68,393
AVG FAMILY INCOME
$49,844
AVG HOUSEHOLD INCOME
0.47
INEQUALITY / GINI INDEX
300
TOTAL POPULATION
179
MALE POPULATION
121
FEMALE POPULATION
147.93
MALES / 100 FEMALES
67.60
FEMALES / 100 MALES
62.8
MEDIAN AGE
2.3
AVG FAMILY SIZE
1.9
AVG HOUSEHOLD SIZE
163
LABOR FORCE [ PEOPLE ]
57.4%
PERCENT IN LABOR FORCE
10.4%
UNEMPLOYMENT RATE
Hunter Zip Codes
Hunter Area Codes
Income in Hunter
Income Overview in Hunter
Per Capita Income in Hunter is $36,418, while median incomes of families and households are $68,393 and $49,844 respectively.
| Characteristic | Number | Measure |
| Per Capita Income | 300 | $36,418 |
| Median Family Income | 100 | $68,393 |
| Mean Family Income | 100 | $85,028 |
| Median Household Income | 155 | $49,844 |
| Mean Household Income | 155 | $68,732 |
| Income Deficit | 100 | $0 |
| Wage / Income Gap (%) | 300 | 0.00% |
| Wage / Income Gap ($) | 300 | 100.00¢ per $1 |
| Gini / Inequality Index | 300 | 0.47 |
Earnings by Sex in Hunter
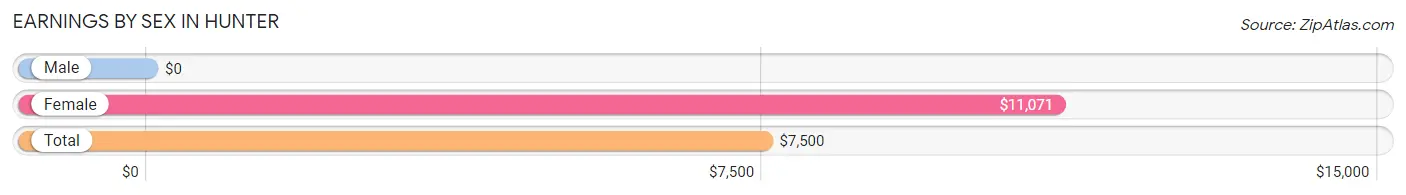
| Sex | Number | Average Earnings |
| Male | 142 (83.5%) | $0 |
| Female | 28 (16.5%) | $11,071 |
| Total | 170 (100.0%) | $7,500 |
Earnings by Sex by Income Bracket in Hunter
The most common earnings brackets in Hunter are $2,500 to $4,999 for men (36 | 25.4%) and $10,000 to $12,499 for women (14 | 50.0%).
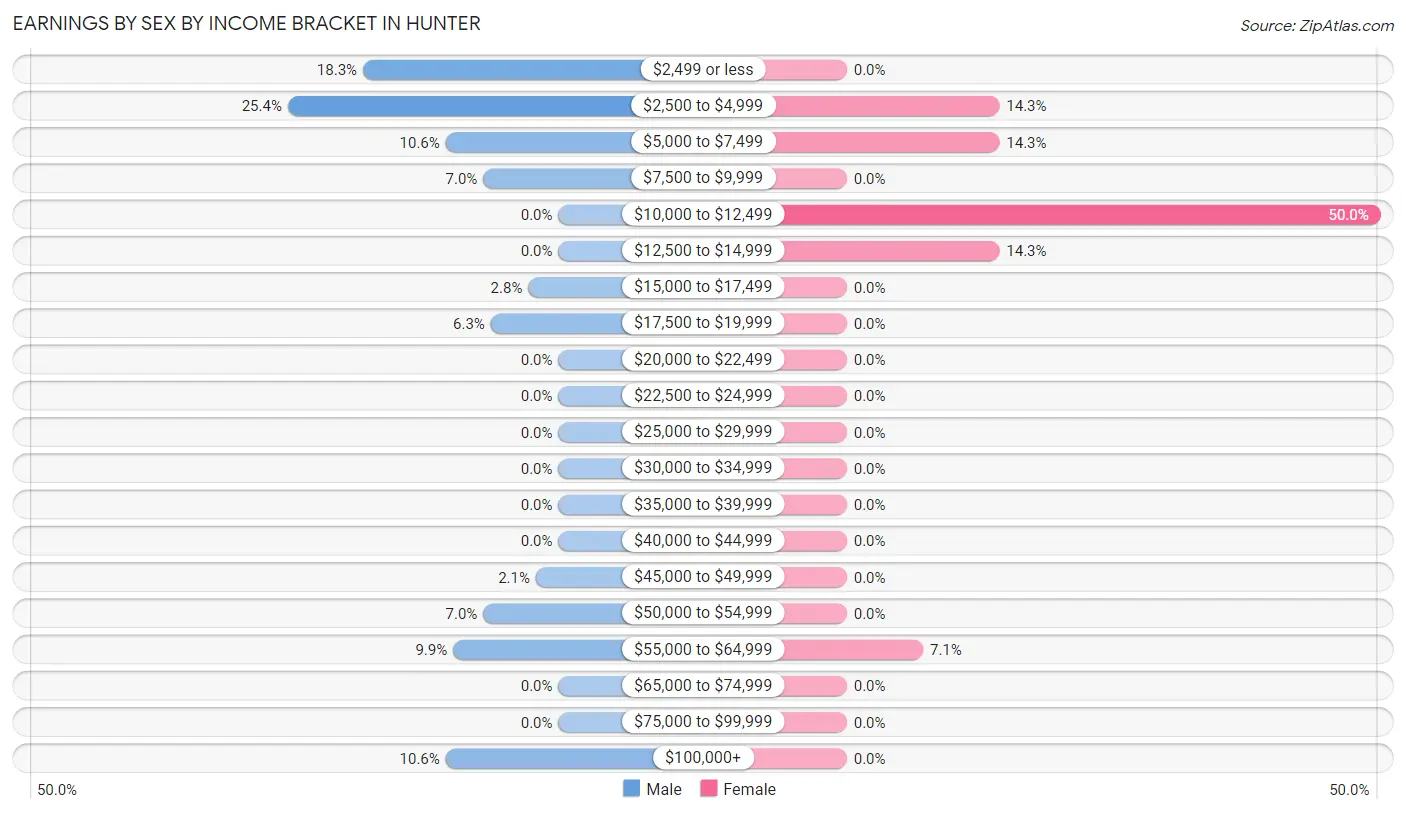
| Income | Male | Female |
| $2,499 or less | 26 (18.3%) | 0 (0.0%) |
| $2,500 to $4,999 | 36 (25.4%) | 4 (14.3%) |
| $5,000 to $7,499 | 15 (10.6%) | 4 (14.3%) |
| $7,500 to $9,999 | 10 (7.0%) | 0 (0.0%) |
| $10,000 to $12,499 | 0 (0.0%) | 14 (50.0%) |
| $12,500 to $14,999 | 0 (0.0%) | 4 (14.3%) |
| $15,000 to $17,499 | 4 (2.8%) | 0 (0.0%) |
| $17,500 to $19,999 | 9 (6.3%) | 0 (0.0%) |
| $20,000 to $22,499 | 0 (0.0%) | 0 (0.0%) |
| $22,500 to $24,999 | 0 (0.0%) | 0 (0.0%) |
| $25,000 to $29,999 | 0 (0.0%) | 0 (0.0%) |
| $30,000 to $34,999 | 0 (0.0%) | 0 (0.0%) |
| $35,000 to $39,999 | 0 (0.0%) | 0 (0.0%) |
| $40,000 to $44,999 | 0 (0.0%) | 0 (0.0%) |
| $45,000 to $49,999 | 3 (2.1%) | 0 (0.0%) |
| $50,000 to $54,999 | 10 (7.0%) | 0 (0.0%) |
| $55,000 to $64,999 | 14 (9.9%) | 2 (7.1%) |
| $65,000 to $74,999 | 0 (0.0%) | 0 (0.0%) |
| $75,000 to $99,999 | 0 (0.0%) | 0 (0.0%) |
| $100,000+ | 15 (10.6%) | 0 (0.0%) |
| Total | 142 (100.0%) | 28 (100.0%) |
Earnings by Sex by Educational Attainment in Hunter
| Educational Attainment | Male Income | Female Income |
| Less than High School | - | - |
| High School Diploma | - | - |
| College or Associate's Degree | - | - |
| Bachelor's Degree | - | - |
| Graduate Degree | - | - |
| Total | - | - |
Family Income in Hunter
Family Income Brackets in Hunter
According to the Hunter family income data, there are 26 families falling into the $150,000 to $199,999 income range, which is the most common income bracket and makes up 26.0% of all families.
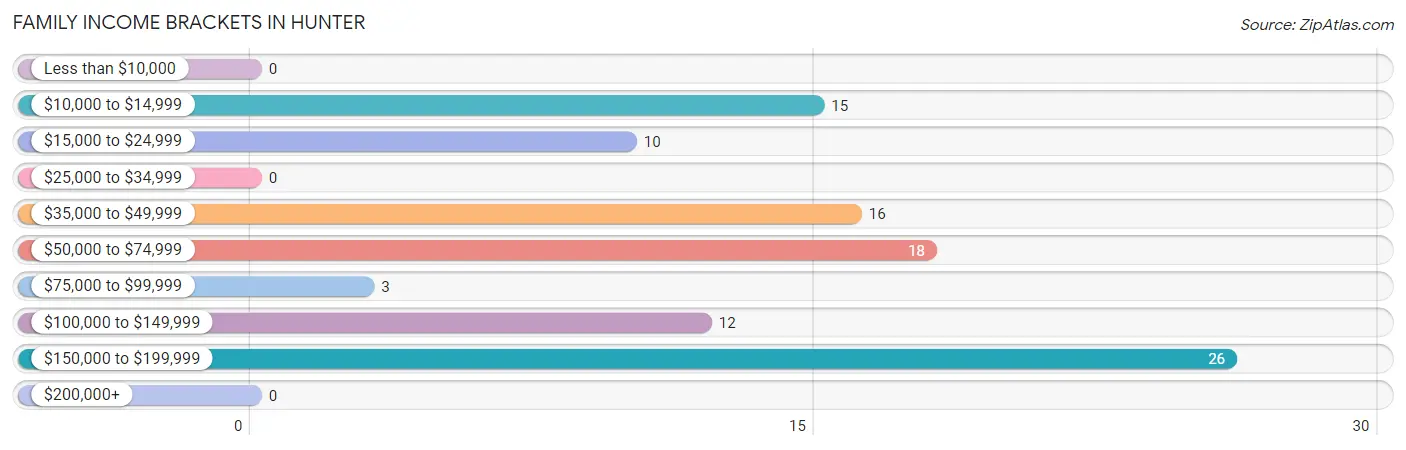
| Income Bracket | # Families | % Families |
| Less than $10,000 | 0 | 0.0% |
| $10,000 to $14,999 | 15 | 15.0% |
| $15,000 to $24,999 | 10 | 10.0% |
| $25,000 to $34,999 | 0 | 0.0% |
| $35,000 to $49,999 | 16 | 16.0% |
| $50,000 to $74,999 | 18 | 18.0% |
| $75,000 to $99,999 | 3 | 3.0% |
| $100,000 to $149,999 | 12 | 12.0% |
| $150,000 to $199,999 | 26 | 26.0% |
| $200,000+ | 0 | 0.0% |
Family Income by Famaliy Size in Hunter
| Income Bracket | # Families | Median Income |
| 2-Person Families | 86 (86.0%) | $0 |
| 3-Person Families | 14 (14.0%) | $0 |
| 4-Person Families | 0 (0.0%) | $0 |
| 5-Person Families | 0 (0.0%) | $0 |
| 6-Person Families | 0 (0.0%) | $0 |
| 7+ Person Families | 0 (0.0%) | $0 |
| Total | 100 (100.0%) | $68,393 |
Family Income by Number of Earners in Hunter
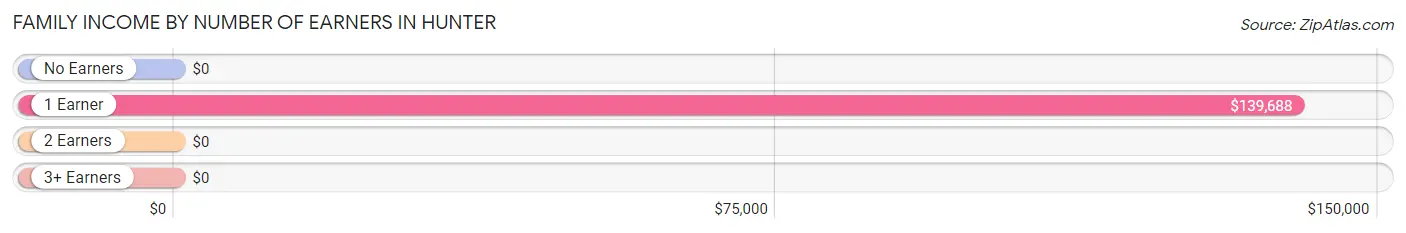
| Number of Earners | # Families | Median Income |
| No Earners | 14 (14.0%) | $0 |
| 1 Earner | 53 (53.0%) | $139,688 |
| 2 Earners | 33 (33.0%) | $0 |
| 3+ Earners | 0 (0.0%) | $0 |
| Total | 100 (100.0%) | $68,393 |
Household Income in Hunter
Household Income Brackets in Hunter
With 28 households falling in the category, the $50,000 to $74,999 income range is the most frequent in Hunter, accounting for 18.1% of all households.
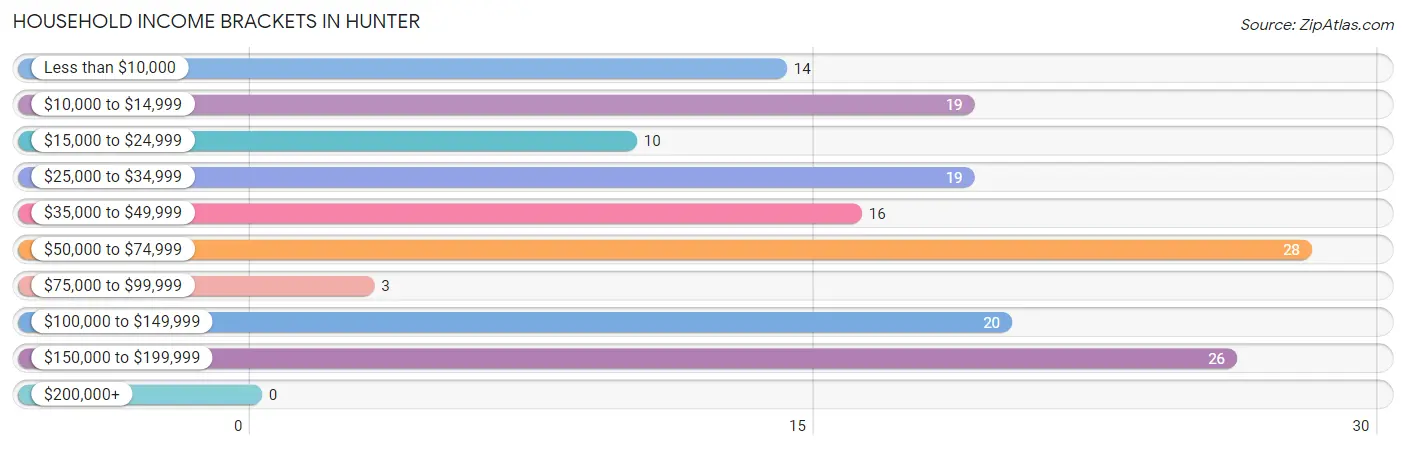
| Income Bracket | # Households | % Households |
| Less than $10,000 | 14 | 9.0% |
| $10,000 to $14,999 | 19 | 12.3% |
| $15,000 to $24,999 | 10 | 6.5% |
| $25,000 to $34,999 | 19 | 12.3% |
| $35,000 to $49,999 | 16 | 10.3% |
| $50,000 to $74,999 | 28 | 18.1% |
| $75,000 to $99,999 | 3 | 1.9% |
| $100,000 to $149,999 | 20 | 12.9% |
| $150,000 to $199,999 | 26 | 16.8% |
| $200,000+ | 0 | 0.0% |
Household Income by Householder Age in Hunter
The median household income in Hunter is $49,844, with the highest median household income of $51,500 found in the 25 to 44 years age bracket for the primary householder. A total of 36 households (23.2%) fall into this category.
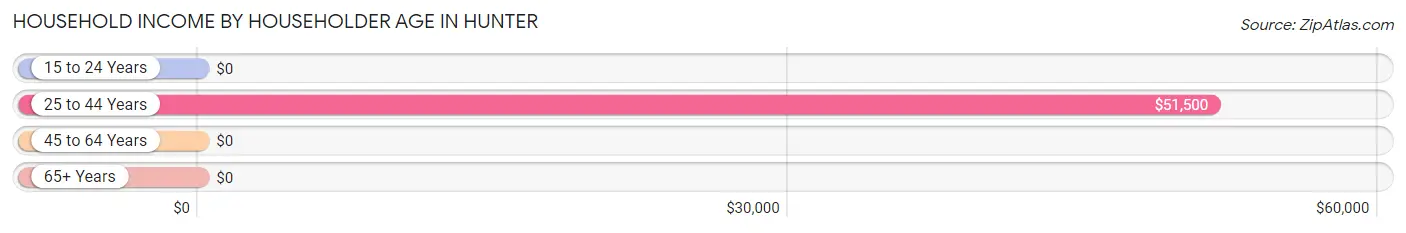
| Income Bracket | # Households | Median Income |
| 15 to 24 Years | 0 (0.0%) | $0 |
| 25 to 44 Years | 36 (23.2%) | $51,500 |
| 45 to 64 Years | 40 (25.8%) | $0 |
| 65+ Years | 79 (51.0%) | $0 |
| Total | 155 (100.0%) | $49,844 |
Poverty in Hunter
Income Below Poverty by Sex and Age in Hunter
With 34.6% poverty level for males and 15.7% for females among the residents of Hunter, 35 to 44 year old males and 55 to 64 year old females are the most vulnerable to poverty, with 27 males (75.0%) and 13 females (35.1%) in their respective age groups living below the poverty level.
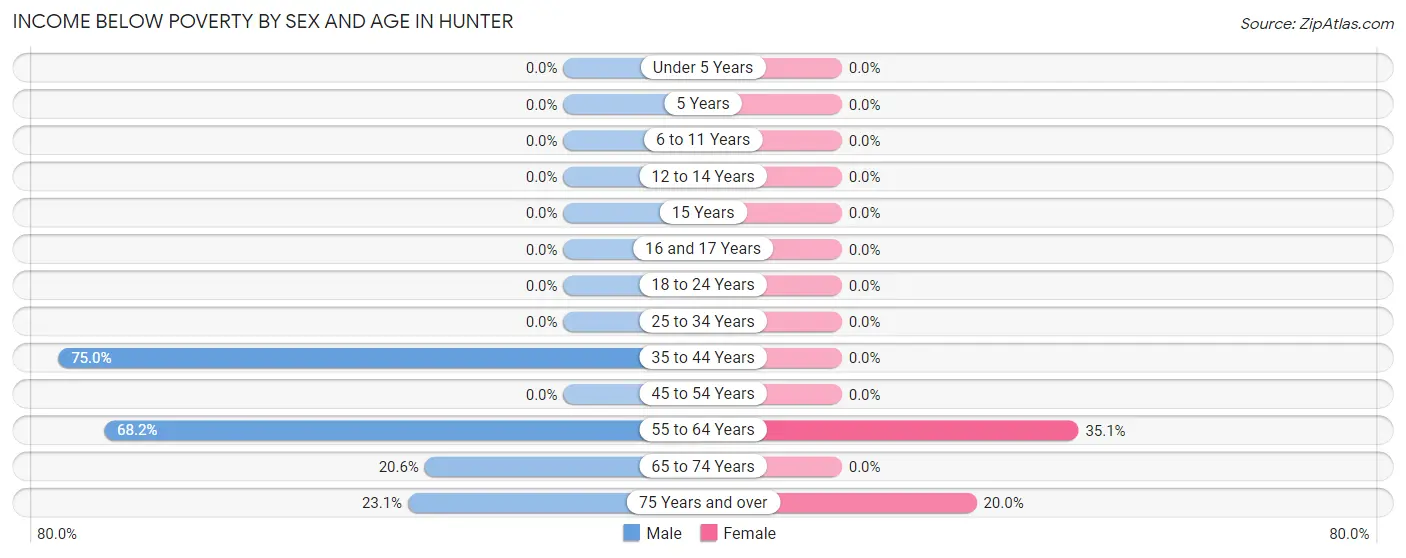
| Age Bracket | Male | Female |
| Under 5 Years | 0 (0.0%) | 0 (0.0%) |
| 5 Years | 0 (0.0%) | 0 (0.0%) |
| 6 to 11 Years | 0 (0.0%) | 0 (0.0%) |
| 12 to 14 Years | 0 (0.0%) | 0 (0.0%) |
| 15 Years | 0 (0.0%) | 0 (0.0%) |
| 16 and 17 Years | 0 (0.0%) | 0 (0.0%) |
| 18 to 24 Years | 0 (0.0%) | 0 (0.0%) |
| 25 to 34 Years | 0 (0.0%) | 0 (0.0%) |
| 35 to 44 Years | 27 (75.0%) | 0 (0.0%) |
| 45 to 54 Years | 0 (0.0%) | 0 (0.0%) |
| 55 to 64 Years | 15 (68.2%) | 13 (35.1%) |
| 65 to 74 Years | 14 (20.6%) | 0 (0.0%) |
| 75 Years and over | 6 (23.1%) | 6 (20.0%) |
| Total | 62 (34.6%) | 19 (15.7%) |
Income Above Poverty by Sex and Age in Hunter
According to the poverty statistics in Hunter, males aged 18 to 24 years and females aged under 5 years are the age groups that are most secure financially, with 100.0% of males and 100.0% of females in these age groups living above the poverty line.
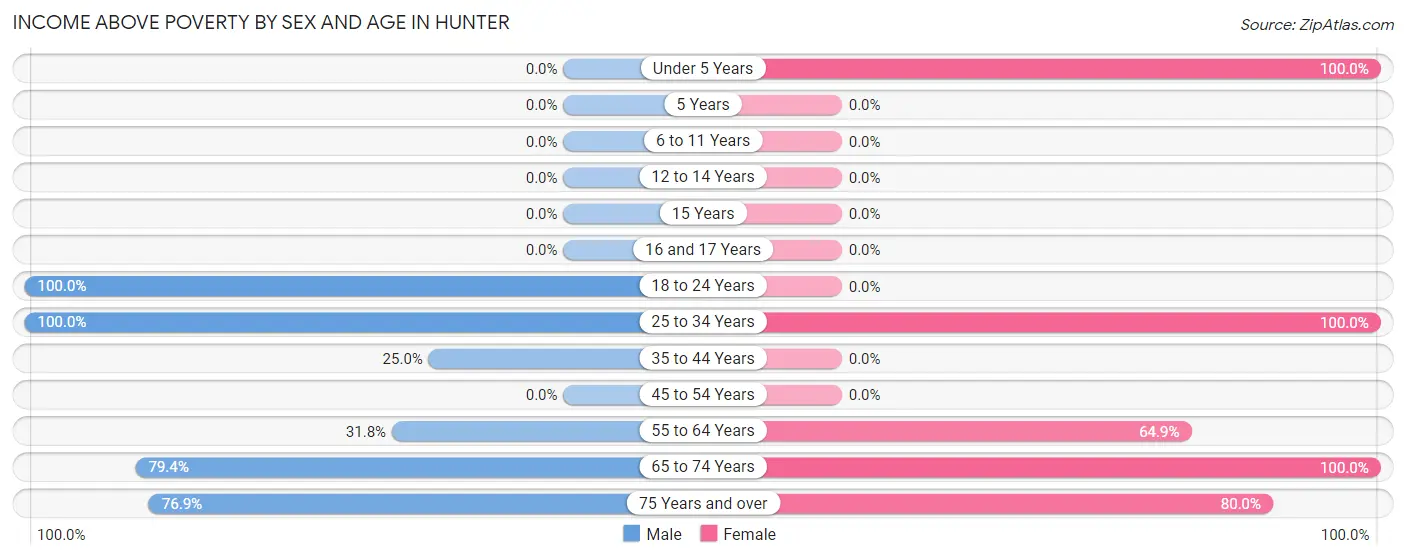
| Age Bracket | Male | Female |
| Under 5 Years | 0 (0.0%) | 16 (100.0%) |
| 5 Years | 0 (0.0%) | 0 (0.0%) |
| 6 to 11 Years | 0 (0.0%) | 0 (0.0%) |
| 12 to 14 Years | 0 (0.0%) | 0 (0.0%) |
| 15 Years | 0 (0.0%) | 0 (0.0%) |
| 16 and 17 Years | 0 (0.0%) | 0 (0.0%) |
| 18 to 24 Years | 14 (100.0%) | 0 (0.0%) |
| 25 to 34 Years | 13 (100.0%) | 16 (100.0%) |
| 35 to 44 Years | 9 (25.0%) | 0 (0.0%) |
| 45 to 54 Years | 0 (0.0%) | 0 (0.0%) |
| 55 to 64 Years | 7 (31.8%) | 24 (64.9%) |
| 65 to 74 Years | 54 (79.4%) | 22 (100.0%) |
| 75 Years and over | 20 (76.9%) | 24 (80.0%) |
| Total | 117 (65.4%) | 102 (84.3%) |
Income Below Poverty Among Married-Couple Families in Hunter
The poverty statistics for married-couple families in Hunter show that 7.5% or 6 of the total 80 families live below the poverty line. Families with no children have the highest poverty rate of 9.1%, comprising of 6 families. On the other hand, families with 1 or 2 children have the lowest poverty rate of 0.0%, which includes 0 families.
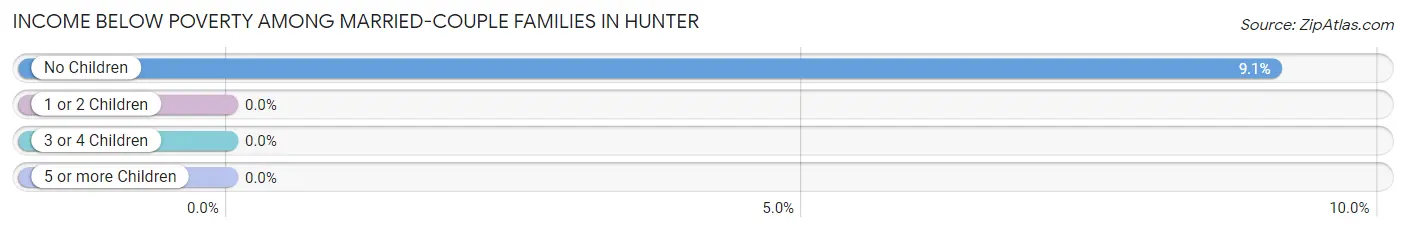
| Children | Above Poverty | Below Poverty |
| No Children | 60 (90.9%) | 6 (9.1%) |
| 1 or 2 Children | 14 (100.0%) | 0 (0.0%) |
| 3 or 4 Children | 0 (0.0%) | 0 (0.0%) |
| 5 or more Children | 0 (0.0%) | 0 (0.0%) |
| Total | 74 (92.5%) | 6 (7.5%) |
Income Below Poverty Among Single-Parent Households in Hunter
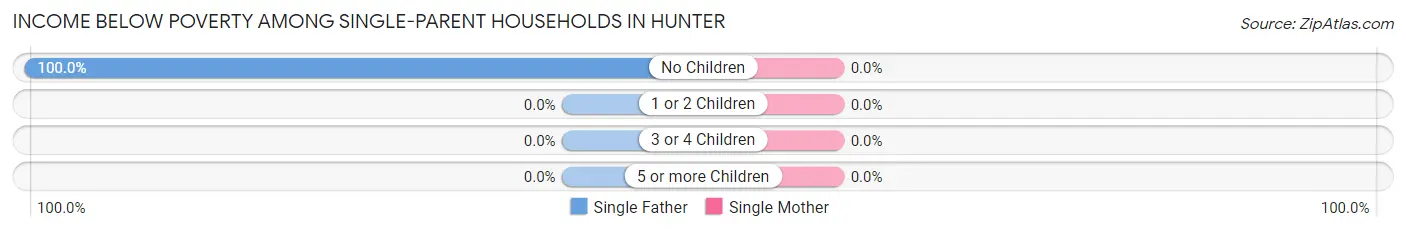
| Children | Single Father | Single Mother |
| No Children | 15 (100.0%) | 0 (0.0%) |
| 1 or 2 Children | 0 (0.0%) | 0 (0.0%) |
| 3 or 4 Children | 0 (0.0%) | 0 (0.0%) |
| 5 or more Children | 0 (0.0%) | 0 (0.0%) |
| Total | 15 (100.0%) | 0 (0.0%) |
Income Below Poverty Among Married-Couple vs Single-Parent Households in Hunter
The poverty data for Hunter shows that 6 of the married-couple family households (7.5%) and 15 of the single-parent households (75.0%) are living below the poverty level. Within the married-couple family households, those with no children have the highest poverty rate, with 6 households (9.1%) falling below the poverty line. Among the single-parent households, those with no children have the highest poverty rate, with 15 household (75.0%) living below poverty.
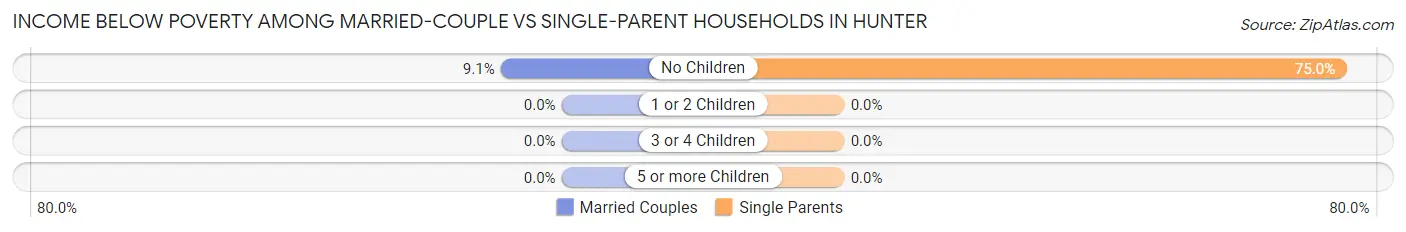
| Children | Married-Couple Families | Single-Parent Households |
| No Children | 6 (9.1%) | 15 (75.0%) |
| 1 or 2 Children | 0 (0.0%) | 0 (0.0%) |
| 3 or 4 Children | 0 (0.0%) | 0 (0.0%) |
| 5 or more Children | 0 (0.0%) | 0 (0.0%) |
| Total | 6 (7.5%) | 15 (75.0%) |
Race in Hunter
The most populous races in Hunter are White / Caucasian (298 | 99.3%), Hispanic or Latino (2 | 0.7%), and Some other Race (2 | 0.7%).
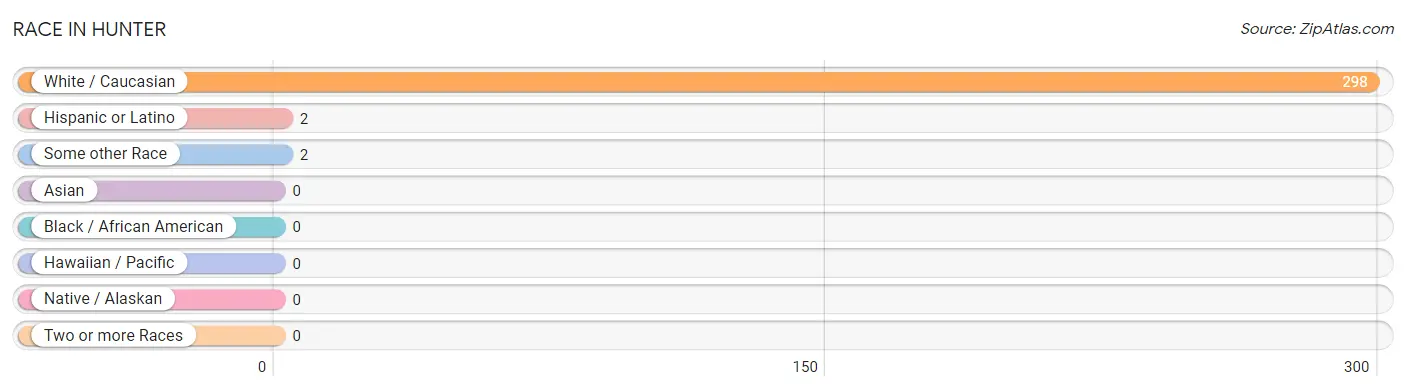
| Race | # Population | % Population |
| Asian | 0 | 0.0% |
| Black / African American | 0 | 0.0% |
| Hawaiian / Pacific | 0 | 0.0% |
| Hispanic or Latino | 2 | 0.7% |
| Native / Alaskan | 0 | 0.0% |
| White / Caucasian | 298 | 99.3% |
| Two or more Races | 0 | 0.0% |
| Some other Race | 2 | 0.7% |
| Total | 300 | 100.0% |
Ancestry in Hunter
The most populous ancestries reported in Hunter are Ukrainian (71 | 23.7%), German (50 | 16.7%), Italian (38 | 12.7%), Irish (29 | 9.7%), and English (21 | 7.0%), together accounting for 69.7% of all Hunter residents.
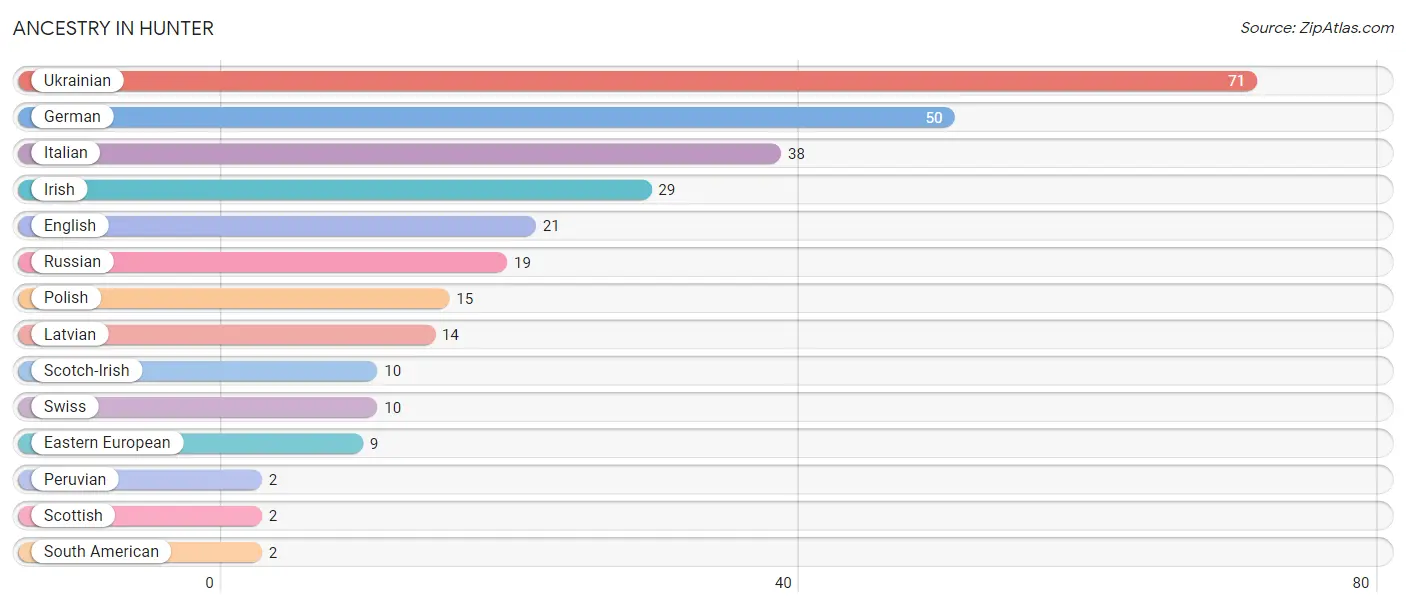
| Ancestry | # Population | % Population |
| Eastern European | 9 | 3.0% |
| English | 21 | 7.0% |
| German | 50 | 16.7% |
| Irish | 29 | 9.7% |
| Italian | 38 | 12.7% |
| Latvian | 14 | 4.7% |
| Peruvian | 2 | 0.7% |
| Polish | 15 | 5.0% |
| Russian | 19 | 6.3% |
| Scotch-Irish | 10 | 3.3% |
| Scottish | 2 | 0.7% |
| South American | 2 | 0.7% |
| Swiss | 10 | 3.3% |
| Ukrainian | 71 | 23.7% | View All 14 Rows |
Immigrants in Hunter
The most numerous immigrant groups reported in Hunter came from Europe (75 | 25.0%), Eastern Europe (67 | 22.3%), Ukraine (59 | 19.7%), Germany (4 | 1.3%), and Italy (4 | 1.3%), together accounting for 69.7% of all Hunter residents.
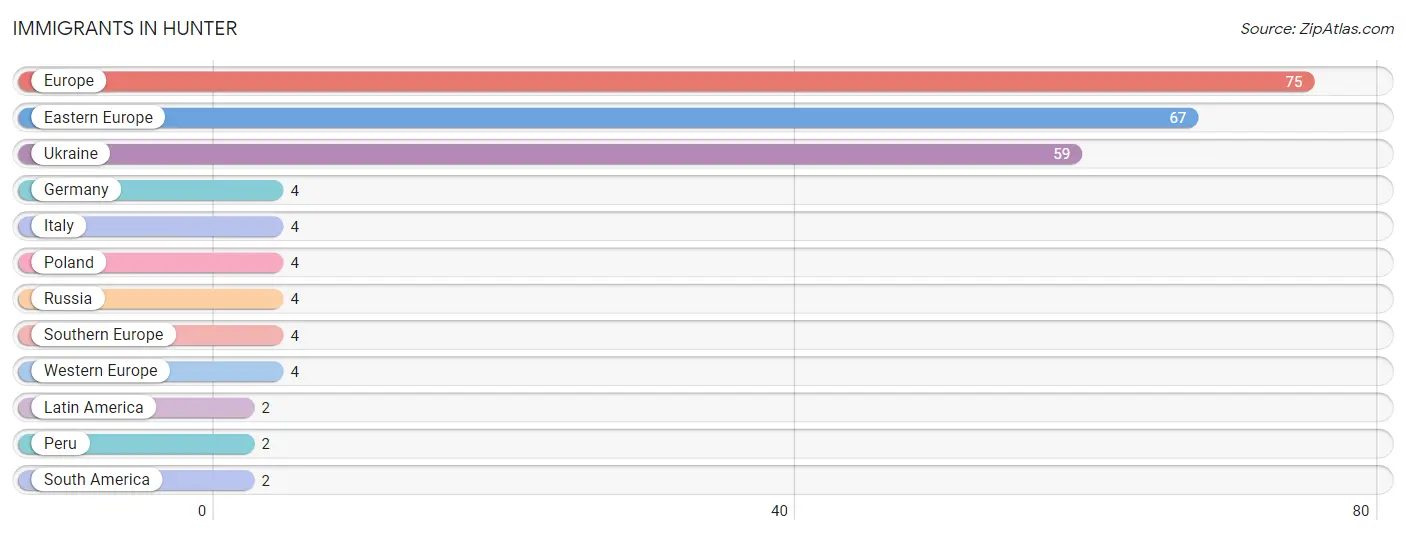
| Immigration Origin | # Population | % Population |
| Eastern Europe | 67 | 22.3% |
| Europe | 75 | 25.0% |
| Germany | 4 | 1.3% |
| Italy | 4 | 1.3% |
| Latin America | 2 | 0.7% |
| Peru | 2 | 0.7% |
| Poland | 4 | 1.3% |
| Russia | 4 | 1.3% |
| South America | 2 | 0.7% |
| Southern Europe | 4 | 1.3% |
| Ukraine | 59 | 19.7% |
| Western Europe | 4 | 1.3% | View All 12 Rows |
Sex and Age in Hunter
Sex and Age in Hunter
The most populous age groups in Hunter are 70 to 74 Years (39 | 21.8%) for men and 55 to 59 Years (21 | 17.4%) for women.
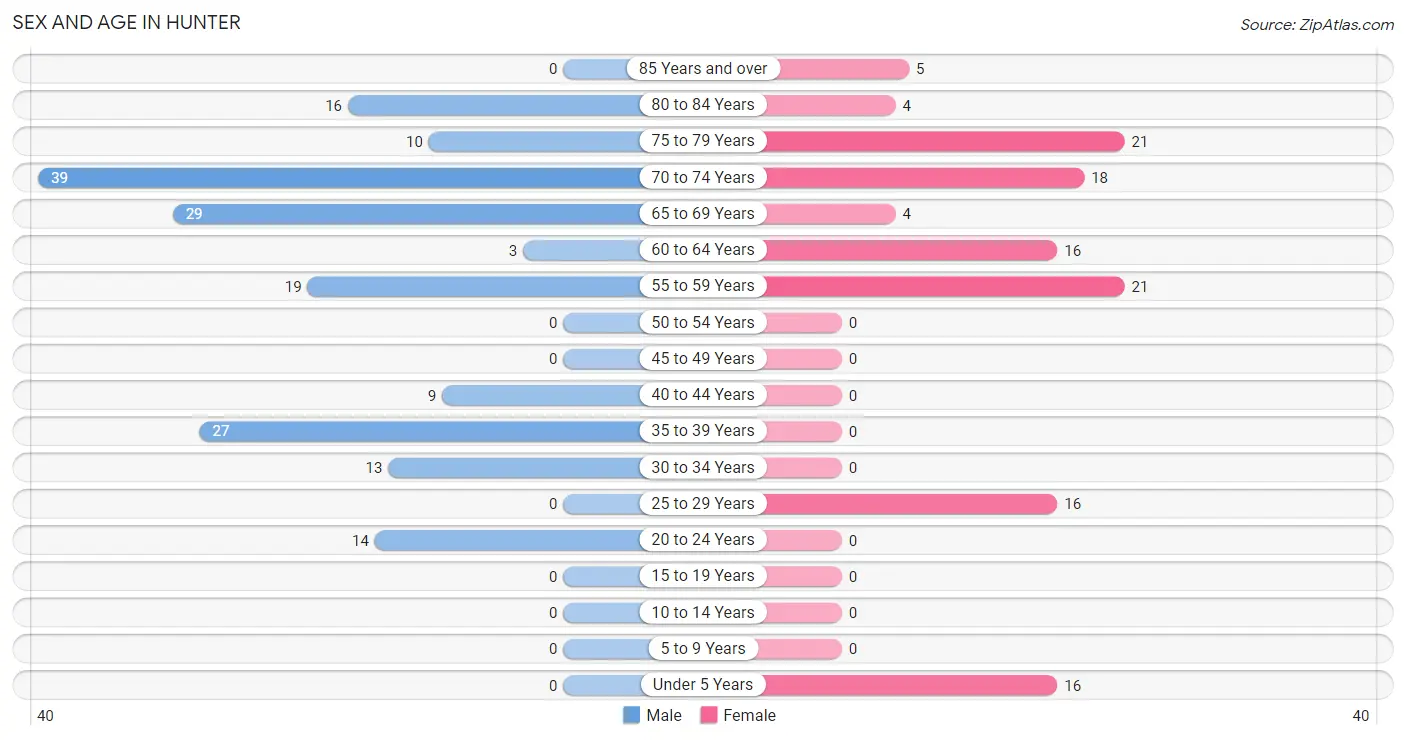
| Age Bracket | Male | Female |
| Under 5 Years | 0 (0.0%) | 16 (13.2%) |
| 5 to 9 Years | 0 (0.0%) | 0 (0.0%) |
| 10 to 14 Years | 0 (0.0%) | 0 (0.0%) |
| 15 to 19 Years | 0 (0.0%) | 0 (0.0%) |
| 20 to 24 Years | 14 (7.8%) | 0 (0.0%) |
| 25 to 29 Years | 0 (0.0%) | 16 (13.2%) |
| 30 to 34 Years | 13 (7.3%) | 0 (0.0%) |
| 35 to 39 Years | 27 (15.1%) | 0 (0.0%) |
| 40 to 44 Years | 9 (5.0%) | 0 (0.0%) |
| 45 to 49 Years | 0 (0.0%) | 0 (0.0%) |
| 50 to 54 Years | 0 (0.0%) | 0 (0.0%) |
| 55 to 59 Years | 19 (10.6%) | 21 (17.4%) |
| 60 to 64 Years | 3 (1.7%) | 16 (13.2%) |
| 65 to 69 Years | 29 (16.2%) | 4 (3.3%) |
| 70 to 74 Years | 39 (21.8%) | 18 (14.9%) |
| 75 to 79 Years | 10 (5.6%) | 21 (17.4%) |
| 80 to 84 Years | 16 (8.9%) | 4 (3.3%) |
| 85 Years and over | 0 (0.0%) | 5 (4.1%) |
| Total | 179 (100.0%) | 121 (100.0%) |
Families and Households in Hunter
Median Family Size in Hunter
The median family size in Hunter is 2.32 persons per family, with single female/mother families (5 | 5.0%) accounting for the largest median family size of 3 persons per family. On the other hand, married-couple families (80 | 80.0%) represent the smallest median family size with 2.19 persons per family.

| Family Type | # Families | Family Size |
| Married-Couple | 80 (80.0%) | 2.19 |
| Single Male/Father | 15 (15.0%) | 2.80 |
| Single Female/Mother | 5 (5.0%) | 3.00 |
| Total Families | 100 (100.0%) | 2.32 |
Median Household Size in Hunter
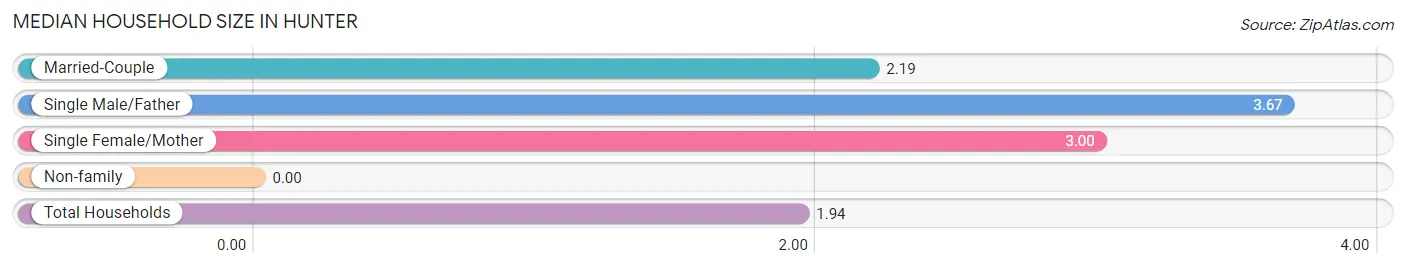
| Household Type | # Households | Household Size |
| Married-Couple | 80 (51.6%) | 2.19 |
| Single Male/Father | 15 (9.7%) | 3.67 |
| Single Female/Mother | 5 (3.2%) | 3.00 |
| Non-family | 55 (35.5%) | - |
| Total Households | 155 (100.0%) | 1.94 |
Household Size by Marriage Status in Hunter
Out of a total of 155 households in Hunter, 100 (64.5%) are family households, while 55 (35.5%) are nonfamily households. The most numerous type of family households are 2-person households, comprising 71, and the most common type of nonfamily households are 1-person households, comprising 55.
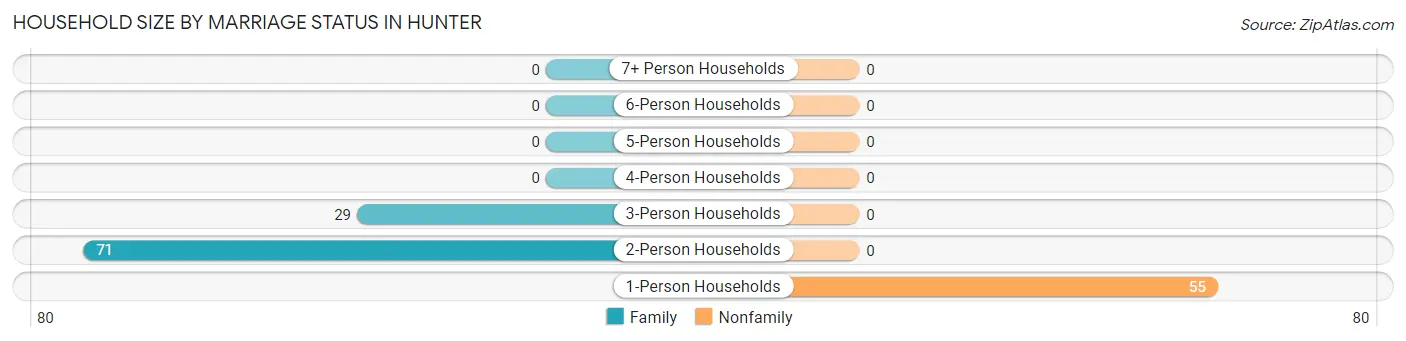
| Household Size | Family Households | Nonfamily Households |
| 1-Person Households | - | 55 (35.5%) |
| 2-Person Households | 71 (45.8%) | 0 (0.0%) |
| 3-Person Households | 29 (18.7%) | 0 (0.0%) |
| 4-Person Households | 0 (0.0%) | 0 (0.0%) |
| 5-Person Households | 0 (0.0%) | 0 (0.0%) |
| 6-Person Households | 0 (0.0%) | 0 (0.0%) |
| 7+ Person Households | 0 (0.0%) | 0 (0.0%) |
| Total | 100 (64.5%) | 55 (35.5%) |
Female Fertility in Hunter
Fertility by Age in Hunter
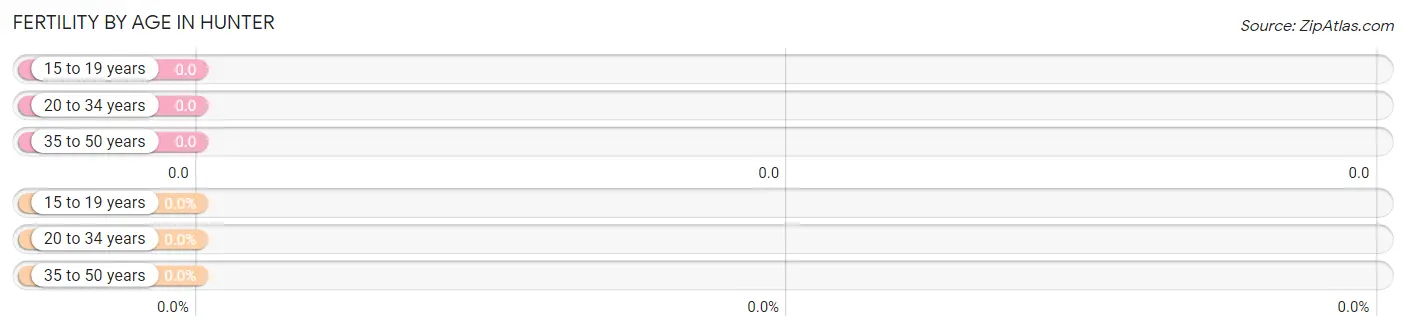
| Age Bracket | Women with Births | Births / 1,000 Women |
| 15 to 19 years | 0 (0.0%) | 0.0 |
| 20 to 34 years | 0 (0.0%) | 0.0 |
| 35 to 50 years | 0 (0.0%) | 0.0 |
| Total | 0 (0.0%) | 0.0 |
Fertility by Age by Marriage Status in Hunter
| Age Bracket | Married | Unmarried |
| 15 to 19 years | 0 (0.0%) | 0 (0.0%) |
| 20 to 34 years | 0 (0.0%) | 0 (0.0%) |
| 35 to 50 years | 0 (0.0%) | 0 (0.0%) |
| Total | 0 (0.0%) | 0 (0.0%) |
Fertility by Education in Hunter
| Educational Attainment | Women with Births | Births / 1,000 Women |
| Less than High School | 0 (0.0%) | 0.0 |
| High School Diploma | 0 (0.0%) | 0.0 |
| College or Associate's Degree | 0 (0.0%) | 0.0 |
| Bachelor's Degree | 0 (0.0%) | 0.0 |
| Graduate Degree | 0 (0.0%) | 0.0 |
| Total | 0 (0.0%) | 0.0 |
Fertility by Education by Marriage Status in Hunter
| Educational Attainment | Married | Unmarried |
| Less than High School | 0 (0.0%) | 0 (0.0%) |
| High School Diploma | 0 (0.0%) | 0 (0.0%) |
| College or Associate's Degree | 0 (0.0%) | 0 (0.0%) |
| Bachelor's Degree | 0 (0.0%) | 0 (0.0%) |
| Graduate Degree | 0 (0.0%) | 0 (0.0%) |
| Total | 0 (0.0%) | 0 (0.0%) |
Employment Characteristics in Hunter
Employment by Class of Employer in Hunter
Among the 119 employed individuals in Hunter, private company employees (45 | 37.8%), self-employed (not incorporated) (34 | 28.6%), and self-employed (incorporated) (15 | 12.6%) make up the most common classes of employment.
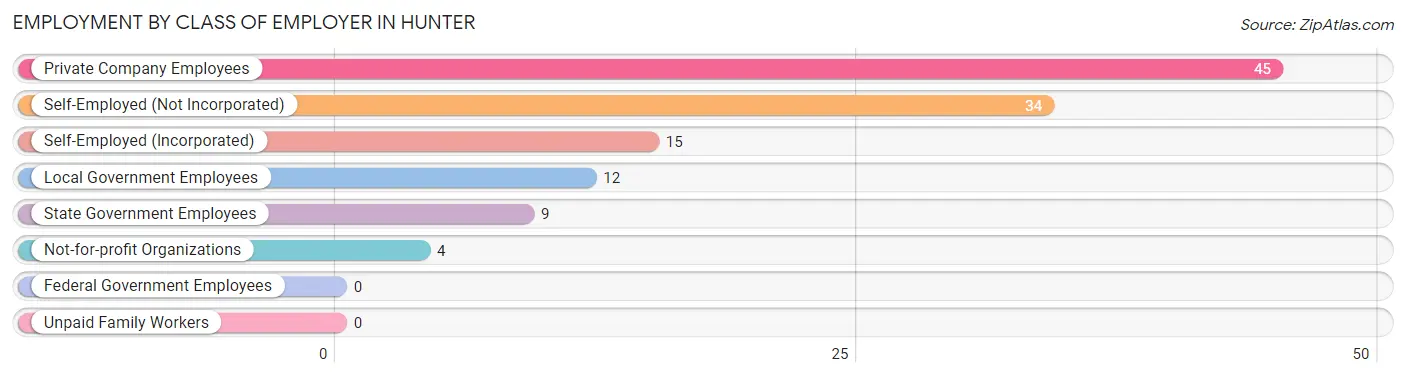
| Employer Class | # Employees | % Employees |
| Private Company Employees | 45 | 37.8% |
| Self-Employed (Incorporated) | 15 | 12.6% |
| Self-Employed (Not Incorporated) | 34 | 28.6% |
| Not-for-profit Organizations | 4 | 3.4% |
| Local Government Employees | 12 | 10.1% |
| State Government Employees | 9 | 7.6% |
| Federal Government Employees | 0 | 0.0% |
| Unpaid Family Workers | 0 | 0.0% |
| Total | 119 | 100.0% |
Employment Status by Age in Hunter
According to the labor force statistics for Hunter, out of the total population over 16 years of age (284), 57.4% or 163 individuals are in the labor force, with 10.4% or 17 of them unemployed. The age group with the highest labor force participation rate is 20 to 24 years, with 100.0% or 14 individuals in the labor force. Within the labor force, the 55 to 59 years age range has the highest percentage of unemployed individuals, with 65.2% or 15 of them being unemployed.
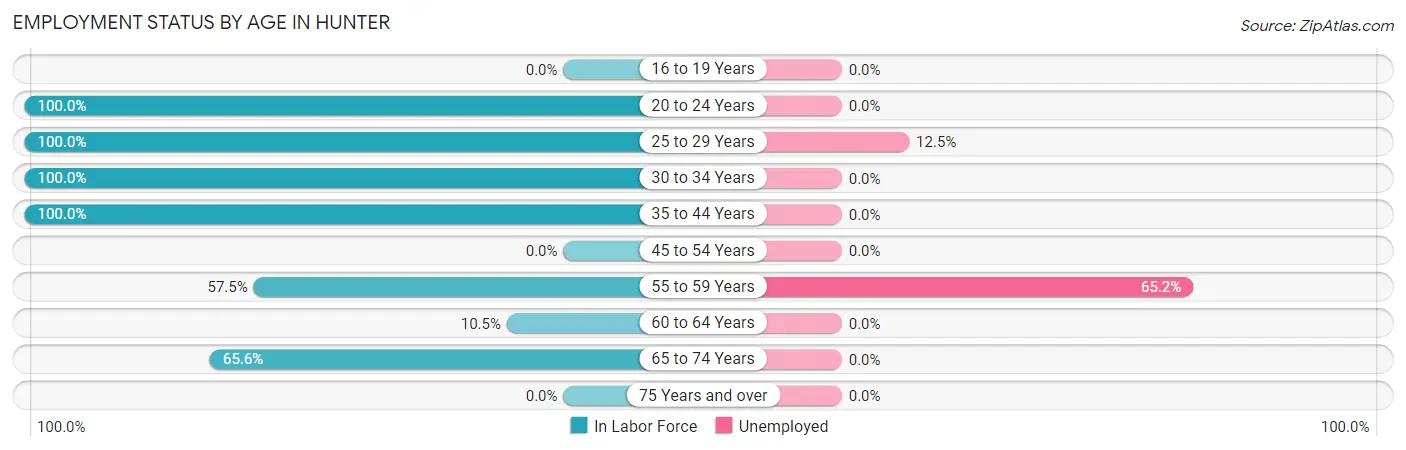
| Age Bracket | In Labor Force | Unemployed |
| 16 to 19 Years | 0 (0.0%) | 0 (0.0%) |
| 20 to 24 Years | 14 (100.0%) | 0 (0.0%) |
| 25 to 29 Years | 16 (100.0%) | 2 (12.5%) |
| 30 to 34 Years | 13 (100.0%) | 0 (0.0%) |
| 35 to 44 Years | 36 (100.0%) | 0 (0.0%) |
| 45 to 54 Years | 0 (0.0%) | 0 (0.0%) |
| 55 to 59 Years | 23 (57.5%) | 15 (65.2%) |
| 60 to 64 Years | 2 (10.5%) | 0 (0.0%) |
| 65 to 74 Years | 59 (65.6%) | 0 (0.0%) |
| 75 Years and over | 0 (0.0%) | 0 (0.0%) |
| Total | 163 (57.4%) | 17 (10.4%) |
Employment Status by Educational Attainment in Hunter
According to labor force statistics for Hunter, 72.6% of individuals (90) out of the total population between 25 and 64 years of age (124) are in the labor force, with 18.9% or 17 of them being unemployed. The group with the highest labor force participation rate are those with the educational attainment of high school diploma, with 85.2% or 75 individuals in the labor force. Within the labor force, individuals with high school diploma education have the highest percentage of unemployment, with 20.0% or 15 of them being unemployed.
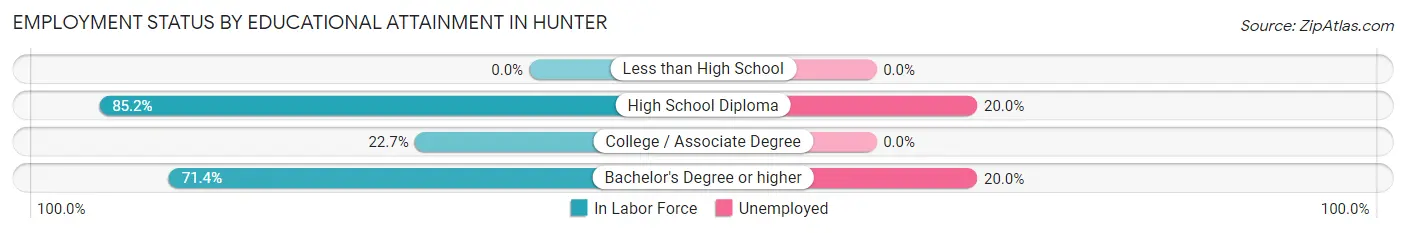
| Educational Attainment | In Labor Force | Unemployed |
| Less than High School | 0 (0.0%) | 0 (0.0%) |
| High School Diploma | 75 (85.2%) | 18 (20.0%) |
| College / Associate Degree | 5 (22.7%) | 0 (0.0%) |
| Bachelor's Degree or higher | 10 (71.4%) | 3 (20.0%) |
| Total | 90 (72.6%) | 23 (18.9%) |
Employment Occupations by Sex in Hunter
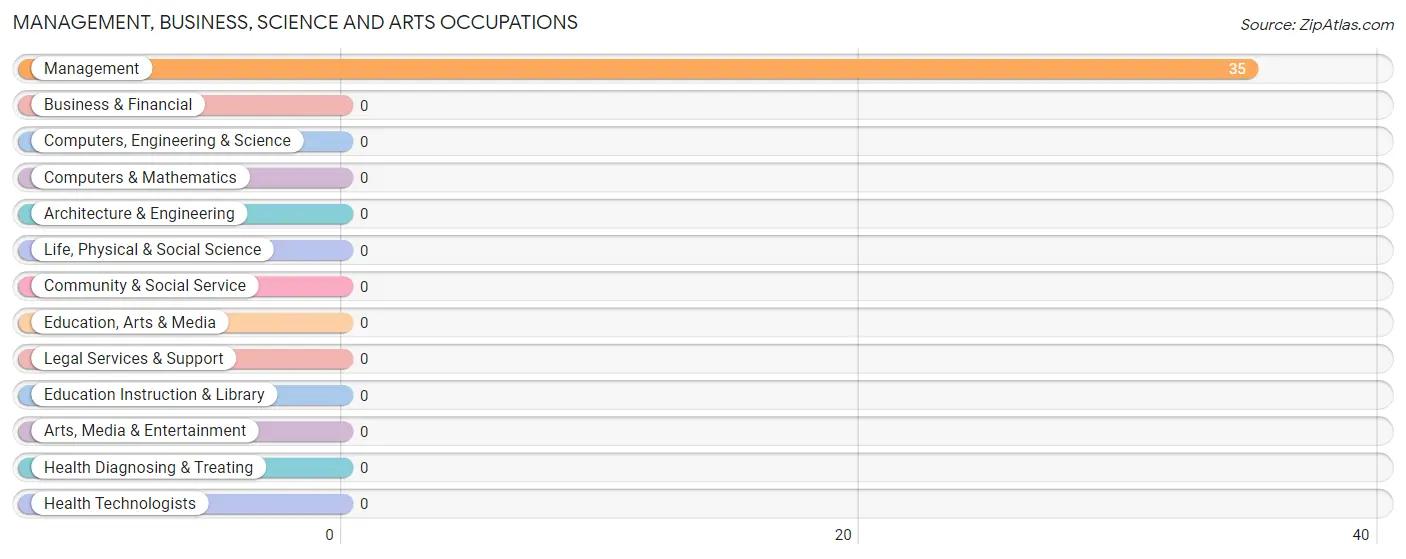
Management, Business, Science and Arts Occupations
The most common Management, Business, Science and Arts occupations in Hunter are , and Management (35 | 24.0%).
Management, Business, Science and Arts Occupations by Sex
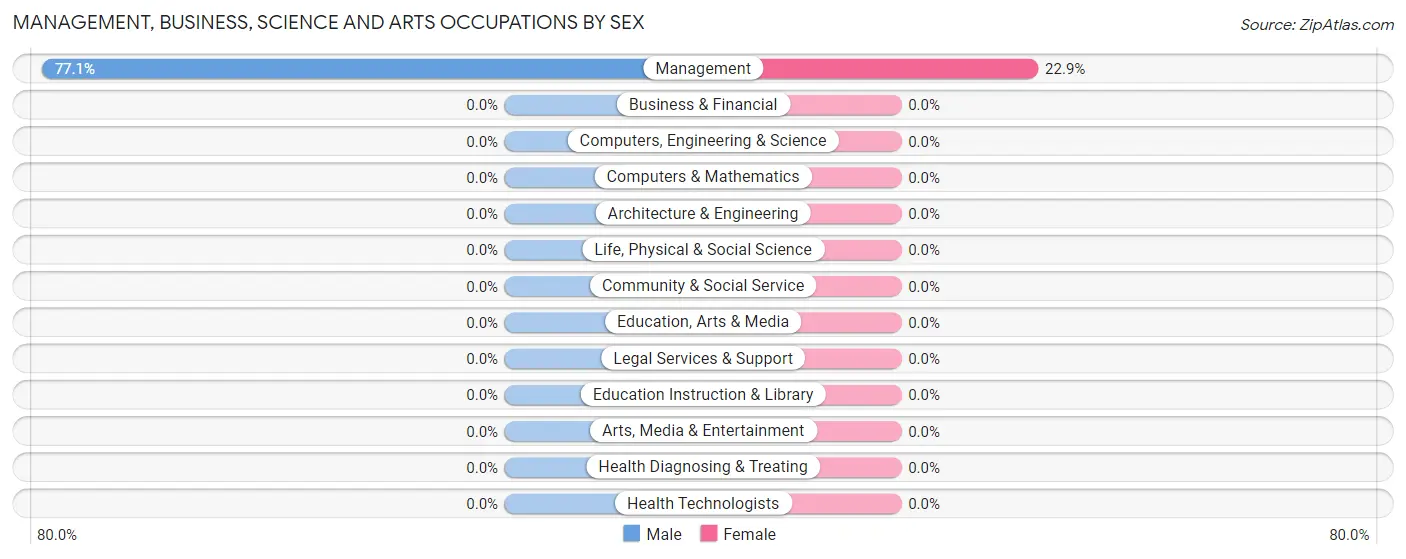
| Occupation | Male | Female |
| Management | 27 (77.1%) | 8 (22.9%) |
| Business & Financial | 0 (0.0%) | 0 (0.0%) |
| Computers, Engineering & Science | 0 (0.0%) | 0 (0.0%) |
| Computers & Mathematics | 0 (0.0%) | 0 (0.0%) |
| Architecture & Engineering | 0 (0.0%) | 0 (0.0%) |
| Life, Physical & Social Science | 0 (0.0%) | 0 (0.0%) |
| Community & Social Service | 0 (0.0%) | 0 (0.0%) |
| Education, Arts & Media | 0 (0.0%) | 0 (0.0%) |
| Legal Services & Support | 0 (0.0%) | 0 (0.0%) |
| Education Instruction & Library | 0 (0.0%) | 0 (0.0%) |
| Arts, Media & Entertainment | 0 (0.0%) | 0 (0.0%) |
| Health Diagnosing & Treating | 0 (0.0%) | 0 (0.0%) |
| Health Technologists | 0 (0.0%) | 0 (0.0%) |
| Total (Category) | 27 (77.1%) | 8 (22.9%) |
| Total (Overall) | 118 (80.8%) | 28 (19.2%) |
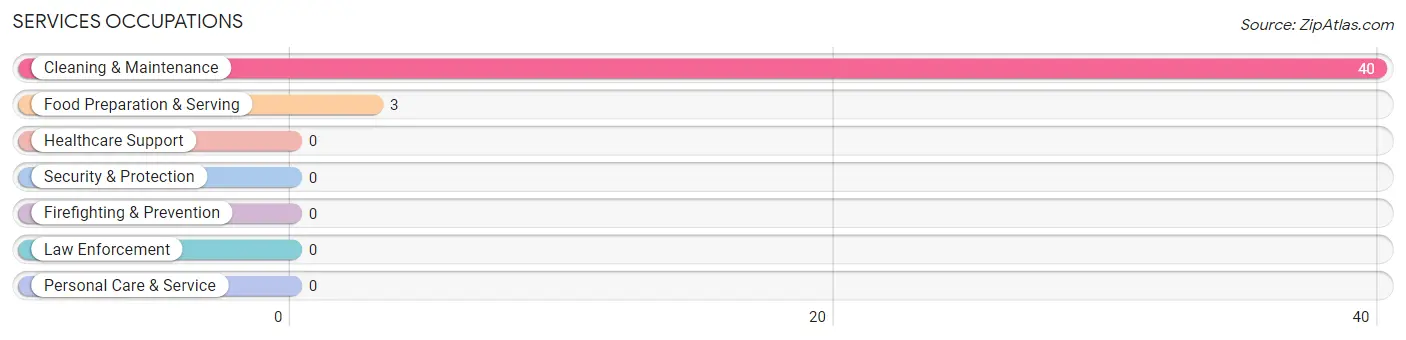
Services Occupations
The most common Services occupations in Hunter are Cleaning & Maintenance (40 | 27.4%), and Food Preparation & Serving (3 | 2.1%).
Services Occupations by Sex
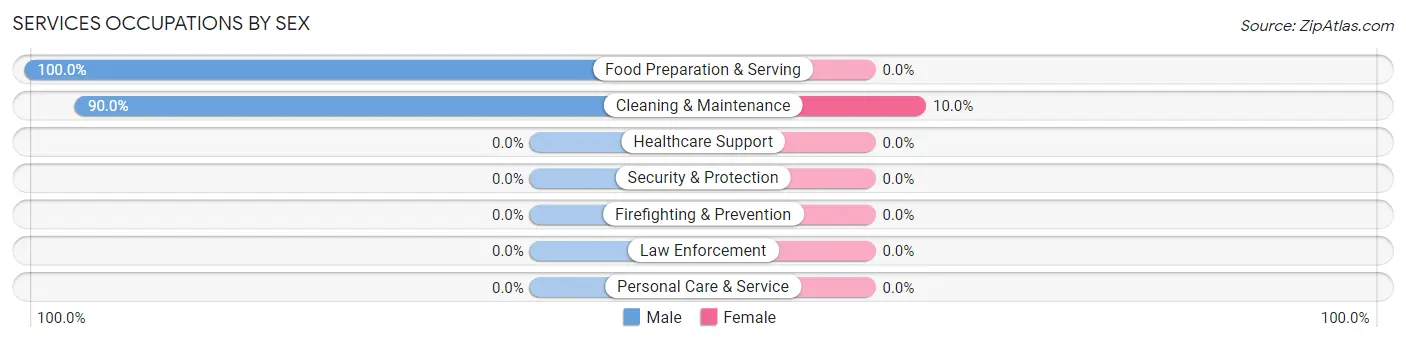
| Occupation | Male | Female |
| Healthcare Support | 0 (0.0%) | 0 (0.0%) |
| Security & Protection | 0 (0.0%) | 0 (0.0%) |
| Firefighting & Prevention | 0 (0.0%) | 0 (0.0%) |
| Law Enforcement | 0 (0.0%) | 0 (0.0%) |
| Food Preparation & Serving | 3 (100.0%) | 0 (0.0%) |
| Cleaning & Maintenance | 36 (90.0%) | 4 (10.0%) |
| Personal Care & Service | 0 (0.0%) | 0 (0.0%) |
| Total (Category) | 39 (90.7%) | 4 (9.3%) |
| Total (Overall) | 118 (80.8%) | 28 (19.2%) |
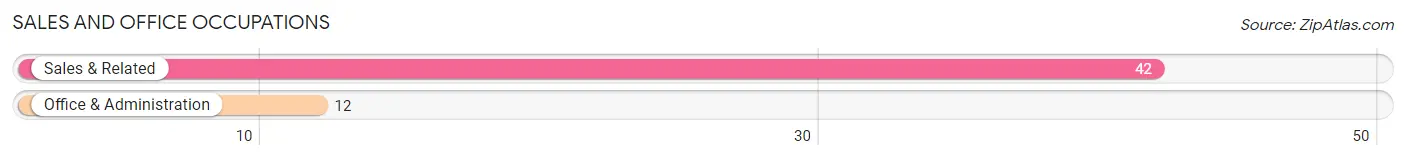
Sales and Office Occupations
The most common Sales and Office occupations in Hunter are Sales & Related (42 | 28.8%), and Office & Administration (12 | 8.2%).
Sales and Office Occupations by Sex
| Occupation | Male | Female |
| Sales & Related | 28 (66.7%) | 14 (33.3%) |
| Office & Administration | 10 (83.3%) | 2 (16.7%) |
| Total (Category) | 38 (70.4%) | 16 (29.6%) |
| Total (Overall) | 118 (80.8%) | 28 (19.2%) |
Natural Resources, Construction and Maintenance Occupations
The most common Natural Resources, Construction and Maintenance occupations in Hunter are , and Installation, Maintenance & Repair (14 | 9.6%).
Natural Resources, Construction and Maintenance Occupations by Sex
| Occupation | Male | Female |
| Farming, Fishing & Forestry | 0 (0.0%) | 0 (0.0%) |
| Construction & Extraction | 0 (0.0%) | 0 (0.0%) |
| Installation, Maintenance & Repair | 14 (100.0%) | 0 (0.0%) |
| Total (Category) | 14 (100.0%) | 0 (0.0%) |
| Total (Overall) | 118 (80.8%) | 28 (19.2%) |
Production, Transportation and Moving Occupations
Production, Transportation and Moving Occupations by Sex
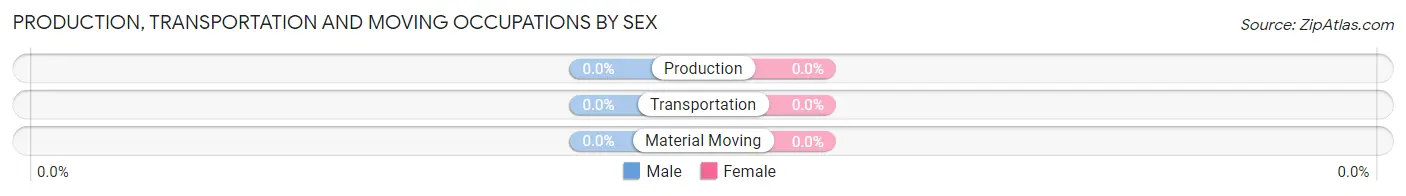
| Occupation | Male | Female |
| Production | 0 (0.0%) | 0 (0.0%) |
| Transportation | 0 (0.0%) | 0 (0.0%) |
| Material Moving | 0 (0.0%) | 0 (0.0%) |
| Total (Category) | 0 (0.0%) | 0 (0.0%) |
| Total (Overall) | 118 (80.8%) | 28 (19.2%) |
Employment Industries by Sex in Hunter
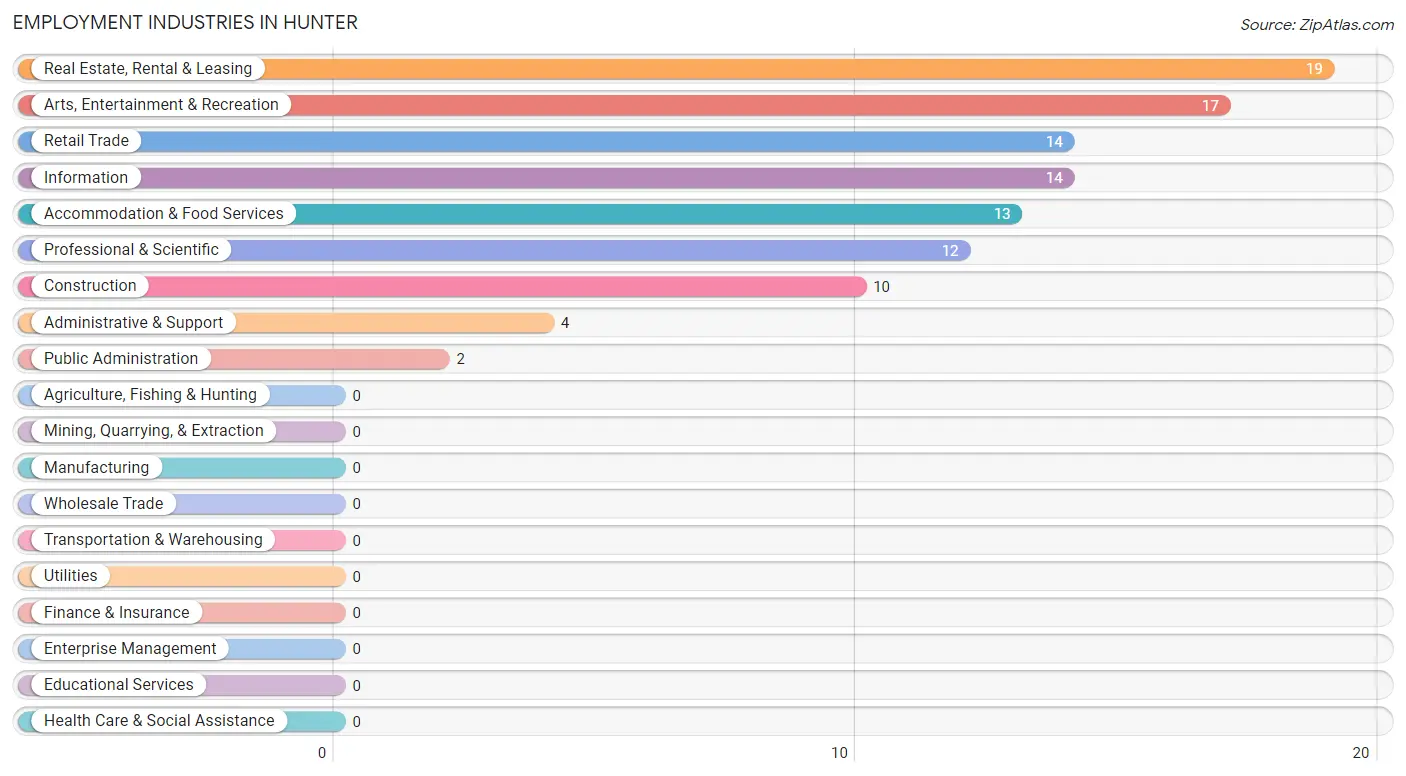
Employment Industries in Hunter
The major employment industries in Hunter include Real Estate, Rental & Leasing (19 | 13.0%), Arts, Entertainment & Recreation (17 | 11.6%), Retail Trade (14 | 9.6%), Information (14 | 9.6%), and Accommodation & Food Services (13 | 8.9%).
Employment Industries by Sex in Hunter
The Hunter industries that see more men than women are Construction (100.0%), Retail Trade (100.0%), and Real Estate, Rental & Leasing (100.0%), whereas the industries that tend to have a higher number of women are Administrative & Support (100.0%), Public Administration (100.0%), and Arts, Entertainment & Recreation (82.4%).
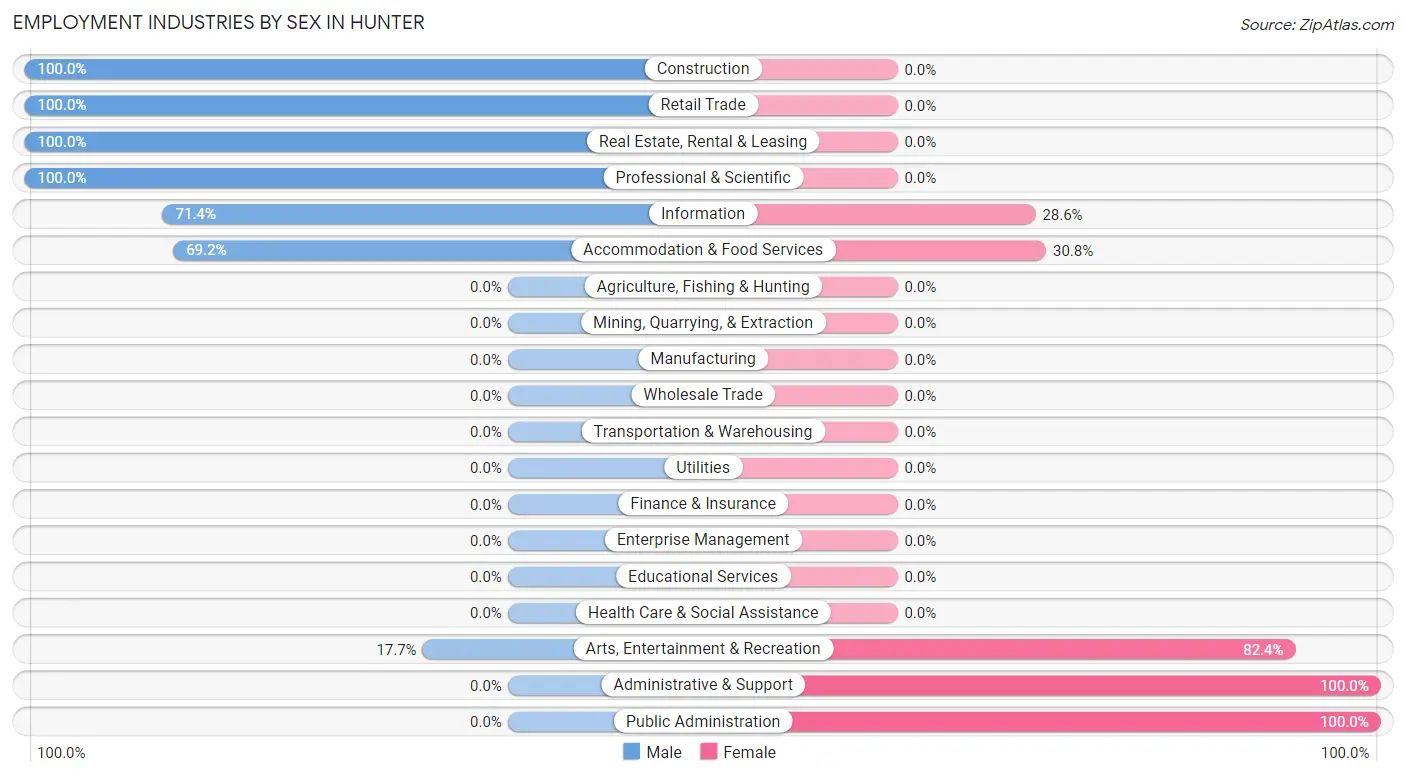
| Industry | Male | Female |
| Agriculture, Fishing & Hunting | 0 (0.0%) | 0 (0.0%) |
| Mining, Quarrying, & Extraction | 0 (0.0%) | 0 (0.0%) |
| Construction | 10 (100.0%) | 0 (0.0%) |
| Manufacturing | 0 (0.0%) | 0 (0.0%) |
| Wholesale Trade | 0 (0.0%) | 0 (0.0%) |
| Retail Trade | 14 (100.0%) | 0 (0.0%) |
| Transportation & Warehousing | 0 (0.0%) | 0 (0.0%) |
| Utilities | 0 (0.0%) | 0 (0.0%) |
| Information | 10 (71.4%) | 4 (28.6%) |
| Finance & Insurance | 0 (0.0%) | 0 (0.0%) |
| Real Estate, Rental & Leasing | 19 (100.0%) | 0 (0.0%) |
| Professional & Scientific | 12 (100.0%) | 0 (0.0%) |
| Enterprise Management | 0 (0.0%) | 0 (0.0%) |
| Administrative & Support | 0 (0.0%) | 4 (100.0%) |
| Educational Services | 0 (0.0%) | 0 (0.0%) |
| Health Care & Social Assistance | 0 (0.0%) | 0 (0.0%) |
| Arts, Entertainment & Recreation | 3 (17.6%) | 14 (82.4%) |
| Accommodation & Food Services | 9 (69.2%) | 4 (30.8%) |
| Public Administration | 0 (0.0%) | 2 (100.0%) |
| Total | 118 (80.8%) | 28 (19.2%) |
Education in Hunter
School Enrollment in Hunter
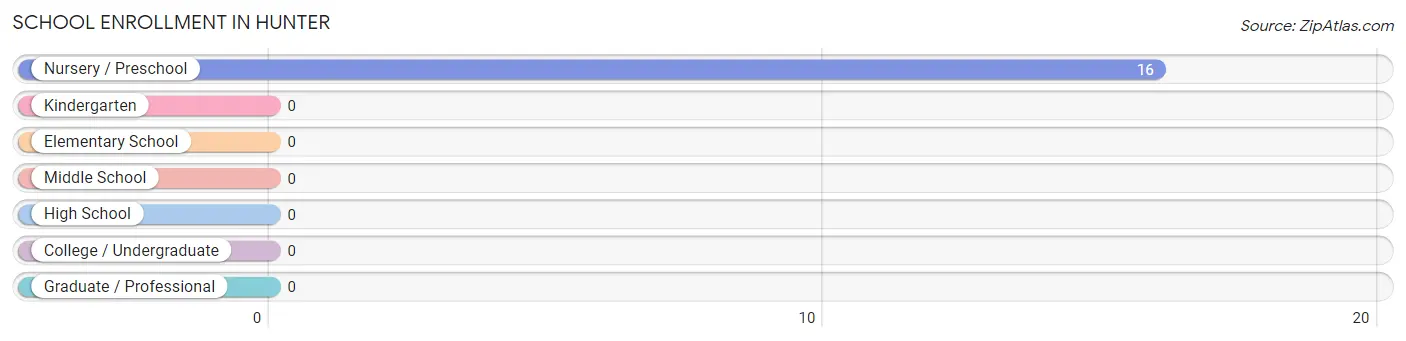
| School Level | # Students | % Students |
| Nursery / Preschool | 16 | 100.0% |
| Kindergarten | 0 | 0.0% |
| Elementary School | 0 | 0.0% |
| Middle School | 0 | 0.0% |
| High School | 0 | 0.0% |
| College / Undergraduate | 0 | 0.0% |
| Graduate / Professional | 0 | 0.0% |
| Total | 16 | 100.0% |
School Enrollment by Age by Funding Source in Hunter
| Age Bracket | Public School | Private School |
| 3 to 4 Year Olds | 16 (100.0%) | 0 (0.0%) |
| 5 to 9 Year Old | 0 (0.0%) | 0 (0.0%) |
| 10 to 14 Year Olds | 0 (0.0%) | 0 (0.0%) |
| 15 to 17 Year Olds | 0 (0.0%) | 0 (0.0%) |
| 18 to 19 Year Olds | 0 (0.0%) | 0 (0.0%) |
| 20 to 24 Year Olds | 0 (0.0%) | 0 (0.0%) |
| 25 to 34 Year Olds | 0 (0.0%) | 0 (0.0%) |
| 35 Years and over | 0 (0.0%) | 0 (0.0%) |
| Total | 16 (100.0%) | 0 (0.0%) |
Educational Attainment by Field of Study in Hunter
Education (19 | 38.0%), arts & humanities (12 | 24.0%), computers & mathematics (5 | 10.0%), psychology (4 | 8.0%), and business (4 | 8.0%) are the most common fields of study among 50 individuals in Hunter who have obtained a bachelor's degree or higher.
| Field of Study | # Graduates | % Graduates |
| Computers & Mathematics | 5 | 10.0% |
| Bio, Nature & Agricultural | 2 | 4.0% |
| Physical & Health Sciences | 0 | 0.0% |
| Psychology | 4 | 8.0% |
| Social Sciences | 0 | 0.0% |
| Engineering | 0 | 0.0% |
| Multidisciplinary Studies | 0 | 0.0% |
| Science & Technology | 0 | 0.0% |
| Business | 4 | 8.0% |
| Education | 19 | 38.0% |
| Literature & Languages | 0 | 0.0% |
| Liberal Arts & History | 0 | 0.0% |
| Visual & Performing Arts | 4 | 8.0% |
| Communications | 0 | 0.0% |
| Arts & Humanities | 12 | 24.0% |
| Total | 50 | 100.0% |
Transportation & Commute in Hunter
Vehicle Availability by Sex in Hunter
The most prevalent vehicle ownership categories in Hunter are males with 1 vehicle (54, accounting for 59.3%) and females with 1 vehicle (4, making up 192.9%).
| Vehicles Available | Male | Female |
| No Vehicle | 0 (0.0%) | 0 (0.0%) |
| 1 Vehicle | 54 (59.3%) | 4 (14.3%) |
| 2 Vehicles | 37 (40.7%) | 20 (71.4%) |
| 3 Vehicles | 0 (0.0%) | 4 (14.3%) |
| 4 Vehicles | 0 (0.0%) | 0 (0.0%) |
| 5 or more Vehicles | 0 (0.0%) | 0 (0.0%) |
| Total | 91 (100.0%) | 28 (100.0%) |
Commute Time in Hunter
The most frequently occuring commute durations in Hunter are less than 5 minutes (26 commuters, 26.3%), 5 to 9 minutes (26 commuters, 26.3%), and 15 to 19 minutes (15 commuters, 15.1%).
| Commute Time | # Commuters | % Commuters |
| Less than 5 Minutes | 26 | 26.3% |
| 5 to 9 Minutes | 26 | 26.3% |
| 10 to 14 Minutes | 8 | 8.1% |
| 15 to 19 Minutes | 15 | 15.1% |
| 20 to 24 Minutes | 10 | 10.1% |
| 25 to 29 Minutes | 0 | 0.0% |
| 30 to 34 Minutes | 0 | 0.0% |
| 35 to 39 Minutes | 0 | 0.0% |
| 40 to 44 Minutes | 0 | 0.0% |
| 45 to 59 Minutes | 0 | 0.0% |
| 60 to 89 Minutes | 14 | 14.1% |
| 90 or more Minutes | 0 | 0.0% |
Commute Time by Sex in Hunter
The most common commute times in Hunter are less than 5 minutes (24 commuters, 30.4%) for males and 5 to 9 minutes (14 commuters, 70.0%) for females.
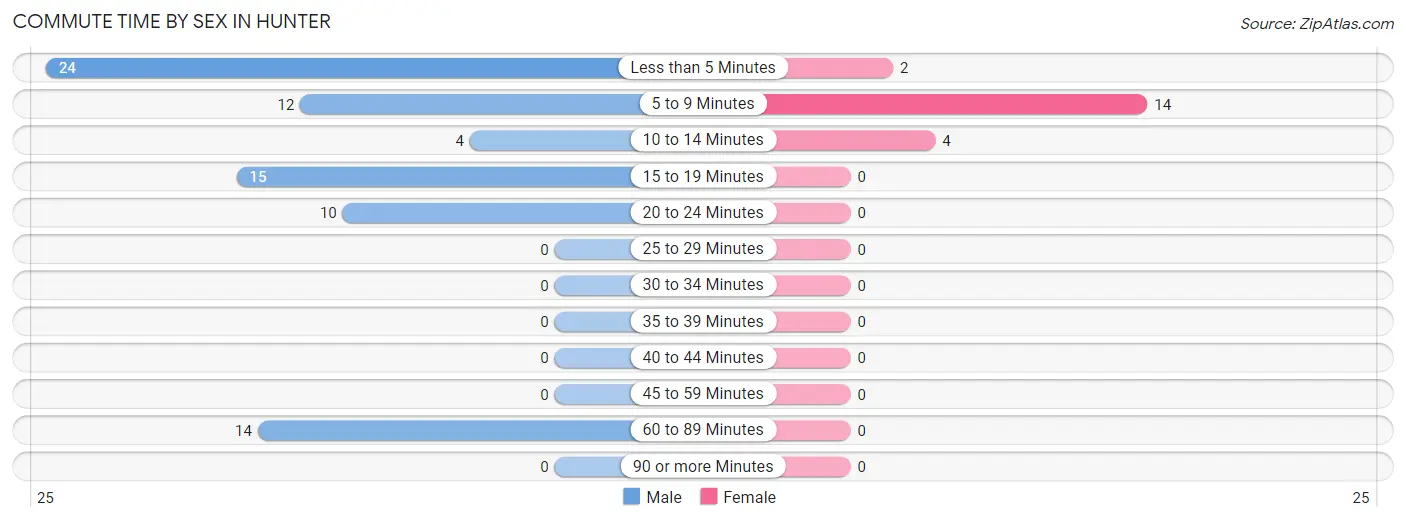
| Commute Time | Male | Female |
| Less than 5 Minutes | 24 (30.4%) | 2 (10.0%) |
| 5 to 9 Minutes | 12 (15.2%) | 14 (70.0%) |
| 10 to 14 Minutes | 4 (5.1%) | 4 (20.0%) |
| 15 to 19 Minutes | 15 (19.0%) | 0 (0.0%) |
| 20 to 24 Minutes | 10 (12.7%) | 0 (0.0%) |
| 25 to 29 Minutes | 0 (0.0%) | 0 (0.0%) |
| 30 to 34 Minutes | 0 (0.0%) | 0 (0.0%) |
| 35 to 39 Minutes | 0 (0.0%) | 0 (0.0%) |
| 40 to 44 Minutes | 0 (0.0%) | 0 (0.0%) |
| 45 to 59 Minutes | 0 (0.0%) | 0 (0.0%) |
| 60 to 89 Minutes | 14 (17.7%) | 0 (0.0%) |
| 90 or more Minutes | 0 (0.0%) | 0 (0.0%) |
Time of Departure to Work by Sex in Hunter
The most frequent times of departure to work in Hunter are 6:30 AM to 6:59 AM (17, 21.5%) for males and 7:00 AM to 7:29 AM (14, 70.0%) for females.
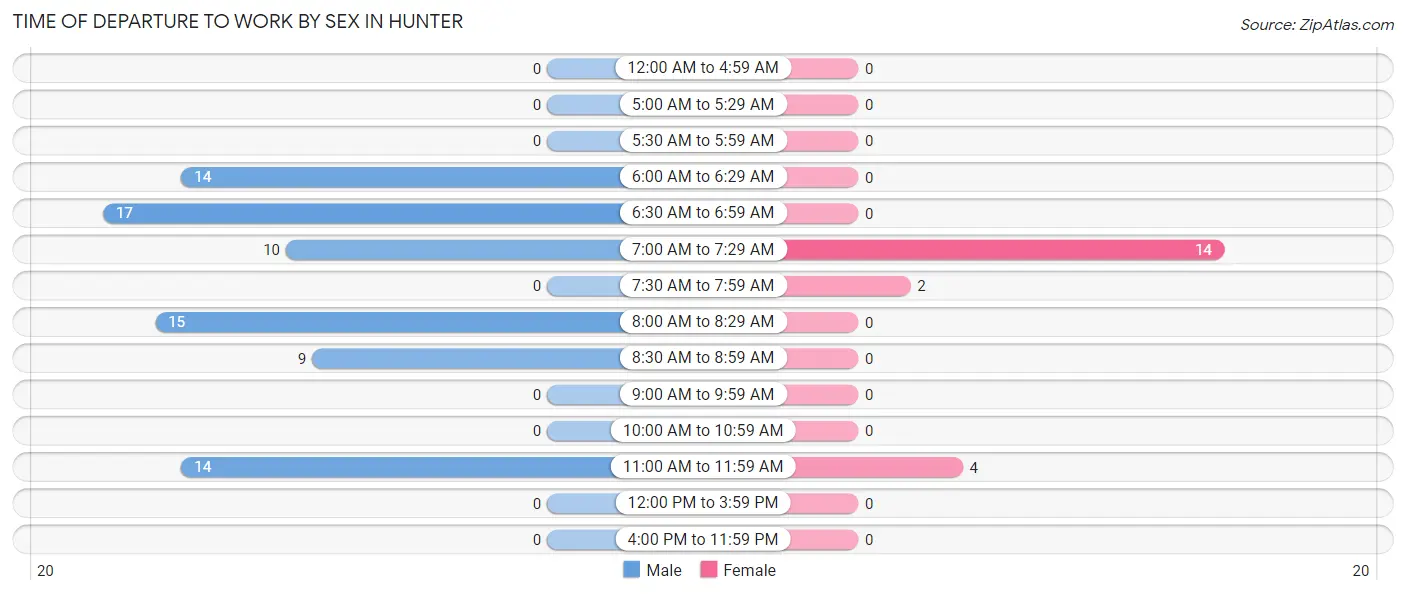
| Time of Departure | Male | Female |
| 12:00 AM to 4:59 AM | 0 (0.0%) | 0 (0.0%) |
| 5:00 AM to 5:29 AM | 0 (0.0%) | 0 (0.0%) |
| 5:30 AM to 5:59 AM | 0 (0.0%) | 0 (0.0%) |
| 6:00 AM to 6:29 AM | 14 (17.7%) | 0 (0.0%) |
| 6:30 AM to 6:59 AM | 17 (21.5%) | 0 (0.0%) |
| 7:00 AM to 7:29 AM | 10 (12.7%) | 14 (70.0%) |
| 7:30 AM to 7:59 AM | 0 (0.0%) | 2 (10.0%) |
| 8:00 AM to 8:29 AM | 15 (19.0%) | 0 (0.0%) |
| 8:30 AM to 8:59 AM | 9 (11.4%) | 0 (0.0%) |
| 9:00 AM to 9:59 AM | 0 (0.0%) | 0 (0.0%) |
| 10:00 AM to 10:59 AM | 0 (0.0%) | 0 (0.0%) |
| 11:00 AM to 11:59 AM | 14 (17.7%) | 4 (20.0%) |
| 12:00 PM to 3:59 PM | 0 (0.0%) | 0 (0.0%) |
| 4:00 PM to 11:59 PM | 0 (0.0%) | 0 (0.0%) |
| Total | 79 (100.0%) | 20 (100.0%) |
Housing Occupancy in Hunter
Occupancy by Ownership in Hunter
Of the total 155 dwellings in Hunter, owner-occupied units account for 103 (66.4%), while renter-occupied units make up 52 (33.6%).
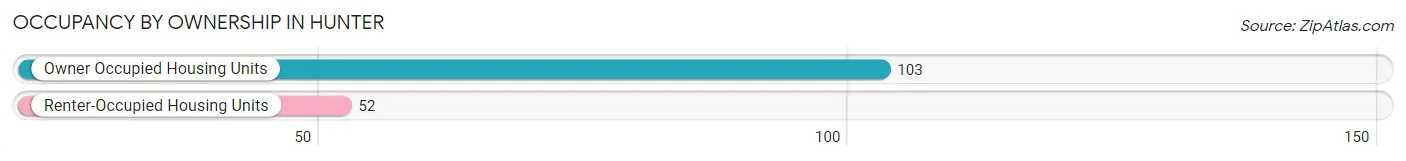
| Occupancy | # Housing Units | % Housing Units |
| Owner Occupied Housing Units | 103 | 66.4% |
| Renter-Occupied Housing Units | 52 | 33.6% |
| Total Occupied Housing Units | 155 | 100.0% |
Occupancy by Household Size in Hunter
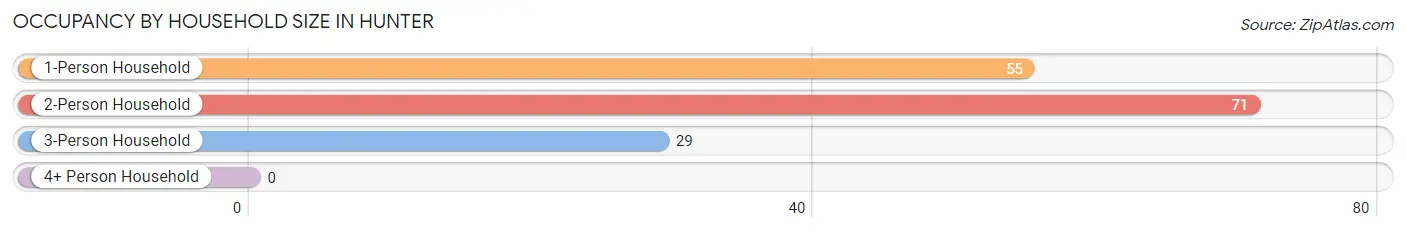
| Household Size | # Housing Units | % Housing Units |
| 1-Person Household | 55 | 35.5% |
| 2-Person Household | 71 | 45.8% |
| 3-Person Household | 29 | 18.7% |
| 4+ Person Household | 0 | 0.0% |
| Total Housing Units | 155 | 100.0% |
Occupancy by Ownership by Household Size in Hunter
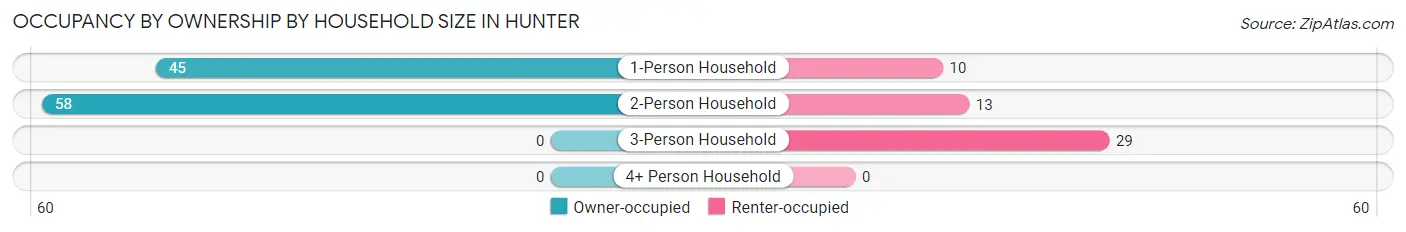
| Household Size | Owner-occupied | Renter-occupied |
| 1-Person Household | 45 (81.8%) | 10 (18.2%) |
| 2-Person Household | 58 (81.7%) | 13 (18.3%) |
| 3-Person Household | 0 (0.0%) | 29 (100.0%) |
| 4+ Person Household | 0 (0.0%) | 0 (0.0%) |
| Total Housing Units | 103 (66.4%) | 52 (33.6%) |
Occupancy by Educational Attainment in Hunter
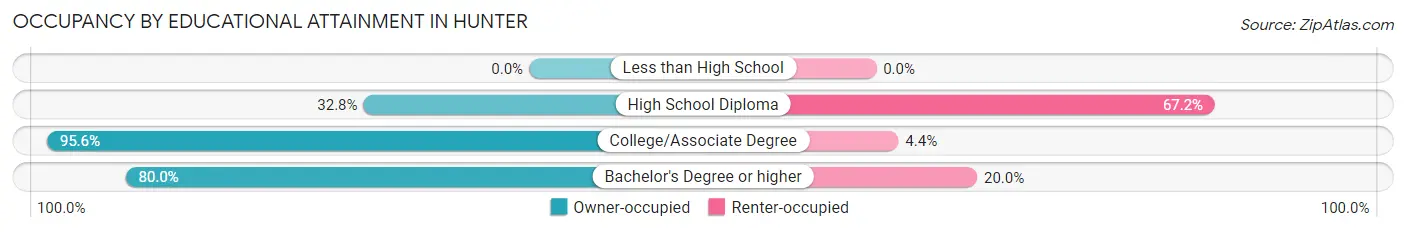
| Household Size | Owner-occupied | Renter-occupied |
| Less than High School | 0 (0.0%) | 0 (0.0%) |
| High School Diploma | 22 (32.8%) | 45 (67.2%) |
| College/Associate Degree | 65 (95.6%) | 3 (4.4%) |
| Bachelor's Degree or higher | 16 (80.0%) | 4 (20.0%) |
Occupancy by Age of Householder in Hunter
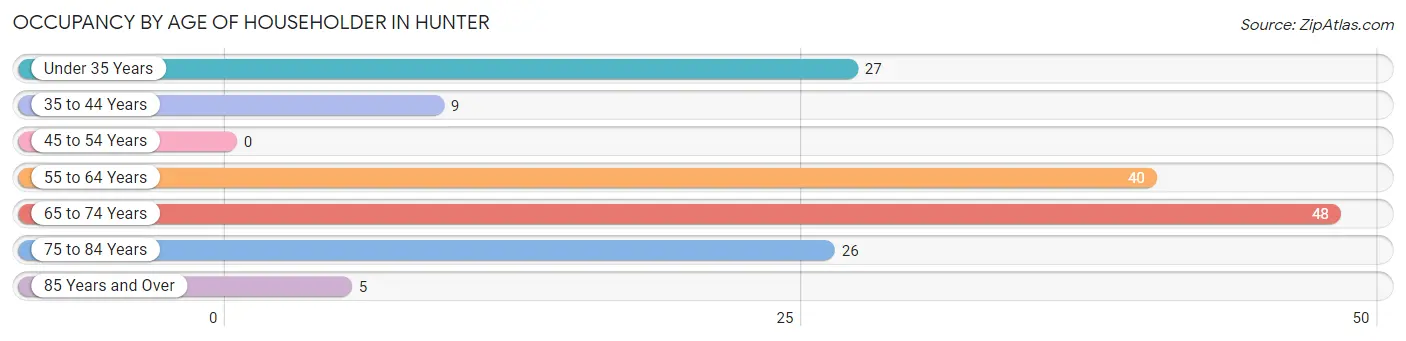
| Age Bracket | # Households | % Households |
| Under 35 Years | 27 | 17.4% |
| 35 to 44 Years | 9 | 5.8% |
| 45 to 54 Years | 0 | 0.0% |
| 55 to 64 Years | 40 | 25.8% |
| 65 to 74 Years | 48 | 31.0% |
| 75 to 84 Years | 26 | 16.8% |
| 85 Years and Over | 5 | 3.2% |
| Total | 155 | 100.0% |
Housing Finances in Hunter
Median Income by Occupancy in Hunter
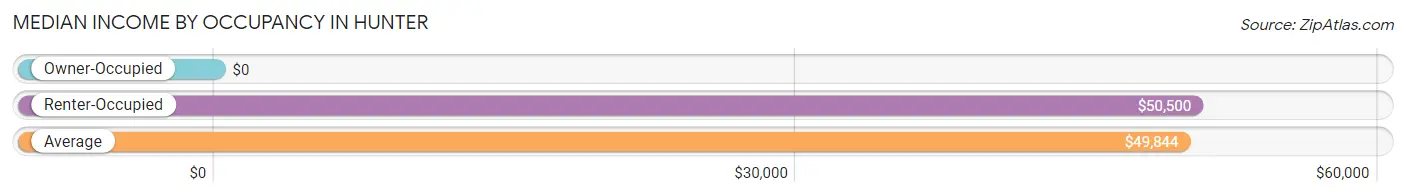
| Occupancy Type | # Households | Median Income |
| Owner-Occupied | 103 (66.4%) | $0 |
| Renter-Occupied | 52 (33.6%) | $50,500 |
| Average | 155 (100.0%) | $49,844 |
Occupancy by Householder Income Bracket in Hunter
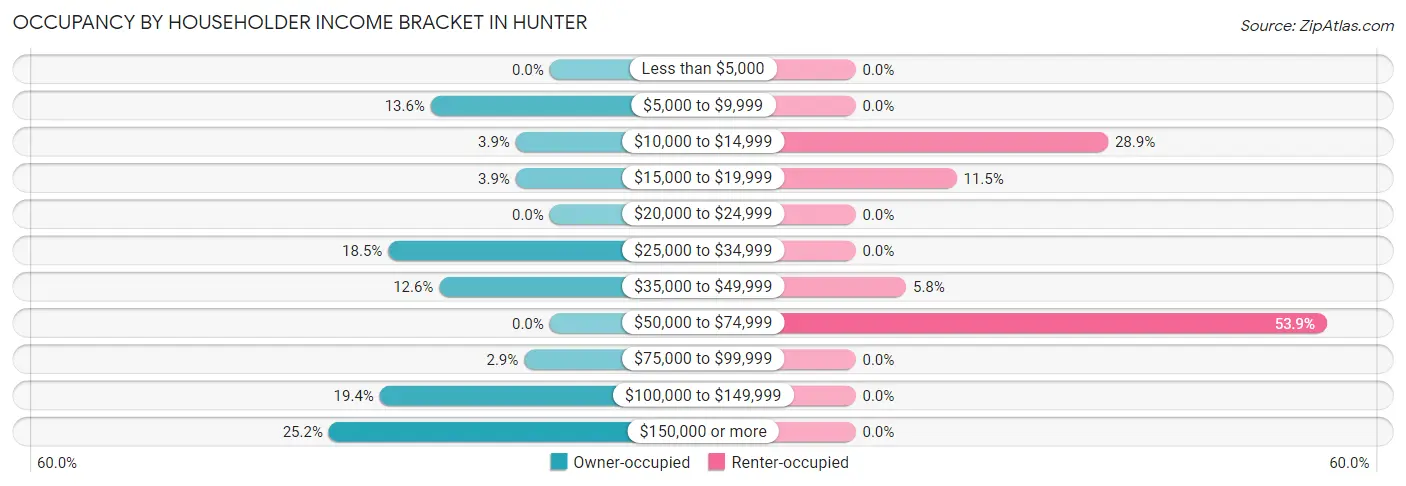
| Income Bracket | Owner-occupied | Renter-occupied |
| Less than $5,000 | 0 (0.0%) | 0 (0.0%) |
| $5,000 to $9,999 | 14 (13.6%) | 0 (0.0%) |
| $10,000 to $14,999 | 4 (3.9%) | 15 (28.8%) |
| $15,000 to $19,999 | 4 (3.9%) | 6 (11.5%) |
| $20,000 to $24,999 | 0 (0.0%) | 0 (0.0%) |
| $25,000 to $34,999 | 19 (18.4%) | 0 (0.0%) |
| $35,000 to $49,999 | 13 (12.6%) | 3 (5.8%) |
| $50,000 to $74,999 | 0 (0.0%) | 28 (53.8%) |
| $75,000 to $99,999 | 3 (2.9%) | 0 (0.0%) |
| $100,000 to $149,999 | 20 (19.4%) | 0 (0.0%) |
| $150,000 or more | 26 (25.2%) | 0 (0.0%) |
| Total | 103 (100.0%) | 52 (100.0%) |
Monthly Housing Cost Tiers in Hunter
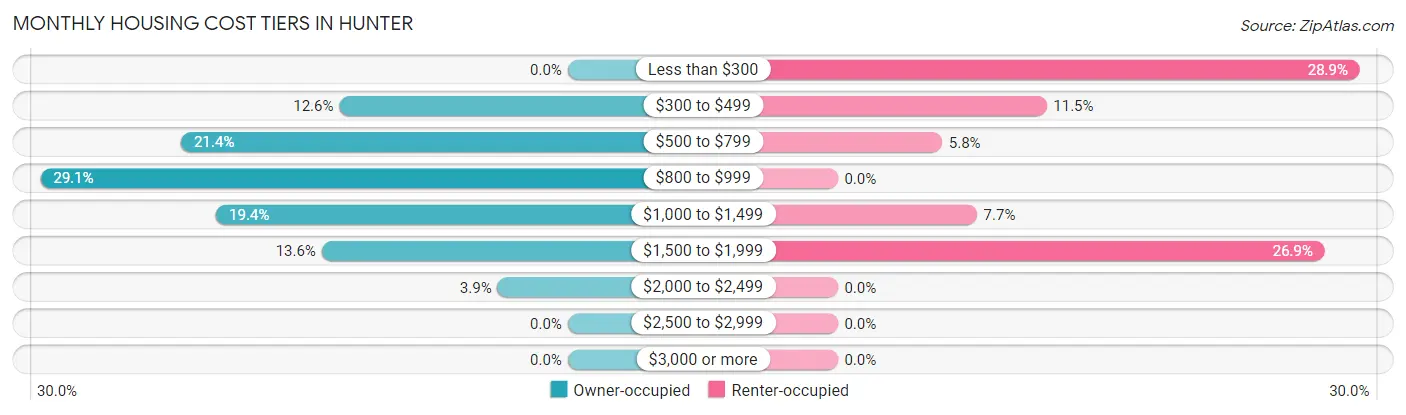
| Monthly Cost | Owner-occupied | Renter-occupied |
| Less than $300 | 0 (0.0%) | 15 (28.8%) |
| $300 to $499 | 13 (12.6%) | 6 (11.5%) |
| $500 to $799 | 22 (21.4%) | 3 (5.8%) |
| $800 to $999 | 30 (29.1%) | 0 (0.0%) |
| $1,000 to $1,499 | 20 (19.4%) | 4 (7.7%) |
| $1,500 to $1,999 | 14 (13.6%) | 14 (26.9%) |
| $2,000 to $2,499 | 4 (3.9%) | 0 (0.0%) |
| $2,500 to $2,999 | 0 (0.0%) | 0 (0.0%) |
| $3,000 or more | 0 (0.0%) | 0 (0.0%) |
| Total | 103 (100.0%) | 52 (100.0%) |
Physical Housing Characteristics in Hunter
Housing Structures in Hunter
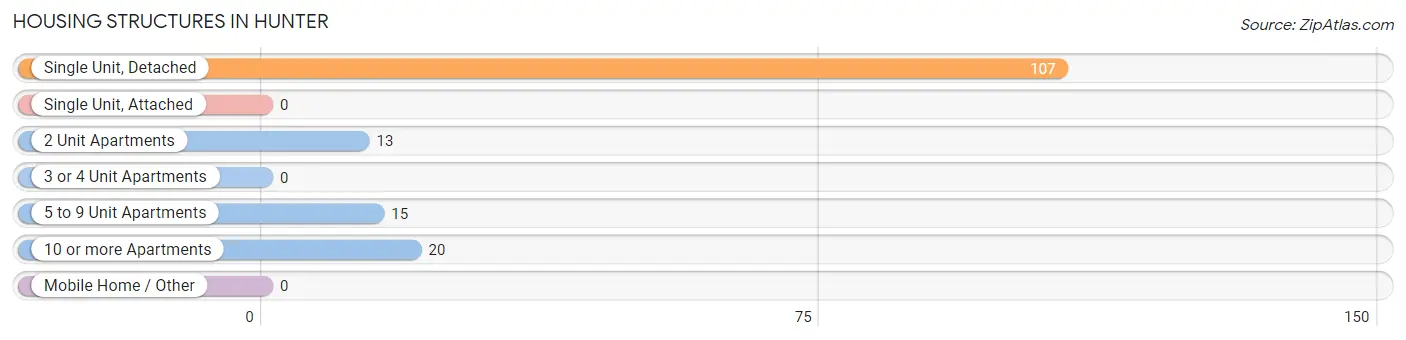
| Structure Type | # Housing Units | % Housing Units |
| Single Unit, Detached | 107 | 69.0% |
| Single Unit, Attached | 0 | 0.0% |
| 2 Unit Apartments | 13 | 8.4% |
| 3 or 4 Unit Apartments | 0 | 0.0% |
| 5 to 9 Unit Apartments | 15 | 9.7% |
| 10 or more Apartments | 20 | 12.9% |
| Mobile Home / Other | 0 | 0.0% |
| Total | 155 | 100.0% |
Housing Structures by Occupancy in Hunter
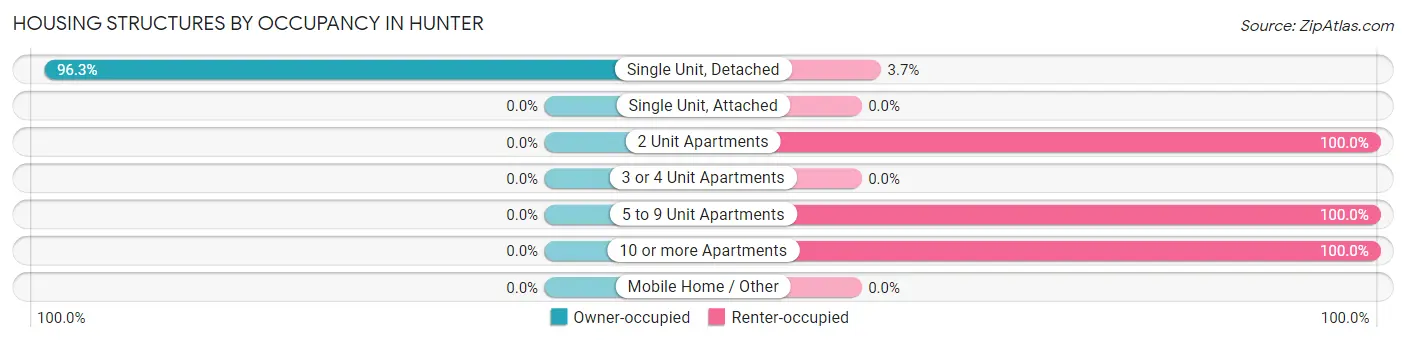
| Structure Type | Owner-occupied | Renter-occupied |
| Single Unit, Detached | 103 (96.3%) | 4 (3.7%) |
| Single Unit, Attached | 0 (0.0%) | 0 (0.0%) |
| 2 Unit Apartments | 0 (0.0%) | 13 (100.0%) |
| 3 or 4 Unit Apartments | 0 (0.0%) | 0 (0.0%) |
| 5 to 9 Unit Apartments | 0 (0.0%) | 15 (100.0%) |
| 10 or more Apartments | 0 (0.0%) | 20 (100.0%) |
| Mobile Home / Other | 0 (0.0%) | 0 (0.0%) |
| Total | 103 (66.4%) | 52 (33.6%) |
Housing Structures by Number of Rooms in Hunter
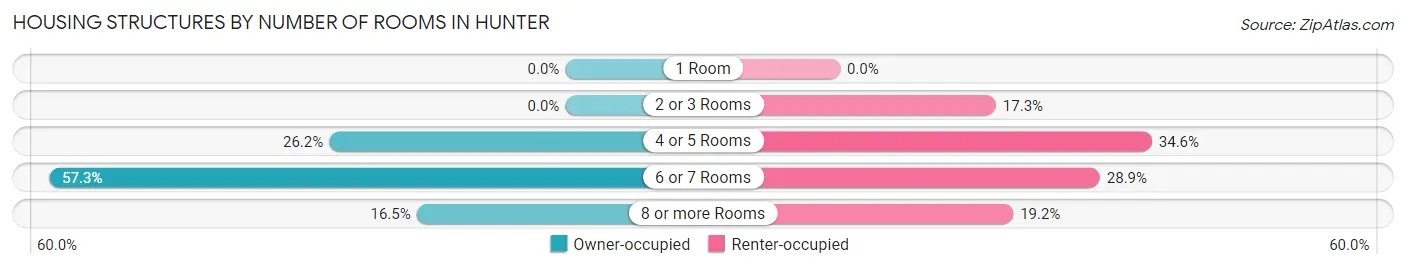
| Number of Rooms | Owner-occupied | Renter-occupied |
| 1 Room | 0 (0.0%) | 0 (0.0%) |
| 2 or 3 Rooms | 0 (0.0%) | 9 (17.3%) |
| 4 or 5 Rooms | 27 (26.2%) | 18 (34.6%) |
| 6 or 7 Rooms | 59 (57.3%) | 15 (28.8%) |
| 8 or more Rooms | 17 (16.5%) | 10 (19.2%) |
| Total | 103 (100.0%) | 52 (100.0%) |
Housing Structure by Heating Type in Hunter
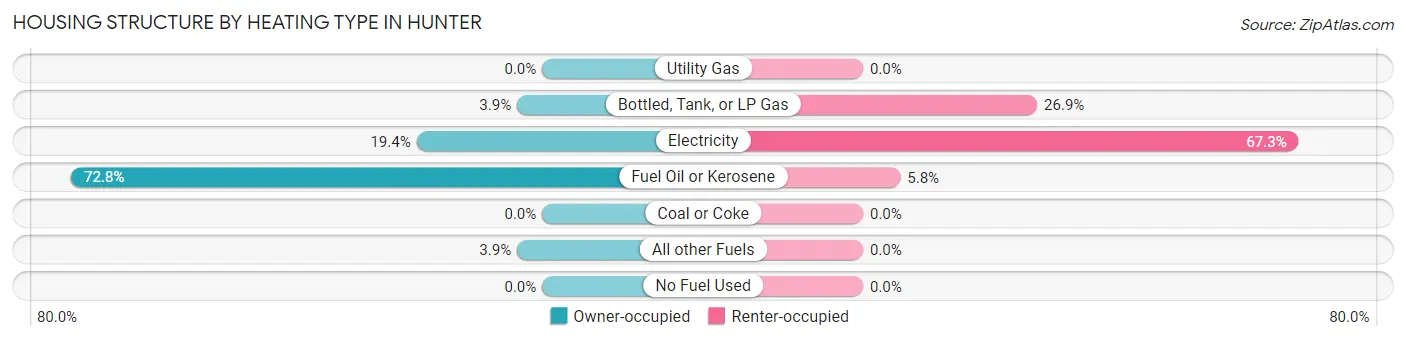
| Heating Type | Owner-occupied | Renter-occupied |
| Utility Gas | 0 (0.0%) | 0 (0.0%) |
| Bottled, Tank, or LP Gas | 4 (3.9%) | 14 (26.9%) |
| Electricity | 20 (19.4%) | 35 (67.3%) |
| Fuel Oil or Kerosene | 75 (72.8%) | 3 (5.8%) |
| Coal or Coke | 0 (0.0%) | 0 (0.0%) |
| All other Fuels | 4 (3.9%) | 0 (0.0%) |
| No Fuel Used | 0 (0.0%) | 0 (0.0%) |
| Total | 103 (100.0%) | 52 (100.0%) |
Household Vehicle Usage in Hunter
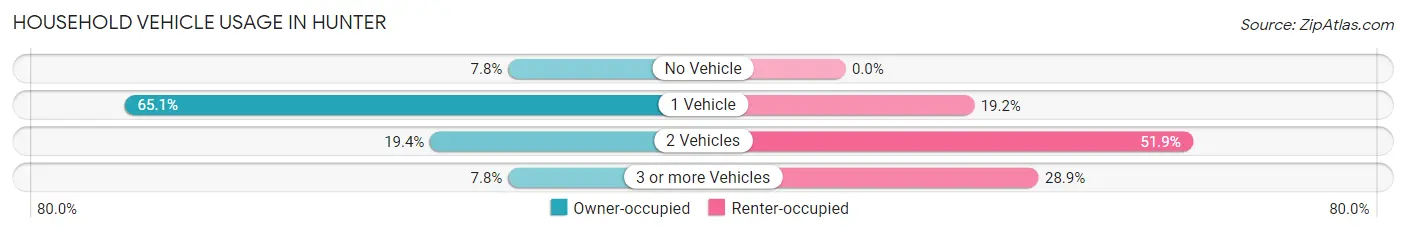
| Vehicles per Household | Owner-occupied | Renter-occupied |
| No Vehicle | 8 (7.8%) | 0 (0.0%) |
| 1 Vehicle | 67 (65.0%) | 10 (19.2%) |
| 2 Vehicles | 20 (19.4%) | 27 (51.9%) |
| 3 or more Vehicles | 8 (7.8%) | 15 (28.8%) |
| Total | 103 (100.0%) | 52 (100.0%) |
Real Estate & Mortgages in Hunter
Real Estate and Mortgage Overview in Hunter
| Characteristic | Without Mortgage | With Mortgage |
| Housing Units | 81 | 22 |
| Median Property Value | $231,300 | $225,000 |
| Median Household Income | $113,438 | $0 |
| Monthly Housing Costs | $831 | $0 |
| Real Estate Taxes | $3,861 | $0 |
Property Value by Mortgage Status in Hunter
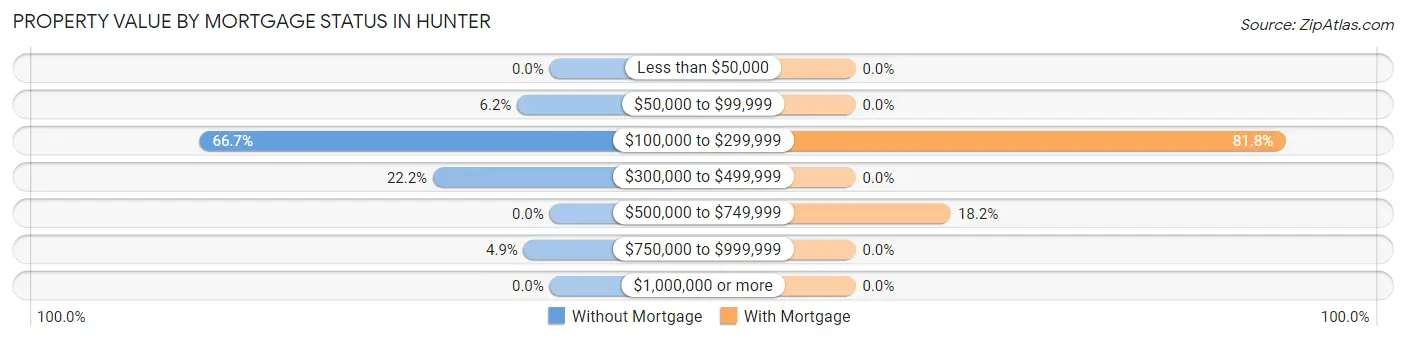
| Property Value | Without Mortgage | With Mortgage |
| Less than $50,000 | 0 (0.0%) | 0 (0.0%) |
| $50,000 to $99,999 | 5 (6.2%) | 0 (0.0%) |
| $100,000 to $299,999 | 54 (66.7%) | 18 (81.8%) |
| $300,000 to $499,999 | 18 (22.2%) | 0 (0.0%) |
| $500,000 to $749,999 | 0 (0.0%) | 4 (18.2%) |
| $750,000 to $999,999 | 4 (4.9%) | 0 (0.0%) |
| $1,000,000 or more | 0 (0.0%) | 0 (0.0%) |
| Total | 81 (100.0%) | 22 (100.0%) |
Household Income by Mortgage Status in Hunter
| Household Income | Without Mortgage | With Mortgage |
| Less than $10,000 | 0 (0.0%) | 0 (0.0%) |
| $10,000 to $24,999 | 8 (9.9%) | 14 (63.6%) |
| $25,000 to $34,999 | 19 (23.5%) | 0 (0.0%) |
| $35,000 to $49,999 | 9 (11.1%) | 0 (0.0%) |
| $50,000 to $74,999 | 0 (0.0%) | 4 (18.2%) |
| $75,000 to $99,999 | 3 (3.7%) | 0 (0.0%) |
| $100,000 to $149,999 | 16 (19.8%) | 0 (0.0%) |
| $150,000 or more | 26 (32.1%) | 4 (18.2%) |
| Total | 81 (100.0%) | 22 (100.0%) |
Property Value to Household Income Ratio in Hunter
| Value-to-Income Ratio | Without Mortgage | With Mortgage |
| Less than 2.0x | 28 (34.6%) | 0 (0.0%) |
| 2.0x to 2.9x | 14 (17.3%) | 4 (18.2%) |
| 3.0x to 3.9x | 14 (17.3%) | 0 (0.0%) |
| 4.0x or more | 25 (30.9%) | 0 (0.0%) |
| Total | 81 (100.0%) | 22 (100.0%) |
Real Estate Taxes by Mortgage Status in Hunter
| Property Taxes | Without Mortgage | With Mortgage |
| Less than $800 | 0 (0.0%) | 0 (0.0%) |
| $800 to $1,499 | 13 (16.1%) | 0 (0.0%) |
| $800 to $1,499 | 68 (84.0%) | 4 (18.2%) |
| Total | 81 (100.0%) | 22 (100.0%) |
Health & Disability in Hunter
Health Insurance Coverage by Age in Hunter
| Age Bracket | With Coverage | Without Coverage |
| Under 6 Years | 16 (100.0%) | 0 (0.0%) |
| 6 to 18 Years | 0 (0.0%) | 0 (0.0%) |
| 19 to 25 Years | 14 (100.0%) | 0 (0.0%) |
| 26 to 34 Years | 24 (82.8%) | 5 (17.2%) |
| 35 to 44 Years | 36 (100.0%) | 0 (0.0%) |
| 45 to 54 Years | 0 (0.0%) | 0 (0.0%) |
| 55 to 64 Years | 59 (100.0%) | 0 (0.0%) |
| 65 to 74 Years | 90 (100.0%) | 0 (0.0%) |
| 75 Years and older | 56 (100.0%) | 0 (0.0%) |
| Total | 295 (98.3%) | 5 (1.7%) |
Health Insurance Coverage by Citizenship Status in Hunter
| Citizenship Status | With Coverage | Without Coverage |
| Native Born | 16 (100.0%) | 0 (0.0%) |
| Foreign Born, Citizen | 0 (0.0%) | 0 (0.0%) |
| Foreign Born, not a Citizen | 14 (100.0%) | 0 (0.0%) |
Health Insurance Coverage by Household Income in Hunter
| Household Income | With Coverage | Without Coverage |
| Under $25,000 | 93 (100.0%) | 0 (0.0%) |
| $25,000 to $49,999 | 50 (90.9%) | 5 (9.1%) |
| $50,000 to $74,999 | 62 (100.0%) | 0 (0.0%) |
| $75,000 to $99,999 | 5 (100.0%) | 0 (0.0%) |
| $100,000 and over | 85 (100.0%) | 0 (0.0%) |
Public vs Private Health Insurance Coverage by Age in Hunter
| Age Bracket | Public Insurance | Private Insurance |
| Under 6 | 16 (100.0%) | 16 (100.0%) |
| 6 to 18 Years | 0 (0.0%) | 0 (0.0%) |
| 19 to 25 Years | 0 (0.0%) | 14 (100.0%) |
| 25 to 34 Years | 24 (82.8%) | 10 (34.5%) |
| 35 to 44 Years | 27 (75.0%) | 36 (100.0%) |
| 45 to 54 Years | 0 (0.0%) | 0 (0.0%) |
| 55 to 64 Years | 36 (61.0%) | 36 (61.0%) |
| 65 to 74 Years | 75 (83.3%) | 46 (51.1%) |
| 75 Years and over | 56 (100.0%) | 36 (64.3%) |
| Total | 234 (78.0%) | 194 (64.7%) |
Disability Status by Sex by Age in Hunter
| Age Bracket | Male | Female |
| Under 5 Years | 0 (0.0%) | 0 (0.0%) |
| 5 to 17 Years | 0 (0.0%) | 0 (0.0%) |
| 18 to 34 Years | 0 (0.0%) | 0 (0.0%) |
| 35 to 64 Years | 15 (25.9%) | 0 (0.0%) |
| 65 to 74 Years | 0 (0.0%) | 0 (0.0%) |
| 75 Years and over | 8 (30.8%) | 5 (16.7%) |
Disability Class by Sex by Age in Hunter
Disability Class: Hearing Difficulty
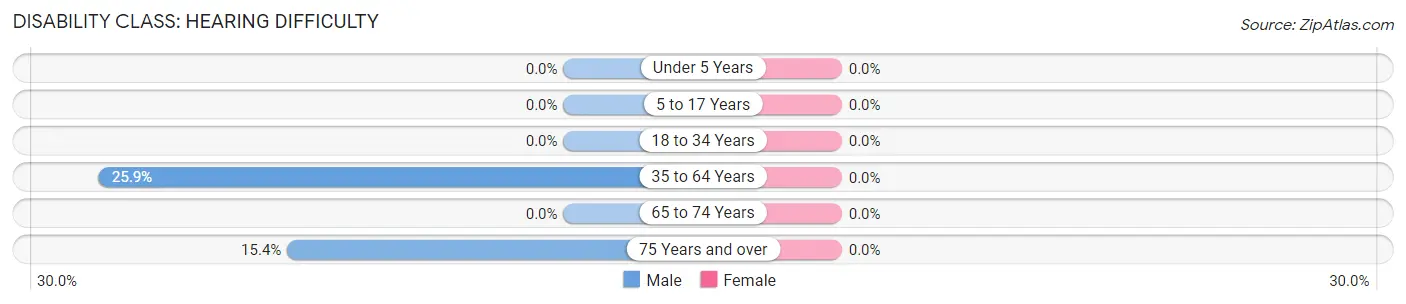
| Age Bracket | Male | Female |
| Under 5 Years | 0 (0.0%) | 0 (0.0%) |
| 5 to 17 Years | 0 (0.0%) | 0 (0.0%) |
| 18 to 34 Years | 0 (0.0%) | 0 (0.0%) |
| 35 to 64 Years | 15 (25.9%) | 0 (0.0%) |
| 65 to 74 Years | 0 (0.0%) | 0 (0.0%) |
| 75 Years and over | 4 (15.4%) | 0 (0.0%) |
Disability Class: Vision Difficulty
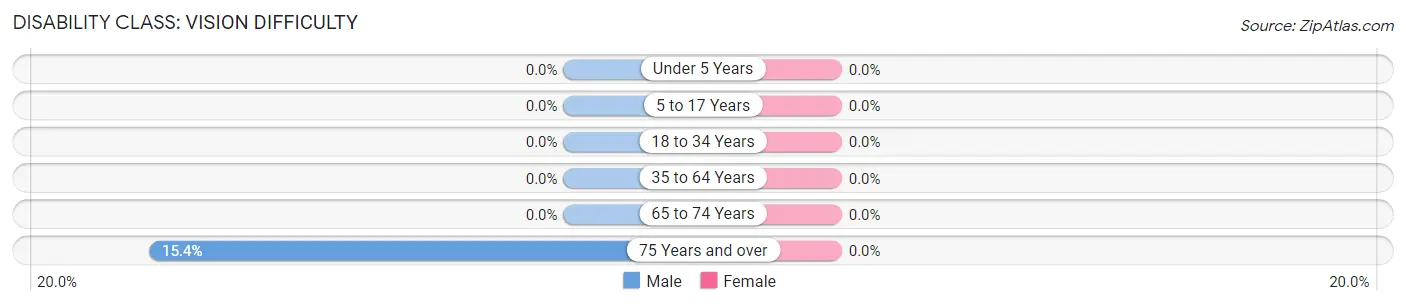
| Age Bracket | Male | Female |
| Under 5 Years | 0 (0.0%) | 0 (0.0%) |
| 5 to 17 Years | 0 (0.0%) | 0 (0.0%) |
| 18 to 34 Years | 0 (0.0%) | 0 (0.0%) |
| 35 to 64 Years | 0 (0.0%) | 0 (0.0%) |
| 65 to 74 Years | 0 (0.0%) | 0 (0.0%) |
| 75 Years and over | 4 (15.4%) | 0 (0.0%) |
Disability Class: Cognitive Difficulty
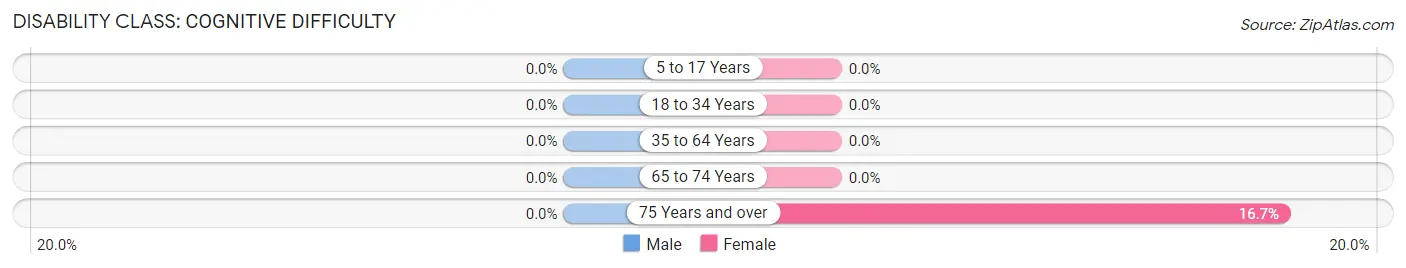
| Age Bracket | Male | Female |
| 5 to 17 Years | 0 (0.0%) | 0 (0.0%) |
| 18 to 34 Years | 0 (0.0%) | 0 (0.0%) |
| 35 to 64 Years | 0 (0.0%) | 0 (0.0%) |
| 65 to 74 Years | 0 (0.0%) | 0 (0.0%) |
| 75 Years and over | 0 (0.0%) | 5 (16.7%) |
Disability Class: Ambulatory Difficulty
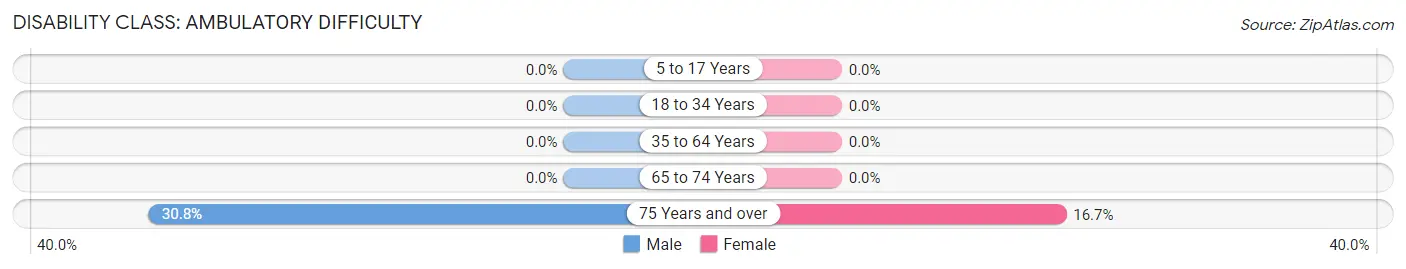
| Age Bracket | Male | Female |
| 5 to 17 Years | 0 (0.0%) | 0 (0.0%) |
| 18 to 34 Years | 0 (0.0%) | 0 (0.0%) |
| 35 to 64 Years | 0 (0.0%) | 0 (0.0%) |
| 65 to 74 Years | 0 (0.0%) | 0 (0.0%) |
| 75 Years and over | 8 (30.8%) | 5 (16.7%) |
Disability Class: Self-Care Difficulty
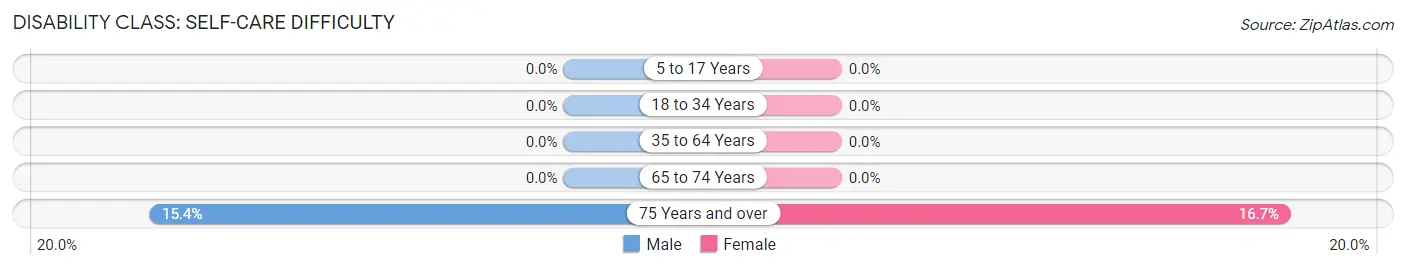
| Age Bracket | Male | Female |
| 5 to 17 Years | 0 (0.0%) | 0 (0.0%) |
| 18 to 34 Years | 0 (0.0%) | 0 (0.0%) |
| 35 to 64 Years | 0 (0.0%) | 0 (0.0%) |
| 65 to 74 Years | 0 (0.0%) | 0 (0.0%) |
| 75 Years and over | 4 (15.4%) | 5 (16.7%) |
Technology Access in Hunter
Computing Device Access in Hunter
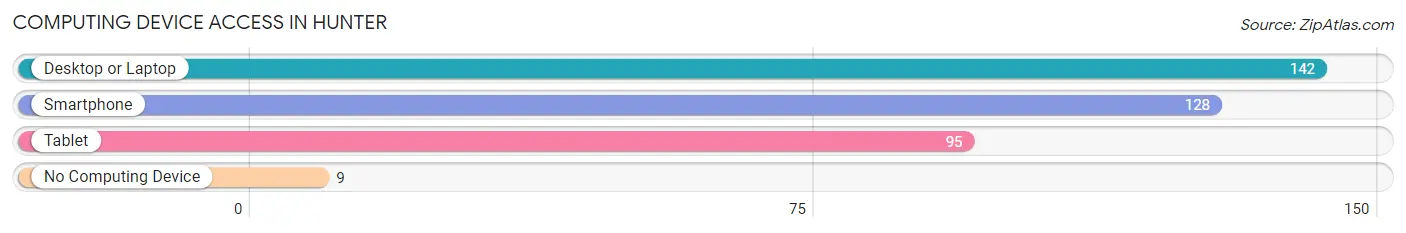
| Device Type | # Households | % Households |
| Desktop or Laptop | 142 | 91.6% |
| Smartphone | 128 | 82.6% |
| Tablet | 95 | 61.3% |
| No Computing Device | 9 | 5.8% |
| Total | 155 | 100.0% |
Internet Access in Hunter
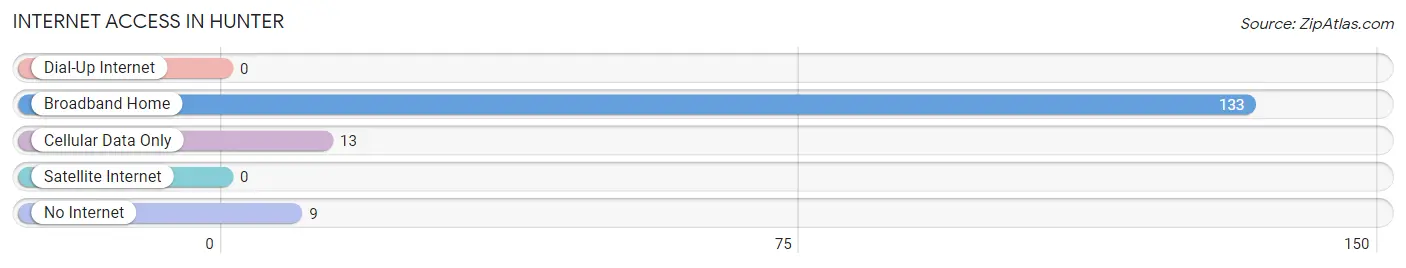
| Internet Type | # Households | % Households |
| Dial-Up Internet | 0 | 0.0% |
| Broadband Home | 133 | 85.8% |
| Cellular Data Only | 13 | 8.4% |
| Satellite Internet | 0 | 0.0% |
| No Internet | 9 | 5.8% |
| Total | 155 | 100.0% |
Hunter Summary
Hunter is a town located in Greene County, New York, United States. The population was 2,726 at the 2010 census. The town is in the southwest part of the county and is in the Catskill Mountains.
Geography
Hunter is located in the southwest corner of Greene County, bordered to the west by Delaware County, to the south by Ulster County, and to the east by the towns of Lexington and Windham. The town is in the Catskill Mountains and includes the hamlets of Hunter, Hunter Village, and Tannersville.
According to the United States Census Bureau, the town has a total area of 39.7sqmi, of which 39.6sqmi is land and 0.1sqmi, or 0.25%, is water.
The east town line is the border of the Catskill Park The Kaaterskill Creek flows through the town
History
The town was first settled around 1770. The town of Hunter was formed in 1813 from the town of Lexington.
Demographics
As of the census of 2000, there were 2,726 people, 1,093 households, and 745 families residing in the town. The population density was 68.9 people per square mile (26.6/km^2). There were 1,845 housing units at an average density of 46.4 per square mile (17.9/km^2). The racial makeup of the town was 97.20% White, 0.81% African American, 0.33% Native American, 0.37% Asian, 0.07% Pacific Islander, 0.37% from other races, and 0.84% from two or more races. Hispanic or Latino of any race were 1.45% of the population.
There were 1,093 households, out of which 28.2% had children under the age of 18 living with them, 54.2% were married couples living together, 9.2% had a female householder with no husband present, and 32.2% were non-families. 26.2% of all households were made up of individuals, and 10.2% had someone living alone who was 65 years of age or older. The average household size was 2.48 and the average family size was 3.00.
In the town, the population was spread out, with 24.2% under the age of 18, 6.2% from 18 to 24, 27.2% from 25 to 44, 27.2% from 45 to 64, and 15.2% who were 65 years of age or older. The median age was 40 years. For every 100 females, there were 97.2 males. For every 100 females age 18 and over, there were 94.2 males.
The median income for a household in the town was $37,917, and the median income for a family was $45,000. Males had a median income of $31,964 versus $25,000 for females. The per capita income for the town was $19,945. About 8.2% of families and 11.2% of the population were below the poverty line, including 15.2% of those under age 18 and 8.2% of those age 65 or over.
Economy
Hunter is a popular tourist destination, with many visitors coming to ski at Hunter Mountain, the largest ski resort in the Catskills. The town is also home to several restaurants, hotels, and other businesses catering to tourists.
The town is also home to several farms, including dairy farms, vegetable farms, and apple orchards. The town is also home to several wineries, including the Hunter Mountain Winery, which produces a variety of wines from local grapes.
The town is also home to several small businesses, including a lumber mill, a sawmill, and a furniture factory. The town is also home to several small retail stores, including a grocery store, a hardware store, and a variety of antique stores.
Common Questions
What is Per Capita Income in Hunter?
Per Capita income in Hunter is $36,418.
What is the Median Family Income in Hunter?
Median Family Income in Hunter is $68,393.
What is the Median Household income in Hunter?
Median Household Income in Hunter is $49,844.
What is Inequality or Gini Index in Hunter?
Inequality or Gini Index in Hunter is 0.47.
What is the Total Population of Hunter?
Total Population of Hunter is 300.
What is the Total Male Population of Hunter?
Total Male Population of Hunter is 179.
What is the Total Female Population of Hunter?
Total Female Population of Hunter is 121.
What is the Ratio of Males per 100 Females in Hunter?
There are 147.93 Males per 100 Females in Hunter.
What is the Ratio of Females per 100 Males in Hunter?
There are 67.60 Females per 100 Males in Hunter.
What is the Median Population Age in Hunter?
Median Population Age in Hunter is 62.8 Years.
What is the Average Family Size in Hunter
Average Family Size in Hunter is 2.3 People.
What is the Average Household Size in Hunter
Average Household Size in Hunter is 1.9 People.
How Large is the Labor Force in Hunter?
There are 163 People in the Labor Forcein in Hunter.
What is the Percentage of People in the Labor Force in Hunter?
57.4% of People are in the Labor Force in Hunter.
What is the Unemployment Rate in Hunter?
Unemployment Rate in Hunter is 10.4%.