Earnings by Sex by Educational Attainment in Rodeo
Educational Attainment
Male Income
Female Income
Less than High School
-
-
High School Diploma
-
-
College or Associate's Degree
-
-
Bachelor's Degree
-
-
Graduate Degree
-
-
Total
-
-
Family Income in Rodeo
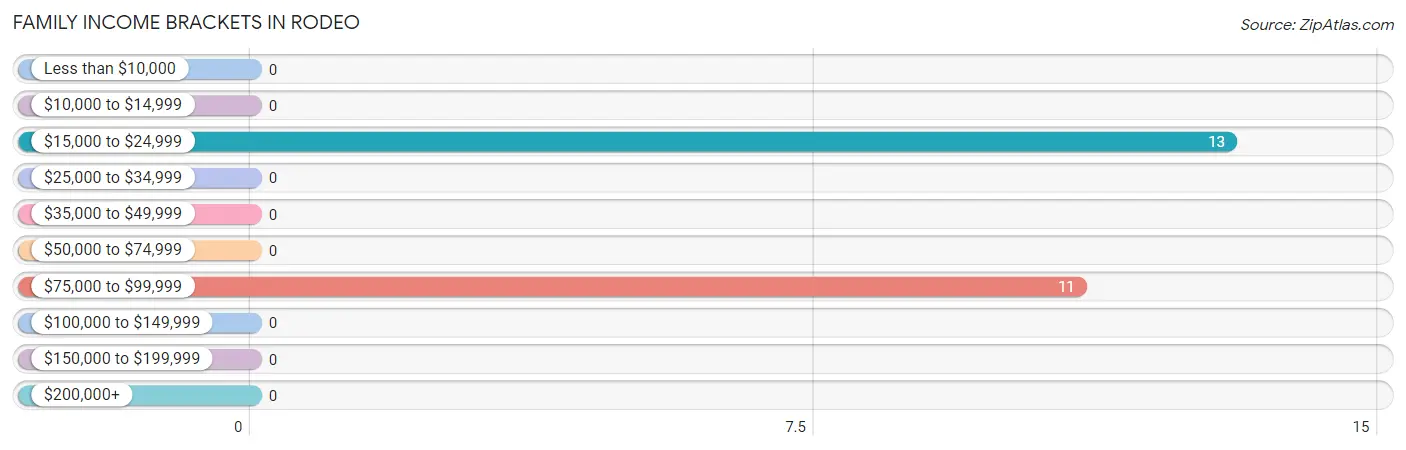
Family Income Brackets in Rodeo
According to the Rodeo family income data, there are 13 families falling into the $15,000 to $24,999 income range, which is the most common income bracket and makes up 54.2% of all families.
Income Bracket
# Families
% Families
Less than $10,000
0
0.0%
$10,000 to $14,999
0
0.0%
$15,000 to $24,999
13
54.2%
$25,000 to $34,999
0
0.0%
$35,000 to $49,999
0
0.0%
$50,000 to $74,999
0
0.0%
$75,000 to $99,999
11
45.8%
$100,000 to $149,999
0
0.0%
$150,000 to $199,999
0
0.0%
$200,000+
0
0.0%
Family Income by Famaliy Size in Rodeo
Income Bracket
# Families
Median Income
2-Person Families
24 (100.0%)
$0
3-Person Families
0 (0.0%)
$0
4-Person Families
0 (0.0%)
$0
5-Person Families
0 (0.0%)
$0
6-Person Families
0 (0.0%)
$0
7+ Person Families
0 (0.0%)
$0
Total
24 (100.0%)
$0
Family Income by Number of Earners in Rodeo
Number of Earners
# Families
Median Income
No Earners
24 (100.0%)
$0
1 Earner
0 (0.0%)
$0
2 Earners
0 (0.0%)
$0
3+ Earners
0 (0.0%)
$0
Total
24 (100.0%)
$0
Household Income in Rodeo
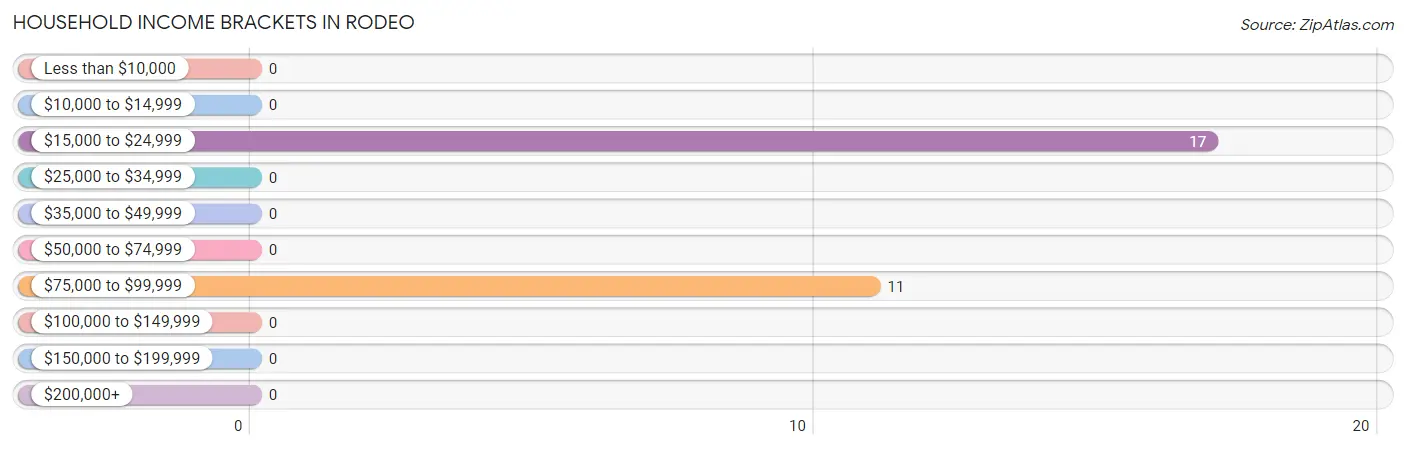
Household Income Brackets in Rodeo
With 17 households falling in the category, the $15,000 to $24,999 income range is the most frequent in Rodeo, accounting for 60.7% of all households.
Income Bracket
# Households
% Households
Less than $10,000
0
0.0%
$10,000 to $14,999
0
0.0%
$15,000 to $24,999
17
60.7%
$25,000 to $34,999
0
0.0%
$35,000 to $49,999
0
0.0%
$50,000 to $74,999
0
0.0%
$75,000 to $99,999
11
39.3%
$100,000 to $149,999
0
0.0%
$150,000 to $199,999
0
0.0%
$200,000+
0
0.0%
Household Income by Householder Age in Rodeo
Income Bracket
# Households
Median Income
15 to 24 Years
0 (0.0%)
$0
25 to 44 Years
0 (0.0%)
$0
45 to 64 Years
17 (60.7%)
$0
65+ Years
11 (39.3%)
$0
Total
28 (100.0%)
$0
Poverty in Rodeo
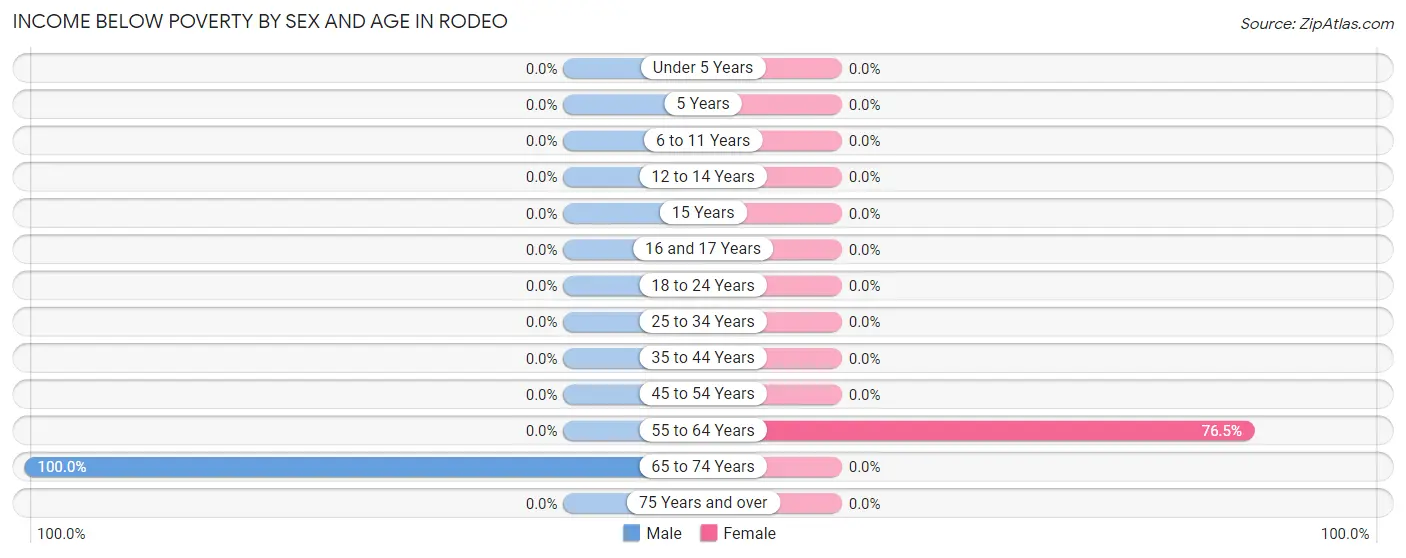
Income Below Poverty by Sex and Age in Rodeo
With 63.6% poverty level for males and 46.4% for females among the residents of Rodeo, 65 to 74 year old males and 55 to 64 year old females are the most vulnerable to poverty, with 14 males (100.0%) and 13 females (76.5%) in their respective age groups living below the poverty level.
Age Bracket
Male
Female
Under 5 Years
0 (0.0%)
0 (0.0%)
5 Years
0 (0.0%)
0 (0.0%)
6 to 11 Years
0 (0.0%)
0 (0.0%)
12 to 14 Years
0 (0.0%)
0 (0.0%)
15 Years
0 (0.0%)
0 (0.0%)
16 and 17 Years
0 (0.0%)
0 (0.0%)
18 to 24 Years
0 (0.0%)
0 (0.0%)
25 to 34 Years
0 (0.0%)
0 (0.0%)
35 to 44 Years
0 (0.0%)
0 (0.0%)
45 to 54 Years
0 (0.0%)
0 (0.0%)
55 to 64 Years
0 (0.0%)
13 (76.5%)
65 to 74 Years
14 (100.0%)
0 (0.0%)
75 Years and over
0 (0.0%)
0 (0.0%)
Total
14 (63.6%)
13 (46.4%)
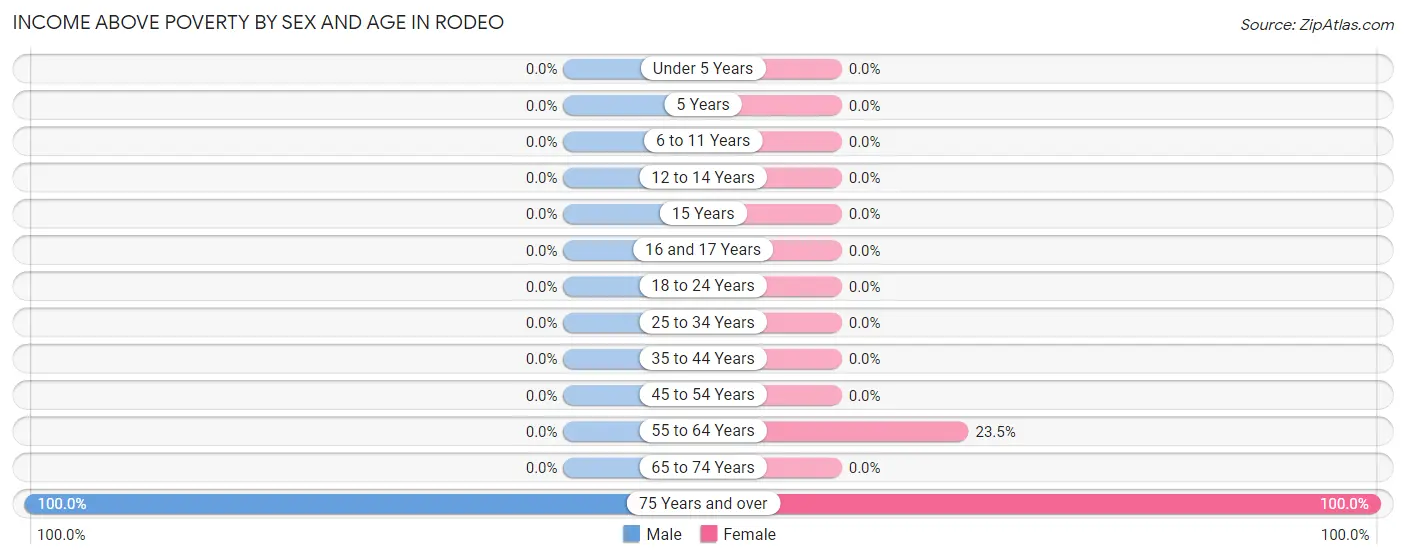
Income Above Poverty by Sex and Age in Rodeo
According to the poverty statistics in Rodeo, males aged 75 years and over and females aged 75 years and over are the age groups that are most secure financially, with 100.0% of males and 100.0% of females in these age groups living above the poverty line.
Age Bracket
Male
Female
Under 5 Years
0 (0.0%)
0 (0.0%)
5 Years
0 (0.0%)
0 (0.0%)
6 to 11 Years
0 (0.0%)
0 (0.0%)
12 to 14 Years
0 (0.0%)
0 (0.0%)
15 Years
0 (0.0%)
0 (0.0%)
16 and 17 Years
0 (0.0%)
0 (0.0%)
18 to 24 Years
0 (0.0%)
0 (0.0%)
25 to 34 Years
0 (0.0%)
0 (0.0%)
35 to 44 Years
0 (0.0%)
0 (0.0%)
45 to 54 Years
0 (0.0%)
0 (0.0%)
55 to 64 Years
0 (0.0%)
4 (23.5%)
65 to 74 Years
0 (0.0%)
0 (0.0%)
75 Years and over
8 (100.0%)
11 (100.0%)
Total
8 (36.4%)
15 (53.6%)
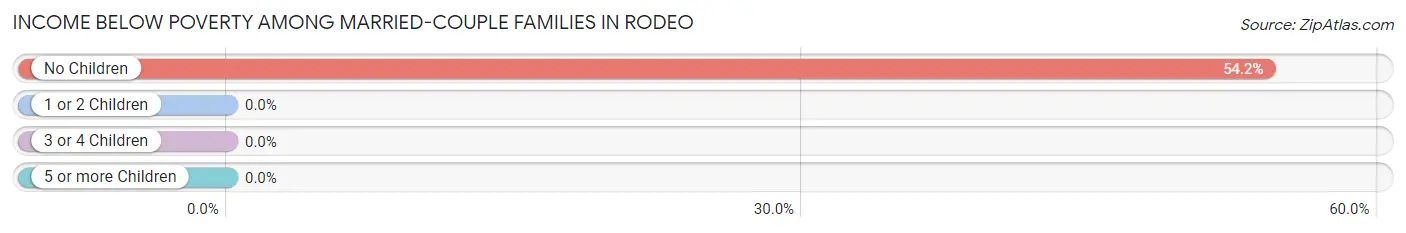
Income Below Poverty Among Married-Couple Families in Rodeo
The poverty statistics for married-couple families in Rodeo show that 54.2% or 13 of the total 24 families live below the poverty line. Families with no children have the highest poverty rate of 54.2%, comprising of 13 families. On the other hand, families with no children have the lowest poverty rate of 54.2%, which includes 13 families.
Children
Above Poverty
Below Poverty
No Children
11 (45.8%)
13 (54.2%)
1 or 2 Children
0 (0.0%)
0 (0.0%)
3 or 4 Children
0 (0.0%)
0 (0.0%)
5 or more Children
0 (0.0%)
0 (0.0%)
Total
11 (45.8%)
13 (54.2%)
Income Below Poverty Among Single-Parent Households in Rodeo
Children
Single Father
Single Mother
No Children
0 (0.0%)
0 (0.0%)
1 or 2 Children
0 (0.0%)
0 (0.0%)
3 or 4 Children
0 (0.0%)
0 (0.0%)
5 or more Children
0 (0.0%)
0 (0.0%)
Total
0 (0.0%)
0 (0.0%)
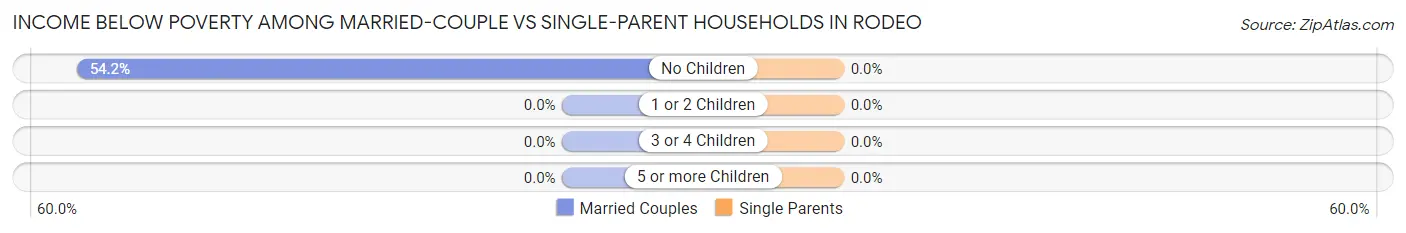
Income Below Poverty Among Married-Couple vs Single-Parent Households in Rodeo
Children
Married-Couple Families
Single-Parent Households
No Children
13 (54.2%)
0 (0.0%)
1 or 2 Children
0 (0.0%)
0 (0.0%)
3 or 4 Children
0 (0.0%)
0 (0.0%)
5 or more Children
0 (0.0%)
0 (0.0%)
Total
13 (54.2%)
0 (0.0%)
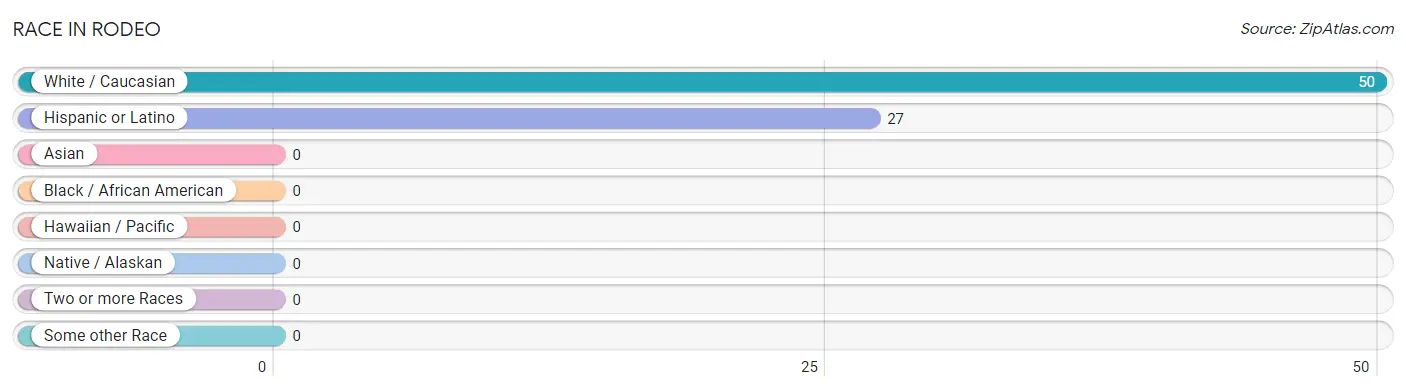
Race in Rodeo
The most populous races in Rodeo are White / Caucasian (50 | 100.0%), and Hispanic or Latino (27 | 54.0%).
Race
# Population
% Population
Asian
0
0.0%
Black / African American
0
0.0%
Hawaiian / Pacific
0
0.0%
Hispanic or Latino
27
54.0%
Native / Alaskan
0
0.0%
White / Caucasian
50
100.0%
Two or more Races
0
0.0%
Some other Race
0
0.0%
Total
50
100.0%
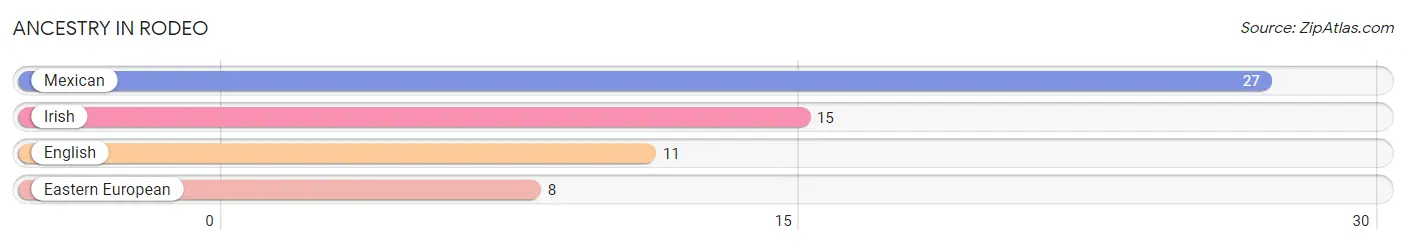
Ancestry in Rodeo
The most populous ancestries reported in Rodeo are Mexican (27 | 54.0%), Irish (15 | 30.0%), English (11 | 22.0%), and Eastern European (8 | 16.0%), together accounting for 122.0% of all Rodeo residents.
Ancestry
# Population
% Population
Eastern European
8
16.0%
English
11
22.0%
Irish
15
30.0%
Mexican
27
54.0%
View All 4 Rows
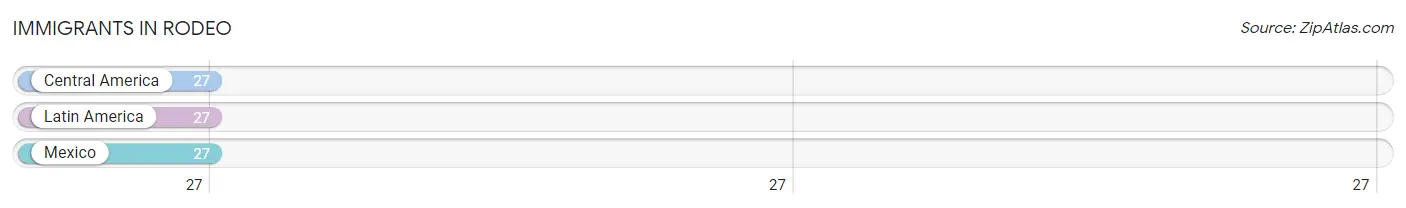
Immigrants in Rodeo
The most numerous immigrant groups reported in Rodeo came from Central America (27 | 54.0%), Latin America (27 | 54.0%), and Mexico (27 | 54.0%), together accounting for 162.0% of all Rodeo residents.
Immigration Origin
# Population
% Population
Central America
27
54.0%
Latin America
27
54.0%
Mexico
27
54.0%
View All 3 Rows
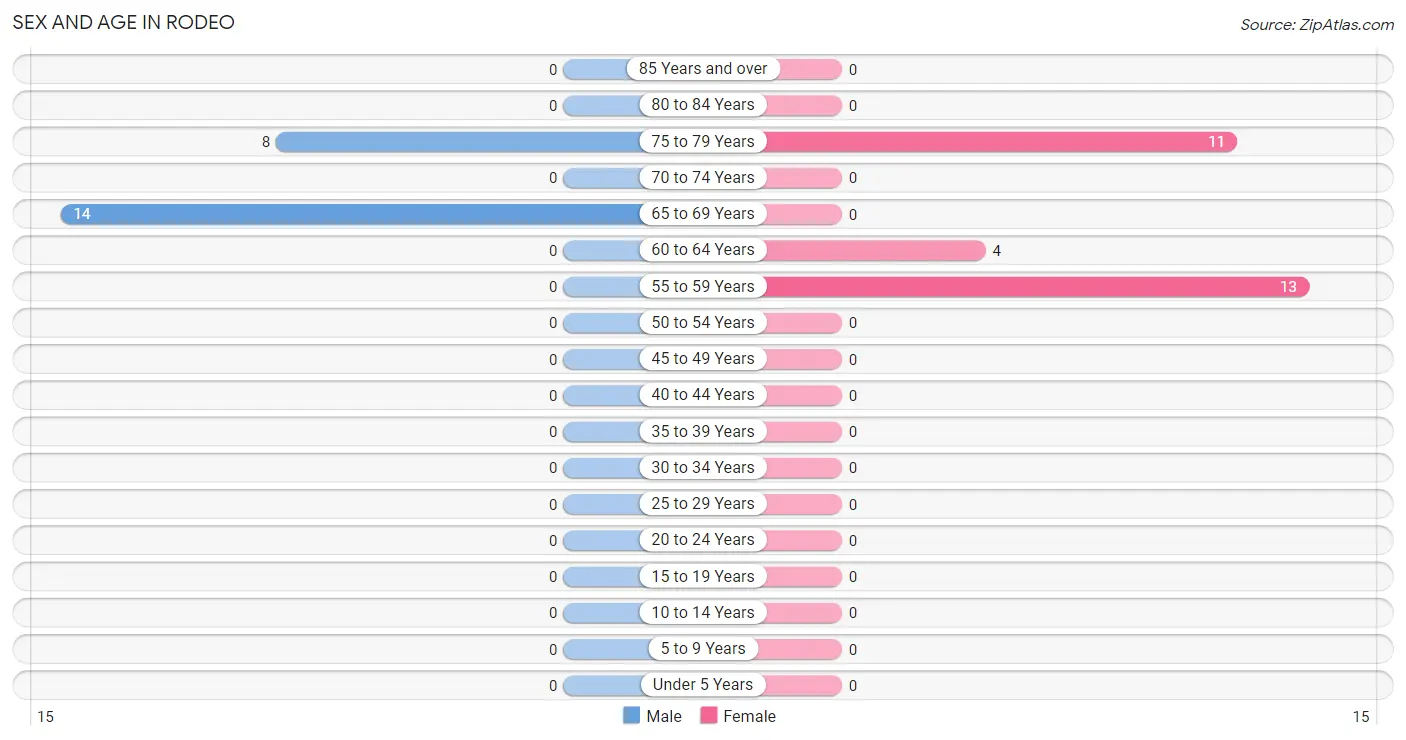
Sex and Age in Rodeo
Sex and Age in Rodeo
The most populous age groups in Rodeo are 65 to 69 Years (14 | 63.6%) for men and 55 to 59 Years (13 | 46.4%) for women.
Age Bracket
Male
Female
Under 5 Years
0 (0.0%)
0 (0.0%)
5 to 9 Years
0 (0.0%)
0 (0.0%)
10 to 14 Years
0 (0.0%)
0 (0.0%)
15 to 19 Years
0 (0.0%)
0 (0.0%)
20 to 24 Years
0 (0.0%)
0 (0.0%)
25 to 29 Years
0 (0.0%)
0 (0.0%)
30 to 34 Years
0 (0.0%)
0 (0.0%)
35 to 39 Years
0 (0.0%)
0 (0.0%)
40 to 44 Years
0 (0.0%)
0 (0.0%)
45 to 49 Years
0 (0.0%)
0 (0.0%)
50 to 54 Years
0 (0.0%)
0 (0.0%)
55 to 59 Years
0 (0.0%)
13 (46.4%)
60 to 64 Years
0 (0.0%)
4 (14.3%)
65 to 69 Years
14 (63.6%)
0 (0.0%)
70 to 74 Years
0 (0.0%)
0 (0.0%)
75 to 79 Years
8 (36.4%)
11 (39.3%)
80 to 84 Years
0 (0.0%)
0 (0.0%)
85 Years and over
0 (0.0%)
0 (0.0%)
Total
22 (100.0%)
28 (100.0%)
Families and Households in Rodeo
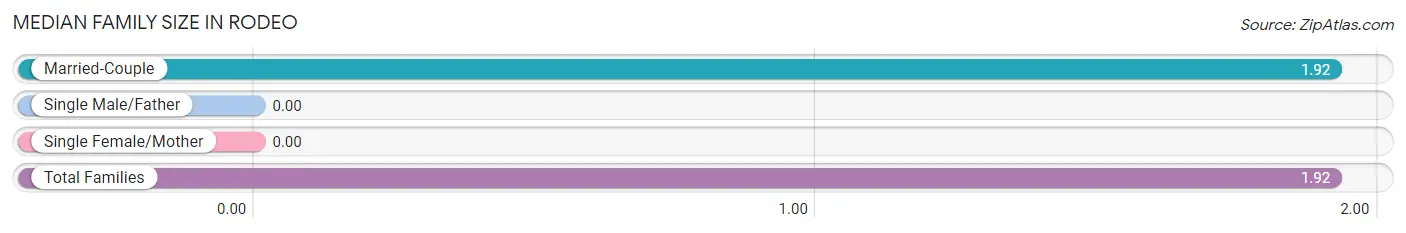
Median Family Size in Rodeo
Family Type
# Families
Family Size
Married-Couple
24 (100.0%)
1.92
Single Male/Father
0 (0.0%)
-
Single Female/Mother
0 (0.0%)
-
Total Families
24 (100.0%)
1.92
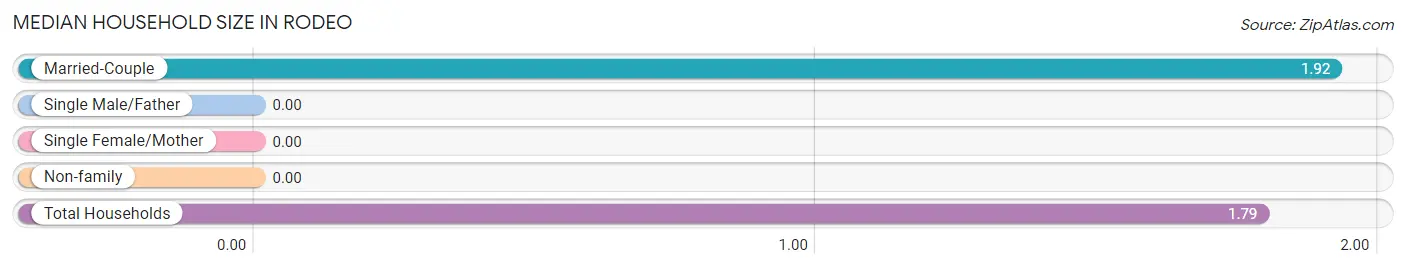
Median Household Size in Rodeo
Household Type
# Households
Household Size
Married-Couple
24 (85.7%)
1.92
Single Male/Father
0 (0.0%)
-
Single Female/Mother
0 (0.0%)
-
Non-family
4 (14.3%)
-
Total Households
28 (100.0%)
1.79
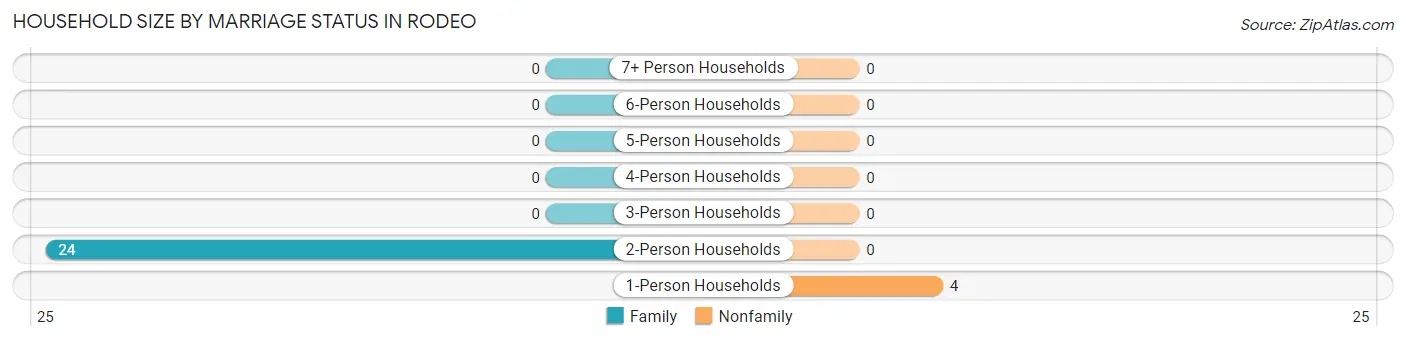
Household Size by Marriage Status in Rodeo
Out of a total of 28 households in Rodeo, 24 (85.7%) are family households, while 4 (14.3%) are nonfamily households. The most numerous type of family households are 2-person households, comprising 24, and the most common type of nonfamily households are 1-person households, comprising 4.
Household Size
Family Households
Nonfamily Households
1-Person Households
-
4 (14.3%)
2-Person Households
24 (85.7%)
0 (0.0%)
3-Person Households
0 (0.0%)
0 (0.0%)
4-Person Households
0 (0.0%)
0 (0.0%)
5-Person Households
0 (0.0%)
0 (0.0%)
6-Person Households
0 (0.0%)
0 (0.0%)
7+ Person Households
0 (0.0%)
0 (0.0%)
Total
24 (85.7%)
4 (14.3%)
Female Fertility in Rodeo
Fertility by Age in Rodeo
Age Bracket
Women with Births
Births / 1,000 Women
15 to 19 years
0 (0.0%)
0.0
20 to 34 years
0 (0.0%)
0.0
35 to 50 years
0 (0.0%)
0.0
Total
0 (0.0%)
0.0
Fertility by Age by Marriage Status in Rodeo
Age Bracket
Married
Unmarried
15 to 19 years
0 (0.0%)
0 (0.0%)
20 to 34 years
0 (0.0%)
0 (0.0%)
35 to 50 years
0 (0.0%)
0 (0.0%)
Total
0 (0.0%)
0 (0.0%)
Fertility by Education in Rodeo
Educational Attainment
Women with Births
Births / 1,000 Women
Less than High School
0 (0.0%)
0.0
High School Diploma
0 (0.0%)
0.0
College or Associate's Degree
0 (0.0%)
0.0
Bachelor's Degree
0 (0.0%)
0.0
Graduate Degree
0 (0.0%)
0.0
Total
0 (0.0%)
0.0
Fertility by Education by Marriage Status in Rodeo
Educational Attainment
Married
Unmarried
Less than High School
0 (0.0%)
0 (0.0%)
High School Diploma
0 (0.0%)
0 (0.0%)
College or Associate's Degree
0 (0.0%)
0 (0.0%)
Bachelor's Degree
0 (0.0%)
0 (0.0%)
Graduate Degree
0 (0.0%)
0 (0.0%)
Total
0 (0.0%)
0 (0.0%)
Employment Characteristics in Rodeo
Employment by Class of Employer in Rodeo
Employer Class
# Employees
% Employees
Private Company Employees
0
0.0%
Self-Employed (Incorporated)
0
0.0%
Self-Employed (Not Incorporated)
0
0.0%
Not-for-profit Organizations
0
0.0%
Local Government Employees
0
0.0%
State Government Employees
0
0.0%
Federal Government Employees
0
0.0%
Unpaid Family Workers
0
0.0%
Total
0
0.0%
Employment Status by Age in Rodeo
Age Bracket
In Labor Force
Unemployed
16 to 19 Years
0 (0.0%)
0 (0.0%)
20 to 24 Years
0 (0.0%)
0 (0.0%)
25 to 29 Years
0 (0.0%)
0 (0.0%)
30 to 34 Years
0 (0.0%)
0 (0.0%)
35 to 44 Years
0 (0.0%)
0 (0.0%)
45 to 54 Years
0 (0.0%)
0 (0.0%)
55 to 59 Years
0 (0.0%)
0 (0.0%)
60 to 64 Years
0 (0.0%)
0 (0.0%)
65 to 74 Years
0 (0.0%)
0 (0.0%)
75 Years and over
0 (0.0%)
0 (0.0%)
Total
0 (0.0%)
0 (0.0%)
Employment Status by Educational Attainment in Rodeo
Educational Attainment
In Labor Force
Unemployed
Less than High School
0 (0.0%)
0 (0.0%)
High School Diploma
0 (0.0%)
0 (0.0%)
College / Associate Degree
0 (0.0%)
0 (0.0%)
Bachelor's Degree or higher
0 (0.0%)
0 (0.0%)
Total
0 (0.0%)
0 (0.0%)
Employment Occupations by Sex in Rodeo
Management, Business, Science and Arts Occupations
Management, Business, Science and Arts Occupations by Sex
Occupation
Male
Female
Management
0 (0.0%)
0 (0.0%)
Business & Financial
0 (0.0%)
0 (0.0%)
Computers, Engineering & Science
0 (0.0%)
0 (0.0%)
Computers & Mathematics
0 (0.0%)
0 (0.0%)
Architecture & Engineering
0 (0.0%)
0 (0.0%)
Life, Physical & Social Science
0 (0.0%)
0 (0.0%)
Community & Social Service
0 (0.0%)
0 (0.0%)
Education, Arts & Media
0 (0.0%)
0 (0.0%)
Legal Services & Support
0 (0.0%)
0 (0.0%)
Education Instruction & Library
0 (0.0%)
0 (0.0%)
Arts, Media & Entertainment
0 (0.0%)
0 (0.0%)
Health Diagnosing & Treating
0 (0.0%)
0 (0.0%)
Health Technologists
0 (0.0%)
0 (0.0%)
Total (Category)
0 (0.0%)
0 (0.0%)
Total (Overall)
0 (0.0%)
0 (0.0%)
Services Occupations
Services Occupations by Sex
Occupation
Male
Female
Healthcare Support
0 (0.0%)
0 (0.0%)
Security & Protection
0 (0.0%)
0 (0.0%)
Firefighting & Prevention
0 (0.0%)
0 (0.0%)
Law Enforcement
0 (0.0%)
0 (0.0%)
Food Preparation & Serving
0 (0.0%)
0 (0.0%)
Cleaning & Maintenance
0 (0.0%)
0 (0.0%)
Personal Care & Service
0 (0.0%)
0 (0.0%)
Total (Category)
0 (0.0%)
0 (0.0%)
Total (Overall)
0 (0.0%)
0 (0.0%)
Sales and Office Occupations
Sales and Office Occupations by Sex
Occupation
Male
Female
Sales & Related
0 (0.0%)
0 (0.0%)
Office & Administration
0 (0.0%)
0 (0.0%)
Total (Category)
0 (0.0%)
0 (0.0%)
Total (Overall)
0 (0.0%)
0 (0.0%)
Natural Resources, Construction and Maintenance Occupations
Natural Resources, Construction and Maintenance Occupations by Sex
Occupation
Male
Female
Farming, Fishing & Forestry
0 (0.0%)
0 (0.0%)
Construction & Extraction
0 (0.0%)
0 (0.0%)
Installation, Maintenance & Repair
0 (0.0%)
0 (0.0%)
Total (Category)
0 (0.0%)
0 (0.0%)
Total (Overall)
0 (0.0%)
0 (0.0%)
Production, Transportation and Moving Occupations
Production, Transportation and Moving Occupations by Sex
Occupation
Male
Female
Production
0 (0.0%)
0 (0.0%)
Transportation
0 (0.0%)
0 (0.0%)
Material Moving
0 (0.0%)
0 (0.0%)
Total (Category)
0 (0.0%)
0 (0.0%)
Total (Overall)
0 (0.0%)
0 (0.0%)
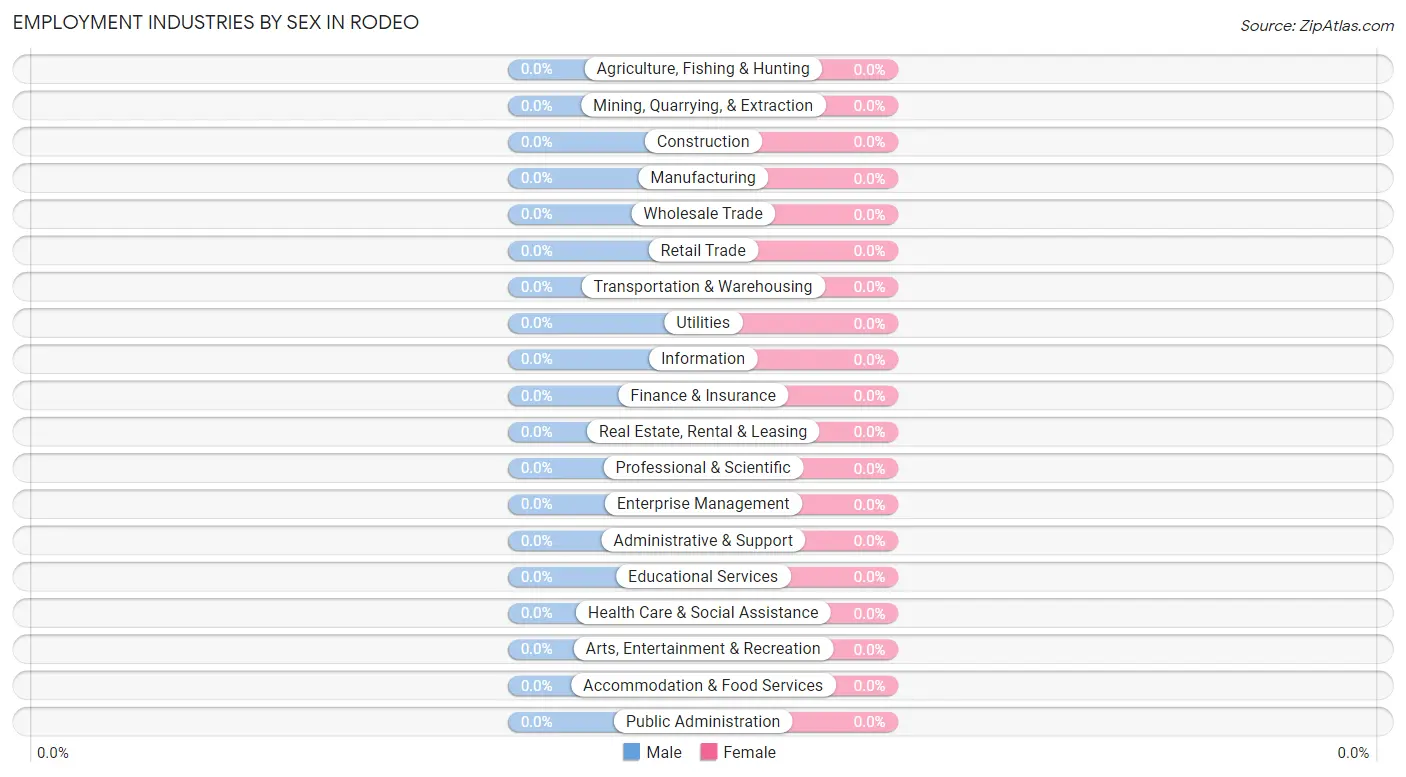
Employment Industries by Sex in Rodeo
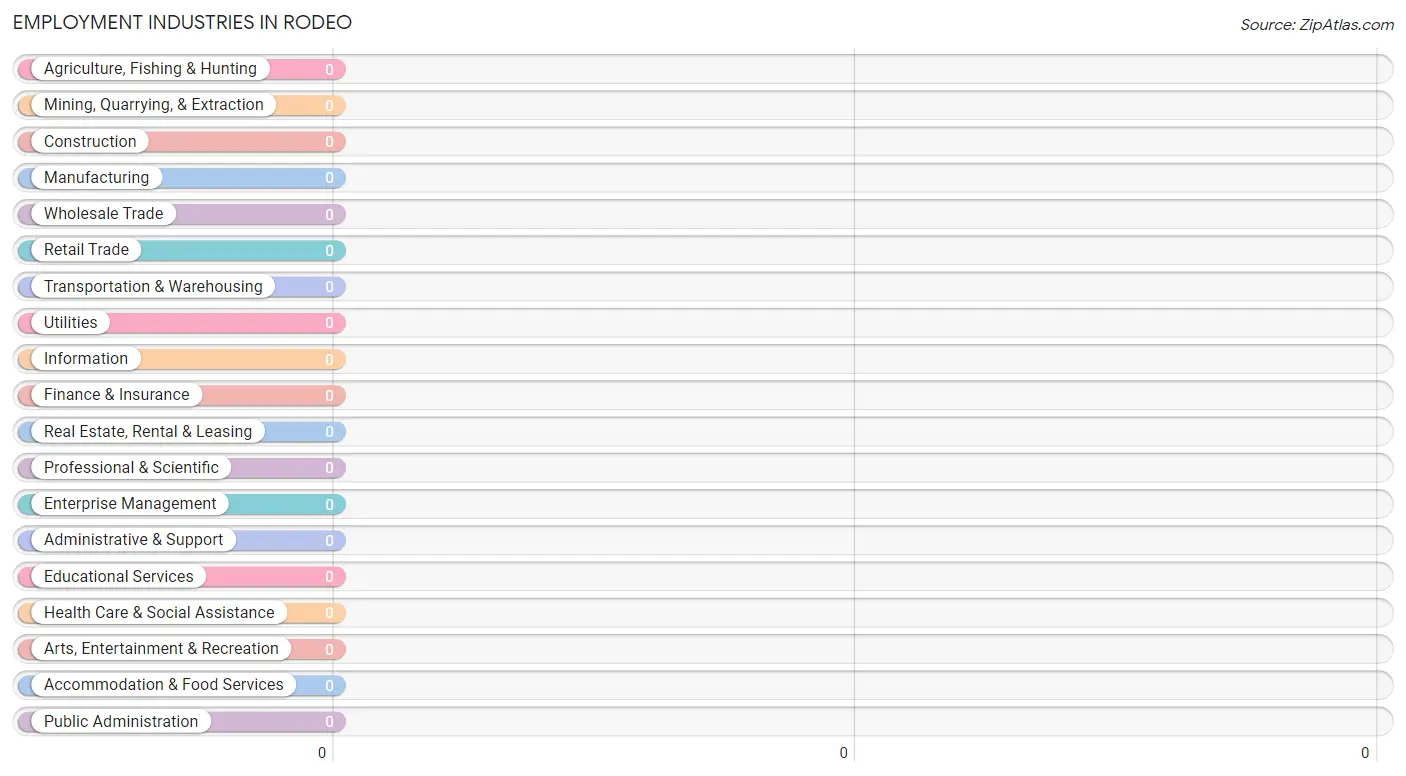
Employment Industries in Rodeo
Employment Industries by Sex in Rodeo
Industry
Male
Female
Agriculture, Fishing & Hunting
0 (0.0%)
0 (0.0%)
Mining, Quarrying, & Extraction
0 (0.0%)
0 (0.0%)
Construction
0 (0.0%)
0 (0.0%)
Manufacturing
0 (0.0%)
0 (0.0%)
Wholesale Trade
0 (0.0%)
0 (0.0%)
Retail Trade
0 (0.0%)
0 (0.0%)
Transportation & Warehousing
0 (0.0%)
0 (0.0%)
Utilities
0 (0.0%)
0 (0.0%)
Information
0 (0.0%)
0 (0.0%)
Finance & Insurance
0 (0.0%)
0 (0.0%)
Real Estate, Rental & Leasing
0 (0.0%)
0 (0.0%)
Professional & Scientific
0 (0.0%)
0 (0.0%)
Enterprise Management
0 (0.0%)
0 (0.0%)
Administrative & Support
0 (0.0%)
0 (0.0%)
Educational Services
0 (0.0%)
0 (0.0%)
Health Care & Social Assistance
0 (0.0%)
0 (0.0%)
Arts, Entertainment & Recreation
0 (0.0%)
0 (0.0%)
Accommodation & Food Services
0 (0.0%)
0 (0.0%)
Public Administration
0 (0.0%)
0 (0.0%)
Total
0 (0.0%)
0 (0.0%)
Education in Rodeo
School Enrollment in Rodeo
School Level
# Students
% Students
Nursery / Preschool
0
0.0%
Kindergarten
0
0.0%
Elementary School
0
0.0%
Middle School
0
0.0%
High School
0
0.0%
College / Undergraduate
0
0.0%
Graduate / Professional
0
0.0%
Total
0
0.0%
School Enrollment by Age by Funding Source in Rodeo
Age Bracket
Public School
Private School
3 to 4 Year Olds
0 (0.0%)
0 (0.0%)
5 to 9 Year Old
0 (0.0%)
0 (0.0%)
10 to 14 Year Olds
0 (0.0%)
0 (0.0%)
15 to 17 Year Olds
0 (0.0%)
0 (0.0%)
18 to 19 Year Olds
0 (0.0%)
0 (0.0%)
20 to 24 Year Olds
0 (0.0%)
0 (0.0%)
25 to 34 Year Olds
0 (0.0%)
0 (0.0%)
35 Years and over
0 (0.0%)
0 (0.0%)
Total
0 (0.0%)
0 (0.0%)
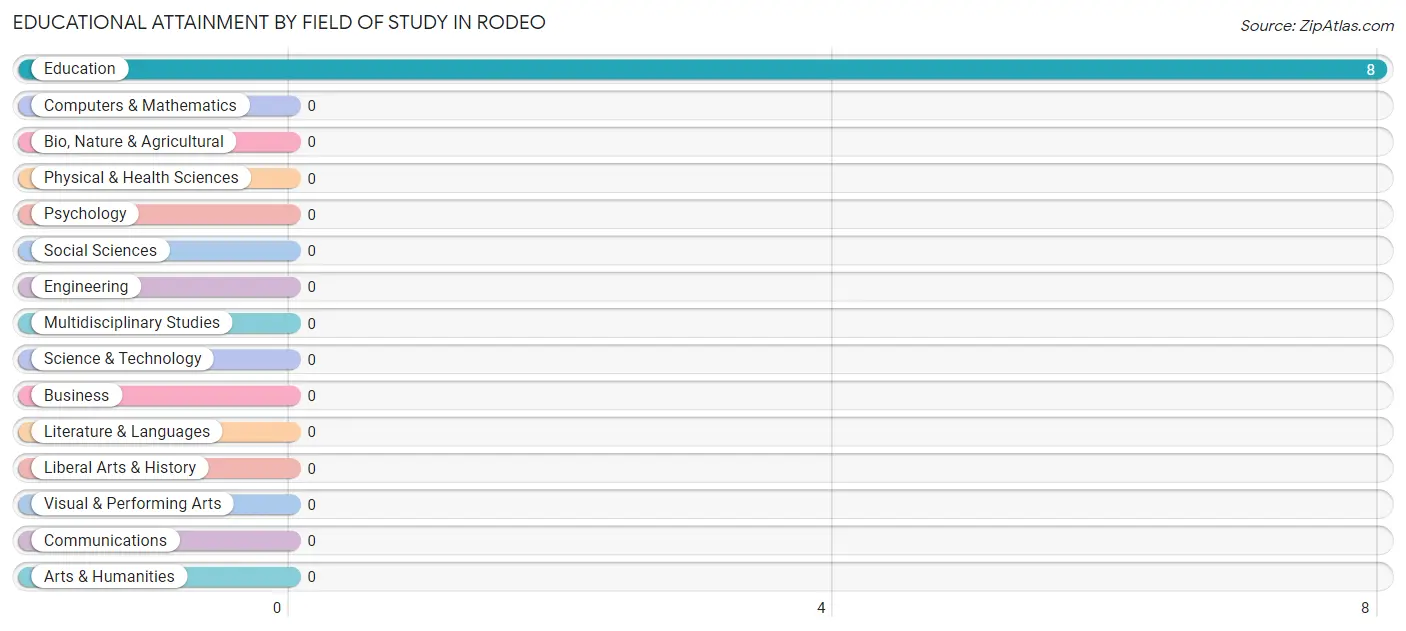
Educational Attainment by Field of Study in Rodeo
, and education (8 | 100.0%) are the most common fields of study among 8 individuals in Rodeo who have obtained a bachelor's degree or higher.
Field of Study
# Graduates
% Graduates
Computers & Mathematics
0
0.0%
Bio, Nature & Agricultural
0
0.0%
Physical & Health Sciences
0
0.0%
Psychology
0
0.0%
Social Sciences
0
0.0%
Engineering
0
0.0%
Multidisciplinary Studies
0
0.0%
Science & Technology
0
0.0%
Business
0
0.0%
Education
8
100.0%
Literature & Languages
0
0.0%
Liberal Arts & History
0
0.0%
Visual & Performing Arts
0
0.0%
Communications
0
0.0%
Arts & Humanities
0
0.0%
Total
8
100.0%
Transportation & Commute in Rodeo
Vehicle Availability by Sex in Rodeo
Vehicles Available
Male
Female
No Vehicle
0 (0.0%)
0 (0.0%)
1 Vehicle
0 (0.0%)
0 (0.0%)
2 Vehicles
0 (0.0%)
0 (0.0%)
3 Vehicles
0 (0.0%)
0 (0.0%)
4 Vehicles
0 (0.0%)
0 (0.0%)
5 or more Vehicles
0 (0.0%)
0 (0.0%)
Total
0 (0.0%)
0 (0.0%)
Commute Time in Rodeo
Commute Time
# Commuters
% Commuters
Less than 5 Minutes
0
0.0%
5 to 9 Minutes
0
0.0%
10 to 14 Minutes
0
0.0%
15 to 19 Minutes
0
0.0%
20 to 24 Minutes
0
0.0%
25 to 29 Minutes
0
0.0%
30 to 34 Minutes
0
0.0%
35 to 39 Minutes
0
0.0%
40 to 44 Minutes
0
0.0%
45 to 59 Minutes
0
0.0%
60 to 89 Minutes
0
0.0%
90 or more Minutes
0
0.0%
Commute Time by Sex in Rodeo
Commute Time
Male
Female
Less than 5 Minutes
0 (0.0%)
0 (0.0%)
5 to 9 Minutes
0 (0.0%)
0 (0.0%)
10 to 14 Minutes
0 (0.0%)
0 (0.0%)
15 to 19 Minutes
0 (0.0%)
0 (0.0%)
20 to 24 Minutes
0 (0.0%)
0 (0.0%)
25 to 29 Minutes
0 (0.0%)
0 (0.0%)
30 to 34 Minutes
0 (0.0%)
0 (0.0%)
35 to 39 Minutes
0 (0.0%)
0 (0.0%)
40 to 44 Minutes
0 (0.0%)
0 (0.0%)
45 to 59 Minutes
0 (0.0%)
0 (0.0%)
60 to 89 Minutes
0 (0.0%)
0 (0.0%)
90 or more Minutes
0 (0.0%)
0 (0.0%)
Time of Departure to Work by Sex in Rodeo
Time of Departure
Male
Female
12:00 AM to 4:59 AM
0 (0.0%)
0 (0.0%)
5:00 AM to 5:29 AM
0 (0.0%)
0 (0.0%)
5:30 AM to 5:59 AM
0 (0.0%)
0 (0.0%)
6:00 AM to 6:29 AM
0 (0.0%)
0 (0.0%)
6:30 AM to 6:59 AM
0 (0.0%)
0 (0.0%)
7:00 AM to 7:29 AM
0 (0.0%)
0 (0.0%)
7:30 AM to 7:59 AM
0 (0.0%)
0 (0.0%)
8:00 AM to 8:29 AM
0 (0.0%)
0 (0.0%)
8:30 AM to 8:59 AM
0 (0.0%)
0 (0.0%)
9:00 AM to 9:59 AM
0 (0.0%)
0 (0.0%)
10:00 AM to 10:59 AM
0 (0.0%)
0 (0.0%)
11:00 AM to 11:59 AM
0 (0.0%)
0 (0.0%)
12:00 PM to 3:59 PM
0 (0.0%)
0 (0.0%)
4:00 PM to 11:59 PM
0 (0.0%)
0 (0.0%)
Total
0 (0.0%)
0 (0.0%)
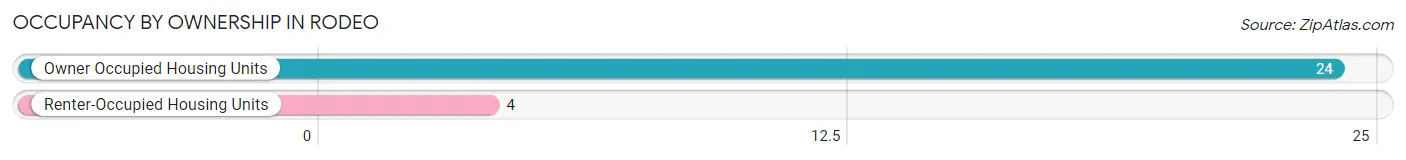
Housing Occupancy in Rodeo
Occupancy by Ownership in Rodeo
Of the total 28 dwellings in Rodeo, owner-occupied units account for 24 (85.7%), while renter-occupied units make up 4 (14.3%).
Occupancy
# Housing Units
% Housing Units
Owner Occupied Housing Units
24
85.7%
Renter-Occupied Housing Units
4
14.3%
Total Occupied Housing Units
28
100.0%
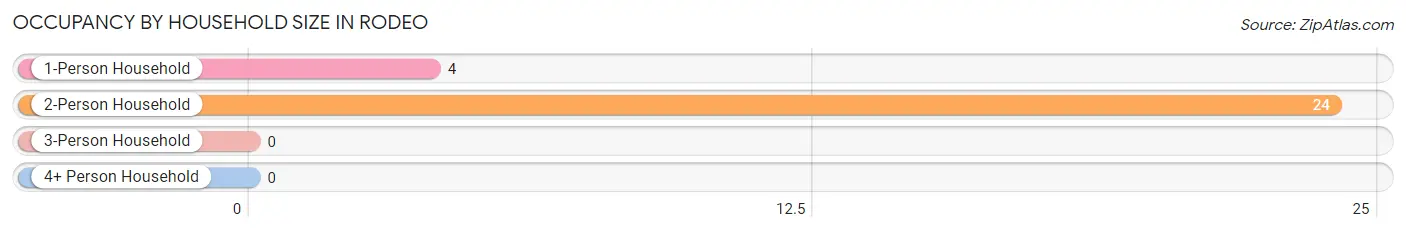
Occupancy by Household Size in Rodeo
Household Size
# Housing Units
% Housing Units
1-Person Household
4
14.3%
2-Person Household
24
85.7%
3-Person Household
0
0.0%
4+ Person Household
0
0.0%
Total Housing Units
28
100.0%
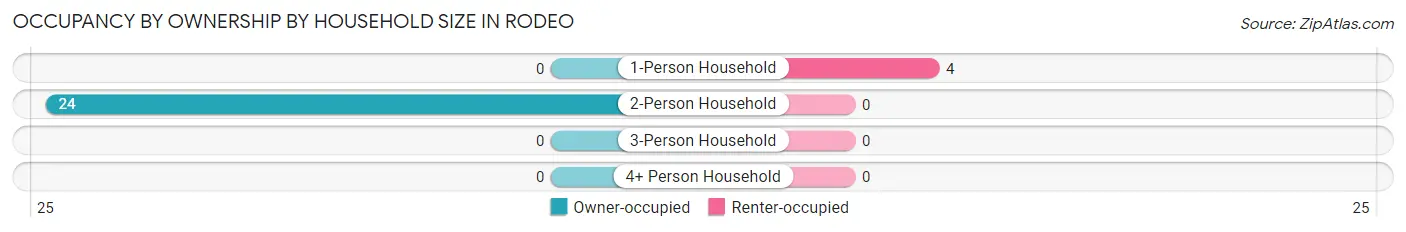
Occupancy by Ownership by Household Size in Rodeo
Household Size
Owner-occupied
Renter-occupied
1-Person Household
0 (0.0%)
4 (100.0%)
2-Person Household
24 (100.0%)
0 (0.0%)
3-Person Household
0 (0.0%)
0 (0.0%)
4+ Person Household
0 (0.0%)
0 (0.0%)
Total Housing Units
24 (85.7%)
4 (14.3%)
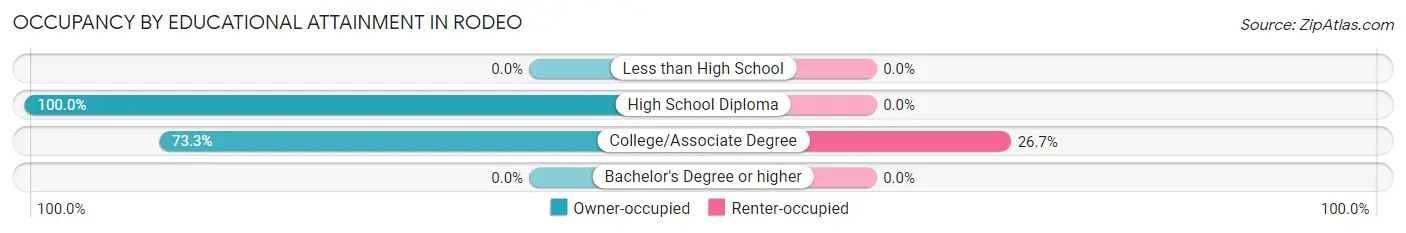
Occupancy by Educational Attainment in Rodeo
Household Size
Owner-occupied
Renter-occupied
Less than High School
0 (0.0%)
0 (0.0%)
High School Diploma
13 (100.0%)
0 (0.0%)
College/Associate Degree
11 (73.3%)
4 (26.7%)
Bachelor's Degree or higher
0 (0.0%)
0 (0.0%)
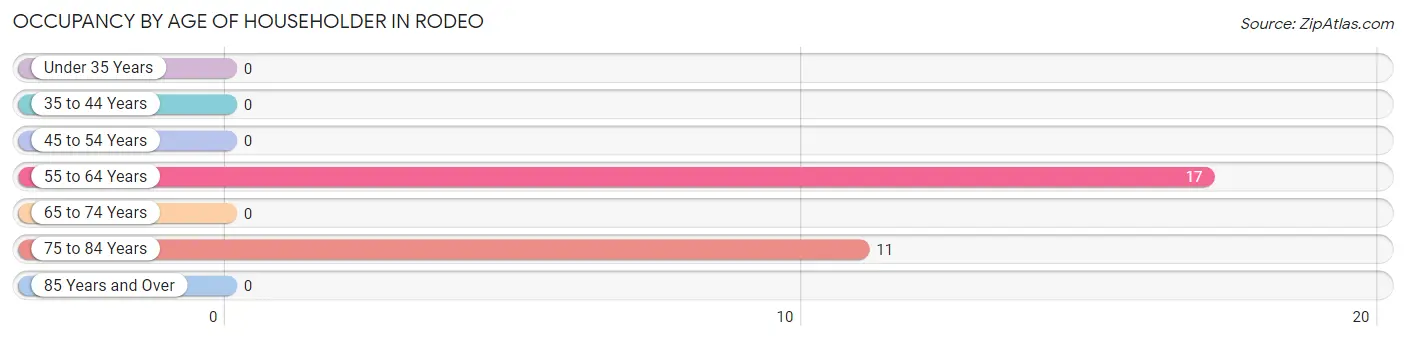
Occupancy by Age of Householder in Rodeo
Age Bracket
# Households
% Households
Under 35 Years
0
0.0%
35 to 44 Years
0
0.0%
45 to 54 Years
0
0.0%
55 to 64 Years
17
60.7%
65 to 74 Years
0
0.0%
75 to 84 Years
11
39.3%
85 Years and Over
0
0.0%
Total
28
100.0%
Housing Finances in Rodeo
Median Income by Occupancy in Rodeo
Occupancy Type
# Households
Median Income
Owner-Occupied
24 (85.7%)
$0
Renter-Occupied
4 (14.3%)
$0
Average
28 (100.0%)
$0
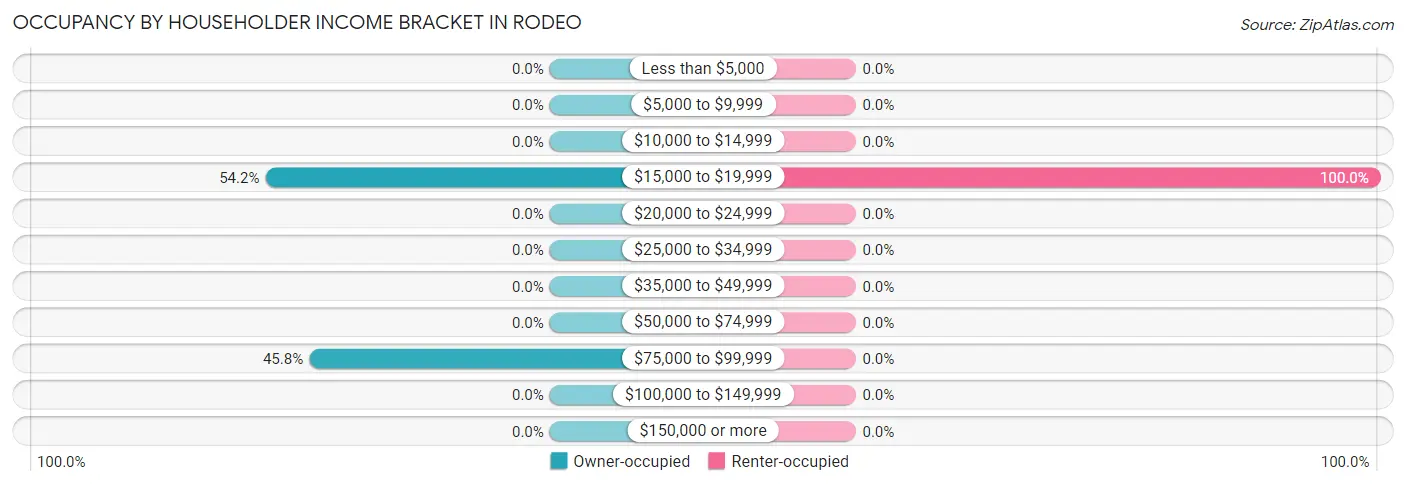
Occupancy by Householder Income Bracket in Rodeo
Income Bracket
Owner-occupied
Renter-occupied
Less than $5,000
0 (0.0%)
0 (0.0%)
$5,000 to $9,999
0 (0.0%)
0 (0.0%)
$10,000 to $14,999
0 (0.0%)
0 (0.0%)
$15,000 to $19,999
13 (54.2%)
4 (100.0%)
$20,000 to $24,999
0 (0.0%)
0 (0.0%)
$25,000 to $34,999
0 (0.0%)
0 (0.0%)
$35,000 to $49,999
0 (0.0%)
0 (0.0%)
$50,000 to $74,999
0 (0.0%)
0 (0.0%)
$75,000 to $99,999
11 (45.8%)
0 (0.0%)
$100,000 to $149,999
0 (0.0%)
0 (0.0%)
$150,000 or more
0 (0.0%)
0 (0.0%)
Total
24 (100.0%)
4 (100.0%)
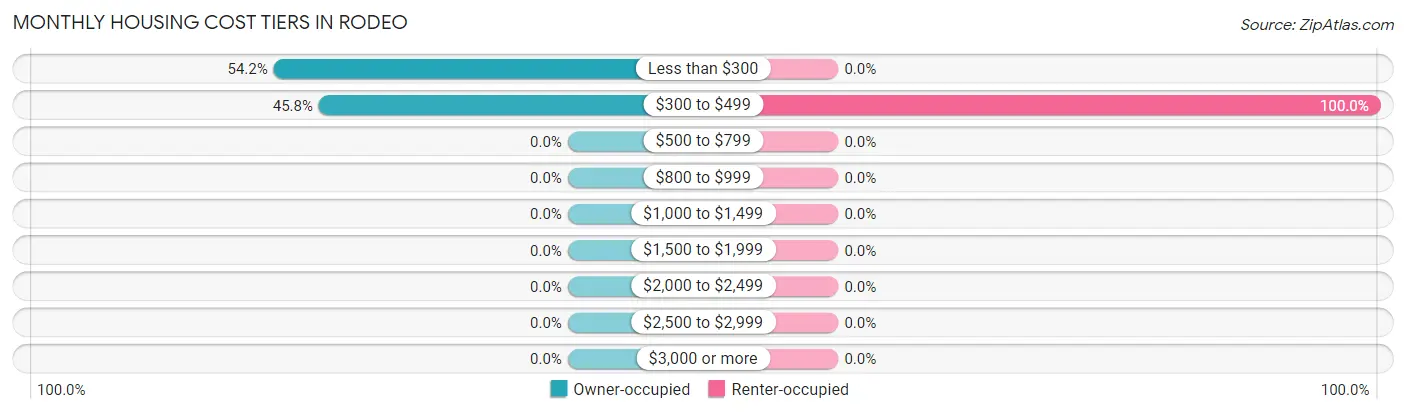
Monthly Housing Cost Tiers in Rodeo
Monthly Cost
Owner-occupied
Renter-occupied
Less than $300
13 (54.2%)
0 (0.0%)
$300 to $499
11 (45.8%)
4 (100.0%)
$500 to $799
0 (0.0%)
0 (0.0%)
$800 to $999
0 (0.0%)
0 (0.0%)
$1,000 to $1,499
0 (0.0%)
0 (0.0%)
$1,500 to $1,999
0 (0.0%)
0 (0.0%)
$2,000 to $2,499
0 (0.0%)
0 (0.0%)
$2,500 to $2,999
0 (0.0%)
0 (0.0%)
$3,000 or more
0 (0.0%)
0 (0.0%)
Total
24 (100.0%)
4 (100.0%)
Physical Housing Characteristics in Rodeo
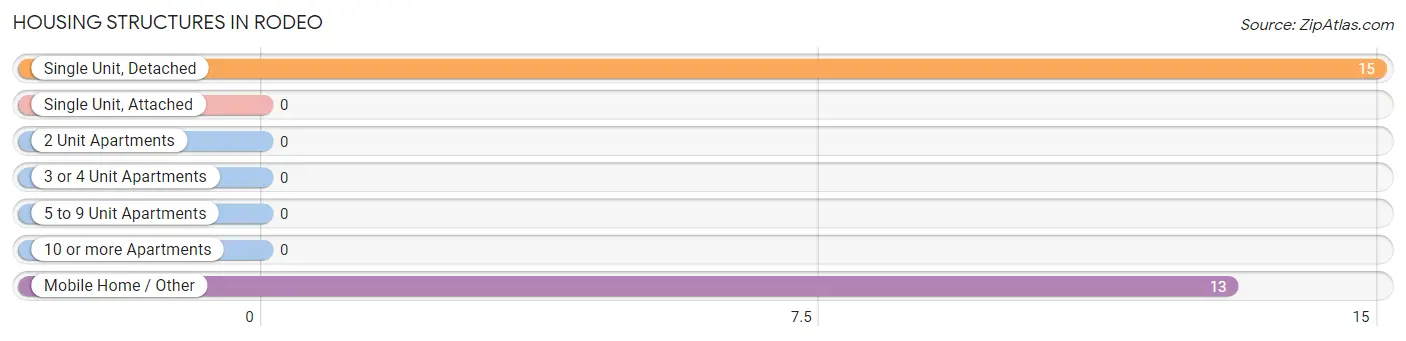
Housing Structures in Rodeo
Structure Type
# Housing Units
% Housing Units
Single Unit, Detached
15
53.6%
Single Unit, Attached
0
0.0%
2 Unit Apartments
0
0.0%
3 or 4 Unit Apartments
0
0.0%
5 to 9 Unit Apartments
0
0.0%
10 or more Apartments
0
0.0%
Mobile Home / Other
13
46.4%
Total
28
100.0%
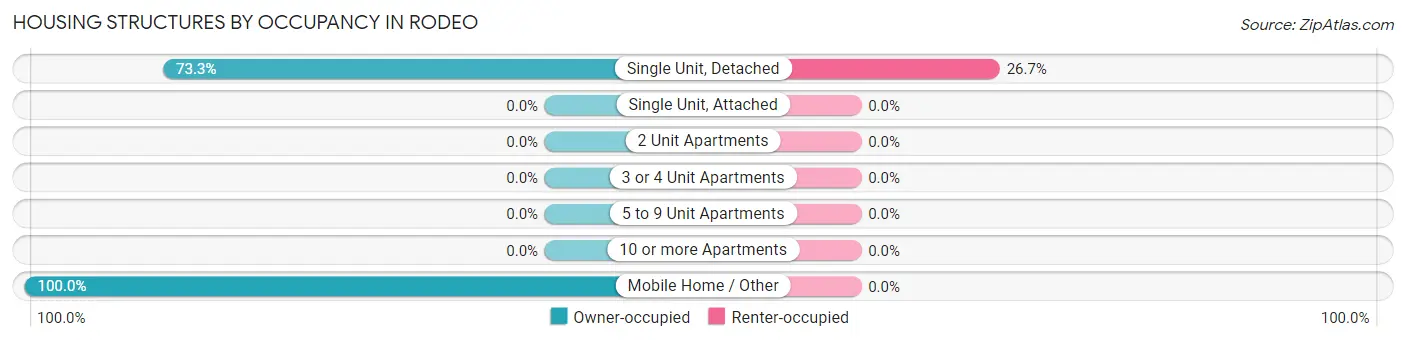
Housing Structures by Occupancy in Rodeo
Structure Type
Owner-occupied
Renter-occupied
Single Unit, Detached
11 (73.3%)
4 (26.7%)
Single Unit, Attached
0 (0.0%)
0 (0.0%)
2 Unit Apartments
0 (0.0%)
0 (0.0%)
3 or 4 Unit Apartments
0 (0.0%)
0 (0.0%)
5 to 9 Unit Apartments
0 (0.0%)
0 (0.0%)
10 or more Apartments
0 (0.0%)
0 (0.0%)
Mobile Home / Other
13 (100.0%)
0 (0.0%)
Total
24 (85.7%)
4 (14.3%)
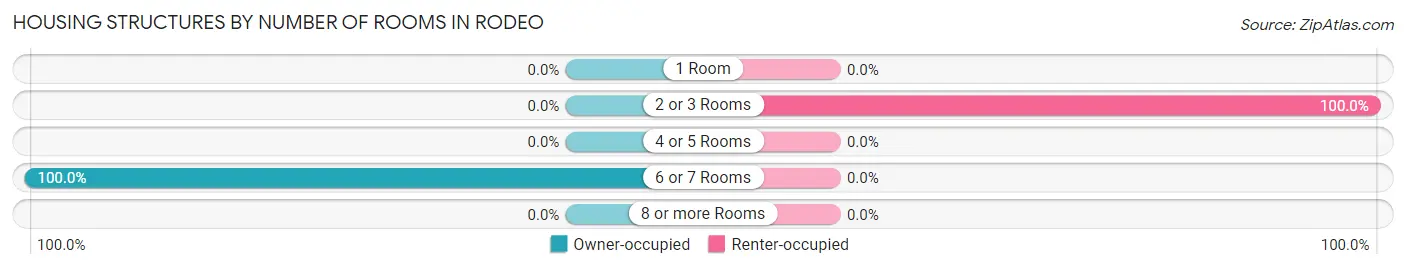
Housing Structures by Number of Rooms in Rodeo
Number of Rooms
Owner-occupied
Renter-occupied
1 Room
0 (0.0%)
0 (0.0%)
2 or 3 Rooms
0 (0.0%)
4 (100.0%)
4 or 5 Rooms
0 (0.0%)
0 (0.0%)
6 or 7 Rooms
24 (100.0%)
0 (0.0%)
8 or more Rooms
0 (0.0%)
0 (0.0%)
Total
24 (100.0%)
4 (100.0%)
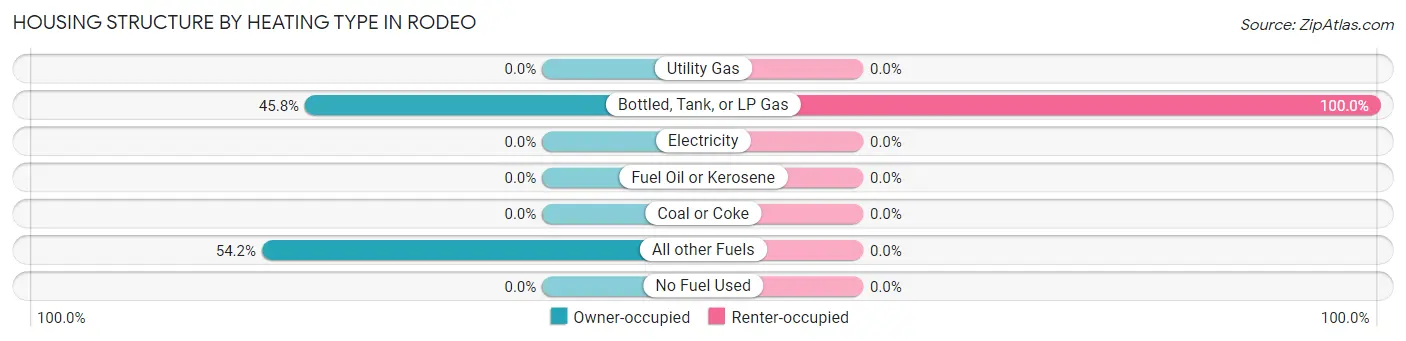
Housing Structure by Heating Type in Rodeo
Heating Type
Owner-occupied
Renter-occupied
Utility Gas
0 (0.0%)
0 (0.0%)
Bottled, Tank, or LP Gas
11 (45.8%)
4 (100.0%)
Electricity
0 (0.0%)
0 (0.0%)
Fuel Oil or Kerosene
0 (0.0%)
0 (0.0%)
Coal or Coke
0 (0.0%)
0 (0.0%)
All other Fuels
13 (54.2%)
0 (0.0%)
No Fuel Used
0 (0.0%)
0 (0.0%)
Total
24 (100.0%)
4 (100.0%)
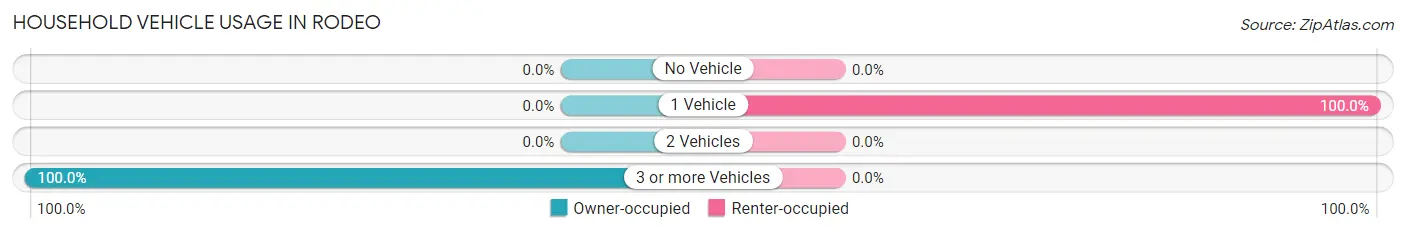
Household Vehicle Usage in Rodeo
Vehicles per Household
Owner-occupied
Renter-occupied
No Vehicle
0 (0.0%)
0 (0.0%)
1 Vehicle
0 (0.0%)
4 (100.0%)
2 Vehicles
0 (0.0%)
0 (0.0%)
3 or more Vehicles
24 (100.0%)
0 (0.0%)
Total
24 (100.0%)
4 (100.0%)
Real Estate & Mortgages in Rodeo
Real Estate and Mortgage Overview in Rodeo
Characteristic
Without Mortgage
With Mortgage
Housing Units
24
0
Median Property Value
-
-
Median Household Income
-
-
Monthly Housing Costs
-
-
Real Estate Taxes
-
-
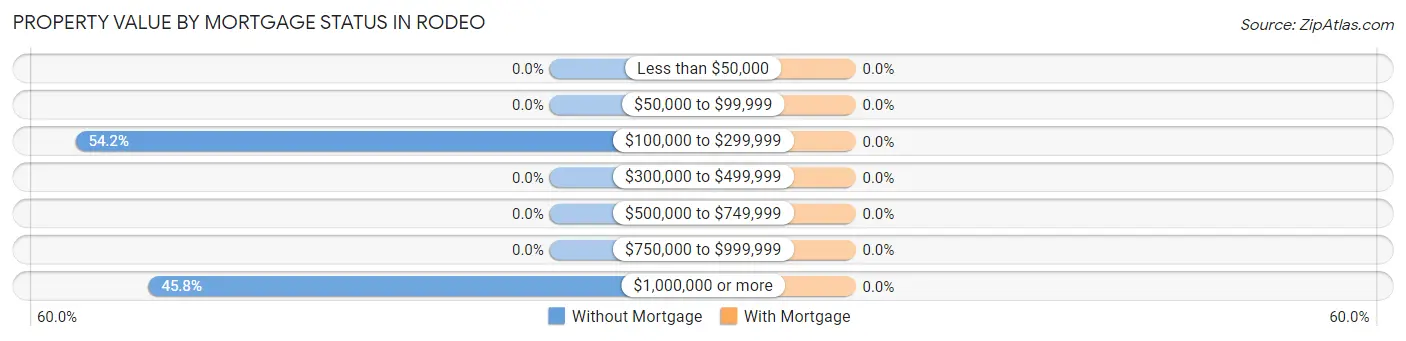
Property Value by Mortgage Status in Rodeo
Property Value
Without Mortgage
With Mortgage
Less than $50,000
0 (0.0%)
0 (0.0%)
$50,000 to $99,999
0 (0.0%)
0 (0.0%)
$100,000 to $299,999
13 (54.2%)
0 (0.0%)
$300,000 to $499,999
0 (0.0%)
0 (0.0%)
$500,000 to $749,999
0 (0.0%)
0 (0.0%)
$750,000 to $999,999
0 (0.0%)
0 (0.0%)
$1,000,000 or more
11 (45.8%)
0 (0.0%)
Total
24 (100.0%)
0 (0.0%)
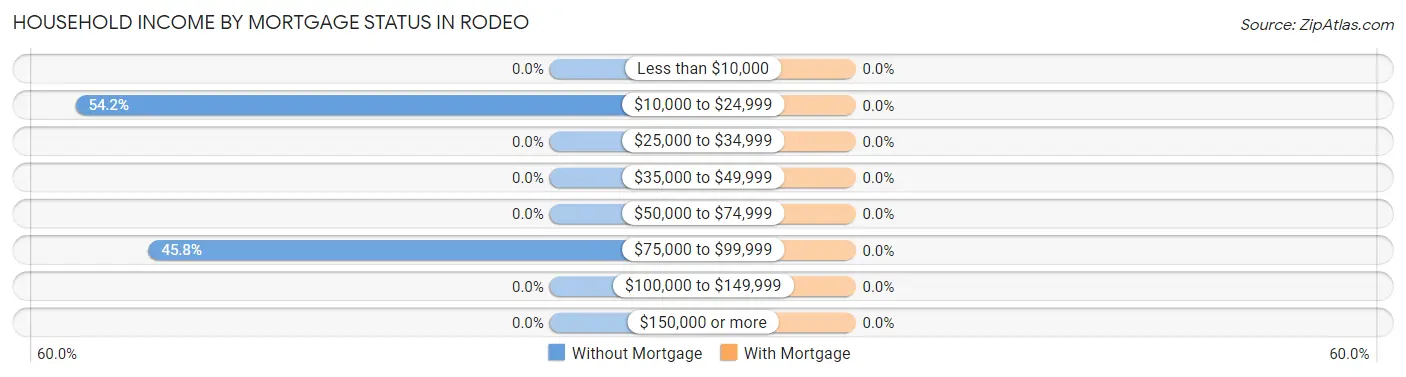
Household Income by Mortgage Status in Rodeo
Household Income
Without Mortgage
With Mortgage
Less than $10,000
0 (0.0%)
0 (0.0%)
$10,000 to $24,999
13 (54.2%)
0 (0.0%)
$25,000 to $34,999
0 (0.0%)
0 (0.0%)
$35,000 to $49,999
0 (0.0%)
0 (0.0%)
$50,000 to $74,999
0 (0.0%)
0 (0.0%)
$75,000 to $99,999
11 (45.8%)
0 (0.0%)
$100,000 to $149,999
0 (0.0%)
0 (0.0%)
$150,000 or more
0 (0.0%)
0 (0.0%)
Total
24 (100.0%)
0 (0.0%)
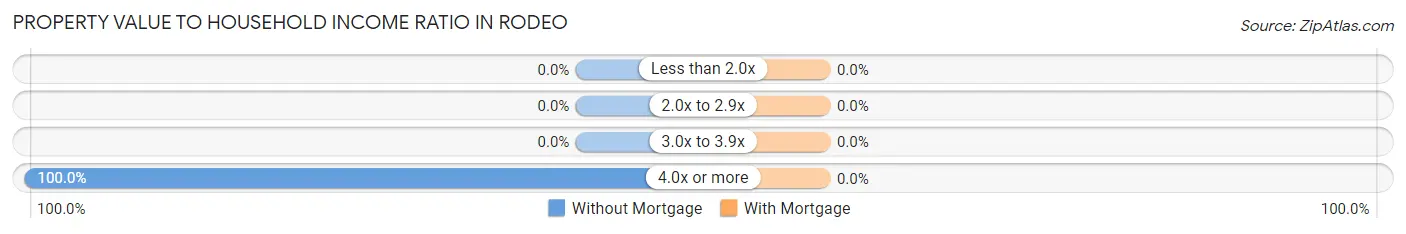
Property Value to Household Income Ratio in Rodeo
Value-to-Income Ratio
Without Mortgage
With Mortgage
Less than 2.0x
0 (0.0%)
0 (0.0%)
2.0x to 2.9x
0 (0.0%)
0 (0.0%)
3.0x to 3.9x
0 (0.0%)
0 (0.0%)
4.0x or more
24 (100.0%)
0 (0.0%)
Total
24 (100.0%)
0 (0.0%)
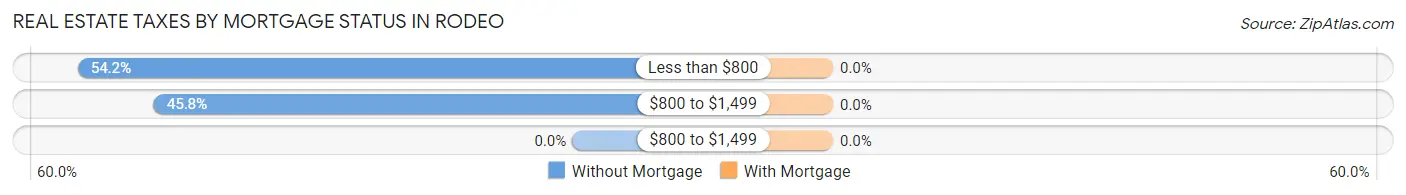
Real Estate Taxes by Mortgage Status in Rodeo
Property Taxes
Without Mortgage
With Mortgage
Less than $800
13 (54.2%)
0 (0.0%)
$800 to $1,499
11 (45.8%)
0 (0.0%)
$800 to $1,499
0 (0.0%)
0 (0.0%)
Total
24 (100.0%)
0 (0.0%)
Health & Disability in Rodeo
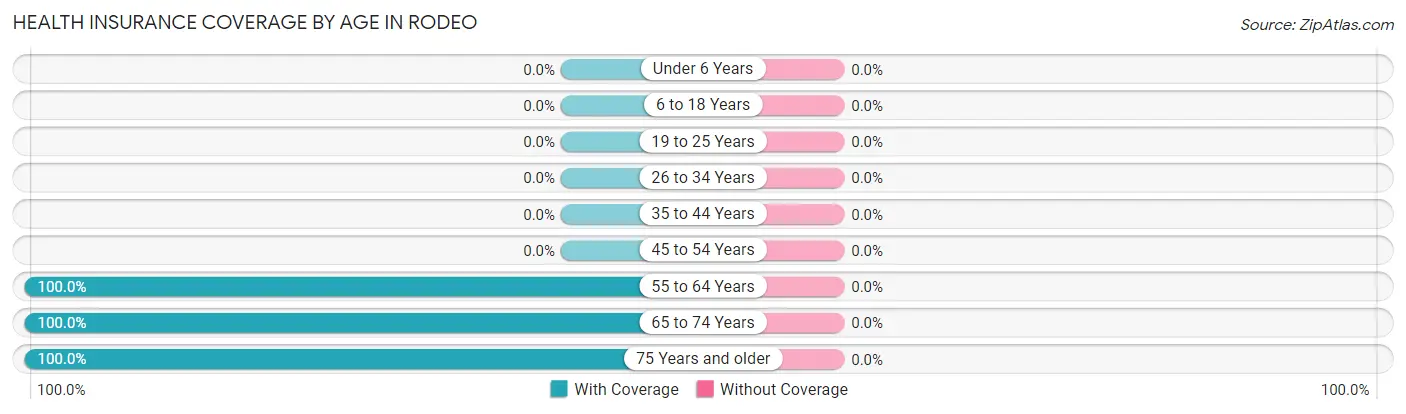
Health Insurance Coverage by Age in Rodeo
Age Bracket
With Coverage
Without Coverage
Under 6 Years
0 (0.0%)
0 (0.0%)
6 to 18 Years
0 (0.0%)
0 (0.0%)
19 to 25 Years
0 (0.0%)
0 (0.0%)
26 to 34 Years
0 (0.0%)
0 (0.0%)
35 to 44 Years
0 (0.0%)
0 (0.0%)
45 to 54 Years
0 (0.0%)
0 (0.0%)
55 to 64 Years
17 (100.0%)
0 (0.0%)
65 to 74 Years
14 (100.0%)
0 (0.0%)
75 Years and older
19 (100.0%)
0 (0.0%)
Total
50 (100.0%)
0 (0.0%)
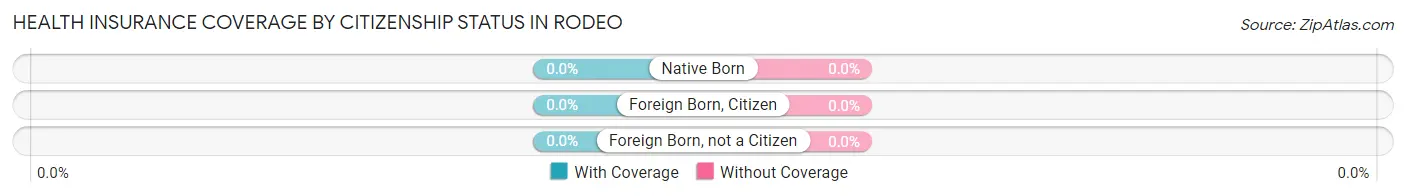
Health Insurance Coverage by Citizenship Status in Rodeo
Citizenship Status
With Coverage
Without Coverage
Native Born
0 (0.0%)
0 (0.0%)
Foreign Born, Citizen
0 (0.0%)
0 (0.0%)
Foreign Born, not a Citizen
0 (0.0%)
0 (0.0%)
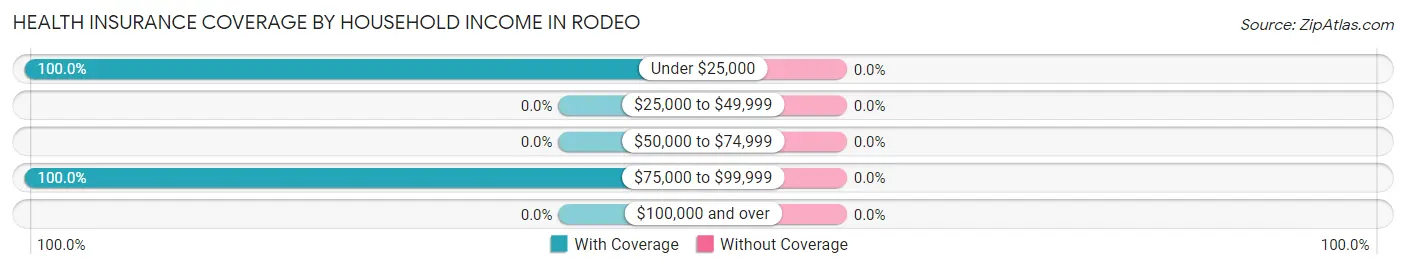
Health Insurance Coverage by Household Income in Rodeo
Household Income
With Coverage
Without Coverage
Under $25,000
31 (100.0%)
0 (0.0%)
$25,000 to $49,999
0 (0.0%)
0 (0.0%)
$50,000 to $74,999
0 (0.0%)
0 (0.0%)
$75,000 to $99,999
19 (100.0%)
0 (0.0%)
$100,000 and over
0 (0.0%)
0 (0.0%)
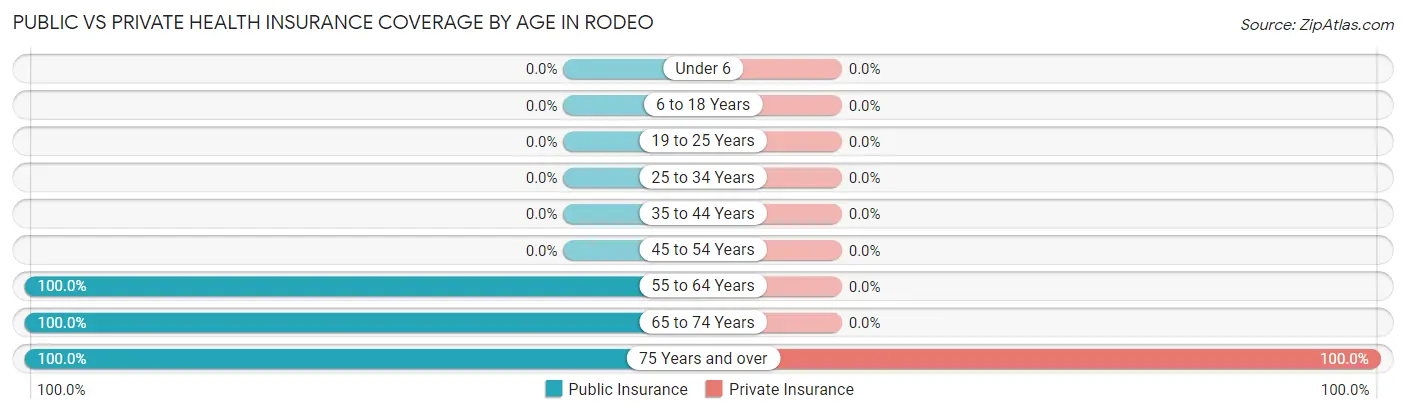
Public vs Private Health Insurance Coverage by Age in Rodeo
Age Bracket
Public Insurance
Private Insurance
Under 6
0 (0.0%)
0 (0.0%)
6 to 18 Years
0 (0.0%)
0 (0.0%)
19 to 25 Years
0 (0.0%)
0 (0.0%)
25 to 34 Years
0 (0.0%)
0 (0.0%)
35 to 44 Years
0 (0.0%)
0 (0.0%)
45 to 54 Years
0 (0.0%)
0 (0.0%)
55 to 64 Years
17 (100.0%)
0 (0.0%)
65 to 74 Years
14 (100.0%)
0 (0.0%)
75 Years and over
19 (100.0%)
19 (100.0%)
Total
50 (100.0%)
19 (38.0%)
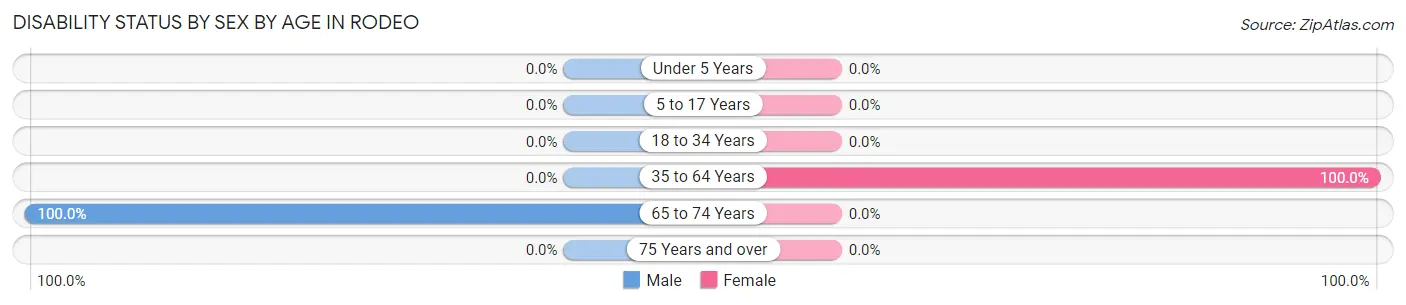
Disability Status by Sex by Age in Rodeo
Age Bracket
Male
Female
Under 5 Years
0 (0.0%)
0 (0.0%)
5 to 17 Years
0 (0.0%)
0 (0.0%)
18 to 34 Years
0 (0.0%)
0 (0.0%)
35 to 64 Years
0 (0.0%)
17 (100.0%)
65 to 74 Years
14 (100.0%)
0 (0.0%)
75 Years and over
0 (0.0%)
0 (0.0%)
Disability Class by Sex by Age in Rodeo
Disability Class: Hearing Difficulty
Age Bracket
Male
Female
Under 5 Years
0 (0.0%)
0 (0.0%)
5 to 17 Years
0 (0.0%)
0 (0.0%)
18 to 34 Years
0 (0.0%)
0 (0.0%)
35 to 64 Years
0 (0.0%)
0 (0.0%)
65 to 74 Years
0 (0.0%)
0 (0.0%)
75 Years and over
0 (0.0%)
0 (0.0%)
Disability Class: Vision Difficulty
Age Bracket
Male
Female
Under 5 Years
0 (0.0%)
0 (0.0%)
5 to 17 Years
0 (0.0%)
0 (0.0%)
18 to 34 Years
0 (0.0%)
0 (0.0%)
35 to 64 Years
0 (0.0%)
0 (0.0%)
65 to 74 Years
0 (0.0%)
0 (0.0%)
75 Years and over
0 (0.0%)
0 (0.0%)
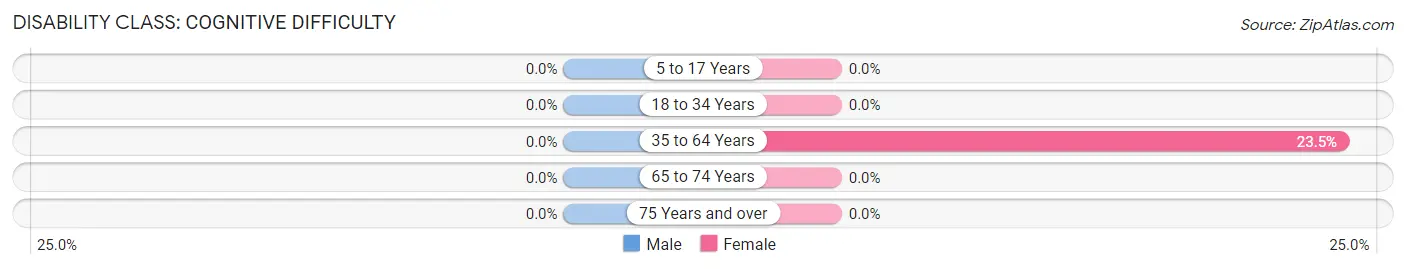
Disability Class: Cognitive Difficulty
Age Bracket
Male
Female
5 to 17 Years
0 (0.0%)
0 (0.0%)
18 to 34 Years
0 (0.0%)
0 (0.0%)
35 to 64 Years
0 (0.0%)
4 (23.5%)
65 to 74 Years
0 (0.0%)
0 (0.0%)
75 Years and over
0 (0.0%)
0 (0.0%)
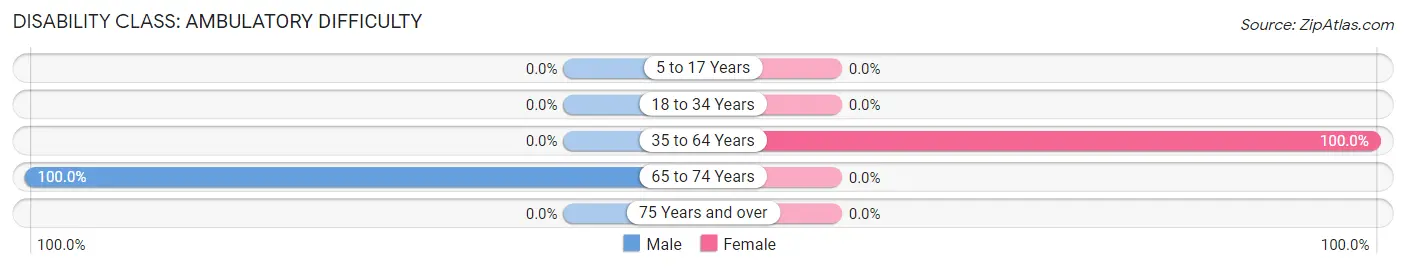
Disability Class: Ambulatory Difficulty
Age Bracket
Male
Female
5 to 17 Years
0 (0.0%)
0 (0.0%)
18 to 34 Years
0 (0.0%)
0 (0.0%)
35 to 64 Years
0 (0.0%)
17 (100.0%)
65 to 74 Years
14 (100.0%)
0 (0.0%)
75 Years and over
0 (0.0%)
0 (0.0%)
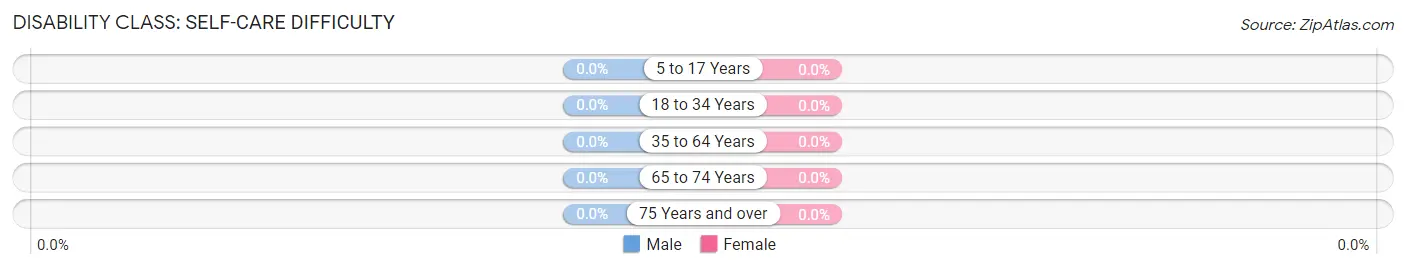
Disability Class: Self-Care Difficulty
Age Bracket
Male
Female
5 to 17 Years
0 (0.0%)
0 (0.0%)
18 to 34 Years
0 (0.0%)
0 (0.0%)
35 to 64 Years
0 (0.0%)
0 (0.0%)
65 to 74 Years
0 (0.0%)
0 (0.0%)
75 Years and over
0 (0.0%)
0 (0.0%)
Technology Access in Rodeo
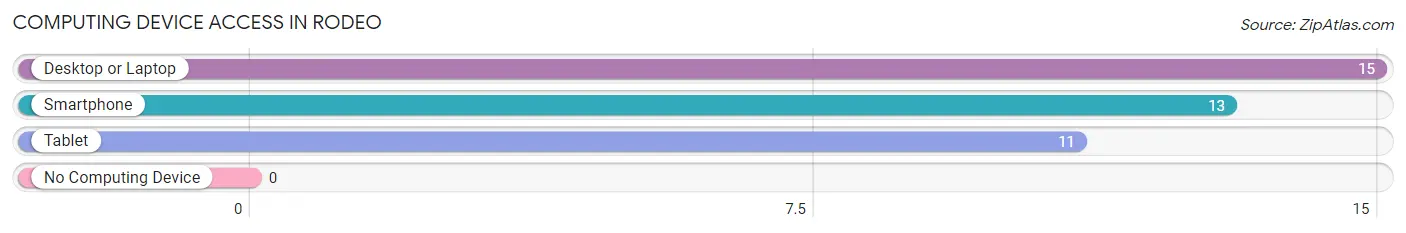
Computing Device Access in Rodeo
Device Type
# Households
% Households
Desktop or Laptop
15
53.6%
Smartphone
13
46.4%
Tablet
11
39.3%
No Computing Device
0
0.0%
Total
28
100.0%
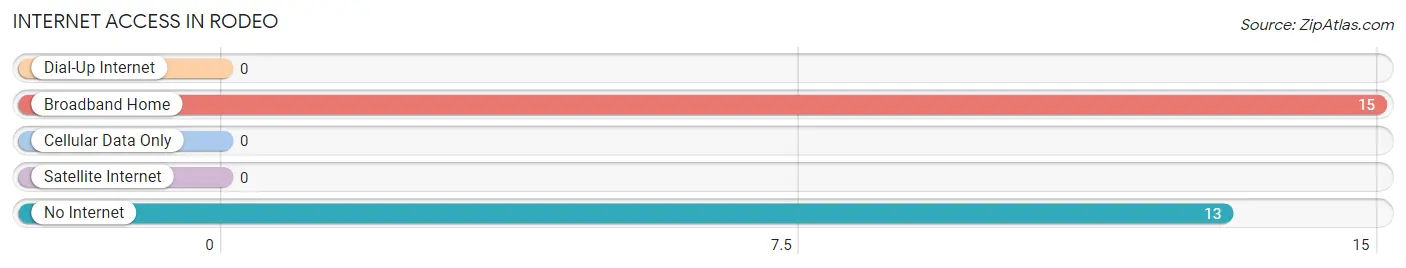
Internet Access in Rodeo
Internet Type
# Households
% Households
Dial-Up Internet
0
0.0%
Broadband Home
15
53.6%
Cellular Data Only
0
0.0%
Satellite Internet
0
0.0%
No Internet
13
46.4%
Total
28
100.0%
Rodeo Summary
Rodeo, New Mexico is a small unincorporated community located in Hidalgo County in the southwestern corner of the state. It is situated in the Chihuahuan Desert, approximately 20 miles east of the Arizona border and 40 miles south of the New Mexico-Texas border. The population of Rodeo was estimated to be around 1,000 in 2020.
History
Rodeo was founded in the late 19th century by a group of ranchers and farmers who were looking for a place to settle and raise their families. The town was named after the nearby Rodeo Creek, which was named by the Spanish settlers who first arrived in the area. The first post office in Rodeo was established in 1891.
In the early 20th century, Rodeo was a thriving agricultural community, with a variety of crops being grown in the area. The town was also home to a number of businesses, including a general store, a blacksmith shop, and a saloon.
In the 1950s, the town began to decline as many of the residents moved away in search of better economic opportunities. By the 1970s, the population had dropped to around 500.
Geography
Rodeo is located in the Chihuahuan Desert, at an elevation of 4,000 feet. The town is situated on the banks of the Rodeo Creek, which flows through the area. The surrounding area is mostly flat, with some rolling hills and mesas.
The climate in Rodeo is arid and semi-arid, with hot summers and mild winters. The average annual temperature is around 70 degrees Fahrenheit, with temperatures reaching as high as 100 degrees in the summer months.
Economy
The economy of Rodeo is largely based on agriculture. The town is home to a number of farms, which grow a variety of crops, including alfalfa, cotton, and wheat. The town also has a number of small businesses, including a general store, a gas station, and a restaurant.
Demographics
As of the 2010 census, the population of Rodeo was estimated to be around 1,000. The racial makeup of the town was 94.3% White, 0.7% African American, 0.3% Native American, 0.3% Asian, and 4.3% from other races. The median household income was $25,000, and the median age was 37.
Rodeo is a small, rural community with a close-knit population. The town is home to a number of churches, and the residents are very involved in their local community. The town is also home to a number of festivals and events throughout the year, including the annual Rodeo Days celebration.
Common Questions
What is Per Capita Income in Rodeo?
Per Capita income in Rodeo is $22,176.
What is Inequality or Gini Index in Rodeo?
Inequality or Gini Index in Rodeo is 0.39.
What is the Total Population of Rodeo?
Total Population of Rodeo is 50.
What is the Total Male Population of Rodeo?
Total Male Population of Rodeo is 22.
What is the Total Female Population of Rodeo?
Total Female Population of Rodeo is 28.
What is the Ratio of Males per 100 Females in Rodeo?
There are 78.57 Males per 100 Females in Rodeo.
What is the Ratio of Females per 100 Males in Rodeo?
There are 127.27 Females per 100 Males in Rodeo.
What is the Median Population Age in Rodeo?
Median Population Age in Rodeo is 68.6 Years.
What is the Average Family Size in Rodeo
Average Family Size in Rodeo is 1.9 People.
What is the Average Household Size in Rodeo
Average Household Size in Rodeo is 1.8 People.
Report Title
Report Link
HTML Copy & Paste Link
Social Media
Copy and paste the folowing code into any webpage where you would like this interactive chart to display