Sherrill, AR Map & Demographics
Sherrill Map
Sherrill Overview
$6,486
PER CAPITA INCOME
$20,655
AVG HOUSEHOLD INCOME
0.05
INEQUALITY / GINI INDEX
194
TOTAL POPULATION
91
MALE POPULATION
103
FEMALE POPULATION
88.35
MALES / 100 FEMALES
113.19
FEMALES / 100 MALES
42.0
MEDIAN AGE
4.0
AVG FAMILY SIZE
3.0
AVG HOUSEHOLD SIZE
45
LABOR FORCE [ PEOPLE ]
44.6%
PERCENT IN LABOR FORCE
Sherrill Zip Codes
Sherrill Area Codes
Income in Sherrill
Income Overview in Sherrill
| Characteristic | Number | Measure |
| Per Capita Income | 194 | $6,486 |
| Median Family Income | 43 | $0 |
| Mean Family Income | 43 | $0 |
| Median Household Income | 64 | $20,655 |
| Mean Household Income | 64 | $19,495 |
| Income Deficit | 43 | $0 |
| Wage / Income Gap (%) | 194 | 0.00% |
| Wage / Income Gap ($) | 194 | 100.00¢ per $1 |
| Gini / Inequality Index | 194 | 0.05 |
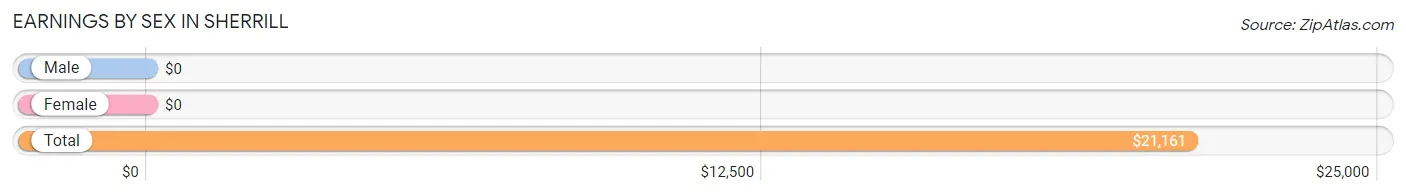
Earnings by Sex in Sherrill
| Sex | Number | Average Earnings |
| Male | 44 (97.8%) | $0 |
| Female | 1 (2.2%) | $0 |
| Total | 45 (100.0%) | $21,161 |
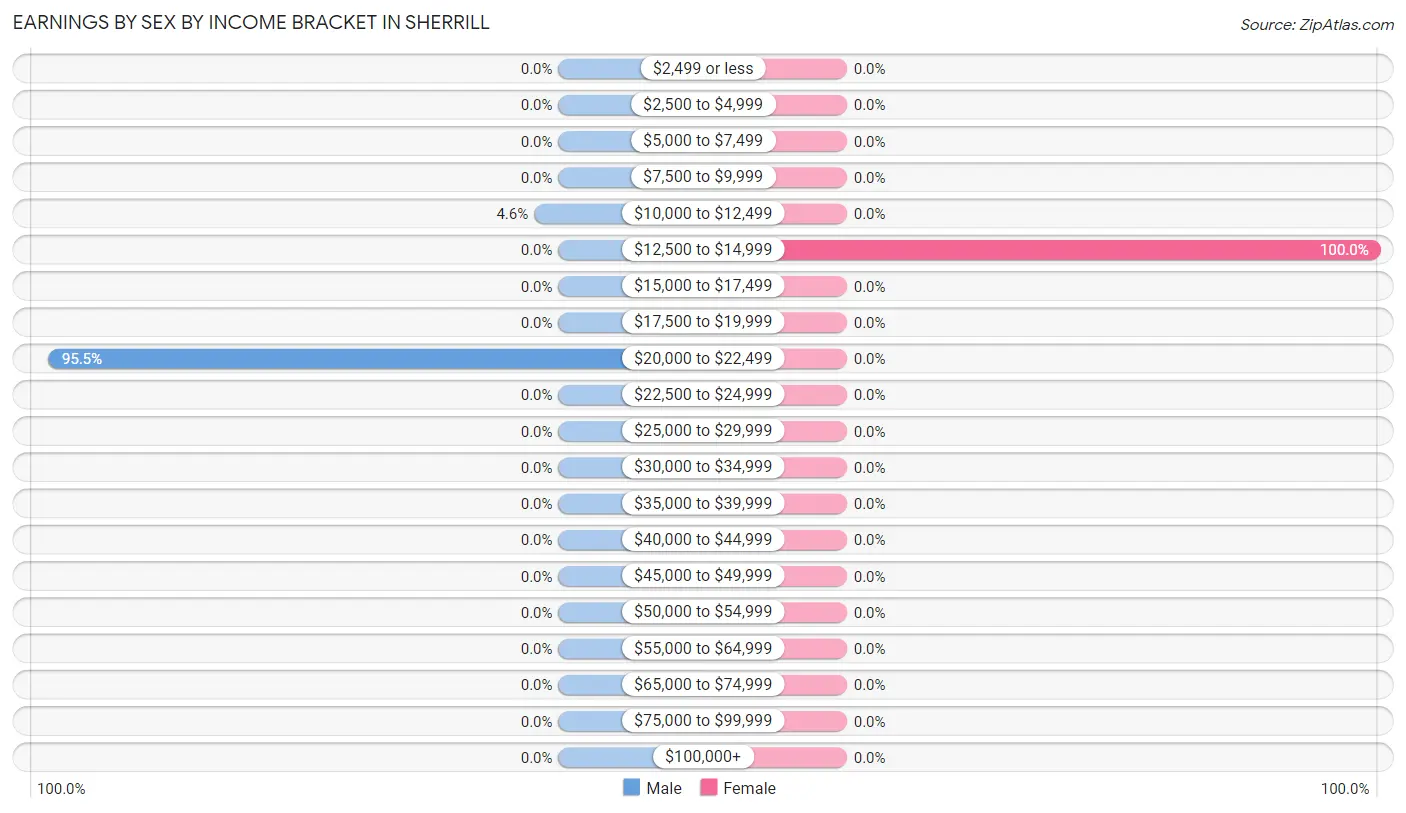
Earnings by Sex by Income Bracket in Sherrill
The most common earnings brackets in Sherrill are $20,000 to $22,499 for men (42 | 95.5%) and $12,500 to $14,999 for women (1 | 100.0%).
| Income | Male | Female |
| $2,499 or less | 0 (0.0%) | 0 (0.0%) |
| $2,500 to $4,999 | 0 (0.0%) | 0 (0.0%) |
| $5,000 to $7,499 | 0 (0.0%) | 0 (0.0%) |
| $7,500 to $9,999 | 0 (0.0%) | 0 (0.0%) |
| $10,000 to $12,499 | 2 (4.5%) | 0 (0.0%) |
| $12,500 to $14,999 | 0 (0.0%) | 1 (100.0%) |
| $15,000 to $17,499 | 0 (0.0%) | 0 (0.0%) |
| $17,500 to $19,999 | 0 (0.0%) | 0 (0.0%) |
| $20,000 to $22,499 | 42 (95.5%) | 0 (0.0%) |
| $22,500 to $24,999 | 0 (0.0%) | 0 (0.0%) |
| $25,000 to $29,999 | 0 (0.0%) | 0 (0.0%) |
| $30,000 to $34,999 | 0 (0.0%) | 0 (0.0%) |
| $35,000 to $39,999 | 0 (0.0%) | 0 (0.0%) |
| $40,000 to $44,999 | 0 (0.0%) | 0 (0.0%) |
| $45,000 to $49,999 | 0 (0.0%) | 0 (0.0%) |
| $50,000 to $54,999 | 0 (0.0%) | 0 (0.0%) |
| $55,000 to $64,999 | 0 (0.0%) | 0 (0.0%) |
| $65,000 to $74,999 | 0 (0.0%) | 0 (0.0%) |
| $75,000 to $99,999 | 0 (0.0%) | 0 (0.0%) |
| $100,000+ | 0 (0.0%) | 0 (0.0%) |
| Total | 44 (100.0%) | 1 (100.0%) |
Earnings by Sex by Educational Attainment in Sherrill
| Educational Attainment | Male Income | Female Income |
| Less than High School | - | - |
| High School Diploma | - | - |
| College or Associate's Degree | - | - |
| Bachelor's Degree | - | - |
| Graduate Degree | - | - |
| Total | - | - |
Family Income in Sherrill
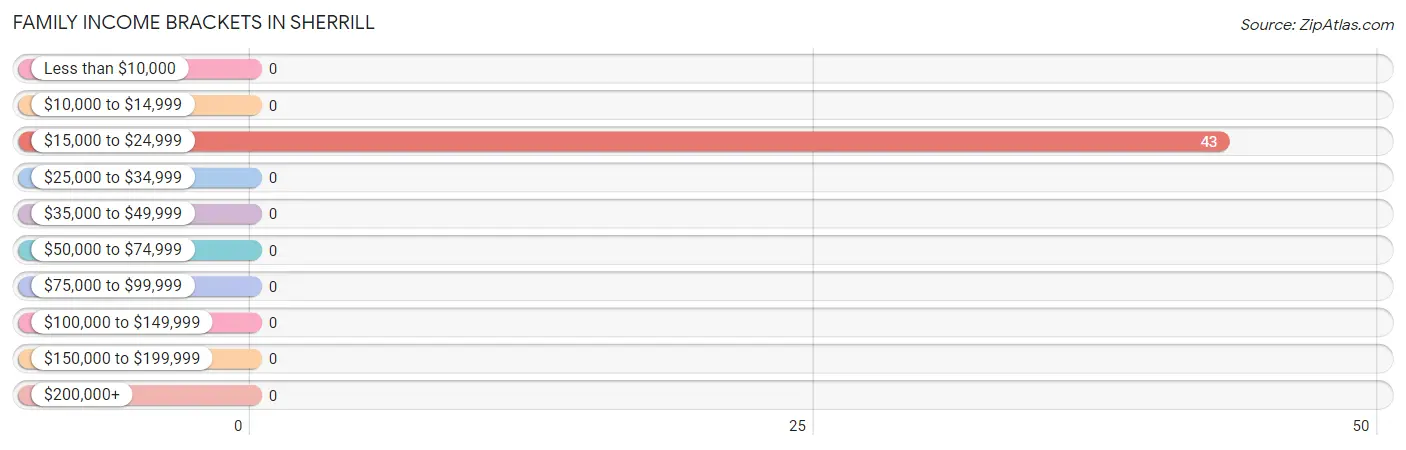
Family Income Brackets in Sherrill
According to the Sherrill family income data, there are 43 families falling into the $15,000 to $24,999 income range, which is the most common income bracket and makes up 100.0% of all families.
| Income Bracket | # Families | % Families |
| Less than $10,000 | 0 | 0.0% |
| $10,000 to $14,999 | 0 | 0.0% |
| $15,000 to $24,999 | 43 | 100.0% |
| $25,000 to $34,999 | 0 | 0.0% |
| $35,000 to $49,999 | 0 | 0.0% |
| $50,000 to $74,999 | 0 | 0.0% |
| $75,000 to $99,999 | 0 | 0.0% |
| $100,000 to $149,999 | 0 | 0.0% |
| $150,000 to $199,999 | 0 | 0.0% |
| $200,000+ | 0 | 0.0% |
Family Income by Famaliy Size in Sherrill
| Income Bracket | # Families | Median Income |
| 2-Person Families | 0 (0.0%) | $0 |
| 3-Person Families | 0 (0.0%) | $0 |
| 4-Person Families | 43 (100.0%) | $0 |
| 5-Person Families | 0 (0.0%) | $0 |
| 6-Person Families | 0 (0.0%) | $0 |
| 7+ Person Families | 0 (0.0%) | $0 |
| Total | 43 (100.0%) | $0 |
Family Income by Number of Earners in Sherrill
| Number of Earners | # Families | Median Income |
| No Earners | 0 (0.0%) | $0 |
| 1 Earner | 43 (100.0%) | $0 |
| 2 Earners | 0 (0.0%) | $0 |
| 3+ Earners | 0 (0.0%) | $0 |
| Total | 43 (100.0%) | $0 |
Household Income in Sherrill
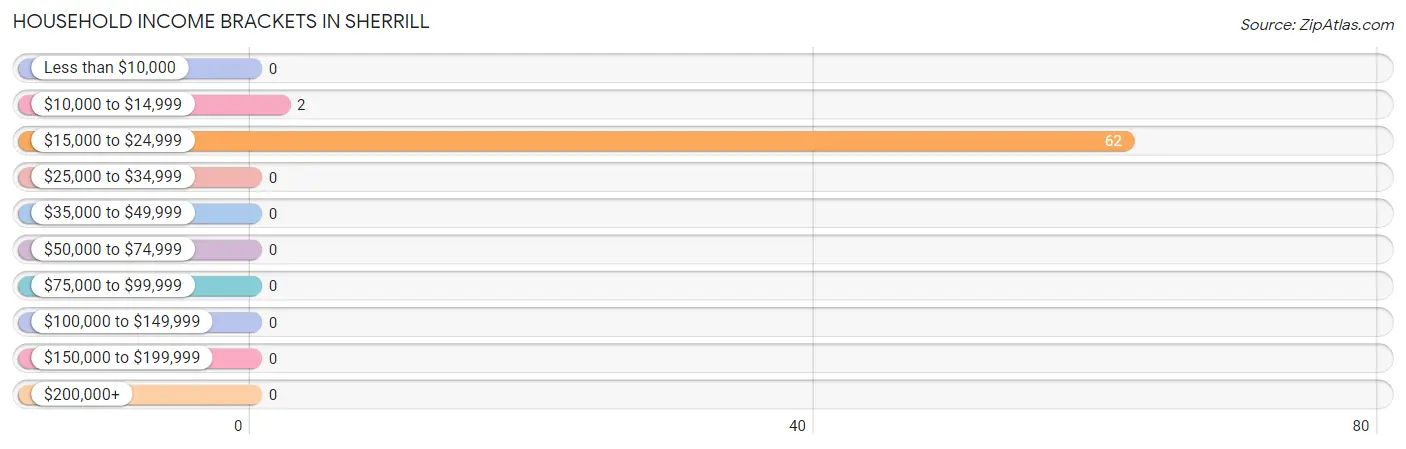
Household Income Brackets in Sherrill
With 62 households falling in the category, the $15,000 to $24,999 income range is the most frequent in Sherrill, accounting for 96.9% of all households.
| Income Bracket | # Households | % Households |
| Less than $10,000 | 0 | 0.0% |
| $10,000 to $14,999 | 2 | 3.1% |
| $15,000 to $24,999 | 62 | 96.9% |
| $25,000 to $34,999 | 0 | 0.0% |
| $35,000 to $49,999 | 0 | 0.0% |
| $50,000 to $74,999 | 0 | 0.0% |
| $75,000 to $99,999 | 0 | 0.0% |
| $100,000 to $149,999 | 0 | 0.0% |
| $150,000 to $199,999 | 0 | 0.0% |
| $200,000+ | 0 | 0.0% |
Household Income by Householder Age in Sherrill
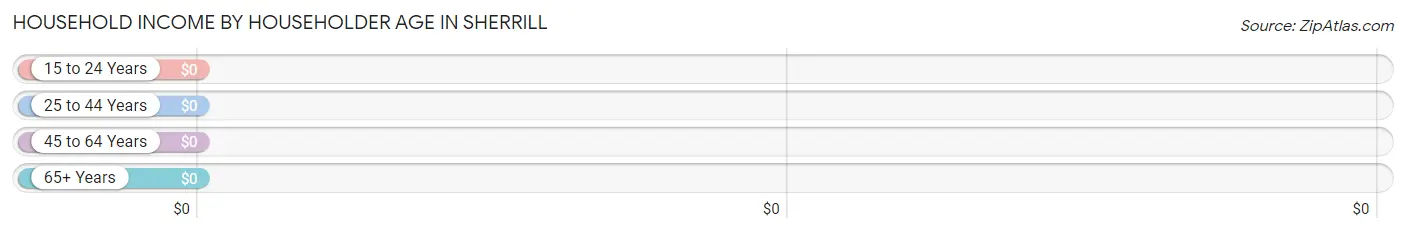
| Income Bracket | # Households | Median Income |
| 15 to 24 Years | 0 (0.0%) | $0 |
| 25 to 44 Years | 43 (67.2%) | $0 |
| 45 to 64 Years | 2 (3.1%) | $0 |
| 65+ Years | 19 (29.7%) | $0 |
| Total | 64 (100.0%) | $20,655 |
Poverty in Sherrill
Income Below Poverty by Sex and Age in Sherrill
With 100.0% poverty level for males and 81.6% for females among the residents of Sherrill, 6 to 11 year old males and under 5 year old females are the most vulnerable to poverty, with 47 males (100.0%) and 46 females (100.0%) in their respective age groups living below the poverty level.
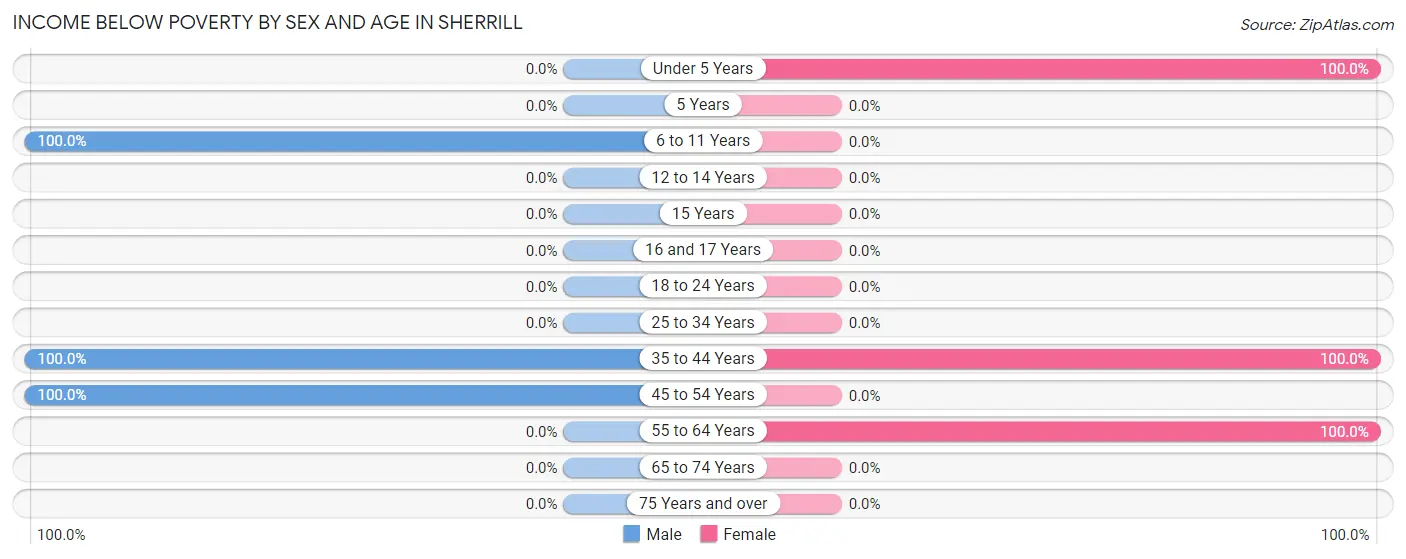
| Age Bracket | Male | Female |
| Under 5 Years | 0 (0.0%) | 46 (100.0%) |
| 5 Years | 0 (0.0%) | 0 (0.0%) |
| 6 to 11 Years | 47 (100.0%) | 0 (0.0%) |
| 12 to 14 Years | 0 (0.0%) | 0 (0.0%) |
| 15 Years | 0 (0.0%) | 0 (0.0%) |
| 16 and 17 Years | 0 (0.0%) | 0 (0.0%) |
| 18 to 24 Years | 0 (0.0%) | 0 (0.0%) |
| 25 to 34 Years | 0 (0.0%) | 0 (0.0%) |
| 35 to 44 Years | 42 (100.0%) | 36 (100.0%) |
| 45 to 54 Years | 2 (100.0%) | 0 (0.0%) |
| 55 to 64 Years | 0 (0.0%) | 2 (100.0%) |
| 65 to 74 Years | 0 (0.0%) | 0 (0.0%) |
| 75 Years and over | 0 (0.0%) | 0 (0.0%) |
| Total | 91 (100.0%) | 84 (81.6%) |
Income Above Poverty by Sex and Age in Sherrill
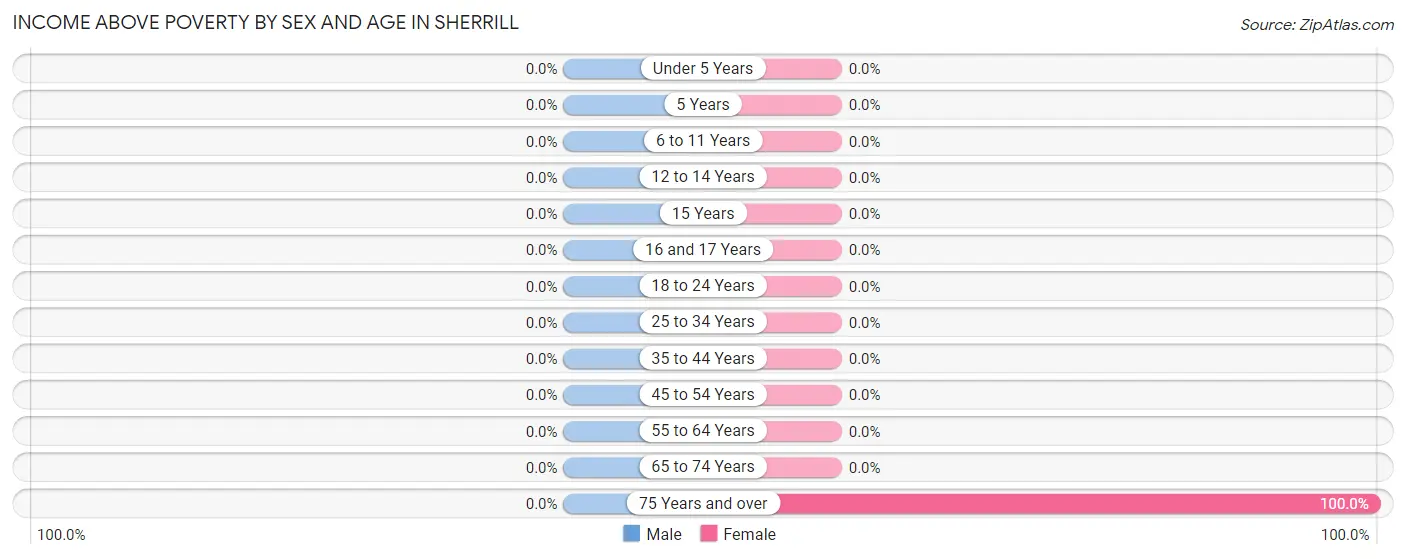
| Age Bracket | Male | Female |
| Under 5 Years | 0 (0.0%) | 0 (0.0%) |
| 5 Years | 0 (0.0%) | 0 (0.0%) |
| 6 to 11 Years | 0 (0.0%) | 0 (0.0%) |
| 12 to 14 Years | 0 (0.0%) | 0 (0.0%) |
| 15 Years | 0 (0.0%) | 0 (0.0%) |
| 16 and 17 Years | 0 (0.0%) | 0 (0.0%) |
| 18 to 24 Years | 0 (0.0%) | 0 (0.0%) |
| 25 to 34 Years | 0 (0.0%) | 0 (0.0%) |
| 35 to 44 Years | 0 (0.0%) | 0 (0.0%) |
| 45 to 54 Years | 0 (0.0%) | 0 (0.0%) |
| 55 to 64 Years | 0 (0.0%) | 0 (0.0%) |
| 65 to 74 Years | 0 (0.0%) | 0 (0.0%) |
| 75 Years and over | 0 (0.0%) | 19 (100.0%) |
| Total | 0 (0.0%) | 19 (18.4%) |
Income Below Poverty Among Married-Couple Families in Sherrill
The poverty statistics for married-couple families in Sherrill show that 100.0% or 42 of the total 42 families live below the poverty line. Families with 1 or 2 children have the highest poverty rate of 100.0%, comprising of 42 families. On the other hand, families with 1 or 2 children have the lowest poverty rate of 100.0%, which includes 42 families.
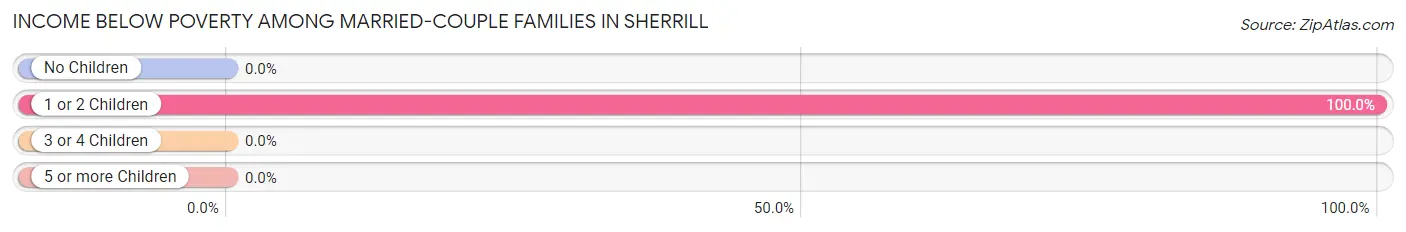
| Children | Above Poverty | Below Poverty |
| No Children | 0 (0.0%) | 0 (0.0%) |
| 1 or 2 Children | 0 (0.0%) | 42 (100.0%) |
| 3 or 4 Children | 0 (0.0%) | 0 (0.0%) |
| 5 or more Children | 0 (0.0%) | 0 (0.0%) |
| Total | 0 (0.0%) | 42 (100.0%) |
Income Below Poverty Among Single-Parent Households in Sherrill
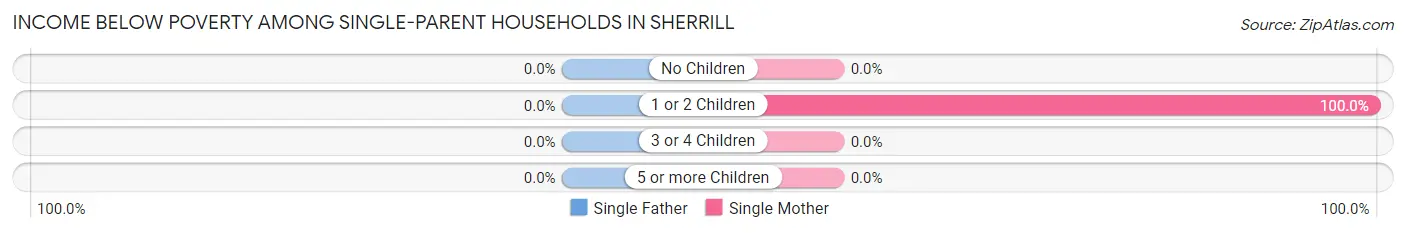
| Children | Single Father | Single Mother |
| No Children | 0 (0.0%) | 0 (0.0%) |
| 1 or 2 Children | 0 (0.0%) | 1 (100.0%) |
| 3 or 4 Children | 0 (0.0%) | 0 (0.0%) |
| 5 or more Children | 0 (0.0%) | 0 (0.0%) |
| Total | 0 (0.0%) | 1 (100.0%) |
Income Below Poverty Among Married-Couple vs Single-Parent Households in Sherrill
The poverty data for Sherrill shows that 42 of the married-couple family households (100.0%) and 1 of the single-parent households (100.0%) are living below the poverty level. Within the married-couple family households, those with 1 or 2 children have the highest poverty rate, with 42 households (100.0%) falling below the poverty line. Among the single-parent households, those with 1 or 2 children have the highest poverty rate, with 1 household (100.0%) living below poverty.
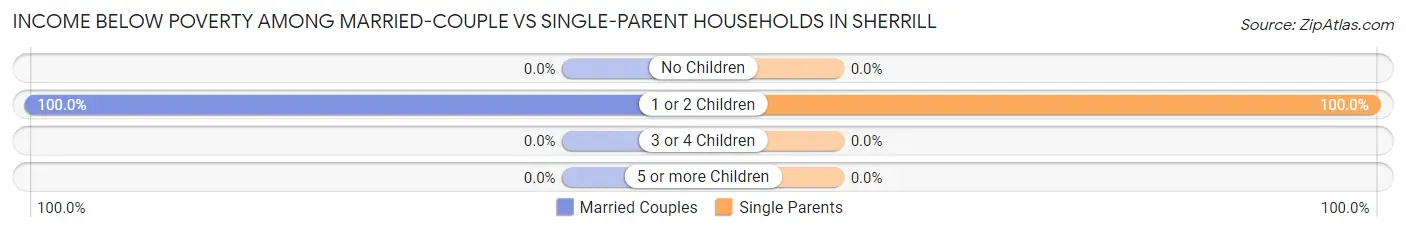
| Children | Married-Couple Families | Single-Parent Households |
| No Children | 0 (0.0%) | 0 (0.0%) |
| 1 or 2 Children | 42 (100.0%) | 1 (100.0%) |
| 3 or 4 Children | 0 (0.0%) | 0 (0.0%) |
| 5 or more Children | 0 (0.0%) | 0 (0.0%) |
| Total | 42 (100.0%) | 1 (100.0%) |
Race in Sherrill
The most populous races in Sherrill are Hispanic or Latino (167 | 86.1%), Some other Race (167 | 86.1%), and White / Caucasian (27 | 13.9%).
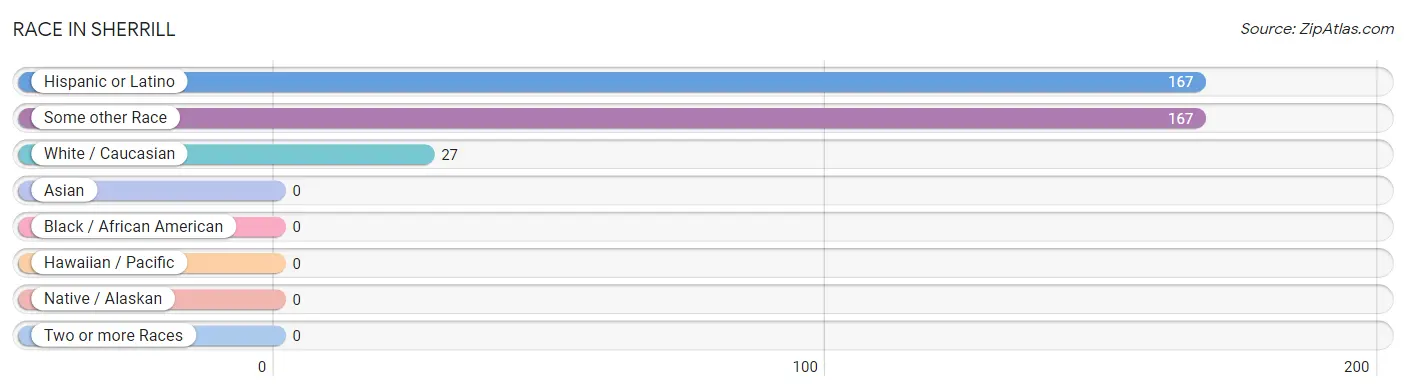
| Race | # Population | % Population |
| Asian | 0 | 0.0% |
| Black / African American | 0 | 0.0% |
| Hawaiian / Pacific | 0 | 0.0% |
| Hispanic or Latino | 167 | 86.1% |
| Native / Alaskan | 0 | 0.0% |
| White / Caucasian | 27 | 13.9% |
| Two or more Races | 0 | 0.0% |
| Some other Race | 167 | 86.1% |
| Total | 194 | 100.0% |
Ancestry in Sherrill
The most populous ancestries reported in Sherrill are Mexican (167 | 86.1%), French (6 | 3.1%), and Irish (6 | 3.1%), together accounting for 92.3% of all Sherrill residents.
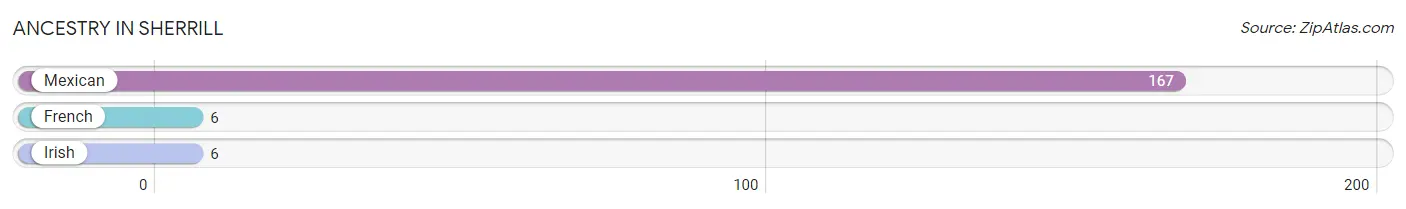
| Ancestry | # Population | % Population |
| French | 6 | 3.1% |
| Irish | 6 | 3.1% |
| Mexican | 167 | 86.1% | View All 3 Rows |
Immigrants in Sherrill
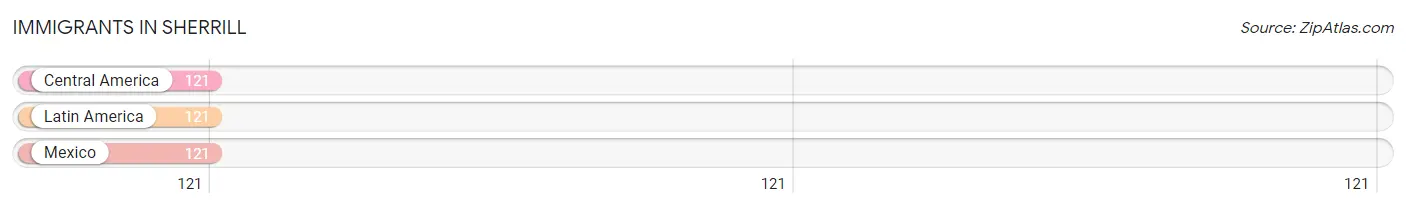
The most numerous immigrant groups reported in Sherrill came from Central America (121 | 62.4%), Latin America (121 | 62.4%), and Mexico (121 | 62.4%), together accounting for 187.1% of all Sherrill residents.
| Immigration Origin | # Population | % Population |
| Central America | 121 | 62.4% |
| Latin America | 121 | 62.4% |
| Mexico | 121 | 62.4% | View All 3 Rows |
Sex and Age in Sherrill
Sex and Age in Sherrill
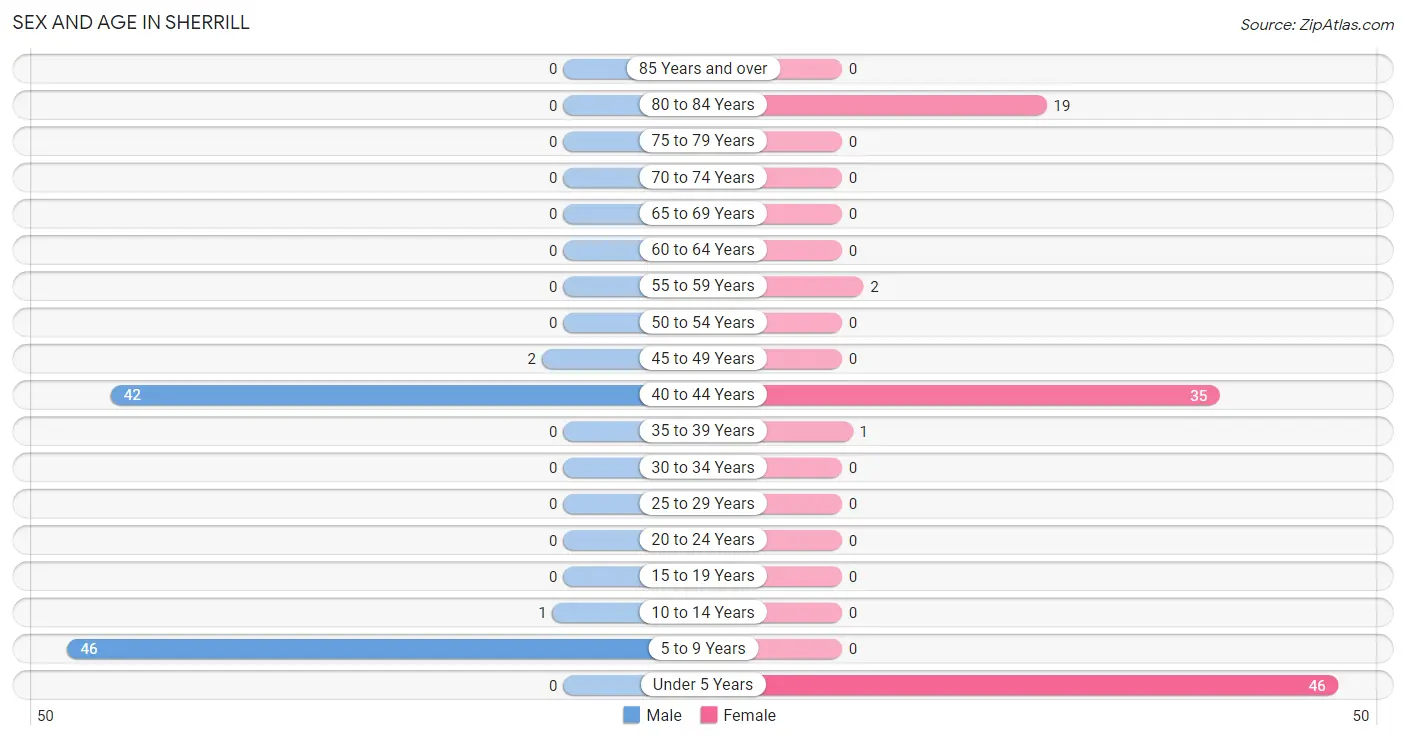
The most populous age groups in Sherrill are 5 to 9 Years (46 | 50.5%) for men and Under 5 Years (46 | 44.7%) for women.
| Age Bracket | Male | Female |
| Under 5 Years | 0 (0.0%) | 46 (44.7%) |
| 5 to 9 Years | 46 (50.5%) | 0 (0.0%) |
| 10 to 14 Years | 1 (1.1%) | 0 (0.0%) |
| 15 to 19 Years | 0 (0.0%) | 0 (0.0%) |
| 20 to 24 Years | 0 (0.0%) | 0 (0.0%) |
| 25 to 29 Years | 0 (0.0%) | 0 (0.0%) |
| 30 to 34 Years | 0 (0.0%) | 0 (0.0%) |
| 35 to 39 Years | 0 (0.0%) | 1 (1.0%) |
| 40 to 44 Years | 42 (46.2%) | 35 (34.0%) |
| 45 to 49 Years | 2 (2.2%) | 0 (0.0%) |
| 50 to 54 Years | 0 (0.0%) | 0 (0.0%) |
| 55 to 59 Years | 0 (0.0%) | 2 (1.9%) |
| 60 to 64 Years | 0 (0.0%) | 0 (0.0%) |
| 65 to 69 Years | 0 (0.0%) | 0 (0.0%) |
| 70 to 74 Years | 0 (0.0%) | 0 (0.0%) |
| 75 to 79 Years | 0 (0.0%) | 0 (0.0%) |
| 80 to 84 Years | 0 (0.0%) | 19 (18.4%) |
| 85 Years and over | 0 (0.0%) | 0 (0.0%) |
| Total | 91 (100.0%) | 103 (100.0%) |
Families and Households in Sherrill
Median Family Size in Sherrill
| Family Type | # Families | Family Size |
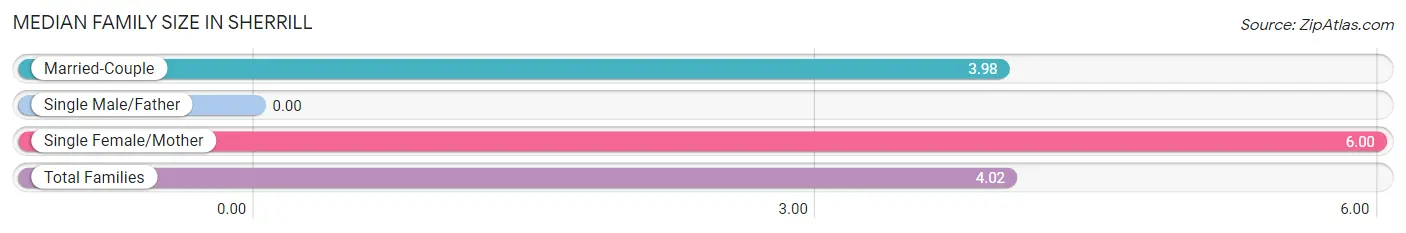
| Married-Couple | 42 (97.7%) | 3.98 |
| Single Male/Father | 0 (0.0%) | - |
| Single Female/Mother | 1 (2.3%) | 6.00 |
| Total Families | 43 (100.0%) | 4.02 |
Median Household Size in Sherrill
| Household Type | # Households | Household Size |
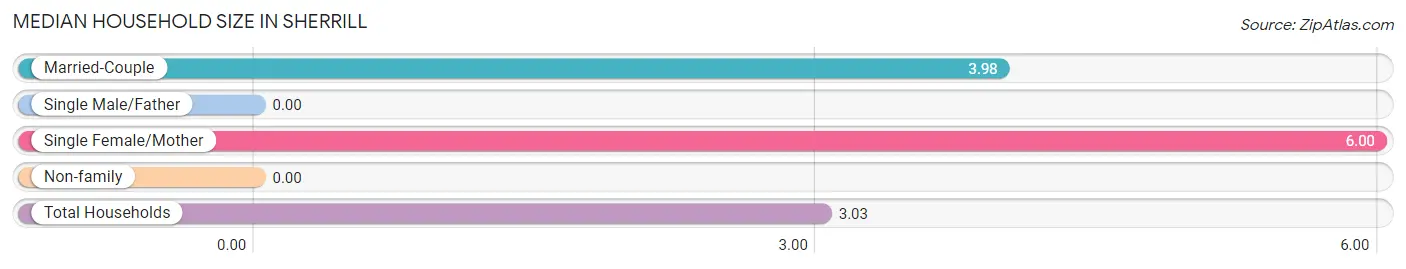
| Married-Couple | 42 (65.6%) | 3.98 |
| Single Male/Father | 0 (0.0%) | - |
| Single Female/Mother | 1 (1.6%) | 6.00 |
| Non-family | 21 (32.8%) | - |
| Total Households | 64 (100.0%) | 3.03 |
Household Size by Marriage Status in Sherrill
Out of a total of 64 households in Sherrill, 43 (67.2%) are family households, while 21 (32.8%) are nonfamily households. The most numerous type of family households are 4-person households, comprising 43, and the most common type of nonfamily households are 1-person households, comprising 21.
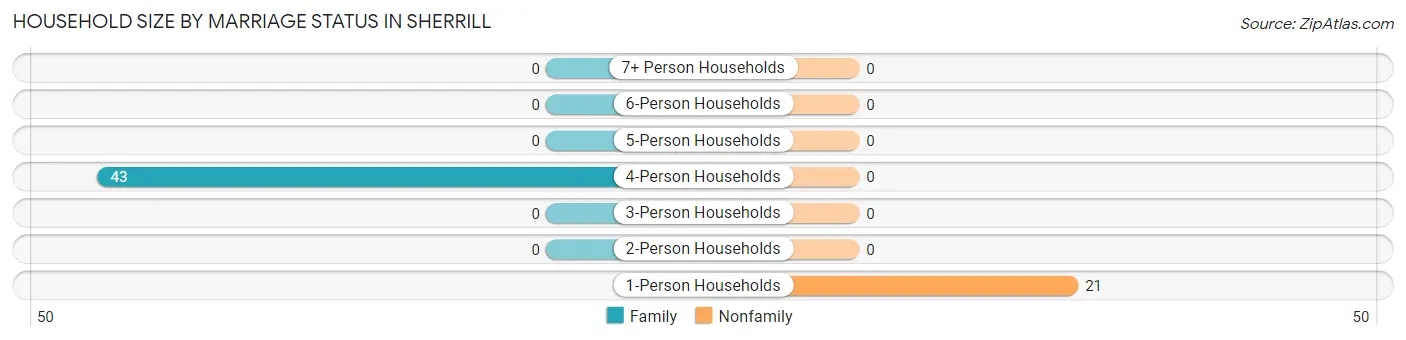
| Household Size | Family Households | Nonfamily Households |
| 1-Person Households | - | 21 (32.8%) |
| 2-Person Households | 0 (0.0%) | 0 (0.0%) |
| 3-Person Households | 0 (0.0%) | 0 (0.0%) |
| 4-Person Households | 43 (67.2%) | 0 (0.0%) |
| 5-Person Households | 0 (0.0%) | 0 (0.0%) |
| 6-Person Households | 0 (0.0%) | 0 (0.0%) |
| 7+ Person Households | 0 (0.0%) | 0 (0.0%) |
| Total | 43 (67.2%) | 21 (32.8%) |
Female Fertility in Sherrill
Fertility by Age in Sherrill
| Age Bracket | Women with Births | Births / 1,000 Women |
| 15 to 19 years | 0 (0.0%) | 0.0 |
| 20 to 34 years | 0 (0.0%) | 0.0 |
| 35 to 50 years | 0 (0.0%) | 0.0 |
| Total | 0 (0.0%) | 0.0 |
Fertility by Age by Marriage Status in Sherrill
| Age Bracket | Married | Unmarried |
| 15 to 19 years | 0 (0.0%) | 0 (0.0%) |
| 20 to 34 years | 0 (0.0%) | 0 (0.0%) |
| 35 to 50 years | 0 (0.0%) | 0 (0.0%) |
| Total | 0 (0.0%) | 0 (0.0%) |
Fertility by Education in Sherrill
| Educational Attainment | Women with Births | Births / 1,000 Women |
| Less than High School | 0 (0.0%) | 0.0 |
| High School Diploma | 0 (0.0%) | 0.0 |
| College or Associate's Degree | 0 (0.0%) | 0.0 |
| Bachelor's Degree | 0 (0.0%) | 0.0 |
| Graduate Degree | 0 (0.0%) | 0.0 |
| Total | 0 (0.0%) | 0.0 |
Fertility by Education by Marriage Status in Sherrill
| Educational Attainment | Married | Unmarried |
| Less than High School | 0 (0.0%) | 0 (0.0%) |
| High School Diploma | 0 (0.0%) | 0 (0.0%) |
| College or Associate's Degree | 0 (0.0%) | 0 (0.0%) |
| Bachelor's Degree | 0 (0.0%) | 0 (0.0%) |
| Graduate Degree | 0 (0.0%) | 0 (0.0%) |
| Total | 0 (0.0%) | 0 (0.0%) |
Employment Characteristics in Sherrill
Employment by Class of Employer in Sherrill
Among the 45 employed individuals in Sherrill, private company employees (44 | 97.8%), and state government employees (1 | 2.2%) make up the most common classes of employment.
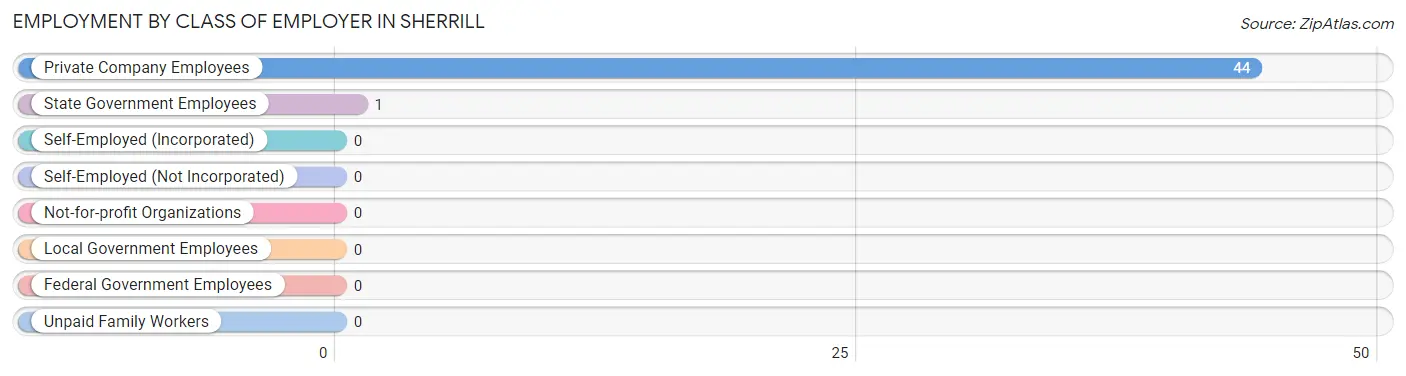
| Employer Class | # Employees | % Employees |
| Private Company Employees | 44 | 97.8% |
| Self-Employed (Incorporated) | 0 | 0.0% |
| Self-Employed (Not Incorporated) | 0 | 0.0% |
| Not-for-profit Organizations | 0 | 0.0% |
| Local Government Employees | 0 | 0.0% |
| State Government Employees | 1 | 2.2% |
| Federal Government Employees | 0 | 0.0% |
| Unpaid Family Workers | 0 | 0.0% |
| Total | 45 | 100.0% |
Employment Status by Age in Sherrill
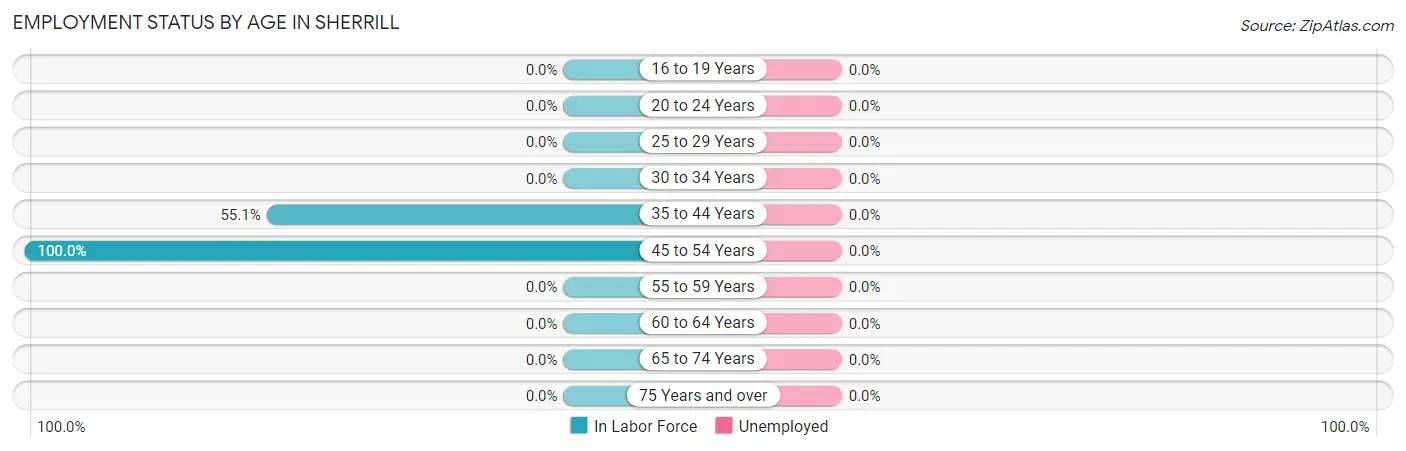
| Age Bracket | In Labor Force | Unemployed |
| 16 to 19 Years | 0 (0.0%) | 0 (0.0%) |
| 20 to 24 Years | 0 (0.0%) | 0 (0.0%) |
| 25 to 29 Years | 0 (0.0%) | 0 (0.0%) |
| 30 to 34 Years | 0 (0.0%) | 0 (0.0%) |
| 35 to 44 Years | 43 (55.1%) | 0 (0.0%) |
| 45 to 54 Years | 2 (100.0%) | 0 (0.0%) |
| 55 to 59 Years | 0 (0.0%) | 0 (0.0%) |
| 60 to 64 Years | 0 (0.0%) | 0 (0.0%) |
| 65 to 74 Years | 0 (0.0%) | 0 (0.0%) |
| 75 Years and over | 0 (0.0%) | 0 (0.0%) |
| Total | 45 (44.6%) | 0 (0.0%) |
Employment Status by Educational Attainment in Sherrill
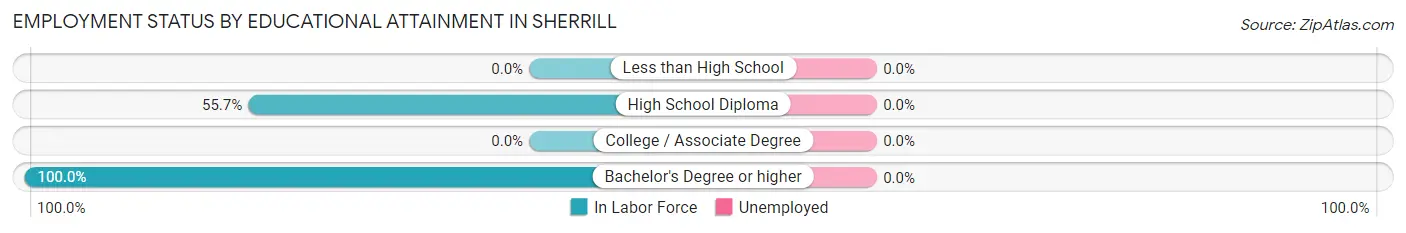
| Educational Attainment | In Labor Force | Unemployed |
| Less than High School | 0 (0.0%) | 0 (0.0%) |
| High School Diploma | 44 (55.7%) | 0 (0.0%) |
| College / Associate Degree | 0 (0.0%) | 0 (0.0%) |
| Bachelor's Degree or higher | 1 (100.0%) | 0 (0.0%) |
| Total | 45 (54.9%) | 0 (0.0%) |
Employment Occupations by Sex in Sherrill
Management, Business, Science and Arts Occupations
The most common Management, Business, Science and Arts occupations in Sherrill are Community & Social Service (1 | 2.2%), and Education Instruction & Library (1 | 2.2%).
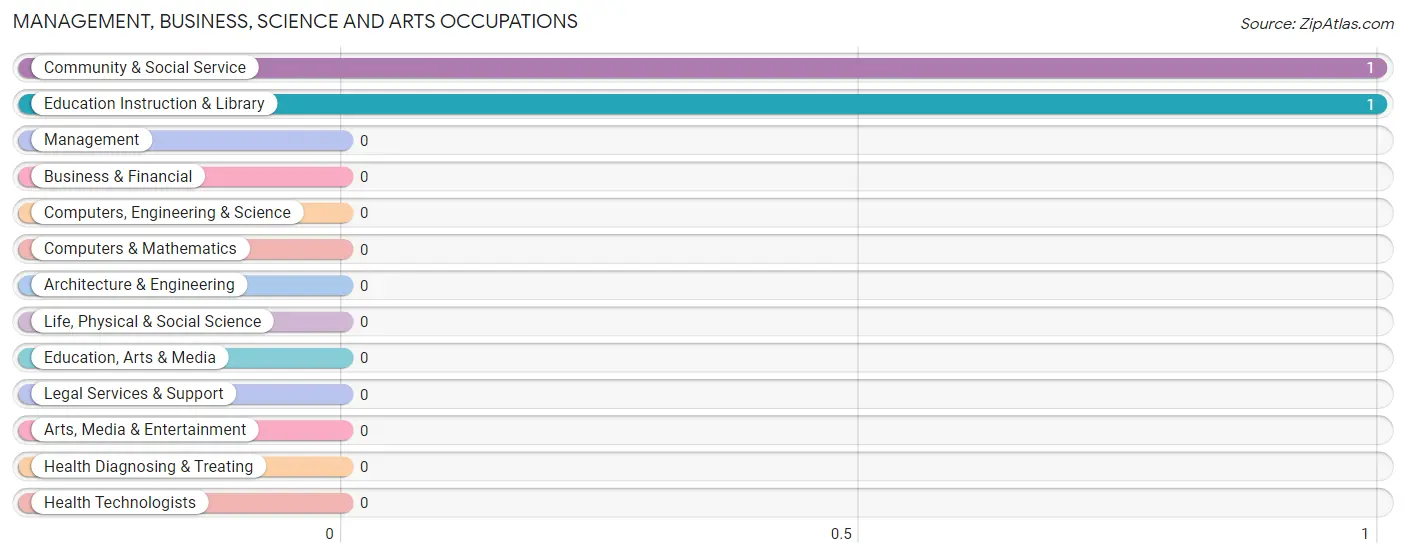
Management, Business, Science and Arts Occupations by Sex
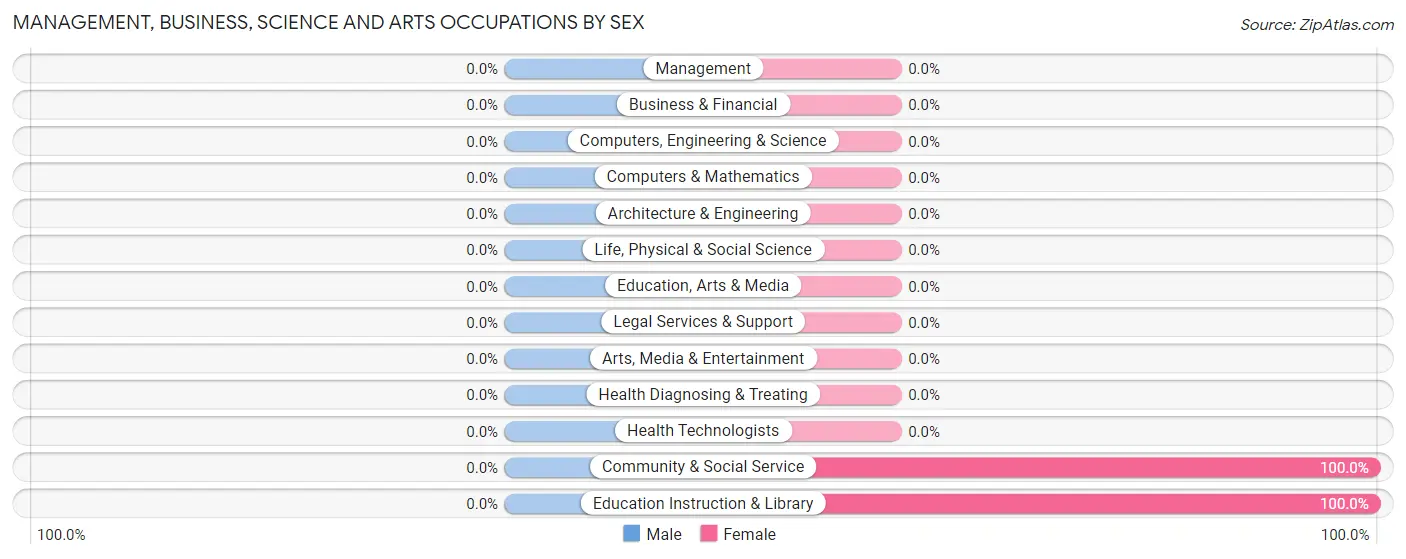
| Occupation | Male | Female |
| Management | 0 (0.0%) | 0 (0.0%) |
| Business & Financial | 0 (0.0%) | 0 (0.0%) |
| Computers, Engineering & Science | 0 (0.0%) | 0 (0.0%) |
| Computers & Mathematics | 0 (0.0%) | 0 (0.0%) |
| Architecture & Engineering | 0 (0.0%) | 0 (0.0%) |
| Life, Physical & Social Science | 0 (0.0%) | 0 (0.0%) |
| Community & Social Service | 0 (0.0%) | 1 (100.0%) |
| Education, Arts & Media | 0 (0.0%) | 0 (0.0%) |
| Legal Services & Support | 0 (0.0%) | 0 (0.0%) |
| Education Instruction & Library | 0 (0.0%) | 1 (100.0%) |
| Arts, Media & Entertainment | 0 (0.0%) | 0 (0.0%) |
| Health Diagnosing & Treating | 0 (0.0%) | 0 (0.0%) |
| Health Technologists | 0 (0.0%) | 0 (0.0%) |
| Total (Category) | 0 (0.0%) | 1 (100.0%) |
| Total (Overall) | 44 (97.8%) | 1 (2.2%) |
Services Occupations
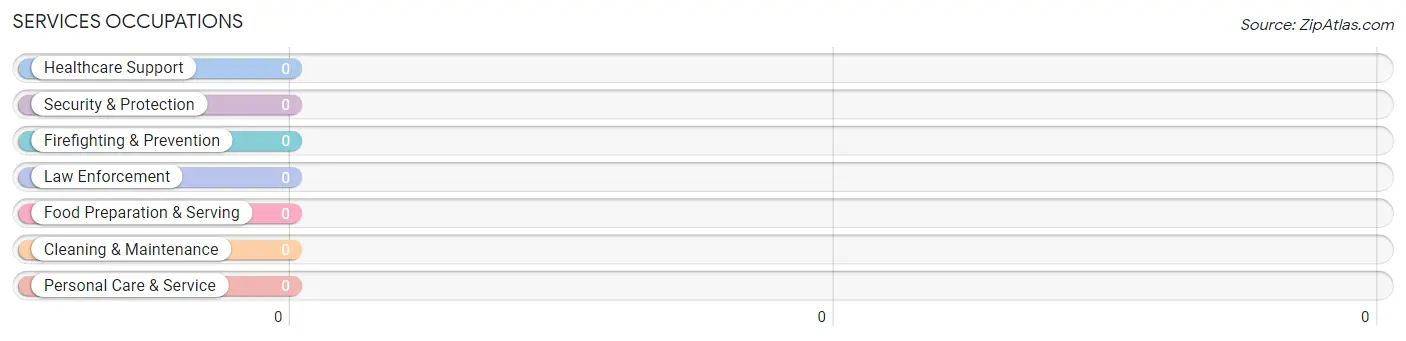
Services Occupations by Sex
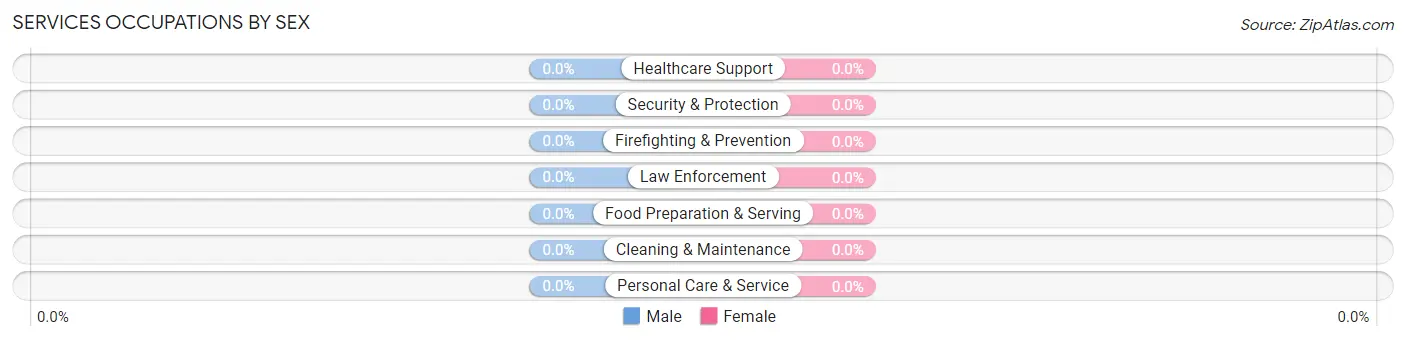
| Occupation | Male | Female |
| Healthcare Support | 0 (0.0%) | 0 (0.0%) |
| Security & Protection | 0 (0.0%) | 0 (0.0%) |
| Firefighting & Prevention | 0 (0.0%) | 0 (0.0%) |
| Law Enforcement | 0 (0.0%) | 0 (0.0%) |
| Food Preparation & Serving | 0 (0.0%) | 0 (0.0%) |
| Cleaning & Maintenance | 0 (0.0%) | 0 (0.0%) |
| Personal Care & Service | 0 (0.0%) | 0 (0.0%) |
| Total (Category) | 0 (0.0%) | 0 (0.0%) |
| Total (Overall) | 44 (97.8%) | 1 (2.2%) |
Sales and Office Occupations
Sales and Office Occupations by Sex
| Occupation | Male | Female |
| Sales & Related | 0 (0.0%) | 0 (0.0%) |
| Office & Administration | 0 (0.0%) | 0 (0.0%) |
| Total (Category) | 0 (0.0%) | 0 (0.0%) |
| Total (Overall) | 44 (97.8%) | 1 (2.2%) |
Natural Resources, Construction and Maintenance Occupations
The most common Natural Resources, Construction and Maintenance occupations in Sherrill are , and Farming, Fishing & Forestry (42 | 93.3%).
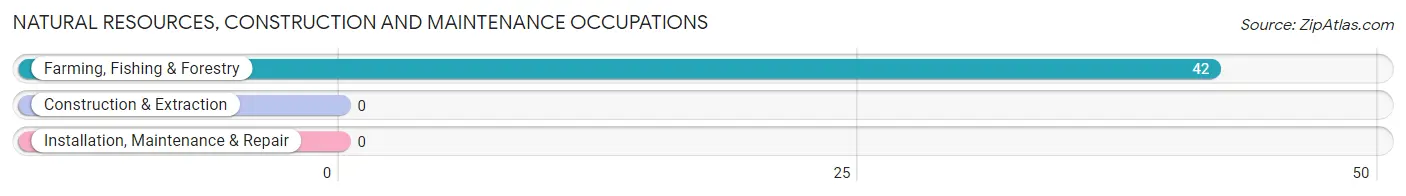
Natural Resources, Construction and Maintenance Occupations by Sex
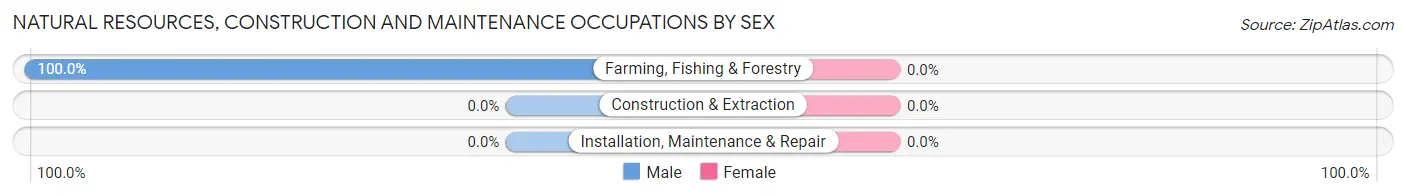
| Occupation | Male | Female |
| Farming, Fishing & Forestry | 42 (100.0%) | 0 (0.0%) |
| Construction & Extraction | 0 (0.0%) | 0 (0.0%) |
| Installation, Maintenance & Repair | 0 (0.0%) | 0 (0.0%) |
| Total (Category) | 42 (100.0%) | 0 (0.0%) |
| Total (Overall) | 44 (97.8%) | 1 (2.2%) |
Production, Transportation and Moving Occupations
The most common Production, Transportation and Moving occupations in Sherrill are , and Transportation (2 | 4.4%).
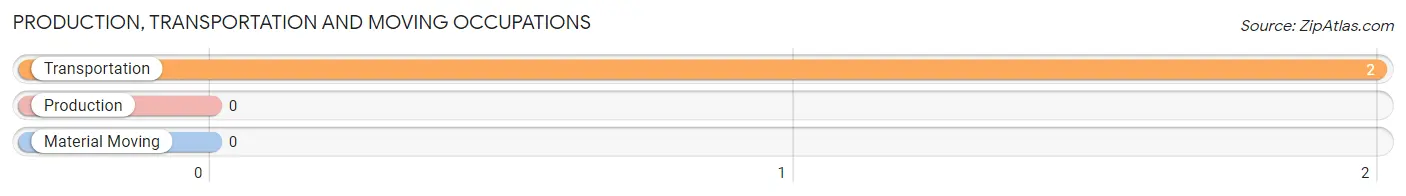
Production, Transportation and Moving Occupations by Sex
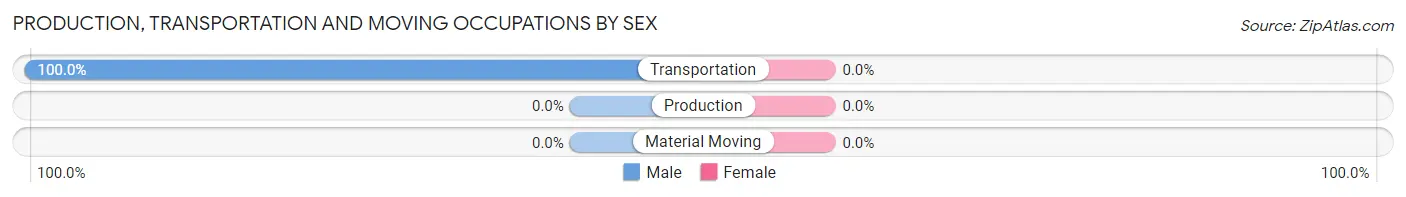
| Occupation | Male | Female |
| Production | 0 (0.0%) | 0 (0.0%) |
| Transportation | 2 (100.0%) | 0 (0.0%) |
| Material Moving | 0 (0.0%) | 0 (0.0%) |
| Total (Category) | 2 (100.0%) | 0 (0.0%) |
| Total (Overall) | 44 (97.8%) | 1 (2.2%) |
Employment Industries by Sex in Sherrill
Employment Industries in Sherrill
The major employment industries in Sherrill include Agriculture, Fishing & Hunting (44 | 97.8%), and Educational Services (1 | 2.2%).
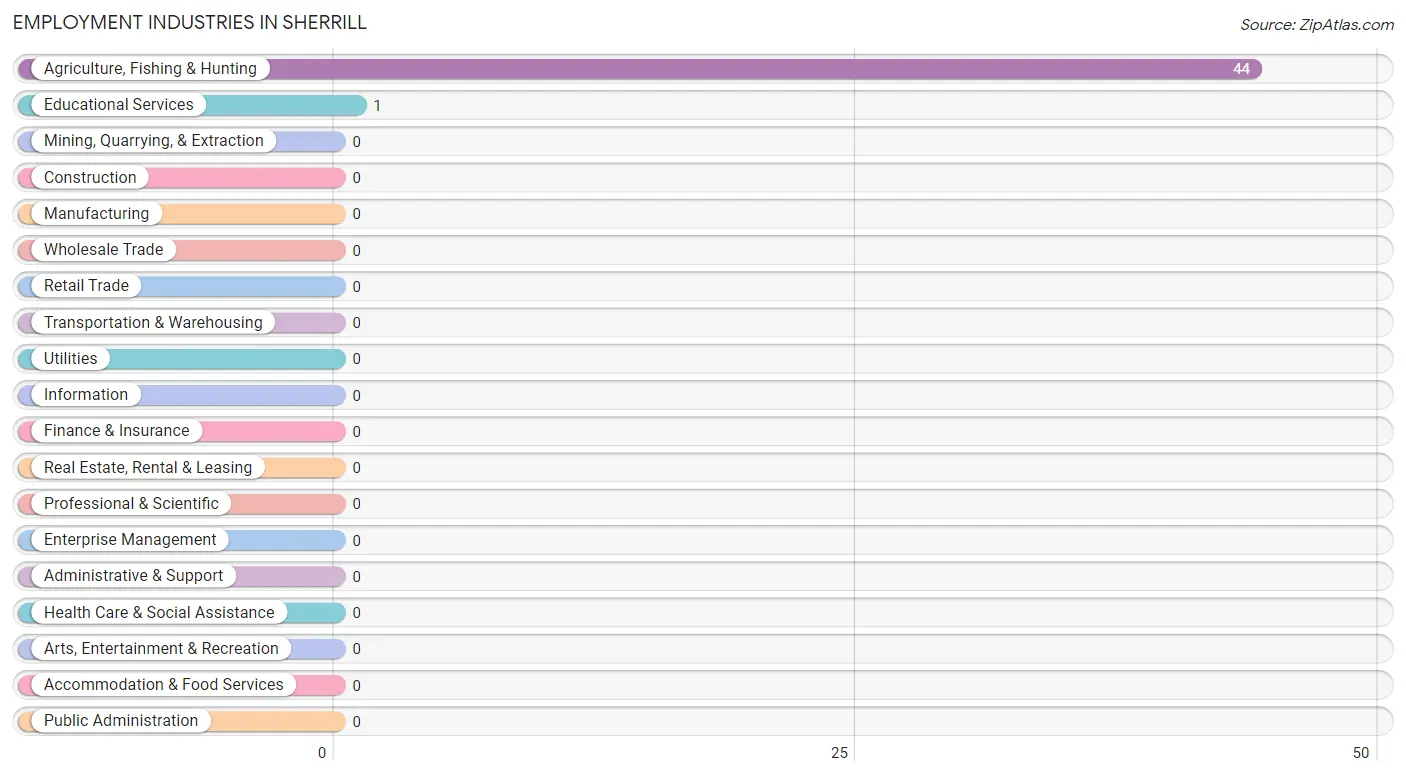
Employment Industries by Sex in Sherrill
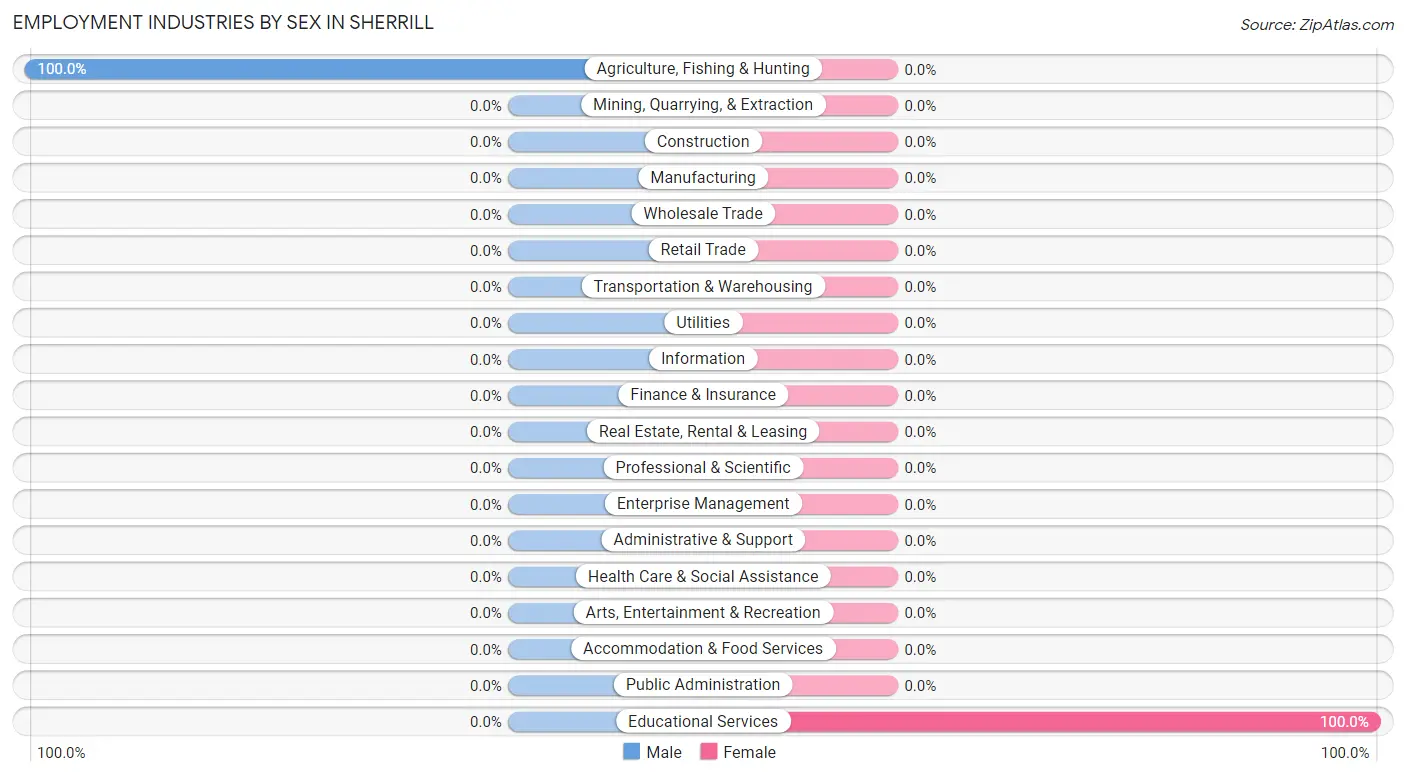
| Industry | Male | Female |
| Agriculture, Fishing & Hunting | 44 (100.0%) | 0 (0.0%) |
| Mining, Quarrying, & Extraction | 0 (0.0%) | 0 (0.0%) |
| Construction | 0 (0.0%) | 0 (0.0%) |
| Manufacturing | 0 (0.0%) | 0 (0.0%) |
| Wholesale Trade | 0 (0.0%) | 0 (0.0%) |
| Retail Trade | 0 (0.0%) | 0 (0.0%) |
| Transportation & Warehousing | 0 (0.0%) | 0 (0.0%) |
| Utilities | 0 (0.0%) | 0 (0.0%) |
| Information | 0 (0.0%) | 0 (0.0%) |
| Finance & Insurance | 0 (0.0%) | 0 (0.0%) |
| Real Estate, Rental & Leasing | 0 (0.0%) | 0 (0.0%) |
| Professional & Scientific | 0 (0.0%) | 0 (0.0%) |
| Enterprise Management | 0 (0.0%) | 0 (0.0%) |
| Administrative & Support | 0 (0.0%) | 0 (0.0%) |
| Educational Services | 0 (0.0%) | 1 (100.0%) |
| Health Care & Social Assistance | 0 (0.0%) | 0 (0.0%) |
| Arts, Entertainment & Recreation | 0 (0.0%) | 0 (0.0%) |
| Accommodation & Food Services | 0 (0.0%) | 0 (0.0%) |
| Public Administration | 0 (0.0%) | 0 (0.0%) |
| Total | 44 (97.8%) | 1 (2.2%) |
Education in Sherrill
School Enrollment in Sherrill
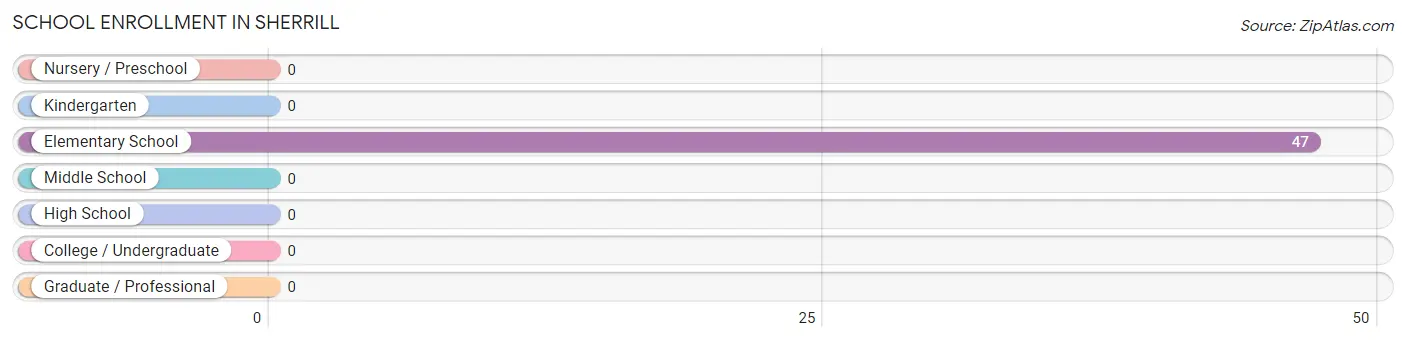
| School Level | # Students | % Students |
| Nursery / Preschool | 0 | 0.0% |
| Kindergarten | 0 | 0.0% |
| Elementary School | 47 | 100.0% |
| Middle School | 0 | 0.0% |
| High School | 0 | 0.0% |
| College / Undergraduate | 0 | 0.0% |
| Graduate / Professional | 0 | 0.0% |
| Total | 47 | 100.0% |
School Enrollment by Age by Funding Source in Sherrill
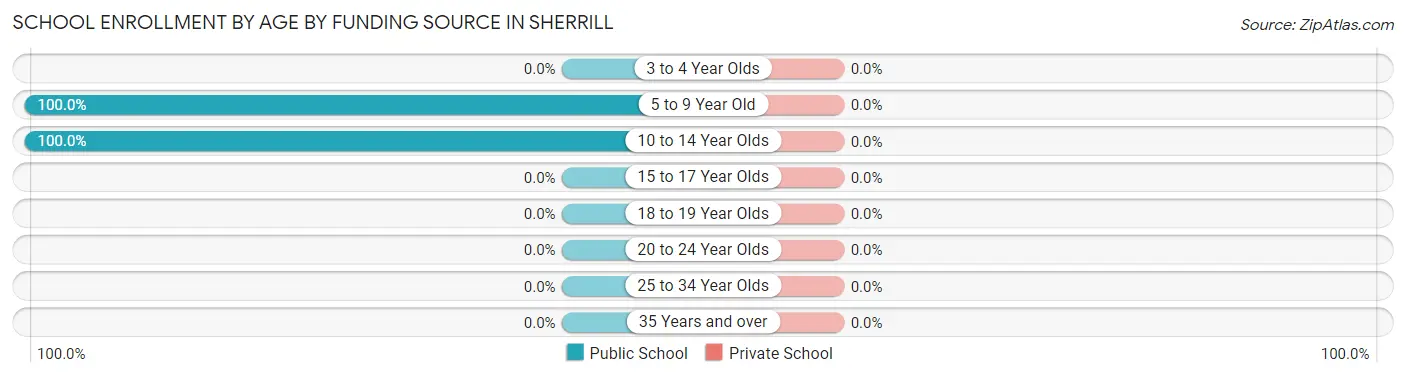
| Age Bracket | Public School | Private School |
| 3 to 4 Year Olds | 0 (0.0%) | 0 (0.0%) |
| 5 to 9 Year Old | 46 (100.0%) | 0 (0.0%) |
| 10 to 14 Year Olds | 1 (100.0%) | 0 (0.0%) |
| 15 to 17 Year Olds | 0 (0.0%) | 0 (0.0%) |
| 18 to 19 Year Olds | 0 (0.0%) | 0 (0.0%) |
| 20 to 24 Year Olds | 0 (0.0%) | 0 (0.0%) |
| 25 to 34 Year Olds | 0 (0.0%) | 0 (0.0%) |
| 35 Years and over | 0 (0.0%) | 0 (0.0%) |
| Total | 47 (100.0%) | 0 (0.0%) |
Educational Attainment by Field of Study in Sherrill
, and science & technology (1 | 100.0%) are the most common fields of study among 1 individuals in Sherrill who have obtained a bachelor's degree or higher.
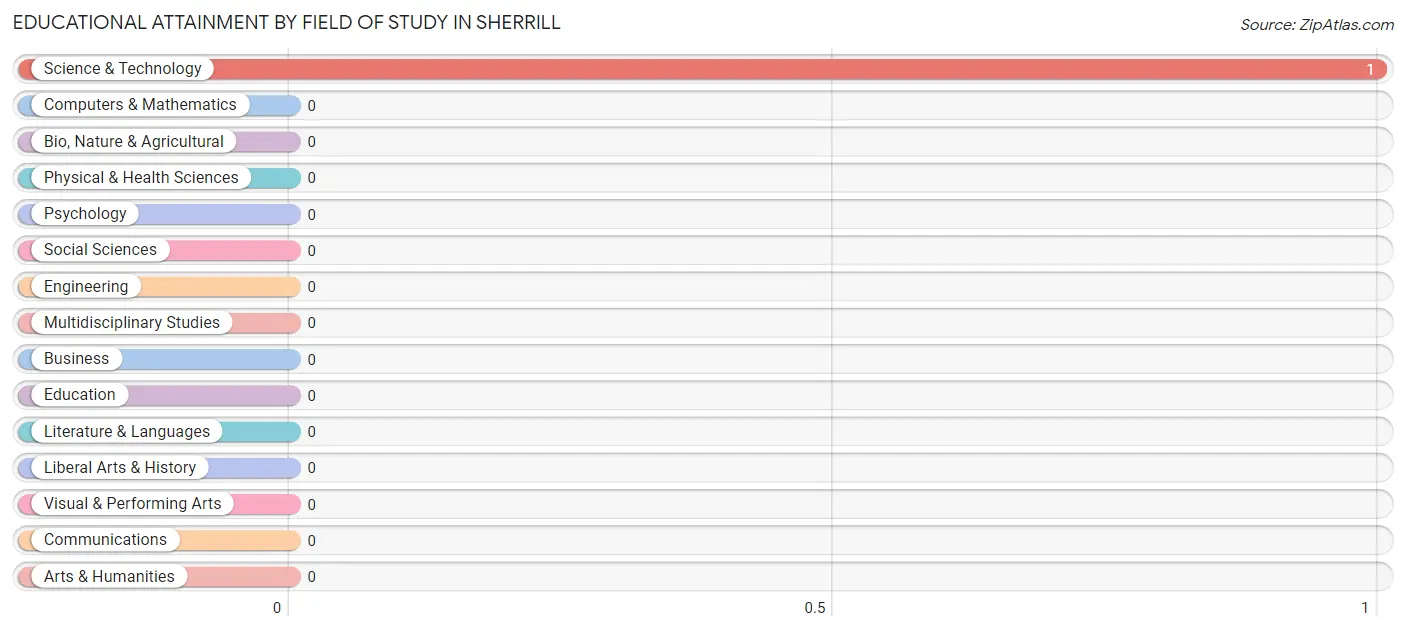
| Field of Study | # Graduates | % Graduates |
| Computers & Mathematics | 0 | 0.0% |
| Bio, Nature & Agricultural | 0 | 0.0% |
| Physical & Health Sciences | 0 | 0.0% |
| Psychology | 0 | 0.0% |
| Social Sciences | 0 | 0.0% |
| Engineering | 0 | 0.0% |
| Multidisciplinary Studies | 0 | 0.0% |
| Science & Technology | 1 | 100.0% |
| Business | 0 | 0.0% |
| Education | 0 | 0.0% |
| Literature & Languages | 0 | 0.0% |
| Liberal Arts & History | 0 | 0.0% |
| Visual & Performing Arts | 0 | 0.0% |
| Communications | 0 | 0.0% |
| Arts & Humanities | 0 | 0.0% |
| Total | 1 | 100.0% |
Transportation & Commute in Sherrill
Vehicle Availability by Sex in Sherrill
The most prevalent vehicle ownership categories in Sherrill are males with 1 vehicle (44, accounting for 100.0%) and females with 1 vehicle (0, making up 4,400.0%).
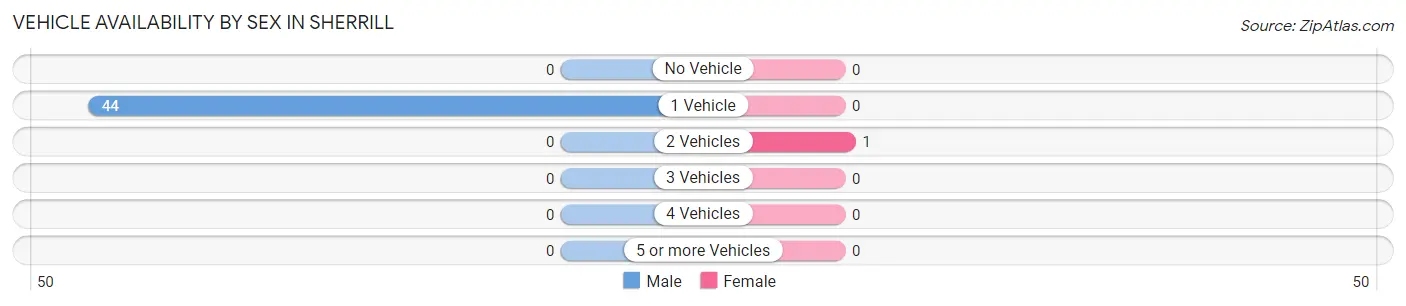
| Vehicles Available | Male | Female |
| No Vehicle | 0 (0.0%) | 0 (0.0%) |
| 1 Vehicle | 44 (100.0%) | 0 (0.0%) |
| 2 Vehicles | 0 (0.0%) | 1 (100.0%) |
| 3 Vehicles | 0 (0.0%) | 0 (0.0%) |
| 4 Vehicles | 0 (0.0%) | 0 (0.0%) |
| 5 or more Vehicles | 0 (0.0%) | 0 (0.0%) |
| Total | 44 (100.0%) | 1 (100.0%) |
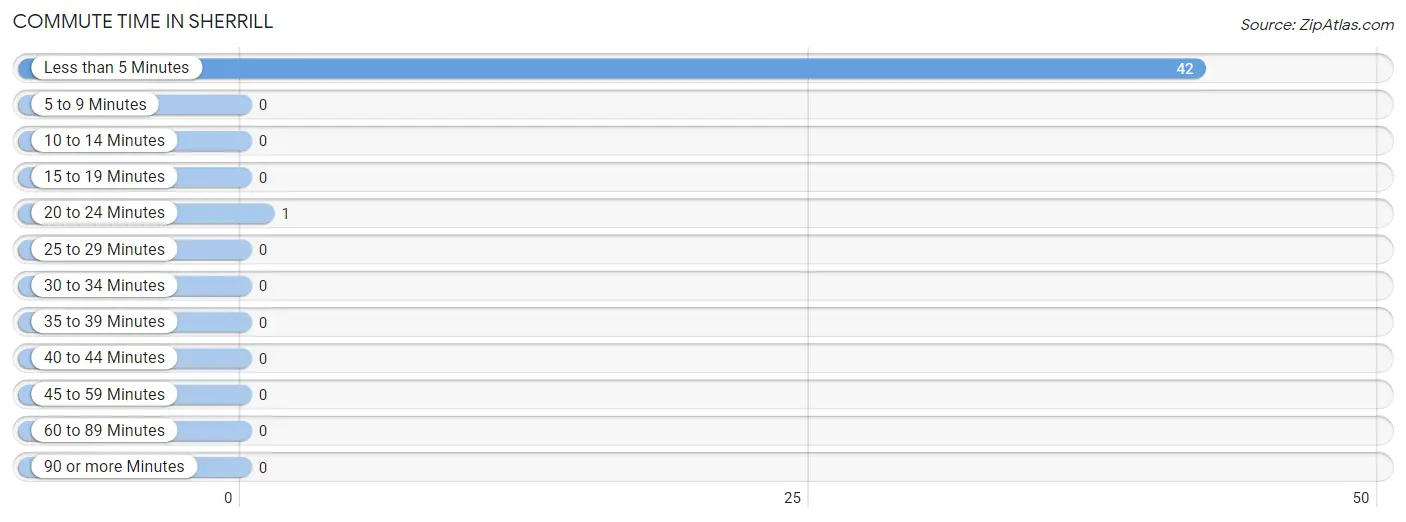
Commute Time in Sherrill
The most frequently occuring commute durations in Sherrill are less than 5 minutes (42 commuters, 97.7%), 20 to 24 minutes (1 commuters, 2.3%), and 5 to 9 minutes (0 commuters, 0.0%).
| Commute Time | # Commuters | % Commuters |
| Less than 5 Minutes | 42 | 97.7% |
| 5 to 9 Minutes | 0 | 0.0% |
| 10 to 14 Minutes | 0 | 0.0% |
| 15 to 19 Minutes | 0 | 0.0% |
| 20 to 24 Minutes | 1 | 2.3% |
| 25 to 29 Minutes | 0 | 0.0% |
| 30 to 34 Minutes | 0 | 0.0% |
| 35 to 39 Minutes | 0 | 0.0% |
| 40 to 44 Minutes | 0 | 0.0% |
| 45 to 59 Minutes | 0 | 0.0% |
| 60 to 89 Minutes | 0 | 0.0% |
| 90 or more Minutes | 0 | 0.0% |
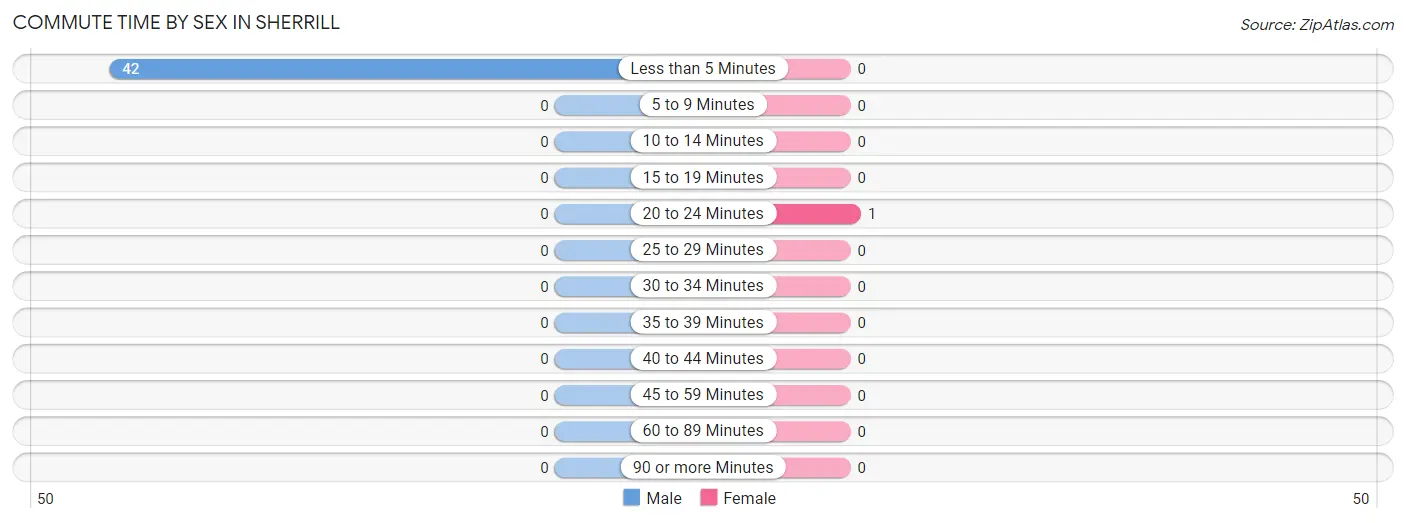
Commute Time by Sex in Sherrill
The most common commute times in Sherrill are less than 5 minutes (42 commuters, 100.0%) for males and 20 to 24 minutes (1 commuters, 100.0%) for females.
| Commute Time | Male | Female |
| Less than 5 Minutes | 42 (100.0%) | 0 (0.0%) |
| 5 to 9 Minutes | 0 (0.0%) | 0 (0.0%) |
| 10 to 14 Minutes | 0 (0.0%) | 0 (0.0%) |
| 15 to 19 Minutes | 0 (0.0%) | 0 (0.0%) |
| 20 to 24 Minutes | 0 (0.0%) | 1 (100.0%) |
| 25 to 29 Minutes | 0 (0.0%) | 0 (0.0%) |
| 30 to 34 Minutes | 0 (0.0%) | 0 (0.0%) |
| 35 to 39 Minutes | 0 (0.0%) | 0 (0.0%) |
| 40 to 44 Minutes | 0 (0.0%) | 0 (0.0%) |
| 45 to 59 Minutes | 0 (0.0%) | 0 (0.0%) |
| 60 to 89 Minutes | 0 (0.0%) | 0 (0.0%) |
| 90 or more Minutes | 0 (0.0%) | 0 (0.0%) |
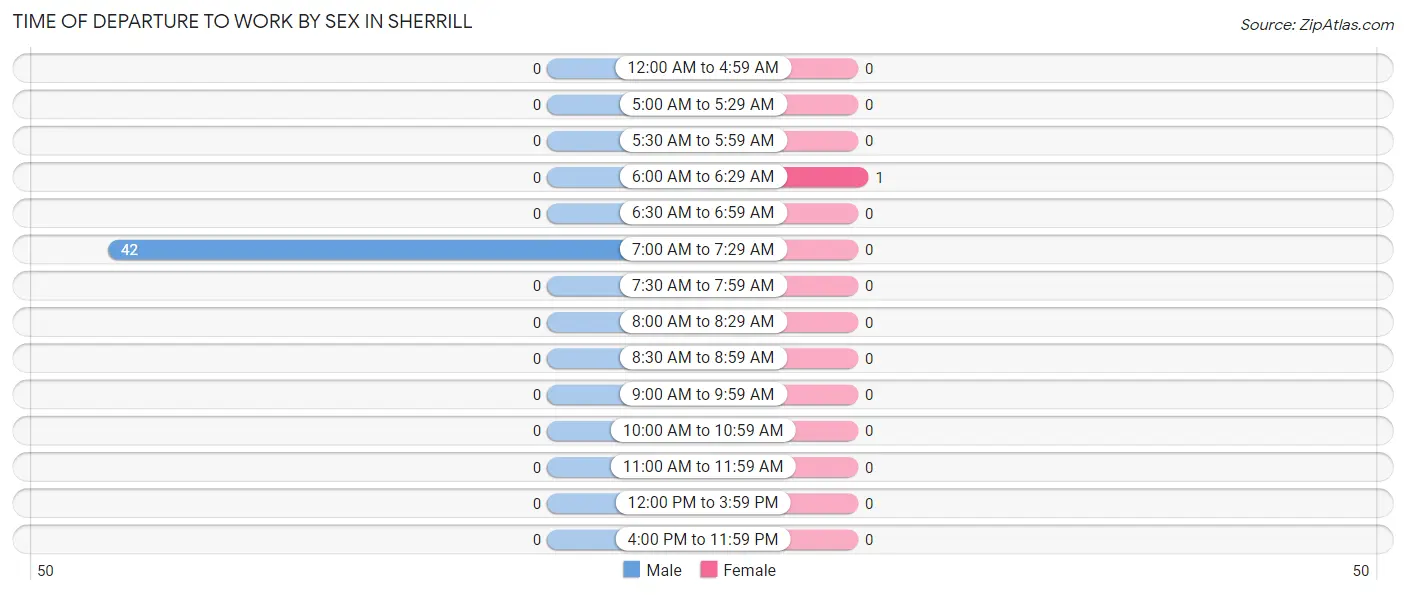
Time of Departure to Work by Sex in Sherrill
The most frequent times of departure to work in Sherrill are 7:00 AM to 7:29 AM (42, 100.0%) for males and 6:00 AM to 6:29 AM (1, 100.0%) for females.
| Time of Departure | Male | Female |
| 12:00 AM to 4:59 AM | 0 (0.0%) | 0 (0.0%) |
| 5:00 AM to 5:29 AM | 0 (0.0%) | 0 (0.0%) |
| 5:30 AM to 5:59 AM | 0 (0.0%) | 0 (0.0%) |
| 6:00 AM to 6:29 AM | 0 (0.0%) | 1 (100.0%) |
| 6:30 AM to 6:59 AM | 0 (0.0%) | 0 (0.0%) |
| 7:00 AM to 7:29 AM | 42 (100.0%) | 0 (0.0%) |
| 7:30 AM to 7:59 AM | 0 (0.0%) | 0 (0.0%) |
| 8:00 AM to 8:29 AM | 0 (0.0%) | 0 (0.0%) |
| 8:30 AM to 8:59 AM | 0 (0.0%) | 0 (0.0%) |
| 9:00 AM to 9:59 AM | 0 (0.0%) | 0 (0.0%) |
| 10:00 AM to 10:59 AM | 0 (0.0%) | 0 (0.0%) |
| 11:00 AM to 11:59 AM | 0 (0.0%) | 0 (0.0%) |
| 12:00 PM to 3:59 PM | 0 (0.0%) | 0 (0.0%) |
| 4:00 PM to 11:59 PM | 0 (0.0%) | 0 (0.0%) |
| Total | 42 (100.0%) | 1 (100.0%) |
Housing Occupancy in Sherrill
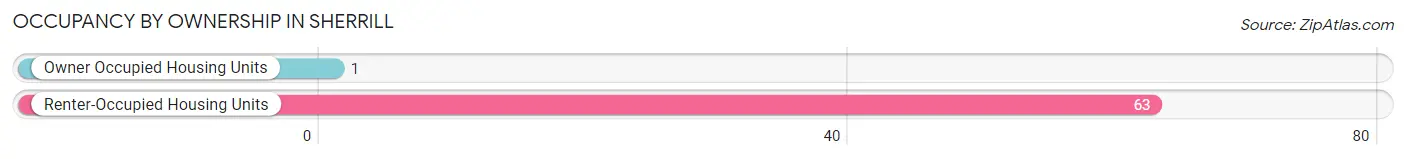
Occupancy by Ownership in Sherrill
Of the total 64 dwellings in Sherrill, owner-occupied units account for 1 (1.6%), while renter-occupied units make up 63 (98.4%).
| Occupancy | # Housing Units | % Housing Units |
| Owner Occupied Housing Units | 1 | 1.6% |
| Renter-Occupied Housing Units | 63 | 98.4% |
| Total Occupied Housing Units | 64 | 100.0% |
Occupancy by Household Size in Sherrill
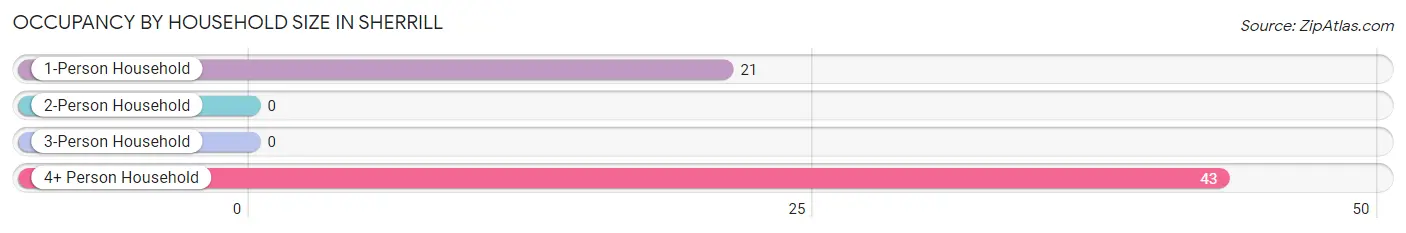
| Household Size | # Housing Units | % Housing Units |
| 1-Person Household | 21 | 32.8% |
| 2-Person Household | 0 | 0.0% |
| 3-Person Household | 0 | 0.0% |
| 4+ Person Household | 43 | 67.2% |
| Total Housing Units | 64 | 100.0% |
Occupancy by Ownership by Household Size in Sherrill
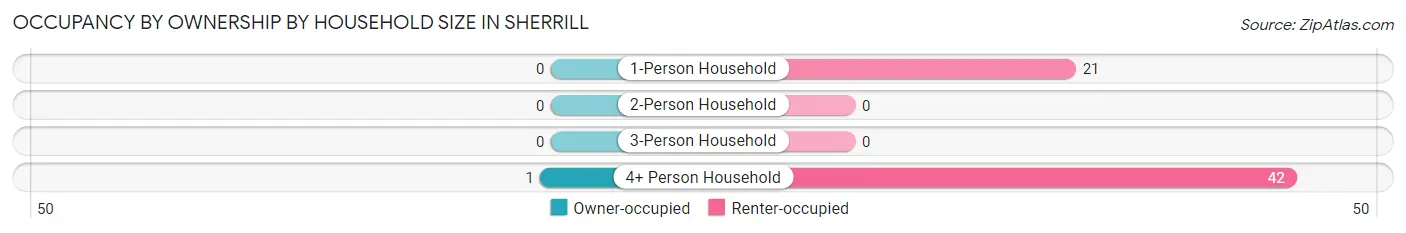
| Household Size | Owner-occupied | Renter-occupied |
| 1-Person Household | 0 (0.0%) | 21 (100.0%) |
| 2-Person Household | 0 (0.0%) | 0 (0.0%) |
| 3-Person Household | 0 (0.0%) | 0 (0.0%) |
| 4+ Person Household | 1 (2.3%) | 42 (97.7%) |
| Total Housing Units | 1 (1.6%) | 63 (98.4%) |
Occupancy by Educational Attainment in Sherrill
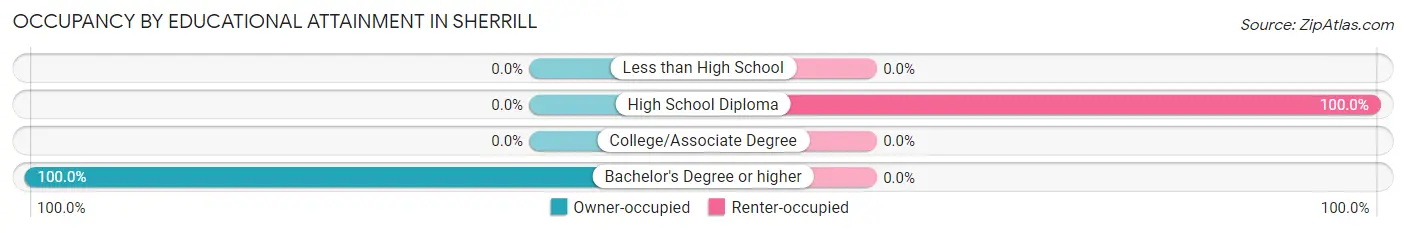
| Household Size | Owner-occupied | Renter-occupied |
| Less than High School | 0 (0.0%) | 0 (0.0%) |
| High School Diploma | 0 (0.0%) | 63 (100.0%) |
| College/Associate Degree | 0 (0.0%) | 0 (0.0%) |
| Bachelor's Degree or higher | 1 (100.0%) | 0 (0.0%) |
Occupancy by Age of Householder in Sherrill
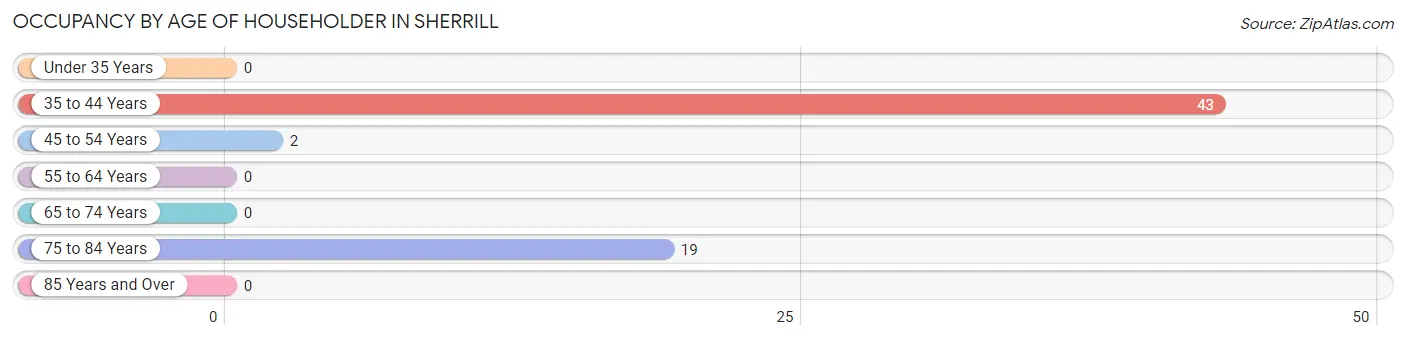
| Age Bracket | # Households | % Households |
| Under 35 Years | 0 | 0.0% |
| 35 to 44 Years | 43 | 67.2% |
| 45 to 54 Years | 2 | 3.1% |
| 55 to 64 Years | 0 | 0.0% |
| 65 to 74 Years | 0 | 0.0% |
| 75 to 84 Years | 19 | 29.7% |
| 85 Years and Over | 0 | 0.0% |
| Total | 64 | 100.0% |
Housing Finances in Sherrill
Median Income by Occupancy in Sherrill
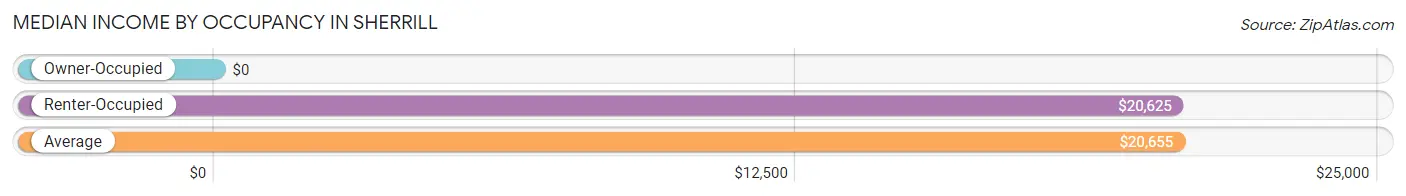
| Occupancy Type | # Households | Median Income |
| Owner-Occupied | 1 (1.6%) | $0 |
| Renter-Occupied | 63 (98.4%) | $20,625 |
| Average | 64 (100.0%) | $20,655 |
Occupancy by Householder Income Bracket in Sherrill
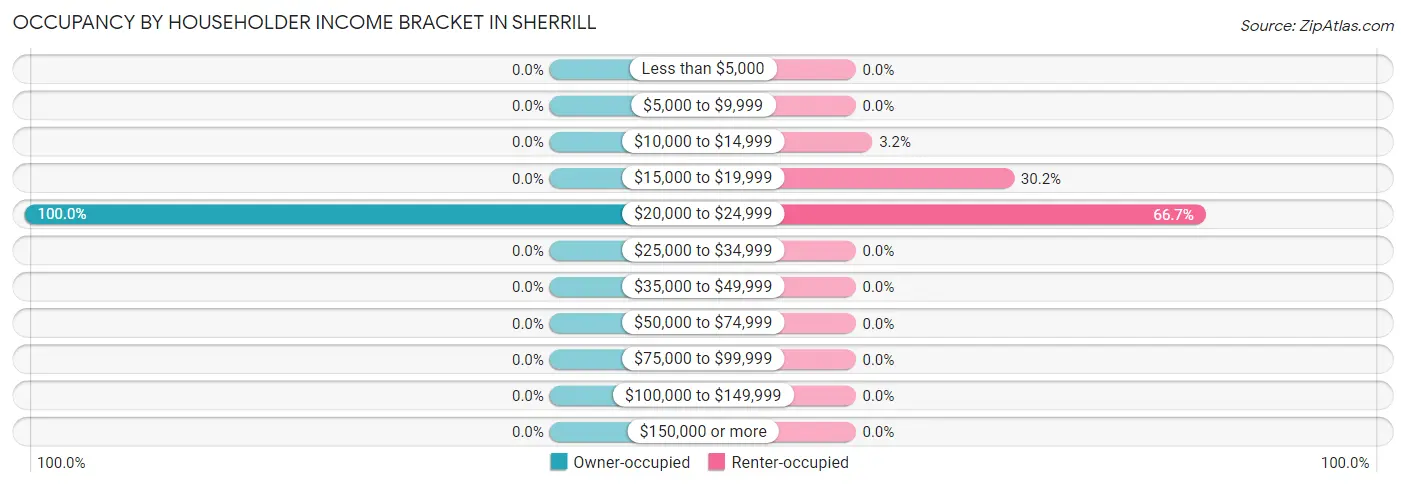
| Income Bracket | Owner-occupied | Renter-occupied |
| Less than $5,000 | 0 (0.0%) | 0 (0.0%) |
| $5,000 to $9,999 | 0 (0.0%) | 0 (0.0%) |
| $10,000 to $14,999 | 0 (0.0%) | 2 (3.2%) |
| $15,000 to $19,999 | 0 (0.0%) | 19 (30.2%) |
| $20,000 to $24,999 | 1 (100.0%) | 42 (66.7%) |
| $25,000 to $34,999 | 0 (0.0%) | 0 (0.0%) |
| $35,000 to $49,999 | 0 (0.0%) | 0 (0.0%) |
| $50,000 to $74,999 | 0 (0.0%) | 0 (0.0%) |
| $75,000 to $99,999 | 0 (0.0%) | 0 (0.0%) |
| $100,000 to $149,999 | 0 (0.0%) | 0 (0.0%) |
| $150,000 or more | 0 (0.0%) | 0 (0.0%) |
| Total | 1 (100.0%) | 63 (100.0%) |
Monthly Housing Cost Tiers in Sherrill
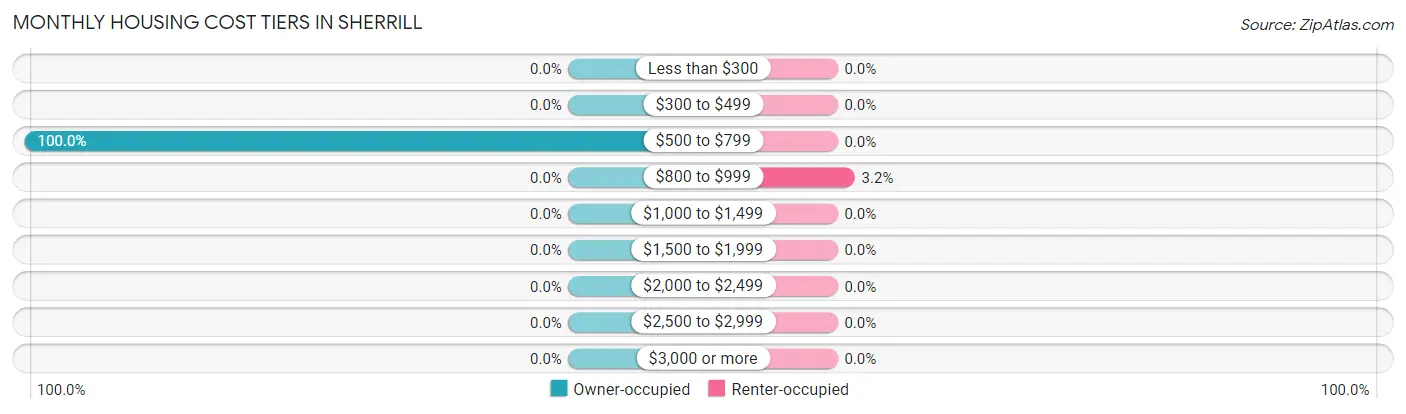
| Monthly Cost | Owner-occupied | Renter-occupied |
| Less than $300 | 0 (0.0%) | 0 (0.0%) |
| $300 to $499 | 0 (0.0%) | 0 (0.0%) |
| $500 to $799 | 1 (100.0%) | 0 (0.0%) |
| $800 to $999 | 0 (0.0%) | 2 (3.2%) |
| $1,000 to $1,499 | 0 (0.0%) | 0 (0.0%) |
| $1,500 to $1,999 | 0 (0.0%) | 0 (0.0%) |
| $2,000 to $2,499 | 0 (0.0%) | 0 (0.0%) |
| $2,500 to $2,999 | 0 (0.0%) | 0 (0.0%) |
| $3,000 or more | 0 (0.0%) | 0 (0.0%) |
| Total | 1 (100.0%) | 63 (100.0%) |
Physical Housing Characteristics in Sherrill
Housing Structures in Sherrill
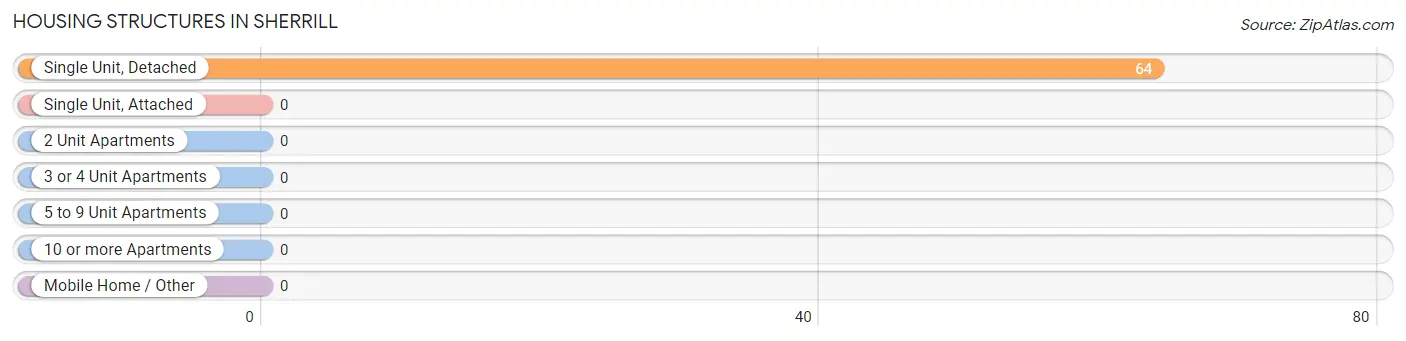
| Structure Type | # Housing Units | % Housing Units |
| Single Unit, Detached | 64 | 100.0% |
| Single Unit, Attached | 0 | 0.0% |
| 2 Unit Apartments | 0 | 0.0% |
| 3 or 4 Unit Apartments | 0 | 0.0% |
| 5 to 9 Unit Apartments | 0 | 0.0% |
| 10 or more Apartments | 0 | 0.0% |
| Mobile Home / Other | 0 | 0.0% |
| Total | 64 | 100.0% |
Housing Structures by Occupancy in Sherrill
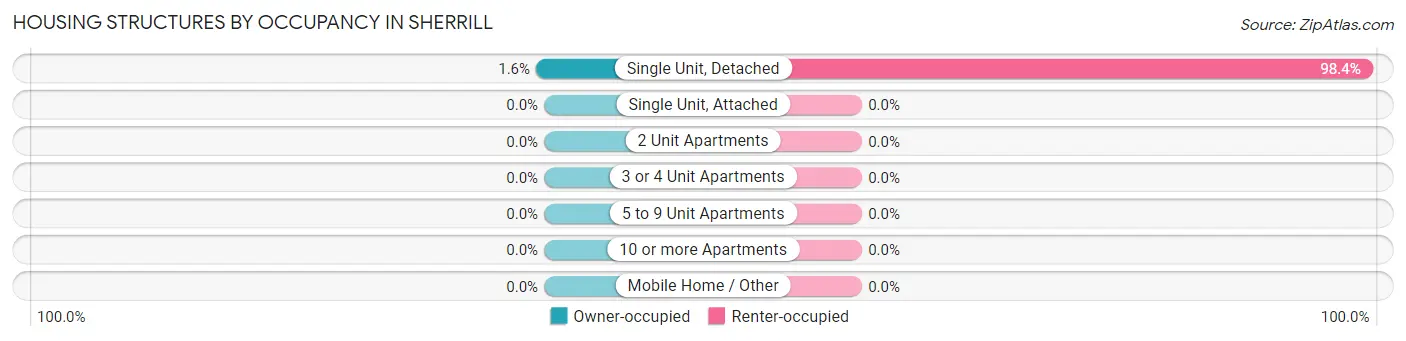
| Structure Type | Owner-occupied | Renter-occupied |
| Single Unit, Detached | 1 (1.6%) | 63 (98.4%) |
| Single Unit, Attached | 0 (0.0%) | 0 (0.0%) |
| 2 Unit Apartments | 0 (0.0%) | 0 (0.0%) |
| 3 or 4 Unit Apartments | 0 (0.0%) | 0 (0.0%) |
| 5 to 9 Unit Apartments | 0 (0.0%) | 0 (0.0%) |
| 10 or more Apartments | 0 (0.0%) | 0 (0.0%) |
| Mobile Home / Other | 0 (0.0%) | 0 (0.0%) |
| Total | 1 (1.6%) | 63 (98.4%) |
Housing Structures by Number of Rooms in Sherrill
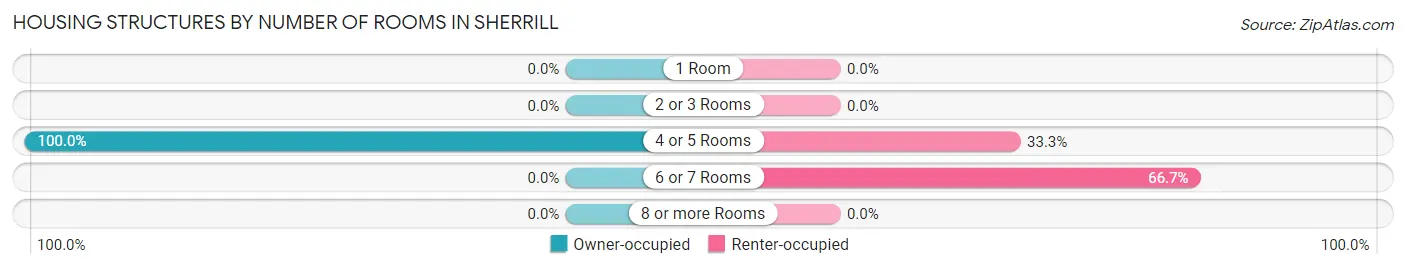
| Number of Rooms | Owner-occupied | Renter-occupied |
| 1 Room | 0 (0.0%) | 0 (0.0%) |
| 2 or 3 Rooms | 0 (0.0%) | 0 (0.0%) |
| 4 or 5 Rooms | 1 (100.0%) | 21 (33.3%) |
| 6 or 7 Rooms | 0 (0.0%) | 42 (66.7%) |
| 8 or more Rooms | 0 (0.0%) | 0 (0.0%) |
| Total | 1 (100.0%) | 63 (100.0%) |
Housing Structure by Heating Type in Sherrill
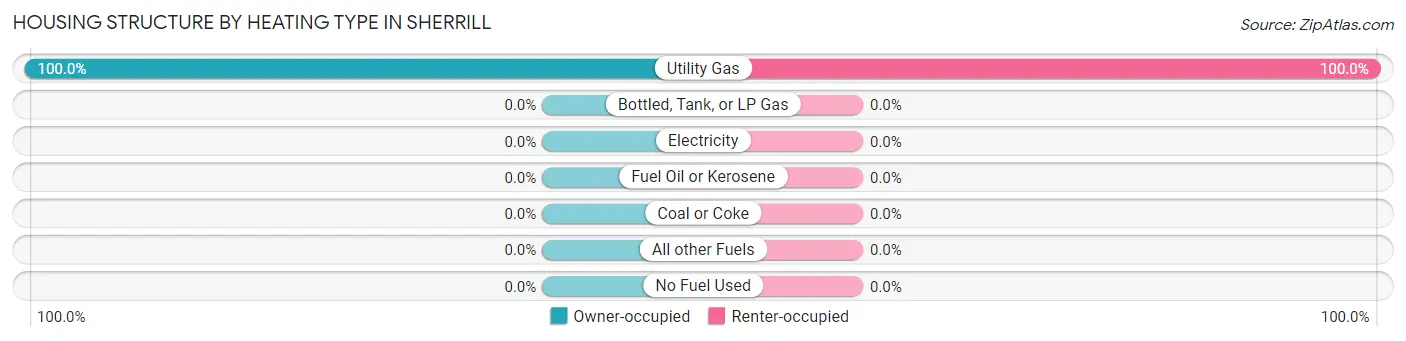
| Heating Type | Owner-occupied | Renter-occupied |
| Utility Gas | 1 (100.0%) | 63 (100.0%) |
| Bottled, Tank, or LP Gas | 0 (0.0%) | 0 (0.0%) |
| Electricity | 0 (0.0%) | 0 (0.0%) |
| Fuel Oil or Kerosene | 0 (0.0%) | 0 (0.0%) |
| Coal or Coke | 0 (0.0%) | 0 (0.0%) |
| All other Fuels | 0 (0.0%) | 0 (0.0%) |
| No Fuel Used | 0 (0.0%) | 0 (0.0%) |
| Total | 1 (100.0%) | 63 (100.0%) |
Household Vehicle Usage in Sherrill
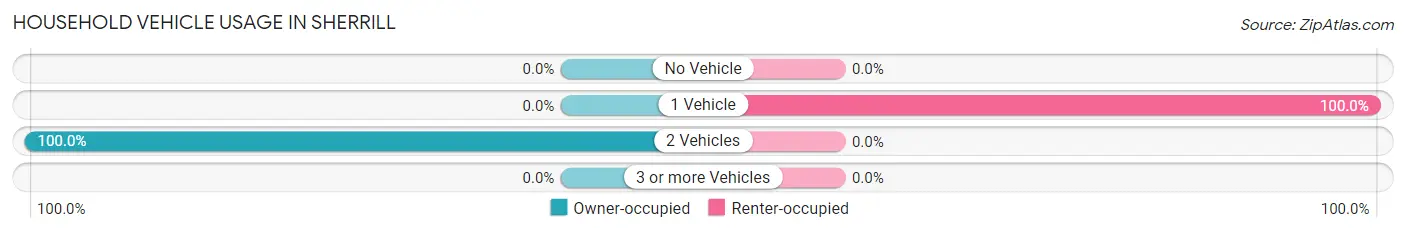
| Vehicles per Household | Owner-occupied | Renter-occupied |
| No Vehicle | 0 (0.0%) | 0 (0.0%) |
| 1 Vehicle | 0 (0.0%) | 63 (100.0%) |
| 2 Vehicles | 1 (100.0%) | 0 (0.0%) |
| 3 or more Vehicles | 0 (0.0%) | 0 (0.0%) |
| Total | 1 (100.0%) | 63 (100.0%) |
Real Estate & Mortgages in Sherrill
Real Estate and Mortgage Overview in Sherrill
| Characteristic | Without Mortgage | With Mortgage |
| Housing Units | 1 | 0 |
| Median Property Value | - | - |
| Median Household Income | - | - |
| Monthly Housing Costs | - | - |
| Real Estate Taxes | - | - |
Property Value by Mortgage Status in Sherrill
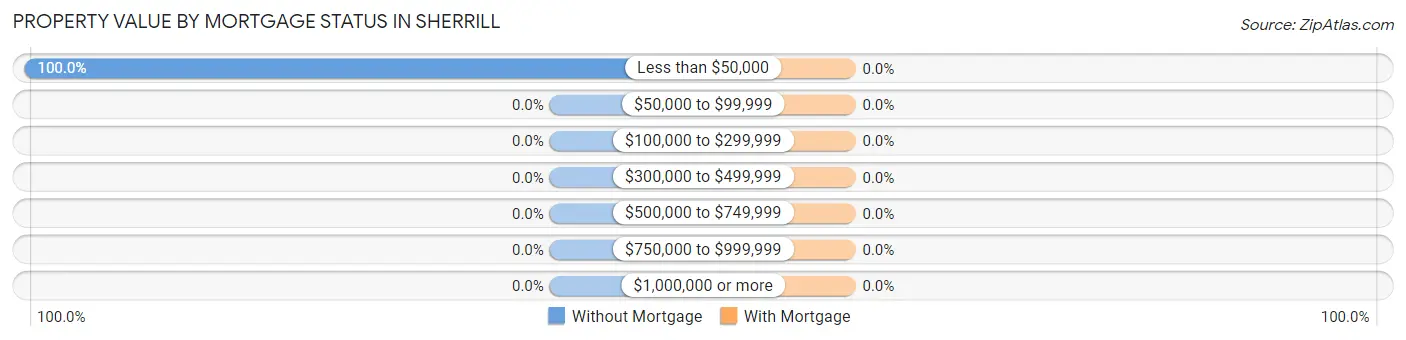
| Property Value | Without Mortgage | With Mortgage |
| Less than $50,000 | 1 (100.0%) | 0 (0.0%) |
| $50,000 to $99,999 | 0 (0.0%) | 0 (0.0%) |
| $100,000 to $299,999 | 0 (0.0%) | 0 (0.0%) |
| $300,000 to $499,999 | 0 (0.0%) | 0 (0.0%) |
| $500,000 to $749,999 | 0 (0.0%) | 0 (0.0%) |
| $750,000 to $999,999 | 0 (0.0%) | 0 (0.0%) |
| $1,000,000 or more | 0 (0.0%) | 0 (0.0%) |
| Total | 1 (100.0%) | 0 (0.0%) |
Household Income by Mortgage Status in Sherrill
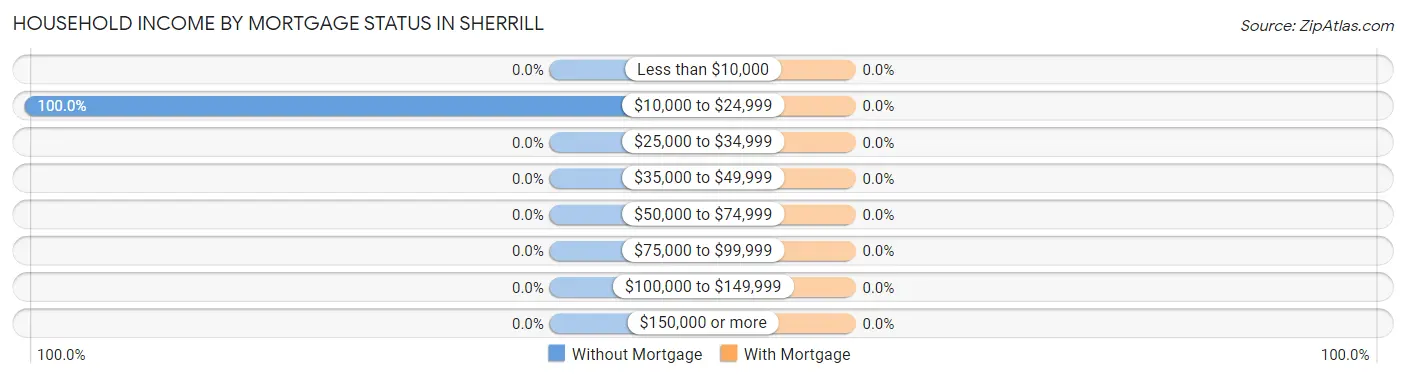
| Household Income | Without Mortgage | With Mortgage |
| Less than $10,000 | 0 (0.0%) | 0 (0.0%) |
| $10,000 to $24,999 | 1 (100.0%) | 0 (0.0%) |
| $25,000 to $34,999 | 0 (0.0%) | 0 (0.0%) |
| $35,000 to $49,999 | 0 (0.0%) | 0 (0.0%) |
| $50,000 to $74,999 | 0 (0.0%) | 0 (0.0%) |
| $75,000 to $99,999 | 0 (0.0%) | 0 (0.0%) |
| $100,000 to $149,999 | 0 (0.0%) | 0 (0.0%) |
| $150,000 or more | 0 (0.0%) | 0 (0.0%) |
| Total | 1 (100.0%) | 0 (0.0%) |
Property Value to Household Income Ratio in Sherrill
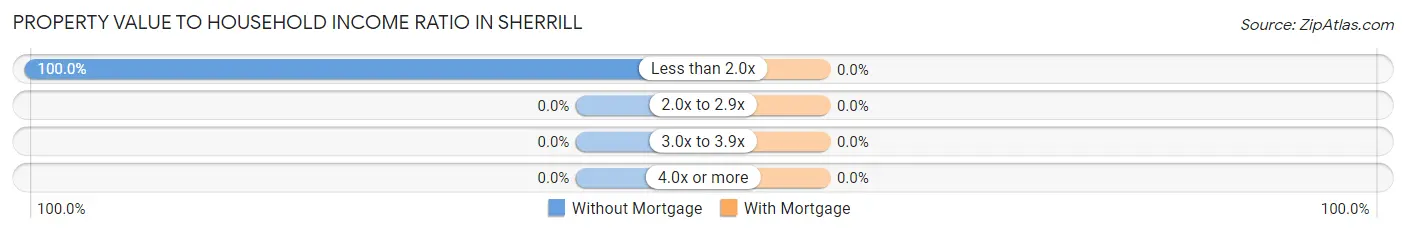
| Value-to-Income Ratio | Without Mortgage | With Mortgage |
| Less than 2.0x | 1 (100.0%) | 0 (0.0%) |
| 2.0x to 2.9x | 0 (0.0%) | 0 (0.0%) |
| 3.0x to 3.9x | 0 (0.0%) | 0 (0.0%) |
| 4.0x or more | 0 (0.0%) | 0 (0.0%) |
| Total | 1 (100.0%) | 0 (0.0%) |
Real Estate Taxes by Mortgage Status in Sherrill
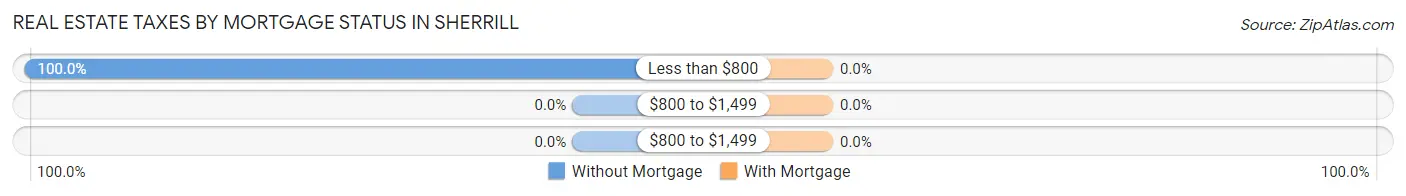
| Property Taxes | Without Mortgage | With Mortgage |
| Less than $800 | 1 (100.0%) | 0 (0.0%) |
| $800 to $1,499 | 0 (0.0%) | 0 (0.0%) |
| $800 to $1,499 | 0 (0.0%) | 0 (0.0%) |
| Total | 1 (100.0%) | 0 (0.0%) |
Health & Disability in Sherrill
Health Insurance Coverage by Age in Sherrill
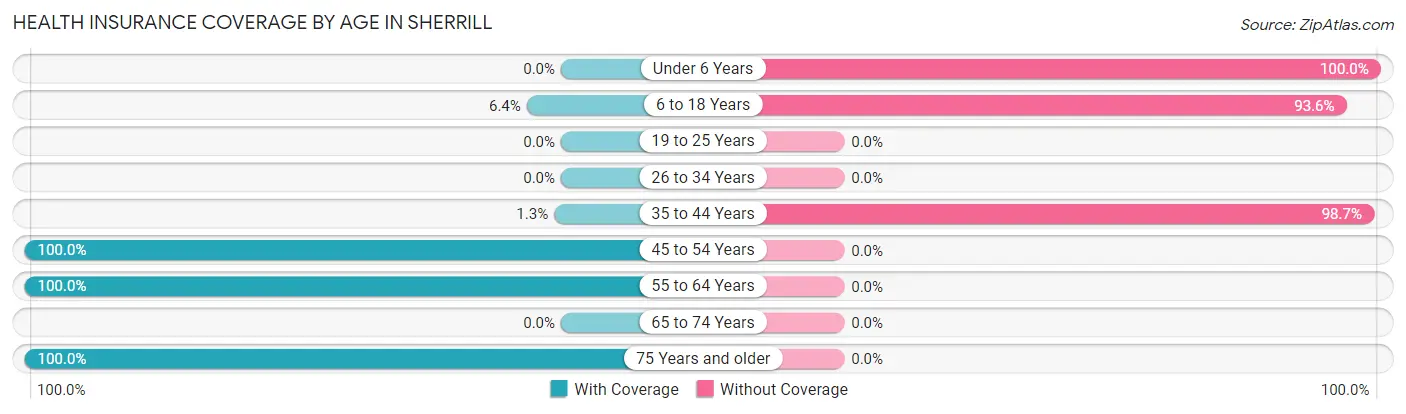
| Age Bracket | With Coverage | Without Coverage |
| Under 6 Years | 0 (0.0%) | 46 (100.0%) |
| 6 to 18 Years | 3 (6.4%) | 44 (93.6%) |
| 19 to 25 Years | 0 (0.0%) | 0 (0.0%) |
| 26 to 34 Years | 0 (0.0%) | 0 (0.0%) |
| 35 to 44 Years | 1 (1.3%) | 77 (98.7%) |
| 45 to 54 Years | 2 (100.0%) | 0 (0.0%) |
| 55 to 64 Years | 2 (100.0%) | 0 (0.0%) |
| 65 to 74 Years | 0 (0.0%) | 0 (0.0%) |
| 75 Years and older | 19 (100.0%) | 0 (0.0%) |
| Total | 27 (13.9%) | 167 (86.1%) |
Health Insurance Coverage by Citizenship Status in Sherrill
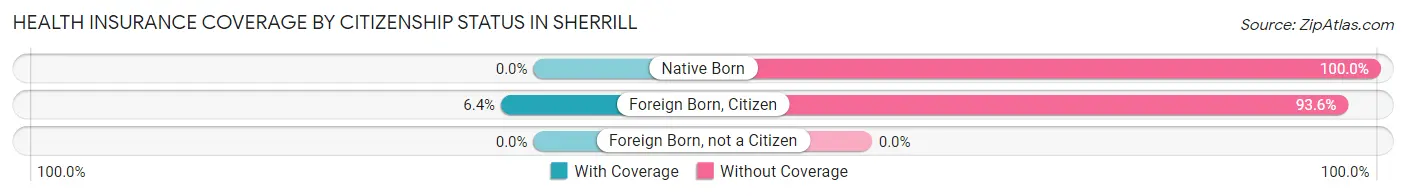
| Citizenship Status | With Coverage | Without Coverage |
| Native Born | 0 (0.0%) | 46 (100.0%) |
| Foreign Born, Citizen | 3 (6.4%) | 44 (93.6%) |
| Foreign Born, not a Citizen | 0 (0.0%) | 0 (0.0%) |
Health Insurance Coverage by Household Income in Sherrill
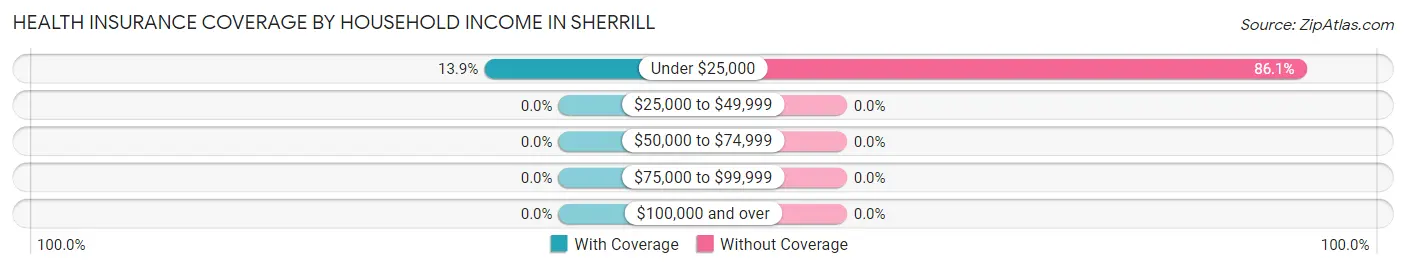
| Household Income | With Coverage | Without Coverage |
| Under $25,000 | 27 (13.9%) | 167 (86.1%) |
| $25,000 to $49,999 | 0 (0.0%) | 0 (0.0%) |
| $50,000 to $74,999 | 0 (0.0%) | 0 (0.0%) |
| $75,000 to $99,999 | 0 (0.0%) | 0 (0.0%) |
| $100,000 and over | 0 (0.0%) | 0 (0.0%) |
Public vs Private Health Insurance Coverage by Age in Sherrill
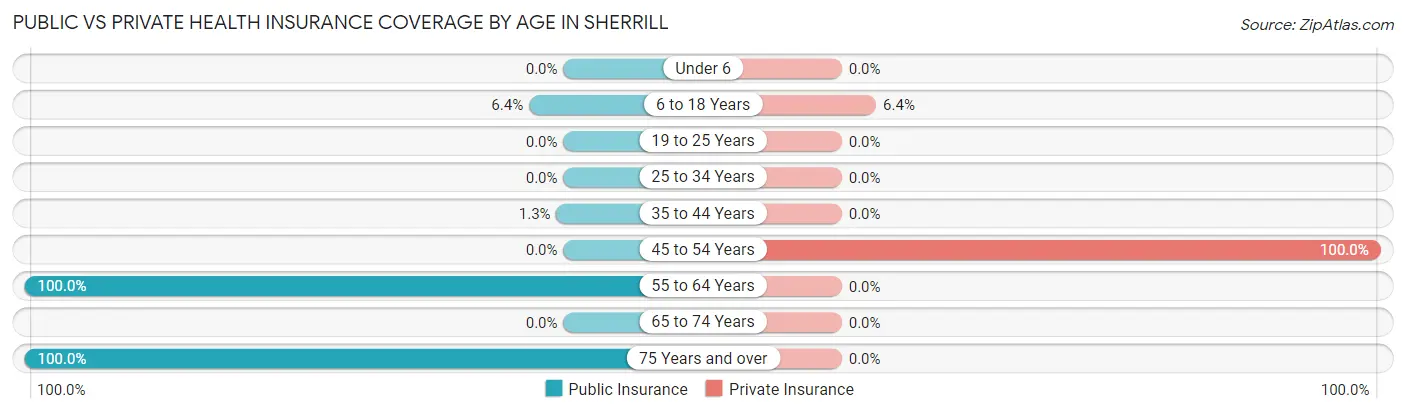
| Age Bracket | Public Insurance | Private Insurance |
| Under 6 | 0 (0.0%) | 0 (0.0%) |
| 6 to 18 Years | 3 (6.4%) | 3 (6.4%) |
| 19 to 25 Years | 0 (0.0%) | 0 (0.0%) |
| 25 to 34 Years | 0 (0.0%) | 0 (0.0%) |
| 35 to 44 Years | 1 (1.3%) | 0 (0.0%) |
| 45 to 54 Years | 0 (0.0%) | 2 (100.0%) |
| 55 to 64 Years | 2 (100.0%) | 0 (0.0%) |
| 65 to 74 Years | 0 (0.0%) | 0 (0.0%) |
| 75 Years and over | 19 (100.0%) | 0 (0.0%) |
| Total | 25 (12.9%) | 5 (2.6%) |
Disability Status by Sex by Age in Sherrill
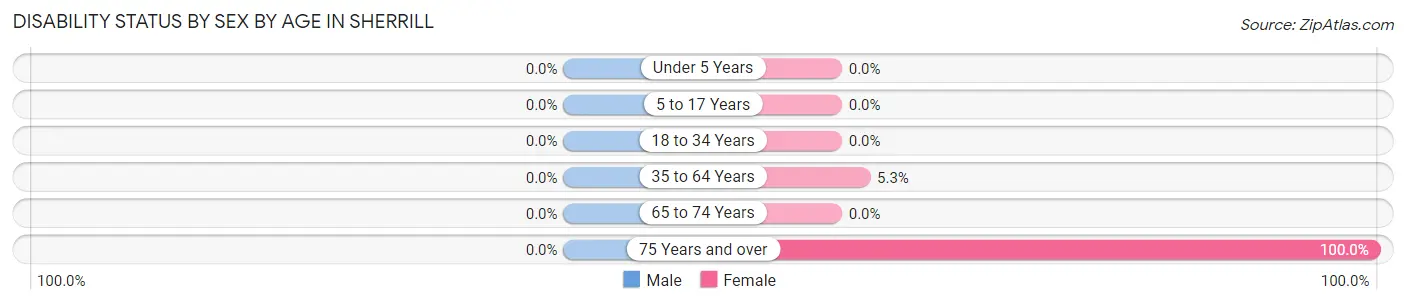
| Age Bracket | Male | Female |
| Under 5 Years | 0 (0.0%) | 0 (0.0%) |
| 5 to 17 Years | 0 (0.0%) | 0 (0.0%) |
| 18 to 34 Years | 0 (0.0%) | 0 (0.0%) |
| 35 to 64 Years | 0 (0.0%) | 2 (5.3%) |
| 65 to 74 Years | 0 (0.0%) | 0 (0.0%) |
| 75 Years and over | 0 (0.0%) | 19 (100.0%) |
Disability Class by Sex by Age in Sherrill
Disability Class: Hearing Difficulty
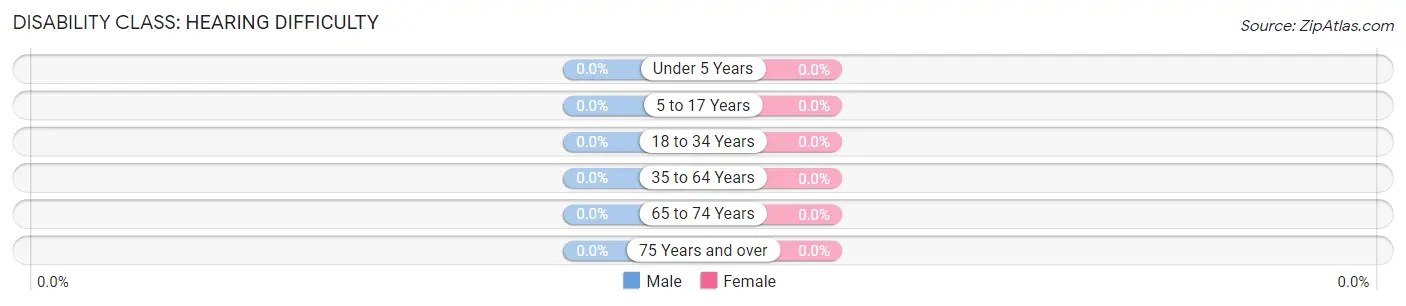
| Age Bracket | Male | Female |
| Under 5 Years | 0 (0.0%) | 0 (0.0%) |
| 5 to 17 Years | 0 (0.0%) | 0 (0.0%) |
| 18 to 34 Years | 0 (0.0%) | 0 (0.0%) |
| 35 to 64 Years | 0 (0.0%) | 0 (0.0%) |
| 65 to 74 Years | 0 (0.0%) | 0 (0.0%) |
| 75 Years and over | 0 (0.0%) | 0 (0.0%) |
Disability Class: Vision Difficulty
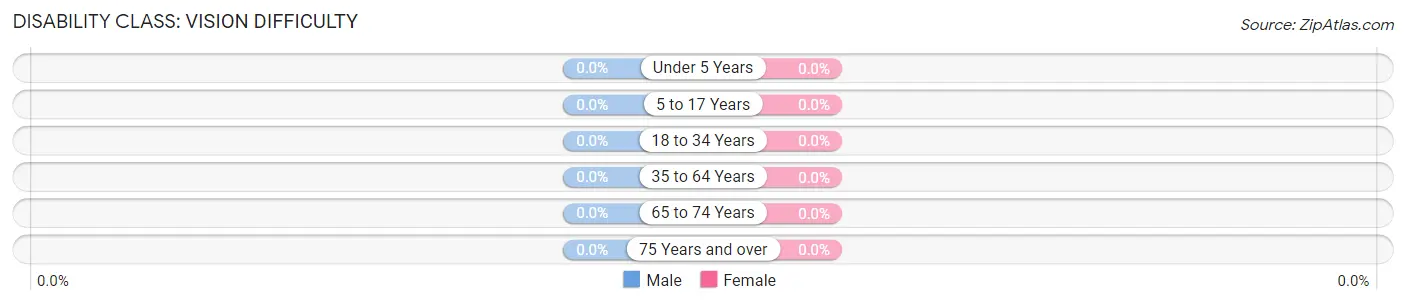
| Age Bracket | Male | Female |
| Under 5 Years | 0 (0.0%) | 0 (0.0%) |
| 5 to 17 Years | 0 (0.0%) | 0 (0.0%) |
| 18 to 34 Years | 0 (0.0%) | 0 (0.0%) |
| 35 to 64 Years | 0 (0.0%) | 0 (0.0%) |
| 65 to 74 Years | 0 (0.0%) | 0 (0.0%) |
| 75 Years and over | 0 (0.0%) | 0 (0.0%) |
Disability Class: Cognitive Difficulty
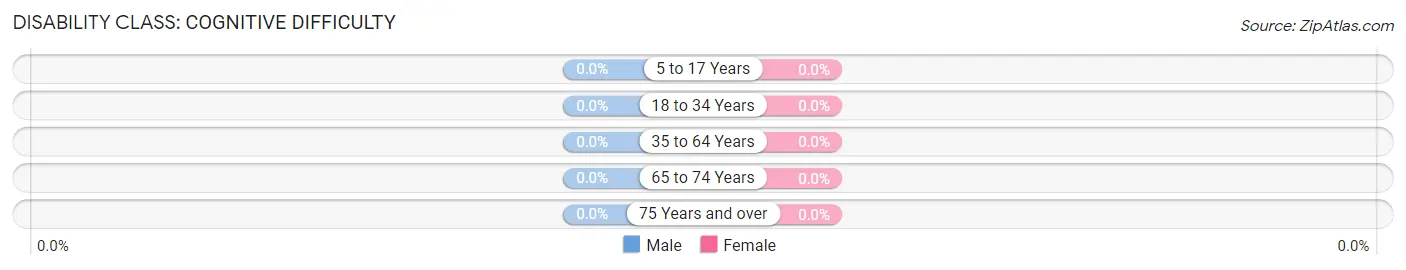
| Age Bracket | Male | Female |
| 5 to 17 Years | 0 (0.0%) | 0 (0.0%) |
| 18 to 34 Years | 0 (0.0%) | 0 (0.0%) |
| 35 to 64 Years | 0 (0.0%) | 0 (0.0%) |
| 65 to 74 Years | 0 (0.0%) | 0 (0.0%) |
| 75 Years and over | 0 (0.0%) | 0 (0.0%) |
Disability Class: Ambulatory Difficulty
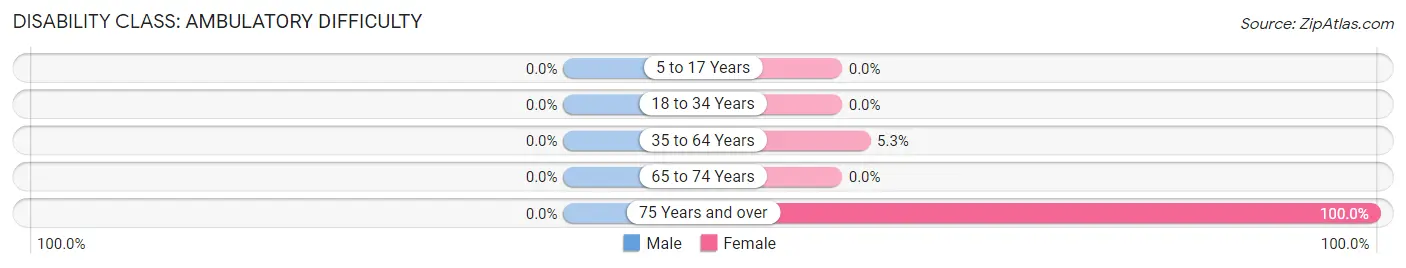
| Age Bracket | Male | Female |
| 5 to 17 Years | 0 (0.0%) | 0 (0.0%) |
| 18 to 34 Years | 0 (0.0%) | 0 (0.0%) |
| 35 to 64 Years | 0 (0.0%) | 2 (5.3%) |
| 65 to 74 Years | 0 (0.0%) | 0 (0.0%) |
| 75 Years and over | 0 (0.0%) | 19 (100.0%) |
Disability Class: Self-Care Difficulty
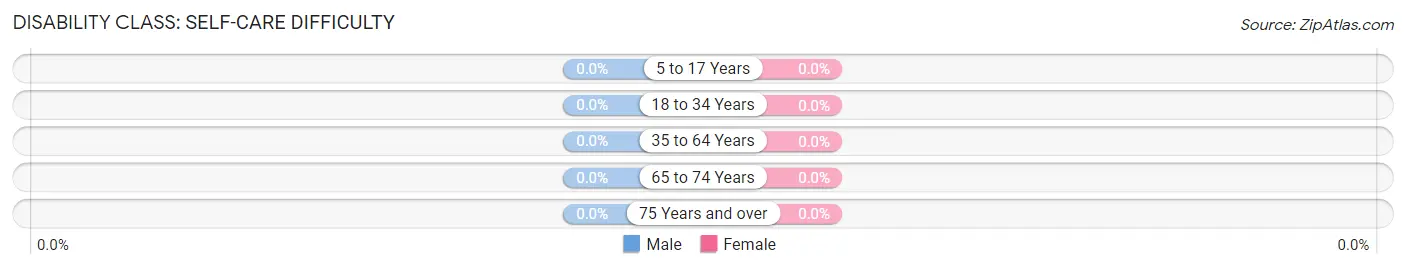
| Age Bracket | Male | Female |
| 5 to 17 Years | 0 (0.0%) | 0 (0.0%) |
| 18 to 34 Years | 0 (0.0%) | 0 (0.0%) |
| 35 to 64 Years | 0 (0.0%) | 0 (0.0%) |
| 65 to 74 Years | 0 (0.0%) | 0 (0.0%) |
| 75 Years and over | 0 (0.0%) | 0 (0.0%) |
Technology Access in Sherrill
Computing Device Access in Sherrill
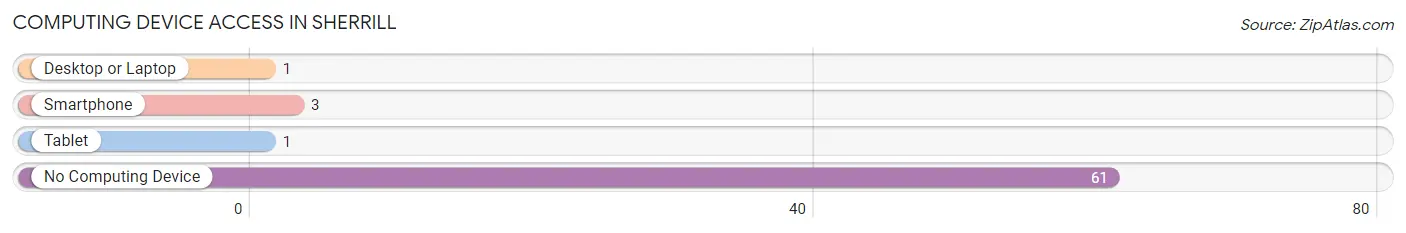
| Device Type | # Households | % Households |
| Desktop or Laptop | 1 | 1.6% |
| Smartphone | 3 | 4.7% |
| Tablet | 1 | 1.6% |
| No Computing Device | 61 | 95.3% |
| Total | 64 | 100.0% |
Internet Access in Sherrill
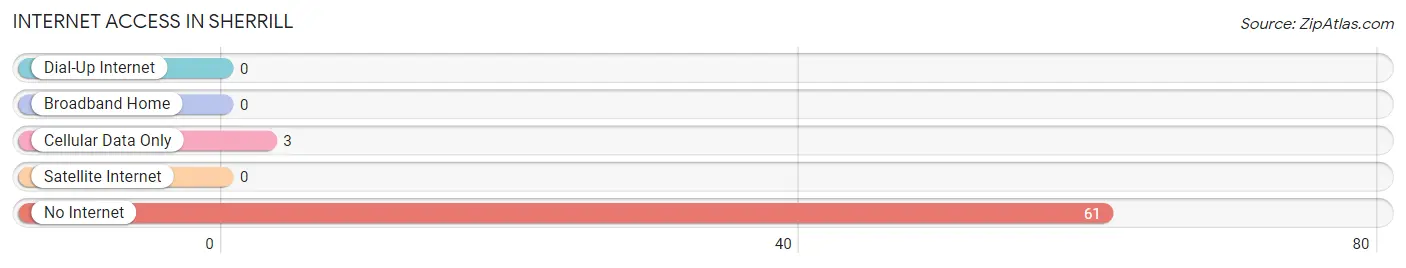
| Internet Type | # Households | % Households |
| Dial-Up Internet | 0 | 0.0% |
| Broadband Home | 0 | 0.0% |
| Cellular Data Only | 3 | 4.7% |
| Satellite Internet | 0 | 0.0% |
| No Internet | 61 | 95.3% |
| Total | 64 | 100.0% |
Sherrill Summary
Sherrill, Arkansas is a small town located in Jefferson County, Arkansas. It is situated on the banks of the Arkansas River, about 20 miles south of Pine Bluff. The town was founded in 1883 and was named after the first postmaster, William Sherrill. The population of Sherrill was estimated to be around 500 people in 2020.
Geography
Sherrill is located in the Arkansas Delta region of the state. The town is situated on the banks of the Arkansas River, about 20 miles south of Pine Bluff. The terrain is mostly flat, with some rolling hills in the area. The climate is humid subtropical, with hot summers and mild winters. The average annual temperature is around 65 degrees Fahrenheit.
Economy
The economy of Sherrill is largely based on agriculture. The town is home to several farms, which produce cotton, soybeans, corn, and other crops. There are also several small businesses in the area, including a grocery store, a hardware store, and a few restaurants.
Demographics
As of the 2010 census, the population of Sherrill was 498 people. The racial makeup of the town was 95.2% White, 0.2% African American, 0.2% Native American, 0.2% Asian, 0.2% Pacific Islander, and 3.2% from other races. The median household income was $30,000, and the median family income was $35,000.
Conclusion
Sherrill, Arkansas is a small town located in Jefferson County, Arkansas. It is situated on the banks of the Arkansas River, about 20 miles south of Pine Bluff. The town was founded in 1883 and was named after the first postmaster, William Sherrill. The population of Sherrill was estimated to be around 500 people in 2020. The economy of Sherrill is largely based on agriculture, with several farms producing cotton, soybeans, corn, and other crops. The racial makeup of the town was 95.2% White, 0.2% African American, 0.2% Native American, 0.2% Asian, 0.2% Pacific Islander, and 3.2% from other races. The median household income was $30,000, and the median family income was $35,000. Sherrill is a small town with a rich history and a bright future.
Common Questions
What is Per Capita Income in Sherrill?
Per Capita income in Sherrill is $6,486.
What is the Median Household income in Sherrill?
Median Household Income in Sherrill is $20,655.
What is Inequality or Gini Index in Sherrill?
Inequality or Gini Index in Sherrill is 0.05.
What is the Total Population of Sherrill?
Total Population of Sherrill is 194.
What is the Total Male Population of Sherrill?
Total Male Population of Sherrill is 91.
What is the Total Female Population of Sherrill?
Total Female Population of Sherrill is 103.
What is the Ratio of Males per 100 Females in Sherrill?
There are 88.35 Males per 100 Females in Sherrill.
What is the Ratio of Females per 100 Males in Sherrill?
There are 113.19 Females per 100 Males in Sherrill.
What is the Median Population Age in Sherrill?
Median Population Age in Sherrill is 42.0 Years.
What is the Average Family Size in Sherrill
Average Family Size in Sherrill is 4.0 People.
What is the Average Household Size in Sherrill
Average Household Size in Sherrill is 3.0 People.
How Large is the Labor Force in Sherrill?
There are 45 People in the Labor Forcein in Sherrill.
What is the Percentage of People in the Labor Force in Sherrill?
44.6% of People are in the Labor Force in Sherrill.