Salem, NM Map & Demographics
Salem Map
Salem Overview
$10,030
PER CAPITA INCOME
$25,823
AVG FAMILY INCOME
$26,768
AVG HOUSEHOLD INCOME
12.7%
WAGE / INCOME GAP [ % ]
87.3¢/ $1
WAGE / INCOME GAP [ $ ]
0.29
INEQUALITY / GINI INDEX
844
TOTAL POPULATION
413
MALE POPULATION
431
FEMALE POPULATION
95.82
MALES / 100 FEMALES
104.36
FEMALES / 100 MALES
25.7
MEDIAN AGE
3.7
AVG FAMILY SIZE
3.4
AVG HOUSEHOLD SIZE
441
LABOR FORCE [ PEOPLE ]
77.5%
PERCENT IN LABOR FORCE
21.1%
UNEMPLOYMENT RATE
Salem Zip Codes
Salem Area Codes
Income in Salem
Income Overview in Salem
Per Capita Income in Salem is $10,030, while median incomes of families and households are $25,823 and $26,768 respectively.
| Characteristic | Number | Measure |
| Per Capita Income | 844 | $10,030 |
| Median Family Income | 221 | $25,823 |
| Mean Family Income | 221 | $30,134 |
| Median Household Income | 252 | $26,768 |
| Mean Household Income | 252 | $33,546 |
| Income Deficit | 221 | $0 |
| Wage / Income Gap (%) | 844 | 12.66% |
| Wage / Income Gap ($) | 844 | 87.34¢ per $1 |
| Gini / Inequality Index | 844 | 0.29 |
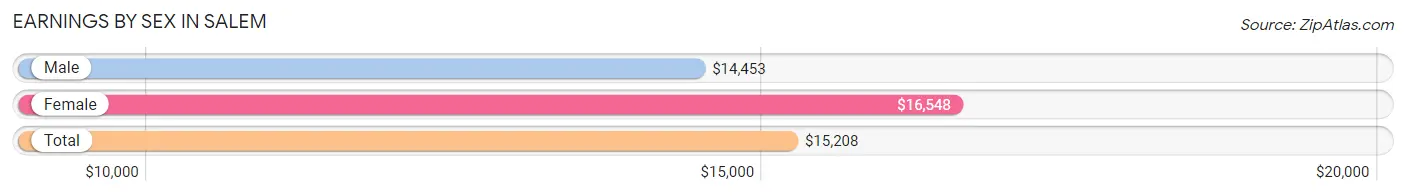
Earnings by Sex in Salem
Average Earnings in Salem are $15,208, $14,453 for men and $16,548 for women, a difference of 12.7%.
| Sex | Number | Average Earnings |
| Male | 291 (74.1%) | $14,453 |
| Female | 102 (26.0%) | $16,548 |
| Total | 393 (100.0%) | $15,208 |
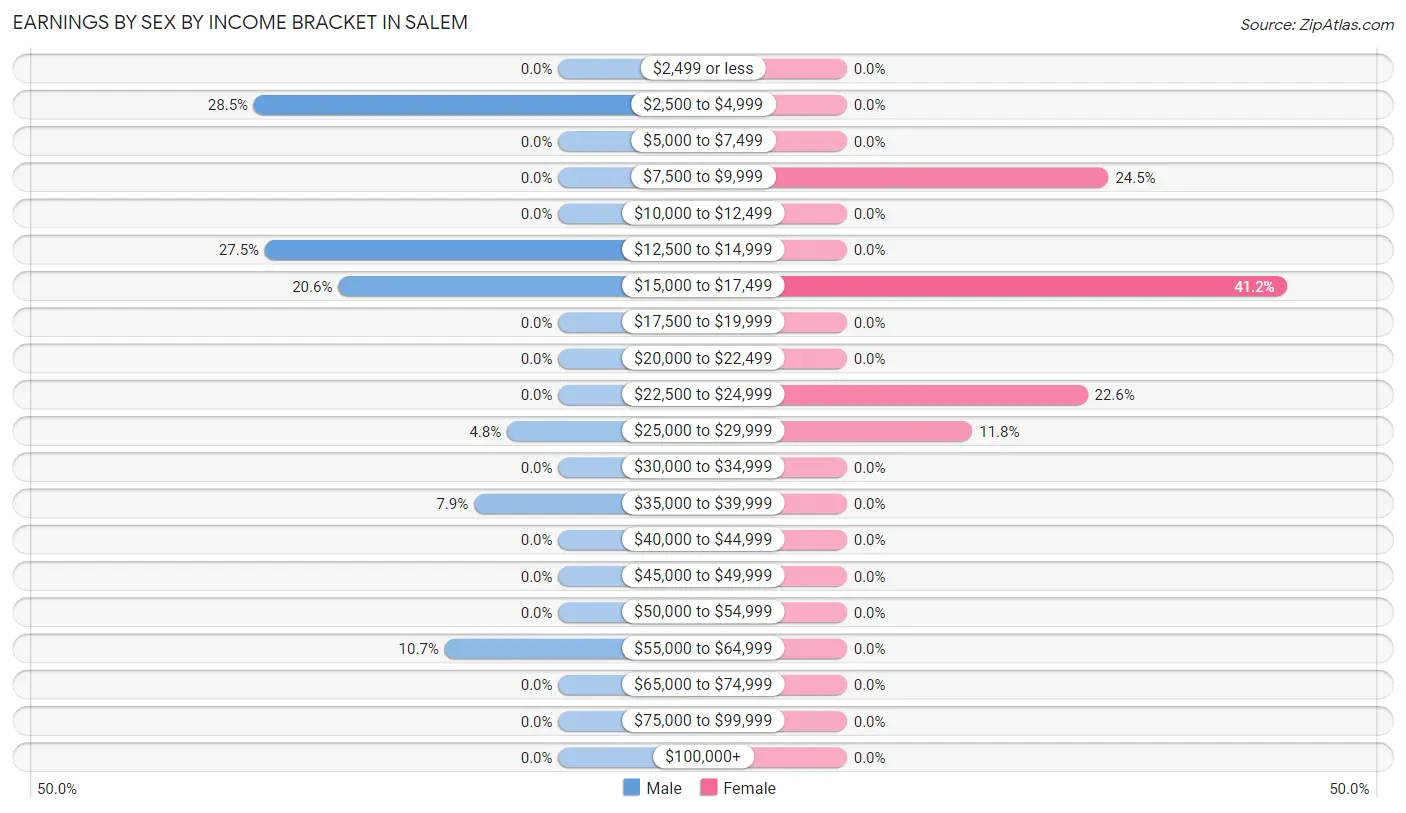
Earnings by Sex by Income Bracket in Salem
The most common earnings brackets in Salem are $2,500 to $4,999 for men (83 | 28.5%) and $15,000 to $17,499 for women (42 | 41.2%).
| Income | Male | Female |
| $2,499 or less | 0 (0.0%) | 0 (0.0%) |
| $2,500 to $4,999 | 83 (28.5%) | 0 (0.0%) |
| $5,000 to $7,499 | 0 (0.0%) | 0 (0.0%) |
| $7,500 to $9,999 | 0 (0.0%) | 25 (24.5%) |
| $10,000 to $12,499 | 0 (0.0%) | 0 (0.0%) |
| $12,500 to $14,999 | 80 (27.5%) | 0 (0.0%) |
| $15,000 to $17,499 | 60 (20.6%) | 42 (41.2%) |
| $17,500 to $19,999 | 0 (0.0%) | 0 (0.0%) |
| $20,000 to $22,499 | 0 (0.0%) | 0 (0.0%) |
| $22,500 to $24,999 | 0 (0.0%) | 23 (22.6%) |
| $25,000 to $29,999 | 14 (4.8%) | 12 (11.8%) |
| $30,000 to $34,999 | 0 (0.0%) | 0 (0.0%) |
| $35,000 to $39,999 | 23 (7.9%) | 0 (0.0%) |
| $40,000 to $44,999 | 0 (0.0%) | 0 (0.0%) |
| $45,000 to $49,999 | 0 (0.0%) | 0 (0.0%) |
| $50,000 to $54,999 | 0 (0.0%) | 0 (0.0%) |
| $55,000 to $64,999 | 31 (10.6%) | 0 (0.0%) |
| $65,000 to $74,999 | 0 (0.0%) | 0 (0.0%) |
| $75,000 to $99,999 | 0 (0.0%) | 0 (0.0%) |
| $100,000+ | 0 (0.0%) | 0 (0.0%) |
| Total | 291 (100.0%) | 102 (100.0%) |
Earnings by Sex by Educational Attainment in Salem
| Educational Attainment | Male Income | Female Income |
| Less than High School | - | - |
| High School Diploma | - | - |
| College or Associate's Degree | - | - |
| Bachelor's Degree | - | - |
| Graduate Degree | - | - |
| Total | - | - |
Family Income in Salem
Family Income Brackets in Salem
According to the Salem family income data, there are 89 families falling into the $25,000 to $34,999 income range, which is the most common income bracket and makes up 40.3% of all families.
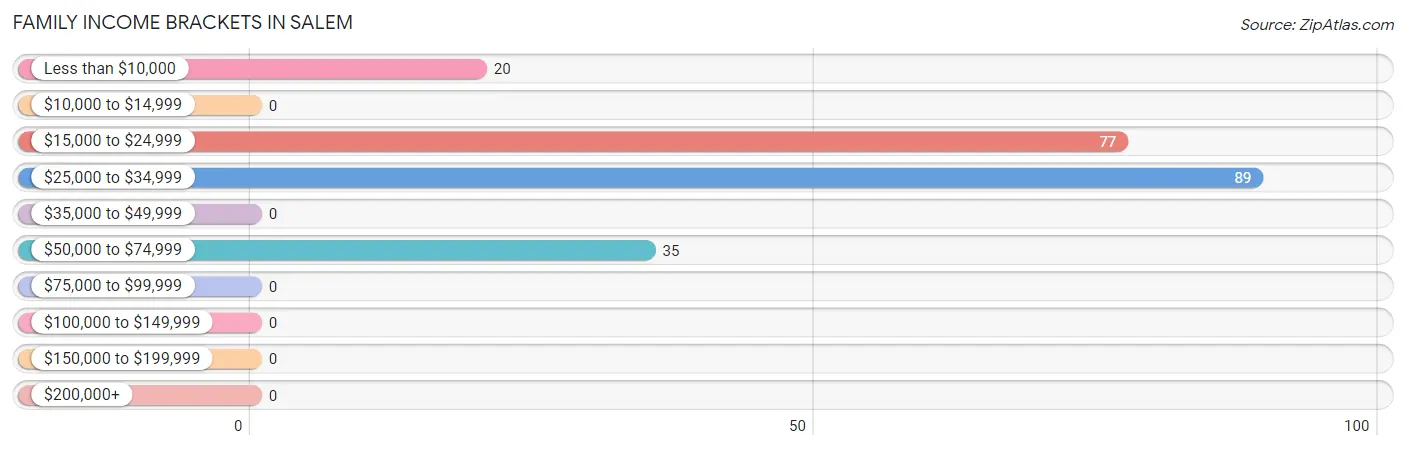
| Income Bracket | # Families | % Families |
| Less than $10,000 | 20 | 9.0% |
| $10,000 to $14,999 | 0 | 0.0% |
| $15,000 to $24,999 | 77 | 34.8% |
| $25,000 to $34,999 | 89 | 40.3% |
| $35,000 to $49,999 | 0 | 0.0% |
| $50,000 to $74,999 | 35 | 15.8% |
| $75,000 to $99,999 | 0 | 0.0% |
| $100,000 to $149,999 | 0 | 0.0% |
| $150,000 to $199,999 | 0 | 0.0% |
| $200,000+ | 0 | 0.0% |
Family Income by Famaliy Size in Salem
2-person families (84 | 38.0%) account for the highest median family income in Salem with $26,341 per family, while 2-person families (84 | 38.0%) have the highest median income of $13,170 per family member.
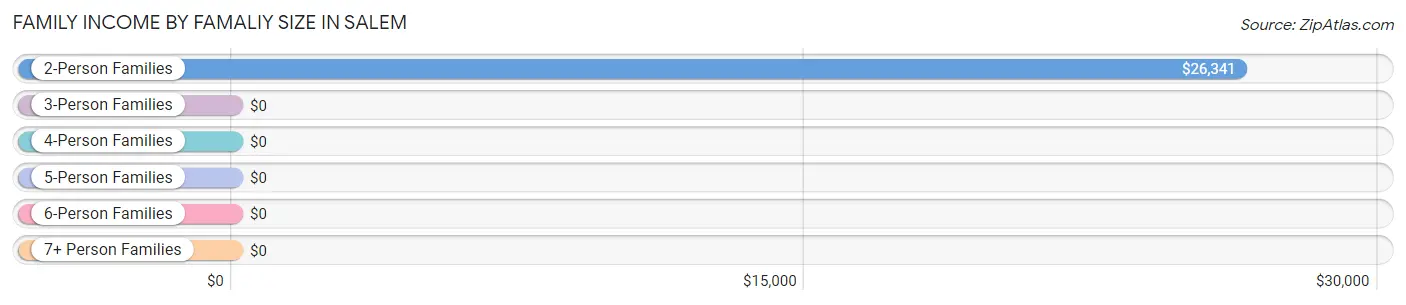
| Income Bracket | # Families | Median Income |
| 2-Person Families | 84 (38.0%) | $26,341 |
| 3-Person Families | 0 (0.0%) | $0 |
| 4-Person Families | 49 (22.2%) | $0 |
| 5-Person Families | 60 (27.2%) | $0 |
| 6-Person Families | 28 (12.7%) | $0 |
| 7+ Person Families | 0 (0.0%) | $0 |
| Total | 221 (100.0%) | $25,823 |
Family Income by Number of Earners in Salem
| Number of Earners | # Families | Median Income |
| No Earners | 20 (9.0%) | $0 |
| 1 Earner | 89 (40.3%) | $0 |
| 2 Earners | 51 (23.1%) | $0 |
| 3+ Earners | 61 (27.6%) | $0 |
| Total | 221 (100.0%) | $25,823 |
Household Income in Salem
Household Income Brackets in Salem
With 89 households falling in the category, the $25,000 to $34,999 income range is the most frequent in Salem, accounting for 35.3% of all households.
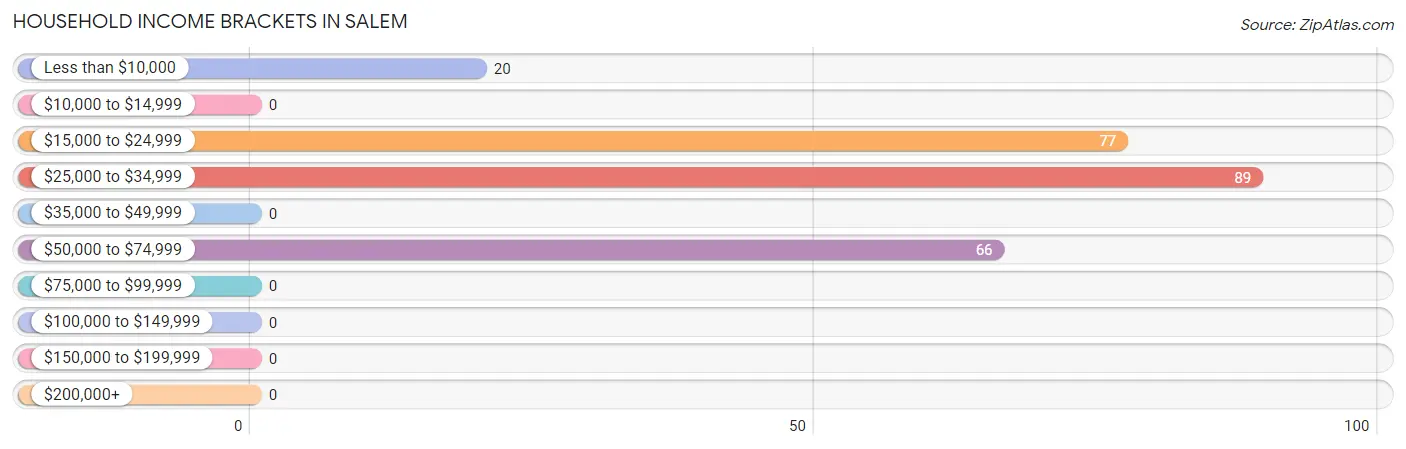
| Income Bracket | # Households | % Households |
| Less than $10,000 | 20 | 7.9% |
| $10,000 to $14,999 | 0 | 0.0% |
| $15,000 to $24,999 | 77 | 30.6% |
| $25,000 to $34,999 | 89 | 35.3% |
| $35,000 to $49,999 | 0 | 0.0% |
| $50,000 to $74,999 | 66 | 26.2% |
| $75,000 to $99,999 | 0 | 0.0% |
| $100,000 to $149,999 | 0 | 0.0% |
| $150,000 to $199,999 | 0 | 0.0% |
| $200,000+ | 0 | 0.0% |
Household Income by Householder Age in Salem
The median household income in Salem is $26,768, with the highest median household income of $32,552 found in the 25 to 44 years age bracket for the primary householder. A total of 156 households (61.9%) fall into this category.
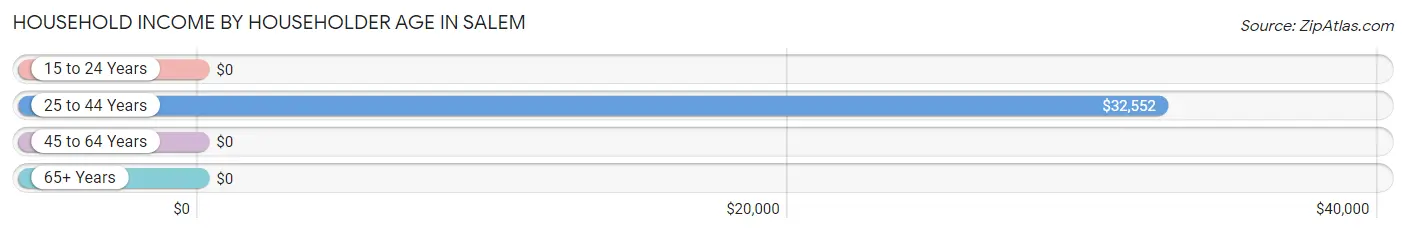
| Income Bracket | # Households | Median Income |
| 15 to 24 Years | 0 (0.0%) | $0 |
| 25 to 44 Years | 156 (61.9%) | $32,552 |
| 45 to 64 Years | 96 (38.1%) | $0 |
| 65+ Years | 0 (0.0%) | $0 |
| Total | 252 (100.0%) | $26,768 |
Poverty in Salem
Income Below Poverty by Sex and Age in Salem
With 62.7% poverty level for males and 82.4% for females among the residents of Salem, 25 to 34 year old males and under 5 year old females are the most vulnerable to poverty, with 49 males (100.0%) and 26 females (100.0%) in their respective age groups living below the poverty level.
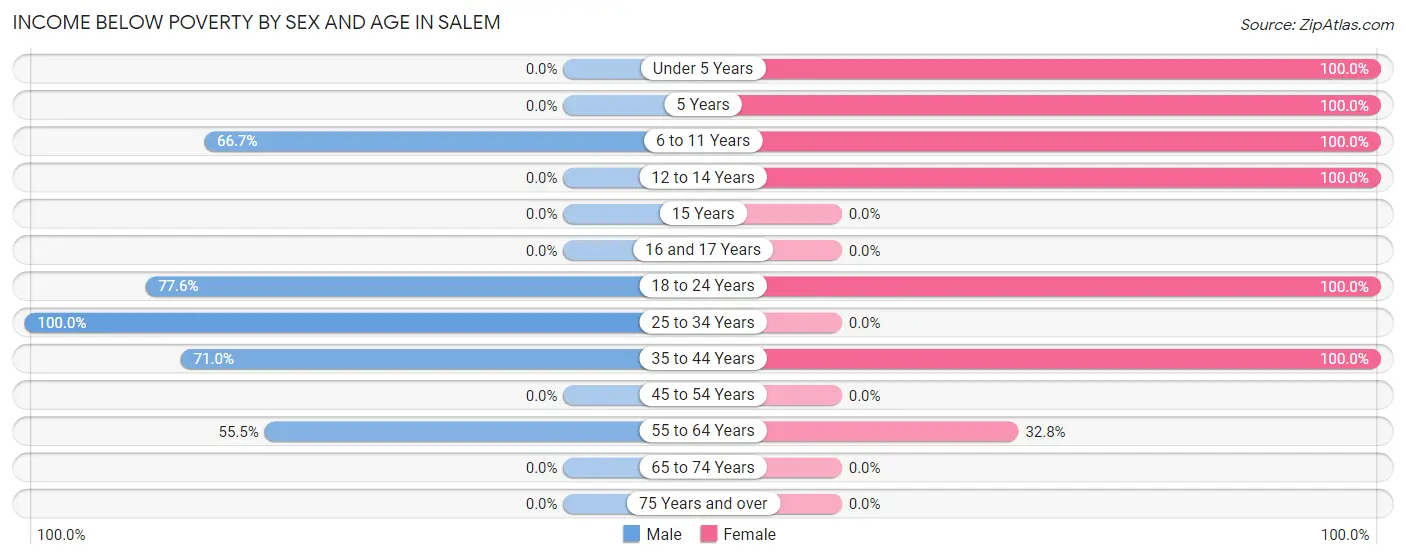
| Age Bracket | Male | Female |
| Under 5 Years | 0 (0.0%) | 26 (100.0%) |
| 5 Years | 0 (0.0%) | 47 (100.0%) |
| 6 to 11 Years | 26 (66.7%) | 28 (100.0%) |
| 12 to 14 Years | 0 (0.0%) | 122 (100.0%) |
| 15 Years | 0 (0.0%) | 0 (0.0%) |
| 16 and 17 Years | 0 (0.0%) | 0 (0.0%) |
| 18 to 24 Years | 52 (77.6%) | 45 (100.0%) |
| 25 to 34 Years | 49 (100.0%) | 0 (0.0%) |
| 35 to 44 Years | 76 (71.0%) | 67 (100.0%) |
| 45 to 54 Years | 0 (0.0%) | 0 (0.0%) |
| 55 to 64 Years | 56 (55.4%) | 20 (32.8%) |
| 65 to 74 Years | 0 (0.0%) | 0 (0.0%) |
| 75 Years and over | 0 (0.0%) | 0 (0.0%) |
| Total | 259 (62.7%) | 355 (82.4%) |
Income Above Poverty by Sex and Age in Salem
According to the poverty statistics in Salem, males aged 12 to 14 years and females aged 45 to 54 years are the age groups that are most secure financially, with 100.0% of males and 100.0% of females in these age groups living above the poverty line.
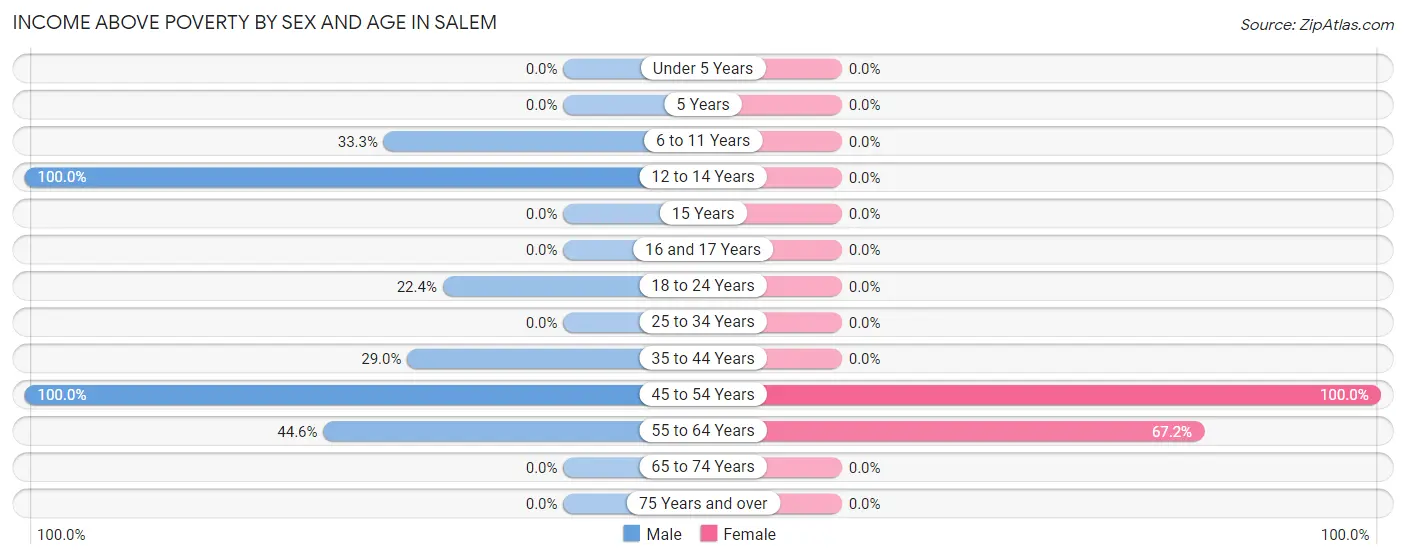
| Age Bracket | Male | Female |
| Under 5 Years | 0 (0.0%) | 0 (0.0%) |
| 5 Years | 0 (0.0%) | 0 (0.0%) |
| 6 to 11 Years | 13 (33.3%) | 0 (0.0%) |
| 12 to 14 Years | 13 (100.0%) | 0 (0.0%) |
| 15 Years | 0 (0.0%) | 0 (0.0%) |
| 16 and 17 Years | 0 (0.0%) | 0 (0.0%) |
| 18 to 24 Years | 15 (22.4%) | 0 (0.0%) |
| 25 to 34 Years | 0 (0.0%) | 0 (0.0%) |
| 35 to 44 Years | 31 (29.0%) | 0 (0.0%) |
| 45 to 54 Years | 37 (100.0%) | 35 (100.0%) |
| 55 to 64 Years | 45 (44.6%) | 41 (67.2%) |
| 65 to 74 Years | 0 (0.0%) | 0 (0.0%) |
| 75 Years and over | 0 (0.0%) | 0 (0.0%) |
| Total | 154 (37.3%) | 76 (17.6%) |
Income Below Poverty Among Married-Couple Families in Salem
The poverty statistics for married-couple families in Salem show that 55.8% or 96 of the total 172 families live below the poverty line. Families with 3 or 4 children have the highest poverty rate of 100.0%, comprising of 76 families. On the other hand, families with 1 or 2 children have the lowest poverty rate of 0.0%, which includes 0 families.
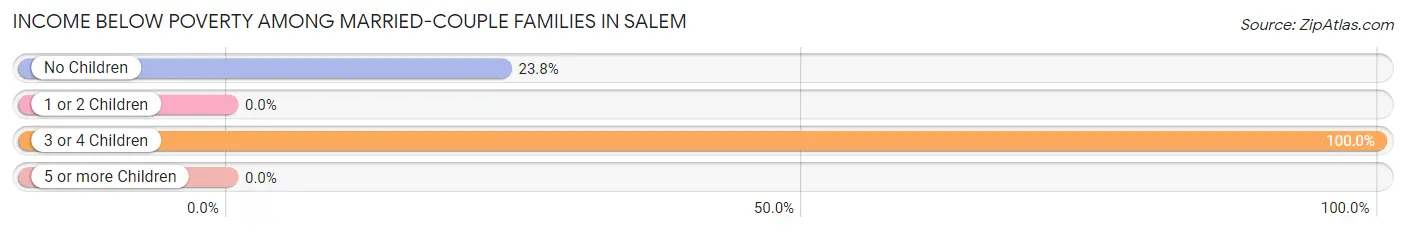
| Children | Above Poverty | Below Poverty |
| No Children | 64 (76.2%) | 20 (23.8%) |
| 1 or 2 Children | 12 (100.0%) | 0 (0.0%) |
| 3 or 4 Children | 0 (0.0%) | 76 (100.0%) |
| 5 or more Children | 0 (0.0%) | 0 (0.0%) |
| Total | 76 (44.2%) | 96 (55.8%) |
Income Below Poverty Among Single-Parent Households in Salem
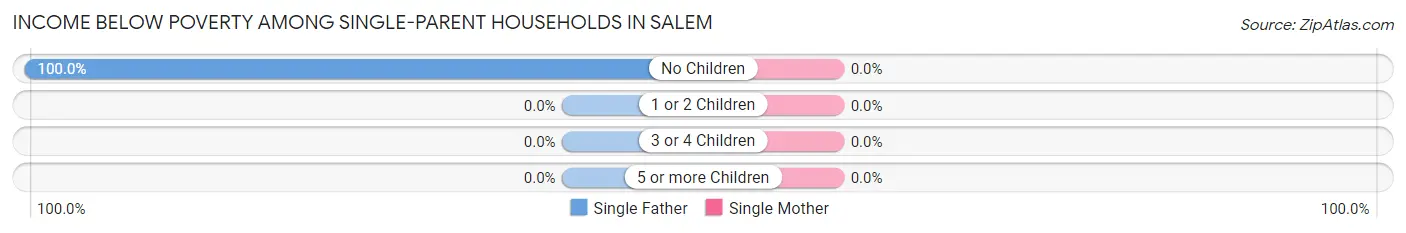
| Children | Single Father | Single Mother |
| No Children | 49 (100.0%) | 0 (0.0%) |
| 1 or 2 Children | 0 (0.0%) | 0 (0.0%) |
| 3 or 4 Children | 0 (0.0%) | 0 (0.0%) |
| 5 or more Children | 0 (0.0%) | 0 (0.0%) |
| Total | 49 (100.0%) | 0 (0.0%) |
Income Below Poverty Among Married-Couple vs Single-Parent Households in Salem
The poverty data for Salem shows that 96 of the married-couple family households (55.8%) and 49 of the single-parent households (100.0%) are living below the poverty level. Within the married-couple family households, those with 3 or 4 children have the highest poverty rate, with 76 households (100.0%) falling below the poverty line. Among the single-parent households, those with no children have the highest poverty rate, with 49 household (100.0%) living below poverty.
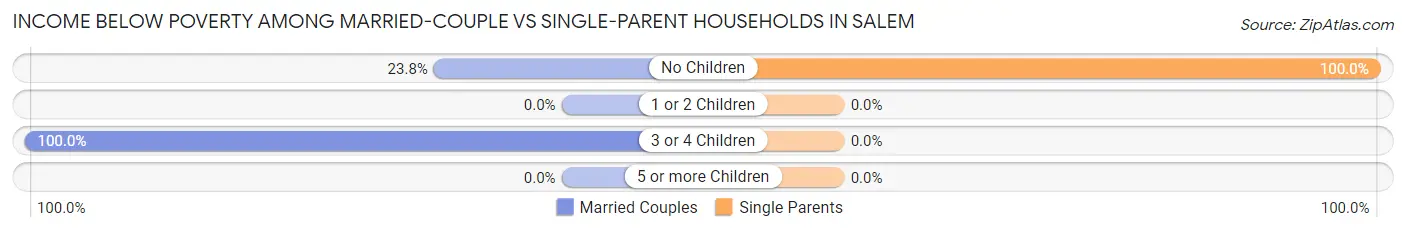
| Children | Married-Couple Families | Single-Parent Households |
| No Children | 20 (23.8%) | 49 (100.0%) |
| 1 or 2 Children | 0 (0.0%) | 0 (0.0%) |
| 3 or 4 Children | 76 (100.0%) | 0 (0.0%) |
| 5 or more Children | 0 (0.0%) | 0 (0.0%) |
| Total | 96 (55.8%) | 49 (100.0%) |
Race in Salem
The most populous races in Salem are Hispanic or Latino (821 | 97.3%), Some other Race (725 | 85.9%), and White / Caucasian (96 | 11.4%).
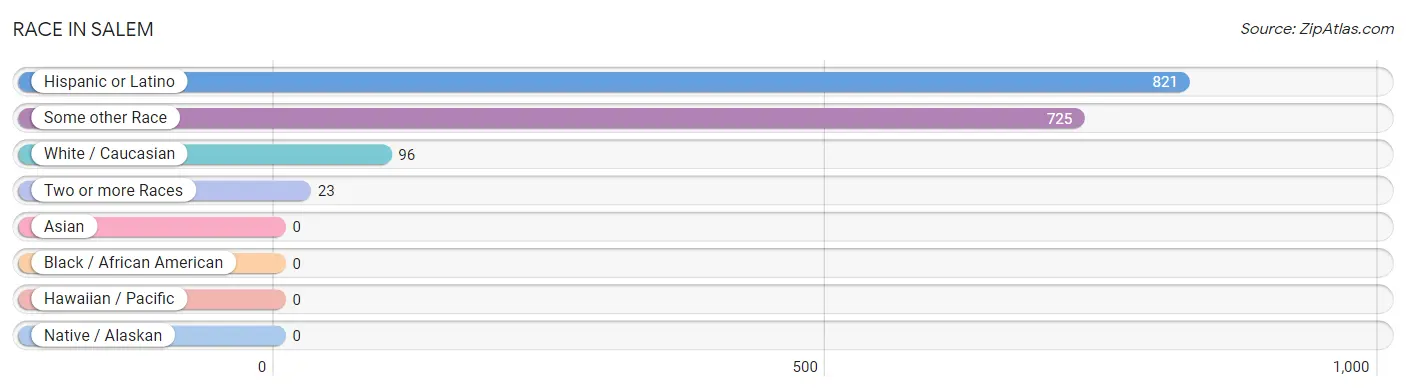
| Race | # Population | % Population |
| Asian | 0 | 0.0% |
| Black / African American | 0 | 0.0% |
| Hawaiian / Pacific | 0 | 0.0% |
| Hispanic or Latino | 821 | 97.3% |
| Native / Alaskan | 0 | 0.0% |
| White / Caucasian | 96 | 11.4% |
| Two or more Races | 23 | 2.7% |
| Some other Race | 725 | 85.9% |
| Total | 844 | 100.0% |
Ancestry in Salem
The most populous ancestries reported in Salem are Mexican (798 | 94.6%), German (23 | 2.7%), and Italian (23 | 2.7%), together accounting for 100.0% of all Salem residents.
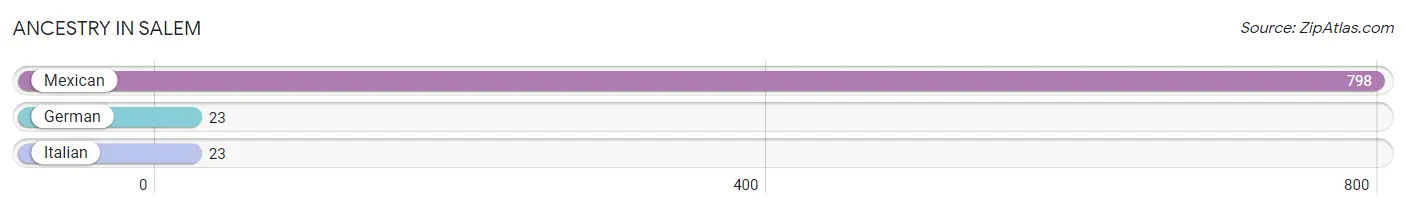
| Ancestry | # Population | % Population |
| German | 23 | 2.7% |
| Italian | 23 | 2.7% |
| Mexican | 798 | 94.6% | View All 3 Rows |
Immigrants in Salem
The most numerous immigrant groups reported in Salem came from Central America (443 | 52.5%), Latin America (443 | 52.5%), and Mexico (443 | 52.5%), together accounting for 157.5% of all Salem residents.
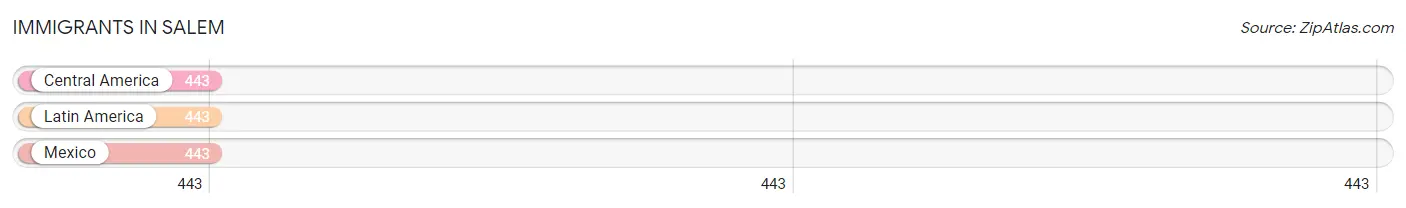
| Immigration Origin | # Population | % Population |
| Central America | 443 | 52.5% |
| Latin America | 443 | 52.5% |
| Mexico | 443 | 52.5% | View All 3 Rows |
Sex and Age in Salem
Sex and Age in Salem
The most populous age groups in Salem are 55 to 59 Years (101 | 24.5%) for men and 10 to 14 Years (122 | 28.3%) for women.
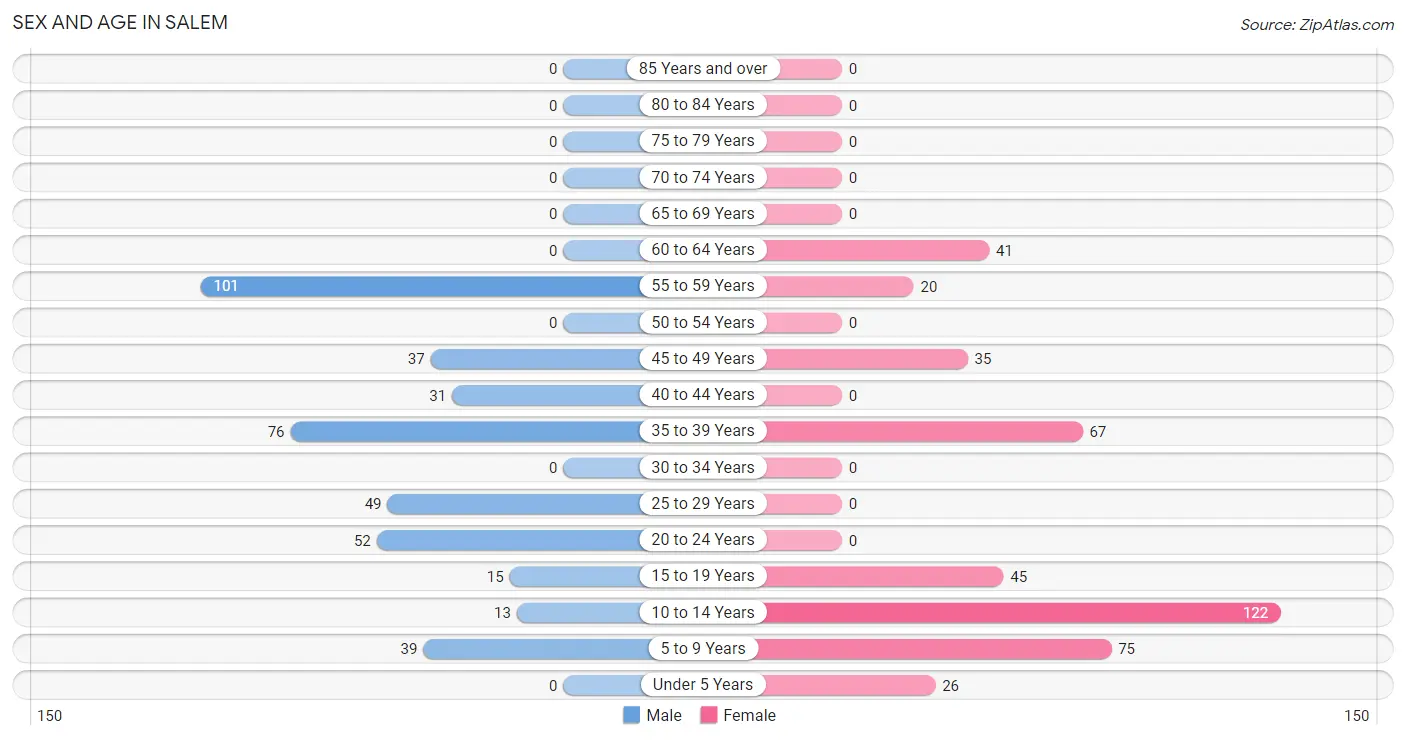
| Age Bracket | Male | Female |
| Under 5 Years | 0 (0.0%) | 26 (6.0%) |
| 5 to 9 Years | 39 (9.4%) | 75 (17.4%) |
| 10 to 14 Years | 13 (3.2%) | 122 (28.3%) |
| 15 to 19 Years | 15 (3.6%) | 45 (10.4%) |
| 20 to 24 Years | 52 (12.6%) | 0 (0.0%) |
| 25 to 29 Years | 49 (11.9%) | 0 (0.0%) |
| 30 to 34 Years | 0 (0.0%) | 0 (0.0%) |
| 35 to 39 Years | 76 (18.4%) | 67 (15.5%) |
| 40 to 44 Years | 31 (7.5%) | 0 (0.0%) |
| 45 to 49 Years | 37 (9.0%) | 35 (8.1%) |
| 50 to 54 Years | 0 (0.0%) | 0 (0.0%) |
| 55 to 59 Years | 101 (24.5%) | 20 (4.6%) |
| 60 to 64 Years | 0 (0.0%) | 41 (9.5%) |
| 65 to 69 Years | 0 (0.0%) | 0 (0.0%) |
| 70 to 74 Years | 0 (0.0%) | 0 (0.0%) |
| 75 to 79 Years | 0 (0.0%) | 0 (0.0%) |
| 80 to 84 Years | 0 (0.0%) | 0 (0.0%) |
| 85 Years and over | 0 (0.0%) | 0 (0.0%) |
| Total | 413 (100.0%) | 431 (100.0%) |
Families and Households in Salem
Median Family Size in Salem
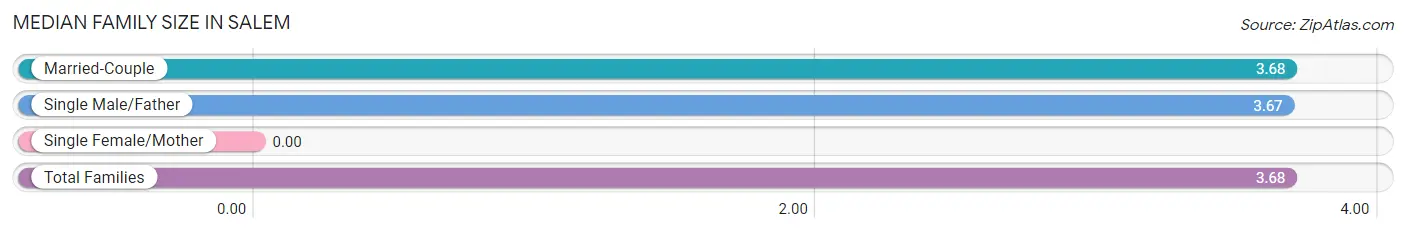
| Family Type | # Families | Family Size |
| Married-Couple | 172 (77.8%) | 3.68 |
| Single Male/Father | 49 (22.2%) | 3.67 |
| Single Female/Mother | 0 (0.0%) | - |
| Total Families | 221 (100.0%) | 3.68 |
Median Household Size in Salem
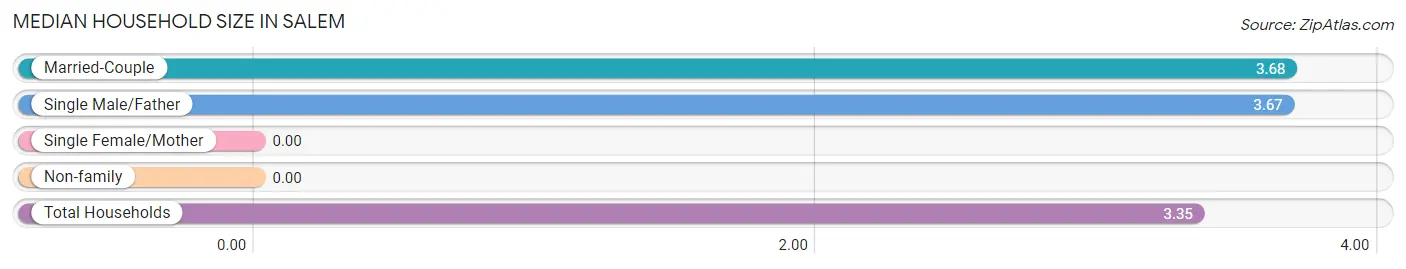
| Household Type | # Households | Household Size |
| Married-Couple | 172 (68.2%) | 3.68 |
| Single Male/Father | 49 (19.4%) | 3.67 |
| Single Female/Mother | 0 (0.0%) | - |
| Non-family | 31 (12.3%) | - |
| Total Households | 252 (100.0%) | 3.35 |
Household Size by Marriage Status in Salem
Out of a total of 252 households in Salem, 221 (87.7%) are family households, while 31 (12.3%) are nonfamily households. The most numerous type of family households are 2-person households, comprising 84, and the most common type of nonfamily households are 1-person households, comprising 31.
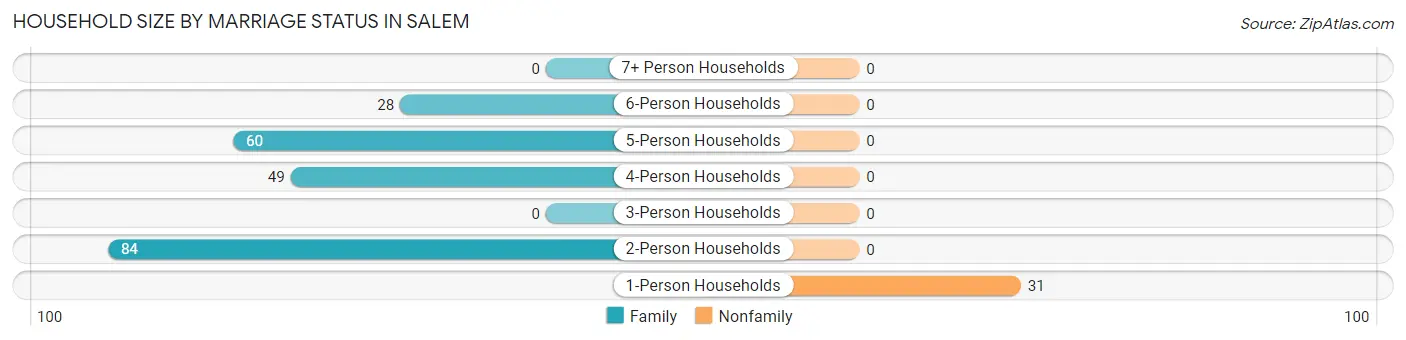
| Household Size | Family Households | Nonfamily Households |
| 1-Person Households | - | 31 (12.3%) |
| 2-Person Households | 84 (33.3%) | 0 (0.0%) |
| 3-Person Households | 0 (0.0%) | 0 (0.0%) |
| 4-Person Households | 49 (19.4%) | 0 (0.0%) |
| 5-Person Households | 60 (23.8%) | 0 (0.0%) |
| 6-Person Households | 28 (11.1%) | 0 (0.0%) |
| 7+ Person Households | 0 (0.0%) | 0 (0.0%) |
| Total | 221 (87.7%) | 31 (12.3%) |
Female Fertility in Salem
Fertility by Age in Salem
Average fertility rate in Salem is 170.0 births per 1,000 women. Women in the age bracket of 35 to 50 years have the highest fertility rate with 245.0 births per 1,000 women. Women in the age bracket of 35 to 50 years acount for 100.0% of all women with births.
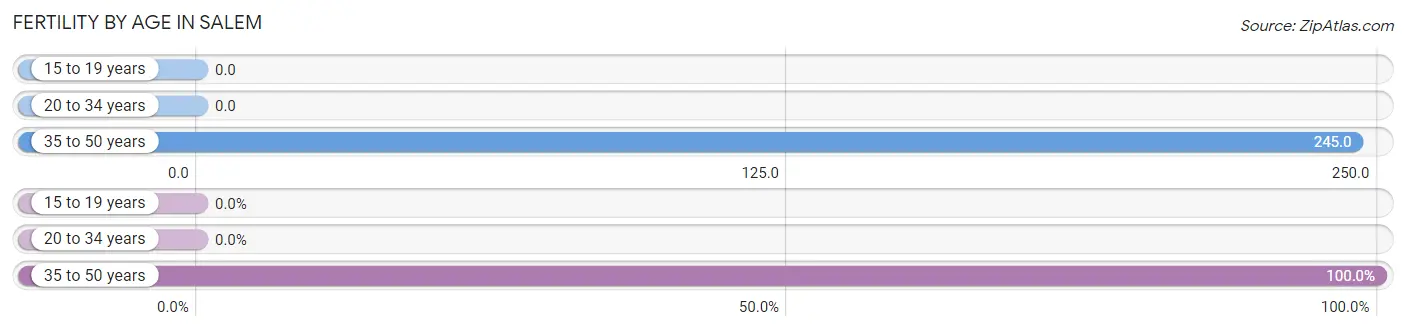
| Age Bracket | Women with Births | Births / 1,000 Women |
| 15 to 19 years | 0 (0.0%) | 0.0 |
| 20 to 34 years | 0 (0.0%) | 0.0 |
| 35 to 50 years | 25 (100.0%) | 245.0 |
| Total | 25 (100.0%) | 170.0 |
Fertility by Age by Marriage Status in Salem
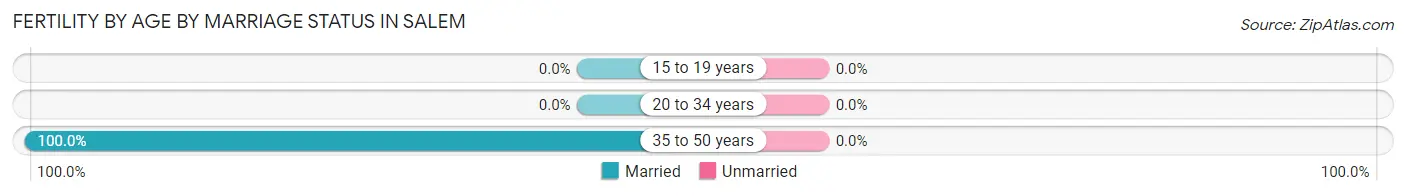
| Age Bracket | Married | Unmarried |
| 15 to 19 years | 0 (0.0%) | 0 (0.0%) |
| 20 to 34 years | 0 (0.0%) | 0 (0.0%) |
| 35 to 50 years | 25 (100.0%) | 0 (0.0%) |
| Total | 25 (100.0%) | 0 (0.0%) |
Fertility by Education in Salem
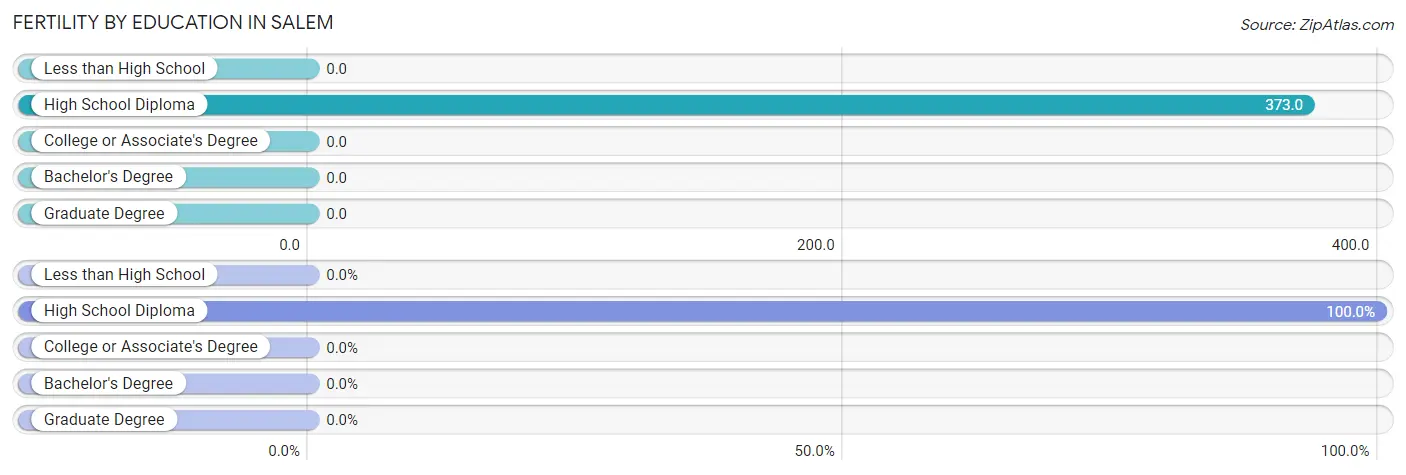
| Educational Attainment | Women with Births | Births / 1,000 Women |
| Less than High School | 0 (0.0%) | 0.0 |
| High School Diploma | 25 (100.0%) | 373.0 |
| College or Associate's Degree | 0 (0.0%) | 0.0 |
| Bachelor's Degree | 0 (0.0%) | 0.0 |
| Graduate Degree | 0 (0.0%) | 0.0 |
| Total | 25 (100.0%) | 170.0 |
Fertility by Education by Marriage Status in Salem
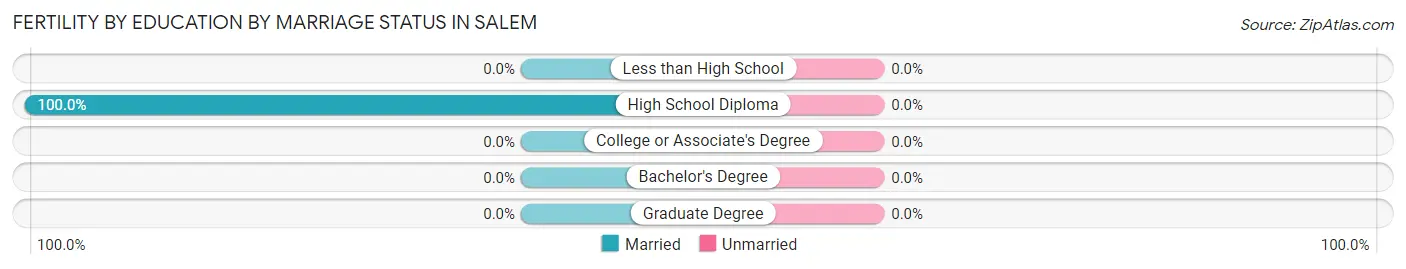
| Educational Attainment | Married | Unmarried |
| Less than High School | 0 (0.0%) | 0 (0.0%) |
| High School Diploma | 25 (100.0%) | 0 (0.0%) |
| College or Associate's Degree | 0 (0.0%) | 0 (0.0%) |
| Bachelor's Degree | 0 (0.0%) | 0 (0.0%) |
| Graduate Degree | 0 (0.0%) | 0 (0.0%) |
| Total | 25 (100.0%) | 0 (0.0%) |
Employment Characteristics in Salem
Employment by Class of Employer in Salem
Among the 348 employed individuals in Salem, private company employees (246 | 70.7%), self-employed (not incorporated) (54 | 15.5%), and state government employees (48 | 13.8%) make up the most common classes of employment.
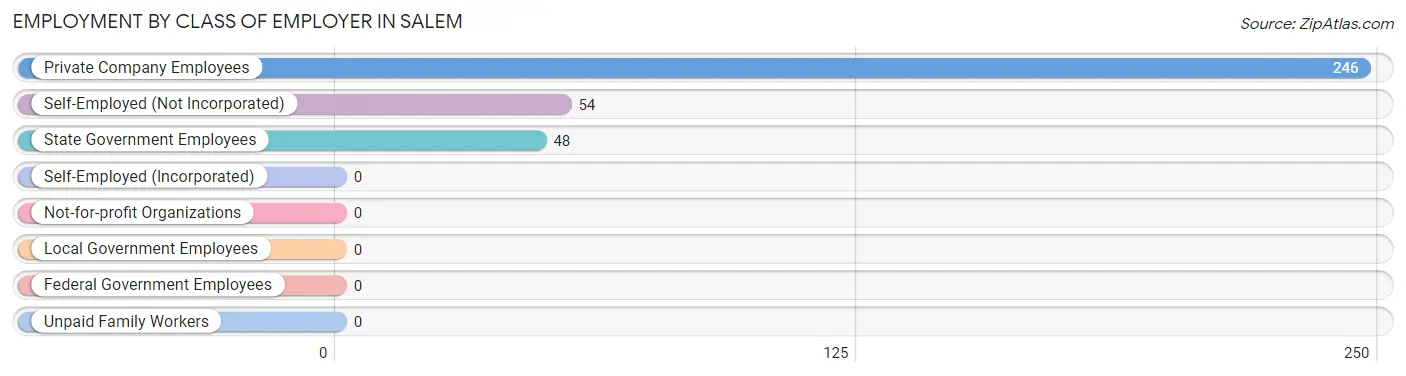
| Employer Class | # Employees | % Employees |
| Private Company Employees | 246 | 70.7% |
| Self-Employed (Incorporated) | 0 | 0.0% |
| Self-Employed (Not Incorporated) | 54 | 15.5% |
| Not-for-profit Organizations | 0 | 0.0% |
| Local Government Employees | 0 | 0.0% |
| State Government Employees | 48 | 13.8% |
| Federal Government Employees | 0 | 0.0% |
| Unpaid Family Workers | 0 | 0.0% |
| Total | 348 | 100.0% |
Employment Status by Age in Salem
According to the labor force statistics for Salem, out of the total population over 16 years of age (569), 77.5% or 441 individuals are in the labor force, with 21.1% or 93 of them unemployed. The age group with the highest labor force participation rate is 20 to 24 years, with 100.0% or 52 individuals in the labor force. Within the labor force, the 55 to 59 years age range has the highest percentage of unemployed individuals, with 57.0% or 45 of them being unemployed.
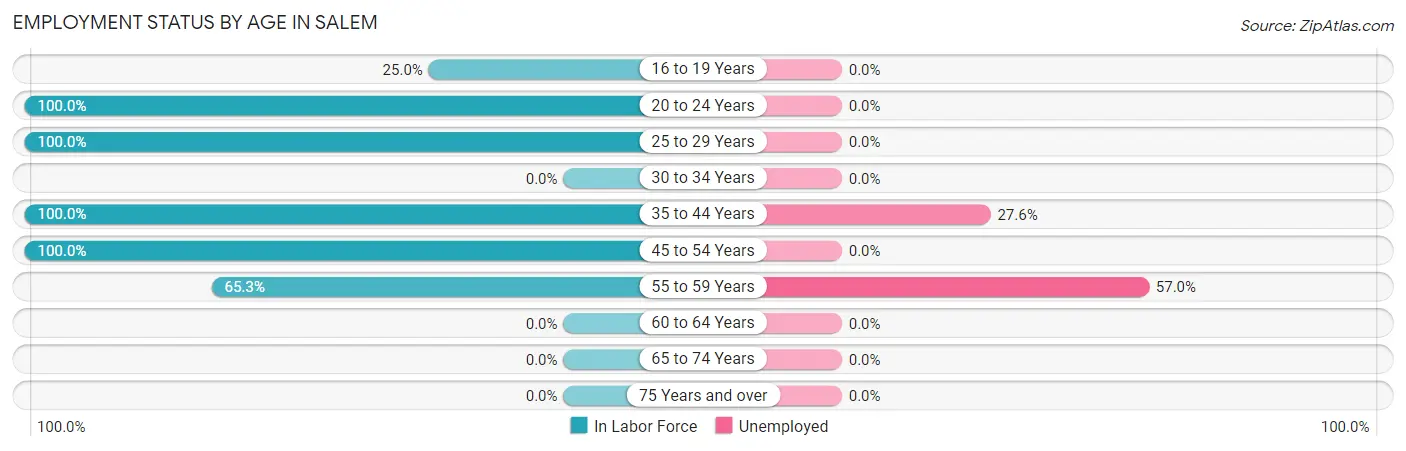
| Age Bracket | In Labor Force | Unemployed |
| 16 to 19 Years | 15 (25.0%) | 0 (0.0%) |
| 20 to 24 Years | 52 (100.0%) | 0 (0.0%) |
| 25 to 29 Years | 49 (100.0%) | 0 (0.0%) |
| 30 to 34 Years | 0 (0.0%) | 0 (0.0%) |
| 35 to 44 Years | 174 (100.0%) | 48 (27.6%) |
| 45 to 54 Years | 72 (100.0%) | 0 (0.0%) |
| 55 to 59 Years | 79 (65.3%) | 45 (57.0%) |
| 60 to 64 Years | 0 (0.0%) | 0 (0.0%) |
| 65 to 74 Years | 0 (0.0%) | 0 (0.0%) |
| 75 Years and over | 0 (0.0%) | 0 (0.0%) |
| Total | 441 (77.5%) | 93 (21.1%) |
Employment Status by Educational Attainment in Salem
According to labor force statistics for Salem, 81.8% of individuals (374) out of the total population between 25 and 64 years of age (457) are in the labor force, with 24.9% or 93 of them being unemployed. The group with the highest labor force participation rate are those with the educational attainment of high school diploma, with 100.0% or 135 individuals in the labor force. Within the labor force, individuals with high school diploma education have the highest percentage of unemployment, with 33.3% or 45 of them being unemployed.
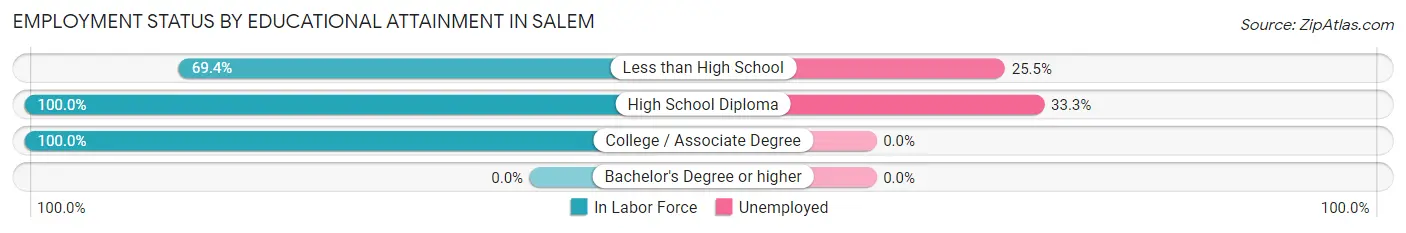
| Educational Attainment | In Labor Force | Unemployed |
| Less than High School | 188 (69.4%) | 69 (25.5%) |
| High School Diploma | 135 (100.0%) | 45 (33.3%) |
| College / Associate Degree | 51 (100.0%) | 0 (0.0%) |
| Bachelor's Degree or higher | 0 (0.0%) | 0 (0.0%) |
| Total | 374 (81.8%) | 114 (24.9%) |
Employment Occupations by Sex in Salem
Management, Business, Science and Arts Occupations
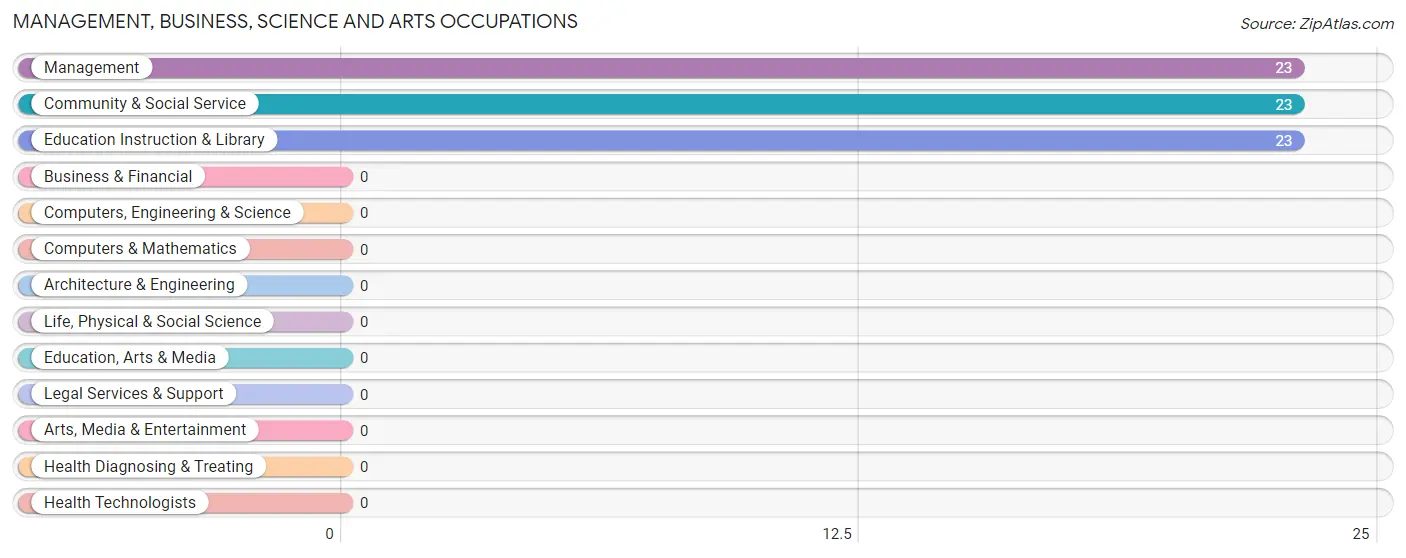
The most common Management, Business, Science and Arts occupations in Salem are Management (23 | 6.6%), Community & Social Service (23 | 6.6%), and Education Instruction & Library (23 | 6.6%).
Management, Business, Science and Arts Occupations by Sex
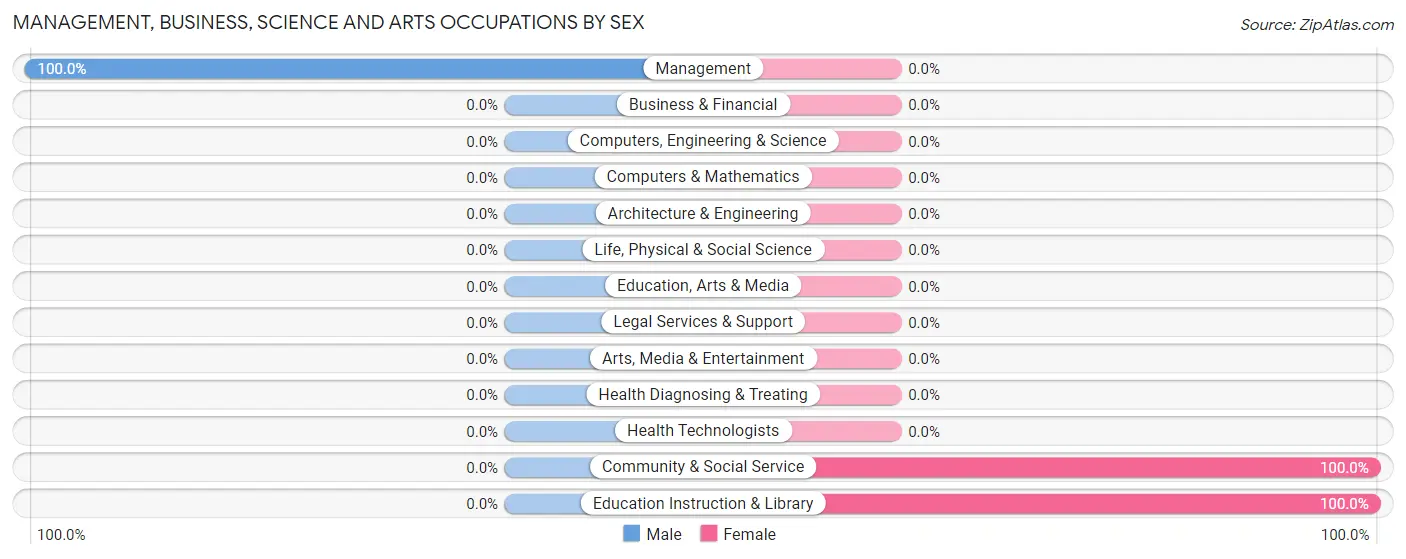
| Occupation | Male | Female |
| Management | 23 (100.0%) | 0 (0.0%) |
| Business & Financial | 0 (0.0%) | 0 (0.0%) |
| Computers, Engineering & Science | 0 (0.0%) | 0 (0.0%) |
| Computers & Mathematics | 0 (0.0%) | 0 (0.0%) |
| Architecture & Engineering | 0 (0.0%) | 0 (0.0%) |
| Life, Physical & Social Science | 0 (0.0%) | 0 (0.0%) |
| Community & Social Service | 0 (0.0%) | 23 (100.0%) |
| Education, Arts & Media | 0 (0.0%) | 0 (0.0%) |
| Legal Services & Support | 0 (0.0%) | 0 (0.0%) |
| Education Instruction & Library | 0 (0.0%) | 23 (100.0%) |
| Arts, Media & Entertainment | 0 (0.0%) | 0 (0.0%) |
| Health Diagnosing & Treating | 0 (0.0%) | 0 (0.0%) |
| Health Technologists | 0 (0.0%) | 0 (0.0%) |
| Total (Category) | 23 (50.0%) | 23 (50.0%) |
| Total (Overall) | 246 (70.7%) | 102 (29.3%) |
Services Occupations
The most common Services occupations in Salem are Healthcare Support (42 | 12.1%), and Cleaning & Maintenance (25 | 7.2%).
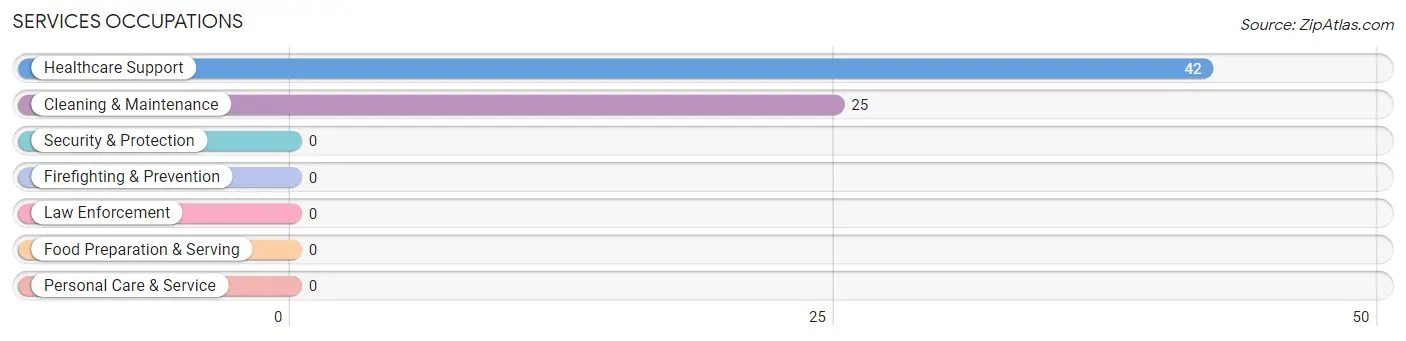
Services Occupations by Sex
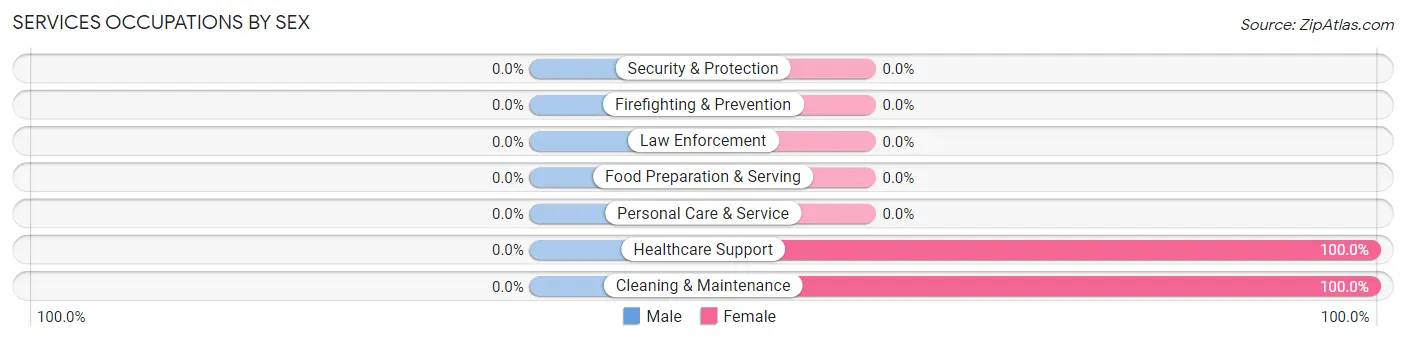
| Occupation | Male | Female |
| Healthcare Support | 0 (0.0%) | 42 (100.0%) |
| Security & Protection | 0 (0.0%) | 0 (0.0%) |
| Firefighting & Prevention | 0 (0.0%) | 0 (0.0%) |
| Law Enforcement | 0 (0.0%) | 0 (0.0%) |
| Food Preparation & Serving | 0 (0.0%) | 0 (0.0%) |
| Cleaning & Maintenance | 0 (0.0%) | 25 (100.0%) |
| Personal Care & Service | 0 (0.0%) | 0 (0.0%) |
| Total (Category) | 0 (0.0%) | 67 (100.0%) |
| Total (Overall) | 246 (70.7%) | 102 (29.3%) |
Sales and Office Occupations
Sales and Office Occupations by Sex
| Occupation | Male | Female |
| Sales & Related | 0 (0.0%) | 0 (0.0%) |
| Office & Administration | 0 (0.0%) | 0 (0.0%) |
| Total (Category) | 0 (0.0%) | 0 (0.0%) |
| Total (Overall) | 246 (70.7%) | 102 (29.3%) |
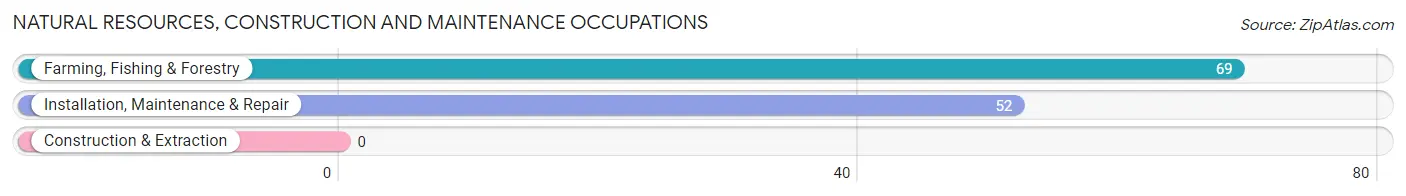
Natural Resources, Construction and Maintenance Occupations
The most common Natural Resources, Construction and Maintenance occupations in Salem are Farming, Fishing & Forestry (69 | 19.8%), and Installation, Maintenance & Repair (52 | 14.9%).
Natural Resources, Construction and Maintenance Occupations by Sex
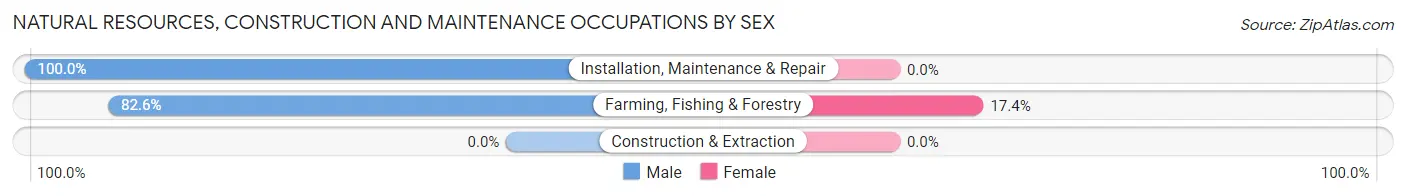
| Occupation | Male | Female |
| Farming, Fishing & Forestry | 57 (82.6%) | 12 (17.4%) |
| Construction & Extraction | 0 (0.0%) | 0 (0.0%) |
| Installation, Maintenance & Repair | 52 (100.0%) | 0 (0.0%) |
| Total (Category) | 109 (90.1%) | 12 (9.9%) |
| Total (Overall) | 246 (70.7%) | 102 (29.3%) |
Production, Transportation and Moving Occupations
The most common Production, Transportation and Moving occupations in Salem are Material Moving (49 | 14.1%), Production (34 | 9.8%), and Transportation (31 | 8.9%).
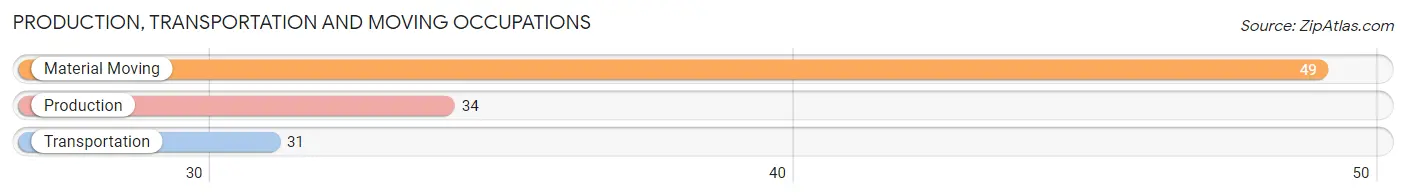
Production, Transportation and Moving Occupations by Sex
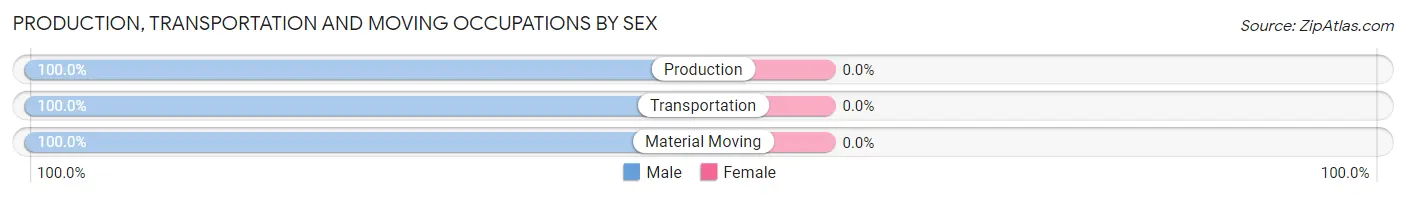
| Occupation | Male | Female |
| Production | 34 (100.0%) | 0 (0.0%) |
| Transportation | 31 (100.0%) | 0 (0.0%) |
| Material Moving | 49 (100.0%) | 0 (0.0%) |
| Total (Category) | 114 (100.0%) | 0 (0.0%) |
| Total (Overall) | 246 (70.7%) | 102 (29.3%) |
Employment Industries by Sex in Salem
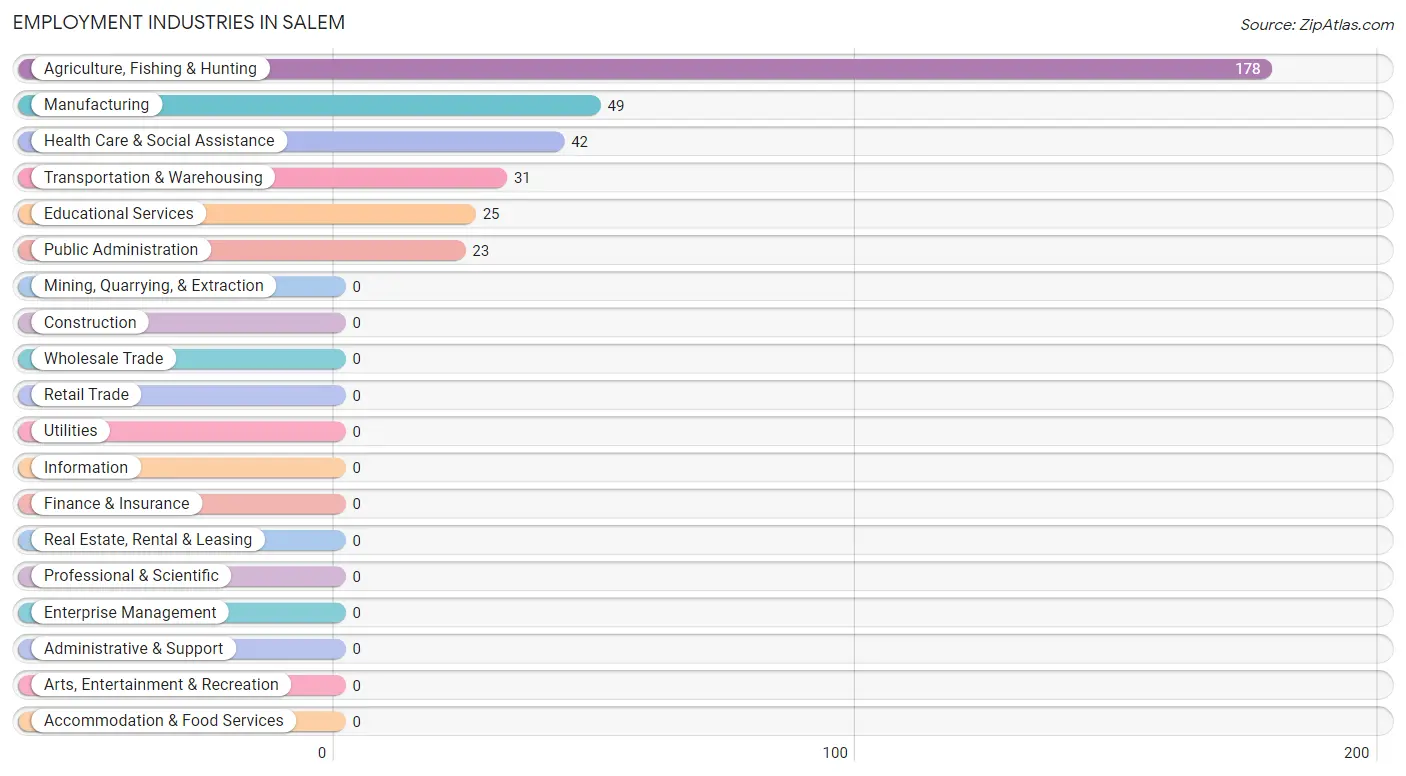
Employment Industries in Salem
The major employment industries in Salem include Agriculture, Fishing & Hunting (178 | 51.1%), Manufacturing (49 | 14.1%), Health Care & Social Assistance (42 | 12.1%), Transportation & Warehousing (31 | 8.9%), and Educational Services (25 | 7.2%).
Employment Industries by Sex in Salem
The Salem industries that see more men than women are Manufacturing (100.0%), Transportation & Warehousing (100.0%), and Agriculture, Fishing & Hunting (93.3%), whereas the industries that tend to have a higher number of women are Educational Services (100.0%), Health Care & Social Assistance (100.0%), and Public Administration (100.0%).
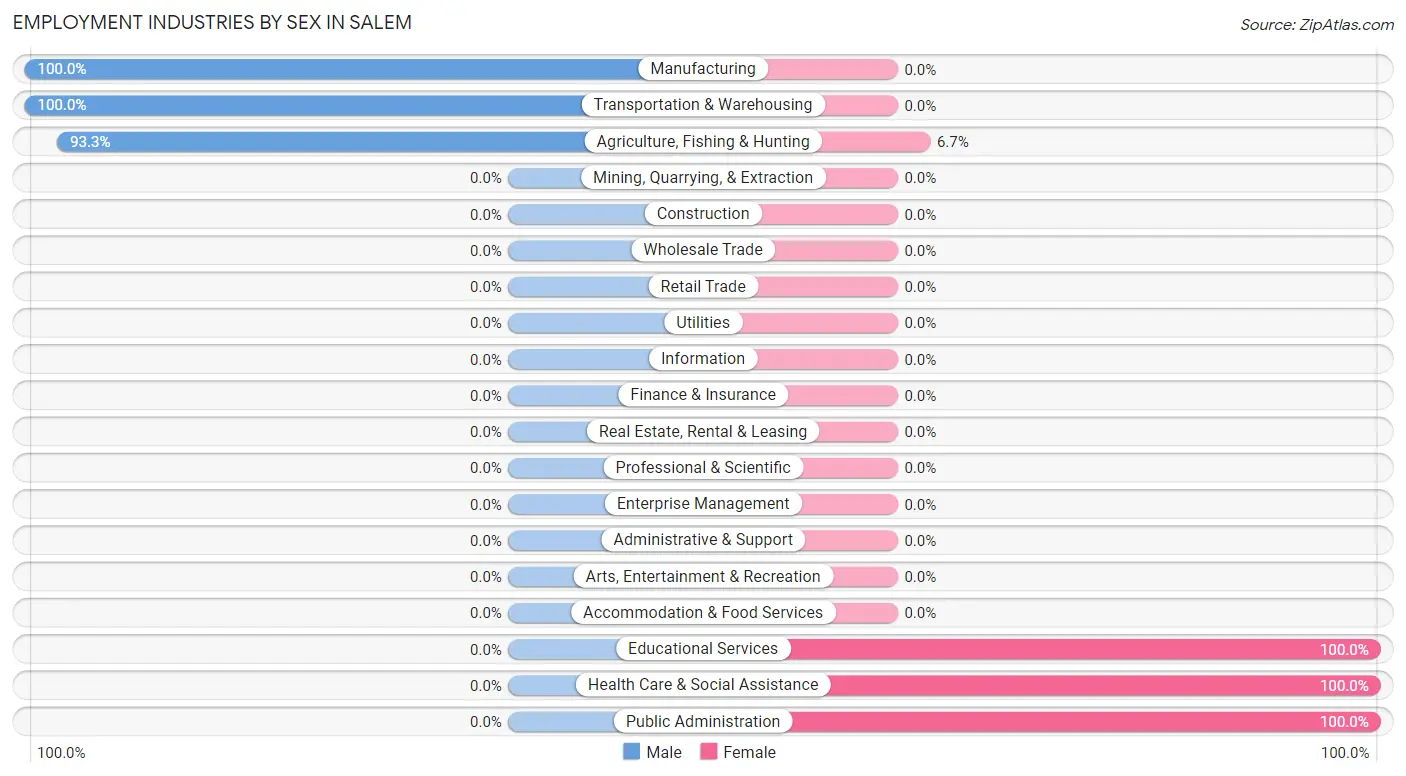
| Industry | Male | Female |
| Agriculture, Fishing & Hunting | 166 (93.3%) | 12 (6.7%) |
| Mining, Quarrying, & Extraction | 0 (0.0%) | 0 (0.0%) |
| Construction | 0 (0.0%) | 0 (0.0%) |
| Manufacturing | 49 (100.0%) | 0 (0.0%) |
| Wholesale Trade | 0 (0.0%) | 0 (0.0%) |
| Retail Trade | 0 (0.0%) | 0 (0.0%) |
| Transportation & Warehousing | 31 (100.0%) | 0 (0.0%) |
| Utilities | 0 (0.0%) | 0 (0.0%) |
| Information | 0 (0.0%) | 0 (0.0%) |
| Finance & Insurance | 0 (0.0%) | 0 (0.0%) |
| Real Estate, Rental & Leasing | 0 (0.0%) | 0 (0.0%) |
| Professional & Scientific | 0 (0.0%) | 0 (0.0%) |
| Enterprise Management | 0 (0.0%) | 0 (0.0%) |
| Administrative & Support | 0 (0.0%) | 0 (0.0%) |
| Educational Services | 0 (0.0%) | 25 (100.0%) |
| Health Care & Social Assistance | 0 (0.0%) | 42 (100.0%) |
| Arts, Entertainment & Recreation | 0 (0.0%) | 0 (0.0%) |
| Accommodation & Food Services | 0 (0.0%) | 0 (0.0%) |
| Public Administration | 0 (0.0%) | 23 (100.0%) |
| Total | 246 (70.7%) | 102 (29.3%) |
Education in Salem
School Enrollment in Salem
The most common levels of schooling among the 309 students in Salem are middle school (135 | 43.7%), college / undergraduate (60 | 19.4%), and nursery / preschool (47 | 15.2%).
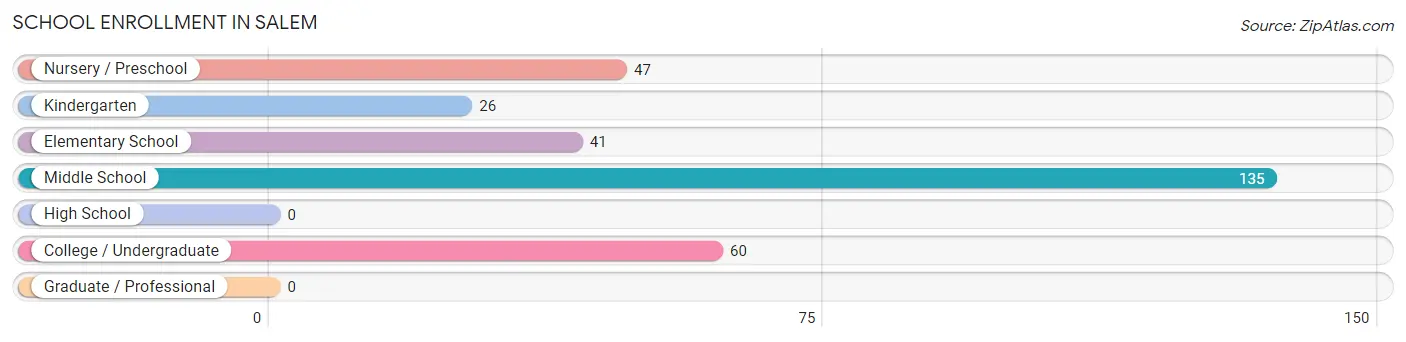
| School Level | # Students | % Students |
| Nursery / Preschool | 47 | 15.2% |
| Kindergarten | 26 | 8.4% |
| Elementary School | 41 | 13.3% |
| Middle School | 135 | 43.7% |
| High School | 0 | 0.0% |
| College / Undergraduate | 60 | 19.4% |
| Graduate / Professional | 0 | 0.0% |
| Total | 309 | 100.0% |
School Enrollment by Age by Funding Source in Salem
Out of a total of 309 students who are enrolled in schools in Salem, 73 (23.6%) attend a private institution, while the remaining 236 (76.4%) are enrolled in public schools. The age group of 18 to 19 year olds has the highest likelihood of being enrolled in private schools, with 60 (100.0% in the age bracket) enrolled. Conversely, the age group of 10 to 14 year olds has the lowest likelihood of being enrolled in a private school, with 135 (100.0% in the age bracket) attending a public institution.
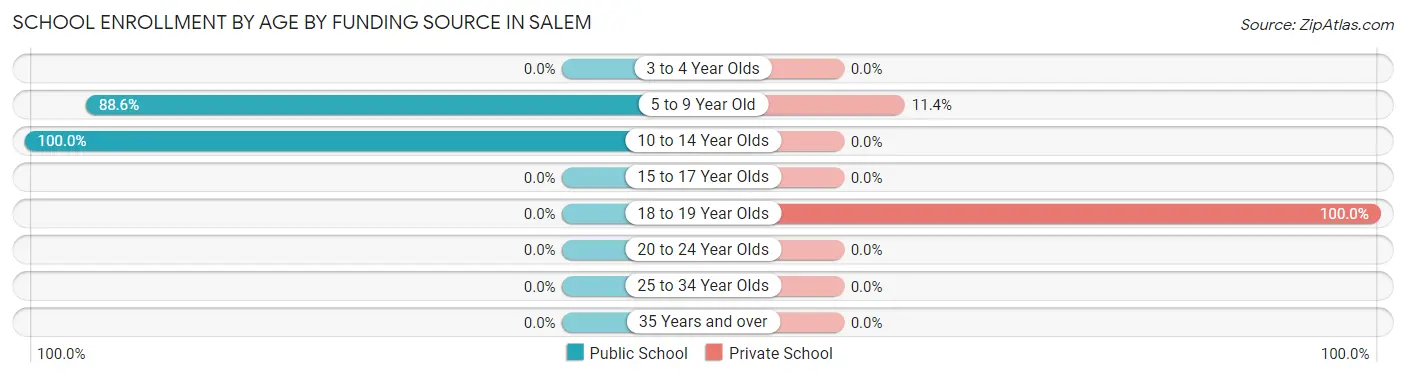
| Age Bracket | Public School | Private School |
| 3 to 4 Year Olds | 0 (0.0%) | 0 (0.0%) |
| 5 to 9 Year Old | 101 (88.6%) | 13 (11.4%) |
| 10 to 14 Year Olds | 135 (100.0%) | 0 (0.0%) |
| 15 to 17 Year Olds | 0 (0.0%) | 0 (0.0%) |
| 18 to 19 Year Olds | 0 (0.0%) | 60 (100.0%) |
| 20 to 24 Year Olds | 0 (0.0%) | 0 (0.0%) |
| 25 to 34 Year Olds | 0 (0.0%) | 0 (0.0%) |
| 35 Years and over | 0 (0.0%) | 0 (0.0%) |
| Total | 236 (76.4%) | 73 (23.6%) |
Educational Attainment by Field of Study in Salem
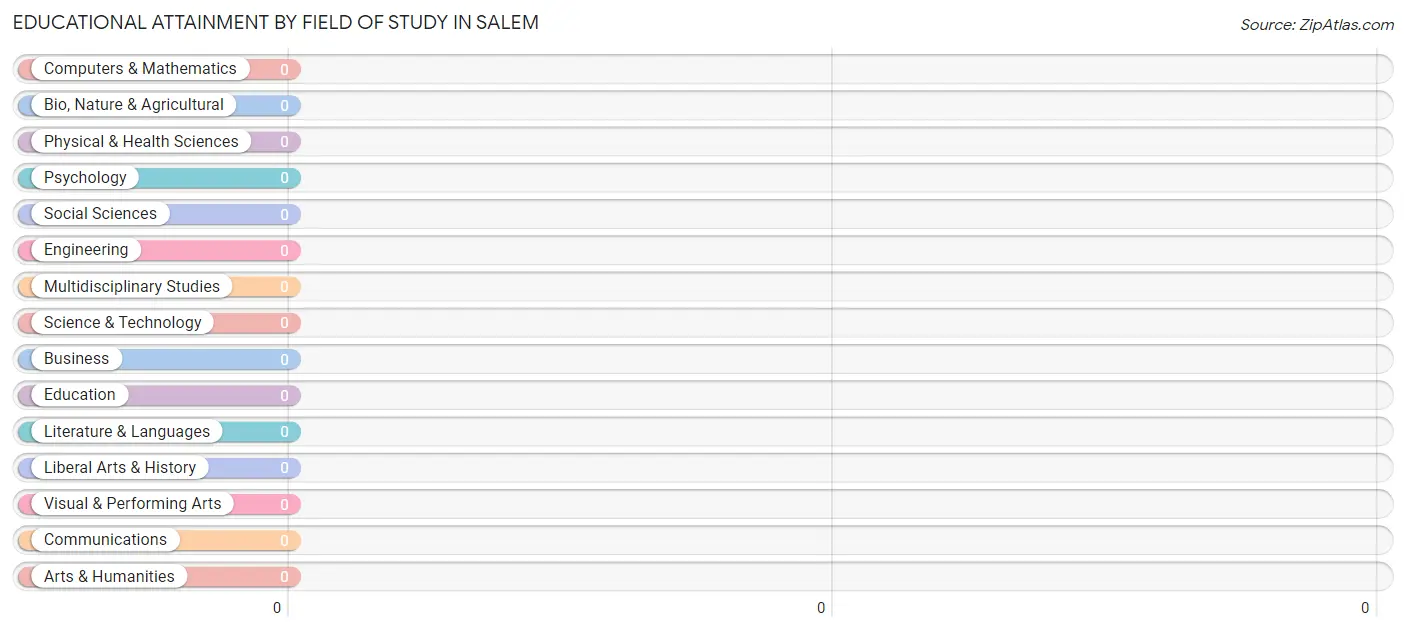
| Field of Study | # Graduates | % Graduates |
| Computers & Mathematics | 0 | 0.0% |
| Bio, Nature & Agricultural | 0 | 0.0% |
| Physical & Health Sciences | 0 | 0.0% |
| Psychology | 0 | 0.0% |
| Social Sciences | 0 | 0.0% |
| Engineering | 0 | 0.0% |
| Multidisciplinary Studies | 0 | 0.0% |
| Science & Technology | 0 | 0.0% |
| Business | 0 | 0.0% |
| Education | 0 | 0.0% |
| Literature & Languages | 0 | 0.0% |
| Liberal Arts & History | 0 | 0.0% |
| Visual & Performing Arts | 0 | 0.0% |
| Communications | 0 | 0.0% |
| Arts & Humanities | 0 | 0.0% |
| Total | 0 | 0.0% |
Transportation & Commute in Salem
Vehicle Availability by Sex in Salem
The most prevalent vehicle ownership categories in Salem are males with 4 vehicles (164, accounting for 66.7%) and females with 4 vehicles (12, making up 160.8%).
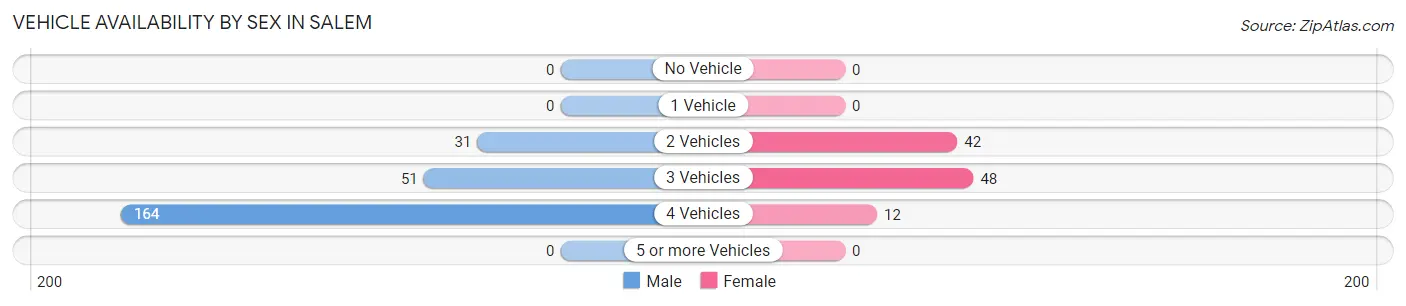
| Vehicles Available | Male | Female |
| No Vehicle | 0 (0.0%) | 0 (0.0%) |
| 1 Vehicle | 0 (0.0%) | 0 (0.0%) |
| 2 Vehicles | 31 (12.6%) | 42 (41.2%) |
| 3 Vehicles | 51 (20.7%) | 48 (47.1%) |
| 4 Vehicles | 164 (66.7%) | 12 (11.8%) |
| 5 or more Vehicles | 0 (0.0%) | 0 (0.0%) |
| Total | 246 (100.0%) | 102 (100.0%) |
Commute Time in Salem
The most frequently occuring commute durations in Salem are 30 to 34 minutes (114 commuters, 32.8%), 60 to 89 minutes (83 commuters, 23.8%), and 25 to 29 minutes (49 commuters, 14.1%).
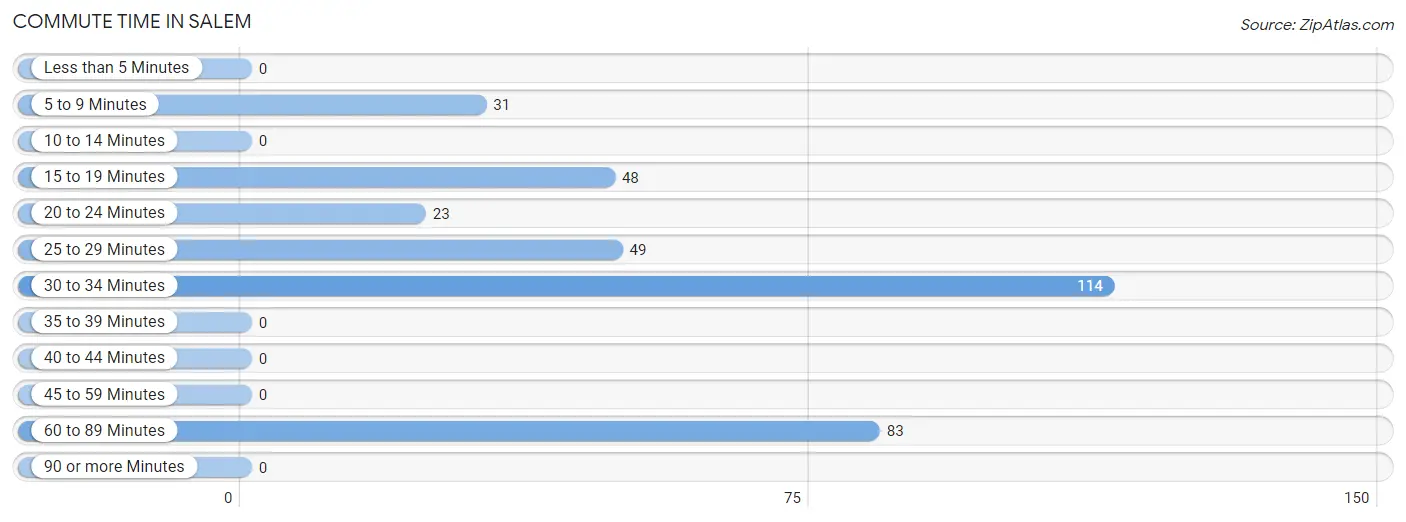
| Commute Time | # Commuters | % Commuters |
| Less than 5 Minutes | 0 | 0.0% |
| 5 to 9 Minutes | 31 | 8.9% |
| 10 to 14 Minutes | 0 | 0.0% |
| 15 to 19 Minutes | 48 | 13.8% |
| 20 to 24 Minutes | 23 | 6.6% |
| 25 to 29 Minutes | 49 | 14.1% |
| 30 to 34 Minutes | 114 | 32.8% |
| 35 to 39 Minutes | 0 | 0.0% |
| 40 to 44 Minutes | 0 | 0.0% |
| 45 to 59 Minutes | 0 | 0.0% |
| 60 to 89 Minutes | 83 | 23.8% |
| 90 or more Minutes | 0 | 0.0% |
Commute Time by Sex in Salem
The most common commute times in Salem are 30 to 34 minutes (114 commuters, 46.3%) for males and 60 to 89 minutes (54 commuters, 52.9%) for females.
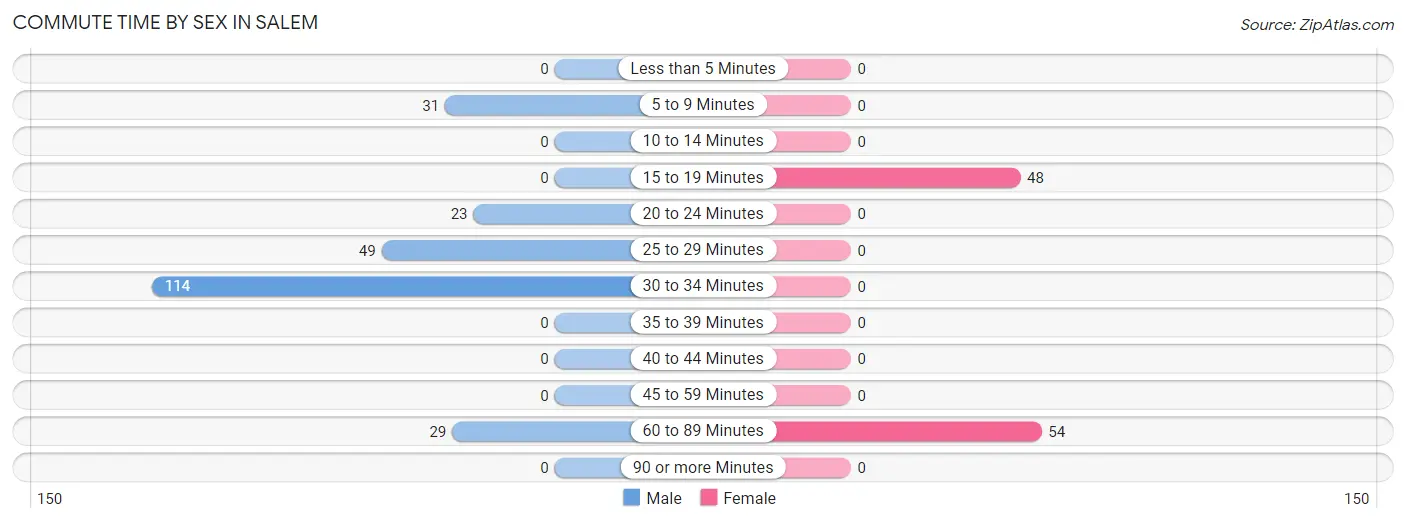
| Commute Time | Male | Female |
| Less than 5 Minutes | 0 (0.0%) | 0 (0.0%) |
| 5 to 9 Minutes | 31 (12.6%) | 0 (0.0%) |
| 10 to 14 Minutes | 0 (0.0%) | 0 (0.0%) |
| 15 to 19 Minutes | 0 (0.0%) | 48 (47.1%) |
| 20 to 24 Minutes | 23 (9.3%) | 0 (0.0%) |
| 25 to 29 Minutes | 49 (19.9%) | 0 (0.0%) |
| 30 to 34 Minutes | 114 (46.3%) | 0 (0.0%) |
| 35 to 39 Minutes | 0 (0.0%) | 0 (0.0%) |
| 40 to 44 Minutes | 0 (0.0%) | 0 (0.0%) |
| 45 to 59 Minutes | 0 (0.0%) | 0 (0.0%) |
| 60 to 89 Minutes | 29 (11.8%) | 54 (52.9%) |
| 90 or more Minutes | 0 (0.0%) | 0 (0.0%) |
Time of Departure to Work by Sex in Salem
The most frequent times of departure to work in Salem are 6:30 AM to 6:59 AM (77, 31.3%) for males and 7:00 AM to 7:29 AM (65, 63.7%) for females.
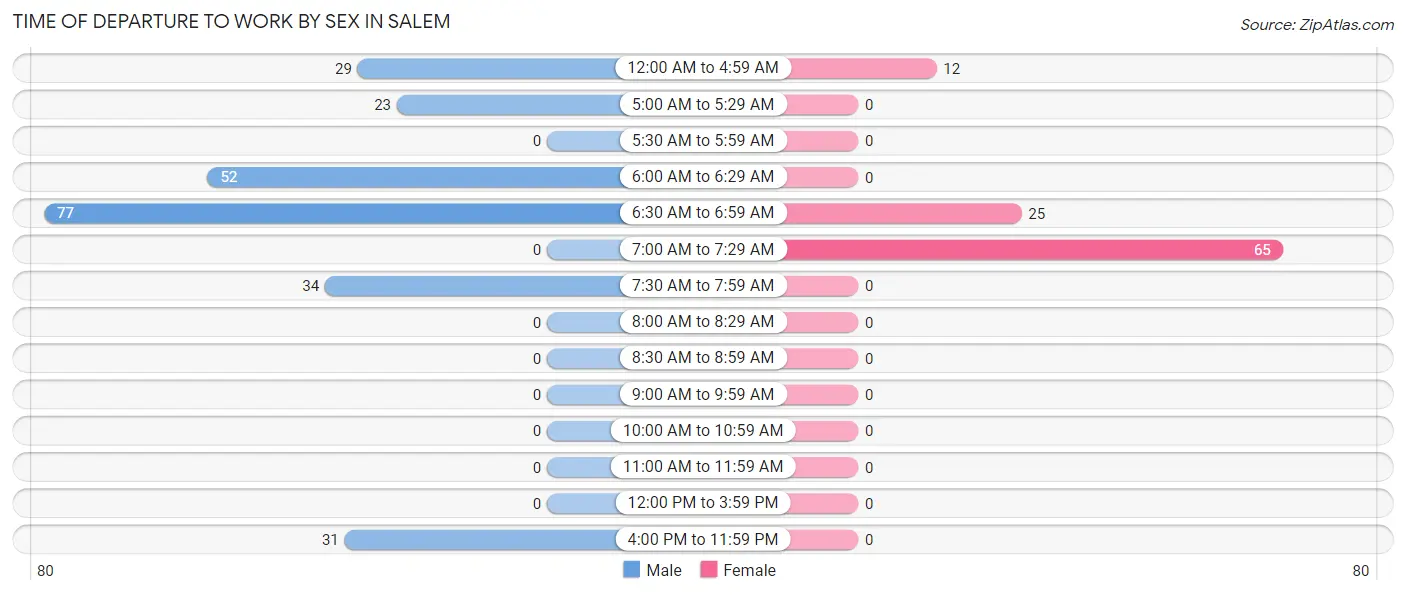
| Time of Departure | Male | Female |
| 12:00 AM to 4:59 AM | 29 (11.8%) | 12 (11.8%) |
| 5:00 AM to 5:29 AM | 23 (9.3%) | 0 (0.0%) |
| 5:30 AM to 5:59 AM | 0 (0.0%) | 0 (0.0%) |
| 6:00 AM to 6:29 AM | 52 (21.1%) | 0 (0.0%) |
| 6:30 AM to 6:59 AM | 77 (31.3%) | 25 (24.5%) |
| 7:00 AM to 7:29 AM | 0 (0.0%) | 65 (63.7%) |
| 7:30 AM to 7:59 AM | 34 (13.8%) | 0 (0.0%) |
| 8:00 AM to 8:29 AM | 0 (0.0%) | 0 (0.0%) |
| 8:30 AM to 8:59 AM | 0 (0.0%) | 0 (0.0%) |
| 9:00 AM to 9:59 AM | 0 (0.0%) | 0 (0.0%) |
| 10:00 AM to 10:59 AM | 0 (0.0%) | 0 (0.0%) |
| 11:00 AM to 11:59 AM | 0 (0.0%) | 0 (0.0%) |
| 12:00 PM to 3:59 PM | 0 (0.0%) | 0 (0.0%) |
| 4:00 PM to 11:59 PM | 31 (12.6%) | 0 (0.0%) |
| Total | 246 (100.0%) | 102 (100.0%) |
Housing Occupancy in Salem
Occupancy by Ownership in Salem
Of the total 252 dwellings in Salem, owner-occupied units account for 175 (69.4%), while renter-occupied units make up 77 (30.6%).
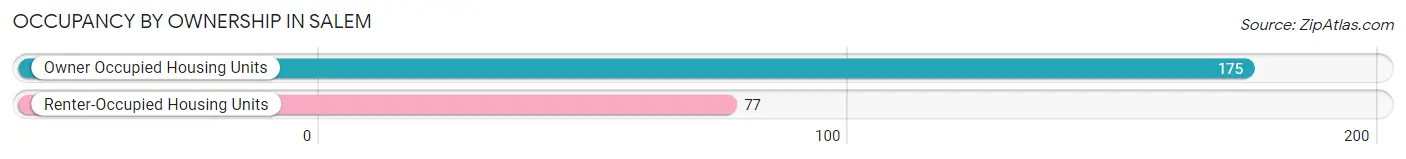
| Occupancy | # Housing Units | % Housing Units |
| Owner Occupied Housing Units | 175 | 69.4% |
| Renter-Occupied Housing Units | 77 | 30.6% |
| Total Occupied Housing Units | 252 | 100.0% |
Occupancy by Household Size in Salem
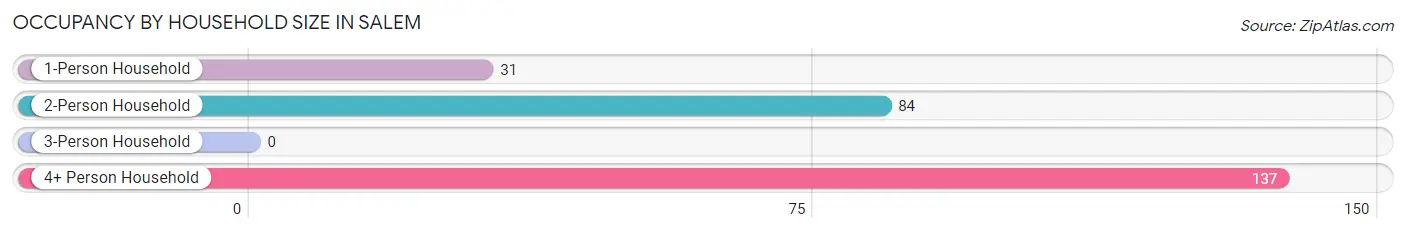
| Household Size | # Housing Units | % Housing Units |
| 1-Person Household | 31 | 12.3% |
| 2-Person Household | 84 | 33.3% |
| 3-Person Household | 0 | 0.0% |
| 4+ Person Household | 137 | 54.4% |
| Total Housing Units | 252 | 100.0% |
Occupancy by Ownership by Household Size in Salem
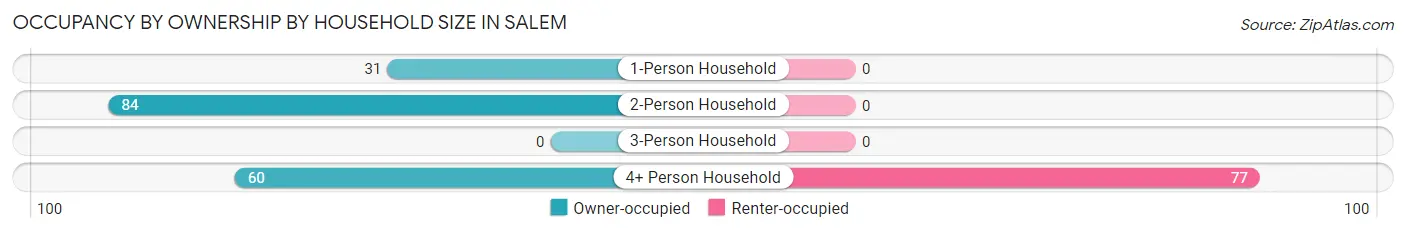
| Household Size | Owner-occupied | Renter-occupied |
| 1-Person Household | 31 (100.0%) | 0 (0.0%) |
| 2-Person Household | 84 (100.0%) | 0 (0.0%) |
| 3-Person Household | 0 (0.0%) | 0 (0.0%) |
| 4+ Person Household | 60 (43.8%) | 77 (56.2%) |
| Total Housing Units | 175 (69.4%) | 77 (30.6%) |
Occupancy by Educational Attainment in Salem
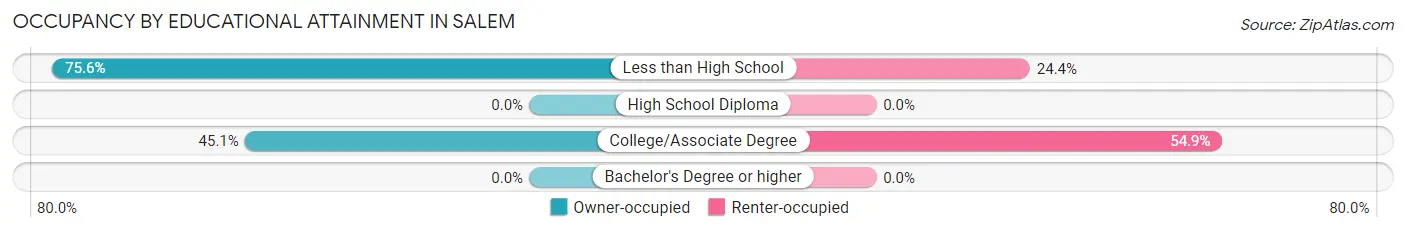
| Household Size | Owner-occupied | Renter-occupied |
| Less than High School | 152 (75.6%) | 49 (24.4%) |
| High School Diploma | 0 (0.0%) | 0 (0.0%) |
| College/Associate Degree | 23 (45.1%) | 28 (54.9%) |
| Bachelor's Degree or higher | 0 (0.0%) | 0 (0.0%) |
Occupancy by Age of Householder in Salem
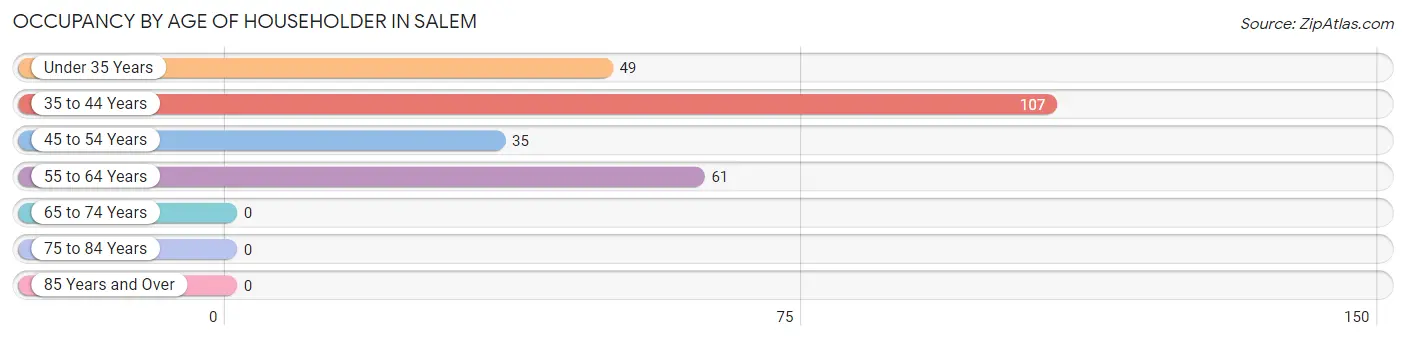
| Age Bracket | # Households | % Households |
| Under 35 Years | 49 | 19.4% |
| 35 to 44 Years | 107 | 42.5% |
| 45 to 54 Years | 35 | 13.9% |
| 55 to 64 Years | 61 | 24.2% |
| 65 to 74 Years | 0 | 0.0% |
| 75 to 84 Years | 0 | 0.0% |
| 85 Years and Over | 0 | 0.0% |
| Total | 252 | 100.0% |
Housing Finances in Salem
Median Income by Occupancy in Salem
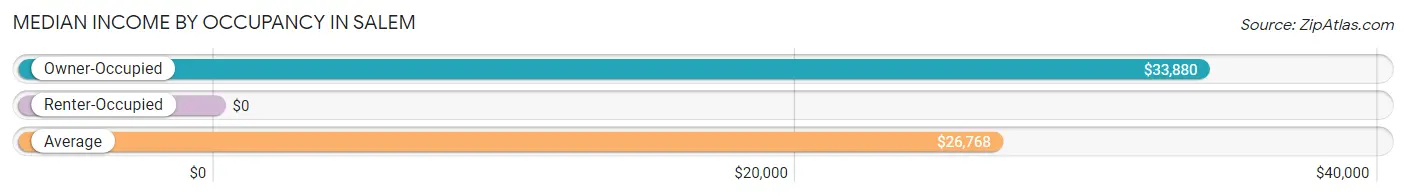
| Occupancy Type | # Households | Median Income |
| Owner-Occupied | 175 (69.4%) | $33,880 |
| Renter-Occupied | 77 (30.6%) | $0 |
| Average | 252 (100.0%) | $26,768 |
Occupancy by Householder Income Bracket in Salem
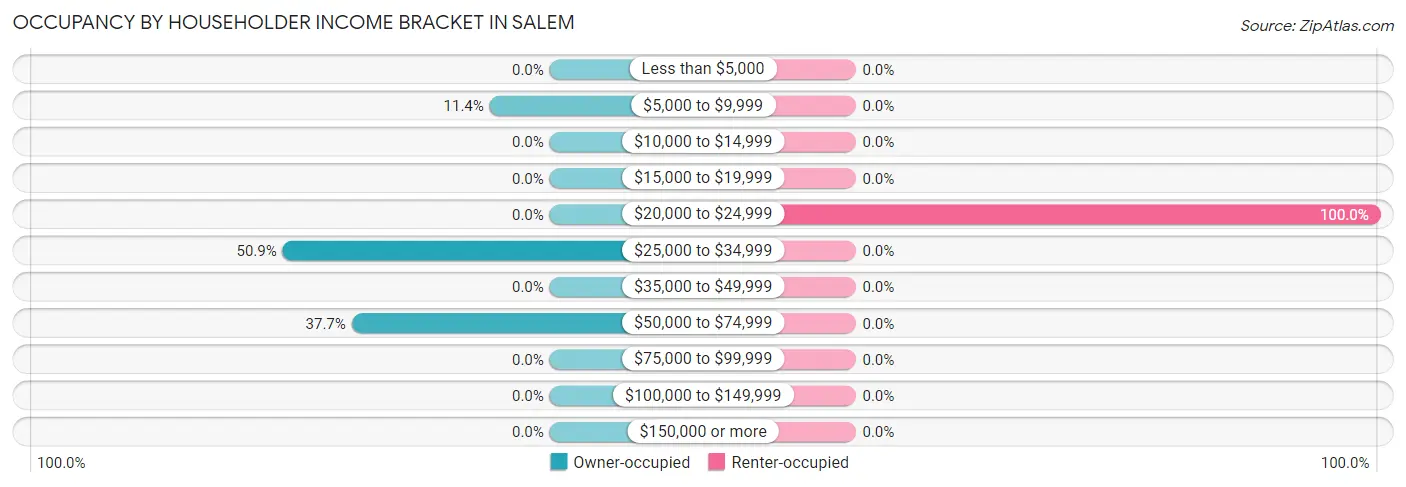
| Income Bracket | Owner-occupied | Renter-occupied |
| Less than $5,000 | 0 (0.0%) | 0 (0.0%) |
| $5,000 to $9,999 | 20 (11.4%) | 0 (0.0%) |
| $10,000 to $14,999 | 0 (0.0%) | 0 (0.0%) |
| $15,000 to $19,999 | 0 (0.0%) | 0 (0.0%) |
| $20,000 to $24,999 | 0 (0.0%) | 77 (100.0%) |
| $25,000 to $34,999 | 89 (50.9%) | 0 (0.0%) |
| $35,000 to $49,999 | 0 (0.0%) | 0 (0.0%) |
| $50,000 to $74,999 | 66 (37.7%) | 0 (0.0%) |
| $75,000 to $99,999 | 0 (0.0%) | 0 (0.0%) |
| $100,000 to $149,999 | 0 (0.0%) | 0 (0.0%) |
| $150,000 or more | 0 (0.0%) | 0 (0.0%) |
| Total | 175 (100.0%) | 77 (100.0%) |
Monthly Housing Cost Tiers in Salem
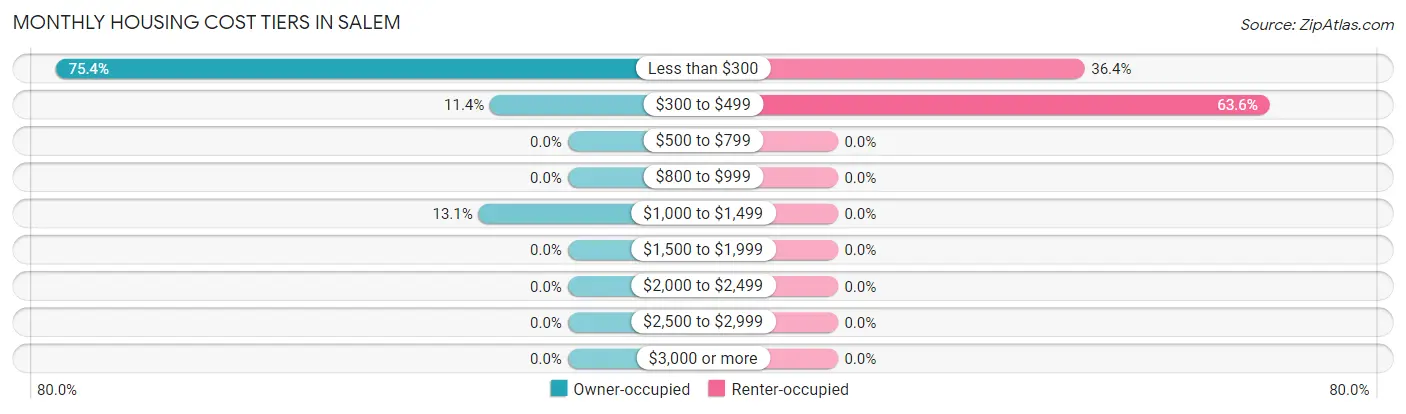
| Monthly Cost | Owner-occupied | Renter-occupied |
| Less than $300 | 132 (75.4%) | 28 (36.4%) |
| $300 to $499 | 20 (11.4%) | 49 (63.6%) |
| $500 to $799 | 0 (0.0%) | 0 (0.0%) |
| $800 to $999 | 0 (0.0%) | 0 (0.0%) |
| $1,000 to $1,499 | 23 (13.1%) | 0 (0.0%) |
| $1,500 to $1,999 | 0 (0.0%) | 0 (0.0%) |
| $2,000 to $2,499 | 0 (0.0%) | 0 (0.0%) |
| $2,500 to $2,999 | 0 (0.0%) | 0 (0.0%) |
| $3,000 or more | 0 (0.0%) | 0 (0.0%) |
| Total | 175 (100.0%) | 77 (100.0%) |
Physical Housing Characteristics in Salem
Housing Structures in Salem
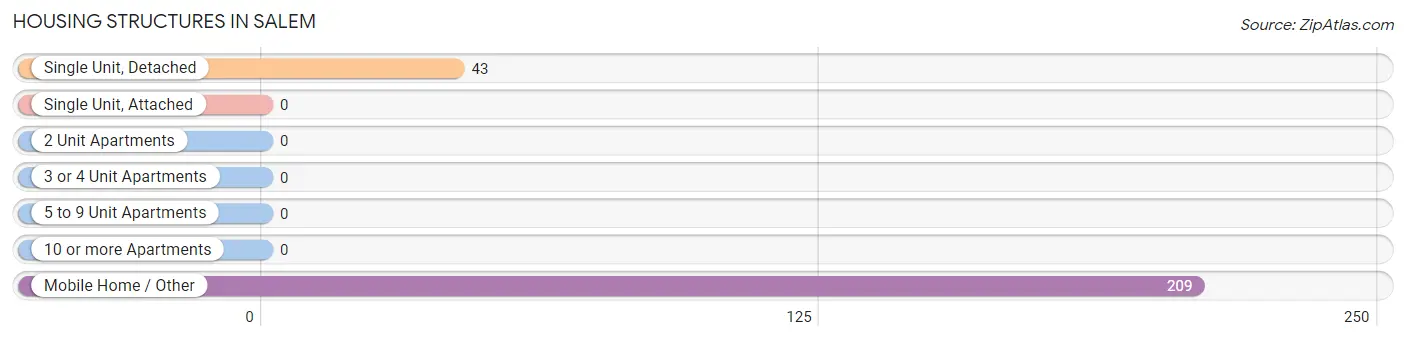
| Structure Type | # Housing Units | % Housing Units |
| Single Unit, Detached | 43 | 17.1% |
| Single Unit, Attached | 0 | 0.0% |
| 2 Unit Apartments | 0 | 0.0% |
| 3 or 4 Unit Apartments | 0 | 0.0% |
| 5 to 9 Unit Apartments | 0 | 0.0% |
| 10 or more Apartments | 0 | 0.0% |
| Mobile Home / Other | 209 | 82.9% |
| Total | 252 | 100.0% |
Housing Structures by Occupancy in Salem
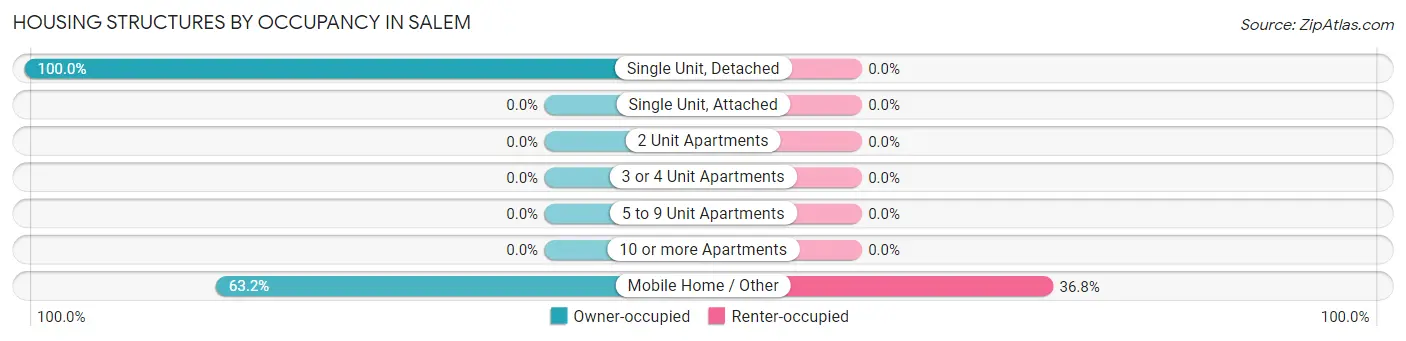
| Structure Type | Owner-occupied | Renter-occupied |
| Single Unit, Detached | 43 (100.0%) | 0 (0.0%) |
| Single Unit, Attached | 0 (0.0%) | 0 (0.0%) |
| 2 Unit Apartments | 0 (0.0%) | 0 (0.0%) |
| 3 or 4 Unit Apartments | 0 (0.0%) | 0 (0.0%) |
| 5 to 9 Unit Apartments | 0 (0.0%) | 0 (0.0%) |
| 10 or more Apartments | 0 (0.0%) | 0 (0.0%) |
| Mobile Home / Other | 132 (63.2%) | 77 (36.8%) |
| Total | 175 (69.4%) | 77 (30.6%) |
Housing Structures by Number of Rooms in Salem
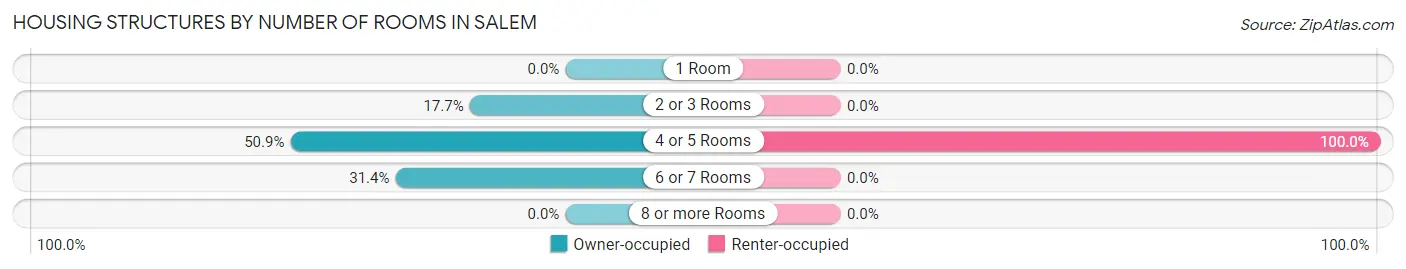
| Number of Rooms | Owner-occupied | Renter-occupied |
| 1 Room | 0 (0.0%) | 0 (0.0%) |
| 2 or 3 Rooms | 31 (17.7%) | 0 (0.0%) |
| 4 or 5 Rooms | 89 (50.9%) | 77 (100.0%) |
| 6 or 7 Rooms | 55 (31.4%) | 0 (0.0%) |
| 8 or more Rooms | 0 (0.0%) | 0 (0.0%) |
| Total | 175 (100.0%) | 77 (100.0%) |
Housing Structure by Heating Type in Salem
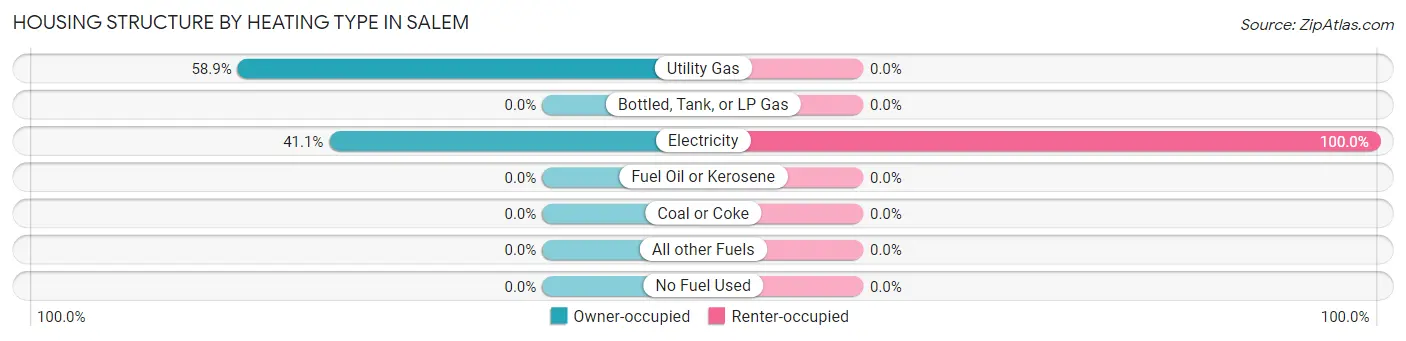
| Heating Type | Owner-occupied | Renter-occupied |
| Utility Gas | 103 (58.9%) | 0 (0.0%) |
| Bottled, Tank, or LP Gas | 0 (0.0%) | 0 (0.0%) |
| Electricity | 72 (41.1%) | 77 (100.0%) |
| Fuel Oil or Kerosene | 0 (0.0%) | 0 (0.0%) |
| Coal or Coke | 0 (0.0%) | 0 (0.0%) |
| All other Fuels | 0 (0.0%) | 0 (0.0%) |
| No Fuel Used | 0 (0.0%) | 0 (0.0%) |
| Total | 175 (100.0%) | 77 (100.0%) |
Household Vehicle Usage in Salem
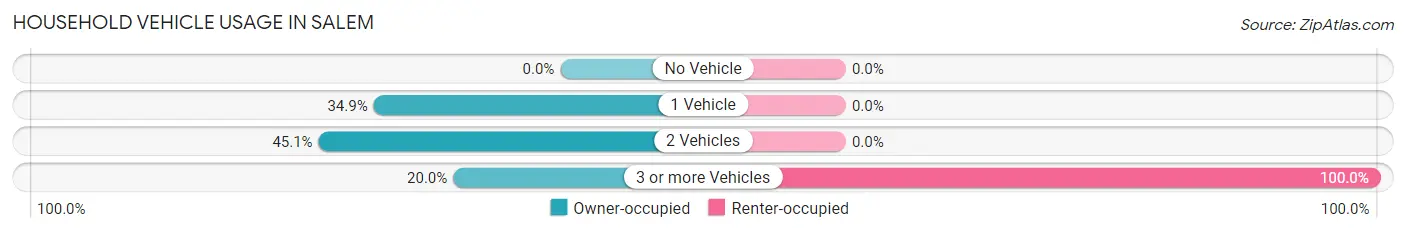
| Vehicles per Household | Owner-occupied | Renter-occupied |
| No Vehicle | 0 (0.0%) | 0 (0.0%) |
| 1 Vehicle | 61 (34.9%) | 0 (0.0%) |
| 2 Vehicles | 79 (45.1%) | 0 (0.0%) |
| 3 or more Vehicles | 35 (20.0%) | 77 (100.0%) |
| Total | 175 (100.0%) | 77 (100.0%) |
Real Estate & Mortgages in Salem
Real Estate and Mortgage Overview in Salem
| Characteristic | Without Mortgage | With Mortgage |
| Housing Units | 175 | 0 |
| Median Property Value | $62,100 | $0 |
| Median Household Income | $33,880 | $0 |
| Monthly Housing Costs | $246 | $0 |
| Real Estate Taxes | - | - |
Property Value by Mortgage Status in Salem
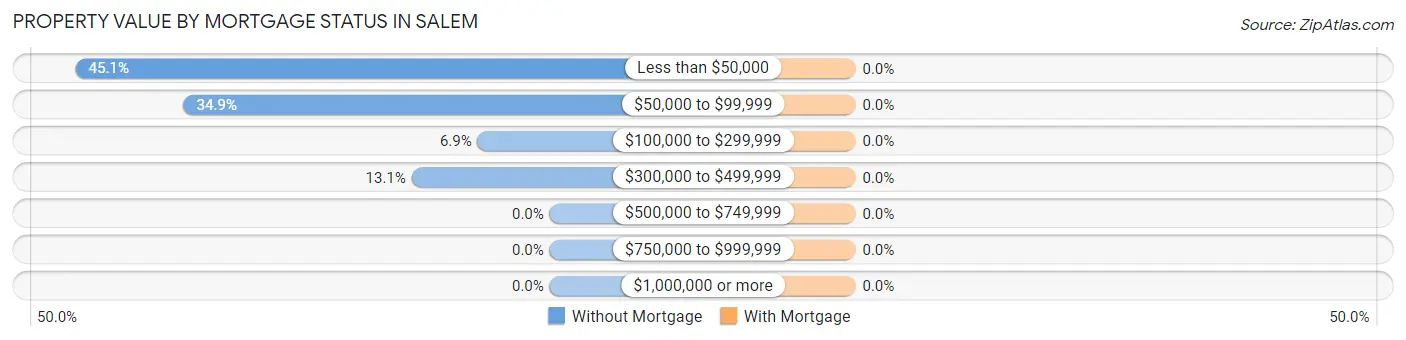
| Property Value | Without Mortgage | With Mortgage |
| Less than $50,000 | 79 (45.1%) | 0 (0.0%) |
| $50,000 to $99,999 | 61 (34.9%) | 0 (0.0%) |
| $100,000 to $299,999 | 12 (6.9%) | 0 (0.0%) |
| $300,000 to $499,999 | 23 (13.1%) | 0 (0.0%) |
| $500,000 to $749,999 | 0 (0.0%) | 0 (0.0%) |
| $750,000 to $999,999 | 0 (0.0%) | 0 (0.0%) |
| $1,000,000 or more | 0 (0.0%) | 0 (0.0%) |
| Total | 175 (100.0%) | 0 (0.0%) |
Household Income by Mortgage Status in Salem
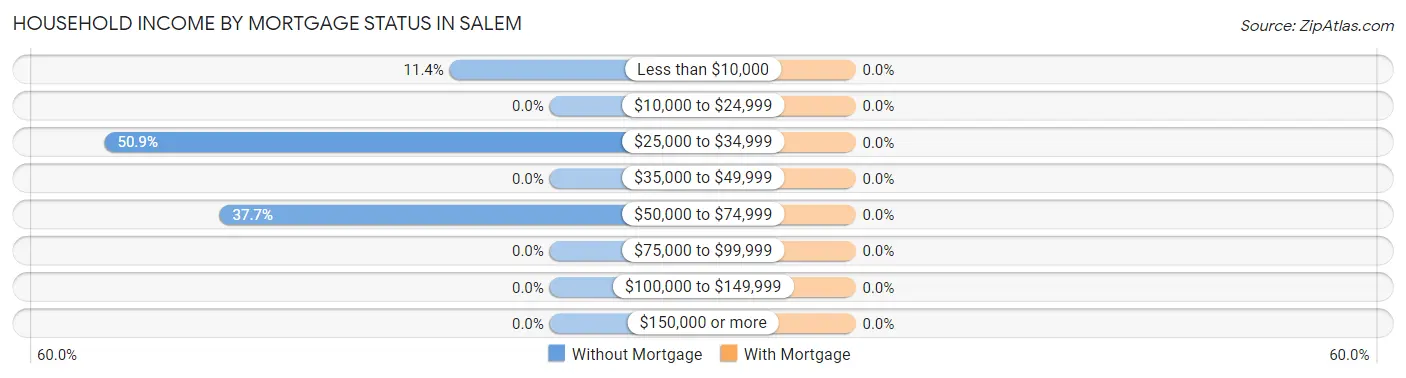
| Household Income | Without Mortgage | With Mortgage |
| Less than $10,000 | 20 (11.4%) | 0 (0.0%) |
| $10,000 to $24,999 | 0 (0.0%) | 0 (0.0%) |
| $25,000 to $34,999 | 89 (50.9%) | 0 (0.0%) |
| $35,000 to $49,999 | 0 (0.0%) | 0 (0.0%) |
| $50,000 to $74,999 | 66 (37.7%) | 0 (0.0%) |
| $75,000 to $99,999 | 0 (0.0%) | 0 (0.0%) |
| $100,000 to $149,999 | 0 (0.0%) | 0 (0.0%) |
| $150,000 or more | 0 (0.0%) | 0 (0.0%) |
| Total | 175 (100.0%) | 0 (0.0%) |
Property Value to Household Income Ratio in Salem
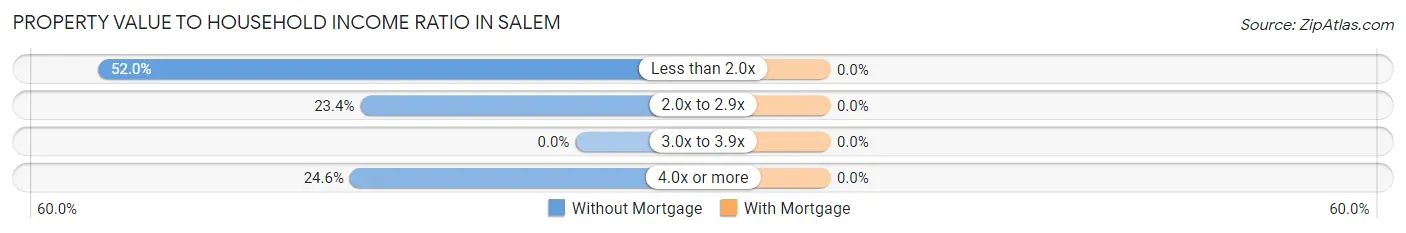
| Value-to-Income Ratio | Without Mortgage | With Mortgage |
| Less than 2.0x | 91 (52.0%) | 0 (0.0%) |
| 2.0x to 2.9x | 41 (23.4%) | 0 (0.0%) |
| 3.0x to 3.9x | 0 (0.0%) | 0 (0.0%) |
| 4.0x or more | 43 (24.6%) | 0 (0.0%) |
| Total | 175 (100.0%) | 0 (0.0%) |
Real Estate Taxes by Mortgage Status in Salem
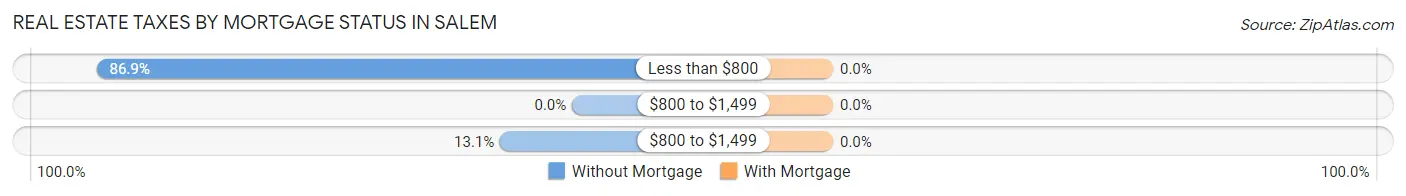
| Property Taxes | Without Mortgage | With Mortgage |
| Less than $800 | 152 (86.9%) | 0 (0.0%) |
| $800 to $1,499 | 0 (0.0%) | 0 (0.0%) |
| $800 to $1,499 | 23 (13.1%) | 0 (0.0%) |
| Total | 175 (100.0%) | 0 (0.0%) |
Health & Disability in Salem
Health Insurance Coverage by Age in Salem
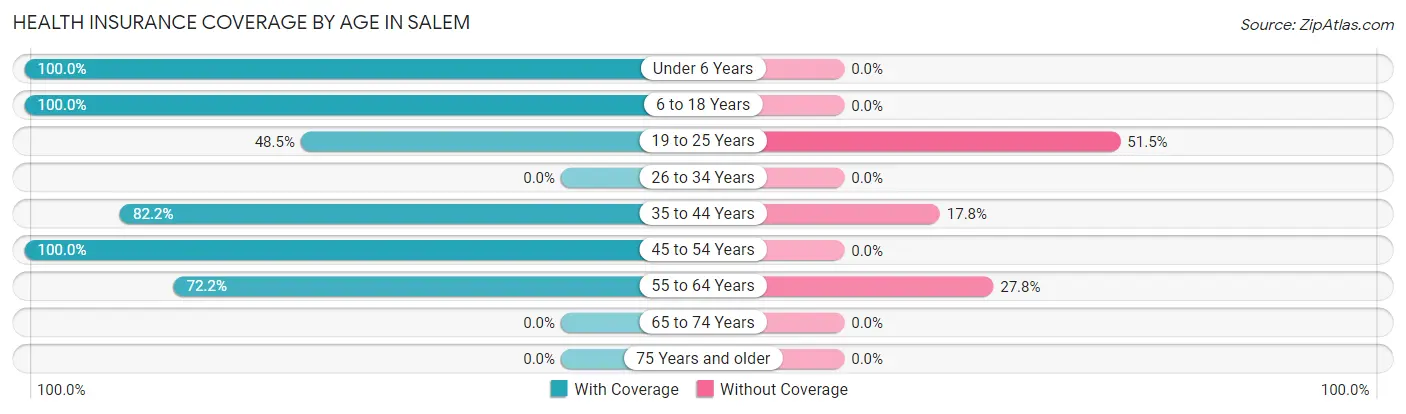
| Age Bracket | With Coverage | Without Coverage |
| Under 6 Years | 73 (100.0%) | 0 (0.0%) |
| 6 to 18 Years | 262 (100.0%) | 0 (0.0%) |
| 19 to 25 Years | 49 (48.5%) | 52 (51.5%) |
| 26 to 34 Years | 0 (0.0%) | 0 (0.0%) |
| 35 to 44 Years | 143 (82.2%) | 31 (17.8%) |
| 45 to 54 Years | 72 (100.0%) | 0 (0.0%) |
| 55 to 64 Years | 117 (72.2%) | 45 (27.8%) |
| 65 to 74 Years | 0 (0.0%) | 0 (0.0%) |
| 75 Years and older | 0 (0.0%) | 0 (0.0%) |
| Total | 716 (84.8%) | 128 (15.2%) |
Health Insurance Coverage by Citizenship Status in Salem
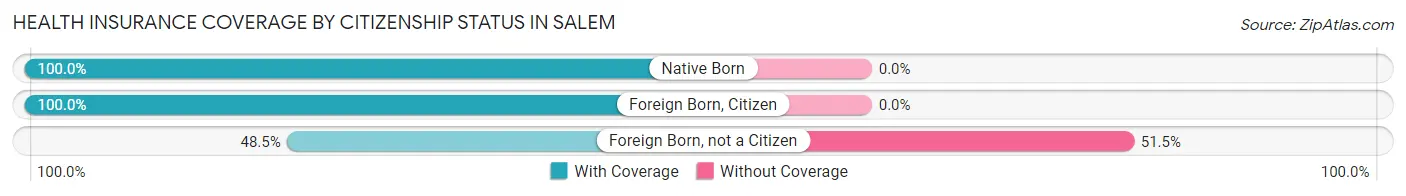
| Citizenship Status | With Coverage | Without Coverage |
| Native Born | 73 (100.0%) | 0 (0.0%) |
| Foreign Born, Citizen | 262 (100.0%) | 0 (0.0%) |
| Foreign Born, not a Citizen | 49 (48.5%) | 52 (51.5%) |
Health Insurance Coverage by Household Income in Salem
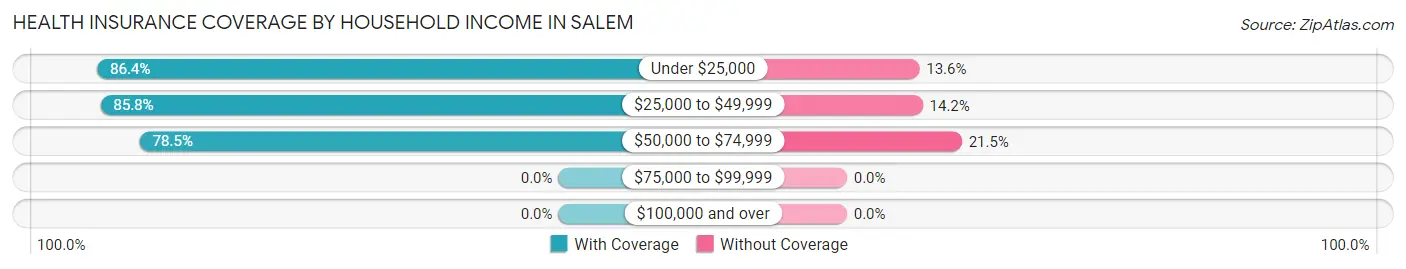
| Household Income | With Coverage | Without Coverage |
| Under $25,000 | 331 (86.4%) | 52 (13.6%) |
| $25,000 to $49,999 | 272 (85.8%) | 45 (14.2%) |
| $50,000 to $74,999 | 113 (78.5%) | 31 (21.5%) |
| $75,000 to $99,999 | 0 (0.0%) | 0 (0.0%) |
| $100,000 and over | 0 (0.0%) | 0 (0.0%) |
Public vs Private Health Insurance Coverage by Age in Salem
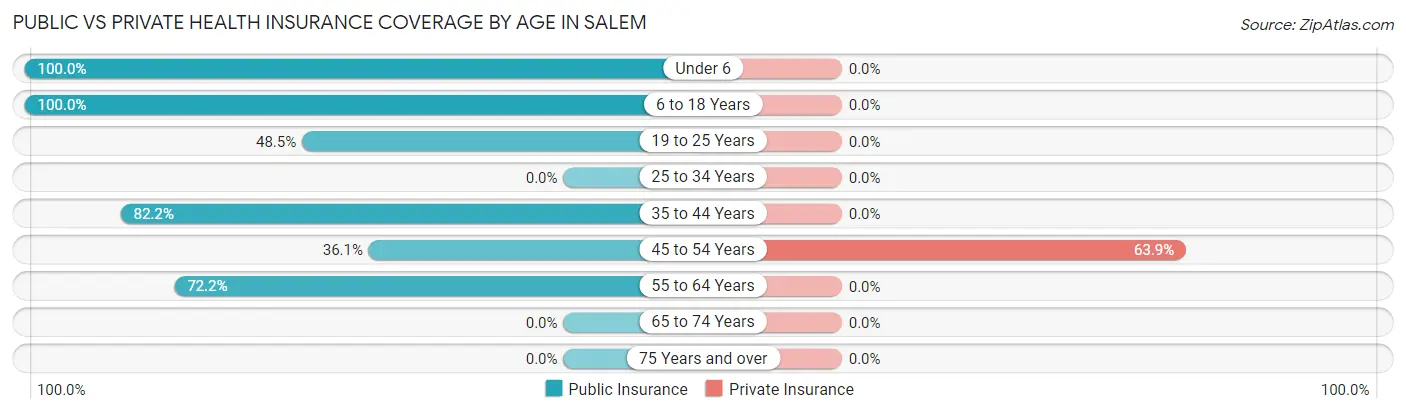
| Age Bracket | Public Insurance | Private Insurance |
| Under 6 | 73 (100.0%) | 0 (0.0%) |
| 6 to 18 Years | 262 (100.0%) | 0 (0.0%) |
| 19 to 25 Years | 49 (48.5%) | 0 (0.0%) |
| 25 to 34 Years | 0 (0.0%) | 0 (0.0%) |
| 35 to 44 Years | 143 (82.2%) | 0 (0.0%) |
| 45 to 54 Years | 26 (36.1%) | 46 (63.9%) |
| 55 to 64 Years | 117 (72.2%) | 0 (0.0%) |
| 65 to 74 Years | 0 (0.0%) | 0 (0.0%) |
| 75 Years and over | 0 (0.0%) | 0 (0.0%) |
| Total | 670 (79.4%) | 46 (5.4%) |
Disability Status by Sex by Age in Salem
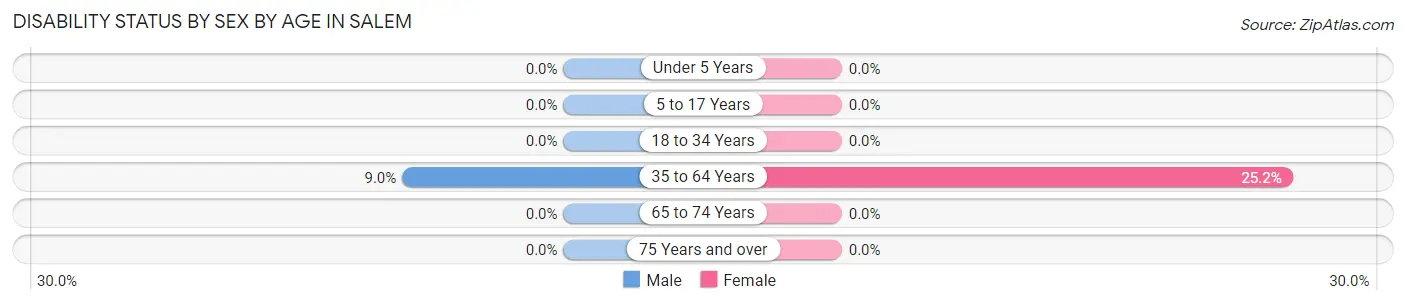
| Age Bracket | Male | Female |
| Under 5 Years | 0 (0.0%) | 0 (0.0%) |
| 5 to 17 Years | 0 (0.0%) | 0 (0.0%) |
| 18 to 34 Years | 0 (0.0%) | 0 (0.0%) |
| 35 to 64 Years | 22 (9.0%) | 41 (25.2%) |
| 65 to 74 Years | 0 (0.0%) | 0 (0.0%) |
| 75 Years and over | 0 (0.0%) | 0 (0.0%) |
Disability Class by Sex by Age in Salem
Disability Class: Hearing Difficulty
| Age Bracket | Male | Female |
| Under 5 Years | 0 (0.0%) | 0 (0.0%) |
| 5 to 17 Years | 0 (0.0%) | 0 (0.0%) |
| 18 to 34 Years | 0 (0.0%) | 0 (0.0%) |
| 35 to 64 Years | 0 (0.0%) | 0 (0.0%) |
| 65 to 74 Years | 0 (0.0%) | 0 (0.0%) |
| 75 Years and over | 0 (0.0%) | 0 (0.0%) |
Disability Class: Vision Difficulty
| Age Bracket | Male | Female |
| Under 5 Years | 0 (0.0%) | 0 (0.0%) |
| 5 to 17 Years | 0 (0.0%) | 0 (0.0%) |
| 18 to 34 Years | 0 (0.0%) | 0 (0.0%) |
| 35 to 64 Years | 0 (0.0%) | 0 (0.0%) |
| 65 to 74 Years | 0 (0.0%) | 0 (0.0%) |
| 75 Years and over | 0 (0.0%) | 0 (0.0%) |
Disability Class: Cognitive Difficulty
| Age Bracket | Male | Female |
| 5 to 17 Years | 0 (0.0%) | 0 (0.0%) |
| 18 to 34 Years | 0 (0.0%) | 0 (0.0%) |
| 35 to 64 Years | 0 (0.0%) | 0 (0.0%) |
| 65 to 74 Years | 0 (0.0%) | 0 (0.0%) |
| 75 Years and over | 0 (0.0%) | 0 (0.0%) |
Disability Class: Ambulatory Difficulty
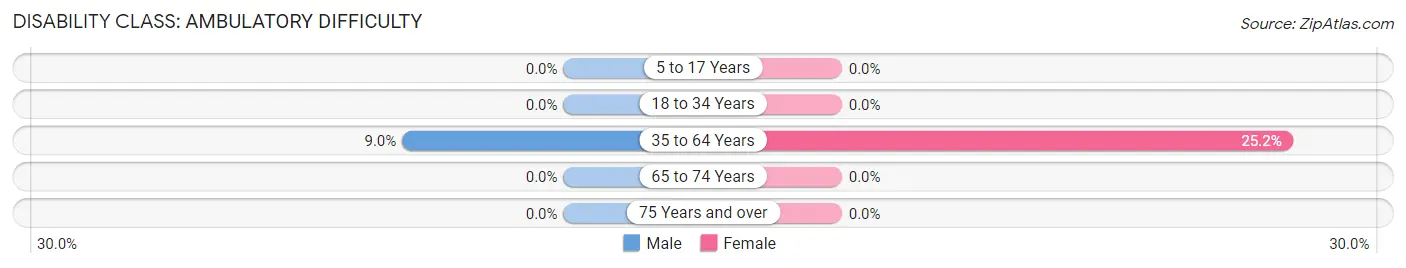
| Age Bracket | Male | Female |
| 5 to 17 Years | 0 (0.0%) | 0 (0.0%) |
| 18 to 34 Years | 0 (0.0%) | 0 (0.0%) |
| 35 to 64 Years | 22 (9.0%) | 41 (25.2%) |
| 65 to 74 Years | 0 (0.0%) | 0 (0.0%) |
| 75 Years and over | 0 (0.0%) | 0 (0.0%) |
Disability Class: Self-Care Difficulty
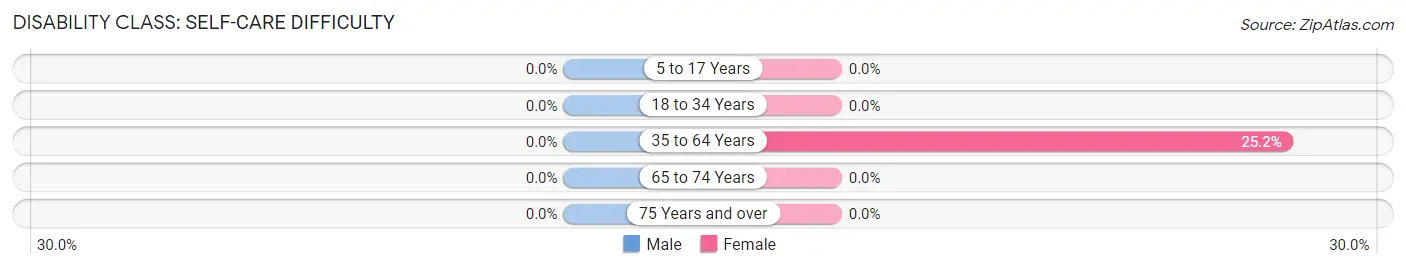
| Age Bracket | Male | Female |
| 5 to 17 Years | 0 (0.0%) | 0 (0.0%) |
| 18 to 34 Years | 0 (0.0%) | 0 (0.0%) |
| 35 to 64 Years | 0 (0.0%) | 41 (25.2%) |
| 65 to 74 Years | 0 (0.0%) | 0 (0.0%) |
| 75 Years and over | 0 (0.0%) | 0 (0.0%) |
Technology Access in Salem
Computing Device Access in Salem
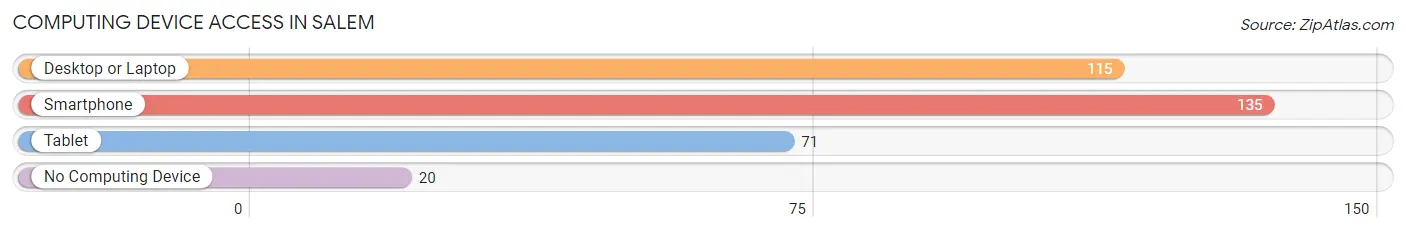
| Device Type | # Households | % Households |
| Desktop or Laptop | 115 | 45.6% |
| Smartphone | 135 | 53.6% |
| Tablet | 71 | 28.2% |
| No Computing Device | 20 | 7.9% |
| Total | 252 | 100.0% |
Internet Access in Salem
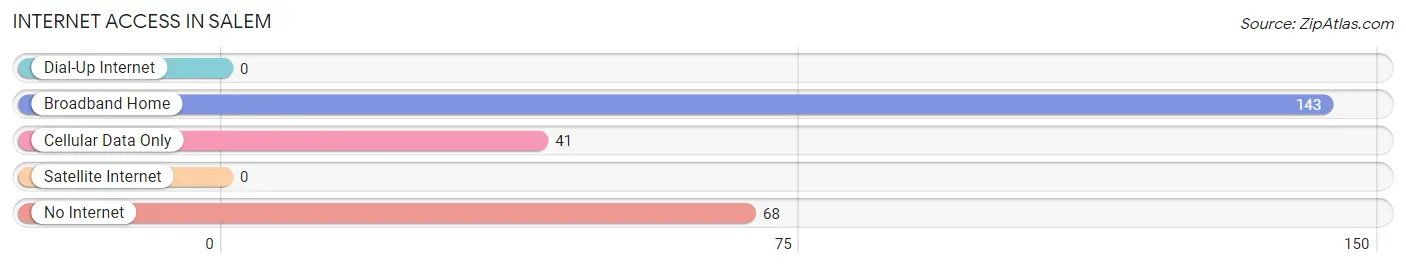
| Internet Type | # Households | % Households |
| Dial-Up Internet | 0 | 0.0% |
| Broadband Home | 143 | 56.8% |
| Cellular Data Only | 41 | 16.3% |
| Satellite Internet | 0 | 0.0% |
| No Internet | 68 | 27.0% |
| Total | 252 | 100.0% |
Salem Summary
Salem, New Mexico is a small town located in the northeastern corner of the state, near the Texas border. It is part of the Clovis-Portales Metropolitan Statistical Area, and is the county seat of Curry County. The town has a population of just over 1,000 people, and is known for its rural charm and friendly atmosphere.
Geography
Salem is located in the northeastern corner of New Mexico, near the Texas border. It is situated in the High Plains region of the state, and is surrounded by rolling hills and flat plains. The town is located at an elevation of 4,400 feet, and is part of the Llano Estacado, or Staked Plains. The climate in Salem is semi-arid, with hot summers and cold winters. The average annual precipitation is just over 15 inches, and the average annual temperature is around 60 degrees Fahrenheit.
Economy
The economy of Salem is largely based on agriculture and ranching. The town is home to several large farms and ranches, and the surrounding area is known for its cattle and sheep production. The town also has a small manufacturing sector, with several small businesses producing a variety of products. The town is also home to a number of small retail stores, restaurants, and other businesses.
Demographics
As of the 2010 census, the population of Salem was 1,037. The racial makeup of the town was 94.3% White, 0.7% African American, 0.7% Native American, 0.3% Asian, 0.1% Pacific Islander, and 3.0% from other races. The median household income was $30,938, and the median family income was $35,625. The per capita income was $15,945.
History
Salem was founded in 1885, when the town was established as the county seat of Curry County. The town was named after Salem, Massachusetts, and was originally a small farming community. In the early 1900s, the town began to grow, and by the 1920s it had become a bustling center of commerce and industry. The town was home to several large businesses, including a cotton gin, a flour mill, and a brick factory.
In the 1950s, the town began to decline, as many of the businesses closed or moved away. The town was also hit hard by the Dust Bowl, and many of the residents left in search of better opportunities elsewhere. In recent years, the town has seen a resurgence, as new businesses have opened and the population has grown. Today, Salem is a small but vibrant community, with a strong sense of community and pride.
Common Questions
What is Per Capita Income in Salem?
Per Capita income in Salem is $10,030.
What is the Median Family Income in Salem?
Median Family Income in Salem is $25,823.
What is the Median Household income in Salem?
Median Household Income in Salem is $26,768.
What is Income or Wage Gap in Salem?
Income or Wage Gap in Salem is 12.7%.
Women in Salem earn 87.3 cents for every dollar earned by a man.
What is Inequality or Gini Index in Salem?
Inequality or Gini Index in Salem is 0.29.
What is the Total Population of Salem?
Total Population of Salem is 844.
What is the Total Male Population of Salem?
Total Male Population of Salem is 413.
What is the Total Female Population of Salem?
Total Female Population of Salem is 431.
What is the Ratio of Males per 100 Females in Salem?
There are 95.82 Males per 100 Females in Salem.
What is the Ratio of Females per 100 Males in Salem?
There are 104.36 Females per 100 Males in Salem.
What is the Median Population Age in Salem?
Median Population Age in Salem is 25.7 Years.
What is the Average Family Size in Salem
Average Family Size in Salem is 3.7 People.
What is the Average Household Size in Salem
Average Household Size in Salem is 3.4 People.
How Large is the Labor Force in Salem?
There are 441 People in the Labor Forcein in Salem.
What is the Percentage of People in the Labor Force in Salem?
77.5% of People are in the Labor Force in Salem.
What is the Unemployment Rate in Salem?
Unemployment Rate in Salem is 21.1%.