Thermal, CA Map & Demographics
Thermal Map
Thermal Overview
$15,718
PER CAPITA INCOME
$32,340
AVG FAMILY INCOME
73.1%
WAGE / INCOME GAP [ % ]
26.9¢/ $1
WAGE / INCOME GAP [ $ ]
0.43
INEQUALITY / GINI INDEX
1,352
TOTAL POPULATION
345
MALE POPULATION
1,007
FEMALE POPULATION
34.26
MALES / 100 FEMALES
291.88
FEMALES / 100 MALES
35.1
MEDIAN AGE
3.7
AVG FAMILY SIZE
2.2
AVG HOUSEHOLD SIZE
583
LABOR FORCE [ PEOPLE ]
54.0%
PERCENT IN LABOR FORCE
6.9%
UNEMPLOYMENT RATE
Thermal Zip Codes
Thermal Area Codes
Income in Thermal
Income Overview in Thermal
| Characteristic | Number | Measure |
| Per Capita Income | 1,352 | $15,718 |
| Median Family Income | 259 | $32,340 |
| Mean Family Income | 259 | $50,771 |
| Median Household Income | 614 | $0 |
| Mean Household Income | 614 | $34,145 |
| Income Deficit | 259 | $0 |
| Wage / Income Gap (%) | 1,352 | 73.14% |
| Wage / Income Gap ($) | 1,352 | 26.86¢ per $1 |
| Gini / Inequality Index | 1,352 | 0.43 |
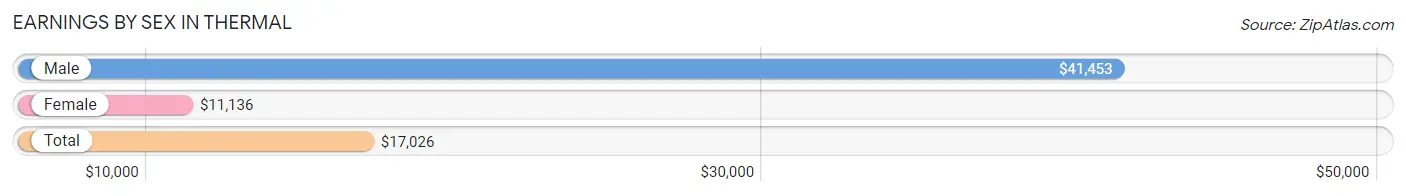
Earnings by Sex in Thermal
Average Earnings in Thermal are $17,026, $41,453 for men and $11,136 for women, a difference of 73.1%.
| Sex | Number | Average Earnings |
| Male | 199 (32.4%) | $41,453 |
| Female | 416 (67.6%) | $11,136 |
| Total | 615 (100.0%) | $17,026 |
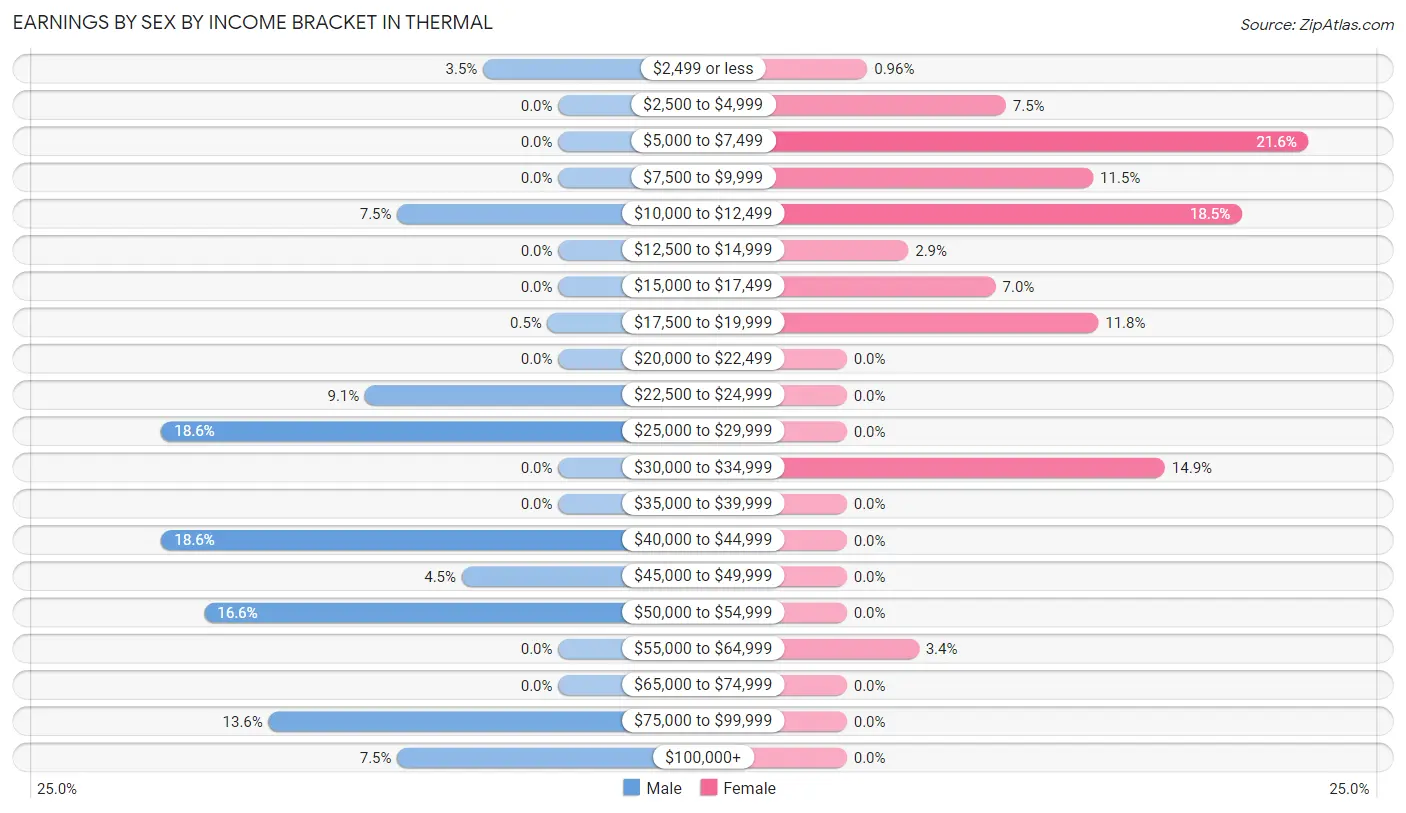
Earnings by Sex by Income Bracket in Thermal
The most common earnings brackets in Thermal are $25,000 to $29,999 for men (37 | 18.6%) and $5,000 to $7,499 for women (90 | 21.6%).
| Income | Male | Female |
| $2,499 or less | 7 (3.5%) | 4 (1.0%) |
| $2,500 to $4,999 | 0 (0.0%) | 31 (7.4%) |
| $5,000 to $7,499 | 0 (0.0%) | 90 (21.6%) |
| $7,500 to $9,999 | 0 (0.0%) | 48 (11.5%) |
| $10,000 to $12,499 | 15 (7.5%) | 77 (18.5%) |
| $12,500 to $14,999 | 0 (0.0%) | 12 (2.9%) |
| $15,000 to $17,499 | 0 (0.0%) | 29 (7.0%) |
| $17,500 to $19,999 | 1 (0.5%) | 49 (11.8%) |
| $20,000 to $22,499 | 0 (0.0%) | 0 (0.0%) |
| $22,500 to $24,999 | 18 (9.0%) | 0 (0.0%) |
| $25,000 to $29,999 | 37 (18.6%) | 0 (0.0%) |
| $30,000 to $34,999 | 0 (0.0%) | 62 (14.9%) |
| $35,000 to $39,999 | 0 (0.0%) | 0 (0.0%) |
| $40,000 to $44,999 | 37 (18.6%) | 0 (0.0%) |
| $45,000 to $49,999 | 9 (4.5%) | 0 (0.0%) |
| $50,000 to $54,999 | 33 (16.6%) | 0 (0.0%) |
| $55,000 to $64,999 | 0 (0.0%) | 14 (3.4%) |
| $65,000 to $74,999 | 0 (0.0%) | 0 (0.0%) |
| $75,000 to $99,999 | 27 (13.6%) | 0 (0.0%) |
| $100,000+ | 15 (7.5%) | 0 (0.0%) |
| Total | 199 (100.0%) | 416 (100.0%) |
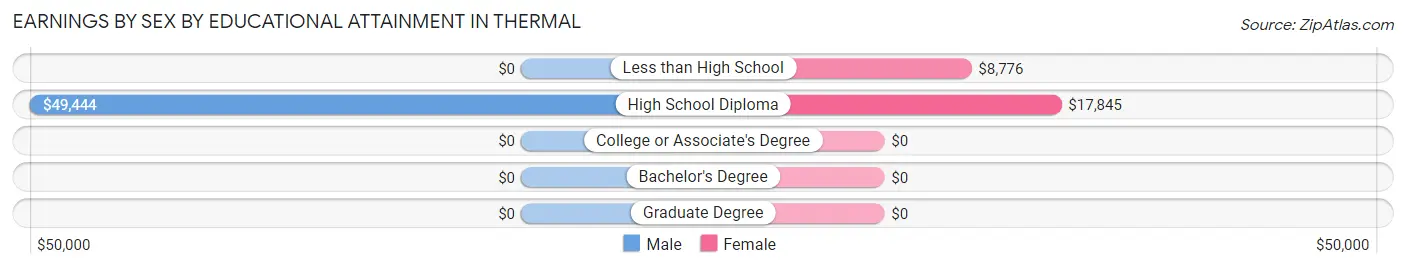
Earnings by Sex by Educational Attainment in Thermal
Average earnings in Thermal are $42,230 for men and $11,705 for women, a difference of 72.3%. Men with an educational attainment of high school diploma enjoy the highest average annual earnings of $49,444, while those with high school diploma education earn the least with $49,444. Women with an educational attainment of high school diploma earn the most with the average annual earnings of $17,845, while those with less than high school education have the smallest earnings of $8,776.
| Educational Attainment | Male Income | Female Income |
| Less than High School | - | - |
| High School Diploma | $49,444 | $17,845 |
| College or Associate's Degree | - | - |
| Bachelor's Degree | - | - |
| Graduate Degree | - | - |
| Total | $42,230 | $11,705 |
Family Income in Thermal
Family Income Brackets in Thermal
According to the Thermal family income data, there are 65 families falling into the $25,000 to $34,999 income range, which is the most common income bracket and makes up 25.1% of all families.
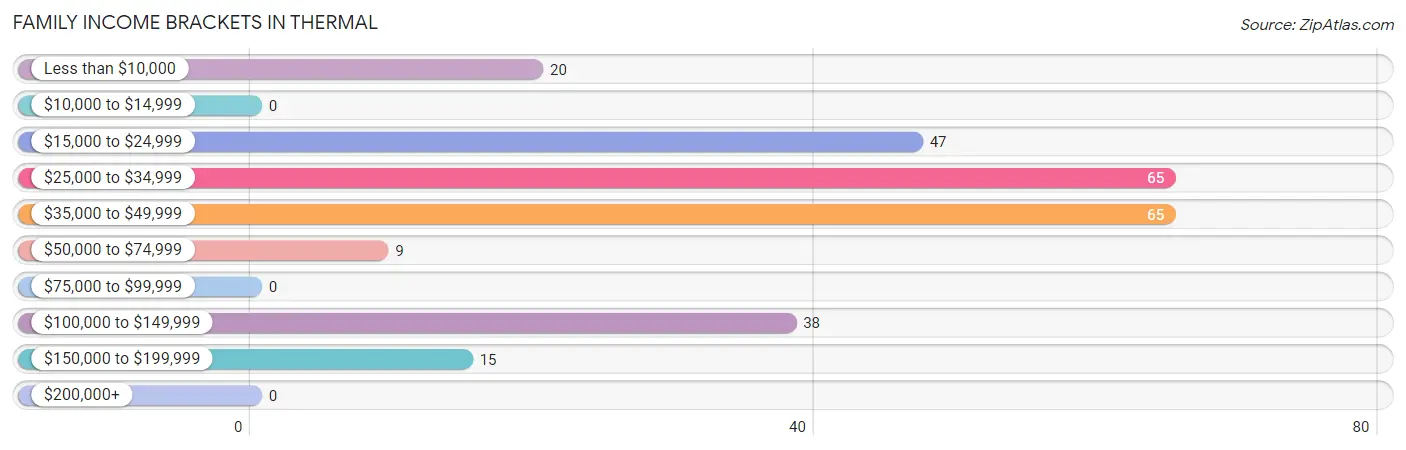
| Income Bracket | # Families | % Families |
| Less than $10,000 | 20 | 7.7% |
| $10,000 to $14,999 | 0 | 0.0% |
| $15,000 to $24,999 | 47 | 18.1% |
| $25,000 to $34,999 | 65 | 25.1% |
| $35,000 to $49,999 | 65 | 25.1% |
| $50,000 to $74,999 | 9 | 3.5% |
| $75,000 to $99,999 | 0 | 0.0% |
| $100,000 to $149,999 | 38 | 14.7% |
| $150,000 to $199,999 | 15 | 5.8% |
| $200,000+ | 0 | 0.0% |
Family Income by Famaliy Size in Thermal
| Income Bracket | # Families | Median Income |
| 2-Person Families | 74 (28.6%) | $0 |
| 3-Person Families | 83 (32.1%) | $0 |
| 4-Person Families | 30 (11.6%) | $0 |
| 5-Person Families | 25 (9.7%) | $0 |
| 6-Person Families | 38 (14.7%) | $0 |
| 7+ Person Families | 9 (3.5%) | $0 |
| Total | 259 (100.0%) | $32,340 |
Family Income by Number of Earners in Thermal
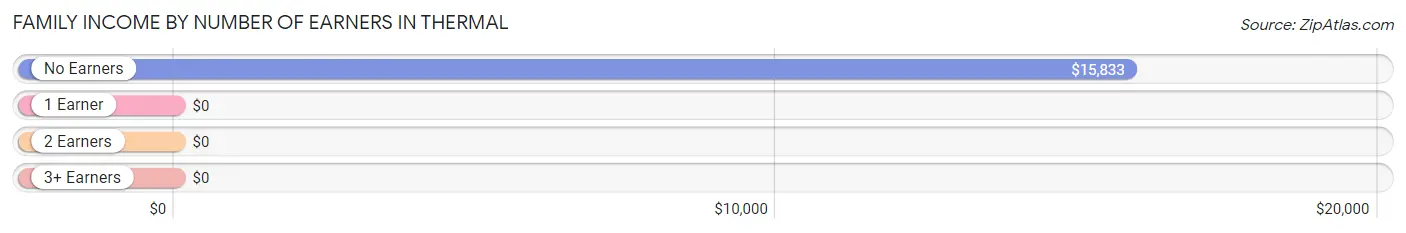
| Number of Earners | # Families | Median Income |
| No Earners | 52 (20.1%) | $15,833 |
| 1 Earner | 51 (19.7%) | $0 |
| 2 Earners | 108 (41.7%) | $0 |
| 3+ Earners | 48 (18.5%) | $0 |
| Total | 259 (100.0%) | $32,340 |
Household Income in Thermal
Household Income Brackets in Thermal
With 231 households falling in the category, the $15,000 to $24,999 income range is the most frequent in Thermal, accounting for 37.6% of all households.
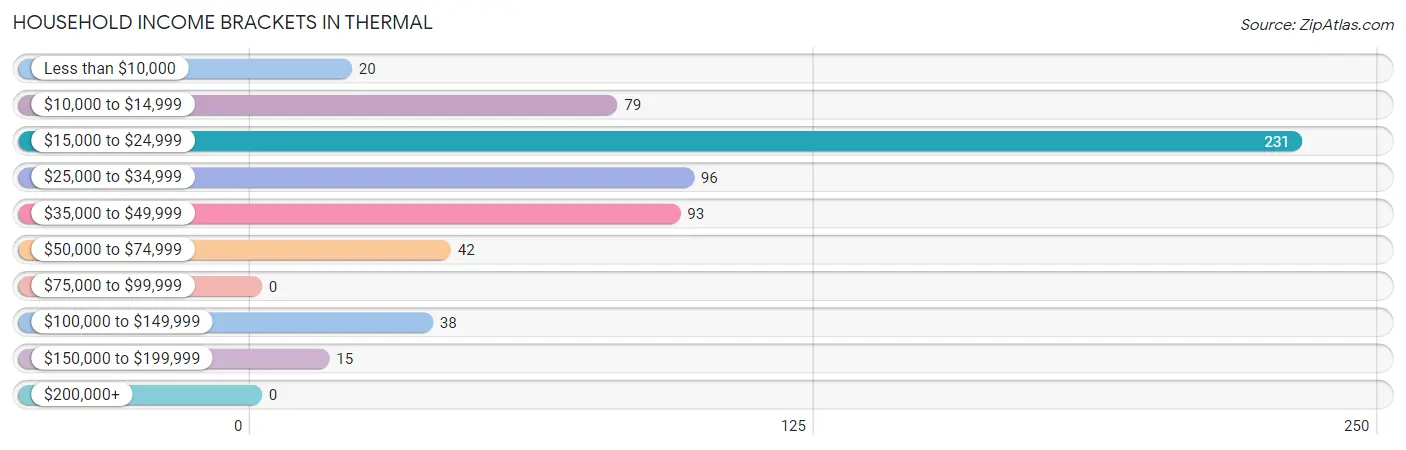
| Income Bracket | # Households | % Households |
| Less than $10,000 | 20 | 3.3% |
| $10,000 to $14,999 | 79 | 12.9% |
| $15,000 to $24,999 | 231 | 37.6% |
| $25,000 to $34,999 | 96 | 15.6% |
| $35,000 to $49,999 | 93 | 15.1% |
| $50,000 to $74,999 | 42 | 6.8% |
| $75,000 to $99,999 | 0 | 0.0% |
| $100,000 to $149,999 | 38 | 6.2% |
| $150,000 to $199,999 | 15 | 2.4% |
| $200,000+ | 0 | 0.0% |
Household Income by Householder Age in Thermal
The median household income in Thermal is $0, with the highest median household income of $43,348 found in the 25 to 44 years age bracket for the primary householder. A total of 179 households (29.1%) fall into this category.
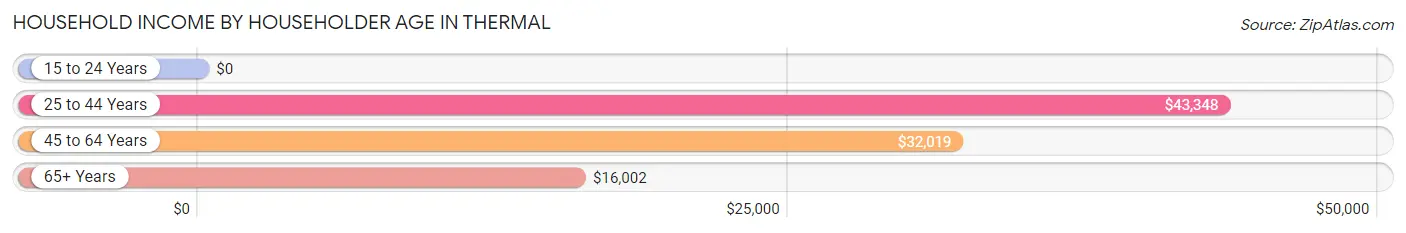
| Income Bracket | # Households | Median Income |
| 15 to 24 Years | 0 (0.0%) | $0 |
| 25 to 44 Years | 179 (29.1%) | $43,348 |
| 45 to 64 Years | 193 (31.4%) | $32,019 |
| 65+ Years | 242 (39.4%) | $16,002 |
| Total | 614 (100.0%) | $0 |
Poverty in Thermal
Income Below Poverty by Sex and Age in Thermal
With 13.6% poverty level for males and 26.3% for females among the residents of Thermal, 6 to 11 year old males and 5 year old females are the most vulnerable to poverty, with 14 males (100.0%) and 32 females (100.0%) in their respective age groups living below the poverty level.
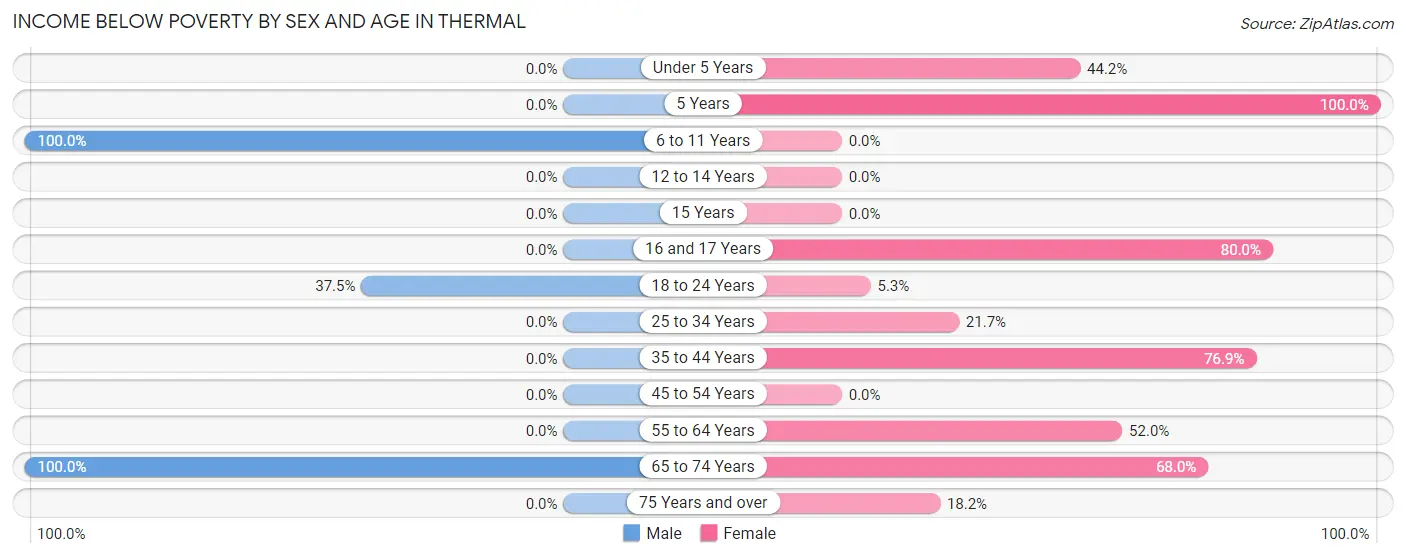
| Age Bracket | Male | Female |
| Under 5 Years | 0 (0.0%) | 23 (44.2%) |
| 5 Years | 0 (0.0%) | 32 (100.0%) |
| 6 to 11 Years | 14 (100.0%) | 0 (0.0%) |
| 12 to 14 Years | 0 (0.0%) | 0 (0.0%) |
| 15 Years | 0 (0.0%) | 0 (0.0%) |
| 16 and 17 Years | 0 (0.0%) | 32 (80.0%) |
| 18 to 24 Years | 15 (37.5%) | 4 (5.3%) |
| 25 to 34 Years | 0 (0.0%) | 45 (21.7%) |
| 35 to 44 Years | 0 (0.0%) | 20 (76.9%) |
| 45 to 54 Years | 0 (0.0%) | 0 (0.0%) |
| 55 to 64 Years | 0 (0.0%) | 51 (52.0%) |
| 65 to 74 Years | 18 (100.0%) | 17 (68.0%) |
| 75 Years and over | 0 (0.0%) | 41 (18.2%) |
| Total | 47 (13.6%) | 265 (26.3%) |
Income Above Poverty by Sex and Age in Thermal
According to the poverty statistics in Thermal, males aged under 5 years and females aged 6 to 11 years are the age groups that are most secure financially, with 100.0% of males and 100.0% of females in these age groups living above the poverty line.
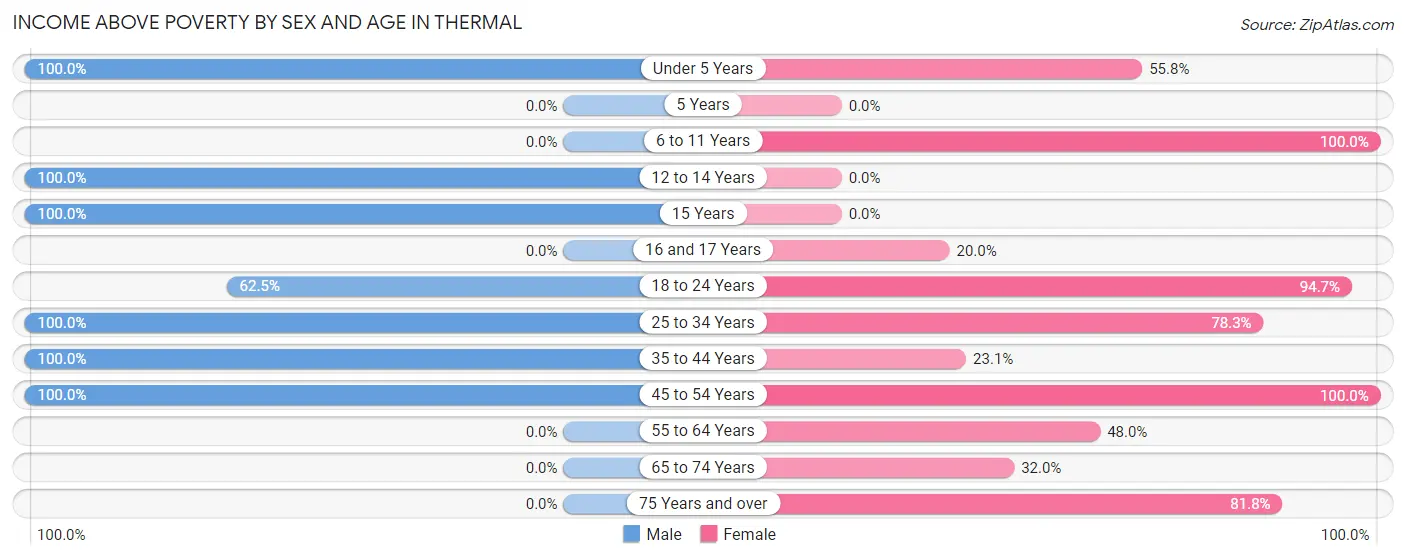
| Age Bracket | Male | Female |
| Under 5 Years | 54 (100.0%) | 29 (55.8%) |
| 5 Years | 0 (0.0%) | 0 (0.0%) |
| 6 to 11 Years | 0 (0.0%) | 78 (100.0%) |
| 12 to 14 Years | 27 (100.0%) | 0 (0.0%) |
| 15 Years | 16 (100.0%) | 0 (0.0%) |
| 16 and 17 Years | 0 (0.0%) | 8 (20.0%) |
| 18 to 24 Years | 25 (62.5%) | 71 (94.7%) |
| 25 to 34 Years | 37 (100.0%) | 162 (78.3%) |
| 35 to 44 Years | 97 (100.0%) | 6 (23.1%) |
| 45 to 54 Years | 42 (100.0%) | 149 (100.0%) |
| 55 to 64 Years | 0 (0.0%) | 47 (48.0%) |
| 65 to 74 Years | 0 (0.0%) | 8 (32.0%) |
| 75 Years and over | 0 (0.0%) | 184 (81.8%) |
| Total | 298 (86.4%) | 742 (73.7%) |
Income Below Poverty Among Married-Couple Families in Thermal
The poverty statistics for married-couple families in Thermal show that 18.4% or 18 of the total 98 families live below the poverty line. Families with no children have the highest poverty rate of 54.5%, comprising of 18 families. On the other hand, families with 1 or 2 children have the lowest poverty rate of 0.0%, which includes 0 families.
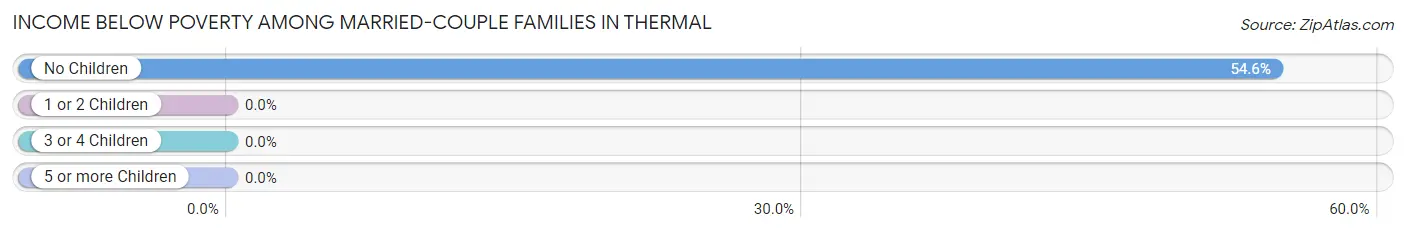
| Children | Above Poverty | Below Poverty |
| No Children | 15 (45.5%) | 18 (54.5%) |
| 1 or 2 Children | 18 (100.0%) | 0 (0.0%) |
| 3 or 4 Children | 47 (100.0%) | 0 (0.0%) |
| 5 or more Children | 0 (0.0%) | 0 (0.0%) |
| Total | 80 (81.6%) | 18 (18.4%) |
Income Below Poverty Among Single-Parent Households in Thermal
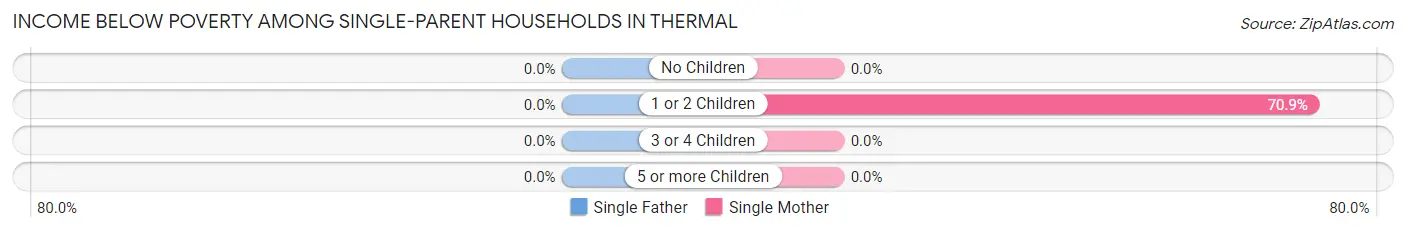
| Children | Single Father | Single Mother |
| No Children | 0 (0.0%) | 0 (0.0%) |
| 1 or 2 Children | 0 (0.0%) | 61 (70.9%) |
| 3 or 4 Children | 0 (0.0%) | 0 (0.0%) |
| 5 or more Children | 0 (0.0%) | 0 (0.0%) |
| Total | 0 (0.0%) | 61 (37.9%) |
Income Below Poverty Among Married-Couple vs Single-Parent Households in Thermal
The poverty data for Thermal shows that 18 of the married-couple family households (18.4%) and 61 of the single-parent households (37.9%) are living below the poverty level. Within the married-couple family households, those with no children have the highest poverty rate, with 18 households (54.5%) falling below the poverty line. Among the single-parent households, those with 1 or 2 children have the highest poverty rate, with 61 household (70.9%) living below poverty.
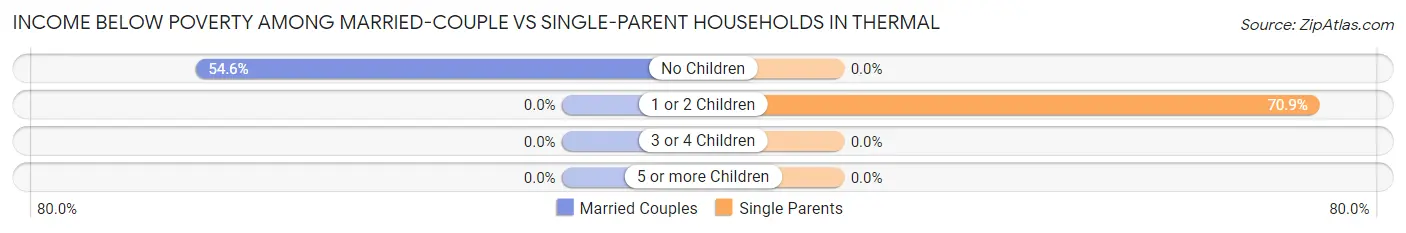
| Children | Married-Couple Families | Single-Parent Households |
| No Children | 18 (54.5%) | 0 (0.0%) |
| 1 or 2 Children | 0 (0.0%) | 61 (70.9%) |
| 3 or 4 Children | 0 (0.0%) | 0 (0.0%) |
| 5 or more Children | 0 (0.0%) | 0 (0.0%) |
| Total | 18 (18.4%) | 61 (37.9%) |
Race in Thermal
The most populous races in Thermal are Hispanic or Latino (1,287 | 95.2%), Some other Race (739 | 54.7%), and Two or more Races (401 | 29.7%).
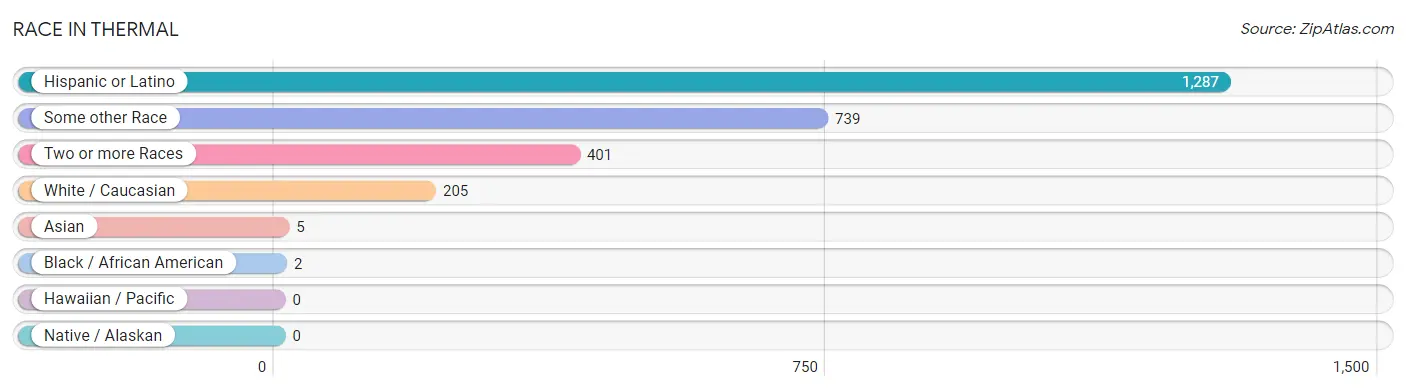
| Race | # Population | % Population |
| Asian | 5 | 0.4% |
| Black / African American | 2 | 0.2% |
| Hawaiian / Pacific | 0 | 0.0% |
| Hispanic or Latino | 1,287 | 95.2% |
| Native / Alaskan | 0 | 0.0% |
| White / Caucasian | 205 | 15.2% |
| Two or more Races | 401 | 29.7% |
| Some other Race | 739 | 54.7% |
| Total | 1,352 | 100.0% |
Ancestry in Thermal
The most populous ancestries reported in Thermal are Mexican (1,285 | 95.0%), European (122 | 9.0%), Armenian (43 | 3.2%), Korean (5 | 0.4%), and Irish (1 | 0.1%), together accounting for 107.7% of all Thermal residents.
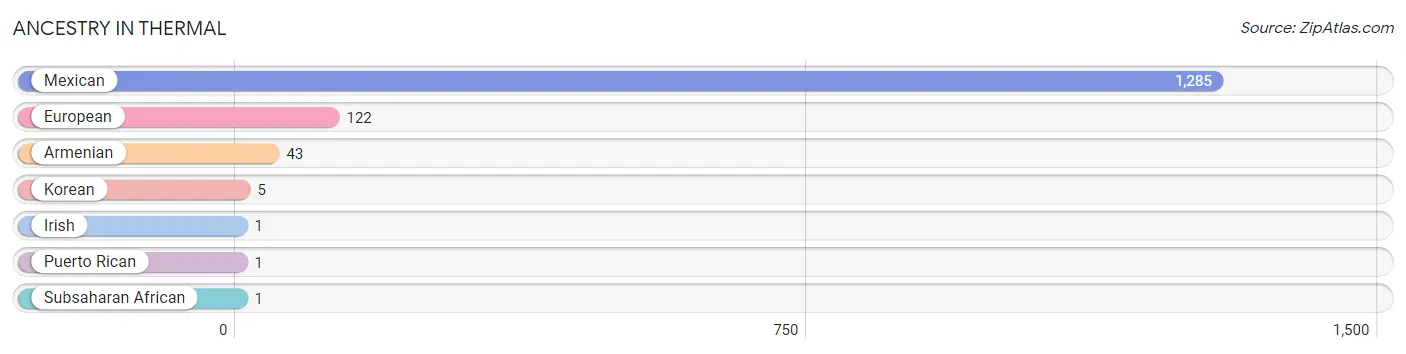
| Ancestry | # Population | % Population |
| Armenian | 43 | 3.2% |
| European | 122 | 9.0% |
| Irish | 1 | 0.1% |
| Korean | 5 | 0.4% |
| Mexican | 1,285 | 95.0% |
| Puerto Rican | 1 | 0.1% |
| Subsaharan African | 1 | 0.1% | View All 7 Rows |
Immigrants in Thermal
The most numerous immigrant groups reported in Thermal came from Central America (685 | 50.7%), Latin America (685 | 50.7%), Mexico (685 | 50.7%), Asia (21 | 1.5%), and Armenia (20 | 1.5%), together accounting for 155.0% of all Thermal residents.
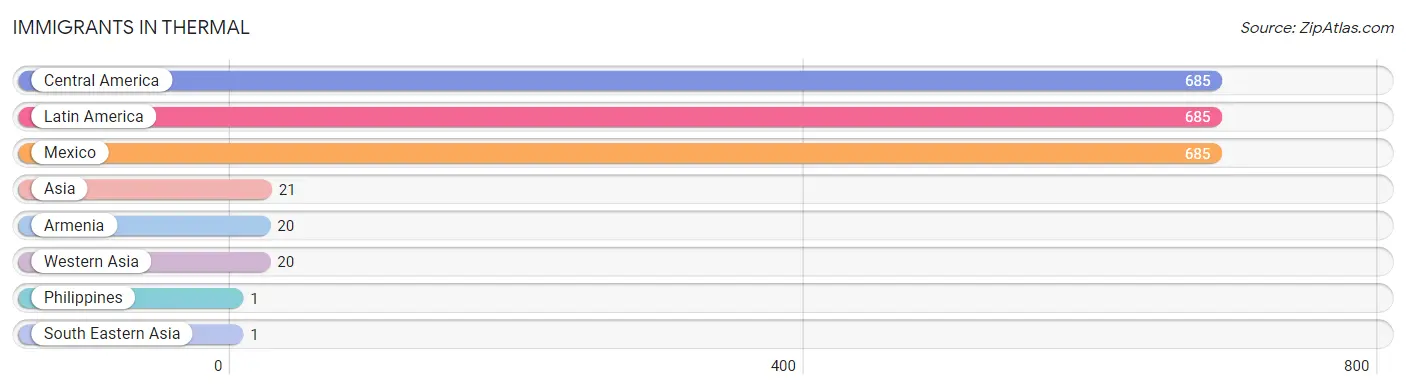
| Immigration Origin | # Population | % Population |
| Armenia | 20 | 1.5% |
| Asia | 21 | 1.5% |
| Central America | 685 | 50.7% |
| Latin America | 685 | 50.7% |
| Mexico | 685 | 50.7% |
| Philippines | 1 | 0.1% |
| South Eastern Asia | 1 | 0.1% |
| Western Asia | 20 | 1.5% | View All 8 Rows |
Sex and Age in Thermal
Sex and Age in Thermal
The most populous age groups in Thermal are 40 to 44 Years (70 | 20.3%) for men and 85 Years and over (184 | 18.3%) for women.
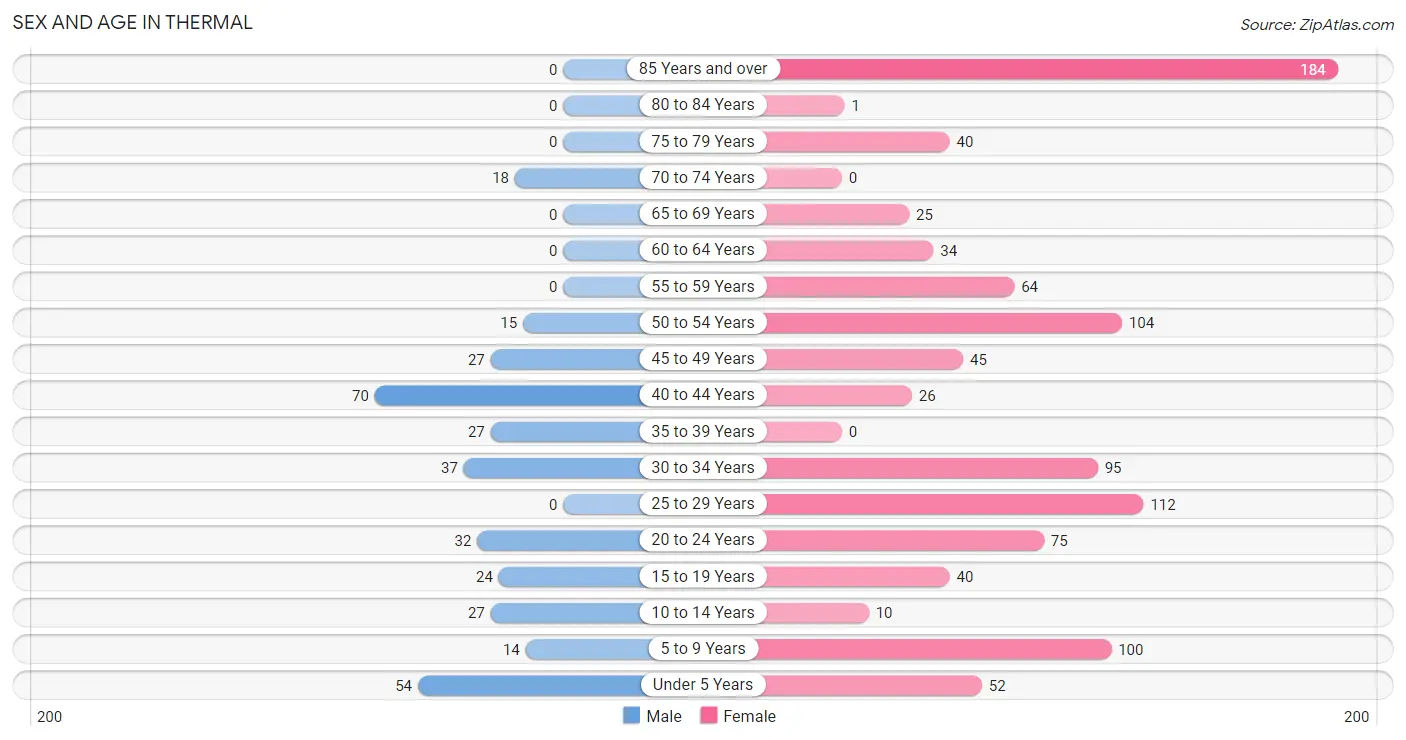
| Age Bracket | Male | Female |
| Under 5 Years | 54 (15.7%) | 52 (5.2%) |
| 5 to 9 Years | 14 (4.1%) | 100 (9.9%) |
| 10 to 14 Years | 27 (7.8%) | 10 (1.0%) |
| 15 to 19 Years | 24 (7.0%) | 40 (4.0%) |
| 20 to 24 Years | 32 (9.3%) | 75 (7.4%) |
| 25 to 29 Years | 0 (0.0%) | 112 (11.1%) |
| 30 to 34 Years | 37 (10.7%) | 95 (9.4%) |
| 35 to 39 Years | 27 (7.8%) | 0 (0.0%) |
| 40 to 44 Years | 70 (20.3%) | 26 (2.6%) |
| 45 to 49 Years | 27 (7.8%) | 45 (4.5%) |
| 50 to 54 Years | 15 (4.3%) | 104 (10.3%) |
| 55 to 59 Years | 0 (0.0%) | 64 (6.4%) |
| 60 to 64 Years | 0 (0.0%) | 34 (3.4%) |
| 65 to 69 Years | 0 (0.0%) | 25 (2.5%) |
| 70 to 74 Years | 18 (5.2%) | 0 (0.0%) |
| 75 to 79 Years | 0 (0.0%) | 40 (4.0%) |
| 80 to 84 Years | 0 (0.0%) | 1 (0.1%) |
| 85 Years and over | 0 (0.0%) | 184 (18.3%) |
| Total | 345 (100.0%) | 1,007 (100.0%) |
Families and Households in Thermal
Median Family Size in Thermal
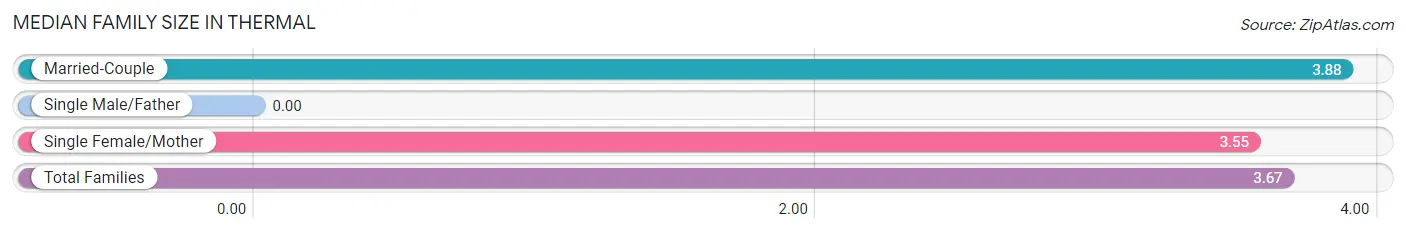
| Family Type | # Families | Family Size |
| Married-Couple | 98 (37.8%) | 3.88 |
| Single Male/Father | 0 (0.0%) | - |
| Single Female/Mother | 161 (62.2%) | 3.55 |
| Total Families | 259 (100.0%) | 3.67 |
Median Household Size in Thermal
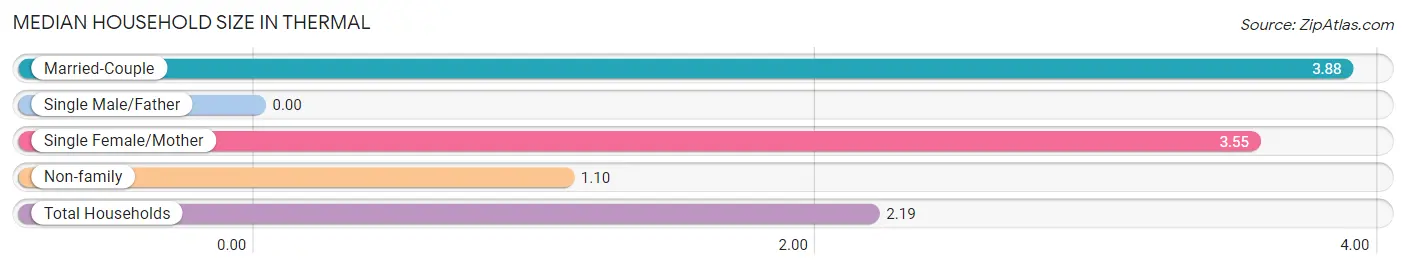
| Household Type | # Households | Household Size |
| Married-Couple | 98 (16.0%) | 3.88 |
| Single Male/Father | 0 (0.0%) | - |
| Single Female/Mother | 161 (26.2%) | 3.55 |
| Non-family | 355 (57.8%) | 1.10 |
| Total Households | 614 (100.0%) | 2.19 |
Household Size by Marriage Status in Thermal
Out of a total of 614 households in Thermal, 259 (42.2%) are family households, while 355 (57.8%) are nonfamily households. The most numerous type of family households are 3-person households, comprising 83, and the most common type of nonfamily households are 1-person households, comprising 327.
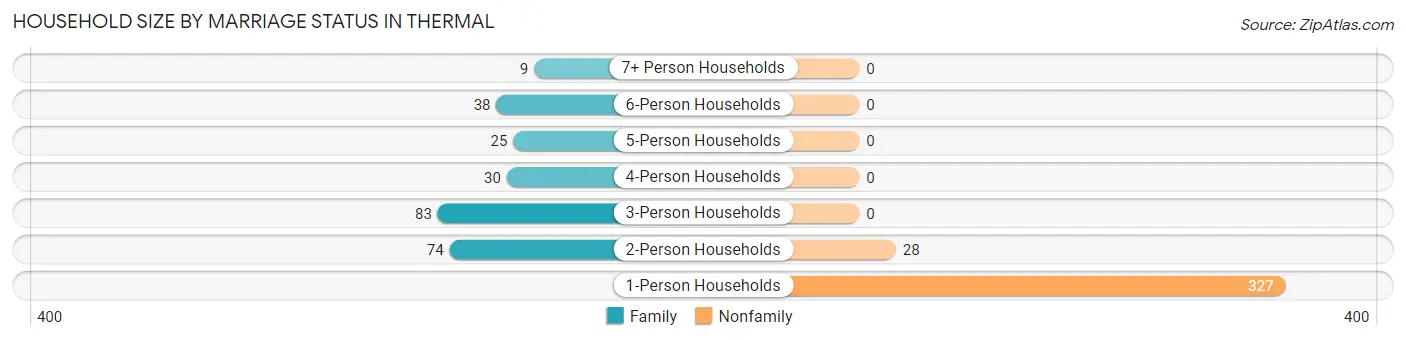
| Household Size | Family Households | Nonfamily Households |
| 1-Person Households | - | 327 (53.3%) |
| 2-Person Households | 74 (12.0%) | 28 (4.6%) |
| 3-Person Households | 83 (13.5%) | 0 (0.0%) |
| 4-Person Households | 30 (4.9%) | 0 (0.0%) |
| 5-Person Households | 25 (4.1%) | 0 (0.0%) |
| 6-Person Households | 38 (6.2%) | 0 (0.0%) |
| 7+ Person Households | 9 (1.5%) | 0 (0.0%) |
| Total | 259 (42.2%) | 355 (57.8%) |
Female Fertility in Thermal
Fertility by Age in Thermal
| Age Bracket | Women with Births | Births / 1,000 Women |
| 15 to 19 years | 0 (0.0%) | 0.0 |
| 20 to 34 years | 0 (0.0%) | 0.0 |
| 35 to 50 years | 0 (0.0%) | 0.0 |
| Total | 0 (0.0%) | 0.0 |
Fertility by Age by Marriage Status in Thermal
| Age Bracket | Married | Unmarried |
| 15 to 19 years | 0 (0.0%) | 0 (0.0%) |
| 20 to 34 years | 0 (0.0%) | 0 (0.0%) |
| 35 to 50 years | 0 (0.0%) | 0 (0.0%) |
| Total | 0 (0.0%) | 0 (0.0%) |
Fertility by Education in Thermal
| Educational Attainment | Women with Births | Births / 1,000 Women |
| Less than High School | 0 (0.0%) | 0.0 |
| High School Diploma | 0 (0.0%) | 0.0 |
| College or Associate's Degree | 0 (0.0%) | 0.0 |
| Bachelor's Degree | 0 (0.0%) | 0.0 |
| Graduate Degree | 0 (0.0%) | 0.0 |
| Total | 0 (0.0%) | 0.0 |
Fertility by Education by Marriage Status in Thermal
| Educational Attainment | Married | Unmarried |
| Less than High School | 0 (0.0%) | 0 (0.0%) |
| High School Diploma | 0 (0.0%) | 0 (0.0%) |
| College or Associate's Degree | 0 (0.0%) | 0 (0.0%) |
| Bachelor's Degree | 0 (0.0%) | 0 (0.0%) |
| Graduate Degree | 0 (0.0%) | 0 (0.0%) |
| Total | 0 (0.0%) | 0 (0.0%) |
Employment Characteristics in Thermal
Employment by Class of Employer in Thermal
Among the 522 employed individuals in Thermal, private company employees (441 | 84.5%), not-for-profit organizations (47 | 9.0%), and self-employed (not incorporated) (29 | 5.6%) make up the most common classes of employment.
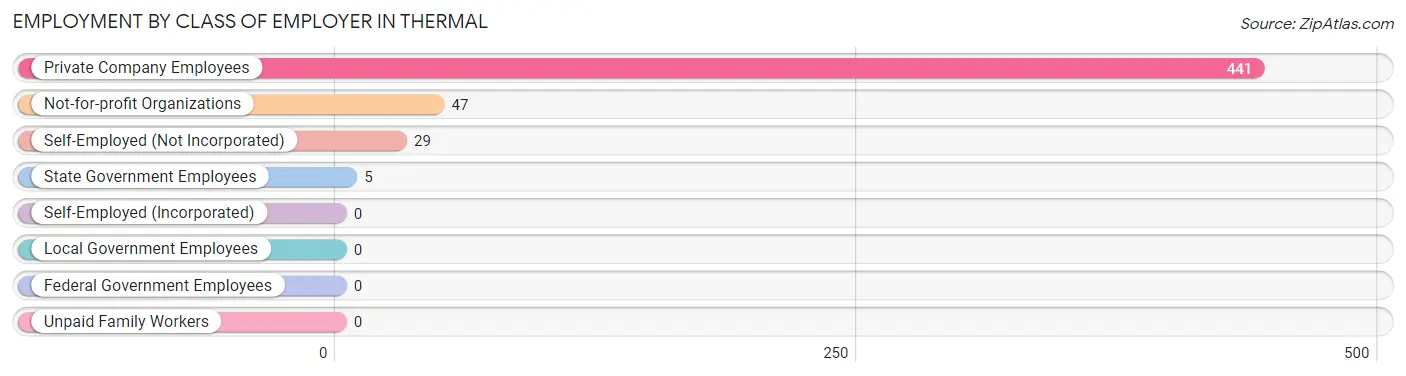
| Employer Class | # Employees | % Employees |
| Private Company Employees | 441 | 84.5% |
| Self-Employed (Incorporated) | 0 | 0.0% |
| Self-Employed (Not Incorporated) | 29 | 5.6% |
| Not-for-profit Organizations | 47 | 9.0% |
| Local Government Employees | 0 | 0.0% |
| State Government Employees | 5 | 1.0% |
| Federal Government Employees | 0 | 0.0% |
| Unpaid Family Workers | 0 | 0.0% |
| Total | 522 | 100.0% |
Employment Status by Age in Thermal
According to the labor force statistics for Thermal, out of the total population over 16 years of age (1,079), 54.0% or 583 individuals are in the labor force, with 6.9% or 40 of them unemployed. The age group with the highest labor force participation rate is 30 to 34 years, with 100.0% or 132 individuals in the labor force. Within the labor force, the 55 to 59 years age range has the highest percentage of unemployed individuals, with 60.9% or 39 of them being unemployed.
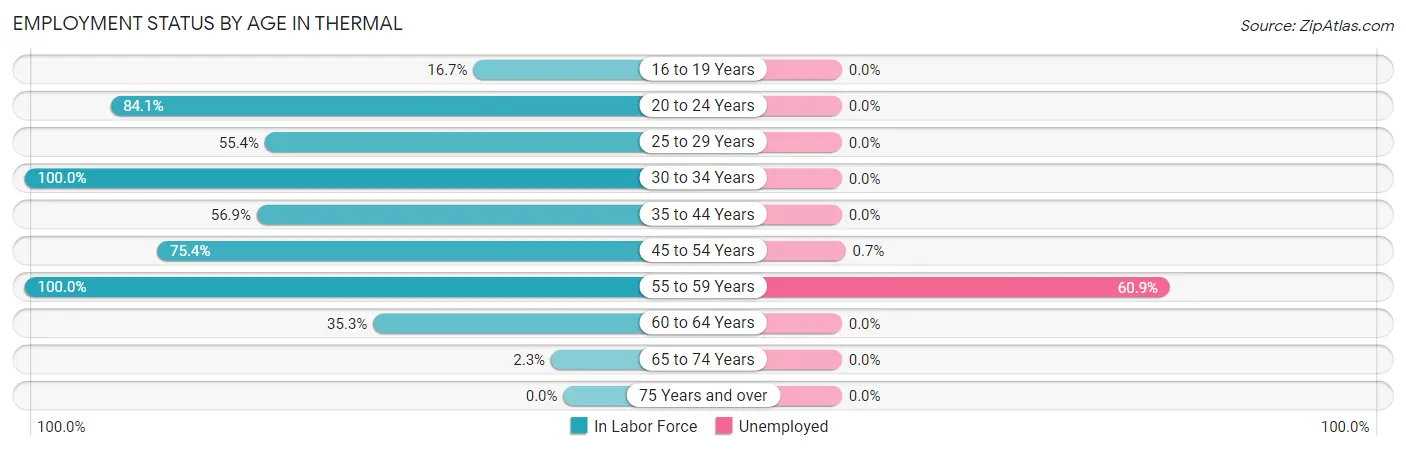
| Age Bracket | In Labor Force | Unemployed |
| 16 to 19 Years | 8 (16.7%) | 0 (0.0%) |
| 20 to 24 Years | 90 (84.1%) | 0 (0.0%) |
| 25 to 29 Years | 62 (55.4%) | 0 (0.0%) |
| 30 to 34 Years | 132 (100.0%) | 0 (0.0%) |
| 35 to 44 Years | 70 (56.9%) | 0 (0.0%) |
| 45 to 54 Years | 144 (75.4%) | 1 (0.7%) |
| 55 to 59 Years | 64 (100.0%) | 39 (60.9%) |
| 60 to 64 Years | 12 (35.3%) | 0 (0.0%) |
| 65 to 74 Years | 1 (2.3%) | 0 (0.0%) |
| 75 Years and over | 0 (0.0%) | 0 (0.0%) |
| Total | 583 (54.0%) | 40 (6.9%) |
Employment Status by Educational Attainment in Thermal
According to labor force statistics for Thermal, 73.8% of individuals (484) out of the total population between 25 and 64 years of age (656) are in the labor force, with 8.3% or 40 of them being unemployed. The group with the highest labor force participation rate are those with the educational attainment of high school diploma, with 79.5% or 237 individuals in the labor force. Within the labor force, individuals with less than high school education have the highest percentage of unemployment, with 17.0% or 40 of them being unemployed.
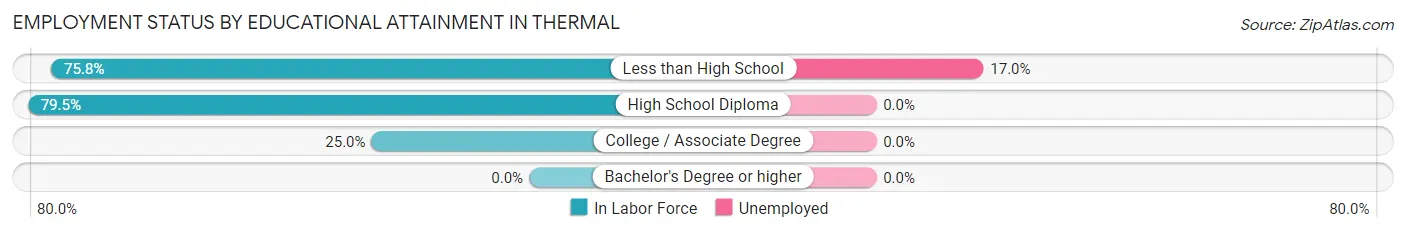
| Educational Attainment | In Labor Force | Unemployed |
| Less than High School | 235 (75.8%) | 53 (17.0%) |
| High School Diploma | 237 (79.5%) | 0 (0.0%) |
| College / Associate Degree | 12 (25.0%) | 0 (0.0%) |
| Bachelor's Degree or higher | 0 (0.0%) | 0 (0.0%) |
| Total | 484 (73.8%) | 54 (8.3%) |
Employment Occupations by Sex in Thermal
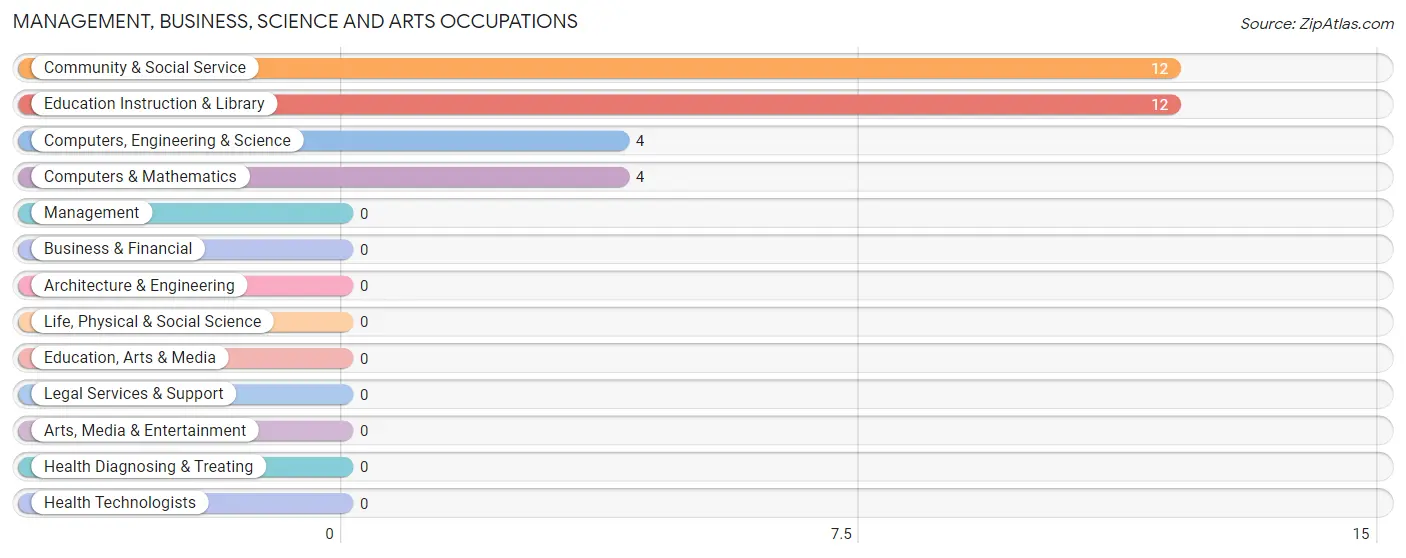
Management, Business, Science and Arts Occupations
The most common Management, Business, Science and Arts occupations in Thermal are Community & Social Service (12 | 2.2%), Education Instruction & Library (12 | 2.2%), Computers, Engineering & Science (4 | 0.7%), and Computers & Mathematics (4 | 0.7%).
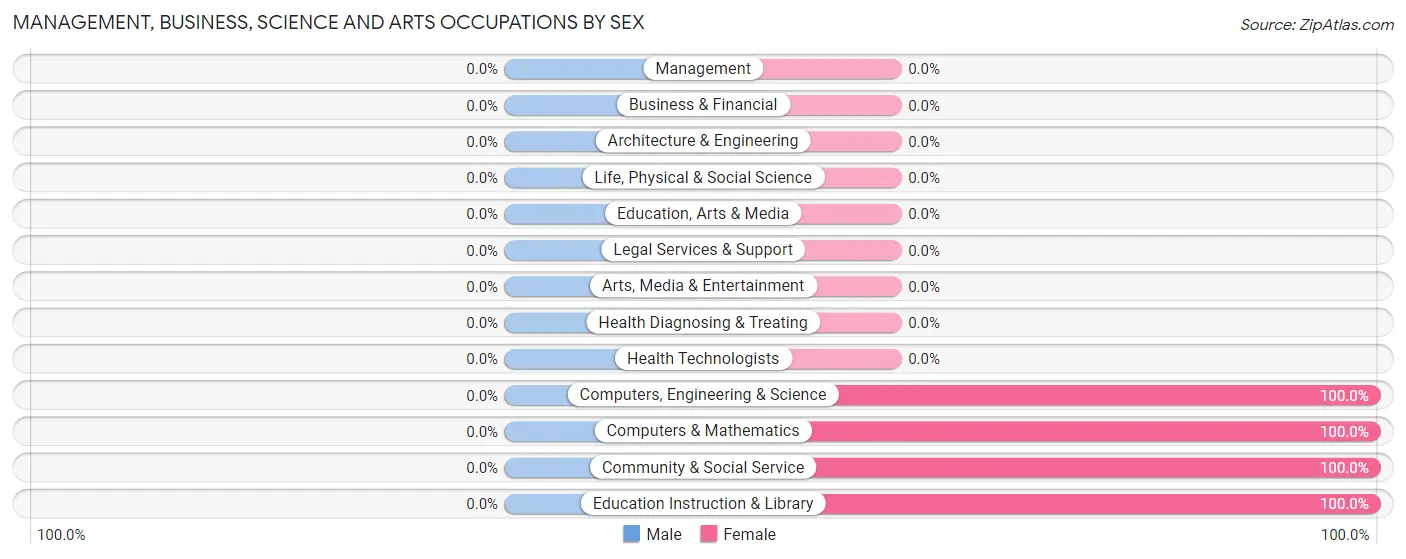
Management, Business, Science and Arts Occupations by Sex
| Occupation | Male | Female |
| Management | 0 (0.0%) | 0 (0.0%) |
| Business & Financial | 0 (0.0%) | 0 (0.0%) |
| Computers, Engineering & Science | 0 (0.0%) | 4 (100.0%) |
| Computers & Mathematics | 0 (0.0%) | 4 (100.0%) |
| Architecture & Engineering | 0 (0.0%) | 0 (0.0%) |
| Life, Physical & Social Science | 0 (0.0%) | 0 (0.0%) |
| Community & Social Service | 0 (0.0%) | 12 (100.0%) |
| Education, Arts & Media | 0 (0.0%) | 0 (0.0%) |
| Legal Services & Support | 0 (0.0%) | 0 (0.0%) |
| Education Instruction & Library | 0 (0.0%) | 12 (100.0%) |
| Arts, Media & Entertainment | 0 (0.0%) | 0 (0.0%) |
| Health Diagnosing & Treating | 0 (0.0%) | 0 (0.0%) |
| Health Technologists | 0 (0.0%) | 0 (0.0%) |
| Total (Category) | 0 (0.0%) | 16 (100.0%) |
| Total (Overall) | 172 (31.7%) | 371 (68.3%) |
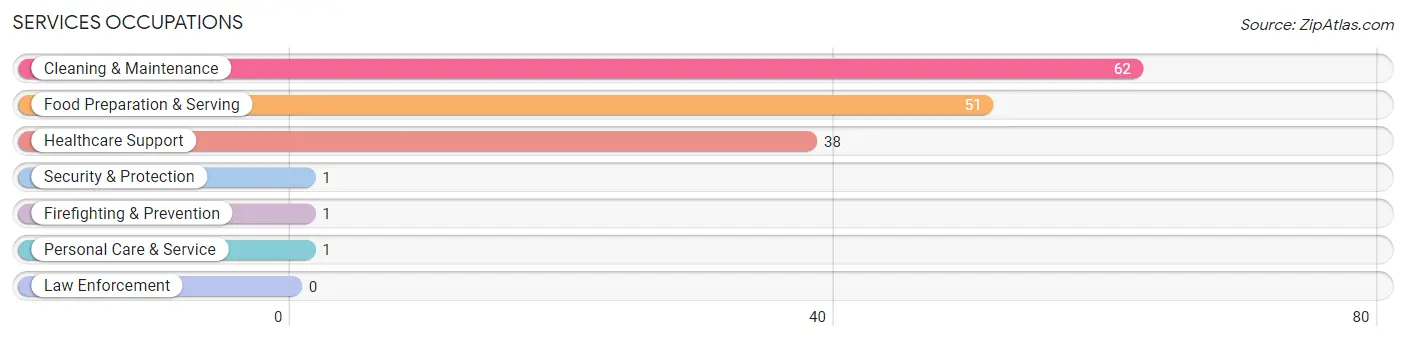
Services Occupations
The most common Services occupations in Thermal are Cleaning & Maintenance (62 | 11.4%), Food Preparation & Serving (51 | 9.4%), Healthcare Support (38 | 7.0%), Security & Protection (1 | 0.2%), and Firefighting & Prevention (1 | 0.2%).
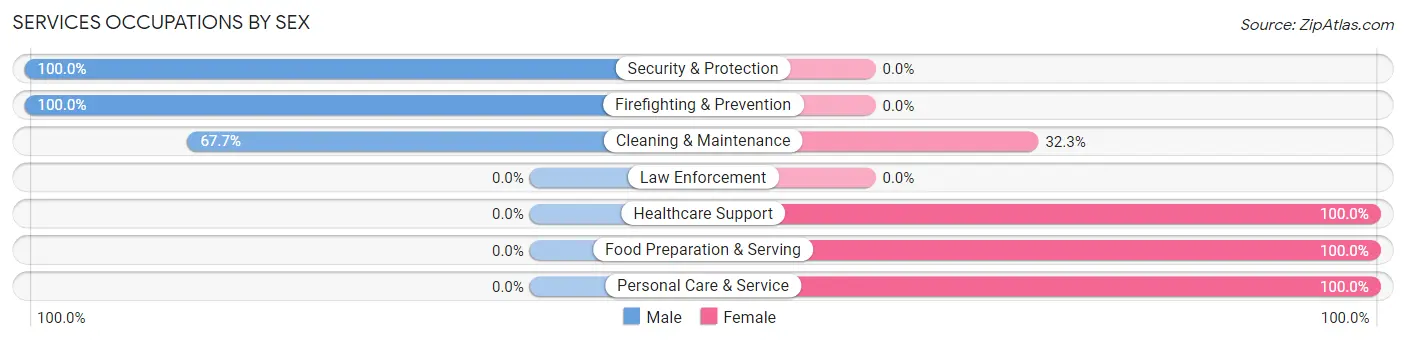
Services Occupations by Sex
Within the Services occupations in Thermal, the most male-oriented occupations are Security & Protection (100.0%), Firefighting & Prevention (100.0%), and Cleaning & Maintenance (67.7%), while the most female-oriented occupations are Healthcare Support (100.0%), Food Preparation & Serving (100.0%), and Personal Care & Service (100.0%).
| Occupation | Male | Female |
| Healthcare Support | 0 (0.0%) | 38 (100.0%) |
| Security & Protection | 1 (100.0%) | 0 (0.0%) |
| Firefighting & Prevention | 1 (100.0%) | 0 (0.0%) |
| Law Enforcement | 0 (0.0%) | 0 (0.0%) |
| Food Preparation & Serving | 0 (0.0%) | 51 (100.0%) |
| Cleaning & Maintenance | 42 (67.7%) | 20 (32.3%) |
| Personal Care & Service | 0 (0.0%) | 1 (100.0%) |
| Total (Category) | 43 (28.1%) | 110 (71.9%) |
| Total (Overall) | 172 (31.7%) | 371 (68.3%) |
Sales and Office Occupations
The most common Sales and Office occupations in Thermal are Sales & Related (85 | 15.7%), and Office & Administration (14 | 2.6%).
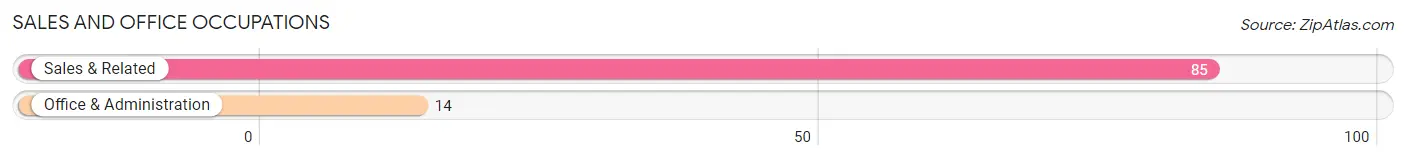
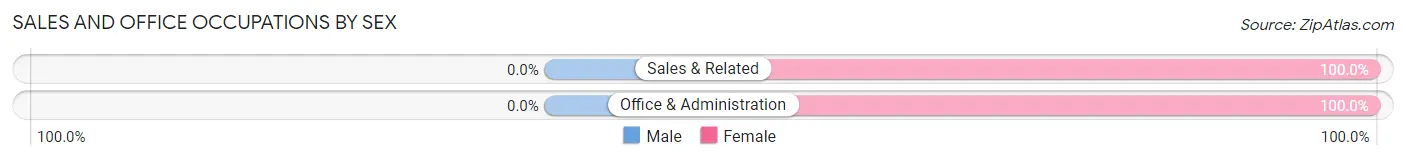
Sales and Office Occupations by Sex
| Occupation | Male | Female |
| Sales & Related | 0 (0.0%) | 85 (100.0%) |
| Office & Administration | 0 (0.0%) | 14 (100.0%) |
| Total (Category) | 0 (0.0%) | 99 (100.0%) |
| Total (Overall) | 172 (31.7%) | 371 (68.3%) |
Natural Resources, Construction and Maintenance Occupations
The most common Natural Resources, Construction and Maintenance occupations in Thermal are Farming, Fishing & Forestry (146 | 26.9%), and Construction & Extraction (33 | 6.1%).
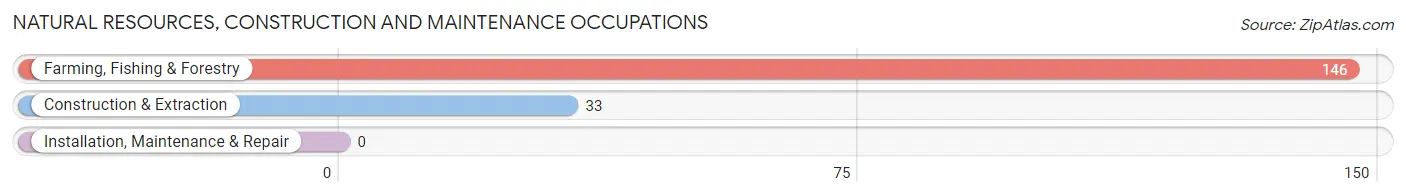
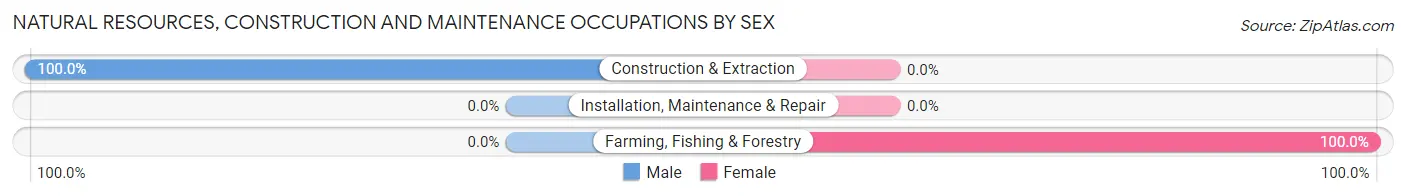
Natural Resources, Construction and Maintenance Occupations by Sex
| Occupation | Male | Female |
| Farming, Fishing & Forestry | 0 (0.0%) | 146 (100.0%) |
| Construction & Extraction | 33 (100.0%) | 0 (0.0%) |
| Installation, Maintenance & Repair | 0 (0.0%) | 0 (0.0%) |
| Total (Category) | 33 (18.4%) | 146 (81.6%) |
| Total (Overall) | 172 (31.7%) | 371 (68.3%) |
Production, Transportation and Moving Occupations
The most common Production, Transportation and Moving occupations in Thermal are , and Material Moving (96 | 17.7%).
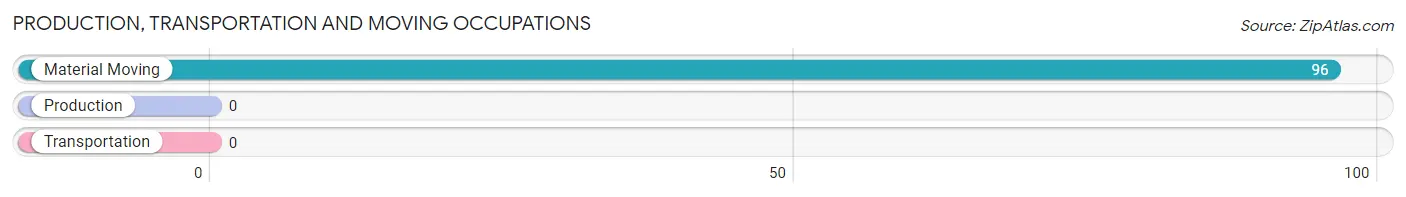
Production, Transportation and Moving Occupations by Sex
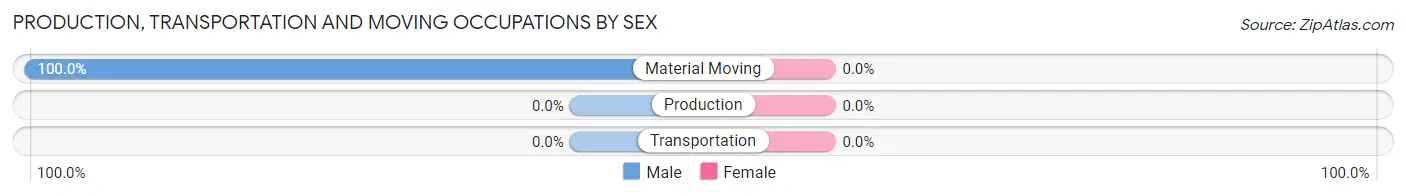
| Occupation | Male | Female |
| Production | 0 (0.0%) | 0 (0.0%) |
| Transportation | 0 (0.0%) | 0 (0.0%) |
| Material Moving | 96 (100.0%) | 0 (0.0%) |
| Total (Category) | 96 (100.0%) | 0 (0.0%) |
| Total (Overall) | 172 (31.7%) | 371 (68.3%) |
Employment Industries by Sex in Thermal
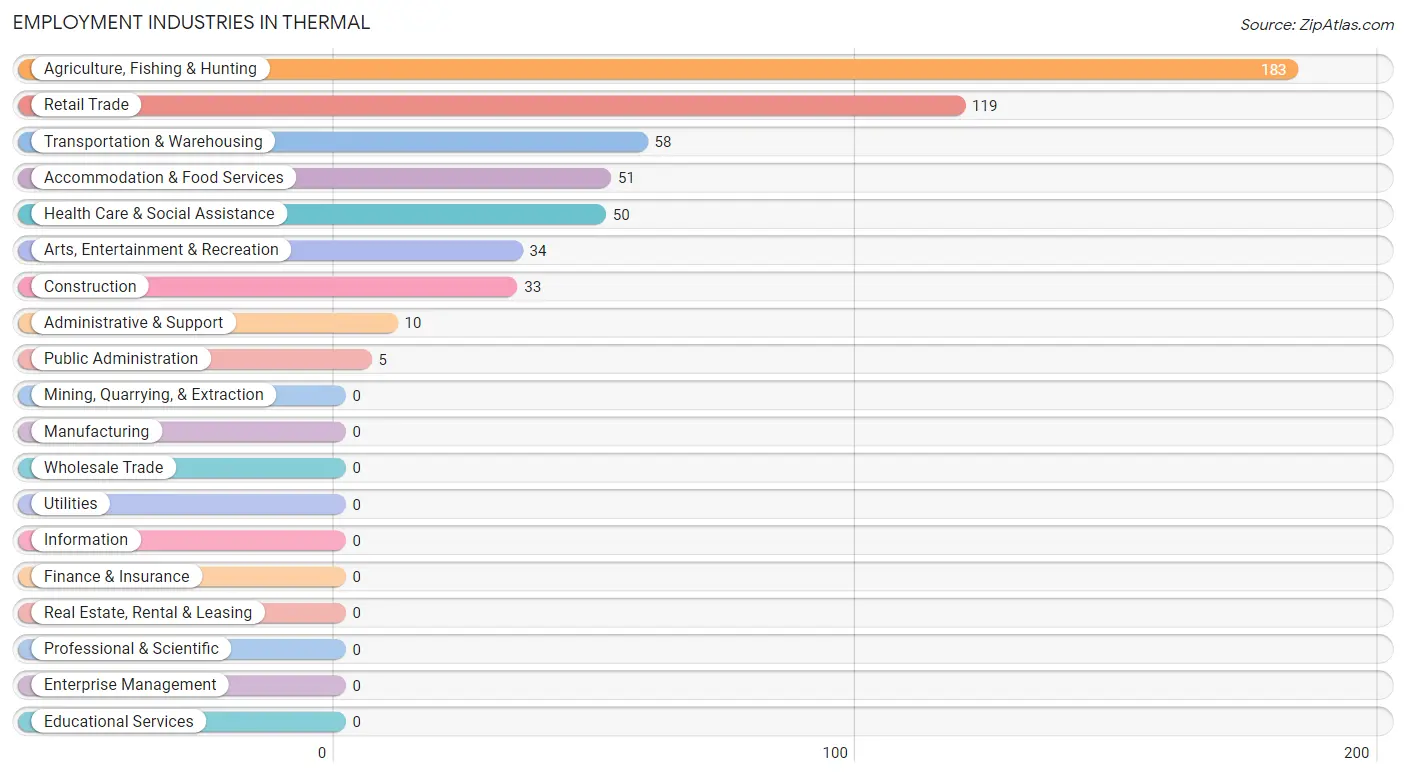
Employment Industries in Thermal
The major employment industries in Thermal include Agriculture, Fishing & Hunting (183 | 33.7%), Retail Trade (119 | 21.9%), Transportation & Warehousing (58 | 10.7%), Accommodation & Food Services (51 | 9.4%), and Health Care & Social Assistance (50 | 9.2%).
Employment Industries by Sex in Thermal
The Thermal industries that see more men than women are Construction (100.0%), Arts, Entertainment & Recreation (97.1%), and Administrative & Support (90.0%), whereas the industries that tend to have a higher number of women are Health Care & Social Assistance (100.0%), Accommodation & Food Services (100.0%), and Retail Trade (87.4%).
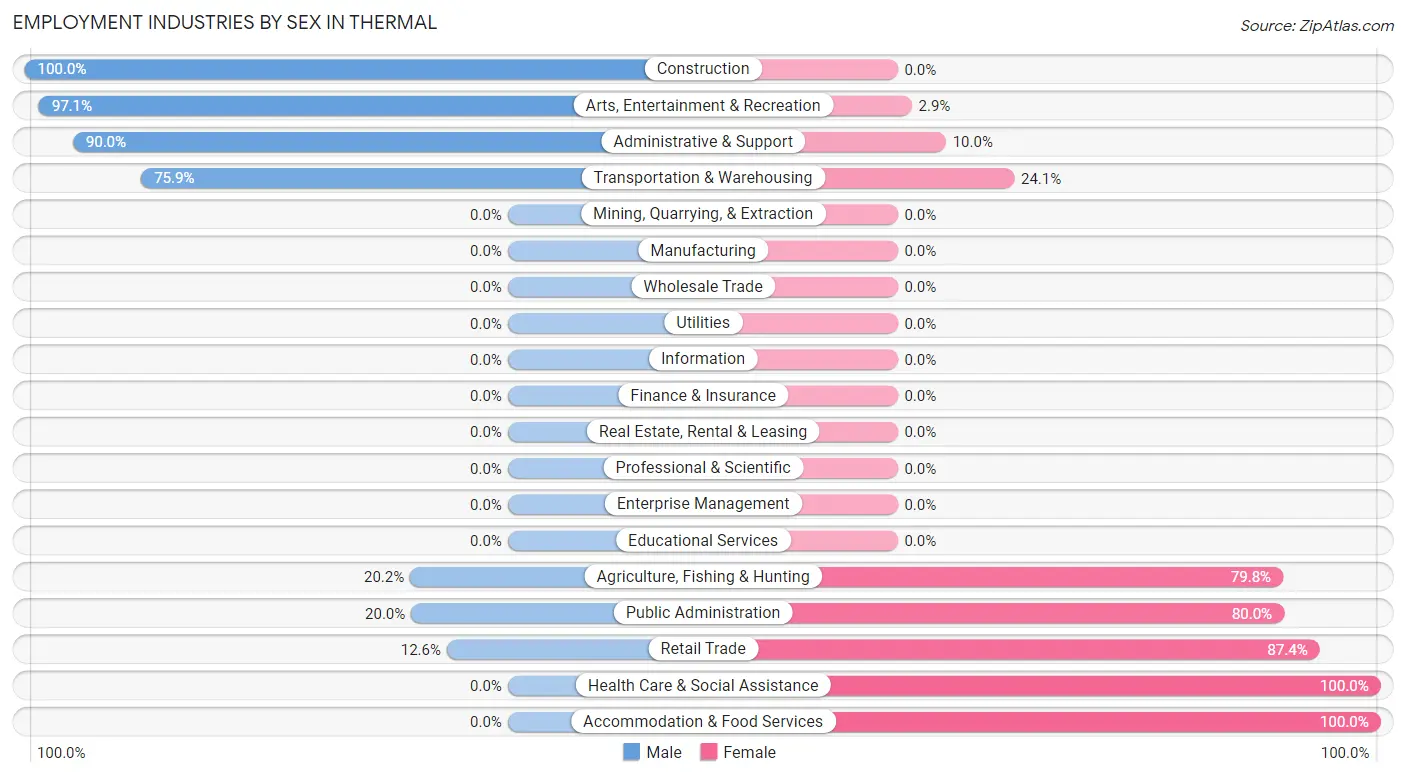
| Industry | Male | Female |
| Agriculture, Fishing & Hunting | 37 (20.2%) | 146 (79.8%) |
| Mining, Quarrying, & Extraction | 0 (0.0%) | 0 (0.0%) |
| Construction | 33 (100.0%) | 0 (0.0%) |
| Manufacturing | 0 (0.0%) | 0 (0.0%) |
| Wholesale Trade | 0 (0.0%) | 0 (0.0%) |
| Retail Trade | 15 (12.6%) | 104 (87.4%) |
| Transportation & Warehousing | 44 (75.9%) | 14 (24.1%) |
| Utilities | 0 (0.0%) | 0 (0.0%) |
| Information | 0 (0.0%) | 0 (0.0%) |
| Finance & Insurance | 0 (0.0%) | 0 (0.0%) |
| Real Estate, Rental & Leasing | 0 (0.0%) | 0 (0.0%) |
| Professional & Scientific | 0 (0.0%) | 0 (0.0%) |
| Enterprise Management | 0 (0.0%) | 0 (0.0%) |
| Administrative & Support | 9 (90.0%) | 1 (10.0%) |
| Educational Services | 0 (0.0%) | 0 (0.0%) |
| Health Care & Social Assistance | 0 (0.0%) | 50 (100.0%) |
| Arts, Entertainment & Recreation | 33 (97.1%) | 1 (2.9%) |
| Accommodation & Food Services | 0 (0.0%) | 51 (100.0%) |
| Public Administration | 1 (20.0%) | 4 (80.0%) |
| Total | 172 (31.7%) | 371 (68.3%) |
Education in Thermal
School Enrollment in Thermal
The most common levels of schooling among the 288 students in Thermal are college / undergraduate (81 | 28.1%), kindergarten (61 | 21.2%), and high school (56 | 19.4%).
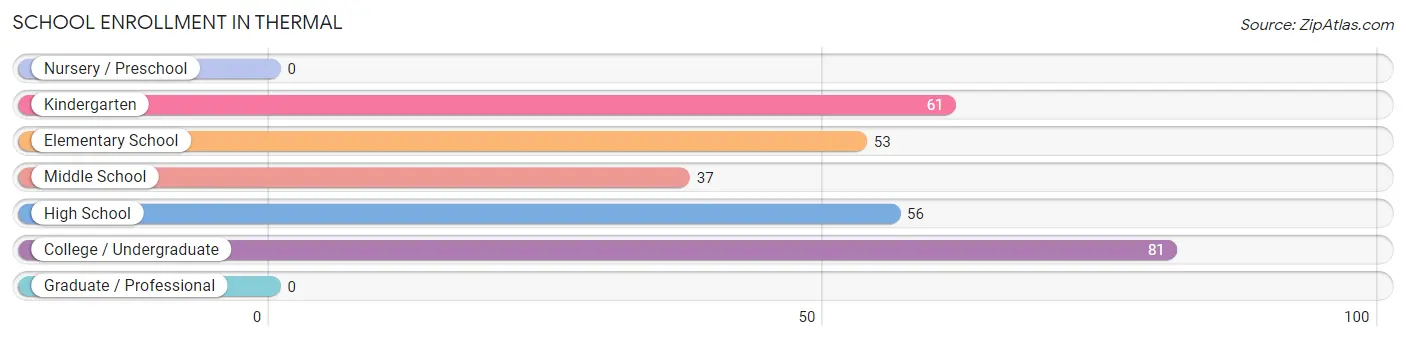
| School Level | # Students | % Students |
| Nursery / Preschool | 0 | 0.0% |
| Kindergarten | 61 | 21.2% |
| Elementary School | 53 | 18.4% |
| Middle School | 37 | 12.9% |
| High School | 56 | 19.4% |
| College / Undergraduate | 81 | 28.1% |
| Graduate / Professional | 0 | 0.0% |
| Total | 288 | 100.0% |
School Enrollment by Age by Funding Source in Thermal
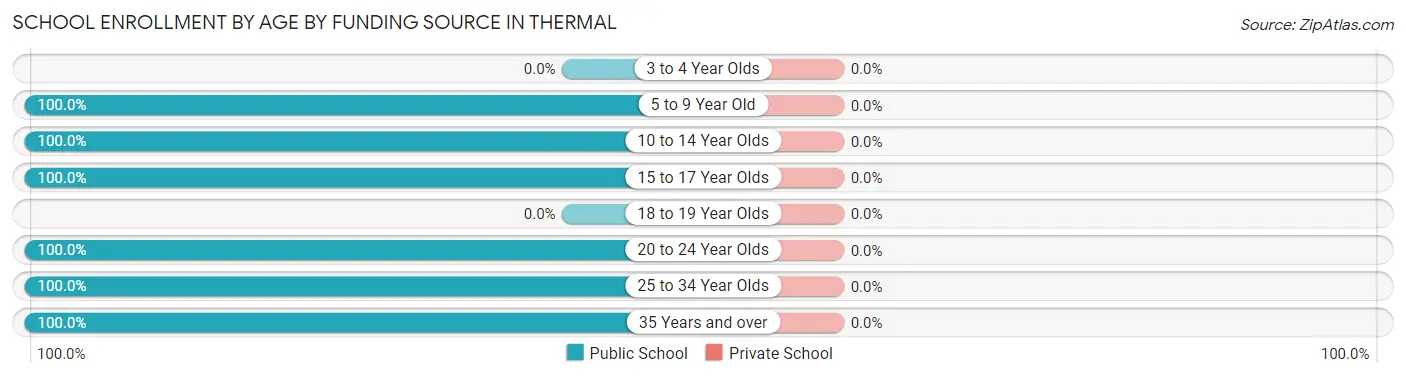
| Age Bracket | Public School | Private School |
| 3 to 4 Year Olds | 0 (0.0%) | 0 (0.0%) |
| 5 to 9 Year Old | 114 (100.0%) | 0 (0.0%) |
| 10 to 14 Year Olds | 37 (100.0%) | 0 (0.0%) |
| 15 to 17 Year Olds | 56 (100.0%) | 0 (0.0%) |
| 18 to 19 Year Olds | 0 (0.0%) | 0 (0.0%) |
| 20 to 24 Year Olds | 52 (100.0%) | 0 (0.0%) |
| 25 to 34 Year Olds | 16 (100.0%) | 0 (0.0%) |
| 35 Years and over | 13 (100.0%) | 0 (0.0%) |
| Total | 288 (100.0%) | 0 (0.0%) |
Educational Attainment by Field of Study in Thermal
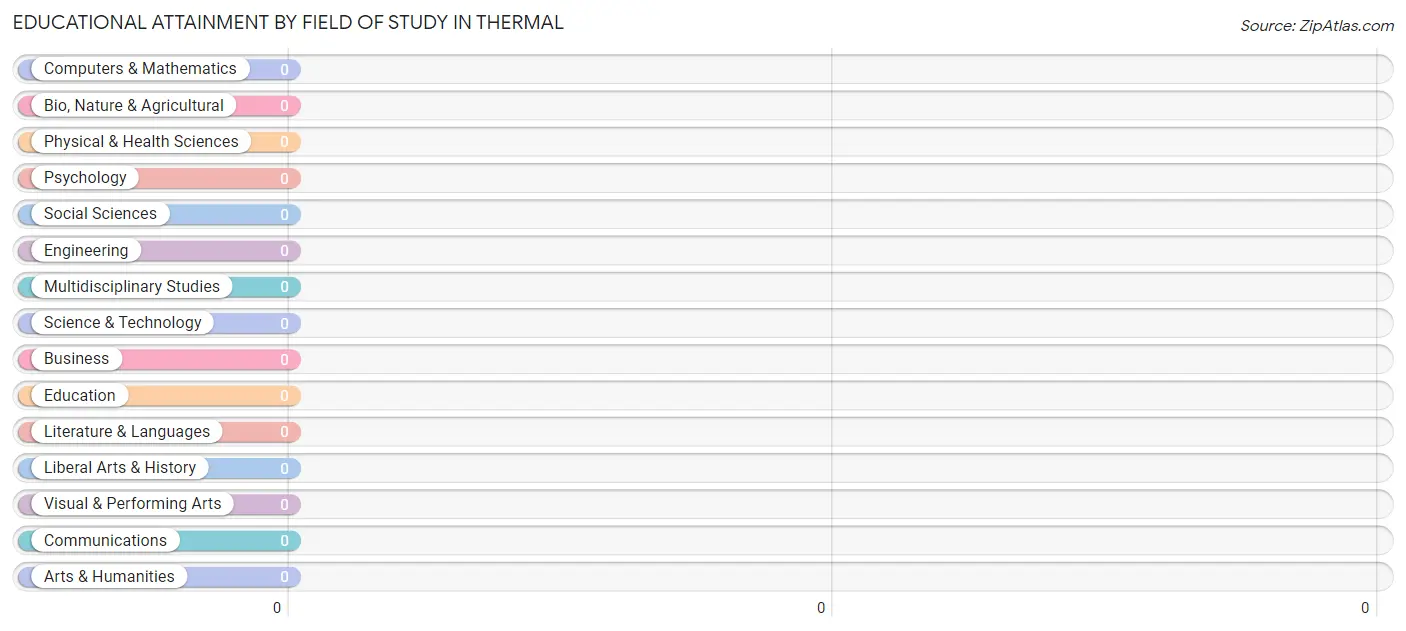
| Field of Study | # Graduates | % Graduates |
| Computers & Mathematics | 0 | 0.0% |
| Bio, Nature & Agricultural | 0 | 0.0% |
| Physical & Health Sciences | 0 | 0.0% |
| Psychology | 0 | 0.0% |
| Social Sciences | 0 | 0.0% |
| Engineering | 0 | 0.0% |
| Multidisciplinary Studies | 0 | 0.0% |
| Science & Technology | 0 | 0.0% |
| Business | 0 | 0.0% |
| Education | 0 | 0.0% |
| Literature & Languages | 0 | 0.0% |
| Liberal Arts & History | 0 | 0.0% |
| Visual & Performing Arts | 0 | 0.0% |
| Communications | 0 | 0.0% |
| Arts & Humanities | 0 | 0.0% |
| Total | 0 | 0.0% |
Transportation & Commute in Thermal
Vehicle Availability by Sex in Thermal
The most prevalent vehicle ownership categories in Thermal are males with 2 vehicles (70, accounting for 42.7%) and females with 2 vehicles (195, making up 19.9%).
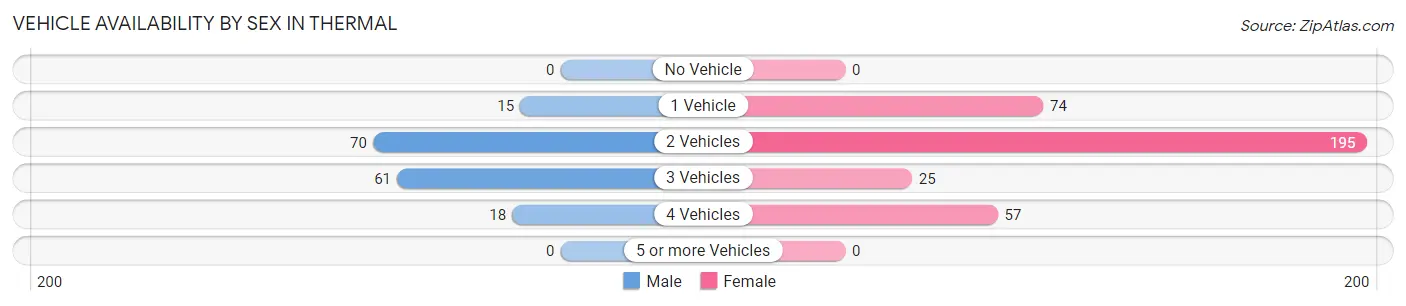
| Vehicles Available | Male | Female |
| No Vehicle | 0 (0.0%) | 0 (0.0%) |
| 1 Vehicle | 15 (9.1%) | 74 (21.1%) |
| 2 Vehicles | 70 (42.7%) | 195 (55.6%) |
| 3 Vehicles | 61 (37.2%) | 25 (7.1%) |
| 4 Vehicles | 18 (11.0%) | 57 (16.2%) |
| 5 or more Vehicles | 0 (0.0%) | 0 (0.0%) |
| Total | 164 (100.0%) | 351 (100.0%) |
Commute Time in Thermal
The most frequently occuring commute durations in Thermal are 15 to 19 minutes (151 commuters, 29.2%), 20 to 24 minutes (106 commuters, 20.5%), and 25 to 29 minutes (66 commuters, 12.8%).
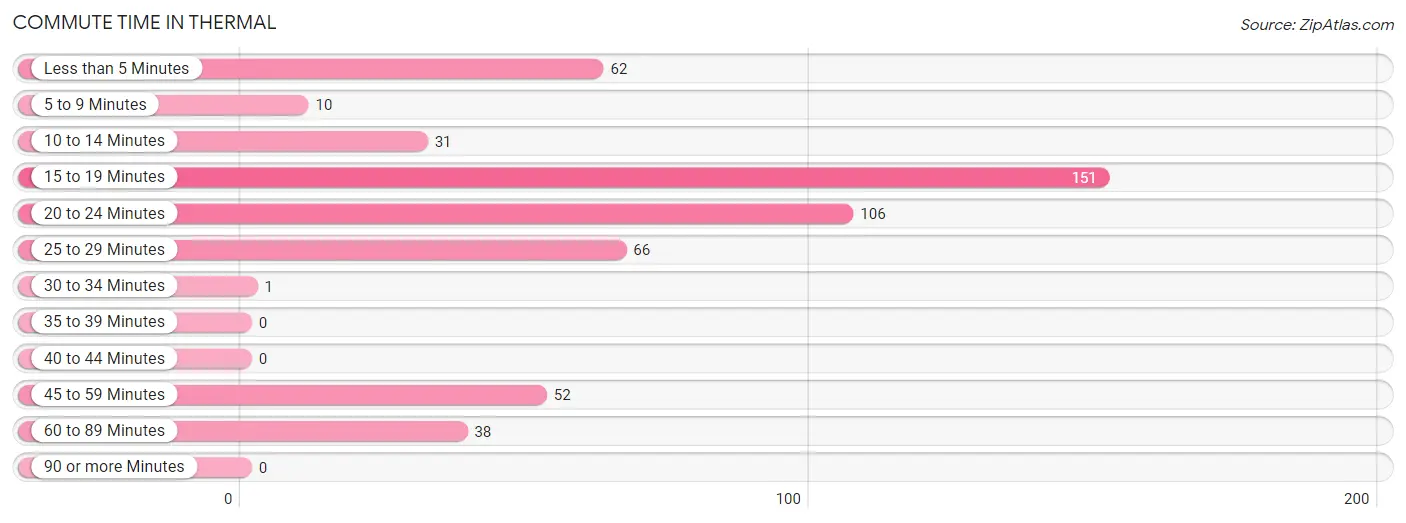
| Commute Time | # Commuters | % Commuters |
| Less than 5 Minutes | 62 | 12.0% |
| 5 to 9 Minutes | 10 | 1.9% |
| 10 to 14 Minutes | 31 | 6.0% |
| 15 to 19 Minutes | 151 | 29.2% |
| 20 to 24 Minutes | 106 | 20.5% |
| 25 to 29 Minutes | 66 | 12.8% |
| 30 to 34 Minutes | 1 | 0.2% |
| 35 to 39 Minutes | 0 | 0.0% |
| 40 to 44 Minutes | 0 | 0.0% |
| 45 to 59 Minutes | 52 | 10.1% |
| 60 to 89 Minutes | 38 | 7.3% |
| 90 or more Minutes | 0 | 0.0% |
Commute Time by Sex in Thermal
The most common commute times in Thermal are less than 5 minutes (37 commuters, 22.6%) for males and 15 to 19 minutes (118 commuters, 33.4%) for females.
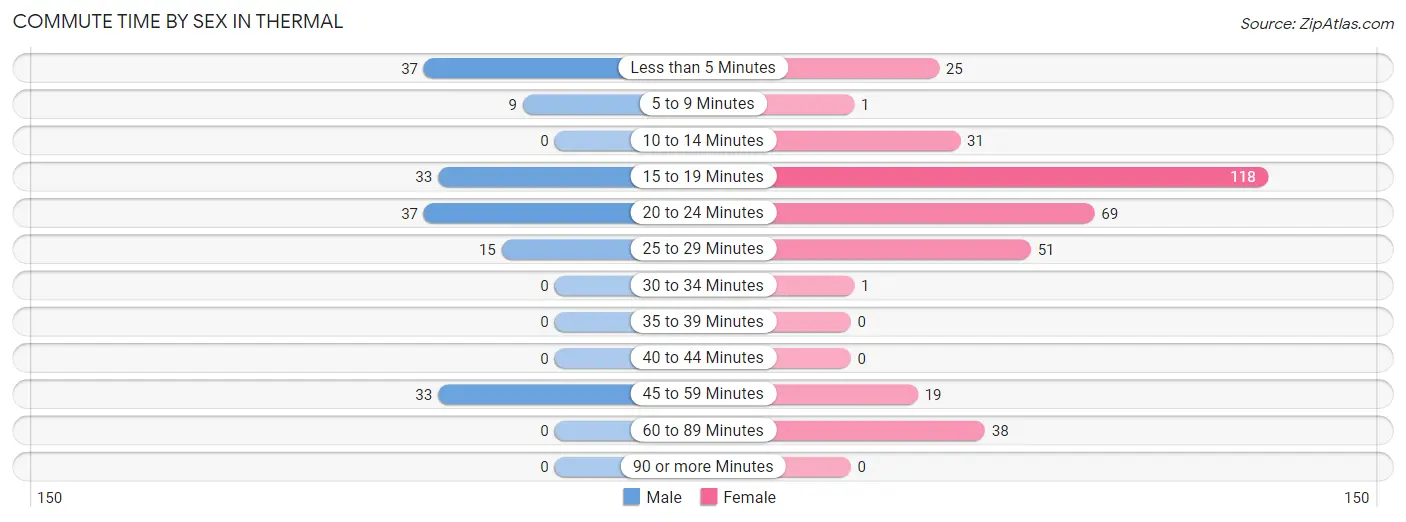
| Commute Time | Male | Female |
| Less than 5 Minutes | 37 (22.6%) | 25 (7.1%) |
| 5 to 9 Minutes | 9 (5.5%) | 1 (0.3%) |
| 10 to 14 Minutes | 0 (0.0%) | 31 (8.8%) |
| 15 to 19 Minutes | 33 (20.1%) | 118 (33.4%) |
| 20 to 24 Minutes | 37 (22.6%) | 69 (19.6%) |
| 25 to 29 Minutes | 15 (9.1%) | 51 (14.4%) |
| 30 to 34 Minutes | 0 (0.0%) | 1 (0.3%) |
| 35 to 39 Minutes | 0 (0.0%) | 0 (0.0%) |
| 40 to 44 Minutes | 0 (0.0%) | 0 (0.0%) |
| 45 to 59 Minutes | 33 (20.1%) | 19 (5.4%) |
| 60 to 89 Minutes | 0 (0.0%) | 38 (10.8%) |
| 90 or more Minutes | 0 (0.0%) | 0 (0.0%) |
Time of Departure to Work by Sex in Thermal
The most frequent times of departure to work in Thermal are 5:30 AM to 5:59 AM (57, 34.8%) for males and 5:00 AM to 5:29 AM (138, 39.1%) for females.
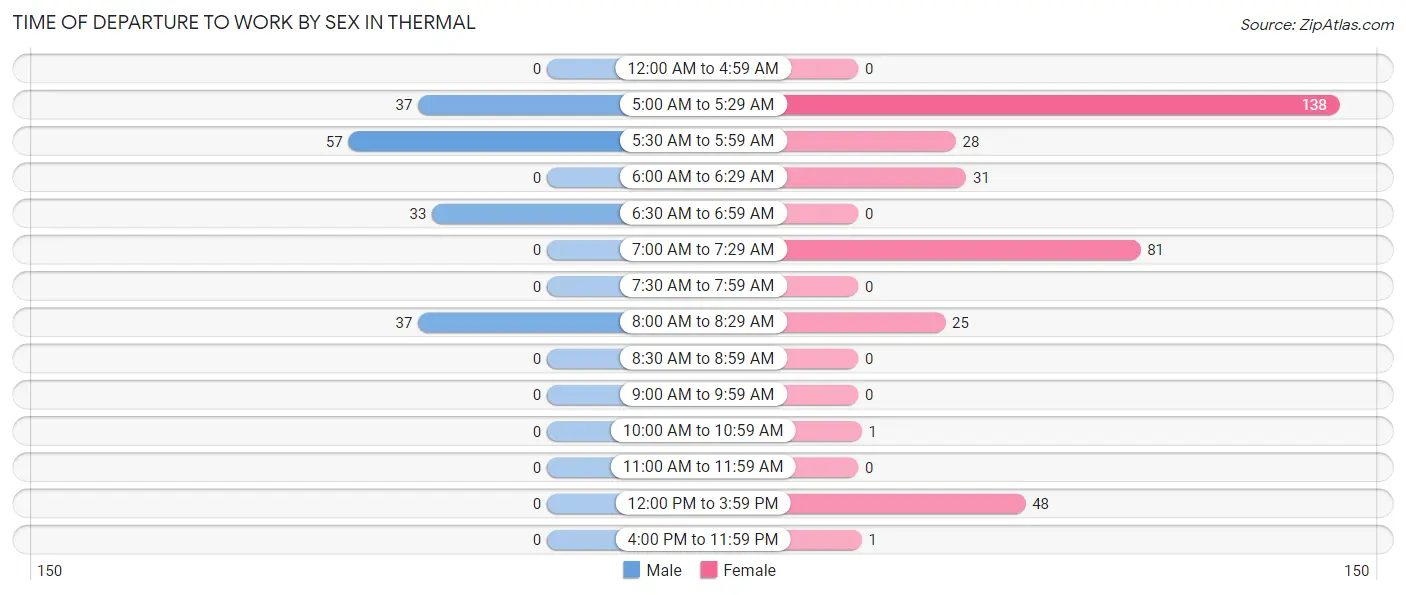
| Time of Departure | Male | Female |
| 12:00 AM to 4:59 AM | 0 (0.0%) | 0 (0.0%) |
| 5:00 AM to 5:29 AM | 37 (22.6%) | 138 (39.1%) |
| 5:30 AM to 5:59 AM | 57 (34.8%) | 28 (7.9%) |
| 6:00 AM to 6:29 AM | 0 (0.0%) | 31 (8.8%) |
| 6:30 AM to 6:59 AM | 33 (20.1%) | 0 (0.0%) |
| 7:00 AM to 7:29 AM | 0 (0.0%) | 81 (23.0%) |
| 7:30 AM to 7:59 AM | 0 (0.0%) | 0 (0.0%) |
| 8:00 AM to 8:29 AM | 37 (22.6%) | 25 (7.1%) |
| 8:30 AM to 8:59 AM | 0 (0.0%) | 0 (0.0%) |
| 9:00 AM to 9:59 AM | 0 (0.0%) | 0 (0.0%) |
| 10:00 AM to 10:59 AM | 0 (0.0%) | 1 (0.3%) |
| 11:00 AM to 11:59 AM | 0 (0.0%) | 0 (0.0%) |
| 12:00 PM to 3:59 PM | 0 (0.0%) | 48 (13.6%) |
| 4:00 PM to 11:59 PM | 0 (0.0%) | 1 (0.3%) |
| Total | 164 (100.0%) | 353 (100.0%) |
Housing Occupancy in Thermal
Occupancy by Ownership in Thermal
Of the total 614 dwellings in Thermal, owner-occupied units account for 426 (69.4%), while renter-occupied units make up 188 (30.6%).
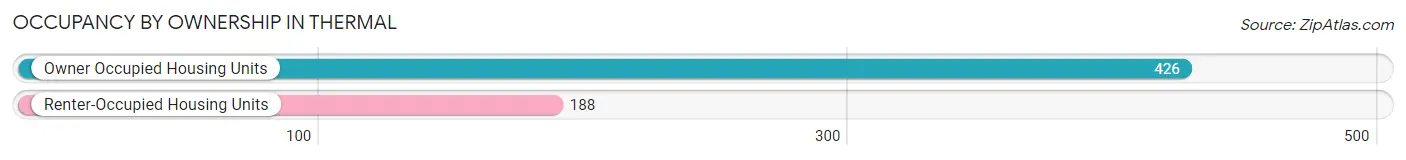
| Occupancy | # Housing Units | % Housing Units |
| Owner Occupied Housing Units | 426 | 69.4% |
| Renter-Occupied Housing Units | 188 | 30.6% |
| Total Occupied Housing Units | 614 | 100.0% |
Occupancy by Household Size in Thermal
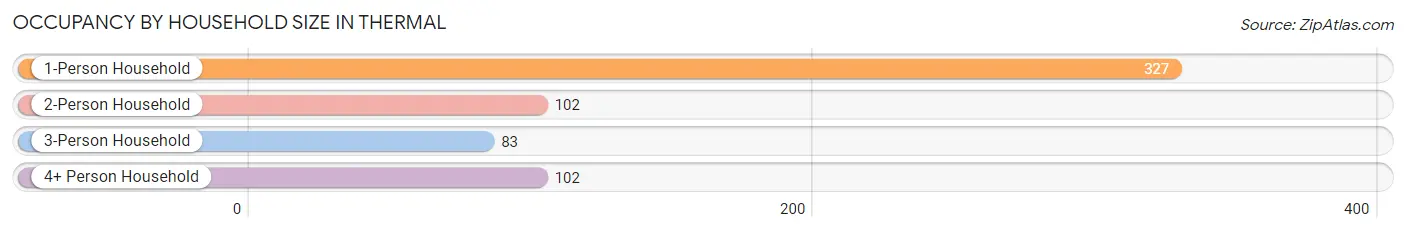
| Household Size | # Housing Units | % Housing Units |
| 1-Person Household | 327 | 53.3% |
| 2-Person Household | 102 | 16.6% |
| 3-Person Household | 83 | 13.5% |
| 4+ Person Household | 102 | 16.6% |
| Total Housing Units | 614 | 100.0% |
Occupancy by Ownership by Household Size in Thermal
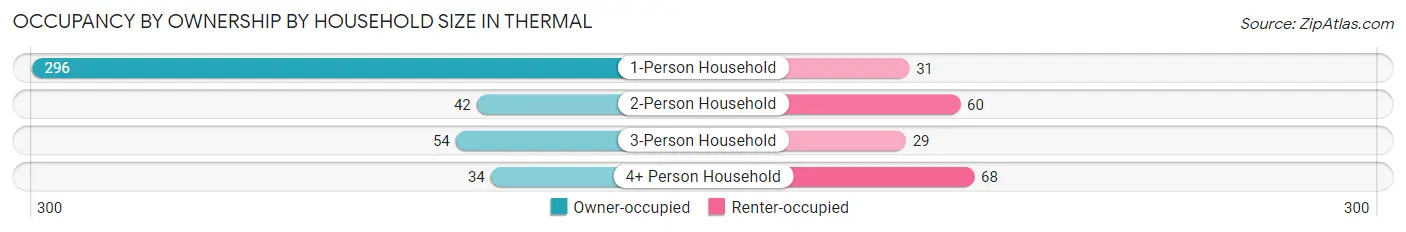
| Household Size | Owner-occupied | Renter-occupied |
| 1-Person Household | 296 (90.5%) | 31 (9.5%) |
| 2-Person Household | 42 (41.2%) | 60 (58.8%) |
| 3-Person Household | 54 (65.1%) | 29 (34.9%) |
| 4+ Person Household | 34 (33.3%) | 68 (66.7%) |
| Total Housing Units | 426 (69.4%) | 188 (30.6%) |
Occupancy by Educational Attainment in Thermal
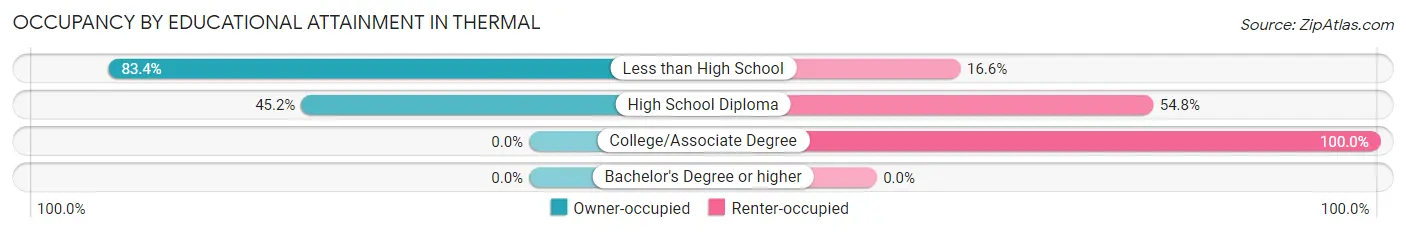
| Household Size | Owner-occupied | Renter-occupied |
| Less than High School | 356 (83.4%) | 71 (16.6%) |
| High School Diploma | 70 (45.2%) | 85 (54.8%) |
| College/Associate Degree | 0 (0.0%) | 32 (100.0%) |
| Bachelor's Degree or higher | 0 (0.0%) | 0 (0.0%) |
Occupancy by Age of Householder in Thermal
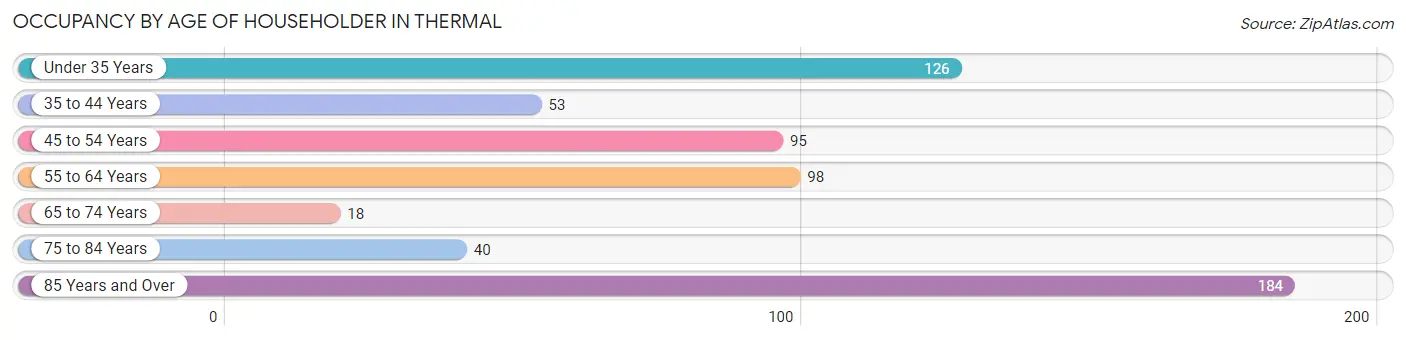
| Age Bracket | # Households | % Households |
| Under 35 Years | 126 | 20.5% |
| 35 to 44 Years | 53 | 8.6% |
| 45 to 54 Years | 95 | 15.5% |
| 55 to 64 Years | 98 | 16.0% |
| 65 to 74 Years | 18 | 2.9% |
| 75 to 84 Years | 40 | 6.5% |
| 85 Years and Over | 184 | 30.0% |
| Total | 614 | 100.0% |
Housing Finances in Thermal
Median Income by Occupancy in Thermal
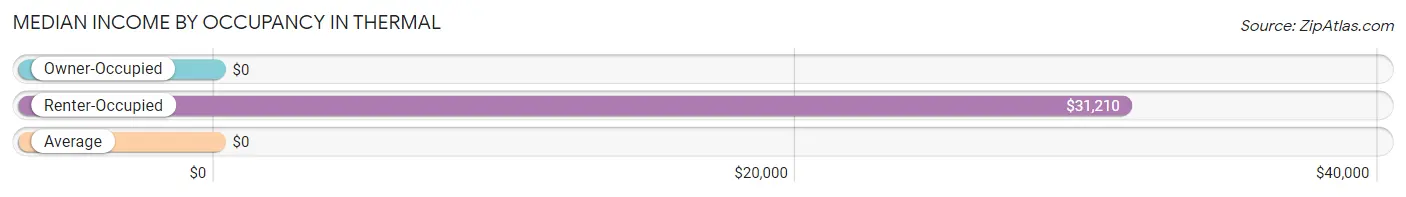
| Occupancy Type | # Households | Median Income |
| Owner-Occupied | 426 (69.4%) | $0 |
| Renter-Occupied | 188 (30.6%) | $31,210 |
| Average | 614 (100.0%) | $0 |
Occupancy by Householder Income Bracket in Thermal
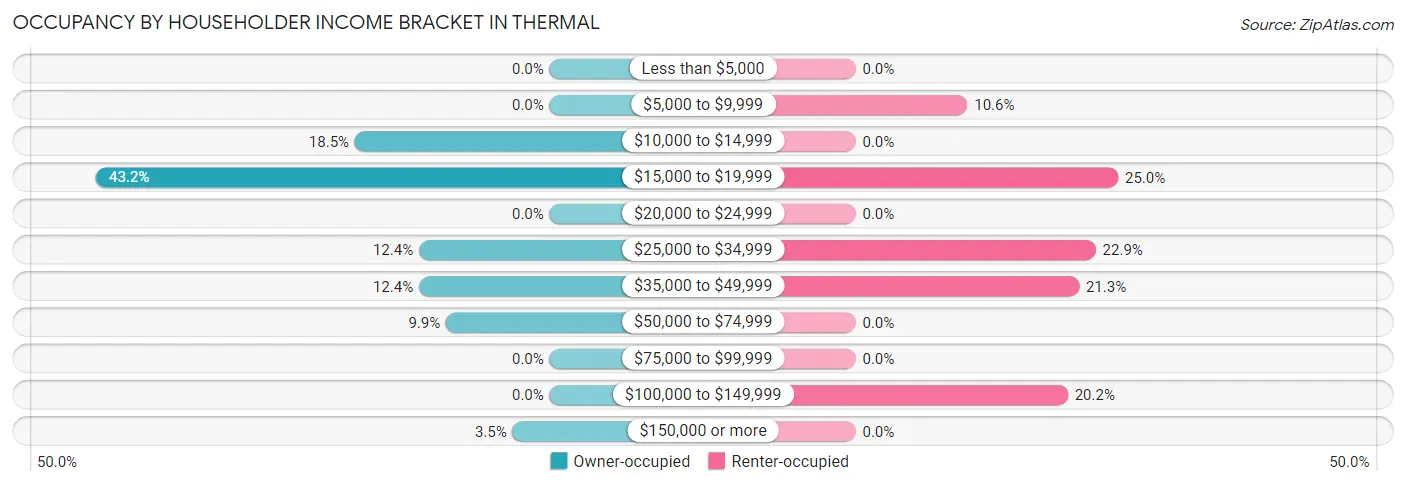
| Income Bracket | Owner-occupied | Renter-occupied |
| Less than $5,000 | 0 (0.0%) | 0 (0.0%) |
| $5,000 to $9,999 | 0 (0.0%) | 20 (10.6%) |
| $10,000 to $14,999 | 79 (18.5%) | 0 (0.0%) |
| $15,000 to $19,999 | 184 (43.2%) | 47 (25.0%) |
| $20,000 to $24,999 | 0 (0.0%) | 0 (0.0%) |
| $25,000 to $34,999 | 53 (12.4%) | 43 (22.9%) |
| $35,000 to $49,999 | 53 (12.4%) | 40 (21.3%) |
| $50,000 to $74,999 | 42 (9.9%) | 0 (0.0%) |
| $75,000 to $99,999 | 0 (0.0%) | 0 (0.0%) |
| $100,000 to $149,999 | 0 (0.0%) | 38 (20.2%) |
| $150,000 or more | 15 (3.5%) | 0 (0.0%) |
| Total | 426 (100.0%) | 188 (100.0%) |
Monthly Housing Cost Tiers in Thermal
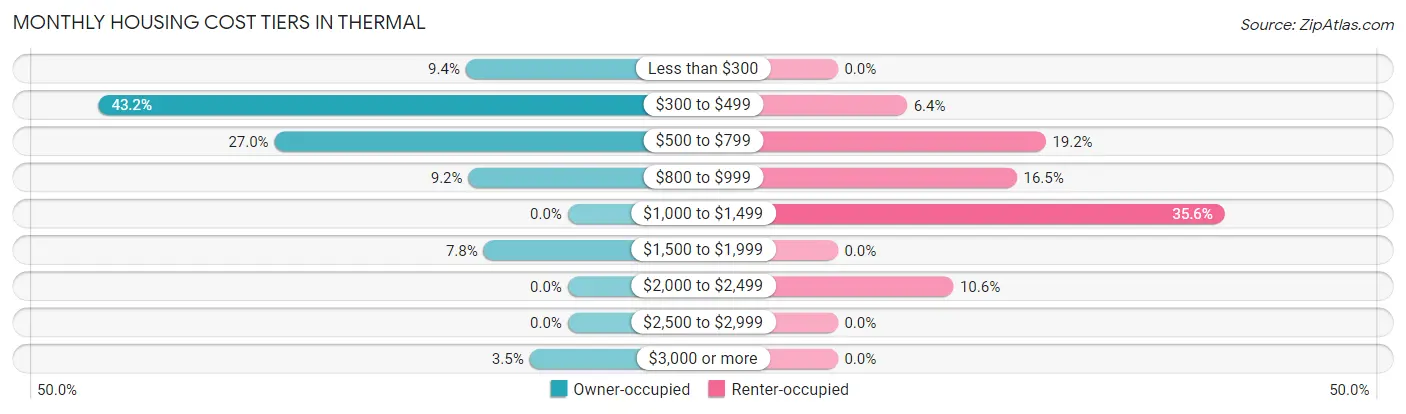
| Monthly Cost | Owner-occupied | Renter-occupied |
| Less than $300 | 40 (9.4%) | 0 (0.0%) |
| $300 to $499 | 184 (43.2%) | 12 (6.4%) |
| $500 to $799 | 115 (27.0%) | 36 (19.2%) |
| $800 to $999 | 39 (9.1%) | 31 (16.5%) |
| $1,000 to $1,499 | 0 (0.0%) | 67 (35.6%) |
| $1,500 to $1,999 | 33 (7.7%) | 0 (0.0%) |
| $2,000 to $2,499 | 0 (0.0%) | 20 (10.6%) |
| $2,500 to $2,999 | 0 (0.0%) | 0 (0.0%) |
| $3,000 or more | 15 (3.5%) | 0 (0.0%) |
| Total | 426 (100.0%) | 188 (100.0%) |
Physical Housing Characteristics in Thermal
Housing Structures in Thermal
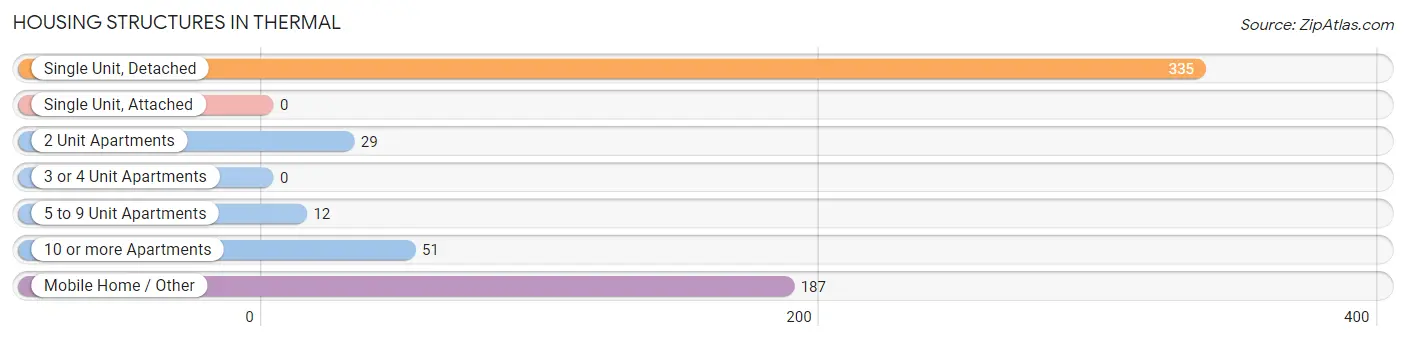
| Structure Type | # Housing Units | % Housing Units |
| Single Unit, Detached | 335 | 54.6% |
| Single Unit, Attached | 0 | 0.0% |
| 2 Unit Apartments | 29 | 4.7% |
| 3 or 4 Unit Apartments | 0 | 0.0% |
| 5 to 9 Unit Apartments | 12 | 1.9% |
| 10 or more Apartments | 51 | 8.3% |
| Mobile Home / Other | 187 | 30.5% |
| Total | 614 | 100.0% |
Housing Structures by Occupancy in Thermal
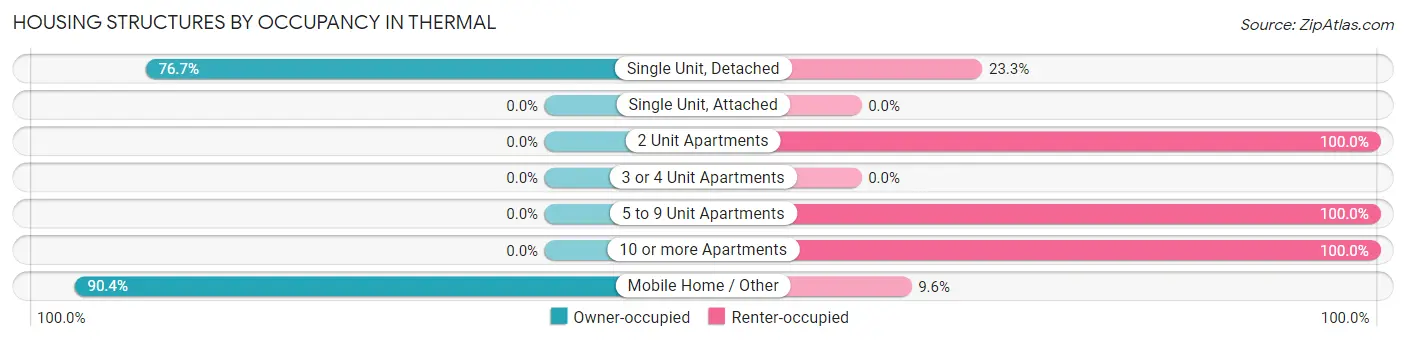
| Structure Type | Owner-occupied | Renter-occupied |
| Single Unit, Detached | 257 (76.7%) | 78 (23.3%) |
| Single Unit, Attached | 0 (0.0%) | 0 (0.0%) |
| 2 Unit Apartments | 0 (0.0%) | 29 (100.0%) |
| 3 or 4 Unit Apartments | 0 (0.0%) | 0 (0.0%) |
| 5 to 9 Unit Apartments | 0 (0.0%) | 12 (100.0%) |
| 10 or more Apartments | 0 (0.0%) | 51 (100.0%) |
| Mobile Home / Other | 169 (90.4%) | 18 (9.6%) |
| Total | 426 (69.4%) | 188 (30.6%) |
Housing Structures by Number of Rooms in Thermal
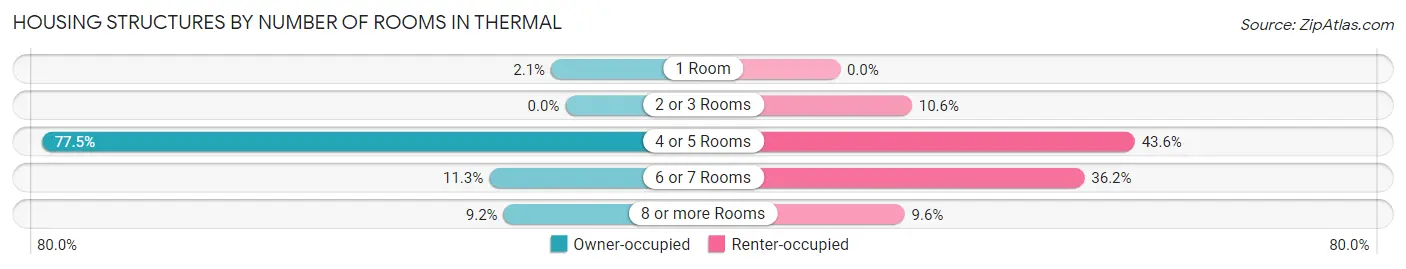
| Number of Rooms | Owner-occupied | Renter-occupied |
| 1 Room | 9 (2.1%) | 0 (0.0%) |
| 2 or 3 Rooms | 0 (0.0%) | 20 (10.6%) |
| 4 or 5 Rooms | 330 (77.5%) | 82 (43.6%) |
| 6 or 7 Rooms | 48 (11.3%) | 68 (36.2%) |
| 8 or more Rooms | 39 (9.1%) | 18 (9.6%) |
| Total | 426 (100.0%) | 188 (100.0%) |
Housing Structure by Heating Type in Thermal
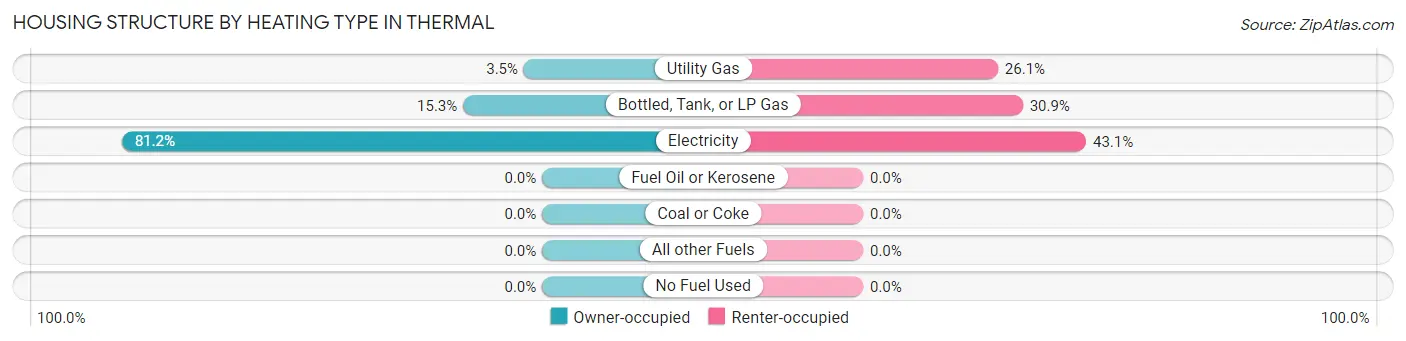
| Heating Type | Owner-occupied | Renter-occupied |
| Utility Gas | 15 (3.5%) | 49 (26.1%) |
| Bottled, Tank, or LP Gas | 65 (15.3%) | 58 (30.8%) |
| Electricity | 346 (81.2%) | 81 (43.1%) |
| Fuel Oil or Kerosene | 0 (0.0%) | 0 (0.0%) |
| Coal or Coke | 0 (0.0%) | 0 (0.0%) |
| All other Fuels | 0 (0.0%) | 0 (0.0%) |
| No Fuel Used | 0 (0.0%) | 0 (0.0%) |
| Total | 426 (100.0%) | 188 (100.0%) |
Household Vehicle Usage in Thermal
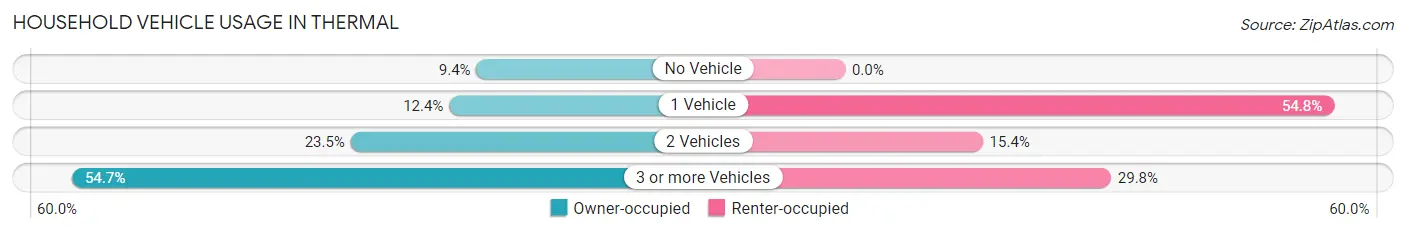
| Vehicles per Household | Owner-occupied | Renter-occupied |
| No Vehicle | 40 (9.4%) | 0 (0.0%) |
| 1 Vehicle | 53 (12.4%) | 103 (54.8%) |
| 2 Vehicles | 100 (23.5%) | 29 (15.4%) |
| 3 or more Vehicles | 233 (54.7%) | 56 (29.8%) |
| Total | 426 (100.0%) | 188 (100.0%) |
Real Estate & Mortgages in Thermal
Real Estate and Mortgage Overview in Thermal
| Characteristic | Without Mortgage | With Mortgage |
| Housing Units | 355 | 71 |
| Median Property Value | $154,300 | $109,500 |
| Median Household Income | $16,338 | $15 |
| Monthly Housing Costs | $475 | $15 |
| Real Estate Taxes | $1,230 | $9 |
Property Value by Mortgage Status in Thermal
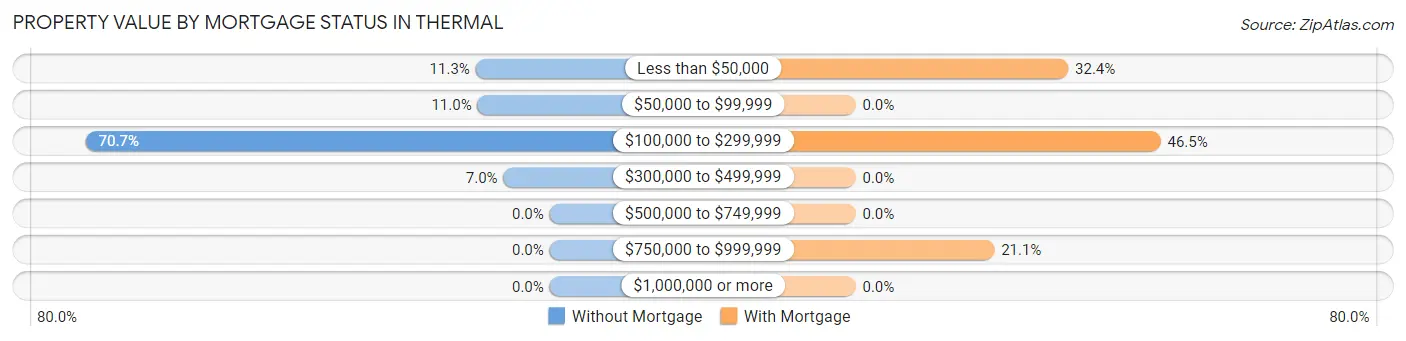
| Property Value | Without Mortgage | With Mortgage |
| Less than $50,000 | 40 (11.3%) | 23 (32.4%) |
| $50,000 to $99,999 | 39 (11.0%) | 0 (0.0%) |
| $100,000 to $299,999 | 251 (70.7%) | 33 (46.5%) |
| $300,000 to $499,999 | 25 (7.0%) | 0 (0.0%) |
| $500,000 to $749,999 | 0 (0.0%) | 0 (0.0%) |
| $750,000 to $999,999 | 0 (0.0%) | 15 (21.1%) |
| $1,000,000 or more | 0 (0.0%) | 0 (0.0%) |
| Total | 355 (100.0%) | 71 (100.0%) |
Household Income by Mortgage Status in Thermal
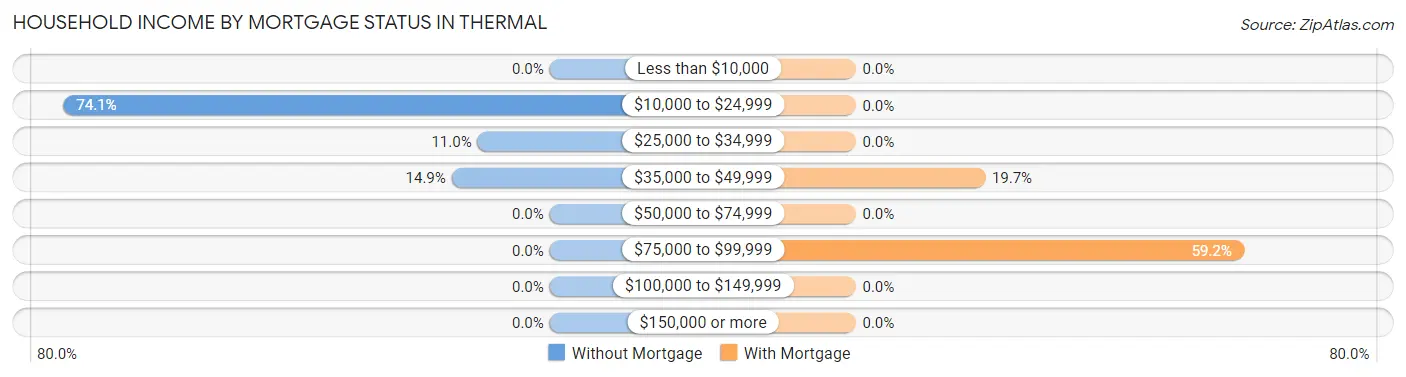
| Household Income | Without Mortgage | With Mortgage |
| Less than $10,000 | 0 (0.0%) | 0 (0.0%) |
| $10,000 to $24,999 | 263 (74.1%) | 0 (0.0%) |
| $25,000 to $34,999 | 39 (11.0%) | 0 (0.0%) |
| $35,000 to $49,999 | 53 (14.9%) | 14 (19.7%) |
| $50,000 to $74,999 | 0 (0.0%) | 0 (0.0%) |
| $75,000 to $99,999 | 0 (0.0%) | 42 (59.2%) |
| $100,000 to $149,999 | 0 (0.0%) | 0 (0.0%) |
| $150,000 or more | 0 (0.0%) | 0 (0.0%) |
| Total | 355 (100.0%) | 71 (100.0%) |
Property Value to Household Income Ratio in Thermal
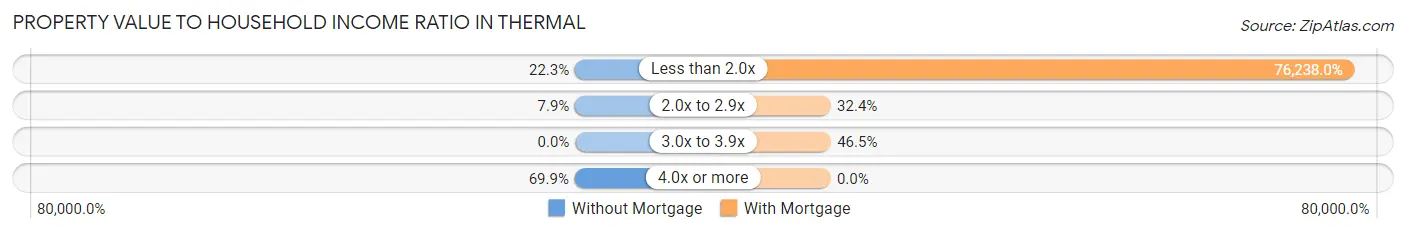
| Value-to-Income Ratio | Without Mortgage | With Mortgage |
| Less than 2.0x | 79 (22.3%) | 54,129 (76,238.0%) |
| 2.0x to 2.9x | 28 (7.9%) | 23 (32.4%) |
| 3.0x to 3.9x | 0 (0.0%) | 33 (46.5%) |
| 4.0x or more | 248 (69.9%) | 0 (0.0%) |
| Total | 355 (100.0%) | 71 (100.0%) |
Real Estate Taxes by Mortgage Status in Thermal
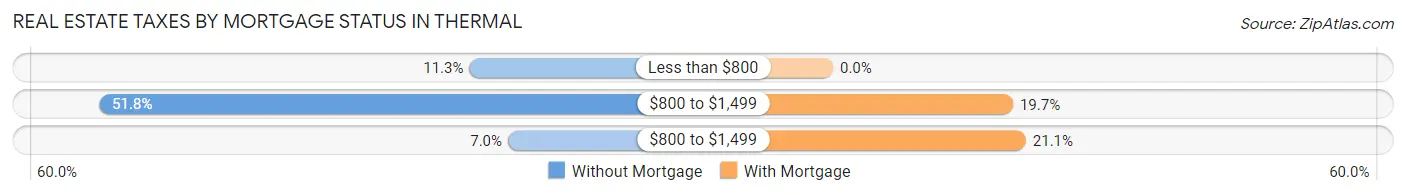
| Property Taxes | Without Mortgage | With Mortgage |
| Less than $800 | 40 (11.3%) | 0 (0.0%) |
| $800 to $1,499 | 184 (51.8%) | 14 (19.7%) |
| $800 to $1,499 | 25 (7.0%) | 15 (21.1%) |
| Total | 355 (100.0%) | 71 (100.0%) |
Health & Disability in Thermal
Health Insurance Coverage by Age in Thermal
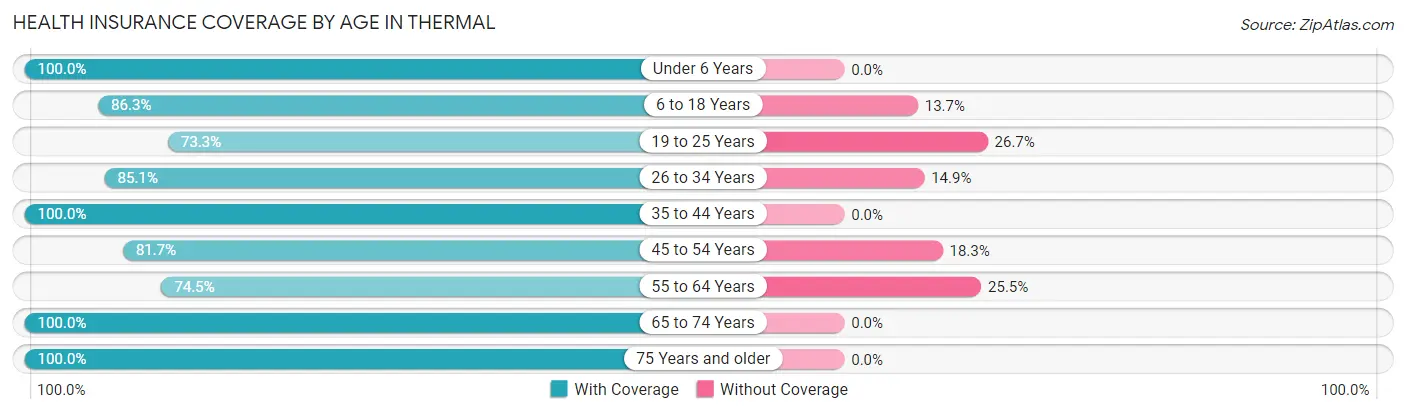
| Age Bracket | With Coverage | Without Coverage |
| Under 6 Years | 138 (100.0%) | 0 (0.0%) |
| 6 to 18 Years | 151 (86.3%) | 24 (13.7%) |
| 19 to 25 Years | 96 (73.3%) | 35 (26.7%) |
| 26 to 34 Years | 194 (85.1%) | 34 (14.9%) |
| 35 to 44 Years | 123 (100.0%) | 0 (0.0%) |
| 45 to 54 Years | 156 (81.7%) | 35 (18.3%) |
| 55 to 64 Years | 73 (74.5%) | 25 (25.5%) |
| 65 to 74 Years | 43 (100.0%) | 0 (0.0%) |
| 75 Years and older | 225 (100.0%) | 0 (0.0%) |
| Total | 1,199 (88.7%) | 153 (11.3%) |
Health Insurance Coverage by Citizenship Status in Thermal
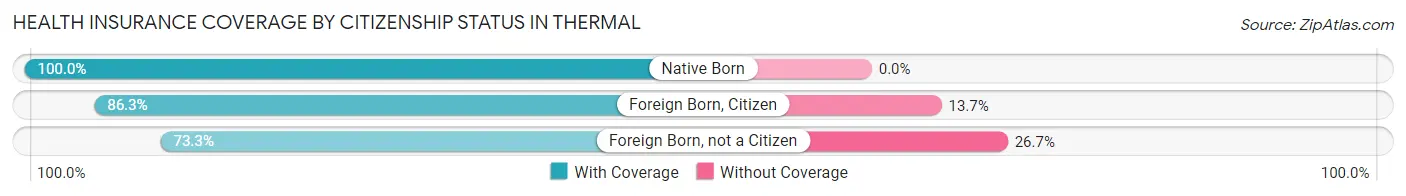
| Citizenship Status | With Coverage | Without Coverage |
| Native Born | 138 (100.0%) | 0 (0.0%) |
| Foreign Born, Citizen | 151 (86.3%) | 24 (13.7%) |
| Foreign Born, not a Citizen | 96 (73.3%) | 35 (26.7%) |
Health Insurance Coverage by Household Income in Thermal
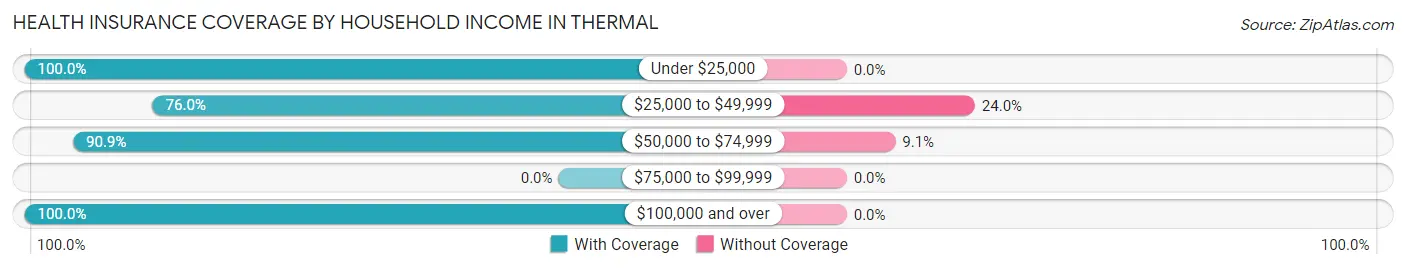
| Household Income | With Coverage | Without Coverage |
| Under $25,000 | 434 (100.0%) | 0 (0.0%) |
| $25,000 to $49,999 | 456 (76.0%) | 144 (24.0%) |
| $50,000 to $74,999 | 80 (90.9%) | 8 (9.1%) |
| $75,000 to $99,999 | 0 (0.0%) | 0 (0.0%) |
| $100,000 and over | 221 (100.0%) | 0 (0.0%) |
Public vs Private Health Insurance Coverage by Age in Thermal
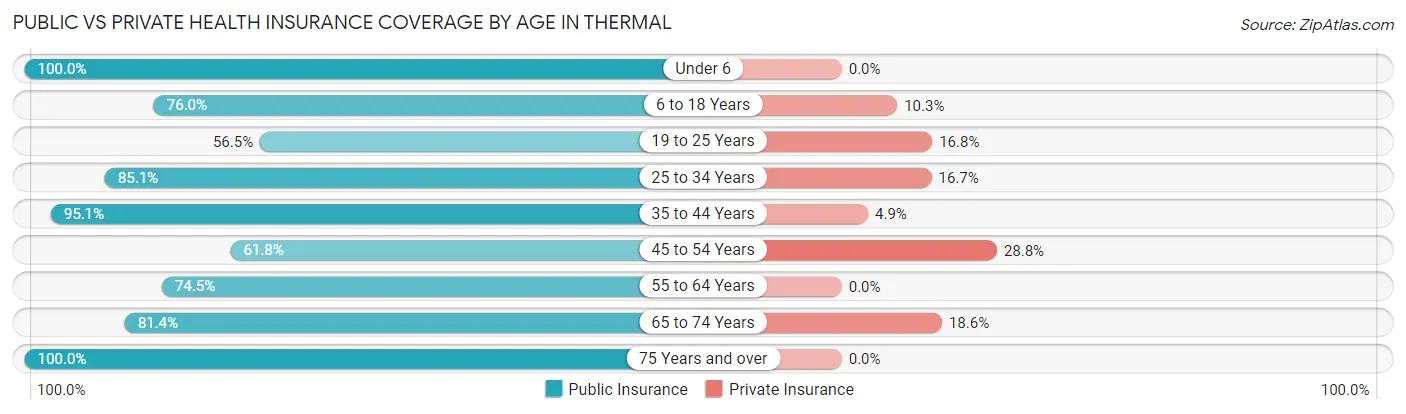
| Age Bracket | Public Insurance | Private Insurance |
| Under 6 | 138 (100.0%) | 0 (0.0%) |
| 6 to 18 Years | 133 (76.0%) | 18 (10.3%) |
| 19 to 25 Years | 74 (56.5%) | 22 (16.8%) |
| 25 to 34 Years | 194 (85.1%) | 38 (16.7%) |
| 35 to 44 Years | 117 (95.1%) | 6 (4.9%) |
| 45 to 54 Years | 118 (61.8%) | 55 (28.8%) |
| 55 to 64 Years | 73 (74.5%) | 0 (0.0%) |
| 65 to 74 Years | 35 (81.4%) | 8 (18.6%) |
| 75 Years and over | 225 (100.0%) | 0 (0.0%) |
| Total | 1,107 (81.9%) | 147 (10.9%) |
Disability Status by Sex by Age in Thermal
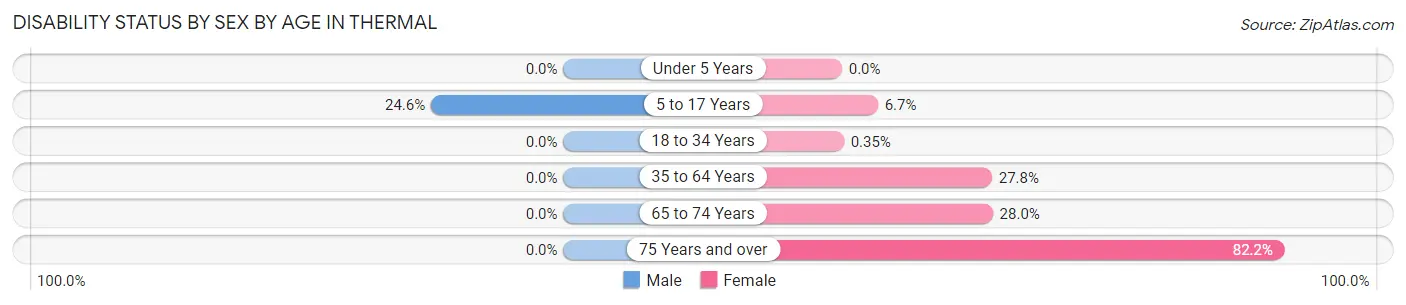
| Age Bracket | Male | Female |
| Under 5 Years | 0 (0.0%) | 0 (0.0%) |
| 5 to 17 Years | 14 (24.6%) | 10 (6.7%) |
| 18 to 34 Years | 0 (0.0%) | 1 (0.4%) |
| 35 to 64 Years | 0 (0.0%) | 76 (27.8%) |
| 65 to 74 Years | 0 (0.0%) | 7 (28.0%) |
| 75 Years and over | 0 (0.0%) | 185 (82.2%) |
Disability Class by Sex by Age in Thermal
Disability Class: Hearing Difficulty
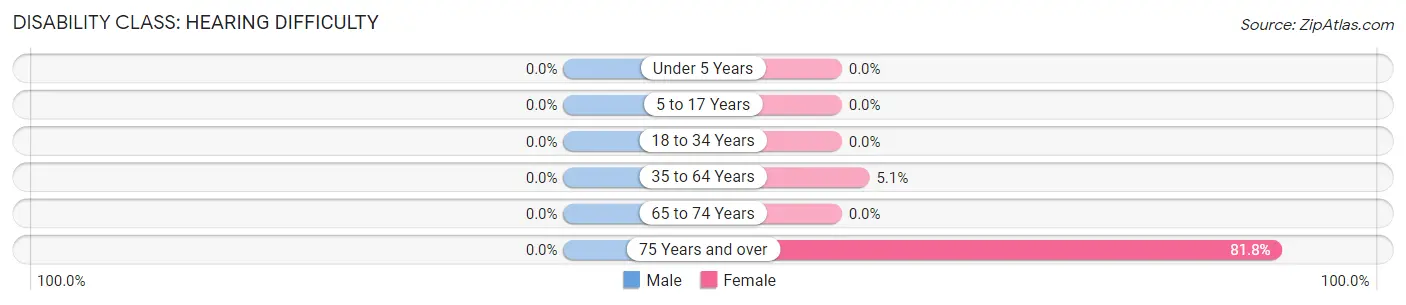
| Age Bracket | Male | Female |
| Under 5 Years | 0 (0.0%) | 0 (0.0%) |
| 5 to 17 Years | 0 (0.0%) | 0 (0.0%) |
| 18 to 34 Years | 0 (0.0%) | 0 (0.0%) |
| 35 to 64 Years | 0 (0.0%) | 14 (5.1%) |
| 65 to 74 Years | 0 (0.0%) | 0 (0.0%) |
| 75 Years and over | 0 (0.0%) | 184 (81.8%) |
Disability Class: Vision Difficulty
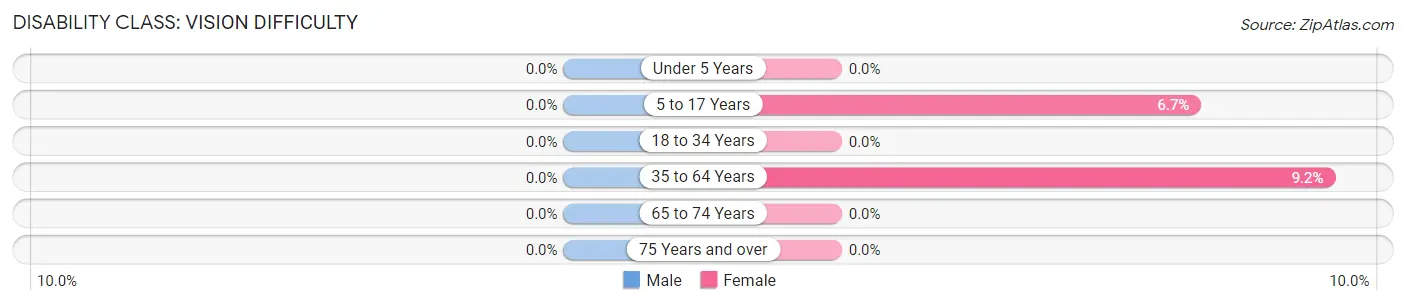
| Age Bracket | Male | Female |
| Under 5 Years | 0 (0.0%) | 0 (0.0%) |
| 5 to 17 Years | 0 (0.0%) | 10 (6.7%) |
| 18 to 34 Years | 0 (0.0%) | 0 (0.0%) |
| 35 to 64 Years | 0 (0.0%) | 25 (9.2%) |
| 65 to 74 Years | 0 (0.0%) | 0 (0.0%) |
| 75 Years and over | 0 (0.0%) | 0 (0.0%) |
Disability Class: Cognitive Difficulty
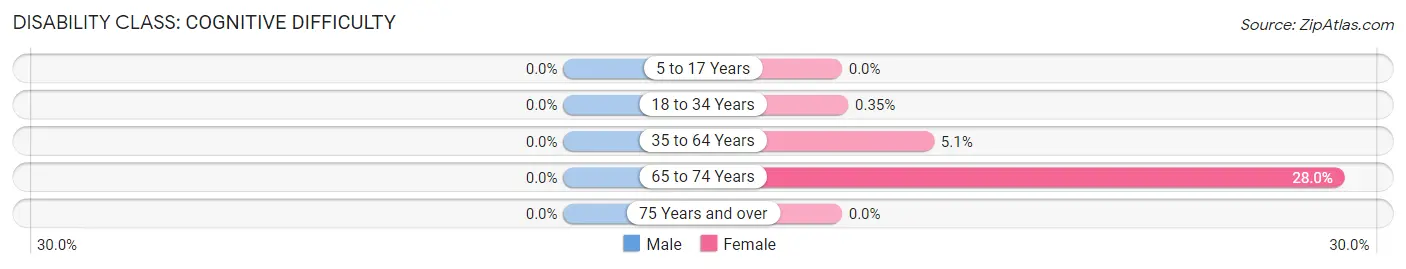
| Age Bracket | Male | Female |
| 5 to 17 Years | 0 (0.0%) | 0 (0.0%) |
| 18 to 34 Years | 0 (0.0%) | 1 (0.4%) |
| 35 to 64 Years | 0 (0.0%) | 14 (5.1%) |
| 65 to 74 Years | 0 (0.0%) | 7 (28.0%) |
| 75 Years and over | 0 (0.0%) | 0 (0.0%) |
Disability Class: Ambulatory Difficulty
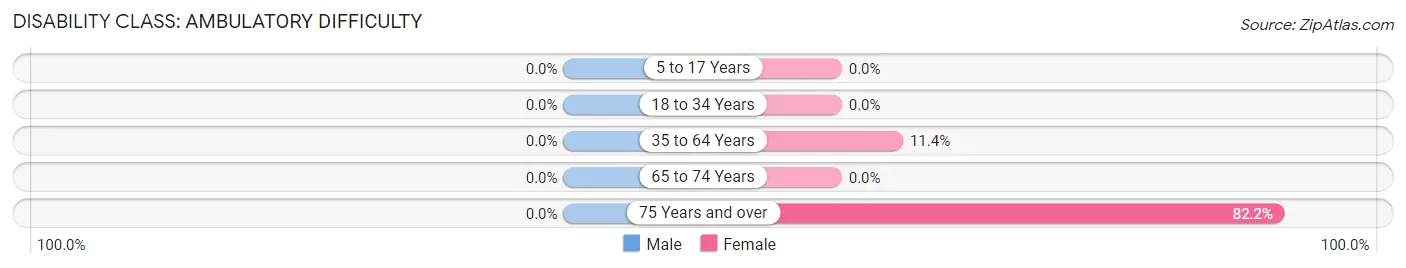
| Age Bracket | Male | Female |
| 5 to 17 Years | 0 (0.0%) | 0 (0.0%) |
| 18 to 34 Years | 0 (0.0%) | 0 (0.0%) |
| 35 to 64 Years | 0 (0.0%) | 31 (11.4%) |
| 65 to 74 Years | 0 (0.0%) | 0 (0.0%) |
| 75 Years and over | 0 (0.0%) | 185 (82.2%) |
Disability Class: Self-Care Difficulty
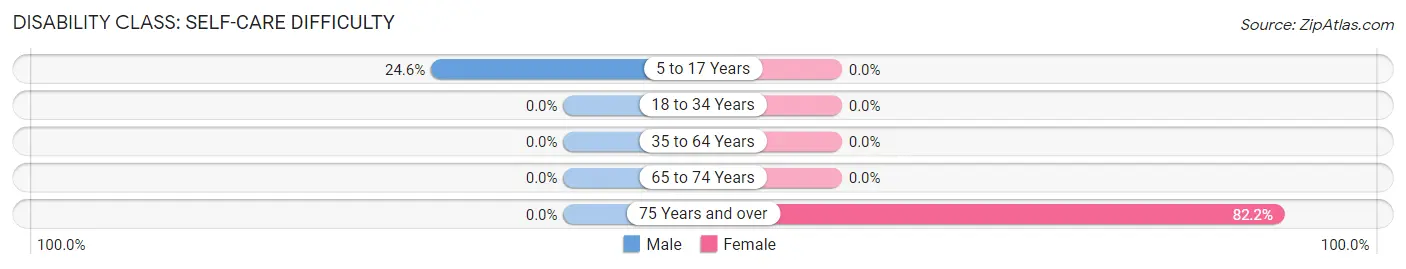
| Age Bracket | Male | Female |
| 5 to 17 Years | 14 (24.6%) | 0 (0.0%) |
| 18 to 34 Years | 0 (0.0%) | 0 (0.0%) |
| 35 to 64 Years | 0 (0.0%) | 0 (0.0%) |
| 65 to 74 Years | 0 (0.0%) | 0 (0.0%) |
| 75 Years and over | 0 (0.0%) | 185 (82.2%) |
Technology Access in Thermal
Computing Device Access in Thermal
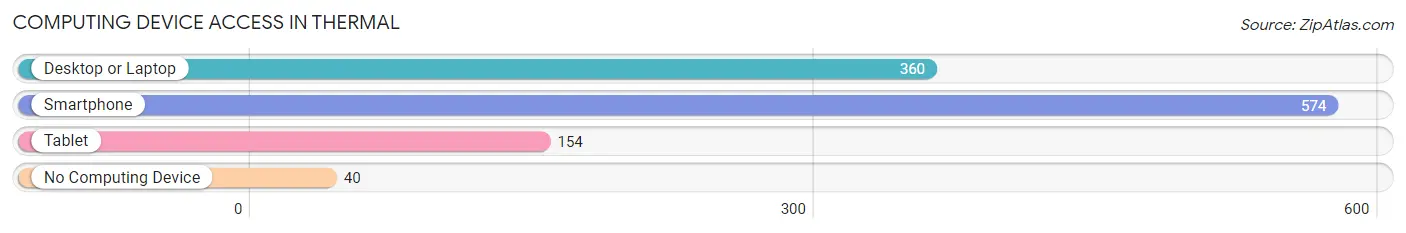
| Device Type | # Households | % Households |
| Desktop or Laptop | 360 | 58.6% |
| Smartphone | 574 | 93.5% |
| Tablet | 154 | 25.1% |
| No Computing Device | 40 | 6.5% |
| Total | 614 | 100.0% |
Internet Access in Thermal
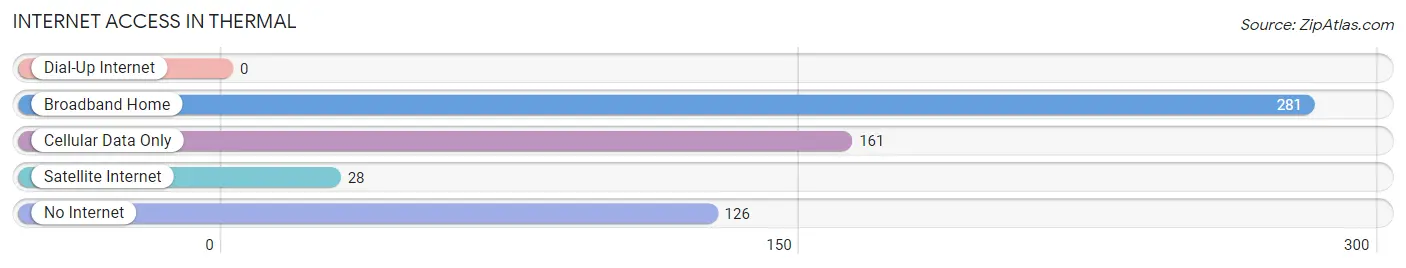
| Internet Type | # Households | % Households |
| Dial-Up Internet | 0 | 0.0% |
| Broadband Home | 281 | 45.8% |
| Cellular Data Only | 161 | 26.2% |
| Satellite Internet | 28 | 4.6% |
| No Internet | 126 | 20.5% |
| Total | 614 | 100.0% |
Thermal Summary
Thermal is an unincorporated community located in Riverside County, California. It is situated in the Coachella Valley, approximately 25 miles southeast of Palm Springs and about 130 miles east of Los Angeles. Thermal is known for its agricultural production, particularly of dates, and is home to the Torres Martinez Desert Cahuilla Indians.
History
The area now known as Thermal has been inhabited for thousands of years by the Cahuilla Indians. The Cahuilla were hunter-gatherers who lived in small villages and relied on the natural resources of the area for their sustenance. The Cahuilla were known for their basket weaving and pottery making, and they also traded with other tribes in the region.
In the late 19th century, the area was settled by Mexican and American farmers who established small farms and ranches. The area was known as “Hot Springs” due to the hot springs located in the area. In the early 20th century, the area was renamed “Thermal” after the hot springs.
In the 1950s, the area began to experience rapid growth due to the development of the nearby Salton Sea. The area became a popular destination for tourists and retirees, and the population of Thermal began to grow.
Geography
Thermal is located in the Coachella Valley, a desert region in southeastern California. The area is characterized by hot, dry summers and mild winters. The average temperature in Thermal is around 90 degrees Fahrenheit in the summer and around 60 degrees Fahrenheit in the winter.
The terrain of Thermal is mostly flat, with some hills and mountains in the surrounding area. The area is home to the Torres Martinez Desert Cahuilla Indians Reservation, which covers approximately 7,000 acres.
Economy
Thermal’s economy is largely based on agriculture. The area is known for its production of dates, which are grown in the nearby Coachella Valley. Other crops grown in the area include citrus fruits, melons, and vegetables.
The area is also home to several manufacturing and industrial businesses, including a cement plant and a solar energy plant. Tourism is also an important part of the local economy, with many visitors coming to the area to enjoy the hot springs and other attractions.
Demographics
As of the 2010 census, the population of Thermal was 2,853. The racial makeup of the town was 57.3% White, 0.7% African American, 0.3% Native American, 0.2% Asian, 0.1% Pacific Islander, 38.2% from other races, and 3.4% from two or more races. Hispanic or Latino of any race were 75.3% of the population.
The median household income in Thermal was $30,938, and the median family income was $35,938. The per capita income for the town was $13,938. About 24.3% of families and 28.2% of the population were below the poverty line, including 37.3% of those under age 18 and 10.3% of those age 65 or over.
Thermal is a small, rural community with a diverse population and a strong agricultural economy. The area is known for its hot springs and its production of dates, and it is a popular destination for tourists and retirees. The town has a rich history and culture, and it is home to the Torres Martinez Desert Cahuilla Indians.
Common Questions
What is Per Capita Income in Thermal?
Per Capita income in Thermal is $15,718.
What is the Median Family Income in Thermal?
Median Family Income in Thermal is $32,340.
What is Income or Wage Gap in Thermal?
Income or Wage Gap in Thermal is 73.1%.
Women in Thermal earn 26.9 cents for every dollar earned by a man.
What is Inequality or Gini Index in Thermal?
Inequality or Gini Index in Thermal is 0.43.
What is the Total Population of Thermal?
Total Population of Thermal is 1,352.
What is the Total Male Population of Thermal?
Total Male Population of Thermal is 345.
What is the Total Female Population of Thermal?
Total Female Population of Thermal is 1,007.
What is the Ratio of Males per 100 Females in Thermal?
There are 34.26 Males per 100 Females in Thermal.
What is the Ratio of Females per 100 Males in Thermal?
There are 291.88 Females per 100 Males in Thermal.
What is the Median Population Age in Thermal?
Median Population Age in Thermal is 35.1 Years.
What is the Average Family Size in Thermal
Average Family Size in Thermal is 3.7 People.
What is the Average Household Size in Thermal
Average Household Size in Thermal is 2.2 People.
How Large is the Labor Force in Thermal?
There are 583 People in the Labor Forcein in Thermal.
What is the Percentage of People in the Labor Force in Thermal?
54.0% of People are in the Labor Force in Thermal.
What is the Unemployment Rate in Thermal?
Unemployment Rate in Thermal is 6.9%.