Olmito, TX Map & Demographics
Olmito Map
Olmito Overview
$16,224
PER CAPITA INCOME
$38,500
AVG FAMILY INCOME
$37,950
AVG HOUSEHOLD INCOME
0.47
INEQUALITY / GINI INDEX
794
TOTAL POPULATION
445
MALE POPULATION
349
FEMALE POPULATION
127.51
MALES / 100 FEMALES
78.43
FEMALES / 100 MALES
31.1
MEDIAN AGE
3.2
AVG FAMILY SIZE
2.8
AVG HOUSEHOLD SIZE
339
LABOR FORCE [ PEOPLE ]
56.5%
PERCENT IN LABOR FORCE
0.6%
UNEMPLOYMENT RATE
Olmito Zip Codes
Olmito Area Codes
Income in Olmito
Income Overview in Olmito
Per Capita Income in Olmito is $16,224, while median incomes of families and households are $38,500 and $37,950 respectively.
| Characteristic | Number | Measure |
| Per Capita Income | 794 | $16,224 |
| Median Family Income | 208 | $38,500 |
| Mean Family Income | 208 | $47,788 |
| Median Household Income | 282 | $37,950 |
| Mean Household Income | 282 | $43,954 |
| Income Deficit | 208 | $0 |
| Wage / Income Gap (%) | 794 | 0.00% |
| Wage / Income Gap ($) | 794 | 100.00¢ per $1 |
| Gini / Inequality Index | 794 | 0.47 |
Earnings by Sex in Olmito
| Sex | Number | Average Earnings |
| Male | 243 (65.7%) | $0 |
| Female | 127 (34.3%) | $0 |
| Total | 370 (100.0%) | $0 |
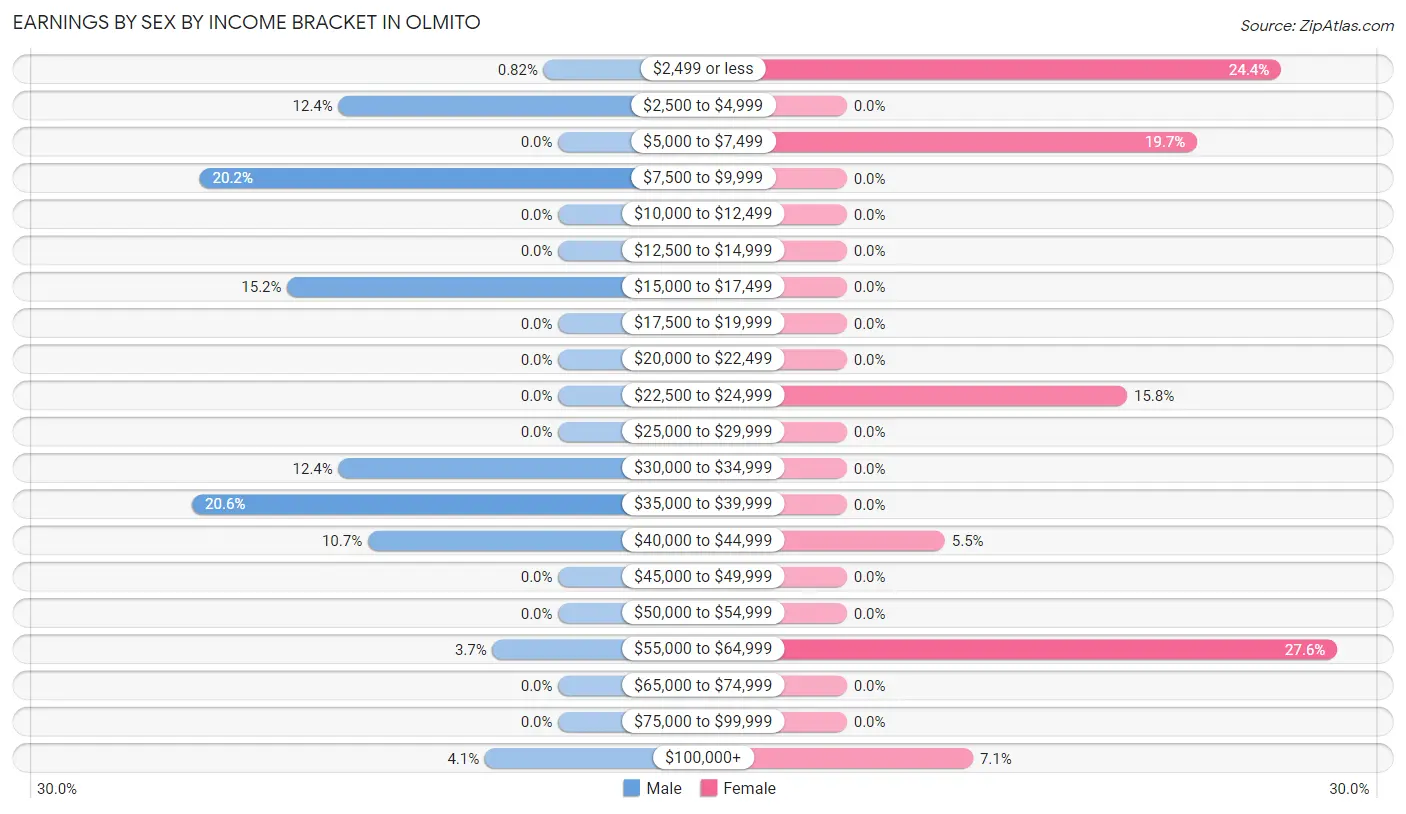
Earnings by Sex by Income Bracket in Olmito
The most common earnings brackets in Olmito are $35,000 to $39,999 for men (50 | 20.6%) and $55,000 to $64,999 for women (35 | 27.6%).
| Income | Male | Female |
| $2,499 or less | 2 (0.8%) | 31 (24.4%) |
| $2,500 to $4,999 | 30 (12.3%) | 0 (0.0%) |
| $5,000 to $7,499 | 0 (0.0%) | 25 (19.7%) |
| $7,500 to $9,999 | 49 (20.2%) | 0 (0.0%) |
| $10,000 to $12,499 | 0 (0.0%) | 0 (0.0%) |
| $12,500 to $14,999 | 0 (0.0%) | 0 (0.0%) |
| $15,000 to $17,499 | 37 (15.2%) | 0 (0.0%) |
| $17,500 to $19,999 | 0 (0.0%) | 0 (0.0%) |
| $20,000 to $22,499 | 0 (0.0%) | 0 (0.0%) |
| $22,500 to $24,999 | 0 (0.0%) | 20 (15.8%) |
| $25,000 to $29,999 | 0 (0.0%) | 0 (0.0%) |
| $30,000 to $34,999 | 30 (12.3%) | 0 (0.0%) |
| $35,000 to $39,999 | 50 (20.6%) | 0 (0.0%) |
| $40,000 to $44,999 | 26 (10.7%) | 7 (5.5%) |
| $45,000 to $49,999 | 0 (0.0%) | 0 (0.0%) |
| $50,000 to $54,999 | 0 (0.0%) | 0 (0.0%) |
| $55,000 to $64,999 | 9 (3.7%) | 35 (27.6%) |
| $65,000 to $74,999 | 0 (0.0%) | 0 (0.0%) |
| $75,000 to $99,999 | 0 (0.0%) | 0 (0.0%) |
| $100,000+ | 10 (4.1%) | 9 (7.1%) |
| Total | 243 (100.0%) | 127 (100.0%) |
Earnings by Sex by Educational Attainment in Olmito
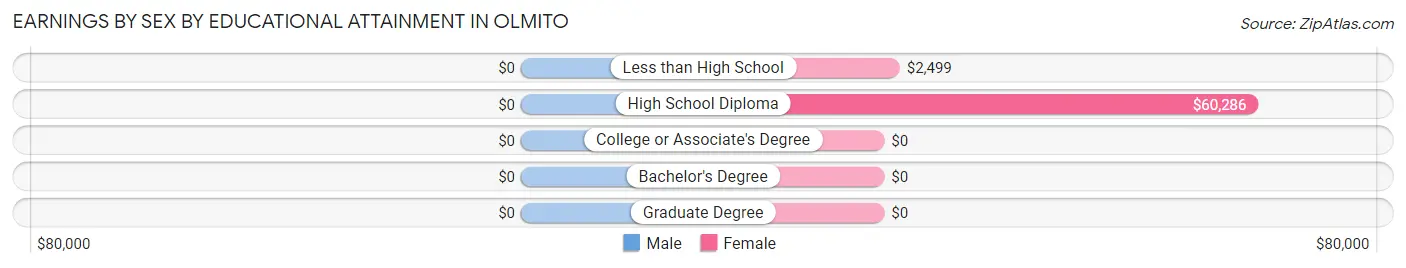
| Educational Attainment | Male Income | Female Income |
| Less than High School | - | - |
| High School Diploma | - | - |
| College or Associate's Degree | - | - |
| Bachelor's Degree | - | - |
| Graduate Degree | - | - |
| Total | - | - |
Family Income in Olmito
Family Income Brackets in Olmito
According to the Olmito family income data, there are 67 families falling into the $15,000 to $24,999 income range, which is the most common income bracket and makes up 32.2% of all families.
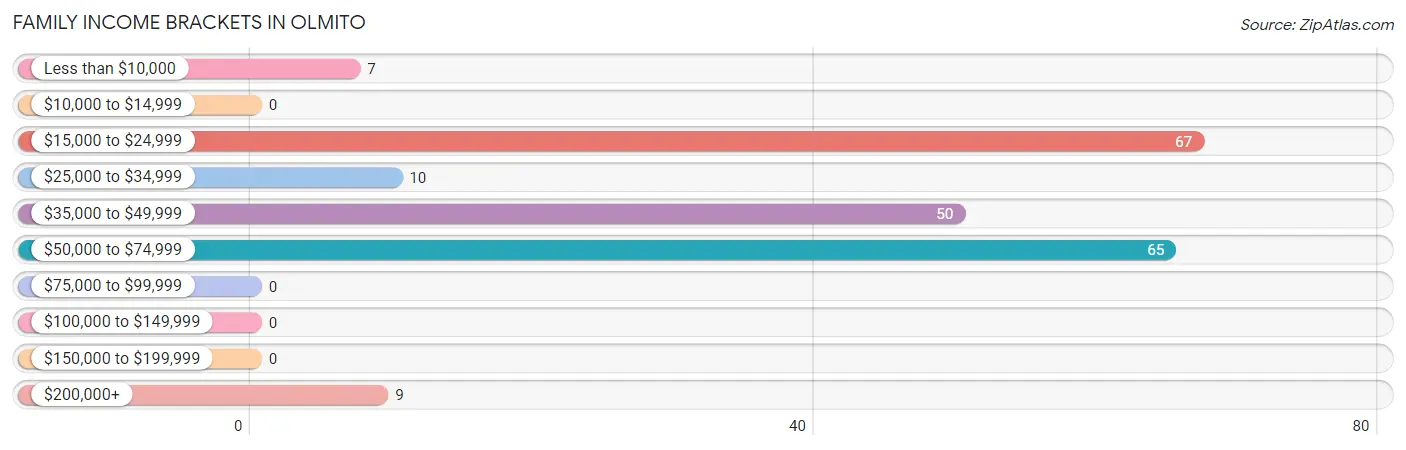
| Income Bracket | # Families | % Families |
| Less than $10,000 | 7 | 3.4% |
| $10,000 to $14,999 | 0 | 0.0% |
| $15,000 to $24,999 | 67 | 32.2% |
| $25,000 to $34,999 | 10 | 4.8% |
| $35,000 to $49,999 | 50 | 24.0% |
| $50,000 to $74,999 | 65 | 31.3% |
| $75,000 to $99,999 | 0 | 0.0% |
| $100,000 to $149,999 | 0 | 0.0% |
| $150,000 to $199,999 | 0 | 0.0% |
| $200,000+ | 9 | 4.3% |
Family Income by Famaliy Size in Olmito
5-person families (45 | 21.6%) account for the highest median family income in Olmito with $59,583 per family, while 2-person families (102 | 49.0%) have the highest median income of $19,600 per family member.
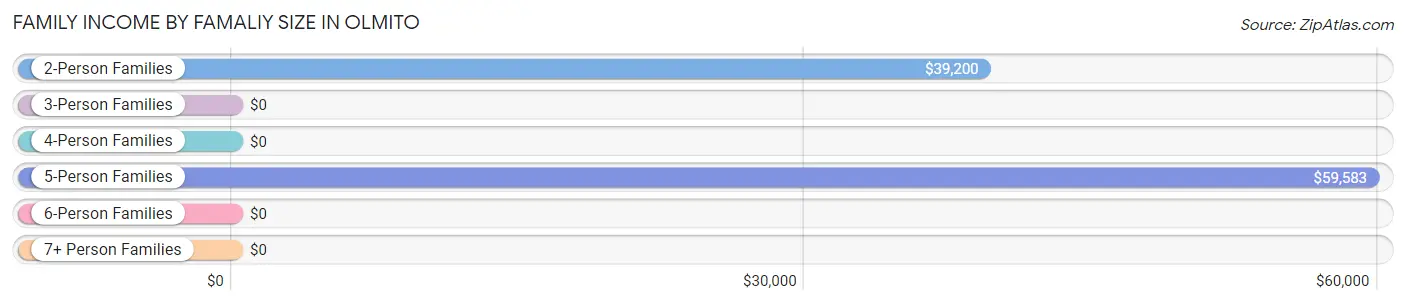
| Income Bracket | # Families | Median Income |
| 2-Person Families | 102 (49.0%) | $39,200 |
| 3-Person Families | 17 (8.2%) | $0 |
| 4-Person Families | 44 (21.1%) | $0 |
| 5-Person Families | 45 (21.6%) | $59,583 |
| 6-Person Families | 0 (0.0%) | $0 |
| 7+ Person Families | 0 (0.0%) | $0 |
| Total | 208 (100.0%) | $38,500 |
Family Income by Number of Earners in Olmito
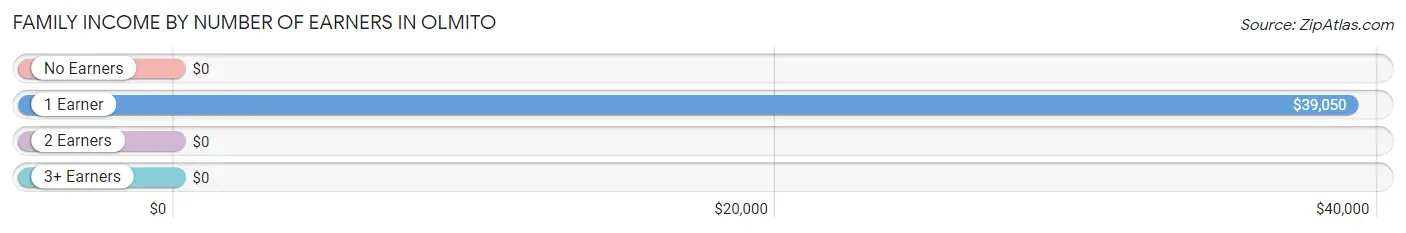
| Number of Earners | # Families | Median Income |
| No Earners | 15 (7.2%) | $0 |
| 1 Earner | 126 (60.6%) | $39,050 |
| 2 Earners | 48 (23.1%) | $0 |
| 3+ Earners | 19 (9.1%) | $0 |
| Total | 208 (100.0%) | $38,500 |
Household Income in Olmito
Household Income Brackets in Olmito
With 76 households falling in the category, the $35,000 to $49,999 income range is the most frequent in Olmito, accounting for 27.0% of all households.
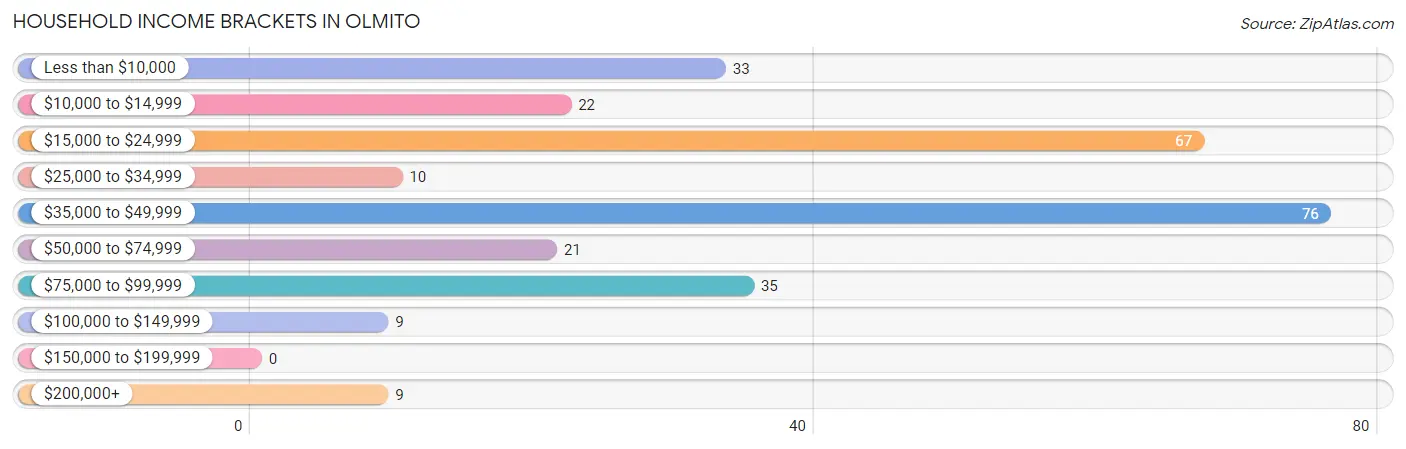
| Income Bracket | # Households | % Households |
| Less than $10,000 | 33 | 11.7% |
| $10,000 to $14,999 | 22 | 7.8% |
| $15,000 to $24,999 | 67 | 23.8% |
| $25,000 to $34,999 | 10 | 3.5% |
| $35,000 to $49,999 | 76 | 27.0% |
| $50,000 to $74,999 | 21 | 7.4% |
| $75,000 to $99,999 | 35 | 12.4% |
| $100,000 to $149,999 | 9 | 3.2% |
| $150,000 to $199,999 | 0 | 0.0% |
| $200,000+ | 9 | 3.2% |
Household Income by Householder Age in Olmito
The median household income in Olmito is $37,950, with the highest median household income of $39,350 found in the 45 to 64 years age bracket for the primary householder. A total of 134 households (47.5%) fall into this category.
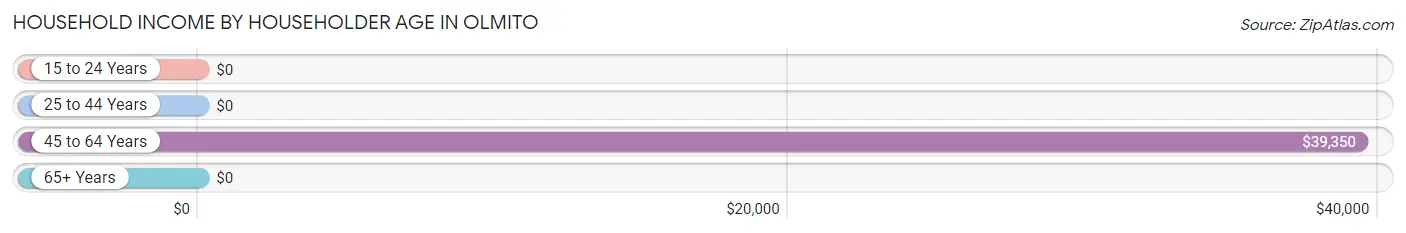
| Income Bracket | # Households | Median Income |
| 15 to 24 Years | 0 (0.0%) | $0 |
| 25 to 44 Years | 88 (31.2%) | $0 |
| 45 to 64 Years | 134 (47.5%) | $39,350 |
| 65+ Years | 60 (21.3%) | $0 |
| Total | 282 (100.0%) | $37,950 |
Poverty in Olmito
Income Below Poverty by Sex and Age in Olmito
With 35.3% poverty level for males and 46.4% for females among the residents of Olmito, 12 to 14 year old males and 6 to 11 year old females are the most vulnerable to poverty, with 15 males (100.0%) and 17 females (100.0%) in their respective age groups living below the poverty level.
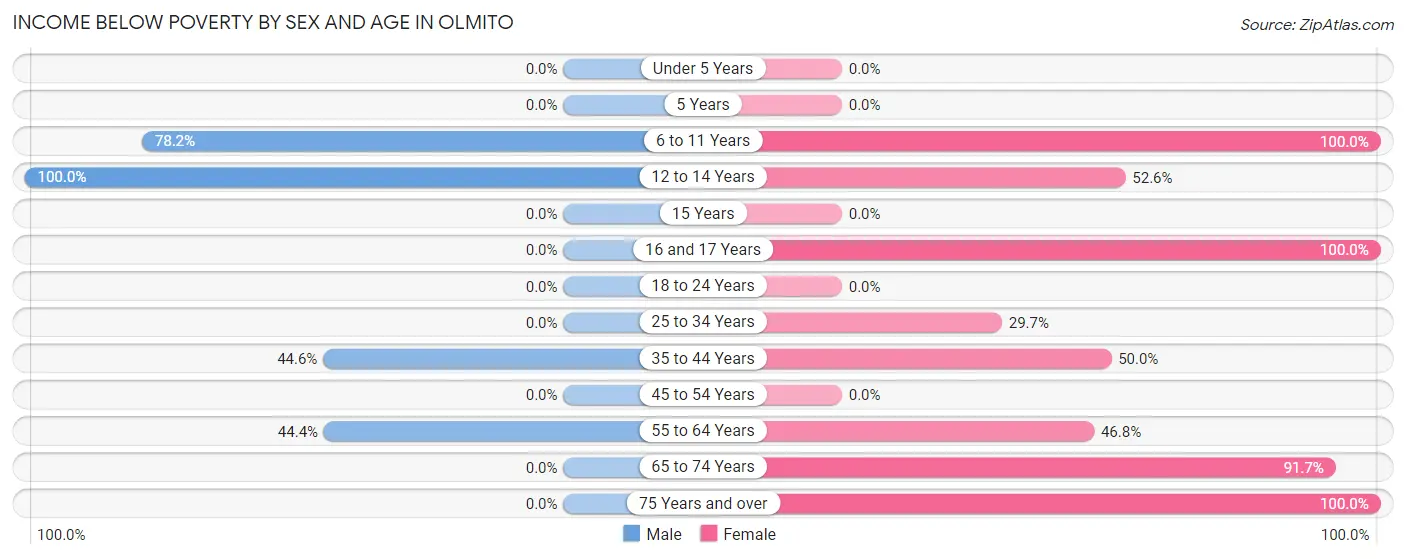
| Age Bracket | Male | Female |
| Under 5 Years | 0 (0.0%) | 0 (0.0%) |
| 5 Years | 0 (0.0%) | 0 (0.0%) |
| 6 to 11 Years | 97 (78.2%) | 17 (100.0%) |
| 12 to 14 Years | 15 (100.0%) | 10 (52.6%) |
| 15 Years | 0 (0.0%) | 0 (0.0%) |
| 16 and 17 Years | 0 (0.0%) | 9 (100.0%) |
| 18 to 24 Years | 0 (0.0%) | 0 (0.0%) |
| 25 to 34 Years | 0 (0.0%) | 49 (29.7%) |
| 35 to 44 Years | 37 (44.6%) | 7 (50.0%) |
| 45 to 54 Years | 0 (0.0%) | 0 (0.0%) |
| 55 to 64 Years | 8 (44.4%) | 22 (46.8%) |
| 65 to 74 Years | 0 (0.0%) | 22 (91.7%) |
| 75 Years and over | 0 (0.0%) | 26 (100.0%) |
| Total | 157 (35.3%) | 162 (46.4%) |
Income Above Poverty by Sex and Age in Olmito
According to the poverty statistics in Olmito, males aged under 5 years and females aged under 5 years are the age groups that are most secure financially, with 100.0% of males and 100.0% of females in these age groups living above the poverty line.
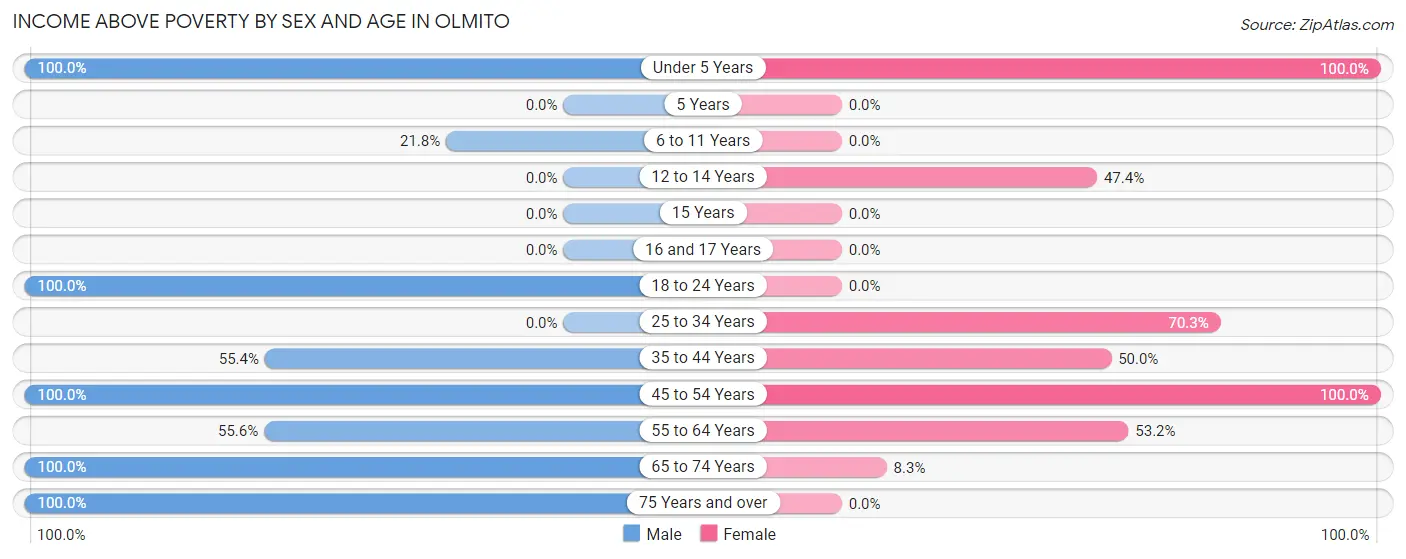
| Age Bracket | Male | Female |
| Under 5 Years | 10 (100.0%) | 9 (100.0%) |
| 5 Years | 0 (0.0%) | 0 (0.0%) |
| 6 to 11 Years | 27 (21.8%) | 0 (0.0%) |
| 12 to 14 Years | 0 (0.0%) | 9 (47.4%) |
| 15 Years | 0 (0.0%) | 0 (0.0%) |
| 16 and 17 Years | 0 (0.0%) | 0 (0.0%) |
| 18 to 24 Years | 96 (100.0%) | 0 (0.0%) |
| 25 to 34 Years | 0 (0.0%) | 116 (70.3%) |
| 35 to 44 Years | 46 (55.4%) | 7 (50.0%) |
| 45 to 54 Years | 81 (100.0%) | 19 (100.0%) |
| 55 to 64 Years | 10 (55.6%) | 25 (53.2%) |
| 65 to 74 Years | 8 (100.0%) | 2 (8.3%) |
| 75 Years and over | 10 (100.0%) | 0 (0.0%) |
| Total | 288 (64.7%) | 187 (53.6%) |
Income Below Poverty Among Married-Couple Families in Olmito
The poverty statistics for married-couple families in Olmito show that 36.6% or 45 of the total 123 families live below the poverty line. Families with 1 or 2 children have the highest poverty rate of 100.0%, comprising of 45 families. On the other hand, families with no children have the lowest poverty rate of 0.0%, which includes 0 families.
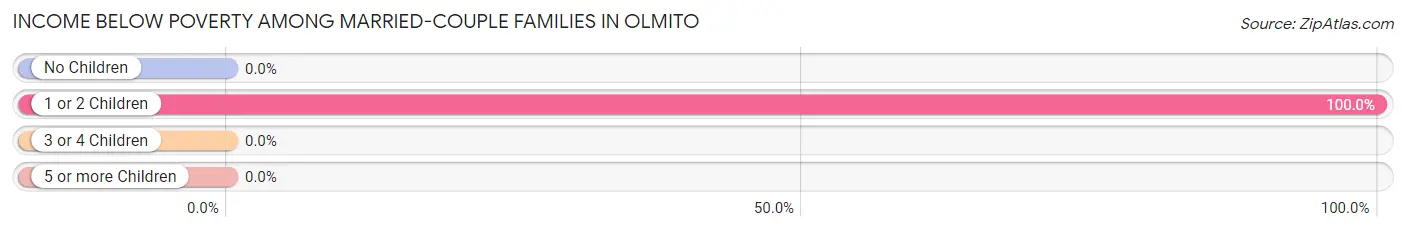
| Children | Above Poverty | Below Poverty |
| No Children | 78 (100.0%) | 0 (0.0%) |
| 1 or 2 Children | 0 (0.0%) | 45 (100.0%) |
| 3 or 4 Children | 0 (0.0%) | 0 (0.0%) |
| 5 or more Children | 0 (0.0%) | 0 (0.0%) |
| Total | 78 (63.4%) | 45 (36.6%) |
Income Below Poverty Among Single-Parent Households in Olmito
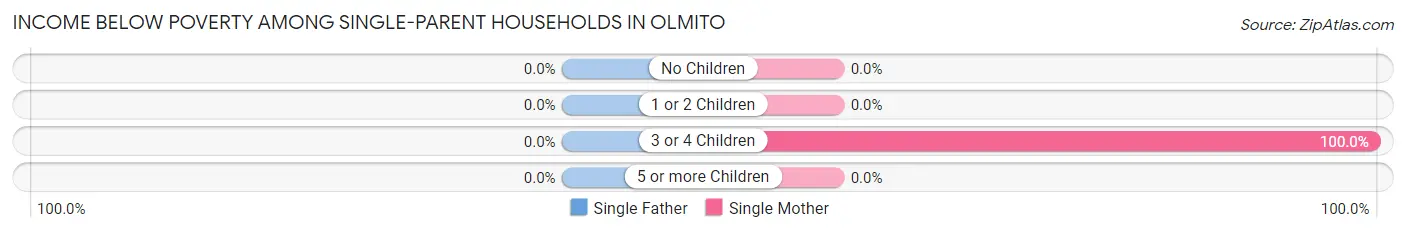
| Children | Single Father | Single Mother |
| No Children | 0 (0.0%) | 0 (0.0%) |
| 1 or 2 Children | 0 (0.0%) | 0 (0.0%) |
| 3 or 4 Children | 0 (0.0%) | 22 (100.0%) |
| 5 or more Children | 0 (0.0%) | 0 (0.0%) |
| Total | 0 (0.0%) | 22 (28.9%) |
Income Below Poverty Among Married-Couple vs Single-Parent Households in Olmito
The poverty data for Olmito shows that 45 of the married-couple family households (36.6%) and 22 of the single-parent households (25.9%) are living below the poverty level. Within the married-couple family households, those with 1 or 2 children have the highest poverty rate, with 45 households (100.0%) falling below the poverty line. Among the single-parent households, those with 3 or 4 children have the highest poverty rate, with 22 household (71.0%) living below poverty.
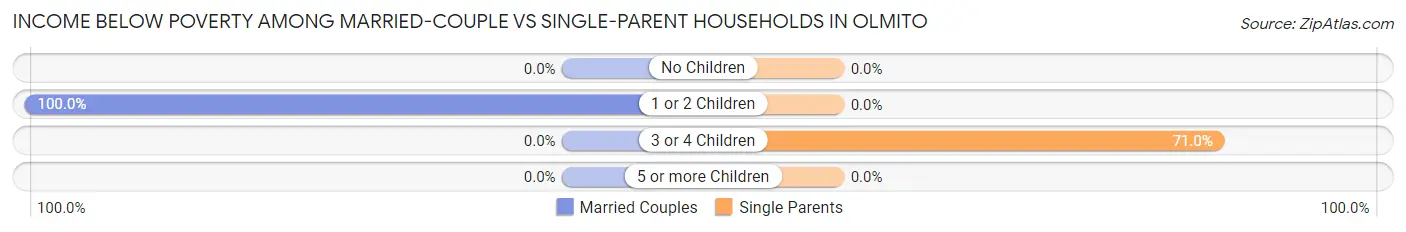
| Children | Married-Couple Families | Single-Parent Households |
| No Children | 0 (0.0%) | 0 (0.0%) |
| 1 or 2 Children | 45 (100.0%) | 0 (0.0%) |
| 3 or 4 Children | 0 (0.0%) | 22 (71.0%) |
| 5 or more Children | 0 (0.0%) | 0 (0.0%) |
| Total | 45 (36.6%) | 22 (25.9%) |
Race in Olmito
The most populous races in Olmito are Hispanic or Latino (794 | 100.0%), White / Caucasian (505 | 63.6%), and Some other Race (252 | 31.7%).
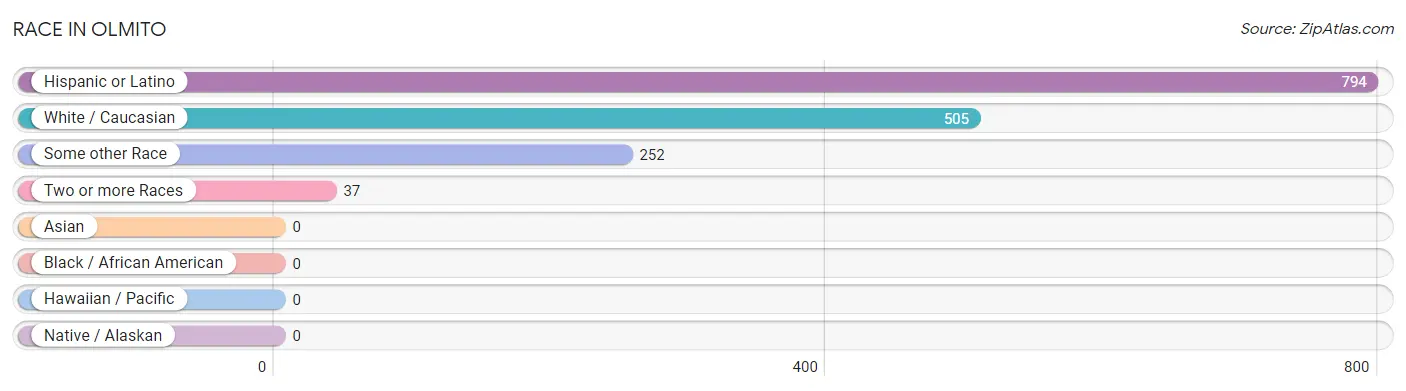
| Race | # Population | % Population |
| Asian | 0 | 0.0% |
| Black / African American | 0 | 0.0% |
| Hawaiian / Pacific | 0 | 0.0% |
| Hispanic or Latino | 794 | 100.0% |
| Native / Alaskan | 0 | 0.0% |
| White / Caucasian | 505 | 63.6% |
| Two or more Races | 37 | 4.7% |
| Some other Race | 252 | 31.7% |
| Total | 794 | 100.0% |
Ancestry in Olmito
The most populous ancestries reported in Olmito are Mexican (794 | 100.0%), and American (7 | 0.9%), together accounting for 100.9% of all Olmito residents.
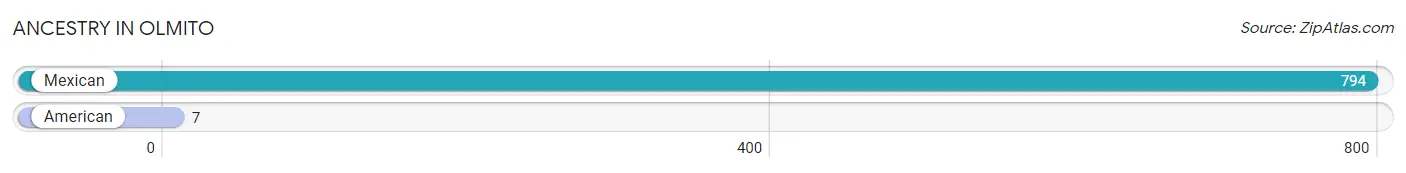
| Ancestry | # Population | % Population |
| American | 7 | 0.9% |
| Mexican | 794 | 100.0% | View All 2 Rows |
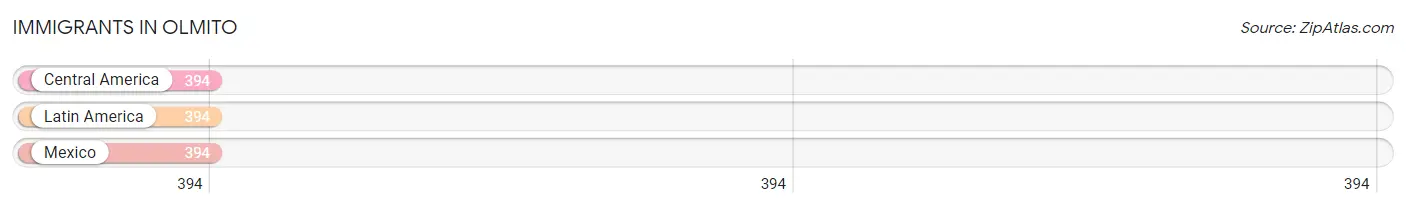
Immigrants in Olmito
The most numerous immigrant groups reported in Olmito came from Central America (394 | 49.6%), Latin America (394 | 49.6%), and Mexico (394 | 49.6%), together accounting for 148.9% of all Olmito residents.
| Immigration Origin | # Population | % Population |
| Central America | 394 | 49.6% |
| Latin America | 394 | 49.6% |
| Mexico | 394 | 49.6% | View All 3 Rows |
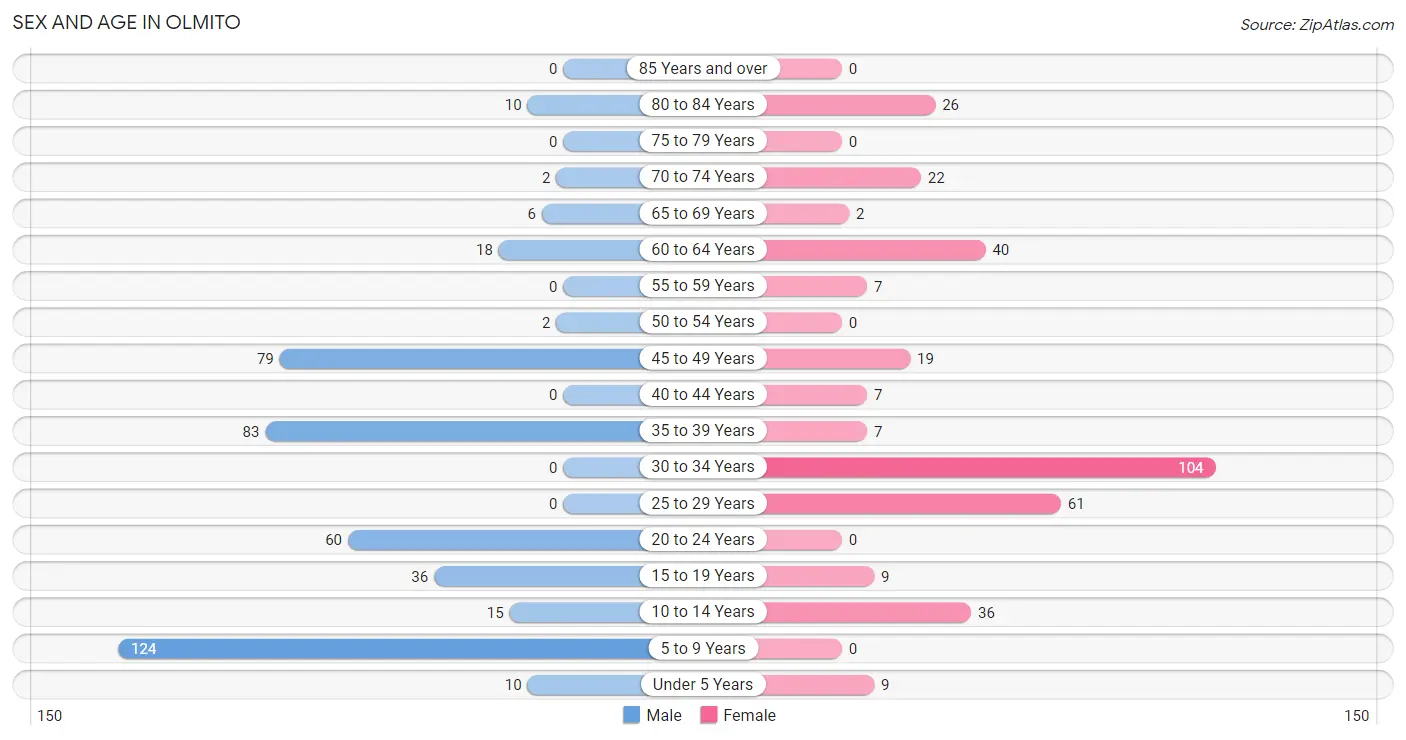
Sex and Age in Olmito
Sex and Age in Olmito
The most populous age groups in Olmito are 5 to 9 Years (124 | 27.9%) for men and 30 to 34 Years (104 | 29.8%) for women.
| Age Bracket | Male | Female |
| Under 5 Years | 10 (2.2%) | 9 (2.6%) |
| 5 to 9 Years | 124 (27.9%) | 0 (0.0%) |
| 10 to 14 Years | 15 (3.4%) | 36 (10.3%) |
| 15 to 19 Years | 36 (8.1%) | 9 (2.6%) |
| 20 to 24 Years | 60 (13.5%) | 0 (0.0%) |
| 25 to 29 Years | 0 (0.0%) | 61 (17.5%) |
| 30 to 34 Years | 0 (0.0%) | 104 (29.8%) |
| 35 to 39 Years | 83 (18.6%) | 7 (2.0%) |
| 40 to 44 Years | 0 (0.0%) | 7 (2.0%) |
| 45 to 49 Years | 79 (17.7%) | 19 (5.4%) |
| 50 to 54 Years | 2 (0.4%) | 0 (0.0%) |
| 55 to 59 Years | 0 (0.0%) | 7 (2.0%) |
| 60 to 64 Years | 18 (4.0%) | 40 (11.5%) |
| 65 to 69 Years | 6 (1.3%) | 2 (0.6%) |
| 70 to 74 Years | 2 (0.4%) | 22 (6.3%) |
| 75 to 79 Years | 0 (0.0%) | 0 (0.0%) |
| 80 to 84 Years | 10 (2.2%) | 26 (7.4%) |
| 85 Years and over | 0 (0.0%) | 0 (0.0%) |
| Total | 445 (100.0%) | 349 (100.0%) |
Families and Households in Olmito
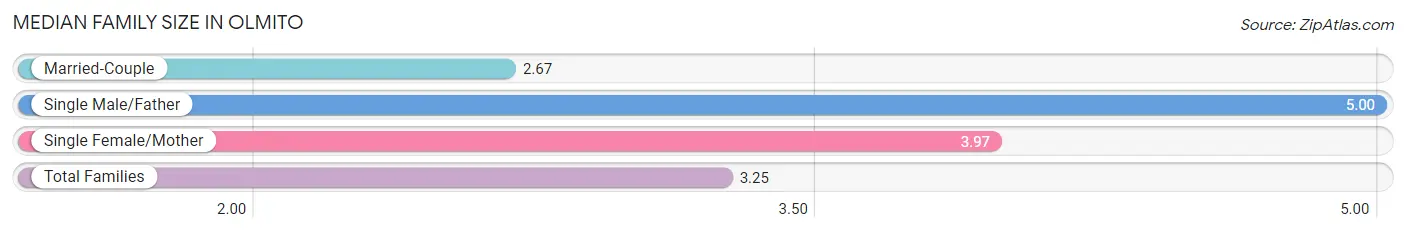
Median Family Size in Olmito
The median family size in Olmito is 3.25 persons per family, with single male/father families (9 | 4.3%) accounting for the largest median family size of 5 persons per family. On the other hand, married-couple families (123 | 59.1%) represent the smallest median family size with 2.67 persons per family.
| Family Type | # Families | Family Size |
| Married-Couple | 123 (59.1%) | 2.67 |
| Single Male/Father | 9 (4.3%) | 5.00 |
| Single Female/Mother | 76 (36.5%) | 3.97 |
| Total Families | 208 (100.0%) | 3.25 |
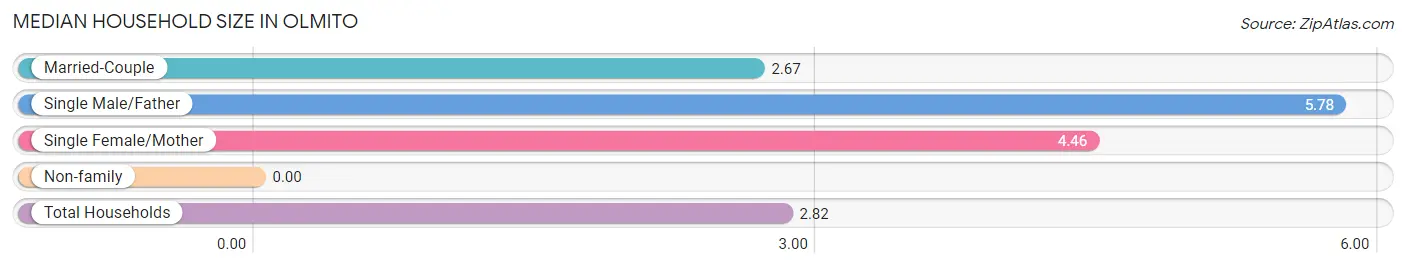
Median Household Size in Olmito
| Household Type | # Households | Household Size |
| Married-Couple | 123 (43.6%) | 2.67 |
| Single Male/Father | 9 (3.2%) | 5.78 |
| Single Female/Mother | 76 (27.0%) | 4.46 |
| Non-family | 74 (26.2%) | - |
| Total Households | 282 (100.0%) | 2.82 |
Household Size by Marriage Status in Olmito
Out of a total of 282 households in Olmito, 208 (73.8%) are family households, while 74 (26.2%) are nonfamily households. The most numerous type of family households are 2-person households, comprising 67, and the most common type of nonfamily households are 1-person households, comprising 74.
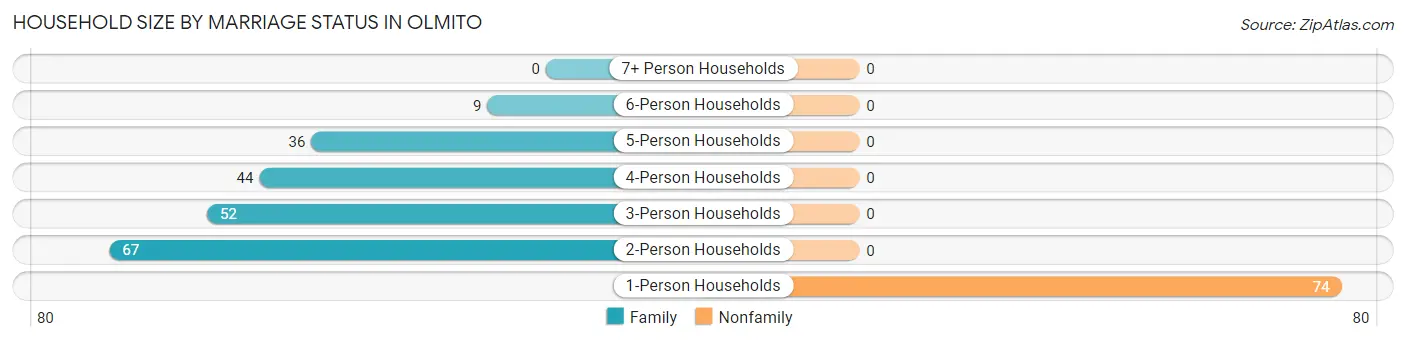
| Household Size | Family Households | Nonfamily Households |
| 1-Person Households | - | 74 (26.2%) |
| 2-Person Households | 67 (23.8%) | 0 (0.0%) |
| 3-Person Households | 52 (18.4%) | 0 (0.0%) |
| 4-Person Households | 44 (15.6%) | 0 (0.0%) |
| 5-Person Households | 36 (12.8%) | 0 (0.0%) |
| 6-Person Households | 9 (3.2%) | 0 (0.0%) |
| 7+ Person Households | 0 (0.0%) | 0 (0.0%) |
| Total | 208 (73.8%) | 74 (26.2%) |
Female Fertility in Olmito
Fertility by Age in Olmito
Average fertility rate in Olmito is 97.0 births per 1,000 women. Women in the age bracket of 20 to 34 years have the highest fertility rate with 121.0 births per 1,000 women. Women in the age bracket of 20 to 34 years acount for 100.0% of all women with births.
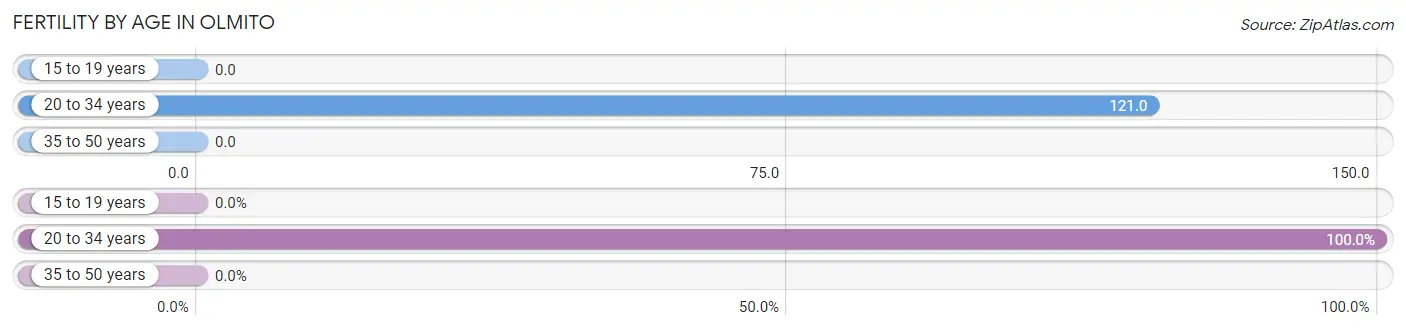
| Age Bracket | Women with Births | Births / 1,000 Women |
| 15 to 19 years | 0 (0.0%) | 0.0 |
| 20 to 34 years | 20 (100.0%) | 121.0 |
| 35 to 50 years | 0 (0.0%) | 0.0 |
| Total | 20 (100.0%) | 97.0 |
Fertility by Age by Marriage Status in Olmito
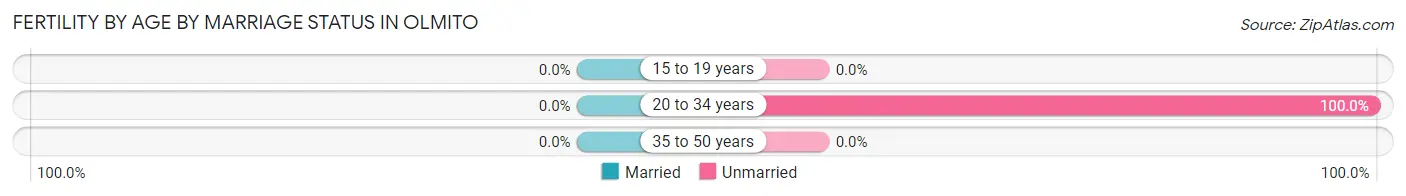
| Age Bracket | Married | Unmarried |
| 15 to 19 years | 0 (0.0%) | 0 (0.0%) |
| 20 to 34 years | 0 (0.0%) | 20 (100.0%) |
| 35 to 50 years | 0 (0.0%) | 0 (0.0%) |
| Total | 0 (0.0%) | 20 (100.0%) |
Fertility by Education in Olmito
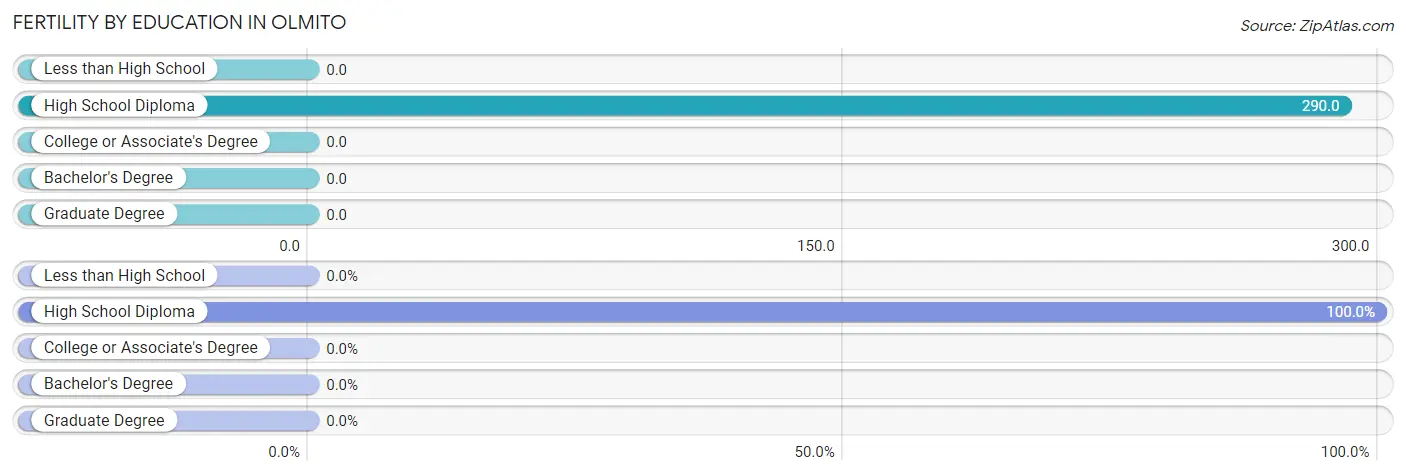
| Educational Attainment | Women with Births | Births / 1,000 Women |
| Less than High School | 0 (0.0%) | 0.0 |
| High School Diploma | 20 (100.0%) | 290.0 |
| College or Associate's Degree | 0 (0.0%) | 0.0 |
| Bachelor's Degree | 0 (0.0%) | 0.0 |
| Graduate Degree | 0 (0.0%) | 0.0 |
| Total | 20 (100.0%) | 97.0 |
Fertility by Education by Marriage Status in Olmito
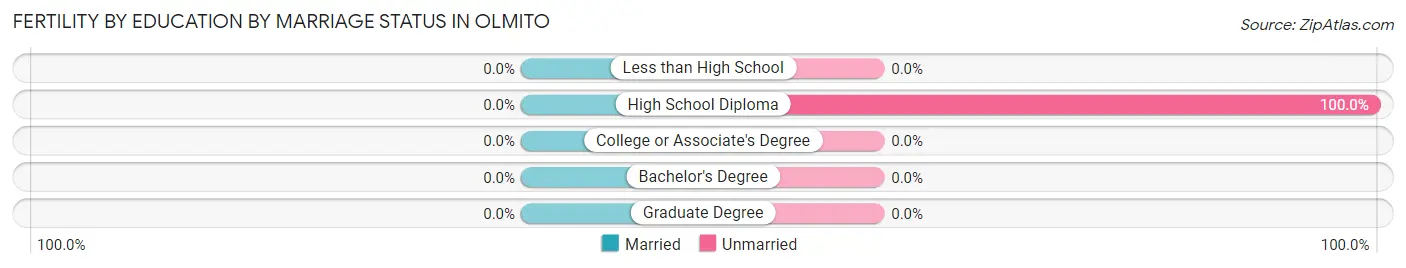
| Educational Attainment | Married | Unmarried |
| Less than High School | 0 (0.0%) | 0 (0.0%) |
| High School Diploma | 0 (0.0%) | 20 (100.0%) |
| College or Associate's Degree | 0 (0.0%) | 0 (0.0%) |
| Bachelor's Degree | 0 (0.0%) | 0 (0.0%) |
| Graduate Degree | 0 (0.0%) | 0 (0.0%) |
| Total | 0 (0.0%) | 20 (100.0%) |
Employment Characteristics in Olmito
Employment by Class of Employer in Olmito
Among the 337 employed individuals in Olmito, private company employees (230 | 68.2%), self-employed (not incorporated) (56 | 16.6%), and not-for-profit organizations (35 | 10.4%) make up the most common classes of employment.
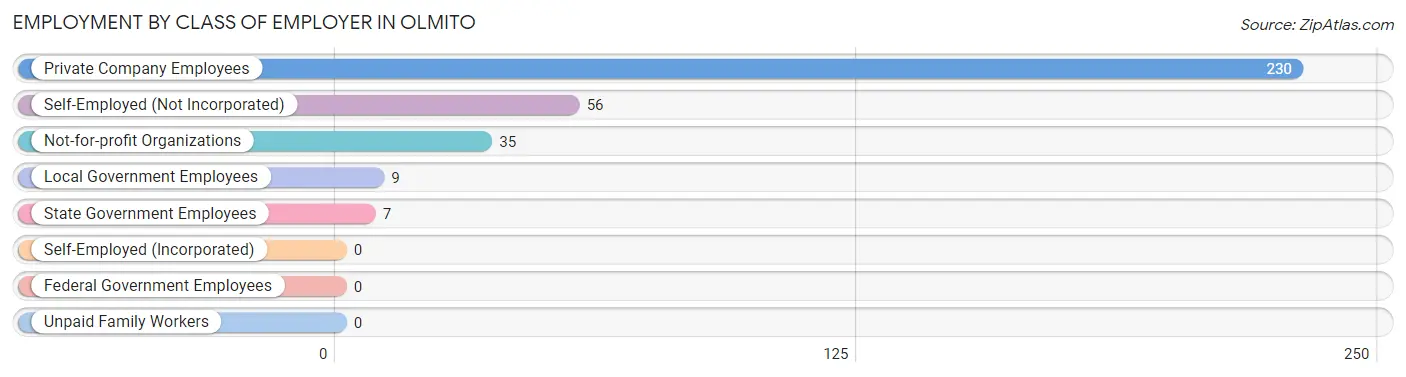
| Employer Class | # Employees | % Employees |
| Private Company Employees | 230 | 68.2% |
| Self-Employed (Incorporated) | 0 | 0.0% |
| Self-Employed (Not Incorporated) | 56 | 16.6% |
| Not-for-profit Organizations | 35 | 10.4% |
| Local Government Employees | 9 | 2.7% |
| State Government Employees | 7 | 2.1% |
| Federal Government Employees | 0 | 0.0% |
| Unpaid Family Workers | 0 | 0.0% |
| Total | 337 | 100.0% |
Employment Status by Age in Olmito
According to the labor force statistics for Olmito, out of the total population over 16 years of age (600), 56.5% or 339 individuals are in the labor force, with 0.6% or 2 of them unemployed. The age group with the highest labor force participation rate is 20 to 24 years, with 100.0% or 60 individuals in the labor force. Within the labor force, the 16 to 19 years age range has the highest percentage of unemployed individuals, with 100.0% or 2 of them being unemployed.
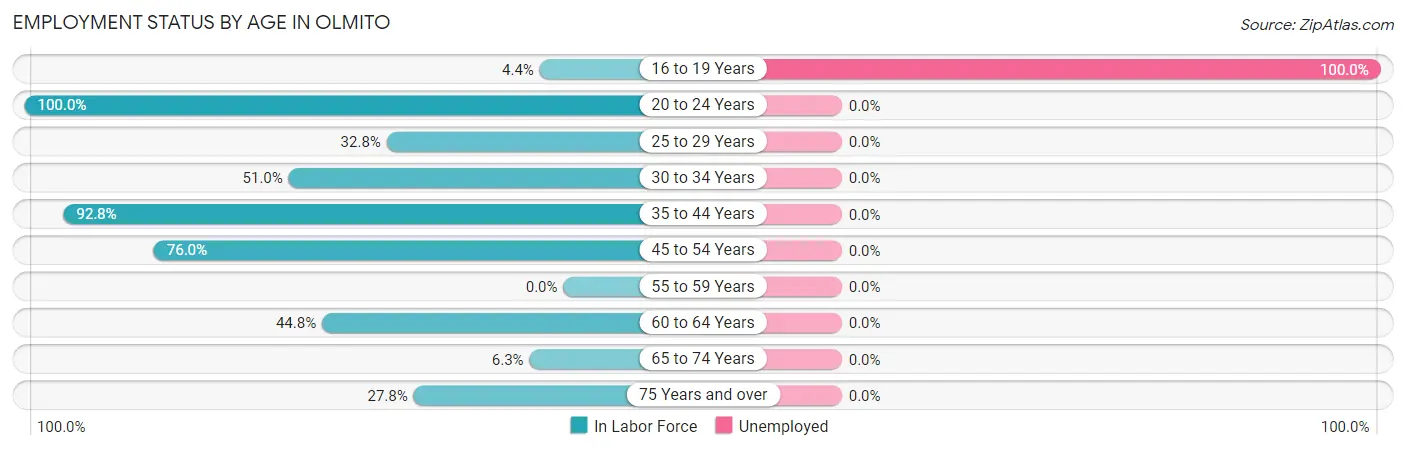
| Age Bracket | In Labor Force | Unemployed |
| 16 to 19 Years | 2 (4.4%) | 2 (100.0%) |
| 20 to 24 Years | 60 (100.0%) | 0 (0.0%) |
| 25 to 29 Years | 20 (32.8%) | 0 (0.0%) |
| 30 to 34 Years | 53 (51.0%) | 0 (0.0%) |
| 35 to 44 Years | 90 (92.8%) | 0 (0.0%) |
| 45 to 54 Years | 76 (76.0%) | 0 (0.0%) |
| 55 to 59 Years | 0 (0.0%) | 0 (0.0%) |
| 60 to 64 Years | 26 (44.8%) | 0 (0.0%) |
| 65 to 74 Years | 2 (6.3%) | 0 (0.0%) |
| 75 Years and over | 10 (27.8%) | 0 (0.0%) |
| Total | 339 (56.5%) | 2 (0.6%) |
Employment Status by Educational Attainment in Olmito
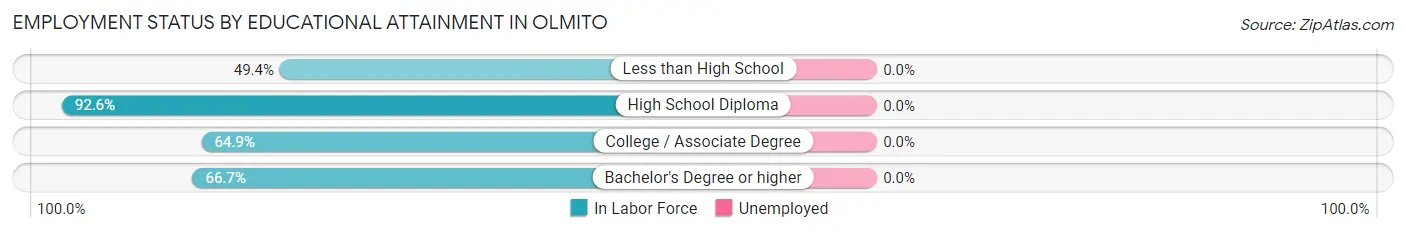
| Educational Attainment | In Labor Force | Unemployed |
| Less than High School | 124 (49.4%) | 0 (0.0%) |
| High School Diploma | 88 (92.6%) | 0 (0.0%) |
| College / Associate Degree | 37 (64.9%) | 0 (0.0%) |
| Bachelor's Degree or higher | 16 (66.7%) | 0 (0.0%) |
| Total | 265 (62.1%) | 0 (0.0%) |
Employment Occupations by Sex in Olmito
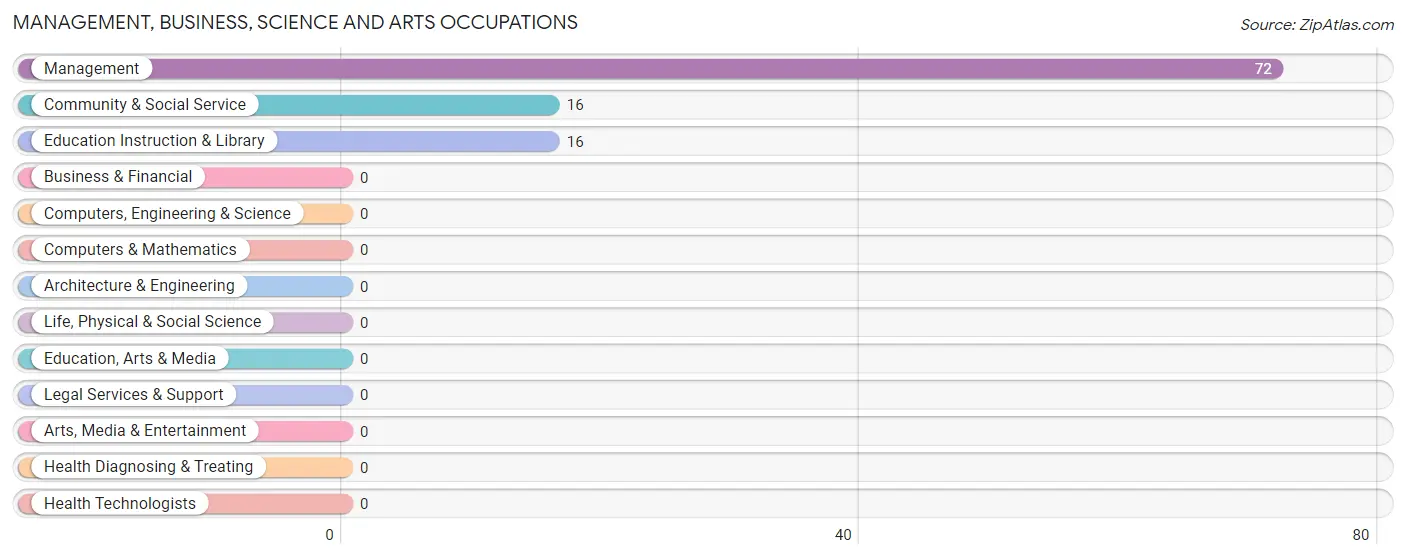
Management, Business, Science and Arts Occupations
The most common Management, Business, Science and Arts occupations in Olmito are Management (72 | 21.4%), Community & Social Service (16 | 4.8%), and Education Instruction & Library (16 | 4.8%).
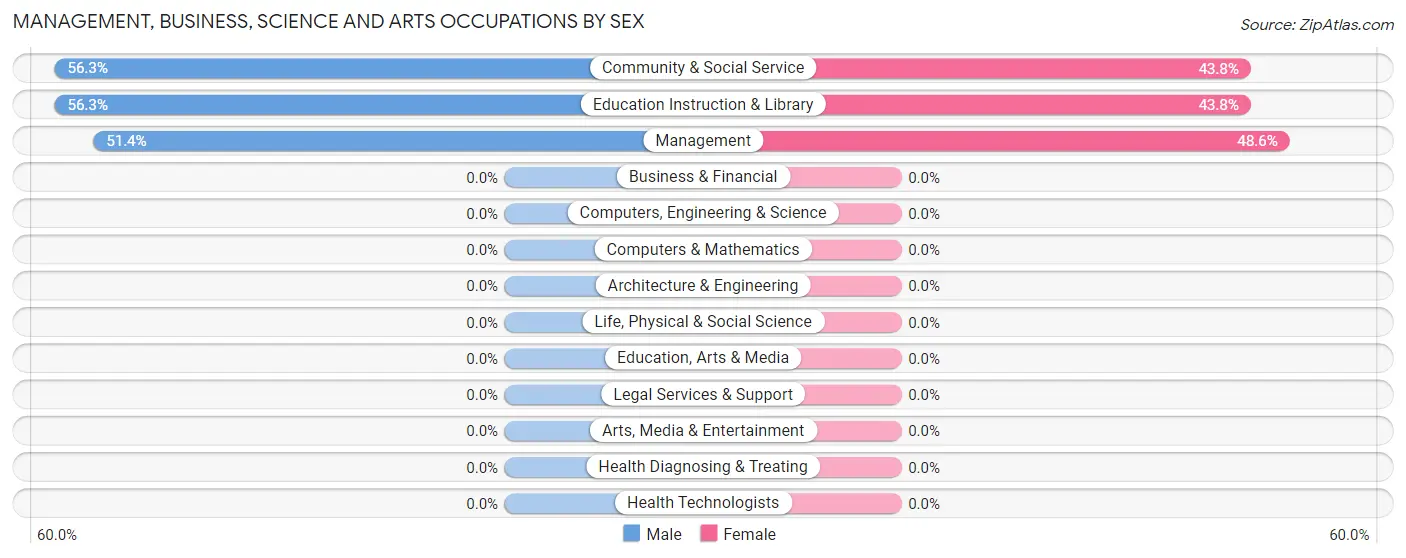
Management, Business, Science and Arts Occupations by Sex
Within the Management, Business, Science and Arts occupations in Olmito, the most male-oriented occupations are Community & Social Service (56.2%), Education Instruction & Library (56.2%), and Management (51.4%), while the most female-oriented occupations are Management (48.6%), Community & Social Service (43.8%), and Education Instruction & Library (43.8%).
| Occupation | Male | Female |
| Management | 37 (51.4%) | 35 (48.6%) |
| Business & Financial | 0 (0.0%) | 0 (0.0%) |
| Computers, Engineering & Science | 0 (0.0%) | 0 (0.0%) |
| Computers & Mathematics | 0 (0.0%) | 0 (0.0%) |
| Architecture & Engineering | 0 (0.0%) | 0 (0.0%) |
| Life, Physical & Social Science | 0 (0.0%) | 0 (0.0%) |
| Community & Social Service | 9 (56.2%) | 7 (43.8%) |
| Education, Arts & Media | 0 (0.0%) | 0 (0.0%) |
| Legal Services & Support | 0 (0.0%) | 0 (0.0%) |
| Education Instruction & Library | 9 (56.2%) | 7 (43.8%) |
| Arts, Media & Entertainment | 0 (0.0%) | 0 (0.0%) |
| Health Diagnosing & Treating | 0 (0.0%) | 0 (0.0%) |
| Health Technologists | 0 (0.0%) | 0 (0.0%) |
| Total (Category) | 46 (52.3%) | 42 (47.7%) |
| Total (Overall) | 241 (71.5%) | 96 (28.5%) |
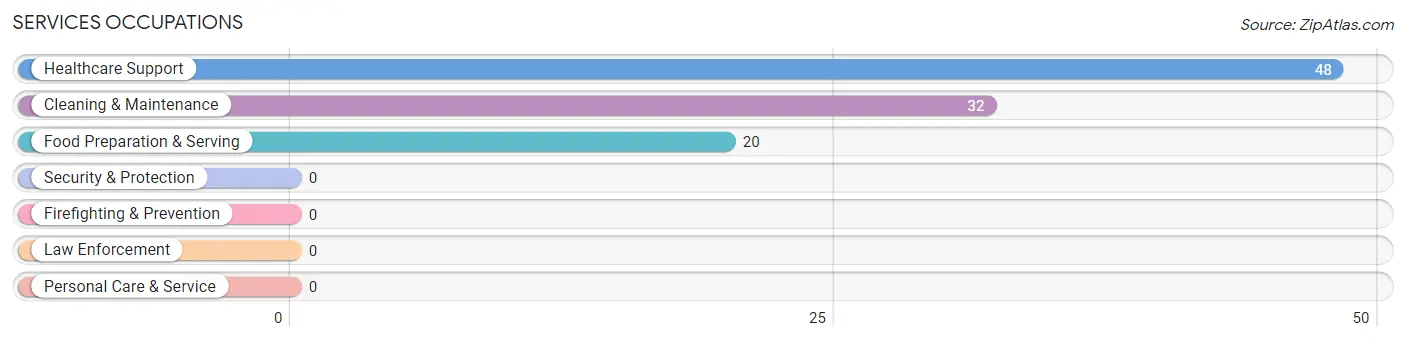
Services Occupations
The most common Services occupations in Olmito are Healthcare Support (48 | 14.2%), Cleaning & Maintenance (32 | 9.5%), and Food Preparation & Serving (20 | 5.9%).
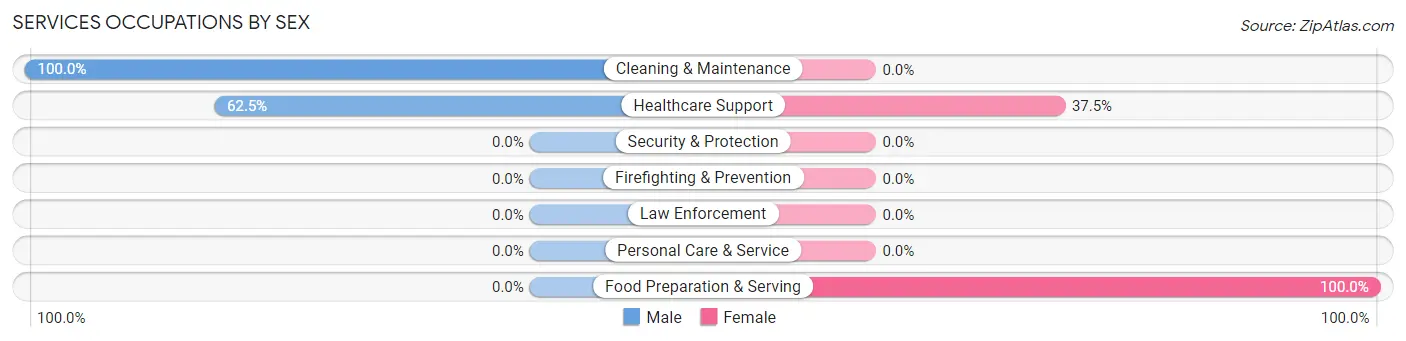
Services Occupations by Sex
Within the Services occupations in Olmito, the most male-oriented occupations are Cleaning & Maintenance (100.0%), and Healthcare Support (62.5%), while the most female-oriented occupations are Food Preparation & Serving (100.0%), and Healthcare Support (37.5%).
| Occupation | Male | Female |
| Healthcare Support | 30 (62.5%) | 18 (37.5%) |
| Security & Protection | 0 (0.0%) | 0 (0.0%) |
| Firefighting & Prevention | 0 (0.0%) | 0 (0.0%) |
| Law Enforcement | 0 (0.0%) | 0 (0.0%) |
| Food Preparation & Serving | 0 (0.0%) | 20 (100.0%) |
| Cleaning & Maintenance | 32 (100.0%) | 0 (0.0%) |
| Personal Care & Service | 0 (0.0%) | 0 (0.0%) |
| Total (Category) | 62 (62.0%) | 38 (38.0%) |
| Total (Overall) | 241 (71.5%) | 96 (28.5%) |
Sales and Office Occupations
The most common Sales and Office occupations in Olmito are Sales & Related (19 | 5.6%), and Office & Administration (17 | 5.0%).
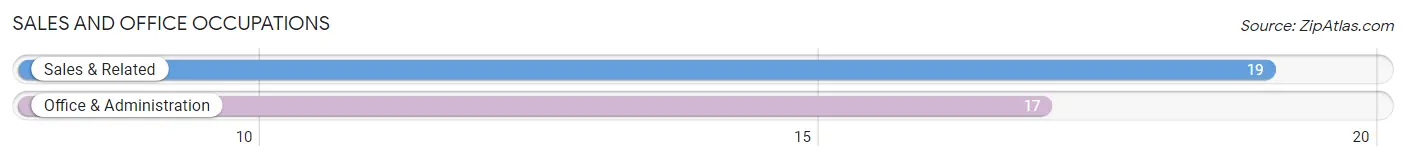
Sales and Office Occupations by Sex
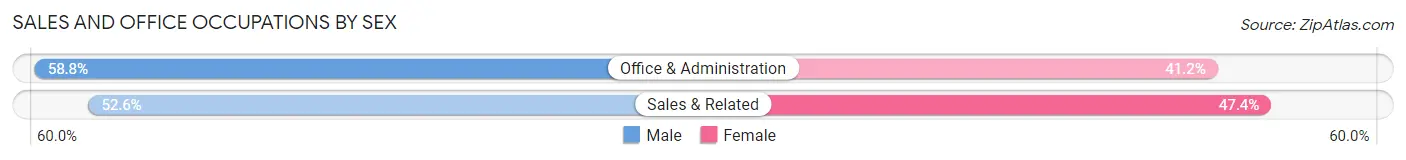
| Occupation | Male | Female |
| Sales & Related | 10 (52.6%) | 9 (47.4%) |
| Office & Administration | 10 (58.8%) | 7 (41.2%) |
| Total (Category) | 20 (55.6%) | 16 (44.4%) |
| Total (Overall) | 241 (71.5%) | 96 (28.5%) |
Natural Resources, Construction and Maintenance Occupations
The most common Natural Resources, Construction and Maintenance occupations in Olmito are , and Construction & Extraction (37 | 11.0%).
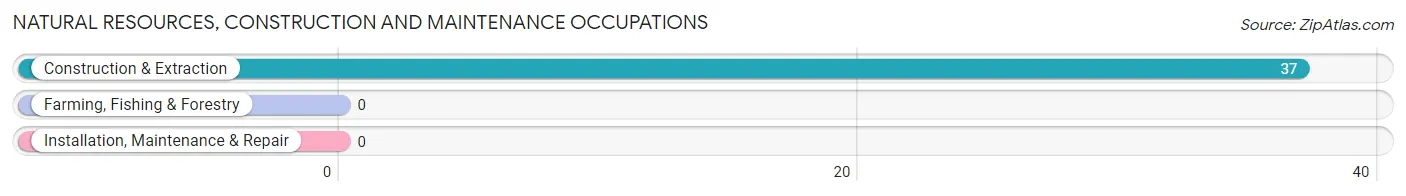
Natural Resources, Construction and Maintenance Occupations by Sex
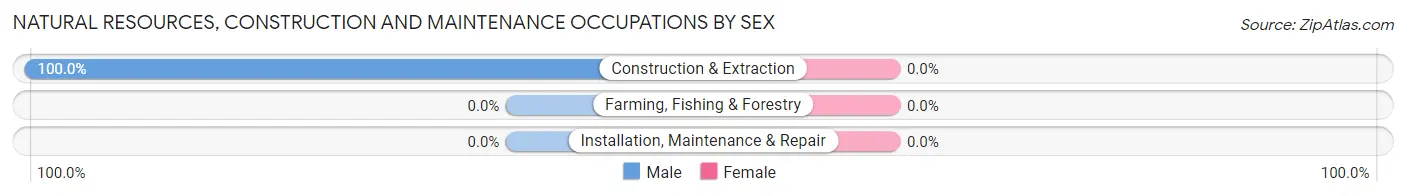
| Occupation | Male | Female |
| Farming, Fishing & Forestry | 0 (0.0%) | 0 (0.0%) |
| Construction & Extraction | 37 (100.0%) | 0 (0.0%) |
| Installation, Maintenance & Repair | 0 (0.0%) | 0 (0.0%) |
| Total (Category) | 37 (100.0%) | 0 (0.0%) |
| Total (Overall) | 241 (71.5%) | 96 (28.5%) |
Production, Transportation and Moving Occupations
The most common Production, Transportation and Moving occupations in Olmito are Production (50 | 14.8%), and Material Moving (26 | 7.7%).
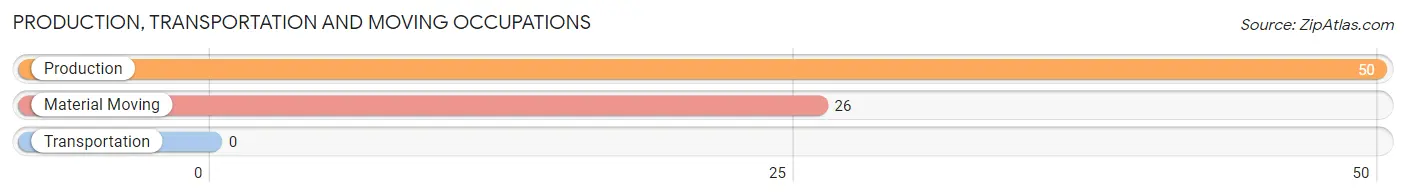
Production, Transportation and Moving Occupations by Sex
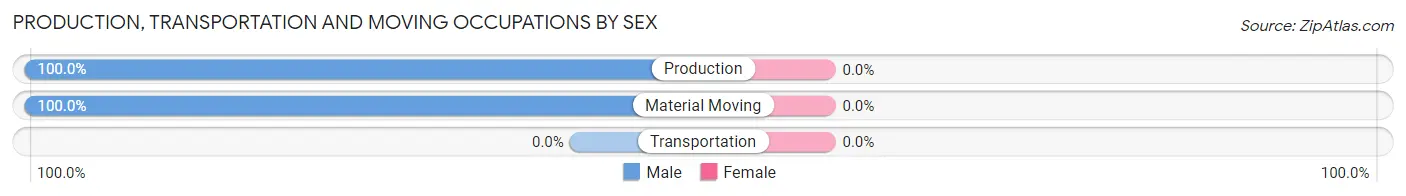
| Occupation | Male | Female |
| Production | 50 (100.0%) | 0 (0.0%) |
| Transportation | 0 (0.0%) | 0 (0.0%) |
| Material Moving | 26 (100.0%) | 0 (0.0%) |
| Total (Category) | 76 (100.0%) | 0 (0.0%) |
| Total (Overall) | 241 (71.5%) | 96 (28.5%) |
Employment Industries by Sex in Olmito
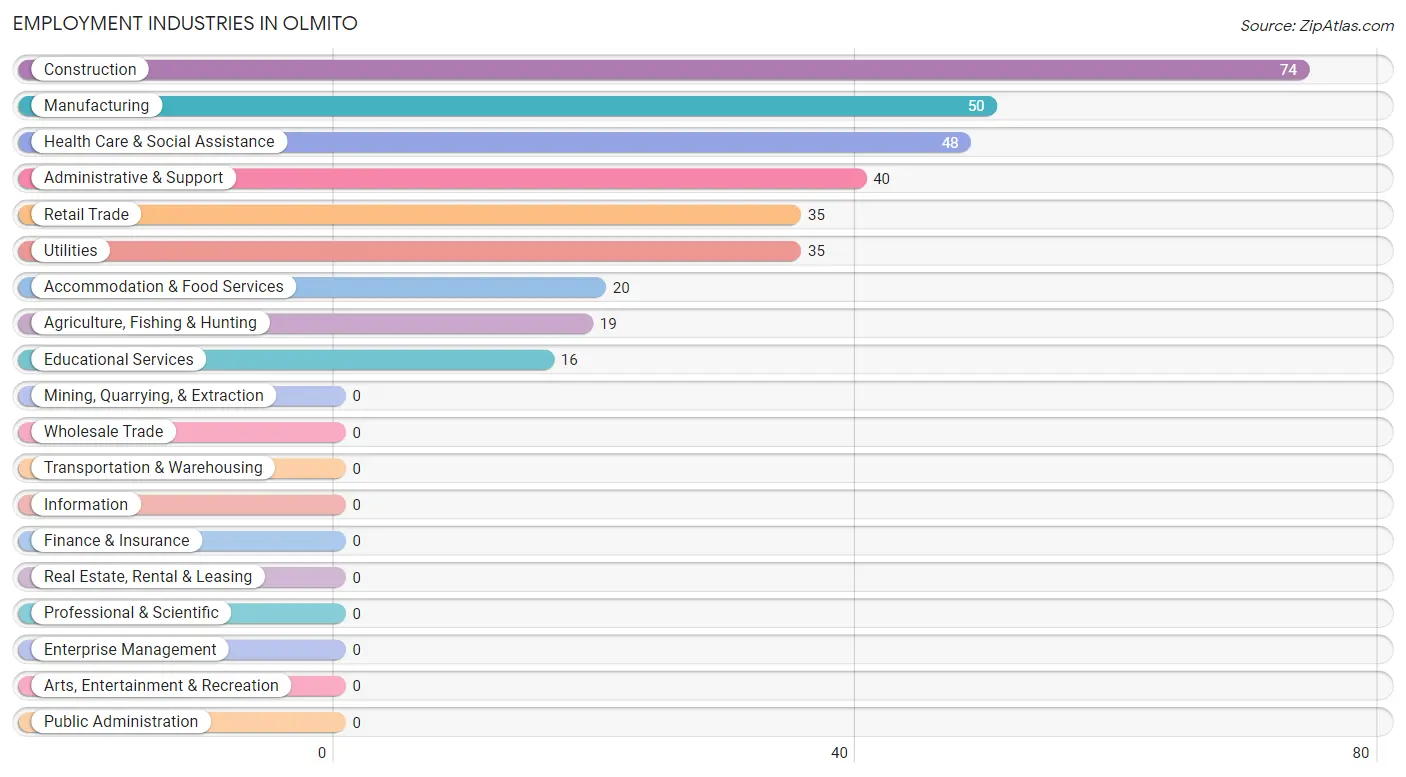
Employment Industries in Olmito
The major employment industries in Olmito include Construction (74 | 22.0%), Manufacturing (50 | 14.8%), Health Care & Social Assistance (48 | 14.2%), Administrative & Support (40 | 11.9%), and Retail Trade (35 | 10.4%).
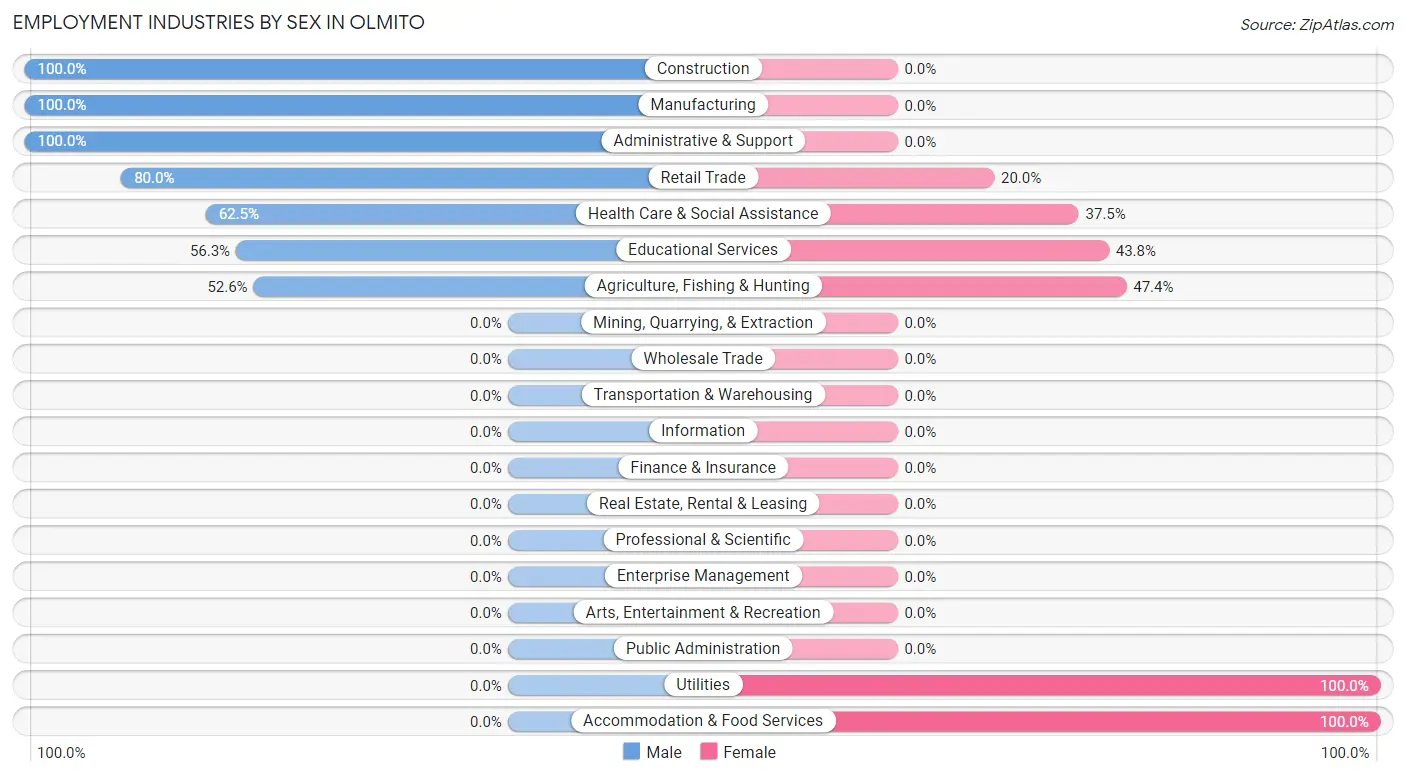
Employment Industries by Sex in Olmito
The Olmito industries that see more men than women are Construction (100.0%), Manufacturing (100.0%), and Administrative & Support (100.0%), whereas the industries that tend to have a higher number of women are Utilities (100.0%), Accommodation & Food Services (100.0%), and Agriculture, Fishing & Hunting (47.4%).
| Industry | Male | Female |
| Agriculture, Fishing & Hunting | 10 (52.6%) | 9 (47.4%) |
| Mining, Quarrying, & Extraction | 0 (0.0%) | 0 (0.0%) |
| Construction | 74 (100.0%) | 0 (0.0%) |
| Manufacturing | 50 (100.0%) | 0 (0.0%) |
| Wholesale Trade | 0 (0.0%) | 0 (0.0%) |
| Retail Trade | 28 (80.0%) | 7 (20.0%) |
| Transportation & Warehousing | 0 (0.0%) | 0 (0.0%) |
| Utilities | 0 (0.0%) | 35 (100.0%) |
| Information | 0 (0.0%) | 0 (0.0%) |
| Finance & Insurance | 0 (0.0%) | 0 (0.0%) |
| Real Estate, Rental & Leasing | 0 (0.0%) | 0 (0.0%) |
| Professional & Scientific | 0 (0.0%) | 0 (0.0%) |
| Enterprise Management | 0 (0.0%) | 0 (0.0%) |
| Administrative & Support | 40 (100.0%) | 0 (0.0%) |
| Educational Services | 9 (56.2%) | 7 (43.8%) |
| Health Care & Social Assistance | 30 (62.5%) | 18 (37.5%) |
| Arts, Entertainment & Recreation | 0 (0.0%) | 0 (0.0%) |
| Accommodation & Food Services | 0 (0.0%) | 20 (100.0%) |
| Public Administration | 0 (0.0%) | 0 (0.0%) |
| Total | 241 (71.5%) | 96 (28.5%) |
Education in Olmito
School Enrollment in Olmito
The most common levels of schooling among the 197 students in Olmito are elementary school (105 | 53.3%), middle school (44 | 22.3%), and college / undergraduate (32 | 16.2%).
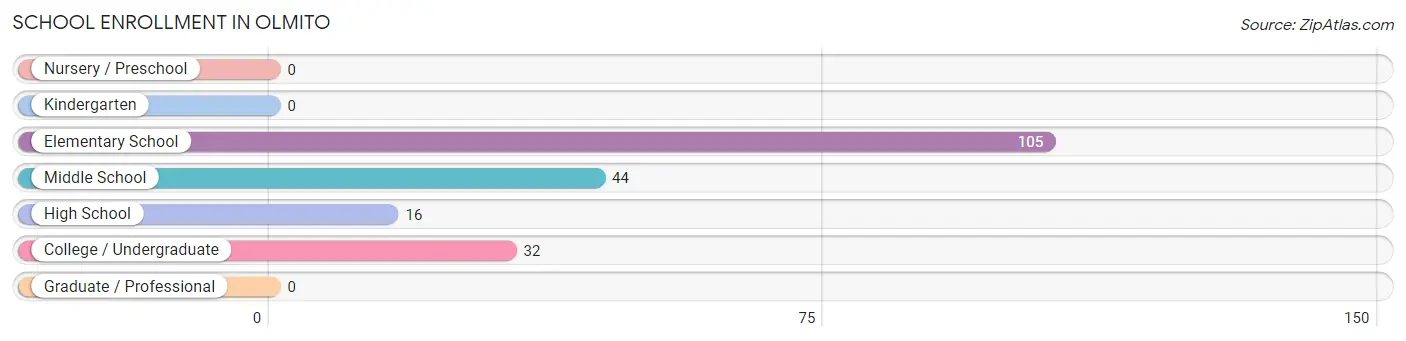
| School Level | # Students | % Students |
| Nursery / Preschool | 0 | 0.0% |
| Kindergarten | 0 | 0.0% |
| Elementary School | 105 | 53.3% |
| Middle School | 44 | 22.3% |
| High School | 16 | 8.1% |
| College / Undergraduate | 32 | 16.2% |
| Graduate / Professional | 0 | 0.0% |
| Total | 197 | 100.0% |
School Enrollment by Age by Funding Source in Olmito
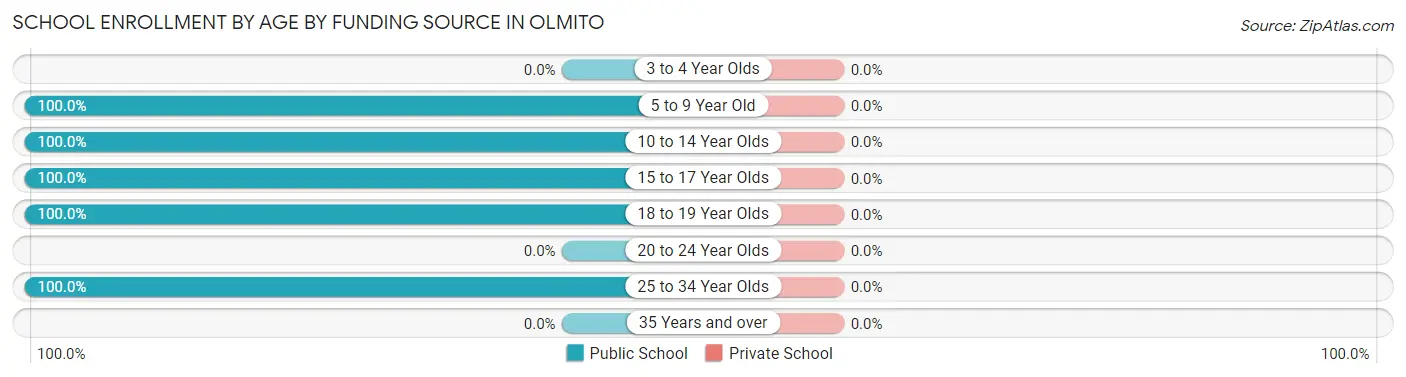
| Age Bracket | Public School | Private School |
| 3 to 4 Year Olds | 0 (0.0%) | 0 (0.0%) |
| 5 to 9 Year Old | 105 (100.0%) | 0 (0.0%) |
| 10 to 14 Year Olds | 51 (100.0%) | 0 (0.0%) |
| 15 to 17 Year Olds | 9 (100.0%) | 0 (0.0%) |
| 18 to 19 Year Olds | 2 (100.0%) | 0 (0.0%) |
| 20 to 24 Year Olds | 0 (0.0%) | 0 (0.0%) |
| 25 to 34 Year Olds | 30 (100.0%) | 0 (0.0%) |
| 35 Years and over | 0 (0.0%) | 0 (0.0%) |
| Total | 197 (100.0%) | 0 (0.0%) |
Educational Attainment by Field of Study in Olmito
Education (15 | 46.9%), computers & mathematics (9 | 28.1%), and social sciences (8 | 25.0%) are the most common fields of study among 32 individuals in Olmito who have obtained a bachelor's degree or higher.
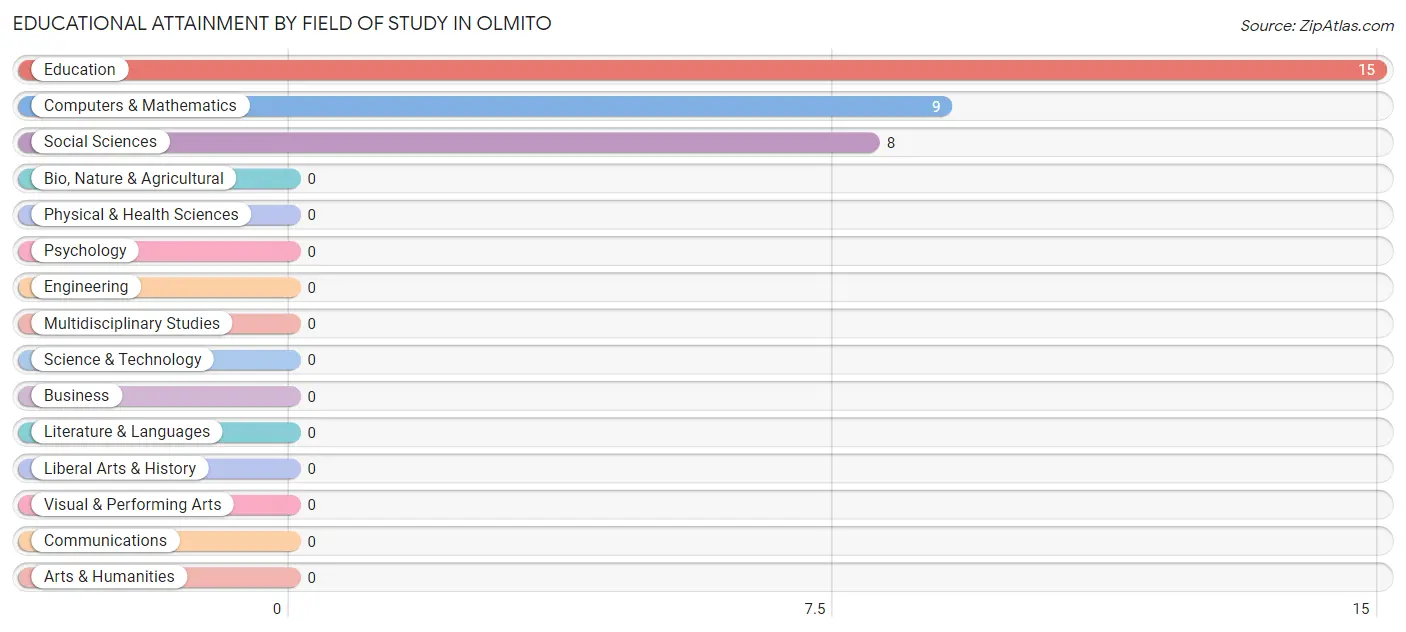
| Field of Study | # Graduates | % Graduates |
| Computers & Mathematics | 9 | 28.1% |
| Bio, Nature & Agricultural | 0 | 0.0% |
| Physical & Health Sciences | 0 | 0.0% |
| Psychology | 0 | 0.0% |
| Social Sciences | 8 | 25.0% |
| Engineering | 0 | 0.0% |
| Multidisciplinary Studies | 0 | 0.0% |
| Science & Technology | 0 | 0.0% |
| Business | 0 | 0.0% |
| Education | 15 | 46.9% |
| Literature & Languages | 0 | 0.0% |
| Liberal Arts & History | 0 | 0.0% |
| Visual & Performing Arts | 0 | 0.0% |
| Communications | 0 | 0.0% |
| Arts & Humanities | 0 | 0.0% |
| Total | 32 | 100.0% |
Transportation & Commute in Olmito
Vehicle Availability by Sex in Olmito
The most prevalent vehicle ownership categories in Olmito are males with 3 vehicles (106, accounting for 44.0%) and females with 3 vehicles (62, making up 110.4%).
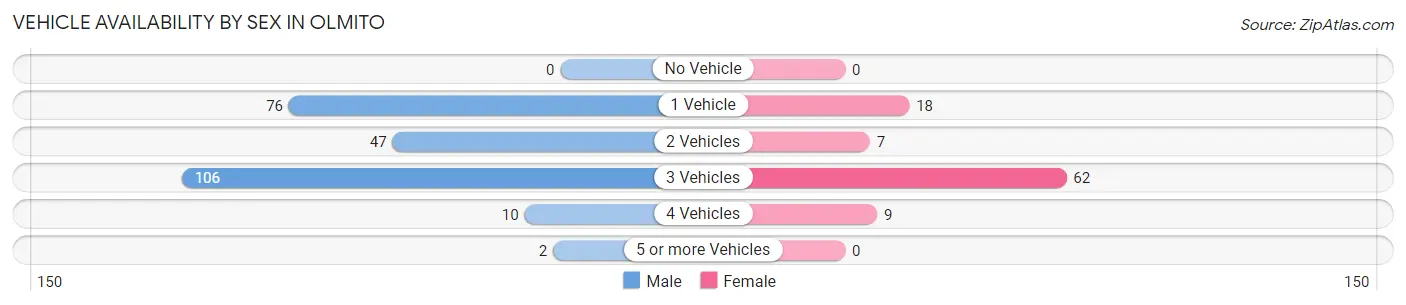
| Vehicles Available | Male | Female |
| No Vehicle | 0 (0.0%) | 0 (0.0%) |
| 1 Vehicle | 76 (31.5%) | 18 (18.8%) |
| 2 Vehicles | 47 (19.5%) | 7 (7.3%) |
| 3 Vehicles | 106 (44.0%) | 62 (64.6%) |
| 4 Vehicles | 10 (4.2%) | 9 (9.4%) |
| 5 or more Vehicles | 2 (0.8%) | 0 (0.0%) |
| Total | 241 (100.0%) | 96 (100.0%) |
Commute Time in Olmito
The most frequently occuring commute durations in Olmito are 20 to 24 minutes (143 commuters, 44.8%), 25 to 29 minutes (80 commuters, 25.1%), and 45 to 59 minutes (60 commuters, 18.8%).
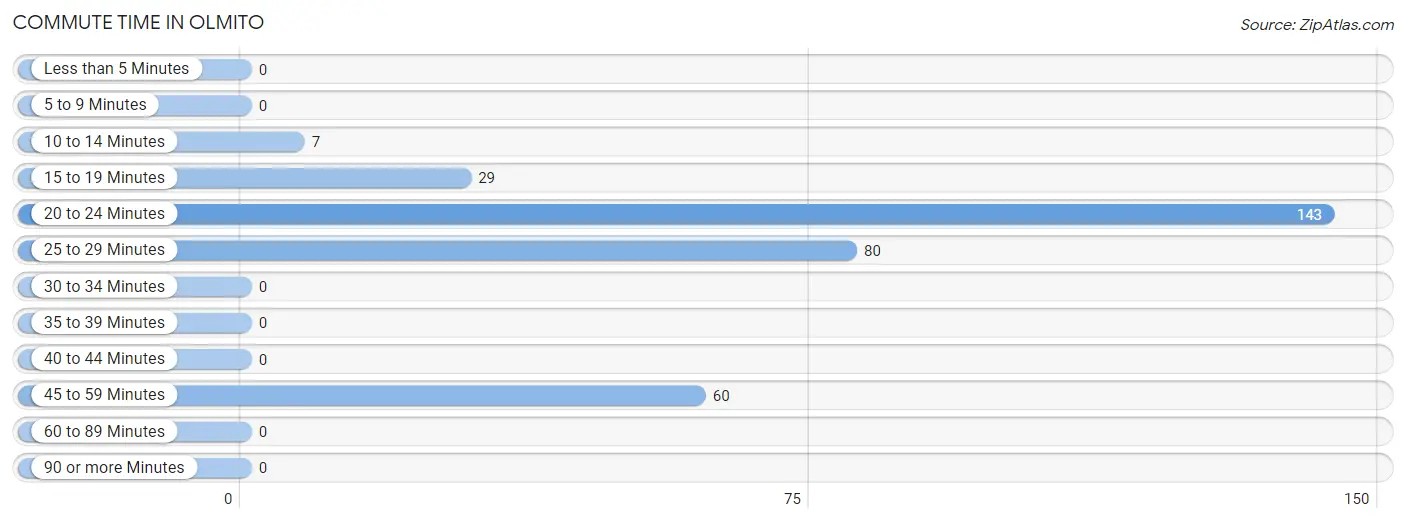
| Commute Time | # Commuters | % Commuters |
| Less than 5 Minutes | 0 | 0.0% |
| 5 to 9 Minutes | 0 | 0.0% |
| 10 to 14 Minutes | 7 | 2.2% |
| 15 to 19 Minutes | 29 | 9.1% |
| 20 to 24 Minutes | 143 | 44.8% |
| 25 to 29 Minutes | 80 | 25.1% |
| 30 to 34 Minutes | 0 | 0.0% |
| 35 to 39 Minutes | 0 | 0.0% |
| 40 to 44 Minutes | 0 | 0.0% |
| 45 to 59 Minutes | 60 | 18.8% |
| 60 to 89 Minutes | 0 | 0.0% |
| 90 or more Minutes | 0 | 0.0% |
Commute Time by Sex in Olmito
The most common commute times in Olmito are 20 to 24 minutes (136 commuters, 56.4%) for males and 25 to 29 minutes (44 commuters, 56.4%) for females.
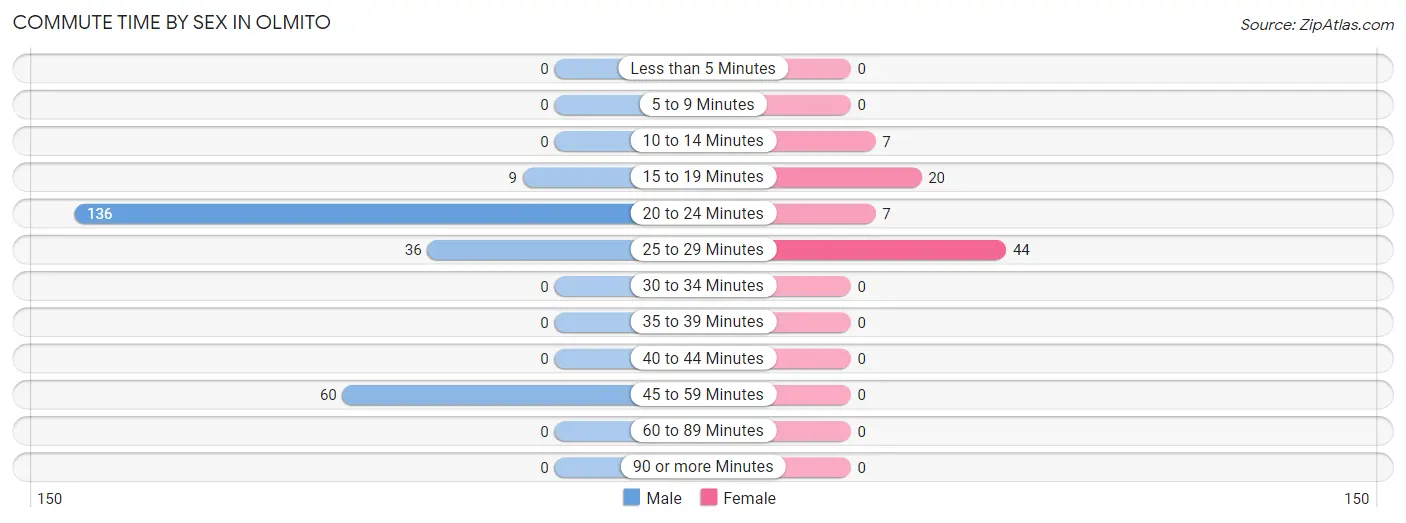
| Commute Time | Male | Female |
| Less than 5 Minutes | 0 (0.0%) | 0 (0.0%) |
| 5 to 9 Minutes | 0 (0.0%) | 0 (0.0%) |
| 10 to 14 Minutes | 0 (0.0%) | 7 (9.0%) |
| 15 to 19 Minutes | 9 (3.7%) | 20 (25.6%) |
| 20 to 24 Minutes | 136 (56.4%) | 7 (9.0%) |
| 25 to 29 Minutes | 36 (14.9%) | 44 (56.4%) |
| 30 to 34 Minutes | 0 (0.0%) | 0 (0.0%) |
| 35 to 39 Minutes | 0 (0.0%) | 0 (0.0%) |
| 40 to 44 Minutes | 0 (0.0%) | 0 (0.0%) |
| 45 to 59 Minutes | 60 (24.9%) | 0 (0.0%) |
| 60 to 89 Minutes | 0 (0.0%) | 0 (0.0%) |
| 90 or more Minutes | 0 (0.0%) | 0 (0.0%) |
Time of Departure to Work by Sex in Olmito
The most frequent times of departure to work in Olmito are 9:00 AM to 9:59 AM (93, 38.6%) for males and 7:30 AM to 7:59 AM (35, 44.9%) for females.
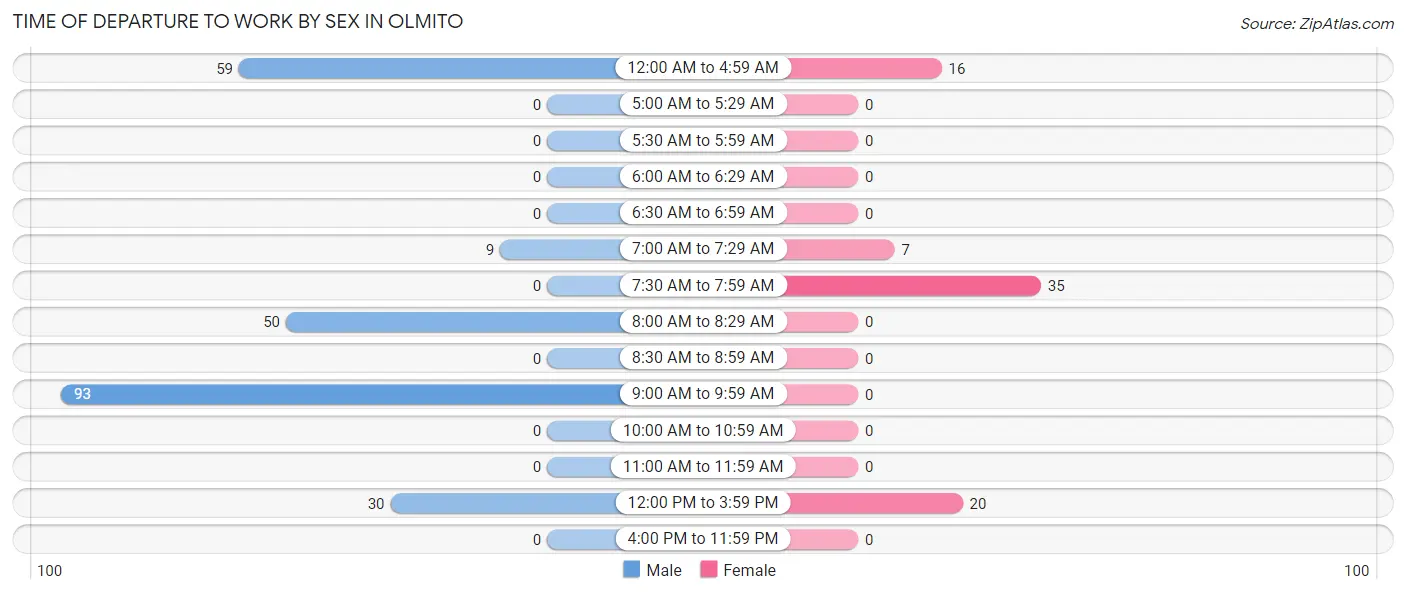
| Time of Departure | Male | Female |
| 12:00 AM to 4:59 AM | 59 (24.5%) | 16 (20.5%) |
| 5:00 AM to 5:29 AM | 0 (0.0%) | 0 (0.0%) |
| 5:30 AM to 5:59 AM | 0 (0.0%) | 0 (0.0%) |
| 6:00 AM to 6:29 AM | 0 (0.0%) | 0 (0.0%) |
| 6:30 AM to 6:59 AM | 0 (0.0%) | 0 (0.0%) |
| 7:00 AM to 7:29 AM | 9 (3.7%) | 7 (9.0%) |
| 7:30 AM to 7:59 AM | 0 (0.0%) | 35 (44.9%) |
| 8:00 AM to 8:29 AM | 50 (20.7%) | 0 (0.0%) |
| 8:30 AM to 8:59 AM | 0 (0.0%) | 0 (0.0%) |
| 9:00 AM to 9:59 AM | 93 (38.6%) | 0 (0.0%) |
| 10:00 AM to 10:59 AM | 0 (0.0%) | 0 (0.0%) |
| 11:00 AM to 11:59 AM | 0 (0.0%) | 0 (0.0%) |
| 12:00 PM to 3:59 PM | 30 (12.4%) | 20 (25.6%) |
| 4:00 PM to 11:59 PM | 0 (0.0%) | 0 (0.0%) |
| Total | 241 (100.0%) | 78 (100.0%) |
Housing Occupancy in Olmito
Occupancy by Ownership in Olmito
Of the total 282 dwellings in Olmito, owner-occupied units account for 108 (38.3%), while renter-occupied units make up 174 (61.7%).
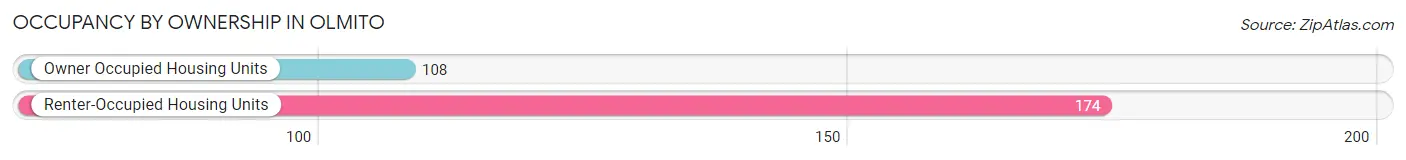
| Occupancy | # Housing Units | % Housing Units |
| Owner Occupied Housing Units | 108 | 38.3% |
| Renter-Occupied Housing Units | 174 | 61.7% |
| Total Occupied Housing Units | 282 | 100.0% |
Occupancy by Household Size in Olmito
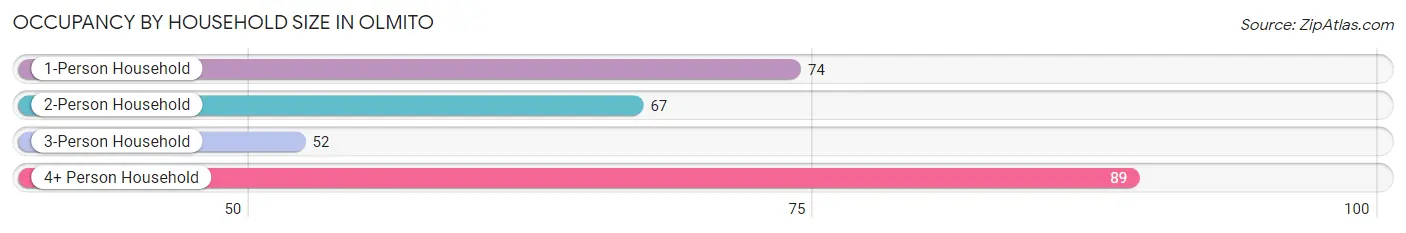
| Household Size | # Housing Units | % Housing Units |
| 1-Person Household | 74 | 26.2% |
| 2-Person Household | 67 | 23.8% |
| 3-Person Household | 52 | 18.4% |
| 4+ Person Household | 89 | 31.6% |
| Total Housing Units | 282 | 100.0% |
Occupancy by Ownership by Household Size in Olmito
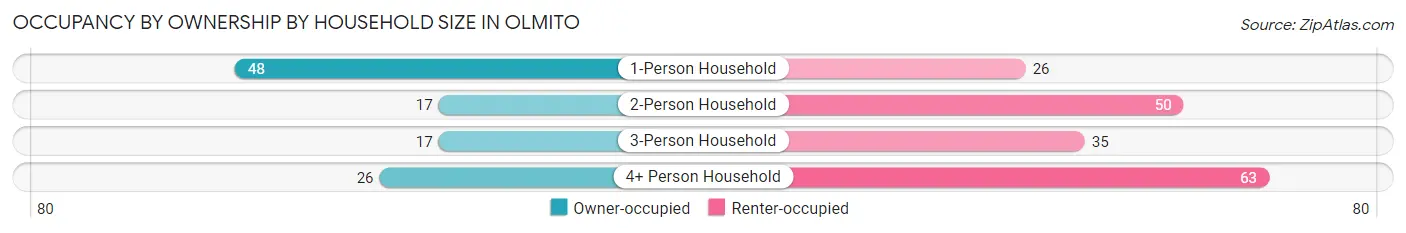
| Household Size | Owner-occupied | Renter-occupied |
| 1-Person Household | 48 (64.9%) | 26 (35.1%) |
| 2-Person Household | 17 (25.4%) | 50 (74.6%) |
| 3-Person Household | 17 (32.7%) | 35 (67.3%) |
| 4+ Person Household | 26 (29.2%) | 63 (70.8%) |
| Total Housing Units | 108 (38.3%) | 174 (61.7%) |
Occupancy by Educational Attainment in Olmito
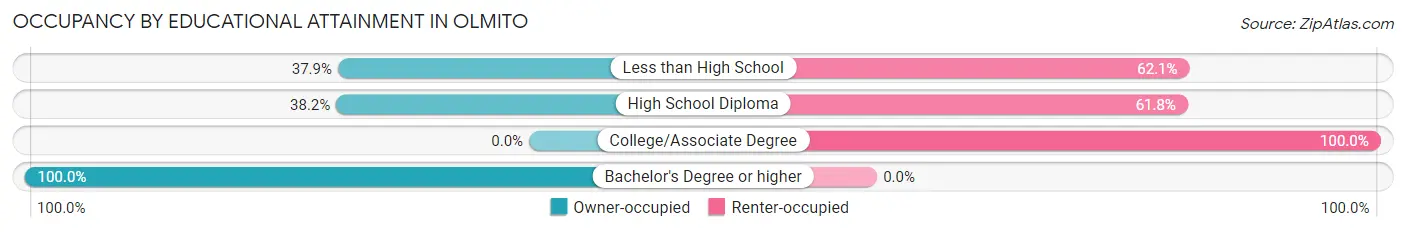
| Household Size | Owner-occupied | Renter-occupied |
| Less than High School | 58 (37.9%) | 95 (62.1%) |
| High School Diploma | 26 (38.2%) | 42 (61.8%) |
| College/Associate Degree | 0 (0.0%) | 37 (100.0%) |
| Bachelor's Degree or higher | 24 (100.0%) | 0 (0.0%) |
Occupancy by Age of Householder in Olmito
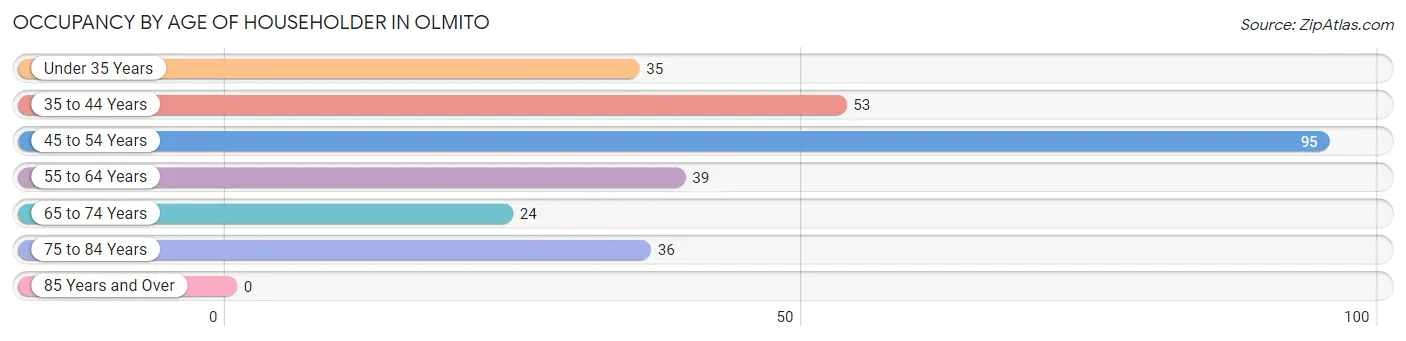
| Age Bracket | # Households | % Households |
| Under 35 Years | 35 | 12.4% |
| 35 to 44 Years | 53 | 18.8% |
| 45 to 54 Years | 95 | 33.7% |
| 55 to 64 Years | 39 | 13.8% |
| 65 to 74 Years | 24 | 8.5% |
| 75 to 84 Years | 36 | 12.8% |
| 85 Years and Over | 0 | 0.0% |
| Total | 282 | 100.0% |
Housing Finances in Olmito
Median Income by Occupancy in Olmito
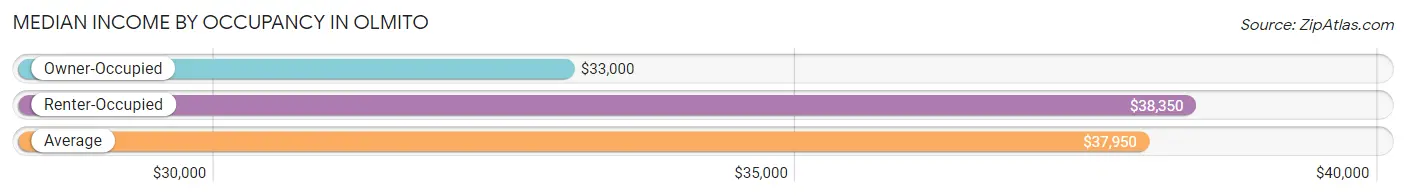
| Occupancy Type | # Households | Median Income |
| Owner-Occupied | 108 (38.3%) | $33,000 |
| Renter-Occupied | 174 (61.7%) | $38,350 |
| Average | 282 (100.0%) | $37,950 |
Occupancy by Householder Income Bracket in Olmito
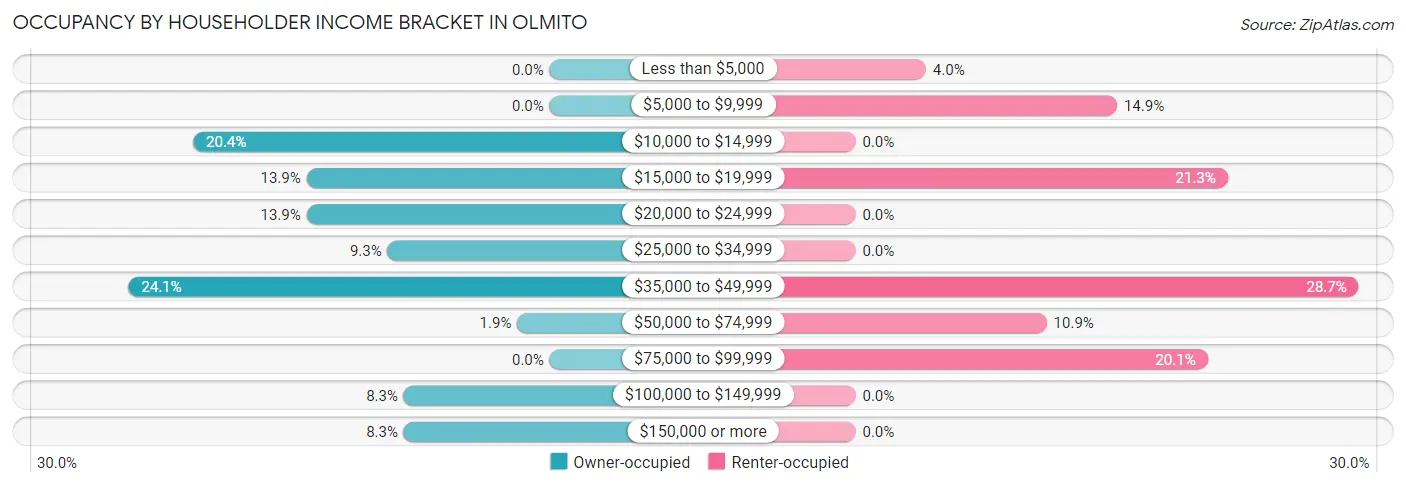
| Income Bracket | Owner-occupied | Renter-occupied |
| Less than $5,000 | 0 (0.0%) | 7 (4.0%) |
| $5,000 to $9,999 | 0 (0.0%) | 26 (14.9%) |
| $10,000 to $14,999 | 22 (20.4%) | 0 (0.0%) |
| $15,000 to $19,999 | 15 (13.9%) | 37 (21.3%) |
| $20,000 to $24,999 | 15 (13.9%) | 0 (0.0%) |
| $25,000 to $34,999 | 10 (9.3%) | 0 (0.0%) |
| $35,000 to $49,999 | 26 (24.1%) | 50 (28.7%) |
| $50,000 to $74,999 | 2 (1.8%) | 19 (10.9%) |
| $75,000 to $99,999 | 0 (0.0%) | 35 (20.1%) |
| $100,000 to $149,999 | 9 (8.3%) | 0 (0.0%) |
| $150,000 or more | 9 (8.3%) | 0 (0.0%) |
| Total | 108 (100.0%) | 174 (100.0%) |
Monthly Housing Cost Tiers in Olmito
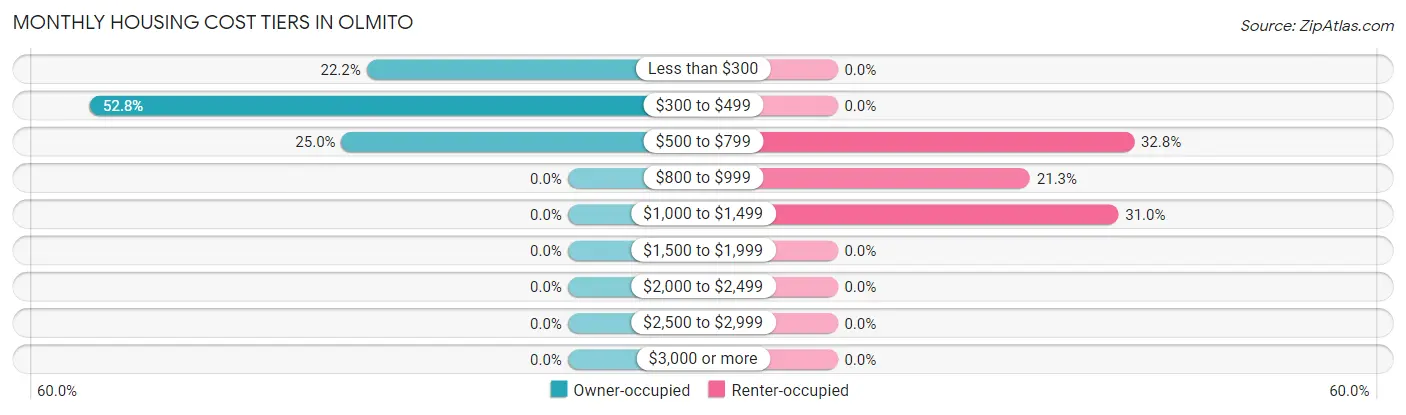
| Monthly Cost | Owner-occupied | Renter-occupied |
| Less than $300 | 24 (22.2%) | 0 (0.0%) |
| $300 to $499 | 57 (52.8%) | 0 (0.0%) |
| $500 to $799 | 27 (25.0%) | 57 (32.8%) |
| $800 to $999 | 0 (0.0%) | 37 (21.3%) |
| $1,000 to $1,499 | 0 (0.0%) | 54 (31.0%) |
| $1,500 to $1,999 | 0 (0.0%) | 0 (0.0%) |
| $2,000 to $2,499 | 0 (0.0%) | 0 (0.0%) |
| $2,500 to $2,999 | 0 (0.0%) | 0 (0.0%) |
| $3,000 or more | 0 (0.0%) | 0 (0.0%) |
| Total | 108 (100.0%) | 174 (100.0%) |
Physical Housing Characteristics in Olmito
Housing Structures in Olmito
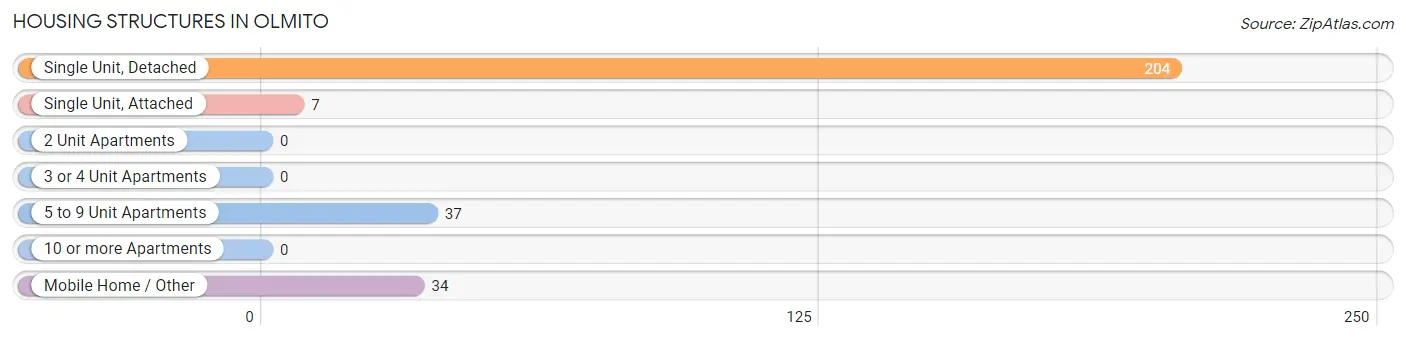
| Structure Type | # Housing Units | % Housing Units |
| Single Unit, Detached | 204 | 72.3% |
| Single Unit, Attached | 7 | 2.5% |
| 2 Unit Apartments | 0 | 0.0% |
| 3 or 4 Unit Apartments | 0 | 0.0% |
| 5 to 9 Unit Apartments | 37 | 13.1% |
| 10 or more Apartments | 0 | 0.0% |
| Mobile Home / Other | 34 | 12.1% |
| Total | 282 | 100.0% |
Housing Structures by Occupancy in Olmito
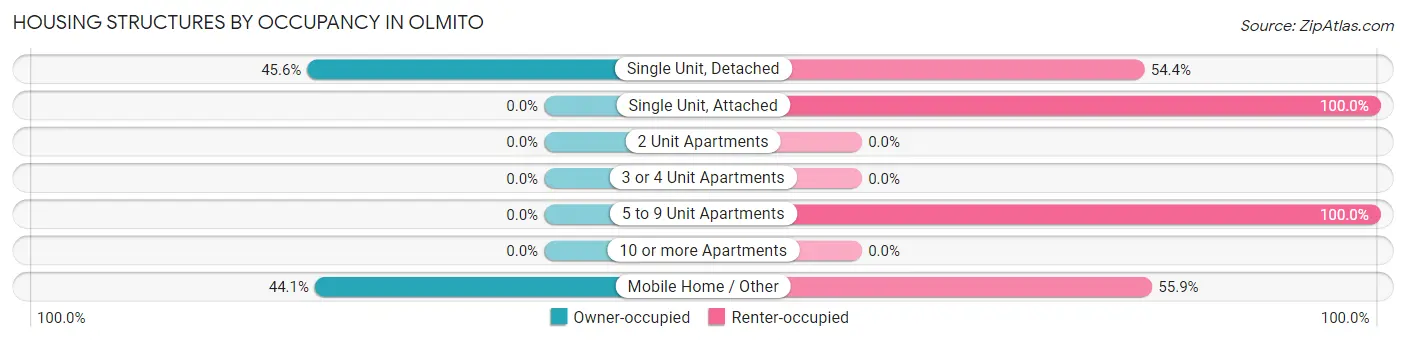
| Structure Type | Owner-occupied | Renter-occupied |
| Single Unit, Detached | 93 (45.6%) | 111 (54.4%) |
| Single Unit, Attached | 0 (0.0%) | 7 (100.0%) |
| 2 Unit Apartments | 0 (0.0%) | 0 (0.0%) |
| 3 or 4 Unit Apartments | 0 (0.0%) | 0 (0.0%) |
| 5 to 9 Unit Apartments | 0 (0.0%) | 37 (100.0%) |
| 10 or more Apartments | 0 (0.0%) | 0 (0.0%) |
| Mobile Home / Other | 15 (44.1%) | 19 (55.9%) |
| Total | 108 (38.3%) | 174 (61.7%) |
Housing Structures by Number of Rooms in Olmito
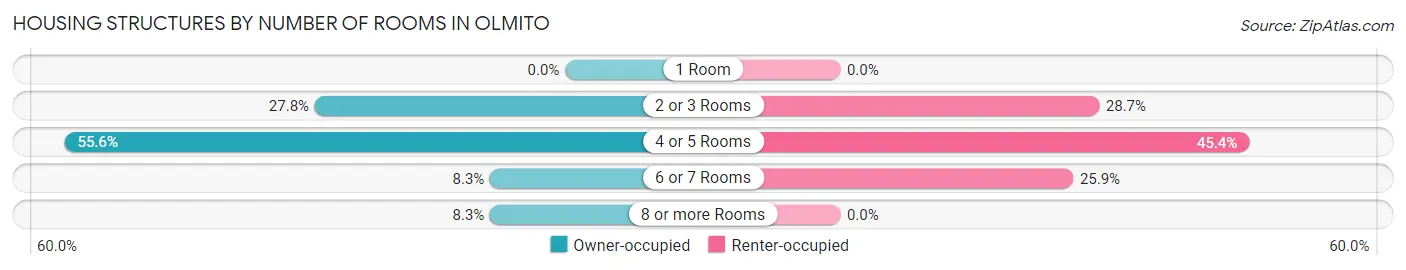
| Number of Rooms | Owner-occupied | Renter-occupied |
| 1 Room | 0 (0.0%) | 0 (0.0%) |
| 2 or 3 Rooms | 30 (27.8%) | 50 (28.7%) |
| 4 or 5 Rooms | 60 (55.6%) | 79 (45.4%) |
| 6 or 7 Rooms | 9 (8.3%) | 45 (25.9%) |
| 8 or more Rooms | 9 (8.3%) | 0 (0.0%) |
| Total | 108 (100.0%) | 174 (100.0%) |
Housing Structure by Heating Type in Olmito
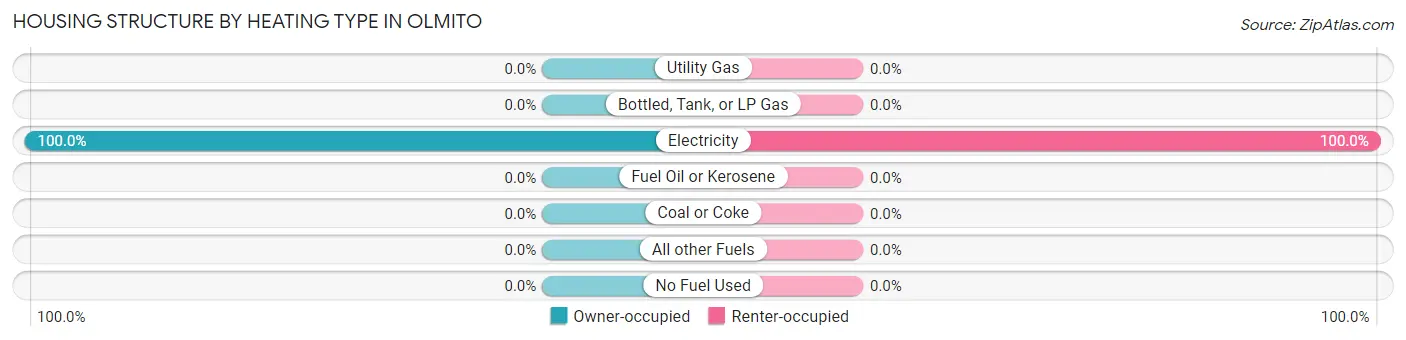
| Heating Type | Owner-occupied | Renter-occupied |
| Utility Gas | 0 (0.0%) | 0 (0.0%) |
| Bottled, Tank, or LP Gas | 0 (0.0%) | 0 (0.0%) |
| Electricity | 108 (100.0%) | 174 (100.0%) |
| Fuel Oil or Kerosene | 0 (0.0%) | 0 (0.0%) |
| Coal or Coke | 0 (0.0%) | 0 (0.0%) |
| All other Fuels | 0 (0.0%) | 0 (0.0%) |
| No Fuel Used | 0 (0.0%) | 0 (0.0%) |
| Total | 108 (100.0%) | 174 (100.0%) |
Household Vehicle Usage in Olmito
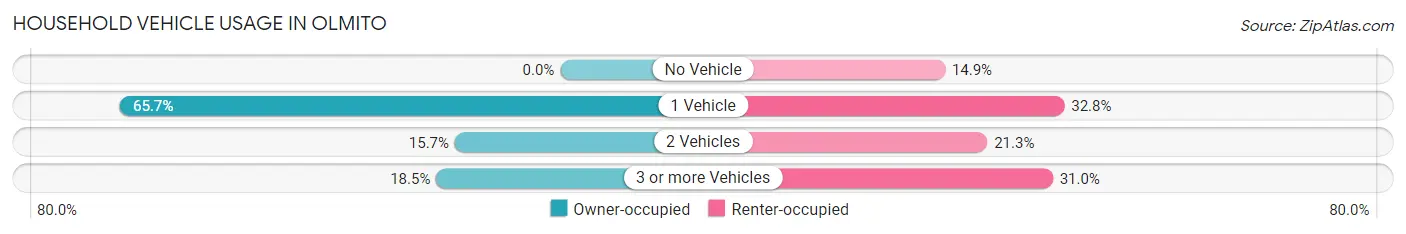
| Vehicles per Household | Owner-occupied | Renter-occupied |
| No Vehicle | 0 (0.0%) | 26 (14.9%) |
| 1 Vehicle | 71 (65.7%) | 57 (32.8%) |
| 2 Vehicles | 17 (15.7%) | 37 (21.3%) |
| 3 or more Vehicles | 20 (18.5%) | 54 (31.0%) |
| Total | 108 (100.0%) | 174 (100.0%) |
Real Estate & Mortgages in Olmito
Real Estate and Mortgage Overview in Olmito
| Characteristic | Without Mortgage | With Mortgage |
| Housing Units | 108 | 0 |
| Median Property Value | $85,000 | $0 |
| Median Household Income | $33,000 | $0 |
| Monthly Housing Costs | $336 | $0 |
| Real Estate Taxes | $1,179 | $0 |
Property Value by Mortgage Status in Olmito
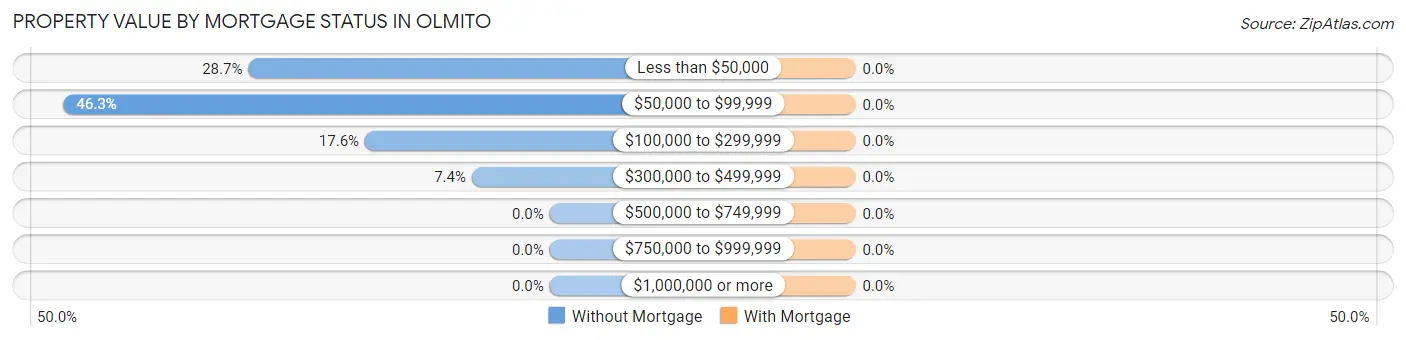
| Property Value | Without Mortgage | With Mortgage |
| Less than $50,000 | 31 (28.7%) | 0 (0.0%) |
| $50,000 to $99,999 | 50 (46.3%) | 0 (0.0%) |
| $100,000 to $299,999 | 19 (17.6%) | 0 (0.0%) |
| $300,000 to $499,999 | 8 (7.4%) | 0 (0.0%) |
| $500,000 to $749,999 | 0 (0.0%) | 0 (0.0%) |
| $750,000 to $999,999 | 0 (0.0%) | 0 (0.0%) |
| $1,000,000 or more | 0 (0.0%) | 0 (0.0%) |
| Total | 108 (100.0%) | 0 (0.0%) |
Household Income by Mortgage Status in Olmito
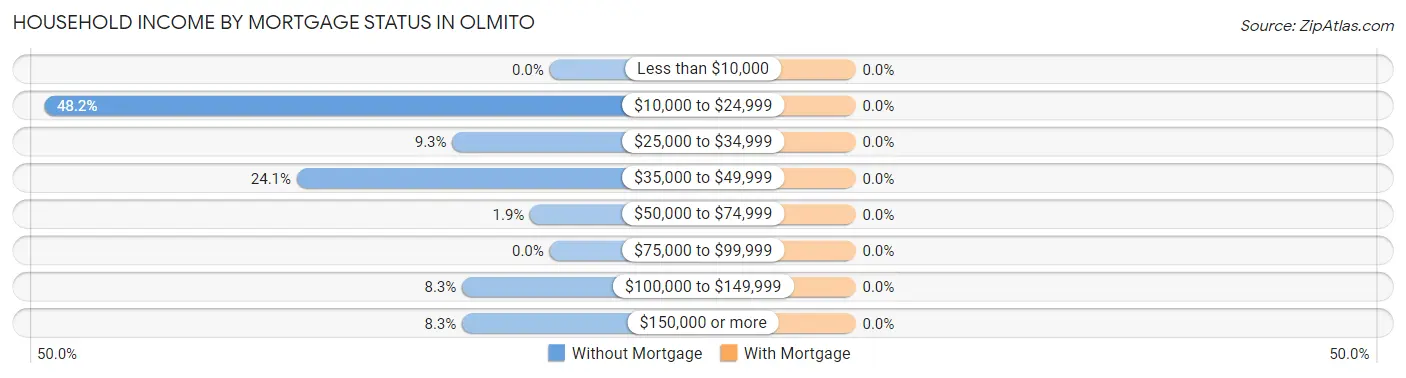
| Household Income | Without Mortgage | With Mortgage |
| Less than $10,000 | 0 (0.0%) | 0 (0.0%) |
| $10,000 to $24,999 | 52 (48.1%) | 0 (0.0%) |
| $25,000 to $34,999 | 10 (9.3%) | 0 (0.0%) |
| $35,000 to $49,999 | 26 (24.1%) | 0 (0.0%) |
| $50,000 to $74,999 | 2 (1.8%) | 0 (0.0%) |
| $75,000 to $99,999 | 0 (0.0%) | 0 (0.0%) |
| $100,000 to $149,999 | 9 (8.3%) | 0 (0.0%) |
| $150,000 or more | 9 (8.3%) | 0 (0.0%) |
| Total | 108 (100.0%) | 0 (0.0%) |
Property Value to Household Income Ratio in Olmito
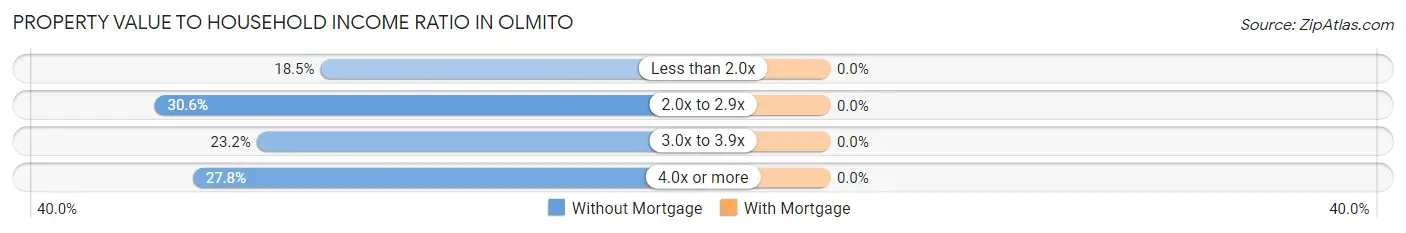
| Value-to-Income Ratio | Without Mortgage | With Mortgage |
| Less than 2.0x | 20 (18.5%) | 0 (0.0%) |
| 2.0x to 2.9x | 33 (30.6%) | 0 (0.0%) |
| 3.0x to 3.9x | 25 (23.2%) | 0 (0.0%) |
| 4.0x or more | 30 (27.8%) | 0 (0.0%) |
| Total | 108 (100.0%) | 0 (0.0%) |
Real Estate Taxes by Mortgage Status in Olmito
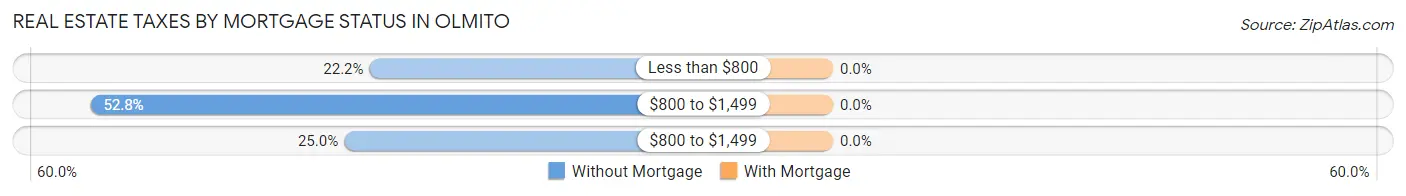
| Property Taxes | Without Mortgage | With Mortgage |
| Less than $800 | 24 (22.2%) | 0 (0.0%) |
| $800 to $1,499 | 57 (52.8%) | 0 (0.0%) |
| $800 to $1,499 | 27 (25.0%) | 0 (0.0%) |
| Total | 108 (100.0%) | 0 (0.0%) |
Health & Disability in Olmito
Health Insurance Coverage by Age in Olmito
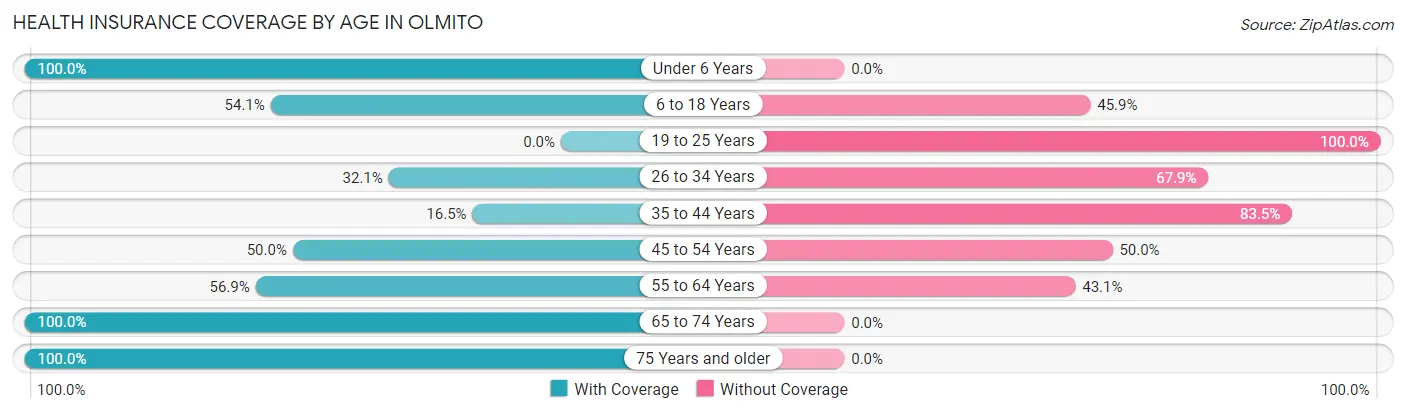
| Age Bracket | With Coverage | Without Coverage |
| Under 6 Years | 19 (100.0%) | 0 (0.0%) |
| 6 to 18 Years | 118 (54.1%) | 100 (45.9%) |
| 19 to 25 Years | 0 (0.0%) | 62 (100.0%) |
| 26 to 34 Years | 53 (32.1%) | 112 (67.9%) |
| 35 to 44 Years | 16 (16.5%) | 81 (83.5%) |
| 45 to 54 Years | 50 (50.0%) | 50 (50.0%) |
| 55 to 64 Years | 37 (56.9%) | 28 (43.1%) |
| 65 to 74 Years | 32 (100.0%) | 0 (0.0%) |
| 75 Years and older | 36 (100.0%) | 0 (0.0%) |
| Total | 361 (45.5%) | 433 (54.5%) |
Health Insurance Coverage by Citizenship Status in Olmito
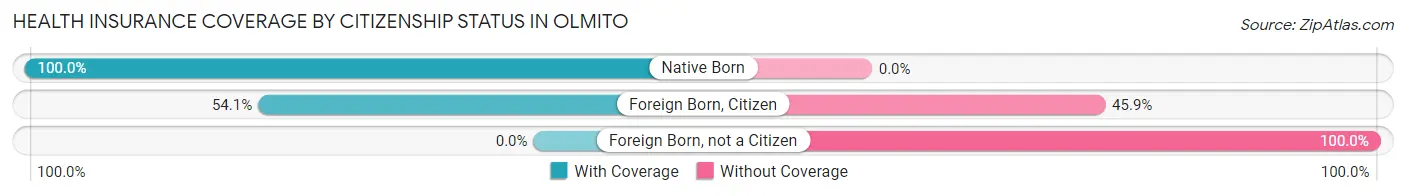
| Citizenship Status | With Coverage | Without Coverage |
| Native Born | 19 (100.0%) | 0 (0.0%) |
| Foreign Born, Citizen | 118 (54.1%) | 100 (45.9%) |
| Foreign Born, not a Citizen | 0 (0.0%) | 62 (100.0%) |
Health Insurance Coverage by Household Income in Olmito
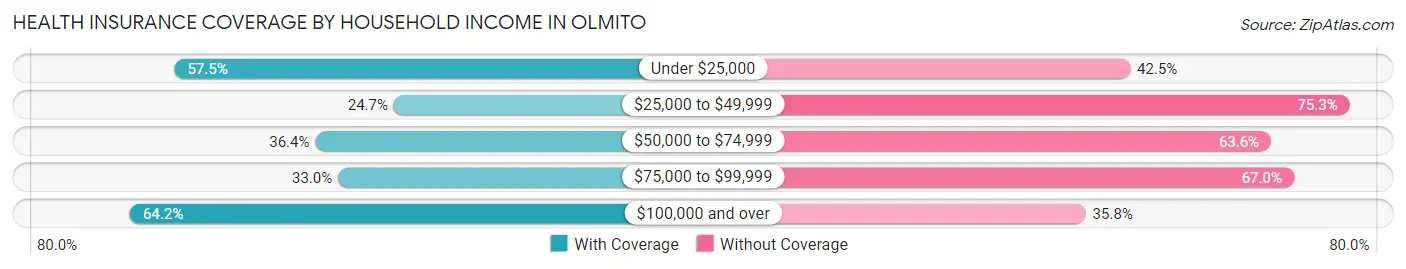
| Household Income | With Coverage | Without Coverage |
| Under $25,000 | 191 (57.5%) | 141 (42.5%) |
| $25,000 to $49,999 | 36 (24.7%) | 110 (75.3%) |
| $50,000 to $74,999 | 47 (36.4%) | 82 (63.6%) |
| $75,000 to $99,999 | 35 (33.0%) | 71 (67.0%) |
| $100,000 and over | 52 (64.2%) | 29 (35.8%) |
Public vs Private Health Insurance Coverage by Age in Olmito
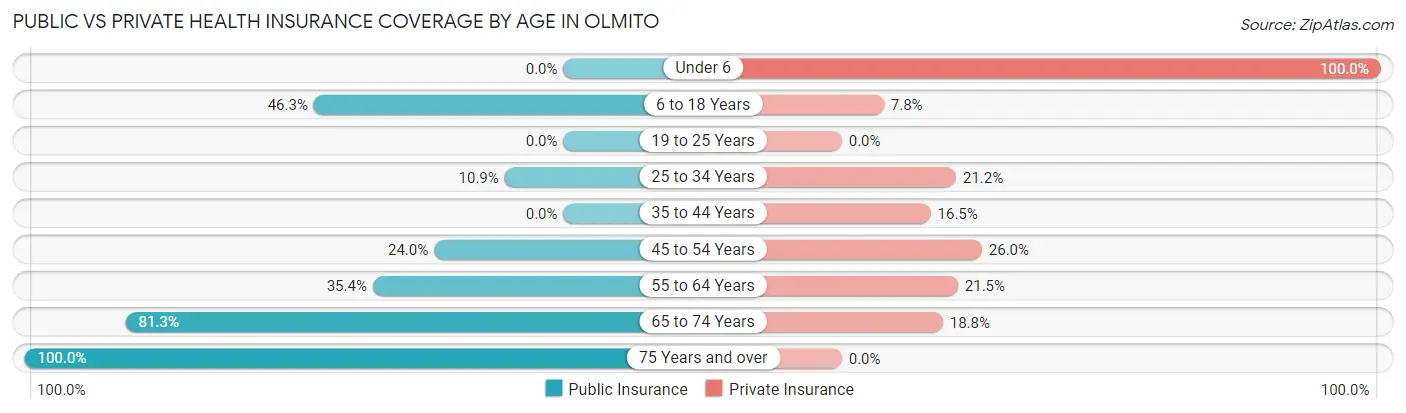
| Age Bracket | Public Insurance | Private Insurance |
| Under 6 | 0 (0.0%) | 19 (100.0%) |
| 6 to 18 Years | 101 (46.3%) | 17 (7.8%) |
| 19 to 25 Years | 0 (0.0%) | 0 (0.0%) |
| 25 to 34 Years | 18 (10.9%) | 35 (21.2%) |
| 35 to 44 Years | 0 (0.0%) | 16 (16.5%) |
| 45 to 54 Years | 24 (24.0%) | 26 (26.0%) |
| 55 to 64 Years | 23 (35.4%) | 14 (21.5%) |
| 65 to 74 Years | 26 (81.2%) | 6 (18.8%) |
| 75 Years and over | 36 (100.0%) | 0 (0.0%) |
| Total | 228 (28.7%) | 133 (16.8%) |
Disability Status by Sex by Age in Olmito
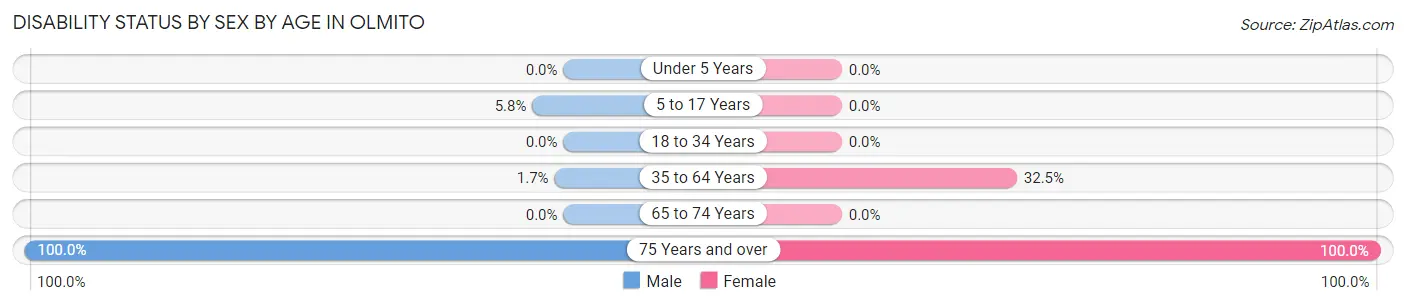
| Age Bracket | Male | Female |
| Under 5 Years | 0 (0.0%) | 0 (0.0%) |
| 5 to 17 Years | 8 (5.8%) | 0 (0.0%) |
| 18 to 34 Years | 0 (0.0%) | 0 (0.0%) |
| 35 to 64 Years | 3 (1.7%) | 26 (32.5%) |
| 65 to 74 Years | 0 (0.0%) | 0 (0.0%) |
| 75 Years and over | 10 (100.0%) | 26 (100.0%) |
Disability Class by Sex by Age in Olmito
Disability Class: Hearing Difficulty
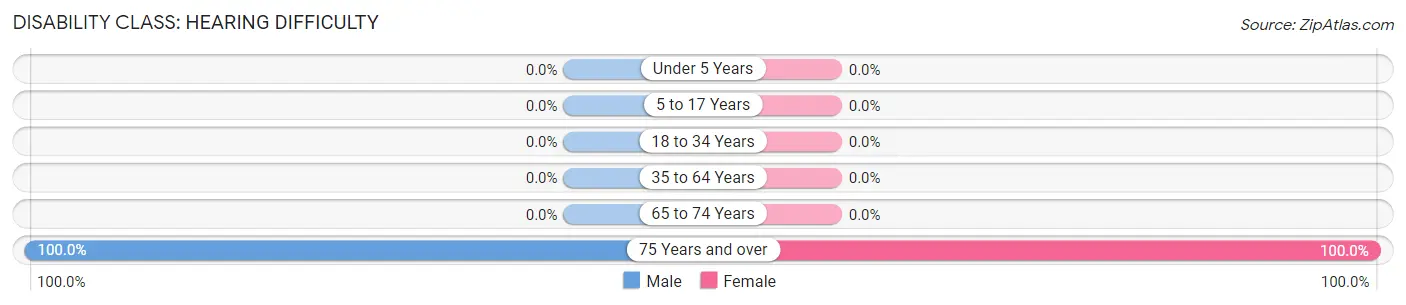
| Age Bracket | Male | Female |
| Under 5 Years | 0 (0.0%) | 0 (0.0%) |
| 5 to 17 Years | 0 (0.0%) | 0 (0.0%) |
| 18 to 34 Years | 0 (0.0%) | 0 (0.0%) |
| 35 to 64 Years | 0 (0.0%) | 0 (0.0%) |
| 65 to 74 Years | 0 (0.0%) | 0 (0.0%) |
| 75 Years and over | 10 (100.0%) | 26 (100.0%) |
Disability Class: Vision Difficulty
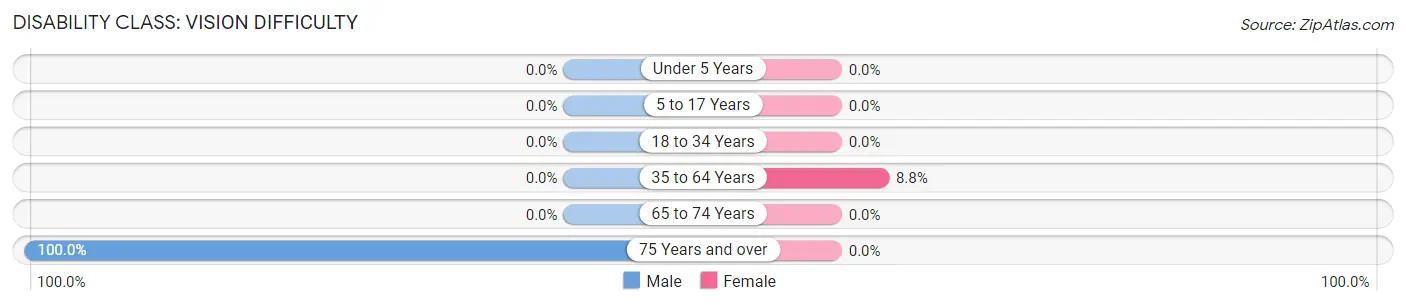
| Age Bracket | Male | Female |
| Under 5 Years | 0 (0.0%) | 0 (0.0%) |
| 5 to 17 Years | 0 (0.0%) | 0 (0.0%) |
| 18 to 34 Years | 0 (0.0%) | 0 (0.0%) |
| 35 to 64 Years | 0 (0.0%) | 7 (8.7%) |
| 65 to 74 Years | 0 (0.0%) | 0 (0.0%) |
| 75 Years and over | 10 (100.0%) | 0 (0.0%) |
Disability Class: Cognitive Difficulty
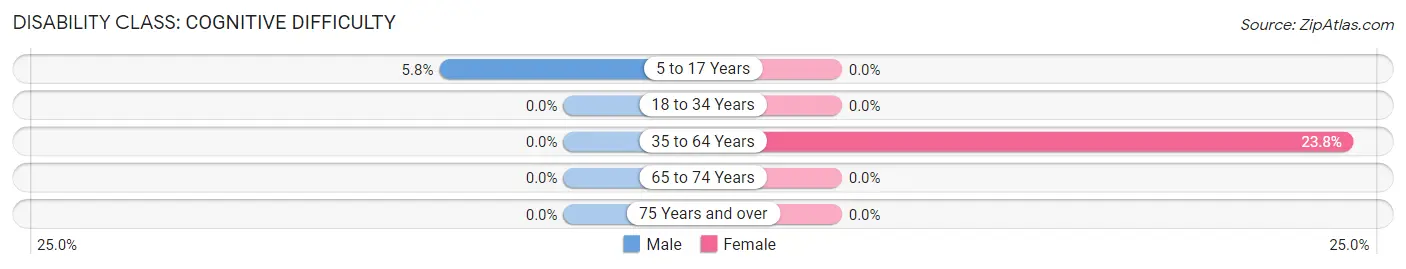
| Age Bracket | Male | Female |
| 5 to 17 Years | 8 (5.8%) | 0 (0.0%) |
| 18 to 34 Years | 0 (0.0%) | 0 (0.0%) |
| 35 to 64 Years | 0 (0.0%) | 19 (23.7%) |
| 65 to 74 Years | 0 (0.0%) | 0 (0.0%) |
| 75 Years and over | 0 (0.0%) | 0 (0.0%) |
Disability Class: Ambulatory Difficulty
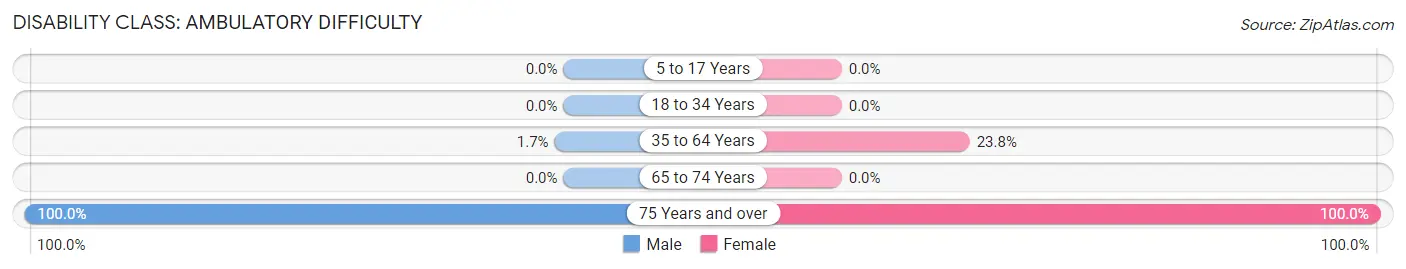
| Age Bracket | Male | Female |
| 5 to 17 Years | 0 (0.0%) | 0 (0.0%) |
| 18 to 34 Years | 0 (0.0%) | 0 (0.0%) |
| 35 to 64 Years | 3 (1.7%) | 19 (23.7%) |
| 65 to 74 Years | 0 (0.0%) | 0 (0.0%) |
| 75 Years and over | 10 (100.0%) | 26 (100.0%) |
Disability Class: Self-Care Difficulty
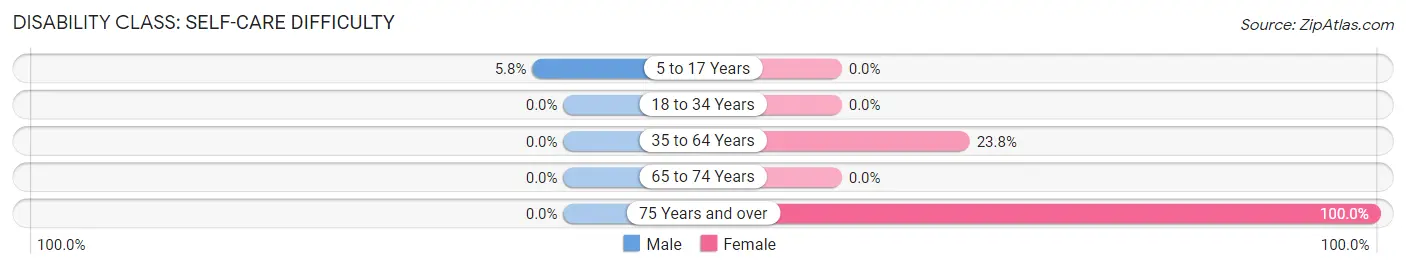
| Age Bracket | Male | Female |
| 5 to 17 Years | 8 (5.8%) | 0 (0.0%) |
| 18 to 34 Years | 0 (0.0%) | 0 (0.0%) |
| 35 to 64 Years | 0 (0.0%) | 19 (23.7%) |
| 65 to 74 Years | 0 (0.0%) | 0 (0.0%) |
| 75 Years and over | 0 (0.0%) | 26 (100.0%) |
Technology Access in Olmito
Computing Device Access in Olmito
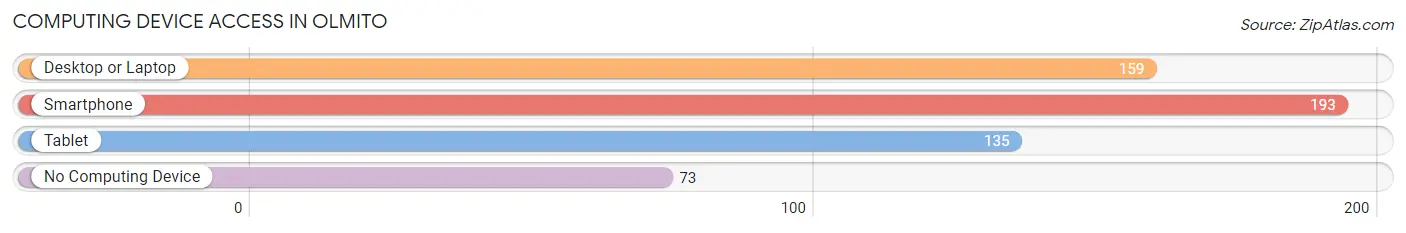
| Device Type | # Households | % Households |
| Desktop or Laptop | 159 | 56.4% |
| Smartphone | 193 | 68.4% |
| Tablet | 135 | 47.9% |
| No Computing Device | 73 | 25.9% |
| Total | 282 | 100.0% |
Internet Access in Olmito
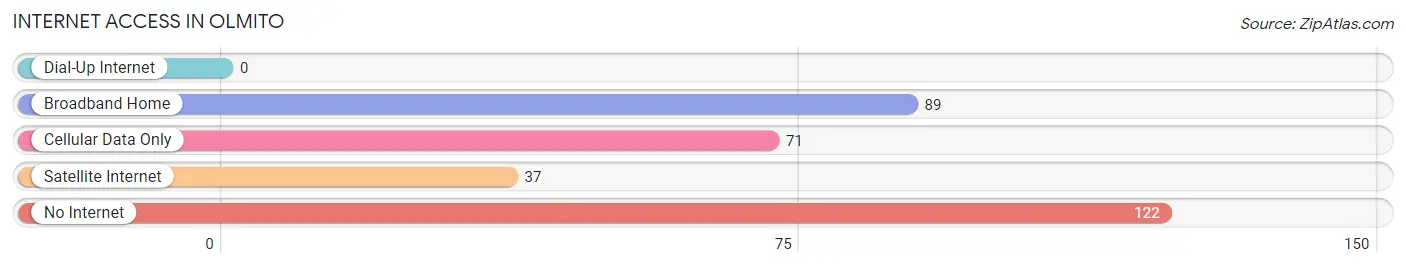
| Internet Type | # Households | % Households |
| Dial-Up Internet | 0 | 0.0% |
| Broadband Home | 89 | 31.6% |
| Cellular Data Only | 71 | 25.2% |
| Satellite Internet | 37 | 13.1% |
| No Internet | 122 | 43.3% |
| Total | 282 | 100.0% |
Olmito Summary
Olmito is a small unincorporated community located in Cameron County, Texas, United States. It is situated on the western edge of the Rio Grande Valley, approximately 20 miles north of Brownsville and the Mexican border. The population of Olmito was estimated to be 1,845 in 2019.
History
The area that is now Olmito was originally inhabited by the Karankawa Indians. The first European settlers arrived in the area in the late 1700s, and the town was officially established in 1848. The town was named after the nearby Olmito Creek, which was named by Spanish settlers who called it El Mito, meaning “the myth”.
In the late 1800s, the town was a popular stop for travelers on the Old Military Highway, which connected San Antonio to Brownsville. The town was also a popular destination for cattle ranchers, who used the area for grazing their herds.
In the early 1900s, the town began to grow as a result of the railroad. The St. Louis, Brownsville and Mexico Railway was built through the area in 1906, and the town soon became a hub for the local agricultural industry.
Geography
Olmito is located in Cameron County, Texas, approximately 20 miles north of Brownsville and the Mexican border. The town is situated on the western edge of the Rio Grande Valley, and is surrounded by agricultural fields and ranches. The climate in Olmito is subtropical, with hot summers and mild winters.
Economy
The economy of Olmito is largely based on agriculture. The town is home to several large farms and ranches, which produce a variety of crops, including cotton, corn, sorghum, and wheat. The town is also home to several small businesses, including restaurants, grocery stores, and auto repair shops.
Demographics
As of 2019, the population of Olmito was estimated to be 1,845. The population is predominantly Hispanic, with over 90% of the population identifying as such. The median household income in Olmito is $30,000, and the median home value is $90,000. The town has a poverty rate of 28.3%, which is higher than the national average.
Conclusion
Olmito is a small unincorporated community located in Cameron County, Texas. The town has a long history, dating back to the late 1700s, and has been a popular destination for travelers and cattle ranchers. The economy of Olmito is largely based on agriculture, and the town is home to several large farms and ranches. The population of Olmito is predominantly Hispanic, with over 90% of the population identifying as such. The median household income in Olmito is $30,000, and the median home value is $90,000.
Common Questions
What is Per Capita Income in Olmito?
Per Capita income in Olmito is $16,224.
What is the Median Family Income in Olmito?
Median Family Income in Olmito is $38,500.
What is the Median Household income in Olmito?
Median Household Income in Olmito is $37,950.
What is Inequality or Gini Index in Olmito?
Inequality or Gini Index in Olmito is 0.47.
What is the Total Population of Olmito?
Total Population of Olmito is 794.
What is the Total Male Population of Olmito?
Total Male Population of Olmito is 445.
What is the Total Female Population of Olmito?
Total Female Population of Olmito is 349.
What is the Ratio of Males per 100 Females in Olmito?
There are 127.51 Males per 100 Females in Olmito.
What is the Ratio of Females per 100 Males in Olmito?
There are 78.43 Females per 100 Males in Olmito.
What is the Median Population Age in Olmito?
Median Population Age in Olmito is 31.1 Years.
What is the Average Family Size in Olmito
Average Family Size in Olmito is 3.2 People.
What is the Average Household Size in Olmito
Average Household Size in Olmito is 2.8 People.
How Large is the Labor Force in Olmito?
There are 339 People in the Labor Forcein in Olmito.
What is the Percentage of People in the Labor Force in Olmito?
56.5% of People are in the Labor Force in Olmito.
What is the Unemployment Rate in Olmito?
Unemployment Rate in Olmito is 0.6%.