Miller s Cove, TX Map & Demographics
Miller s Cove Map
Miller s Cove Overview
$12,459
PER CAPITA INCOME
$29,583
AVG HOUSEHOLD INCOME
0.22
INEQUALITY / GINI INDEX
74
TOTAL POPULATION
49
MALE POPULATION
25
FEMALE POPULATION
196.00
MALES / 100 FEMALES
51.02
FEMALES / 100 MALES
46.3
MEDIAN AGE
3.8
AVG FAMILY SIZE
3.2
AVG HOUSEHOLD SIZE
43
LABOR FORCE [ PEOPLE ]
58.1%
PERCENT IN LABOR FORCE
30.2%
UNEMPLOYMENT RATE
Income in Miller s Cove
Income Overview in Miller s Cove
| Characteristic | Number | Measure |
| Per Capita Income | 74 | $12,459 |
| Median Family Income | 18 | $0 |
| Mean Family Income | 18 | $37,733 |
| Median Household Income | 23 | $29,583 |
| Mean Household Income | 23 | $37,652 |
| Income Deficit | 18 | $0 |
| Wage / Income Gap (%) | 74 | 0.00% |
| Wage / Income Gap ($) | 74 | 100.00¢ per $1 |
| Gini / Inequality Index | 74 | 0.22 |
Earnings by Sex in Miller s Cove
| Sex | Number | Average Earnings |
| Male | 33 (86.8%) | $0 |
| Female | 5 (13.2%) | $0 |
| Total | 38 (100.0%) | $0 |
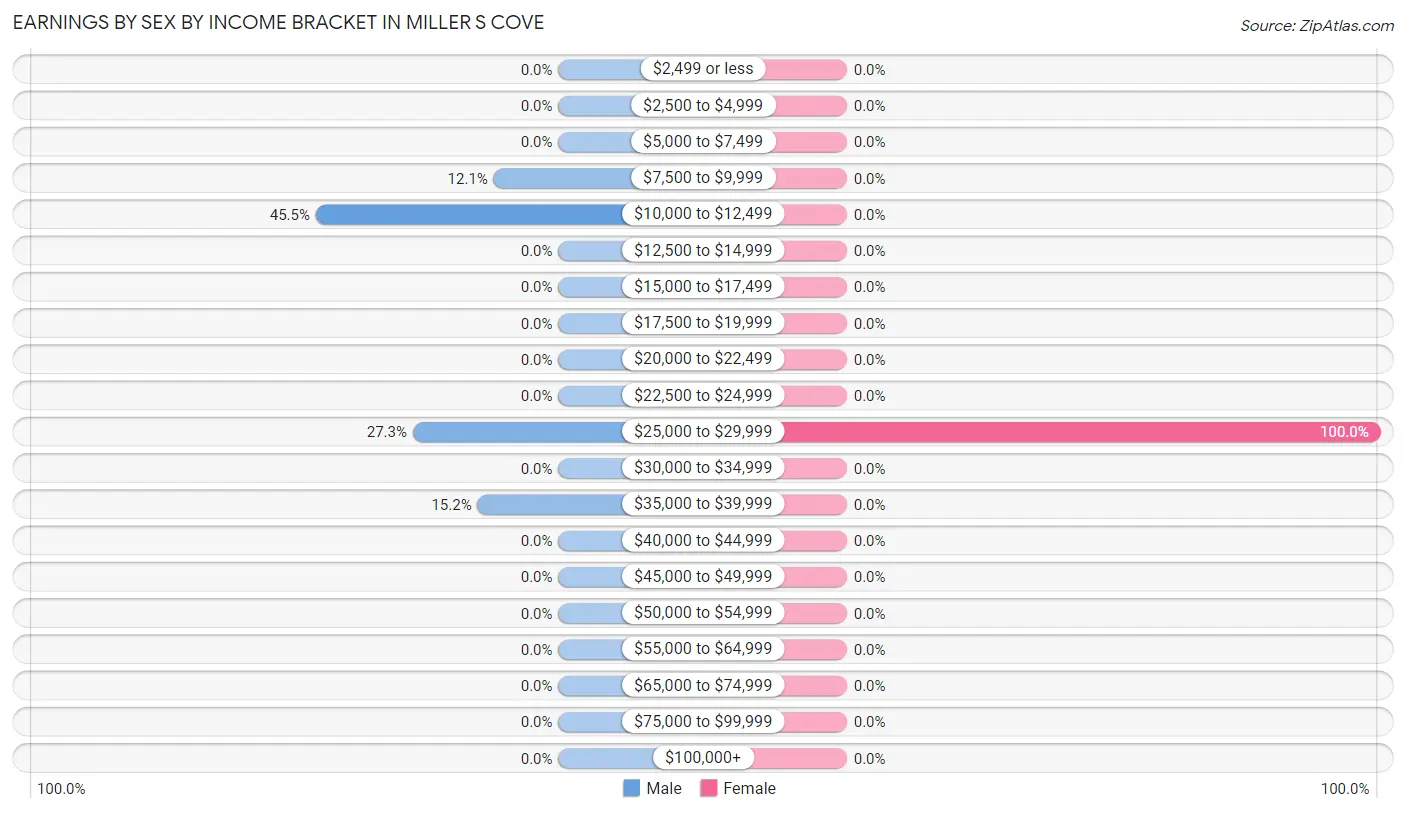
Earnings by Sex by Income Bracket in Miller s Cove
The most common earnings brackets in Miller s Cove are $10,000 to $12,499 for men (15 | 45.5%) and $25,000 to $29,999 for women (5 | 100.0%).
| Income | Male | Female |
| $2,499 or less | 0 (0.0%) | 0 (0.0%) |
| $2,500 to $4,999 | 0 (0.0%) | 0 (0.0%) |
| $5,000 to $7,499 | 0 (0.0%) | 0 (0.0%) |
| $7,500 to $9,999 | 4 (12.1%) | 0 (0.0%) |
| $10,000 to $12,499 | 15 (45.5%) | 0 (0.0%) |
| $12,500 to $14,999 | 0 (0.0%) | 0 (0.0%) |
| $15,000 to $17,499 | 0 (0.0%) | 0 (0.0%) |
| $17,500 to $19,999 | 0 (0.0%) | 0 (0.0%) |
| $20,000 to $22,499 | 0 (0.0%) | 0 (0.0%) |
| $22,500 to $24,999 | 0 (0.0%) | 0 (0.0%) |
| $25,000 to $29,999 | 9 (27.3%) | 5 (100.0%) |
| $30,000 to $34,999 | 0 (0.0%) | 0 (0.0%) |
| $35,000 to $39,999 | 5 (15.1%) | 0 (0.0%) |
| $40,000 to $44,999 | 0 (0.0%) | 0 (0.0%) |
| $45,000 to $49,999 | 0 (0.0%) | 0 (0.0%) |
| $50,000 to $54,999 | 0 (0.0%) | 0 (0.0%) |
| $55,000 to $64,999 | 0 (0.0%) | 0 (0.0%) |
| $65,000 to $74,999 | 0 (0.0%) | 0 (0.0%) |
| $75,000 to $99,999 | 0 (0.0%) | 0 (0.0%) |
| $100,000+ | 0 (0.0%) | 0 (0.0%) |
| Total | 33 (100.0%) | 5 (100.0%) |
Earnings by Sex by Educational Attainment in Miller s Cove
| Educational Attainment | Male Income | Female Income |
| Less than High School | - | - |
| High School Diploma | - | - |
| College or Associate's Degree | - | - |
| Bachelor's Degree | - | - |
| Graduate Degree | - | - |
| Total | - | - |
Family Income in Miller s Cove
Family Income Brackets in Miller s Cove
According to the Miller s Cove family income data, there are 9 families falling into the $25,000 to $34,999 income range, which is the most common income bracket and makes up 50.0% of all families.
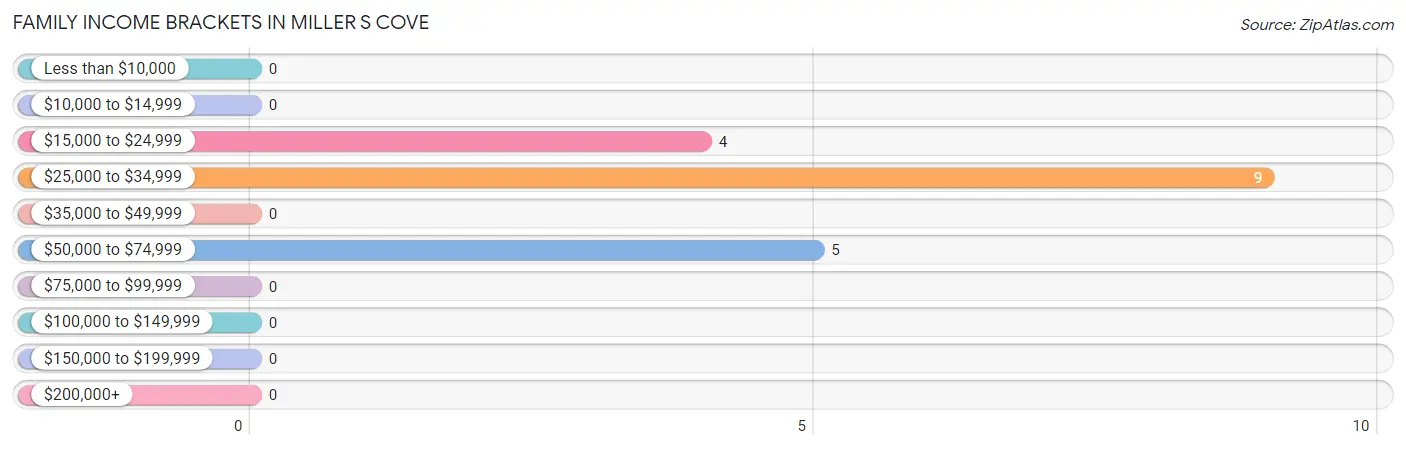
| Income Bracket | # Families | % Families |
| Less than $10,000 | 0 | 0.0% |
| $10,000 to $14,999 | 0 | 0.0% |
| $15,000 to $24,999 | 4 | 22.2% |
| $25,000 to $34,999 | 9 | 50.0% |
| $35,000 to $49,999 | 0 | 0.0% |
| $50,000 to $74,999 | 5 | 27.8% |
| $75,000 to $99,999 | 0 | 0.0% |
| $100,000 to $149,999 | 0 | 0.0% |
| $150,000 to $199,999 | 0 | 0.0% |
| $200,000+ | 0 | 0.0% |
Family Income by Famaliy Size in Miller s Cove
| Income Bracket | # Families | Median Income |
| 2-Person Families | 0 (0.0%) | $0 |
| 3-Person Families | 9 (50.0%) | $0 |
| 4-Person Families | 4 (22.2%) | $0 |
| 5-Person Families | 5 (27.8%) | $0 |
| 6-Person Families | 0 (0.0%) | $0 |
| 7+ Person Families | 0 (0.0%) | $0 |
| Total | 18 (100.0%) | $0 |
Family Income by Number of Earners in Miller s Cove
| Number of Earners | # Families | Median Income |
| No Earners | 0 (0.0%) | $0 |
| 1 Earner | 13 (72.2%) | $0 |
| 2 Earners | 0 (0.0%) | $0 |
| 3+ Earners | 5 (27.8%) | $0 |
| Total | 18 (100.0%) | $0 |
Household Income in Miller s Cove
Household Income Brackets in Miller s Cove
With 9 households falling in the category, the $25,000 to $34,999 income range is the most frequent in Miller s Cove, accounting for 39.1% of all households.
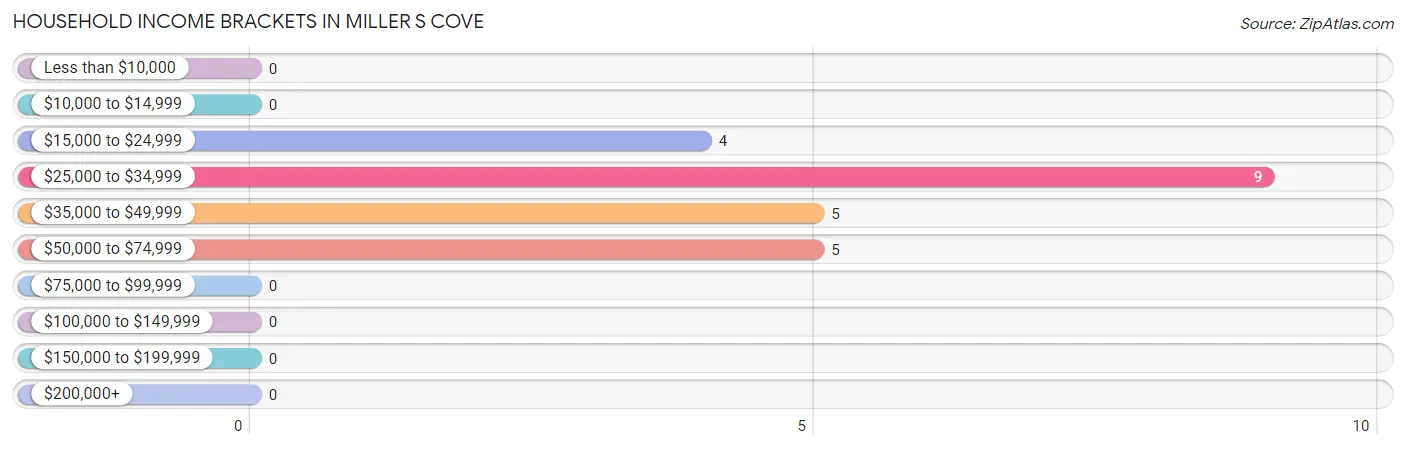
| Income Bracket | # Households | % Households |
| Less than $10,000 | 0 | 0.0% |
| $10,000 to $14,999 | 0 | 0.0% |
| $15,000 to $24,999 | 4 | 17.4% |
| $25,000 to $34,999 | 9 | 39.1% |
| $35,000 to $49,999 | 5 | 21.7% |
| $50,000 to $74,999 | 5 | 21.7% |
| $75,000 to $99,999 | 0 | 0.0% |
| $100,000 to $149,999 | 0 | 0.0% |
| $150,000 to $199,999 | 0 | 0.0% |
| $200,000+ | 0 | 0.0% |
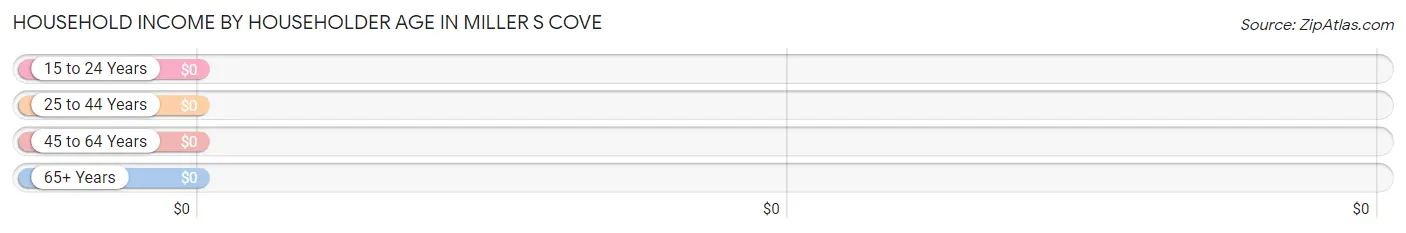
Household Income by Householder Age in Miller s Cove
| Income Bracket | # Households | Median Income |
| 15 to 24 Years | 0 (0.0%) | $0 |
| 25 to 44 Years | 0 (0.0%) | $0 |
| 45 to 64 Years | 10 (43.5%) | $0 |
| 65+ Years | 13 (56.5%) | $0 |
| Total | 23 (100.0%) | $29,583 |
Poverty in Miller s Cove
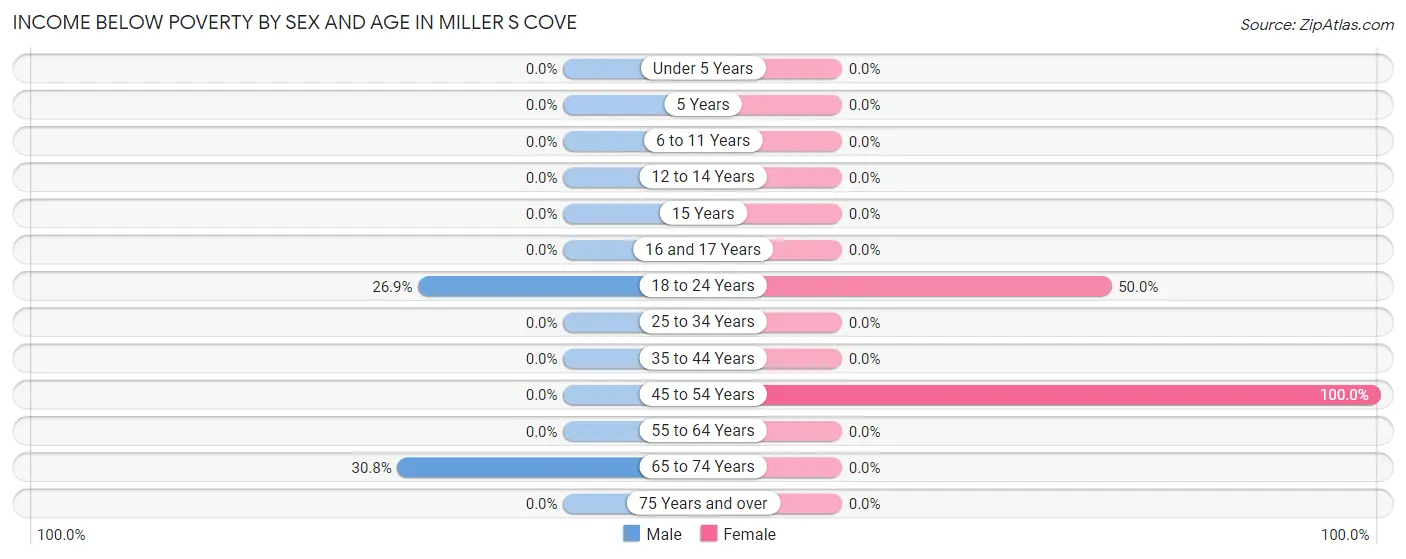
Income Below Poverty by Sex and Age in Miller s Cove
With 22.5% poverty level for males and 36.0% for females among the residents of Miller s Cove, 65 to 74 year old males and 45 to 54 year old females are the most vulnerable to poverty, with 4 males (30.8%) and 4 females (100.0%) in their respective age groups living below the poverty level.
| Age Bracket | Male | Female |
| Under 5 Years | 0 (0.0%) | 0 (0.0%) |
| 5 Years | 0 (0.0%) | 0 (0.0%) |
| 6 to 11 Years | 0 (0.0%) | 0 (0.0%) |
| 12 to 14 Years | 0 (0.0%) | 0 (0.0%) |
| 15 Years | 0 (0.0%) | 0 (0.0%) |
| 16 and 17 Years | 0 (0.0%) | 0 (0.0%) |
| 18 to 24 Years | 7 (26.9%) | 5 (50.0%) |
| 25 to 34 Years | 0 (0.0%) | 0 (0.0%) |
| 35 to 44 Years | 0 (0.0%) | 0 (0.0%) |
| 45 to 54 Years | 0 (0.0%) | 4 (100.0%) |
| 55 to 64 Years | 0 (0.0%) | 0 (0.0%) |
| 65 to 74 Years | 4 (30.8%) | 0 (0.0%) |
| 75 Years and over | 0 (0.0%) | 0 (0.0%) |
| Total | 11 (22.5%) | 9 (36.0%) |
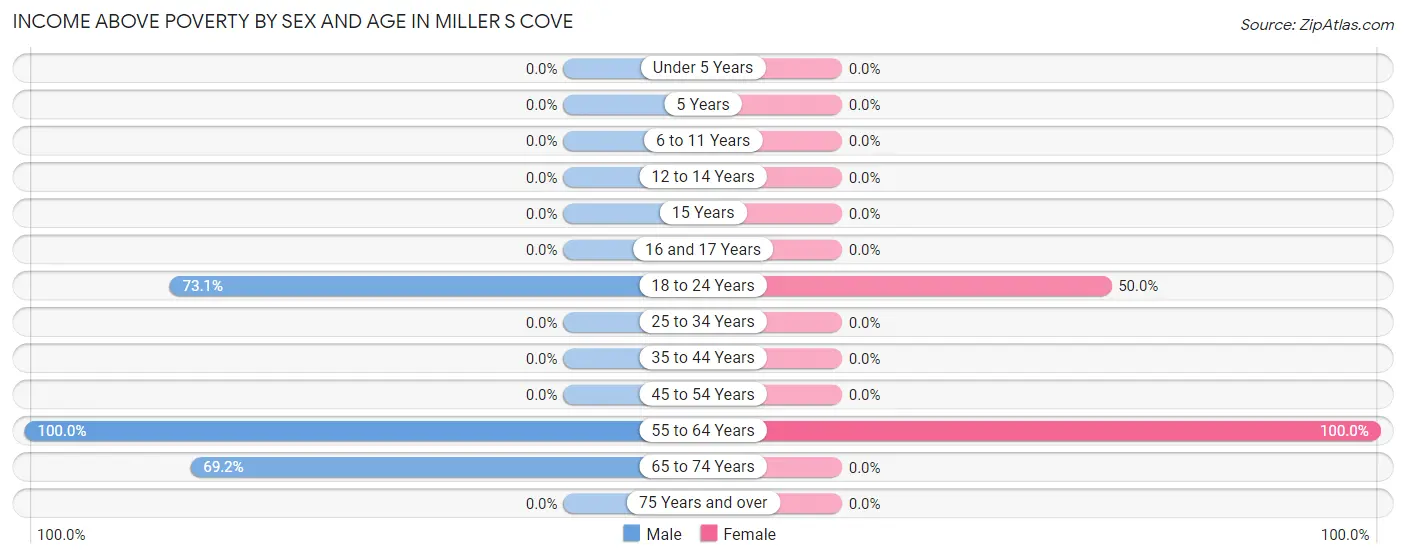
Income Above Poverty by Sex and Age in Miller s Cove
According to the poverty statistics in Miller s Cove, males aged 55 to 64 years and females aged 55 to 64 years are the age groups that are most secure financially, with 100.0% of males and 100.0% of females in these age groups living above the poverty line.
| Age Bracket | Male | Female |
| Under 5 Years | 0 (0.0%) | 0 (0.0%) |
| 5 Years | 0 (0.0%) | 0 (0.0%) |
| 6 to 11 Years | 0 (0.0%) | 0 (0.0%) |
| 12 to 14 Years | 0 (0.0%) | 0 (0.0%) |
| 15 Years | 0 (0.0%) | 0 (0.0%) |
| 16 and 17 Years | 0 (0.0%) | 0 (0.0%) |
| 18 to 24 Years | 19 (73.1%) | 5 (50.0%) |
| 25 to 34 Years | 0 (0.0%) | 0 (0.0%) |
| 35 to 44 Years | 0 (0.0%) | 0 (0.0%) |
| 45 to 54 Years | 0 (0.0%) | 0 (0.0%) |
| 55 to 64 Years | 10 (100.0%) | 11 (100.0%) |
| 65 to 74 Years | 9 (69.2%) | 0 (0.0%) |
| 75 Years and over | 0 (0.0%) | 0 (0.0%) |
| Total | 38 (77.5%) | 16 (64.0%) |
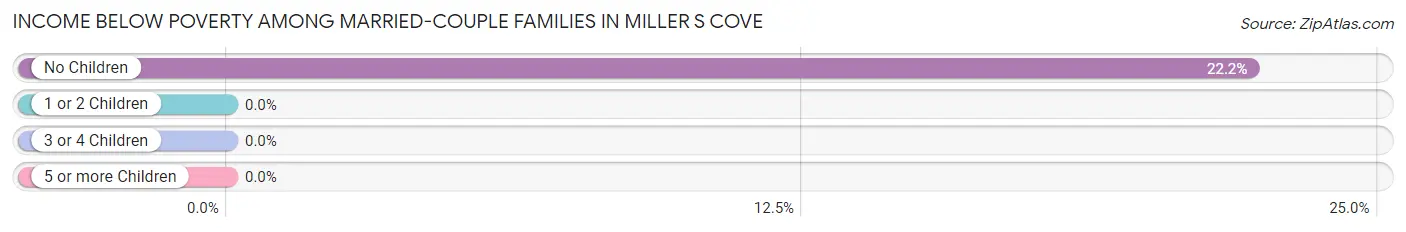
Income Below Poverty Among Married-Couple Families in Miller s Cove
The poverty statistics for married-couple families in Miller s Cove show that 22.2% or 4 of the total 18 families live below the poverty line. Families with no children have the highest poverty rate of 22.2%, comprising of 4 families. On the other hand, families with no children have the lowest poverty rate of 22.2%, which includes 4 families.
| Children | Above Poverty | Below Poverty |
| No Children | 14 (77.8%) | 4 (22.2%) |
| 1 or 2 Children | 0 (0.0%) | 0 (0.0%) |
| 3 or 4 Children | 0 (0.0%) | 0 (0.0%) |
| 5 or more Children | 0 (0.0%) | 0 (0.0%) |
| Total | 14 (77.8%) | 4 (22.2%) |
Income Below Poverty Among Single-Parent Households in Miller s Cove
| Children | Single Father | Single Mother |
| No Children | 0 (0.0%) | 0 (0.0%) |
| 1 or 2 Children | 0 (0.0%) | 0 (0.0%) |
| 3 or 4 Children | 0 (0.0%) | 0 (0.0%) |
| 5 or more Children | 0 (0.0%) | 0 (0.0%) |
| Total | 0 (0.0%) | 0 (0.0%) |
Income Below Poverty Among Married-Couple vs Single-Parent Households in Miller s Cove
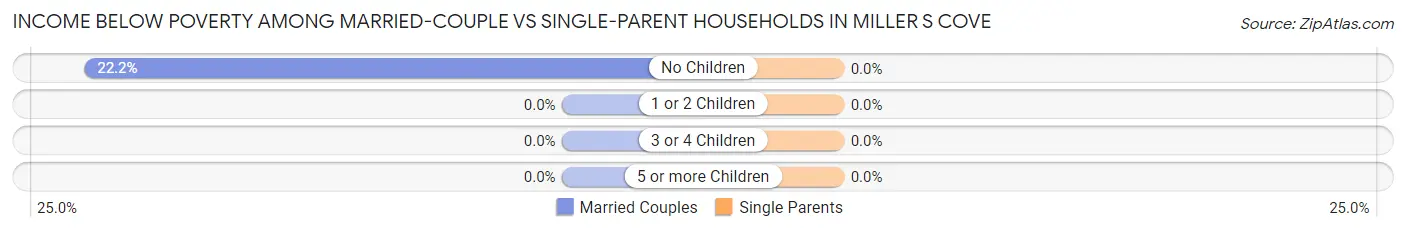
| Children | Married-Couple Families | Single-Parent Households |
| No Children | 4 (22.2%) | 0 (0.0%) |
| 1 or 2 Children | 0 (0.0%) | 0 (0.0%) |
| 3 or 4 Children | 0 (0.0%) | 0 (0.0%) |
| 5 or more Children | 0 (0.0%) | 0 (0.0%) |
| Total | 4 (22.2%) | 0 (0.0%) |
Race in Miller s Cove
The most populous races in Miller s Cove are Hispanic or Latino (74 | 100.0%), White / Caucasian (35 | 47.3%), and Two or more Races (34 | 46.0%).
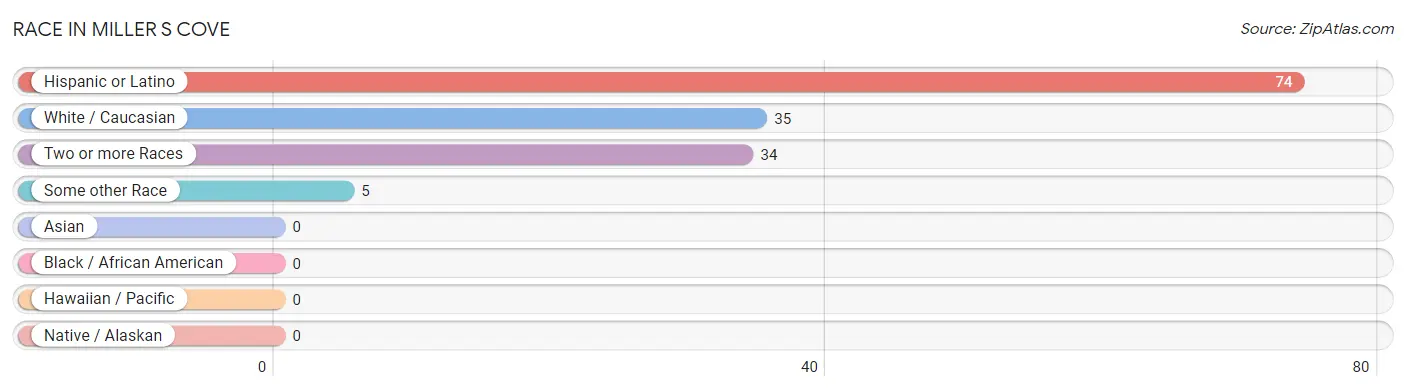
| Race | # Population | % Population |
| Asian | 0 | 0.0% |
| Black / African American | 0 | 0.0% |
| Hawaiian / Pacific | 0 | 0.0% |
| Hispanic or Latino | 74 | 100.0% |
| Native / Alaskan | 0 | 0.0% |
| White / Caucasian | 35 | 47.3% |
| Two or more Races | 34 | 46.0% |
| Some other Race | 5 | 6.8% |
| Total | 74 | 100.0% |
Ancestry in Miller s Cove
The most populous ancestries reported in Miller s Cove are Mexican (74 | 100.0%), and American (4 | 5.4%), together accounting for 105.4% of all Miller s Cove residents.
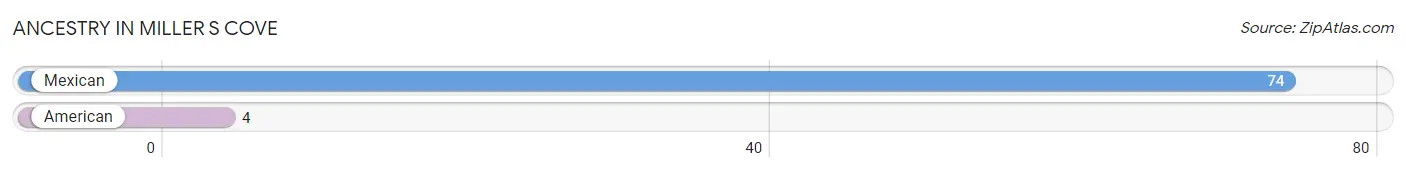
| Ancestry | # Population | % Population |
| American | 4 | 5.4% |
| Mexican | 74 | 100.0% | View All 2 Rows |
Immigrants in Miller s Cove
The most numerous immigrant groups reported in Miller s Cove came from Central America (36 | 48.6%), Latin America (36 | 48.6%), and Mexico (36 | 48.6%), together accounting for 146.0% of all Miller s Cove residents.
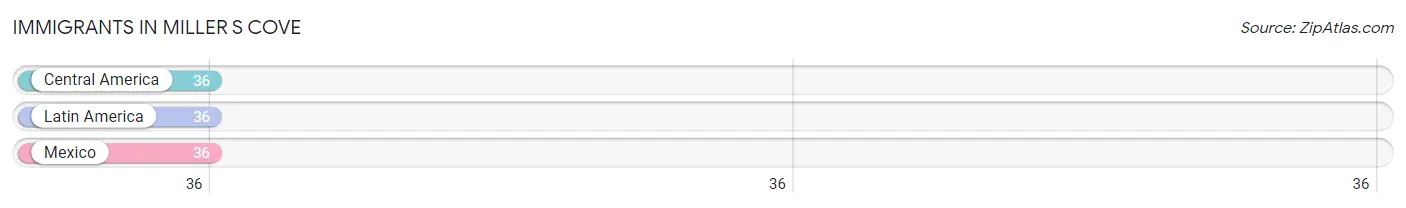
| Immigration Origin | # Population | % Population |
| Central America | 36 | 48.6% |
| Latin America | 36 | 48.6% |
| Mexico | 36 | 48.6% | View All 3 Rows |
Sex and Age in Miller s Cove
Sex and Age in Miller s Cove
The most populous age groups in Miller s Cove are 20 to 24 Years (15 | 30.6%) for men and 55 to 59 Years (6 | 24.0%) for women.
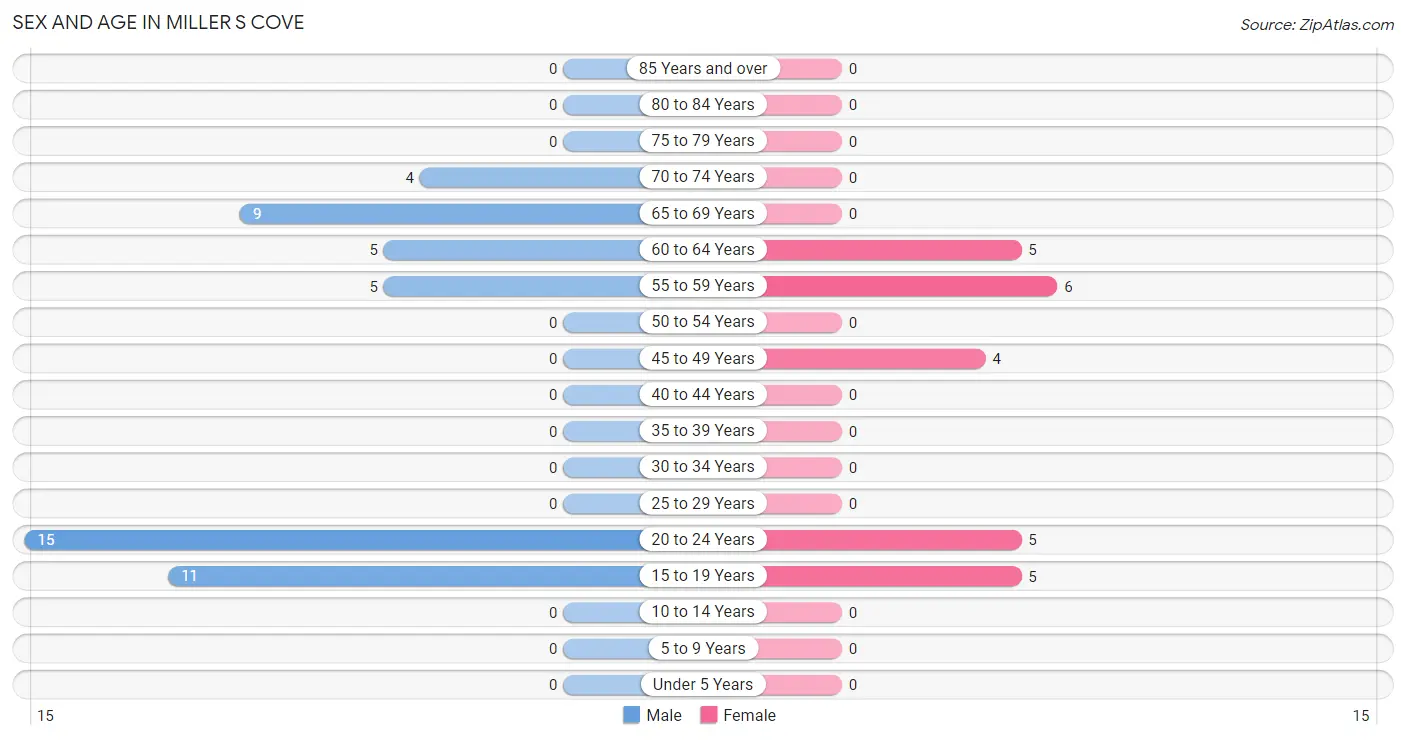
| Age Bracket | Male | Female |
| Under 5 Years | 0 (0.0%) | 0 (0.0%) |
| 5 to 9 Years | 0 (0.0%) | 0 (0.0%) |
| 10 to 14 Years | 0 (0.0%) | 0 (0.0%) |
| 15 to 19 Years | 11 (22.5%) | 5 (20.0%) |
| 20 to 24 Years | 15 (30.6%) | 5 (20.0%) |
| 25 to 29 Years | 0 (0.0%) | 0 (0.0%) |
| 30 to 34 Years | 0 (0.0%) | 0 (0.0%) |
| 35 to 39 Years | 0 (0.0%) | 0 (0.0%) |
| 40 to 44 Years | 0 (0.0%) | 0 (0.0%) |
| 45 to 49 Years | 0 (0.0%) | 4 (16.0%) |
| 50 to 54 Years | 0 (0.0%) | 0 (0.0%) |
| 55 to 59 Years | 5 (10.2%) | 6 (24.0%) |
| 60 to 64 Years | 5 (10.2%) | 5 (20.0%) |
| 65 to 69 Years | 9 (18.4%) | 0 (0.0%) |
| 70 to 74 Years | 4 (8.2%) | 0 (0.0%) |
| 75 to 79 Years | 0 (0.0%) | 0 (0.0%) |
| 80 to 84 Years | 0 (0.0%) | 0 (0.0%) |
| 85 Years and over | 0 (0.0%) | 0 (0.0%) |
| Total | 49 (100.0%) | 25 (100.0%) |
Families and Households in Miller s Cove
Median Family Size in Miller s Cove
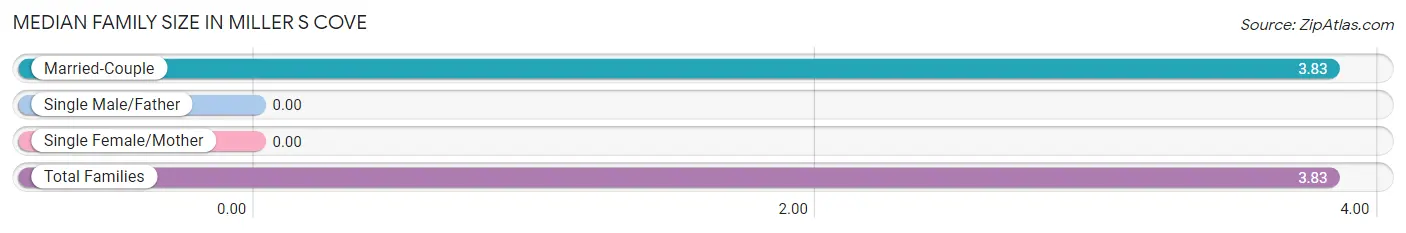
| Family Type | # Families | Family Size |
| Married-Couple | 18 (100.0%) | 3.83 |
| Single Male/Father | 0 (0.0%) | - |
| Single Female/Mother | 0 (0.0%) | - |
| Total Families | 18 (100.0%) | 3.83 |
Median Household Size in Miller s Cove
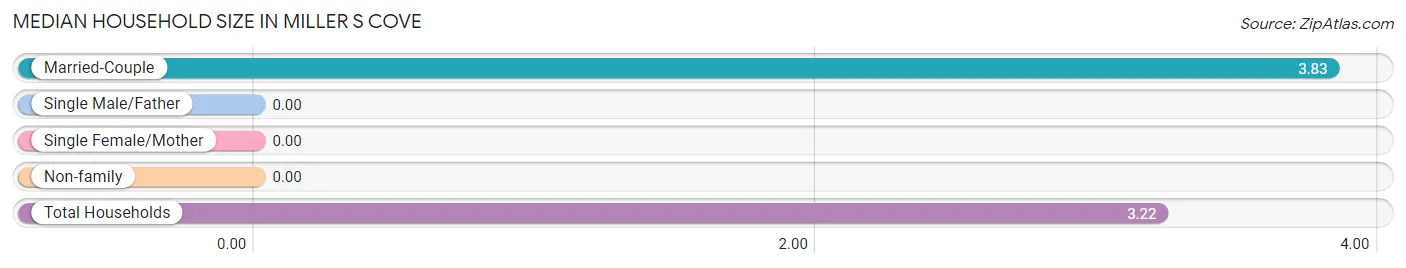
| Household Type | # Households | Household Size |
| Married-Couple | 18 (78.3%) | 3.83 |
| Single Male/Father | 0 (0.0%) | - |
| Single Female/Mother | 0 (0.0%) | - |
| Non-family | 5 (21.7%) | - |
| Total Households | 23 (100.0%) | 3.22 |
Household Size by Marriage Status in Miller s Cove
Out of a total of 23 households in Miller s Cove, 18 (78.3%) are family households, while 5 (21.7%) are nonfamily households. The most numerous type of family households are 3-person households, comprising 9, and the most common type of nonfamily households are 1-person households, comprising 5.
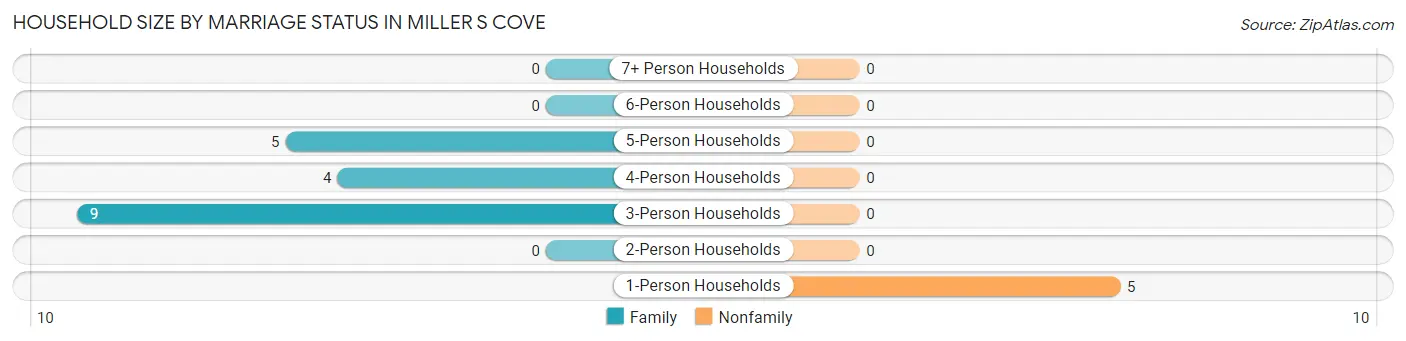
| Household Size | Family Households | Nonfamily Households |
| 1-Person Households | - | 5 (21.7%) |
| 2-Person Households | 0 (0.0%) | 0 (0.0%) |
| 3-Person Households | 9 (39.1%) | 0 (0.0%) |
| 4-Person Households | 4 (17.4%) | 0 (0.0%) |
| 5-Person Households | 5 (21.7%) | 0 (0.0%) |
| 6-Person Households | 0 (0.0%) | 0 (0.0%) |
| 7+ Person Households | 0 (0.0%) | 0 (0.0%) |
| Total | 18 (78.3%) | 5 (21.7%) |
Female Fertility in Miller s Cove
Fertility by Age in Miller s Cove
| Age Bracket | Women with Births | Births / 1,000 Women |
| 15 to 19 years | 0 (0.0%) | 0.0 |
| 20 to 34 years | 0 (0.0%) | 0.0 |
| 35 to 50 years | 0 (0.0%) | 0.0 |
| Total | 0 (0.0%) | 0.0 |
Fertility by Age by Marriage Status in Miller s Cove
| Age Bracket | Married | Unmarried |
| 15 to 19 years | 0 (0.0%) | 0 (0.0%) |
| 20 to 34 years | 0 (0.0%) | 0 (0.0%) |
| 35 to 50 years | 0 (0.0%) | 0 (0.0%) |
| Total | 0 (0.0%) | 0 (0.0%) |
Fertility by Education in Miller s Cove
| Educational Attainment | Women with Births | Births / 1,000 Women |
| Less than High School | 0 (0.0%) | 0.0 |
| High School Diploma | 0 (0.0%) | 0.0 |
| College or Associate's Degree | 0 (0.0%) | 0.0 |
| Bachelor's Degree | 0 (0.0%) | 0.0 |
| Graduate Degree | 0 (0.0%) | 0.0 |
| Total | 0 (0.0%) | 0.0 |
Fertility by Education by Marriage Status in Miller s Cove
| Educational Attainment | Married | Unmarried |
| Less than High School | 0 (0.0%) | 0 (0.0%) |
| High School Diploma | 0 (0.0%) | 0 (0.0%) |
| College or Associate's Degree | 0 (0.0%) | 0 (0.0%) |
| Bachelor's Degree | 0 (0.0%) | 0 (0.0%) |
| Graduate Degree | 0 (0.0%) | 0 (0.0%) |
| Total | 0 (0.0%) | 0 (0.0%) |
Employment Characteristics in Miller s Cove
Employment by Class of Employer in Miller s Cove
Among the 30 employed individuals in Miller s Cove, , and private company employees (30 | 100.0%) make up the most common classes of employment.
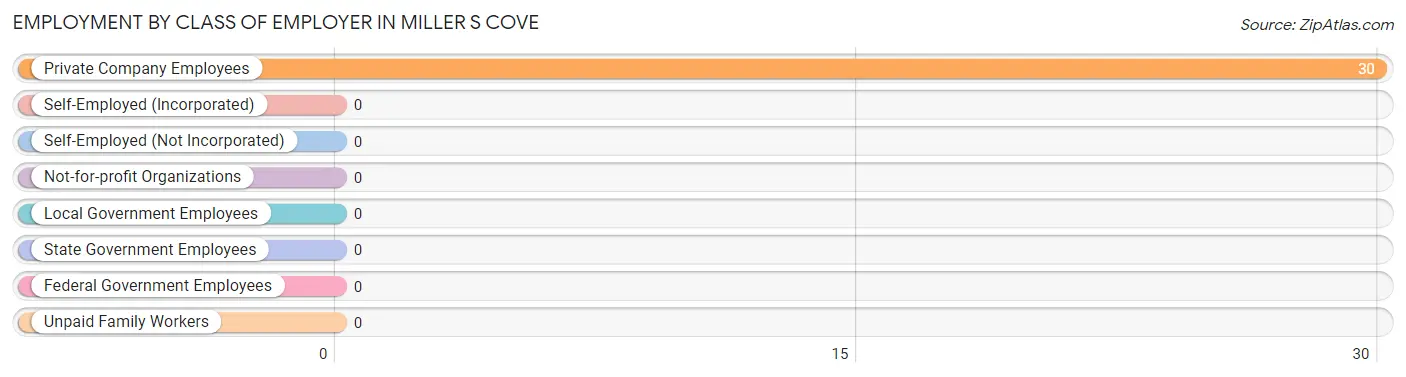
| Employer Class | # Employees | % Employees |
| Private Company Employees | 30 | 100.0% |
| Self-Employed (Incorporated) | 0 | 0.0% |
| Self-Employed (Not Incorporated) | 0 | 0.0% |
| Not-for-profit Organizations | 0 | 0.0% |
| Local Government Employees | 0 | 0.0% |
| State Government Employees | 0 | 0.0% |
| Federal Government Employees | 0 | 0.0% |
| Unpaid Family Workers | 0 | 0.0% |
| Total | 30 | 100.0% |
Employment Status by Age in Miller s Cove
According to the labor force statistics for Miller s Cove, out of the total population over 16 years of age (74), 58.1% or 43 individuals are in the labor force, with 30.2% or 13 of them unemployed. The age group with the highest labor force participation rate is 20 to 24 years, with 100.0% or 20 individuals in the labor force. Within the labor force, the 16 to 19 years age range has the highest percentage of unemployed individuals, with 55.6% or 5 of them being unemployed.
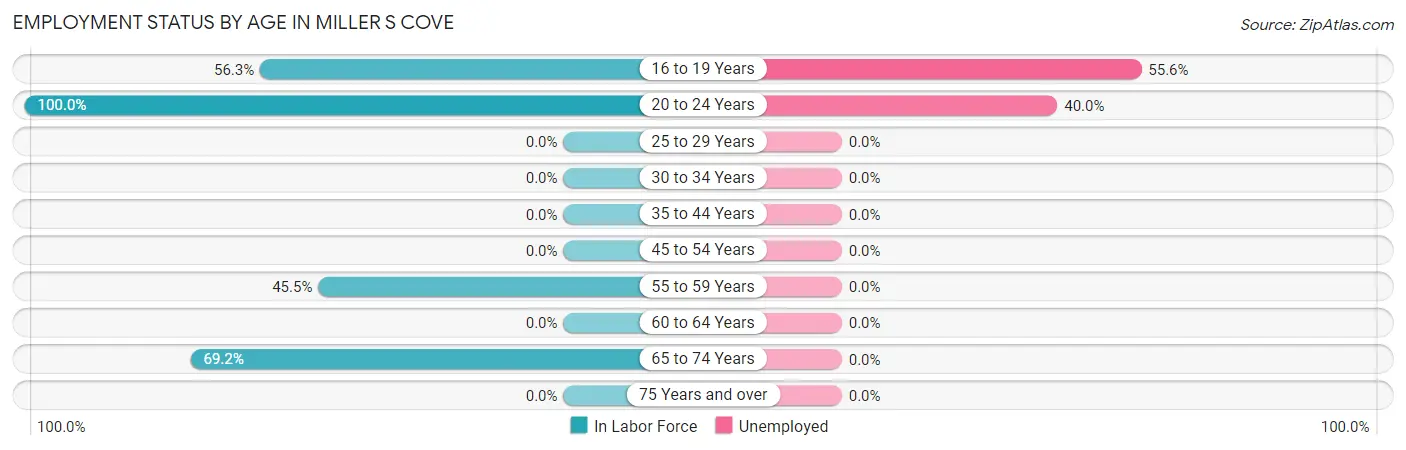
| Age Bracket | In Labor Force | Unemployed |
| 16 to 19 Years | 9 (56.3%) | 5 (55.6%) |
| 20 to 24 Years | 20 (100.0%) | 8 (40.0%) |
| 25 to 29 Years | 0 (0.0%) | 0 (0.0%) |
| 30 to 34 Years | 0 (0.0%) | 0 (0.0%) |
| 35 to 44 Years | 0 (0.0%) | 0 (0.0%) |
| 45 to 54 Years | 0 (0.0%) | 0 (0.0%) |
| 55 to 59 Years | 5 (45.5%) | 0 (0.0%) |
| 60 to 64 Years | 0 (0.0%) | 0 (0.0%) |
| 65 to 74 Years | 9 (69.2%) | 0 (0.0%) |
| 75 Years and over | 0 (0.0%) | 0 (0.0%) |
| Total | 43 (58.1%) | 13 (30.2%) |
Employment Status by Educational Attainment in Miller s Cove
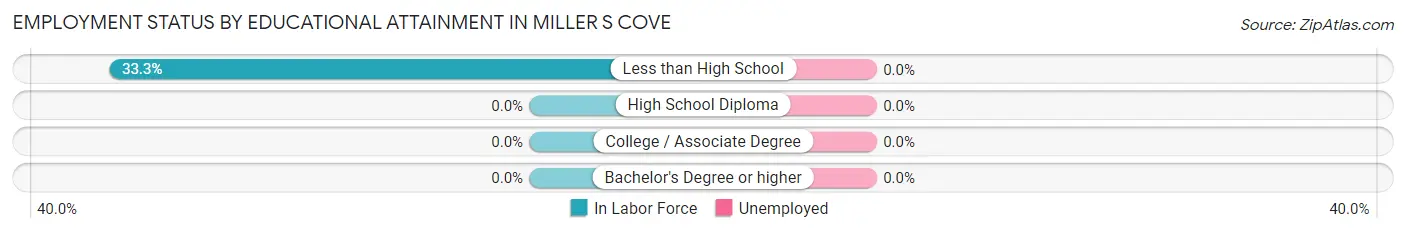
| Educational Attainment | In Labor Force | Unemployed |
| Less than High School | 5 (33.3%) | 0 (0.0%) |
| High School Diploma | 0 (0.0%) | 0 (0.0%) |
| College / Associate Degree | 0 (0.0%) | 0 (0.0%) |
| Bachelor's Degree or higher | 0 (0.0%) | 0 (0.0%) |
| Total | 5 (20.0%) | 0 (0.0%) |
Employment Occupations by Sex in Miller s Cove
Management, Business, Science and Arts Occupations
Management, Business, Science and Arts Occupations by Sex
| Occupation | Male | Female |
| Management | 0 (0.0%) | 0 (0.0%) |
| Business & Financial | 0 (0.0%) | 0 (0.0%) |
| Computers, Engineering & Science | 0 (0.0%) | 0 (0.0%) |
| Computers & Mathematics | 0 (0.0%) | 0 (0.0%) |
| Architecture & Engineering | 0 (0.0%) | 0 (0.0%) |
| Life, Physical & Social Science | 0 (0.0%) | 0 (0.0%) |
| Community & Social Service | 0 (0.0%) | 0 (0.0%) |
| Education, Arts & Media | 0 (0.0%) | 0 (0.0%) |
| Legal Services & Support | 0 (0.0%) | 0 (0.0%) |
| Education Instruction & Library | 0 (0.0%) | 0 (0.0%) |
| Arts, Media & Entertainment | 0 (0.0%) | 0 (0.0%) |
| Health Diagnosing & Treating | 0 (0.0%) | 0 (0.0%) |
| Health Technologists | 0 (0.0%) | 0 (0.0%) |
| Total (Category) | 0 (0.0%) | 0 (0.0%) |
| Total (Overall) | 25 (83.3%) | 5 (16.7%) |
Services Occupations
The most common Services occupations in Miller s Cove are Food Preparation & Serving (11 | 36.7%), and Healthcare Support (5 | 16.7%).
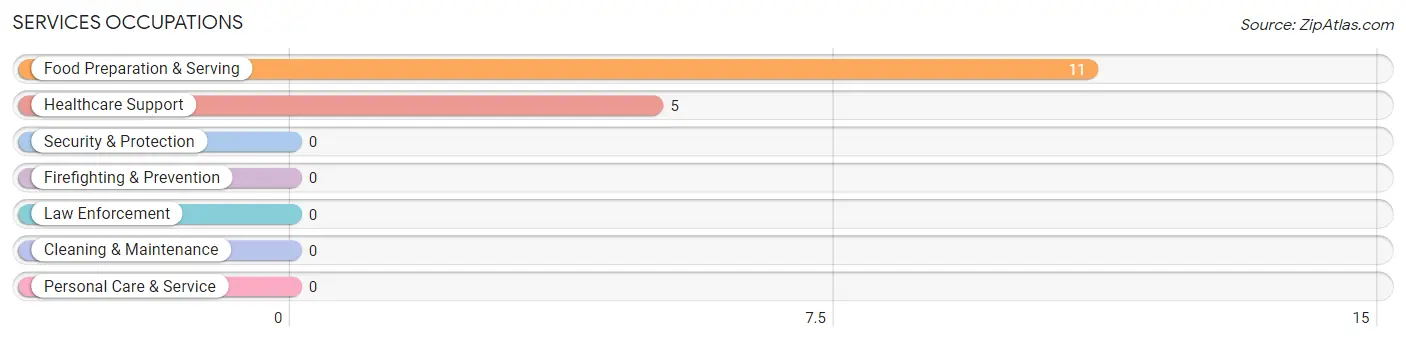
Services Occupations by Sex
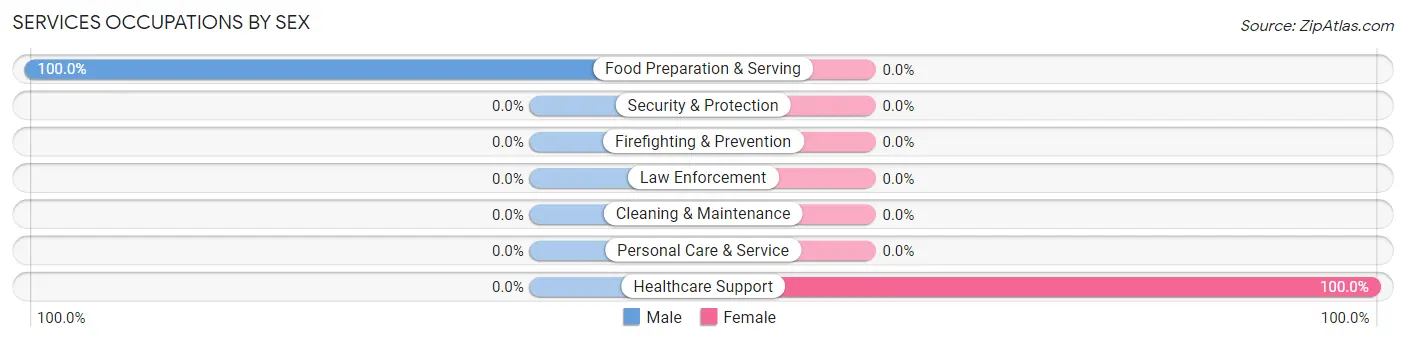
| Occupation | Male | Female |
| Healthcare Support | 0 (0.0%) | 5 (100.0%) |
| Security & Protection | 0 (0.0%) | 0 (0.0%) |
| Firefighting & Prevention | 0 (0.0%) | 0 (0.0%) |
| Law Enforcement | 0 (0.0%) | 0 (0.0%) |
| Food Preparation & Serving | 11 (100.0%) | 0 (0.0%) |
| Cleaning & Maintenance | 0 (0.0%) | 0 (0.0%) |
| Personal Care & Service | 0 (0.0%) | 0 (0.0%) |
| Total (Category) | 11 (68.8%) | 5 (31.2%) |
| Total (Overall) | 25 (83.3%) | 5 (16.7%) |
Sales and Office Occupations
Sales and Office Occupations by Sex
| Occupation | Male | Female |
| Sales & Related | 0 (0.0%) | 0 (0.0%) |
| Office & Administration | 0 (0.0%) | 0 (0.0%) |
| Total (Category) | 0 (0.0%) | 0 (0.0%) |
| Total (Overall) | 25 (83.3%) | 5 (16.7%) |
Natural Resources, Construction and Maintenance Occupations
The most common Natural Resources, Construction and Maintenance occupations in Miller s Cove are , and Construction & Extraction (9 | 30.0%).
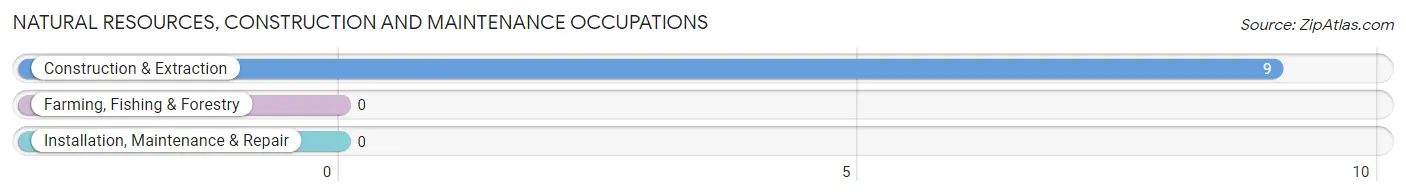
Natural Resources, Construction and Maintenance Occupations by Sex
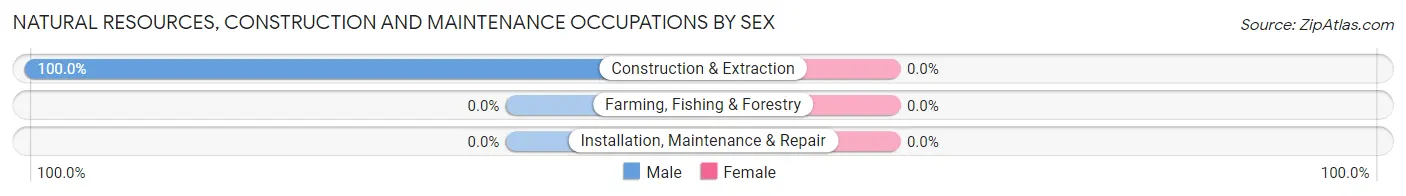
| Occupation | Male | Female |
| Farming, Fishing & Forestry | 0 (0.0%) | 0 (0.0%) |
| Construction & Extraction | 9 (100.0%) | 0 (0.0%) |
| Installation, Maintenance & Repair | 0 (0.0%) | 0 (0.0%) |
| Total (Category) | 9 (100.0%) | 0 (0.0%) |
| Total (Overall) | 25 (83.3%) | 5 (16.7%) |
Production, Transportation and Moving Occupations
The most common Production, Transportation and Moving occupations in Miller s Cove are , and Production (5 | 16.7%).
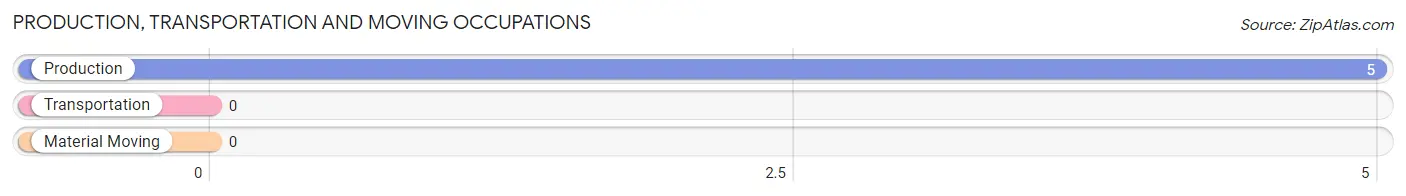
Production, Transportation and Moving Occupations by Sex
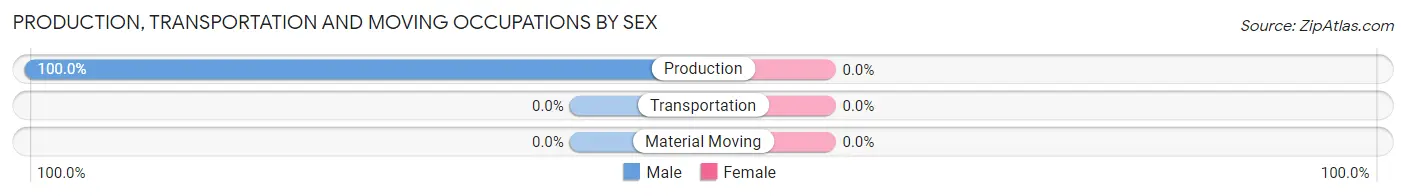
| Occupation | Male | Female |
| Production | 5 (100.0%) | 0 (0.0%) |
| Transportation | 0 (0.0%) | 0 (0.0%) |
| Material Moving | 0 (0.0%) | 0 (0.0%) |
| Total (Category) | 5 (100.0%) | 0 (0.0%) |
| Total (Overall) | 25 (83.3%) | 5 (16.7%) |
Employment Industries by Sex in Miller s Cove
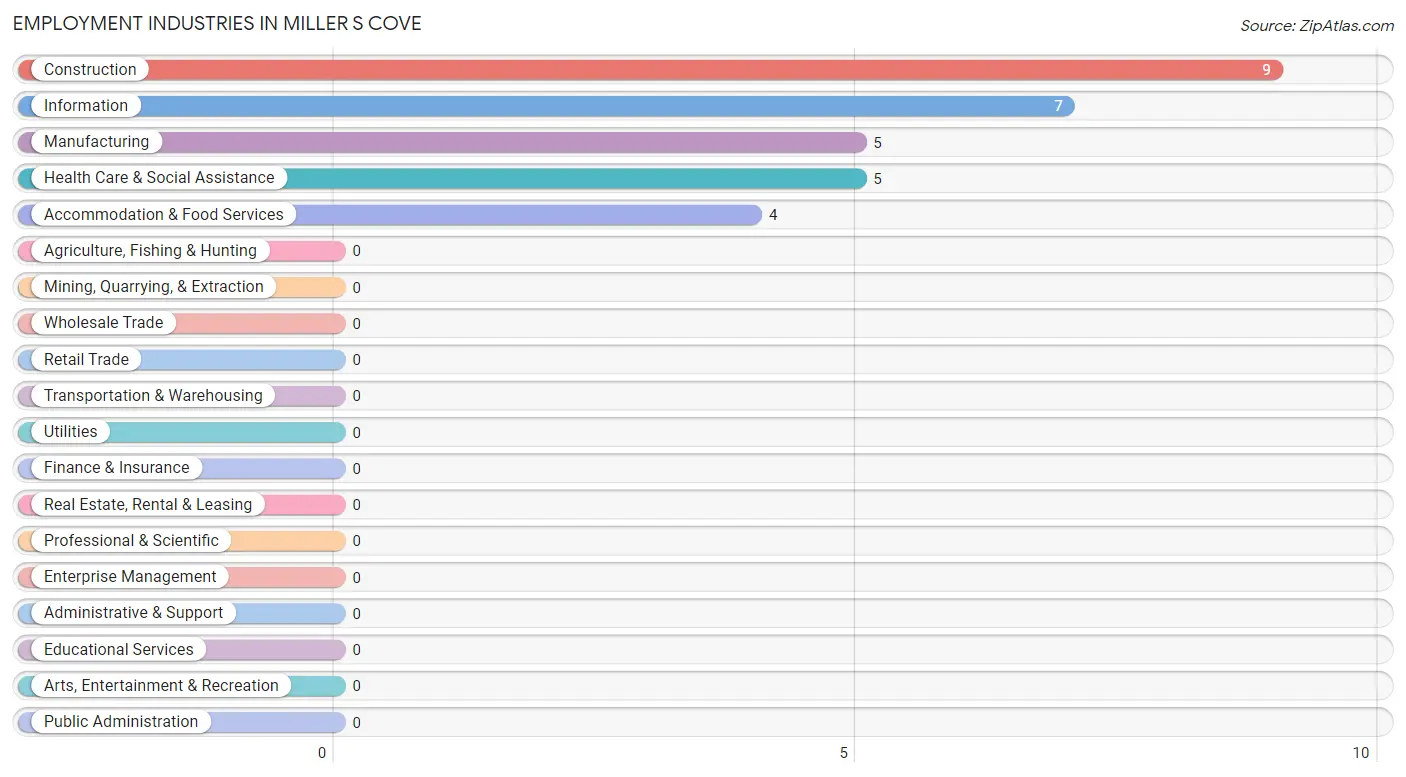
Employment Industries in Miller s Cove
The major employment industries in Miller s Cove include Construction (9 | 30.0%), Information (7 | 23.3%), Manufacturing (5 | 16.7%), Health Care & Social Assistance (5 | 16.7%), and Accommodation & Food Services (4 | 13.3%).
Employment Industries by Sex in Miller s Cove
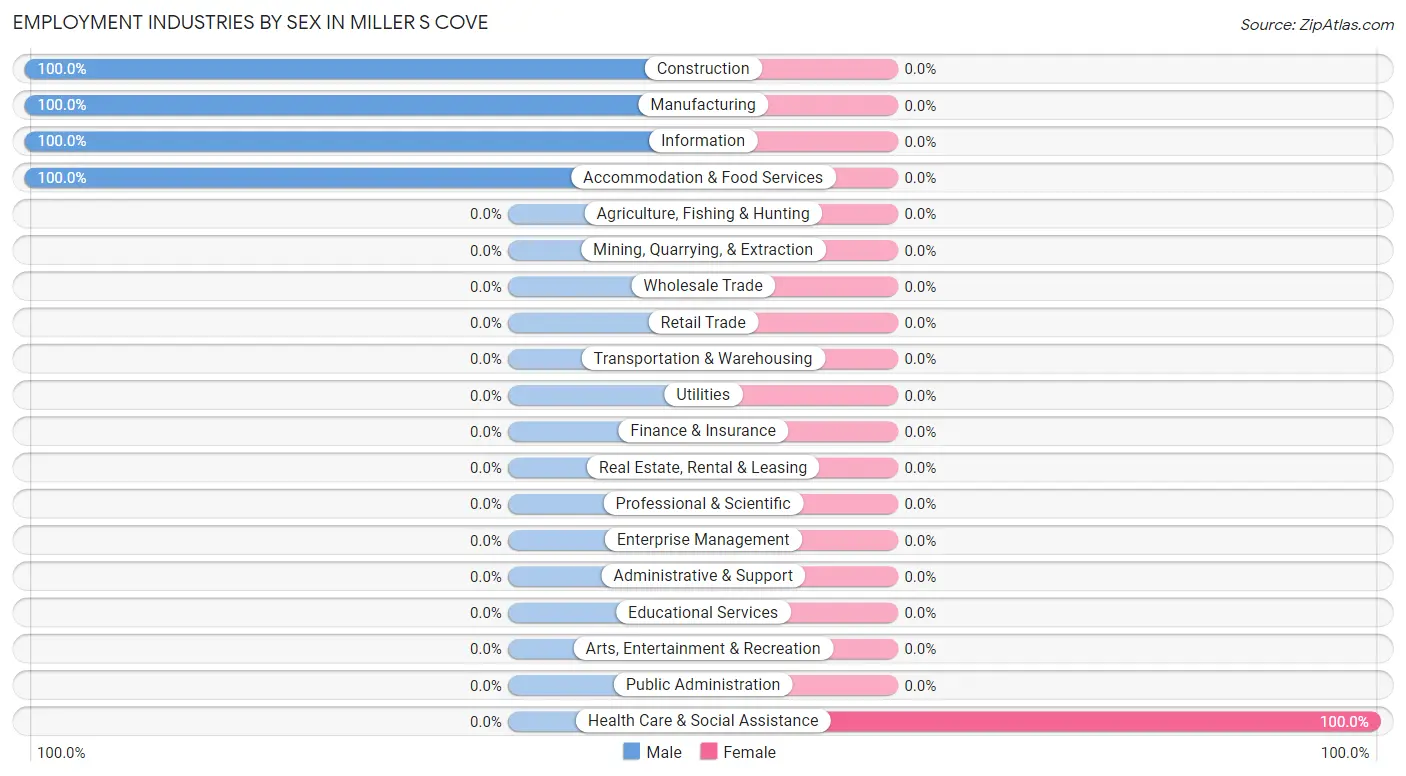
| Industry | Male | Female |
| Agriculture, Fishing & Hunting | 0 (0.0%) | 0 (0.0%) |
| Mining, Quarrying, & Extraction | 0 (0.0%) | 0 (0.0%) |
| Construction | 9 (100.0%) | 0 (0.0%) |
| Manufacturing | 5 (100.0%) | 0 (0.0%) |
| Wholesale Trade | 0 (0.0%) | 0 (0.0%) |
| Retail Trade | 0 (0.0%) | 0 (0.0%) |
| Transportation & Warehousing | 0 (0.0%) | 0 (0.0%) |
| Utilities | 0 (0.0%) | 0 (0.0%) |
| Information | 7 (100.0%) | 0 (0.0%) |
| Finance & Insurance | 0 (0.0%) | 0 (0.0%) |
| Real Estate, Rental & Leasing | 0 (0.0%) | 0 (0.0%) |
| Professional & Scientific | 0 (0.0%) | 0 (0.0%) |
| Enterprise Management | 0 (0.0%) | 0 (0.0%) |
| Administrative & Support | 0 (0.0%) | 0 (0.0%) |
| Educational Services | 0 (0.0%) | 0 (0.0%) |
| Health Care & Social Assistance | 0 (0.0%) | 5 (100.0%) |
| Arts, Entertainment & Recreation | 0 (0.0%) | 0 (0.0%) |
| Accommodation & Food Services | 4 (100.0%) | 0 (0.0%) |
| Public Administration | 0 (0.0%) | 0 (0.0%) |
| Total | 25 (83.3%) | 5 (16.7%) |
Education in Miller s Cove
School Enrollment in Miller s Cove
The most common levels of schooling among the 27 students in Miller s Cove are college / undergraduate (20 | 74.1%), and high school (7 | 25.9%).
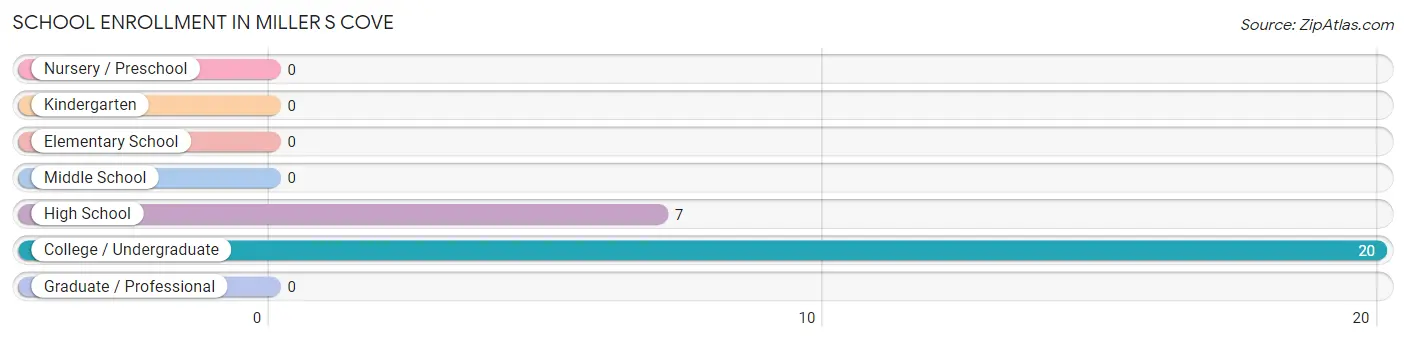
| School Level | # Students | % Students |
| Nursery / Preschool | 0 | 0.0% |
| Kindergarten | 0 | 0.0% |
| Elementary School | 0 | 0.0% |
| Middle School | 0 | 0.0% |
| High School | 7 | 25.9% |
| College / Undergraduate | 20 | 74.1% |
| Graduate / Professional | 0 | 0.0% |
| Total | 27 | 100.0% |
School Enrollment by Age by Funding Source in Miller s Cove
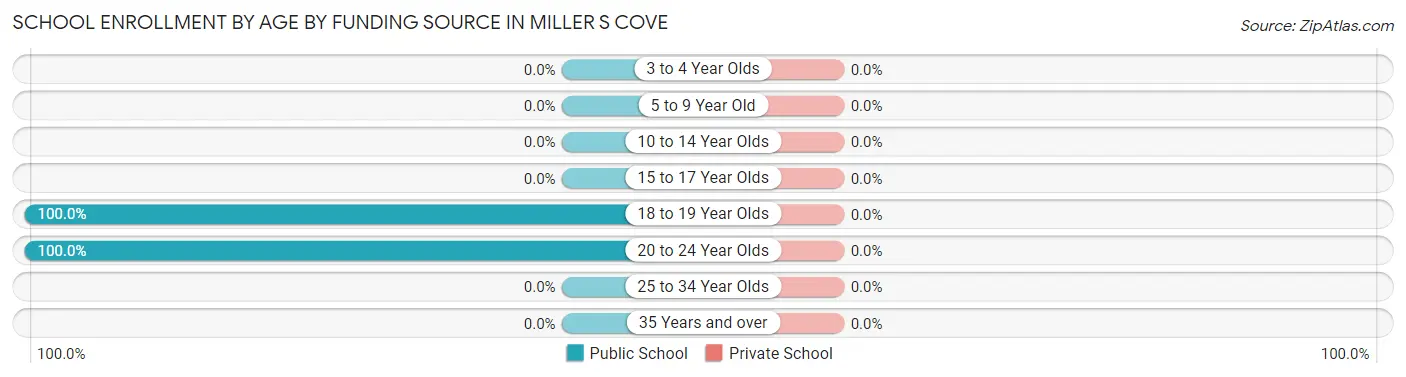
| Age Bracket | Public School | Private School |
| 3 to 4 Year Olds | 0 (0.0%) | 0 (0.0%) |
| 5 to 9 Year Old | 0 (0.0%) | 0 (0.0%) |
| 10 to 14 Year Olds | 0 (0.0%) | 0 (0.0%) |
| 15 to 17 Year Olds | 0 (0.0%) | 0 (0.0%) |
| 18 to 19 Year Olds | 12 (100.0%) | 0 (0.0%) |
| 20 to 24 Year Olds | 15 (100.0%) | 0 (0.0%) |
| 25 to 34 Year Olds | 0 (0.0%) | 0 (0.0%) |
| 35 Years and over | 0 (0.0%) | 0 (0.0%) |
| Total | 27 (100.0%) | 0 (0.0%) |
Educational Attainment by Field of Study in Miller s Cove
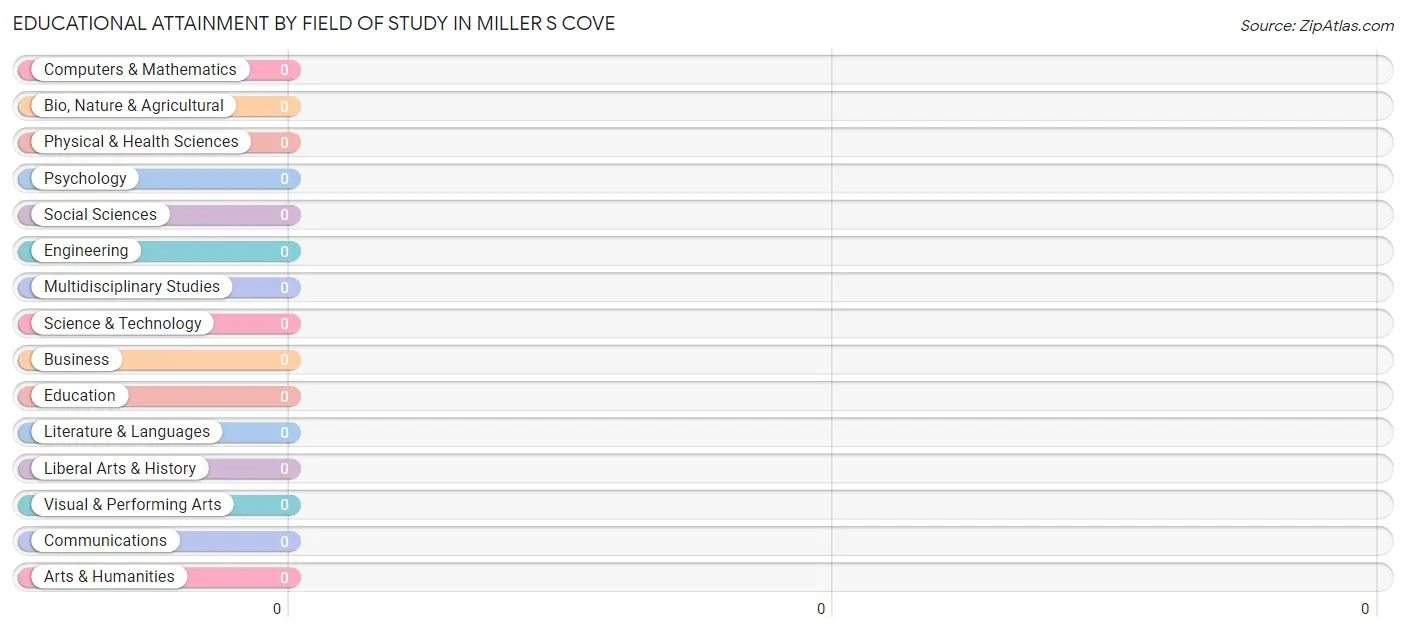
| Field of Study | # Graduates | % Graduates |
| Computers & Mathematics | 0 | 0.0% |
| Bio, Nature & Agricultural | 0 | 0.0% |
| Physical & Health Sciences | 0 | 0.0% |
| Psychology | 0 | 0.0% |
| Social Sciences | 0 | 0.0% |
| Engineering | 0 | 0.0% |
| Multidisciplinary Studies | 0 | 0.0% |
| Science & Technology | 0 | 0.0% |
| Business | 0 | 0.0% |
| Education | 0 | 0.0% |
| Literature & Languages | 0 | 0.0% |
| Liberal Arts & History | 0 | 0.0% |
| Visual & Performing Arts | 0 | 0.0% |
| Communications | 0 | 0.0% |
| Arts & Humanities | 0 | 0.0% |
| Total | 0 | 0.0% |
Transportation & Commute in Miller s Cove
Vehicle Availability by Sex in Miller s Cove
The most prevalent vehicle ownership categories in Miller s Cove are males with 2 vehicles (12, accounting for 48.0%) and females with 2 vehicles (0, making up 240.0%).
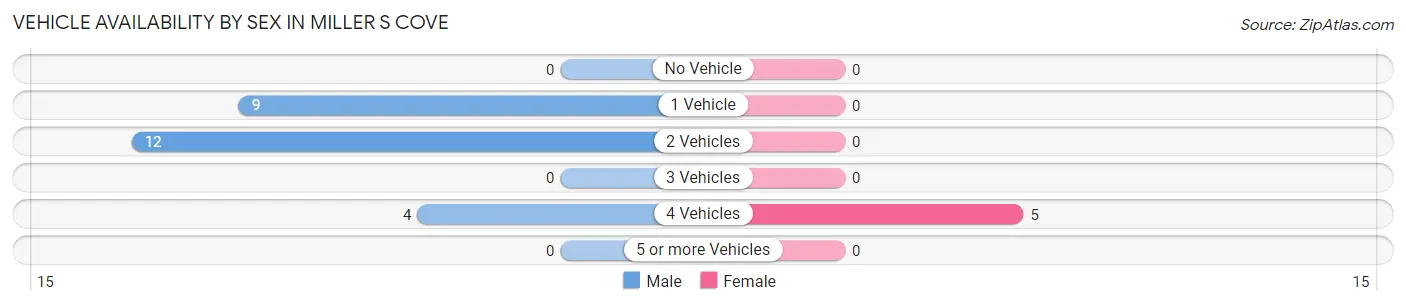
| Vehicles Available | Male | Female |
| No Vehicle | 0 (0.0%) | 0 (0.0%) |
| 1 Vehicle | 9 (36.0%) | 0 (0.0%) |
| 2 Vehicles | 12 (48.0%) | 0 (0.0%) |
| 3 Vehicles | 0 (0.0%) | 0 (0.0%) |
| 4 Vehicles | 4 (16.0%) | 5 (100.0%) |
| 5 or more Vehicles | 0 (0.0%) | 0 (0.0%) |
| Total | 25 (100.0%) | 5 (100.0%) |
Commute Time in Miller s Cove
The most frequently occuring commute durations in Miller s Cove are 15 to 19 minutes (17 commuters, 56.7%), 30 to 34 minutes (9 commuters, 30.0%), and 20 to 24 minutes (4 commuters, 13.3%).
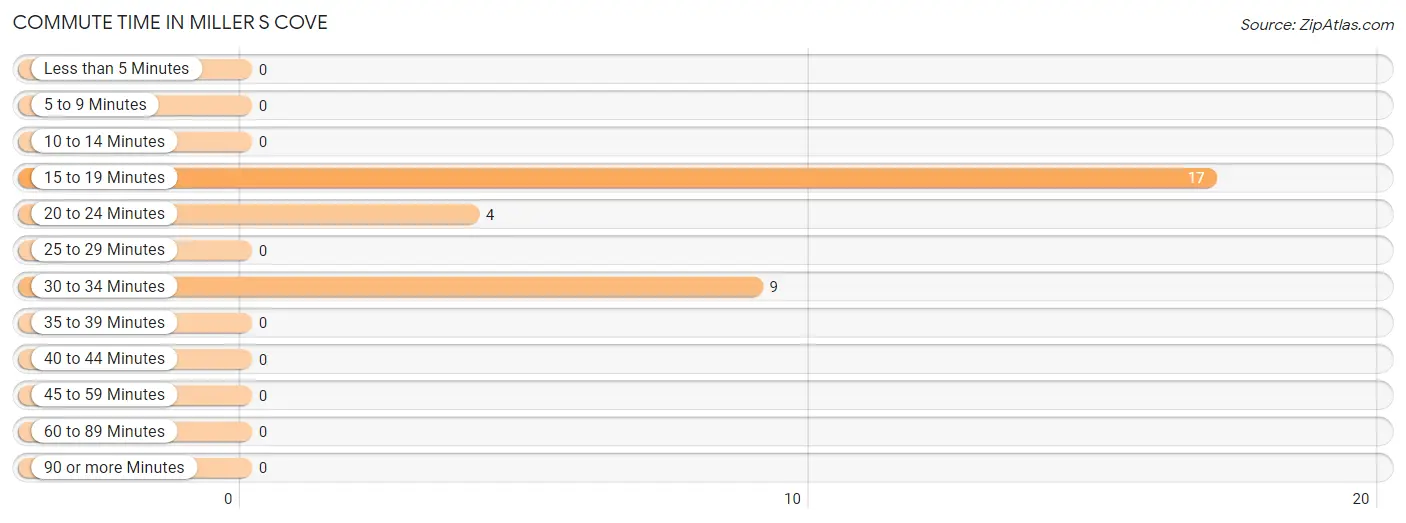
| Commute Time | # Commuters | % Commuters |
| Less than 5 Minutes | 0 | 0.0% |
| 5 to 9 Minutes | 0 | 0.0% |
| 10 to 14 Minutes | 0 | 0.0% |
| 15 to 19 Minutes | 17 | 56.7% |
| 20 to 24 Minutes | 4 | 13.3% |
| 25 to 29 Minutes | 0 | 0.0% |
| 30 to 34 Minutes | 9 | 30.0% |
| 35 to 39 Minutes | 0 | 0.0% |
| 40 to 44 Minutes | 0 | 0.0% |
| 45 to 59 Minutes | 0 | 0.0% |
| 60 to 89 Minutes | 0 | 0.0% |
| 90 or more Minutes | 0 | 0.0% |
Commute Time by Sex in Miller s Cove
The most common commute times in Miller s Cove are 15 to 19 minutes (12 commuters, 48.0%) for males and 15 to 19 minutes (5 commuters, 100.0%) for females.
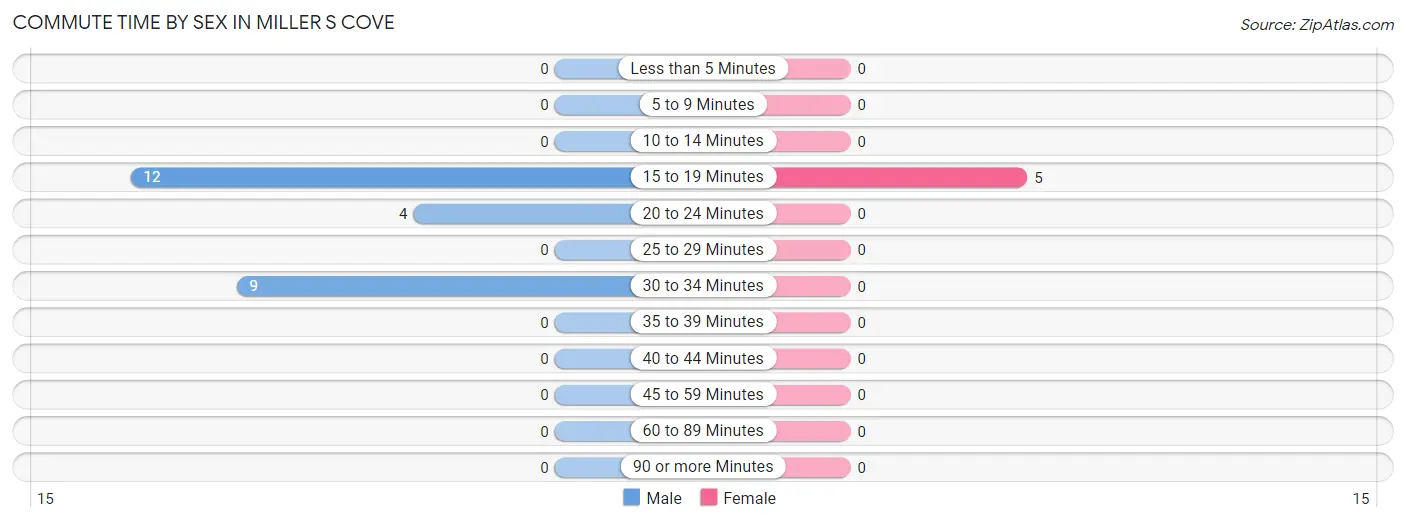
| Commute Time | Male | Female |
| Less than 5 Minutes | 0 (0.0%) | 0 (0.0%) |
| 5 to 9 Minutes | 0 (0.0%) | 0 (0.0%) |
| 10 to 14 Minutes | 0 (0.0%) | 0 (0.0%) |
| 15 to 19 Minutes | 12 (48.0%) | 5 (100.0%) |
| 20 to 24 Minutes | 4 (16.0%) | 0 (0.0%) |
| 25 to 29 Minutes | 0 (0.0%) | 0 (0.0%) |
| 30 to 34 Minutes | 9 (36.0%) | 0 (0.0%) |
| 35 to 39 Minutes | 0 (0.0%) | 0 (0.0%) |
| 40 to 44 Minutes | 0 (0.0%) | 0 (0.0%) |
| 45 to 59 Minutes | 0 (0.0%) | 0 (0.0%) |
| 60 to 89 Minutes | 0 (0.0%) | 0 (0.0%) |
| 90 or more Minutes | 0 (0.0%) | 0 (0.0%) |
Time of Departure to Work by Sex in Miller s Cove
The most frequent times of departure to work in Miller s Cove are 6:30 AM to 6:59 AM (14, 56.0%) for males and 4:00 PM to 11:59 PM (5, 100.0%) for females.
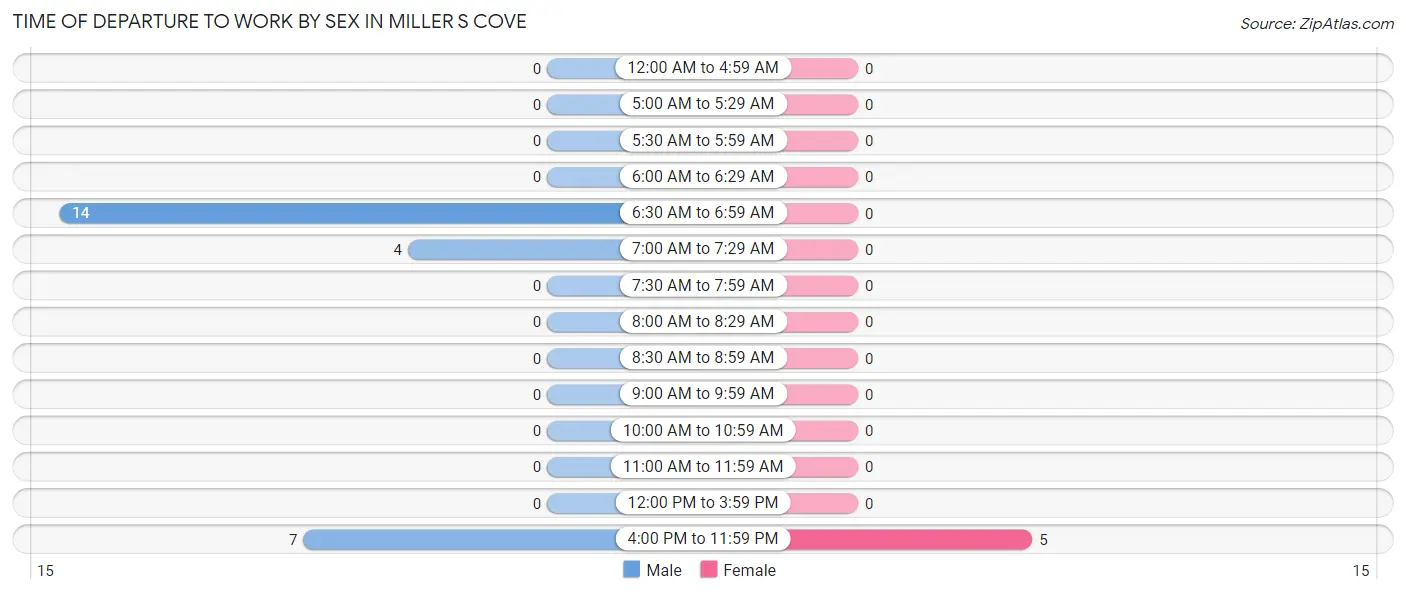
| Time of Departure | Male | Female |
| 12:00 AM to 4:59 AM | 0 (0.0%) | 0 (0.0%) |
| 5:00 AM to 5:29 AM | 0 (0.0%) | 0 (0.0%) |
| 5:30 AM to 5:59 AM | 0 (0.0%) | 0 (0.0%) |
| 6:00 AM to 6:29 AM | 0 (0.0%) | 0 (0.0%) |
| 6:30 AM to 6:59 AM | 14 (56.0%) | 0 (0.0%) |
| 7:00 AM to 7:29 AM | 4 (16.0%) | 0 (0.0%) |
| 7:30 AM to 7:59 AM | 0 (0.0%) | 0 (0.0%) |
| 8:00 AM to 8:29 AM | 0 (0.0%) | 0 (0.0%) |
| 8:30 AM to 8:59 AM | 0 (0.0%) | 0 (0.0%) |
| 9:00 AM to 9:59 AM | 0 (0.0%) | 0 (0.0%) |
| 10:00 AM to 10:59 AM | 0 (0.0%) | 0 (0.0%) |
| 11:00 AM to 11:59 AM | 0 (0.0%) | 0 (0.0%) |
| 12:00 PM to 3:59 PM | 0 (0.0%) | 0 (0.0%) |
| 4:00 PM to 11:59 PM | 7 (28.0%) | 5 (100.0%) |
| Total | 25 (100.0%) | 5 (100.0%) |
Housing Occupancy in Miller s Cove
Occupancy by Ownership in Miller s Cove
Of the total 23 dwellings in Miller s Cove, owner-occupied units account for 19 (82.6%), while renter-occupied units make up 4 (17.4%).
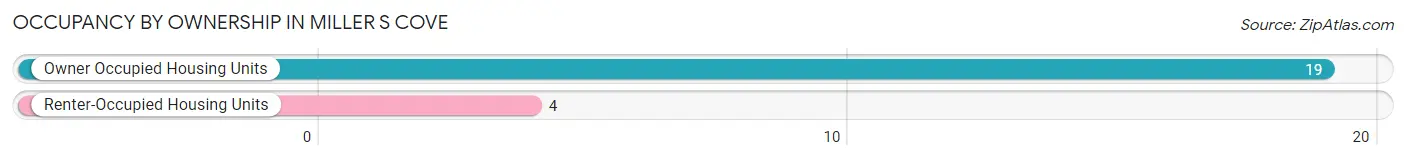
| Occupancy | # Housing Units | % Housing Units |
| Owner Occupied Housing Units | 19 | 82.6% |
| Renter-Occupied Housing Units | 4 | 17.4% |
| Total Occupied Housing Units | 23 | 100.0% |
Occupancy by Household Size in Miller s Cove
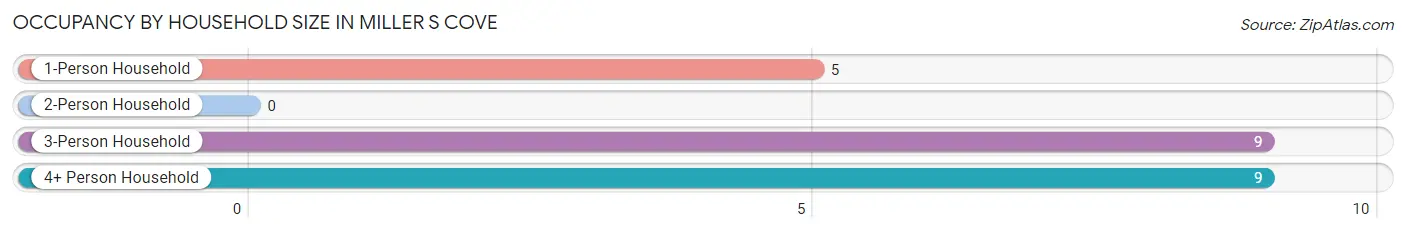
| Household Size | # Housing Units | % Housing Units |
| 1-Person Household | 5 | 21.7% |
| 2-Person Household | 0 | 0.0% |
| 3-Person Household | 9 | 39.1% |
| 4+ Person Household | 9 | 39.1% |
| Total Housing Units | 23 | 100.0% |
Occupancy by Ownership by Household Size in Miller s Cove
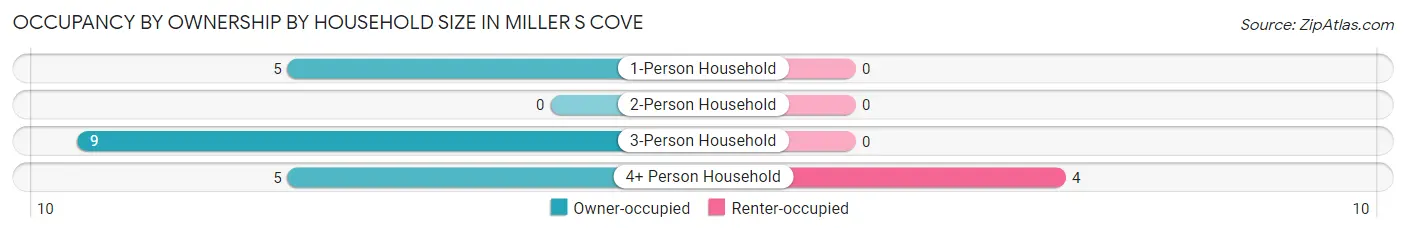
| Household Size | Owner-occupied | Renter-occupied |
| 1-Person Household | 5 (100.0%) | 0 (0.0%) |
| 2-Person Household | 0 (0.0%) | 0 (0.0%) |
| 3-Person Household | 9 (100.0%) | 0 (0.0%) |
| 4+ Person Household | 5 (55.6%) | 4 (44.4%) |
| Total Housing Units | 19 (82.6%) | 4 (17.4%) |
Occupancy by Educational Attainment in Miller s Cove
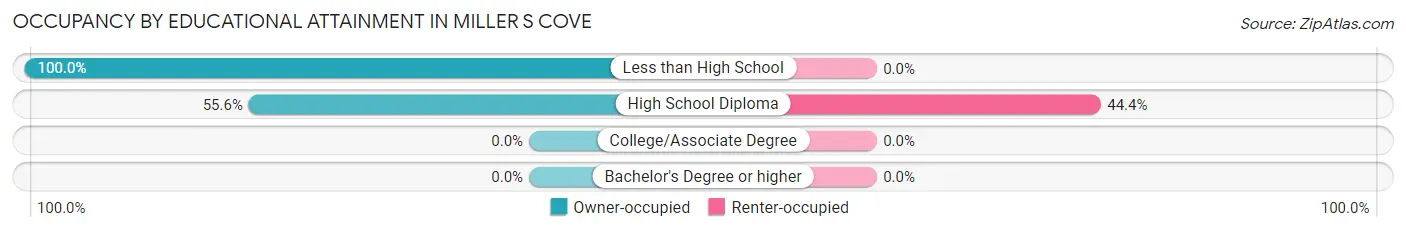
| Household Size | Owner-occupied | Renter-occupied |
| Less than High School | 14 (100.0%) | 0 (0.0%) |
| High School Diploma | 5 (55.6%) | 4 (44.4%) |
| College/Associate Degree | 0 (0.0%) | 0 (0.0%) |
| Bachelor's Degree or higher | 0 (0.0%) | 0 (0.0%) |
Occupancy by Age of Householder in Miller s Cove
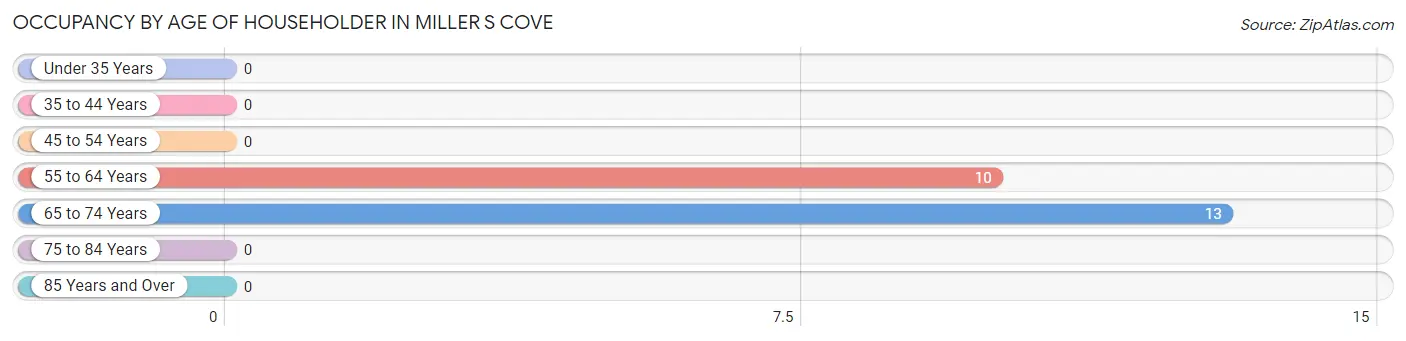
| Age Bracket | # Households | % Households |
| Under 35 Years | 0 | 0.0% |
| 35 to 44 Years | 0 | 0.0% |
| 45 to 54 Years | 0 | 0.0% |
| 55 to 64 Years | 10 | 43.5% |
| 65 to 74 Years | 13 | 56.5% |
| 75 to 84 Years | 0 | 0.0% |
| 85 Years and Over | 0 | 0.0% |
| Total | 23 | 100.0% |
Housing Finances in Miller s Cove
Median Income by Occupancy in Miller s Cove
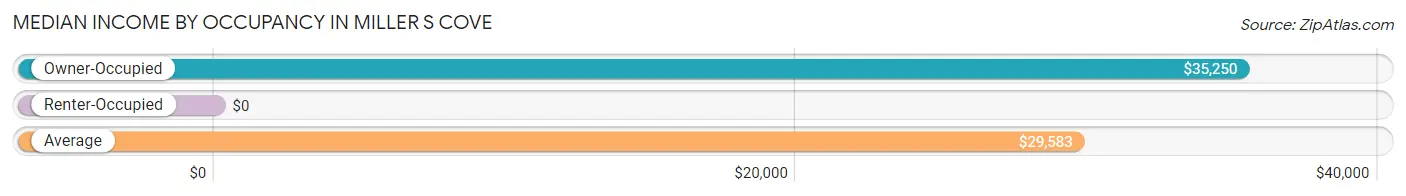
| Occupancy Type | # Households | Median Income |
| Owner-Occupied | 19 (82.6%) | $35,250 |
| Renter-Occupied | 4 (17.4%) | $0 |
| Average | 23 (100.0%) | $29,583 |
Occupancy by Householder Income Bracket in Miller s Cove
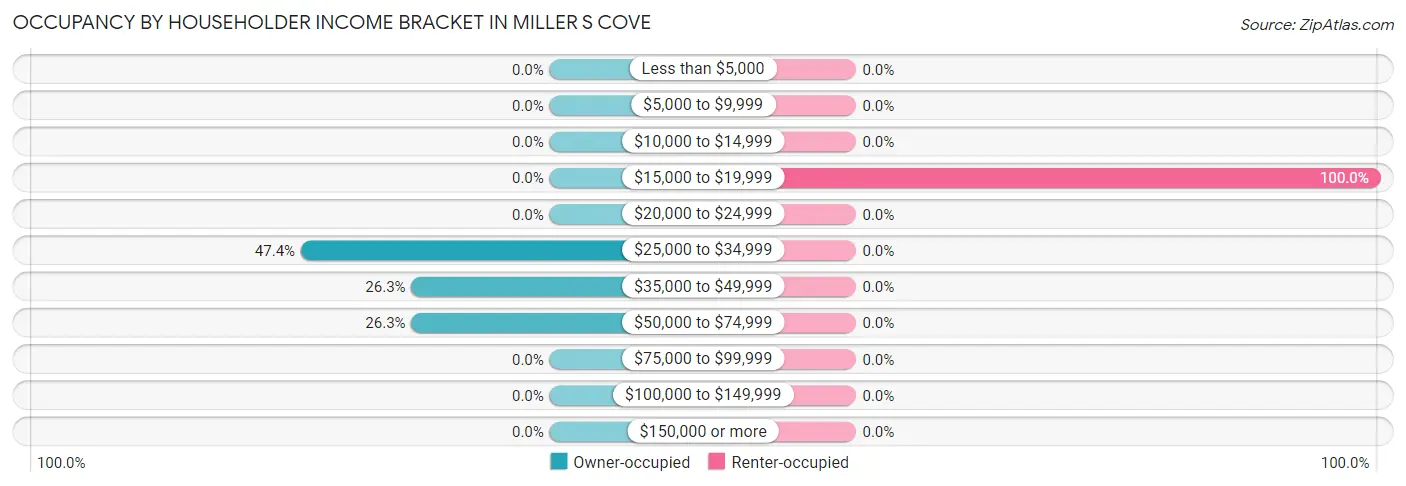
| Income Bracket | Owner-occupied | Renter-occupied |
| Less than $5,000 | 0 (0.0%) | 0 (0.0%) |
| $5,000 to $9,999 | 0 (0.0%) | 0 (0.0%) |
| $10,000 to $14,999 | 0 (0.0%) | 0 (0.0%) |
| $15,000 to $19,999 | 0 (0.0%) | 4 (100.0%) |
| $20,000 to $24,999 | 0 (0.0%) | 0 (0.0%) |
| $25,000 to $34,999 | 9 (47.4%) | 0 (0.0%) |
| $35,000 to $49,999 | 5 (26.3%) | 0 (0.0%) |
| $50,000 to $74,999 | 5 (26.3%) | 0 (0.0%) |
| $75,000 to $99,999 | 0 (0.0%) | 0 (0.0%) |
| $100,000 to $149,999 | 0 (0.0%) | 0 (0.0%) |
| $150,000 or more | 0 (0.0%) | 0 (0.0%) |
| Total | 19 (100.0%) | 4 (100.0%) |
Monthly Housing Cost Tiers in Miller s Cove
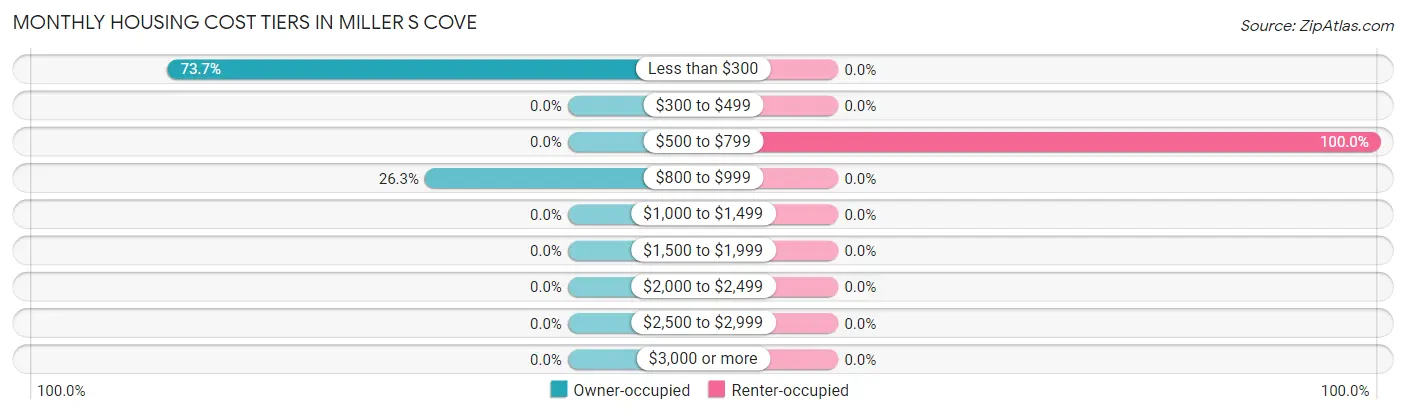
| Monthly Cost | Owner-occupied | Renter-occupied |
| Less than $300 | 14 (73.7%) | 0 (0.0%) |
| $300 to $499 | 0 (0.0%) | 0 (0.0%) |
| $500 to $799 | 0 (0.0%) | 4 (100.0%) |
| $800 to $999 | 5 (26.3%) | 0 (0.0%) |
| $1,000 to $1,499 | 0 (0.0%) | 0 (0.0%) |
| $1,500 to $1,999 | 0 (0.0%) | 0 (0.0%) |
| $2,000 to $2,499 | 0 (0.0%) | 0 (0.0%) |
| $2,500 to $2,999 | 0 (0.0%) | 0 (0.0%) |
| $3,000 or more | 0 (0.0%) | 0 (0.0%) |
| Total | 19 (100.0%) | 4 (100.0%) |
Physical Housing Characteristics in Miller s Cove
Housing Structures in Miller s Cove
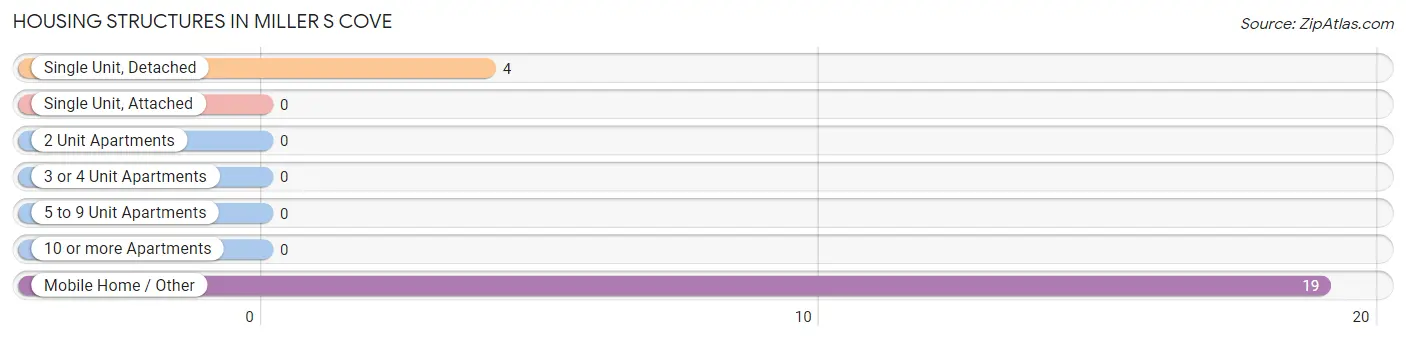
| Structure Type | # Housing Units | % Housing Units |
| Single Unit, Detached | 4 | 17.4% |
| Single Unit, Attached | 0 | 0.0% |
| 2 Unit Apartments | 0 | 0.0% |
| 3 or 4 Unit Apartments | 0 | 0.0% |
| 5 to 9 Unit Apartments | 0 | 0.0% |
| 10 or more Apartments | 0 | 0.0% |
| Mobile Home / Other | 19 | 82.6% |
| Total | 23 | 100.0% |
Housing Structures by Occupancy in Miller s Cove
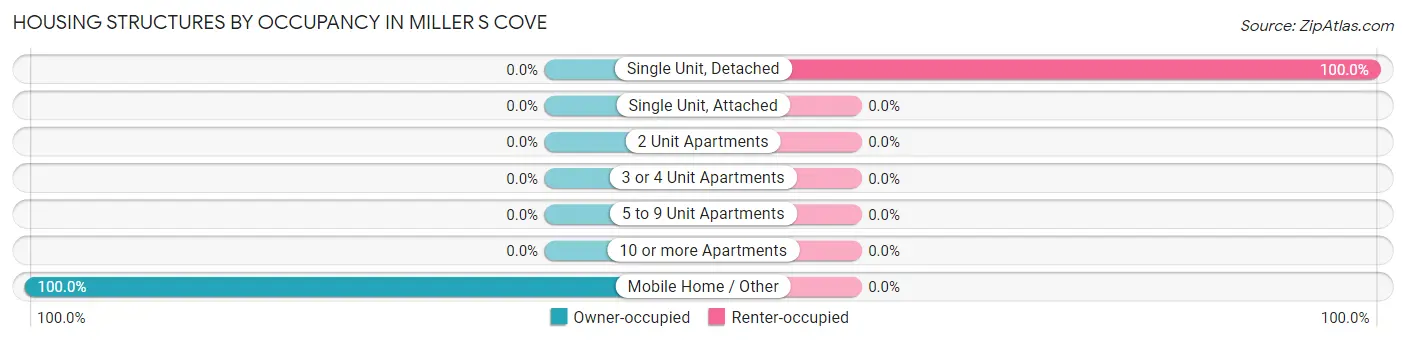
| Structure Type | Owner-occupied | Renter-occupied |
| Single Unit, Detached | 0 (0.0%) | 4 (100.0%) |
| Single Unit, Attached | 0 (0.0%) | 0 (0.0%) |
| 2 Unit Apartments | 0 (0.0%) | 0 (0.0%) |
| 3 or 4 Unit Apartments | 0 (0.0%) | 0 (0.0%) |
| 5 to 9 Unit Apartments | 0 (0.0%) | 0 (0.0%) |
| 10 or more Apartments | 0 (0.0%) | 0 (0.0%) |
| Mobile Home / Other | 19 (100.0%) | 0 (0.0%) |
| Total | 19 (82.6%) | 4 (17.4%) |
Housing Structures by Number of Rooms in Miller s Cove
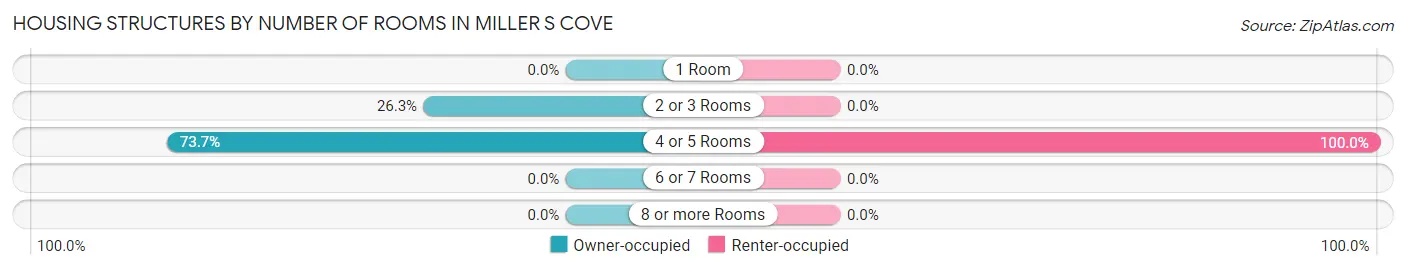
| Number of Rooms | Owner-occupied | Renter-occupied |
| 1 Room | 0 (0.0%) | 0 (0.0%) |
| 2 or 3 Rooms | 5 (26.3%) | 0 (0.0%) |
| 4 or 5 Rooms | 14 (73.7%) | 4 (100.0%) |
| 6 or 7 Rooms | 0 (0.0%) | 0 (0.0%) |
| 8 or more Rooms | 0 (0.0%) | 0 (0.0%) |
| Total | 19 (100.0%) | 4 (100.0%) |
Housing Structure by Heating Type in Miller s Cove
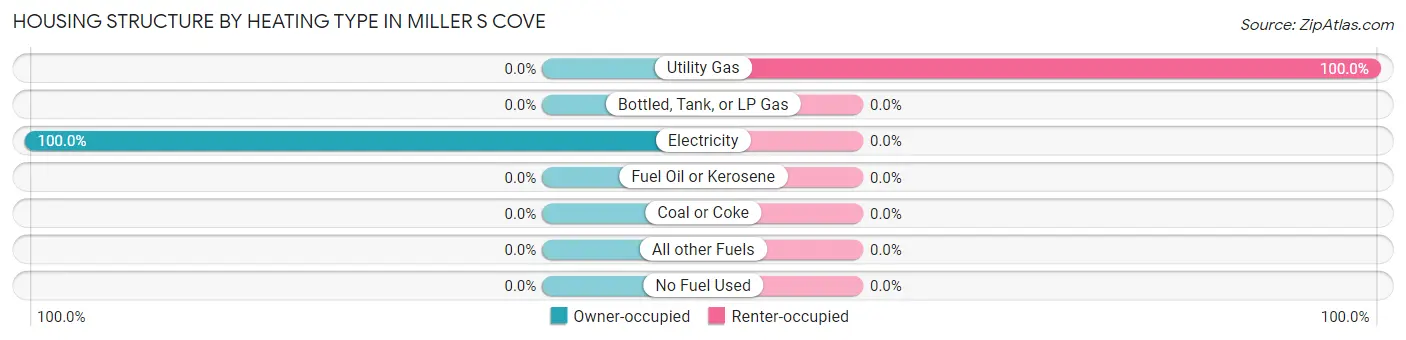
| Heating Type | Owner-occupied | Renter-occupied |
| Utility Gas | 0 (0.0%) | 4 (100.0%) |
| Bottled, Tank, or LP Gas | 0 (0.0%) | 0 (0.0%) |
| Electricity | 19 (100.0%) | 0 (0.0%) |
| Fuel Oil or Kerosene | 0 (0.0%) | 0 (0.0%) |
| Coal or Coke | 0 (0.0%) | 0 (0.0%) |
| All other Fuels | 0 (0.0%) | 0 (0.0%) |
| No Fuel Used | 0 (0.0%) | 0 (0.0%) |
| Total | 19 (100.0%) | 4 (100.0%) |
Household Vehicle Usage in Miller s Cove
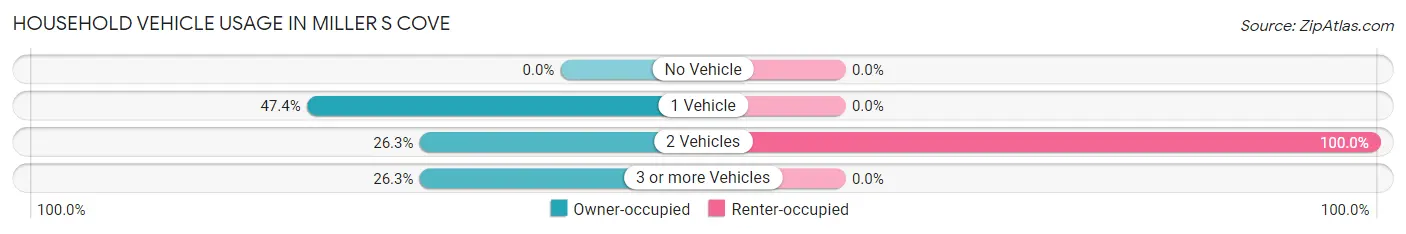
| Vehicles per Household | Owner-occupied | Renter-occupied |
| No Vehicle | 0 (0.0%) | 0 (0.0%) |
| 1 Vehicle | 9 (47.4%) | 0 (0.0%) |
| 2 Vehicles | 5 (26.3%) | 4 (100.0%) |
| 3 or more Vehicles | 5 (26.3%) | 0 (0.0%) |
| Total | 19 (100.0%) | 4 (100.0%) |
Real Estate & Mortgages in Miller s Cove
Real Estate and Mortgage Overview in Miller s Cove
| Characteristic | Without Mortgage | With Mortgage |
| Housing Units | 19 | 0 |
| Median Property Value | - | - |
| Median Household Income | $35,250 | $0 |
| Monthly Housing Costs | - | - |
| Real Estate Taxes | - | - |
Property Value by Mortgage Status in Miller s Cove
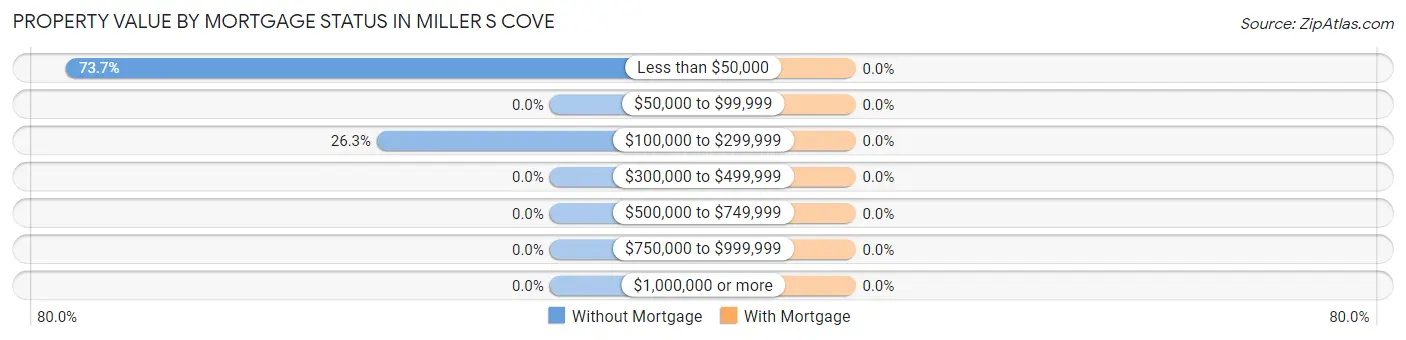
| Property Value | Without Mortgage | With Mortgage |
| Less than $50,000 | 14 (73.7%) | 0 (0.0%) |
| $50,000 to $99,999 | 0 (0.0%) | 0 (0.0%) |
| $100,000 to $299,999 | 5 (26.3%) | 0 (0.0%) |
| $300,000 to $499,999 | 0 (0.0%) | 0 (0.0%) |
| $500,000 to $749,999 | 0 (0.0%) | 0 (0.0%) |
| $750,000 to $999,999 | 0 (0.0%) | 0 (0.0%) |
| $1,000,000 or more | 0 (0.0%) | 0 (0.0%) |
| Total | 19 (100.0%) | 0 (0.0%) |
Household Income by Mortgage Status in Miller s Cove
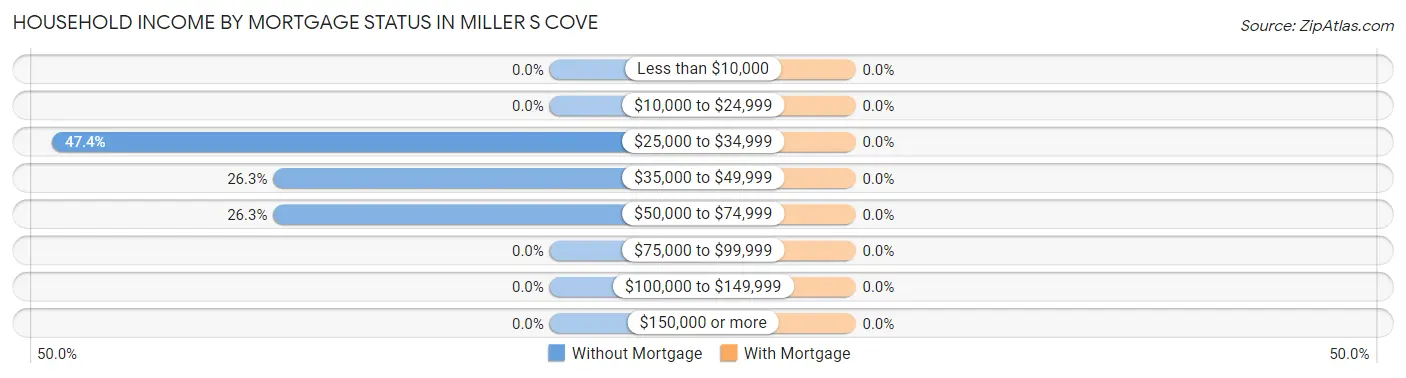
| Household Income | Without Mortgage | With Mortgage |
| Less than $10,000 | 0 (0.0%) | 0 (0.0%) |
| $10,000 to $24,999 | 0 (0.0%) | 0 (0.0%) |
| $25,000 to $34,999 | 9 (47.4%) | 0 (0.0%) |
| $35,000 to $49,999 | 5 (26.3%) | 0 (0.0%) |
| $50,000 to $74,999 | 5 (26.3%) | 0 (0.0%) |
| $75,000 to $99,999 | 0 (0.0%) | 0 (0.0%) |
| $100,000 to $149,999 | 0 (0.0%) | 0 (0.0%) |
| $150,000 or more | 0 (0.0%) | 0 (0.0%) |
| Total | 19 (100.0%) | 0 (0.0%) |
Property Value to Household Income Ratio in Miller s Cove
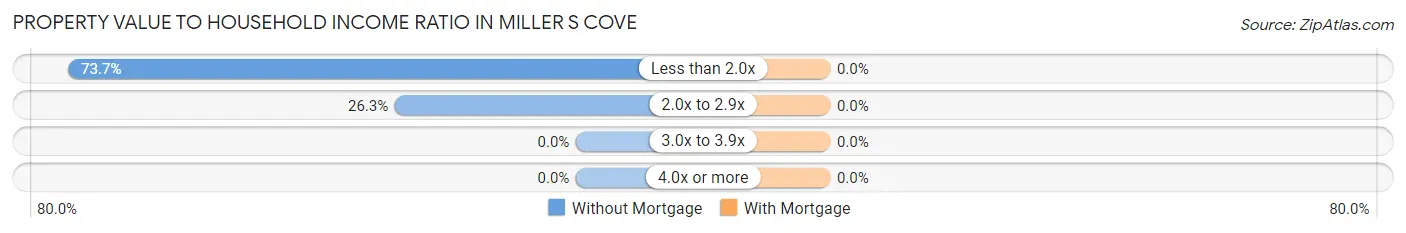
| Value-to-Income Ratio | Without Mortgage | With Mortgage |
| Less than 2.0x | 14 (73.7%) | 0 (0.0%) |
| 2.0x to 2.9x | 5 (26.3%) | 0 (0.0%) |
| 3.0x to 3.9x | 0 (0.0%) | 0 (0.0%) |
| 4.0x or more | 0 (0.0%) | 0 (0.0%) |
| Total | 19 (100.0%) | 0 (0.0%) |
Real Estate Taxes by Mortgage Status in Miller s Cove
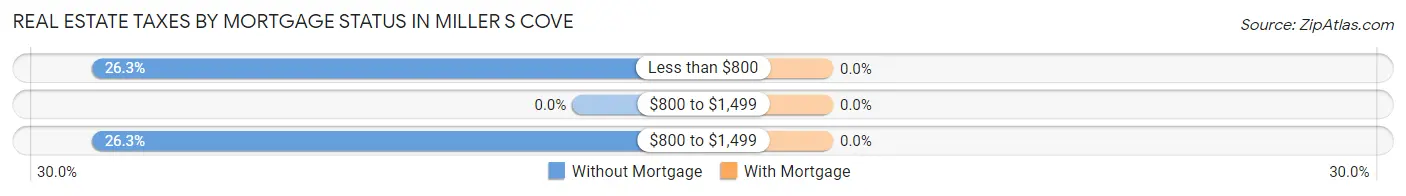
| Property Taxes | Without Mortgage | With Mortgage |
| Less than $800 | 5 (26.3%) | 0 (0.0%) |
| $800 to $1,499 | 0 (0.0%) | 0 (0.0%) |
| $800 to $1,499 | 5 (26.3%) | 0 (0.0%) |
| Total | 19 (100.0%) | 0 (0.0%) |
Health & Disability in Miller s Cove
Health Insurance Coverage by Age in Miller s Cove
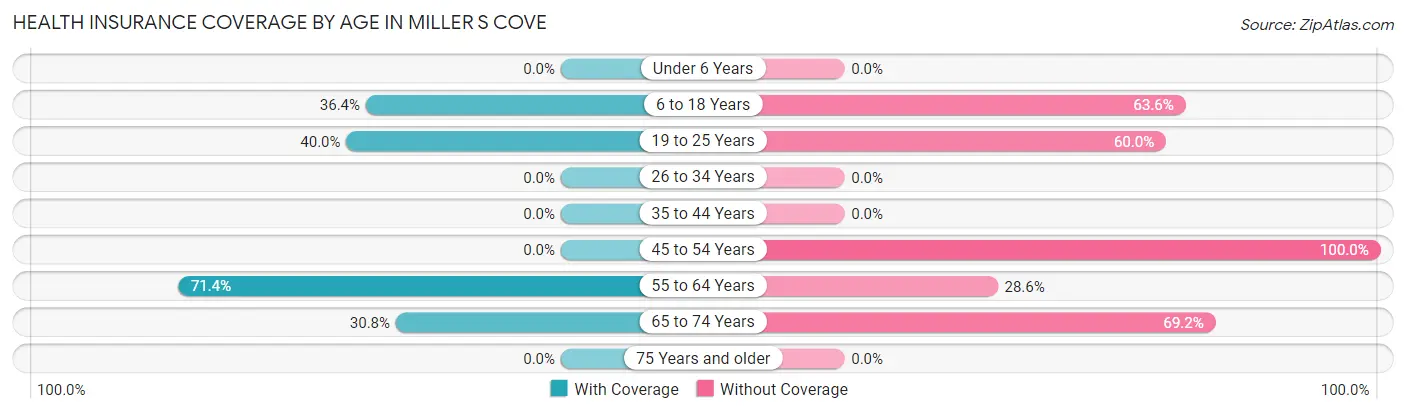
| Age Bracket | With Coverage | Without Coverage |
| Under 6 Years | 0 (0.0%) | 0 (0.0%) |
| 6 to 18 Years | 4 (36.4%) | 7 (63.6%) |
| 19 to 25 Years | 10 (40.0%) | 15 (60.0%) |
| 26 to 34 Years | 0 (0.0%) | 0 (0.0%) |
| 35 to 44 Years | 0 (0.0%) | 0 (0.0%) |
| 45 to 54 Years | 0 (0.0%) | 4 (100.0%) |
| 55 to 64 Years | 15 (71.4%) | 6 (28.6%) |
| 65 to 74 Years | 4 (30.8%) | 9 (69.2%) |
| 75 Years and older | 0 (0.0%) | 0 (0.0%) |
| Total | 33 (44.6%) | 41 (55.4%) |
Health Insurance Coverage by Citizenship Status in Miller s Cove
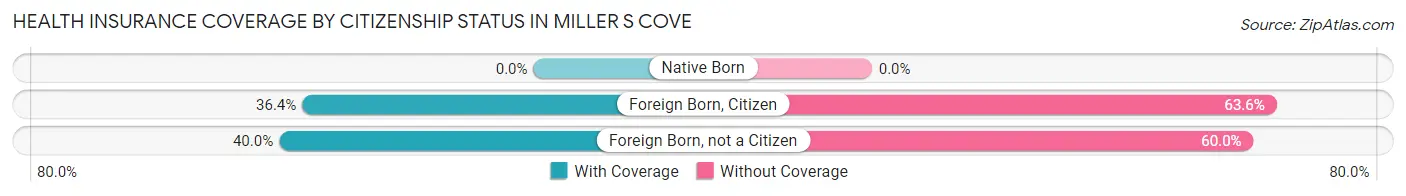
| Citizenship Status | With Coverage | Without Coverage |
| Native Born | 0 (0.0%) | 0 (0.0%) |
| Foreign Born, Citizen | 4 (36.4%) | 7 (63.6%) |
| Foreign Born, not a Citizen | 10 (40.0%) | 15 (60.0%) |
Health Insurance Coverage by Household Income in Miller s Cove
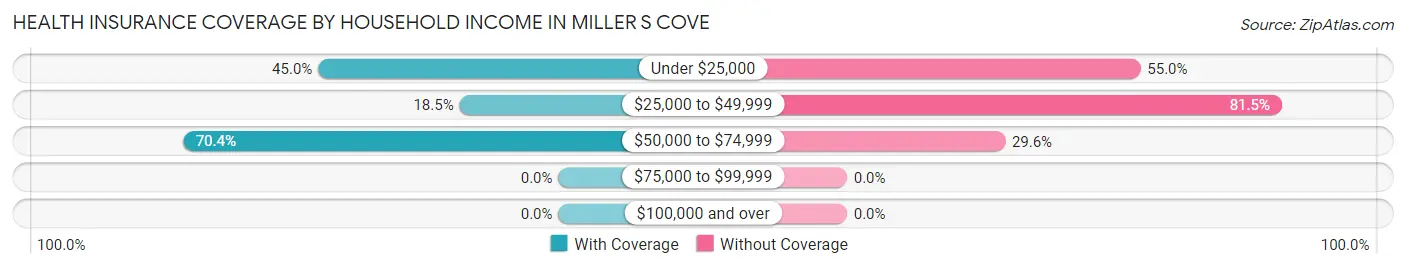
| Household Income | With Coverage | Without Coverage |
| Under $25,000 | 9 (45.0%) | 11 (55.0%) |
| $25,000 to $49,999 | 5 (18.5%) | 22 (81.5%) |
| $50,000 to $74,999 | 19 (70.4%) | 8 (29.6%) |
| $75,000 to $99,999 | 0 (0.0%) | 0 (0.0%) |
| $100,000 and over | 0 (0.0%) | 0 (0.0%) |
Public vs Private Health Insurance Coverage by Age in Miller s Cove
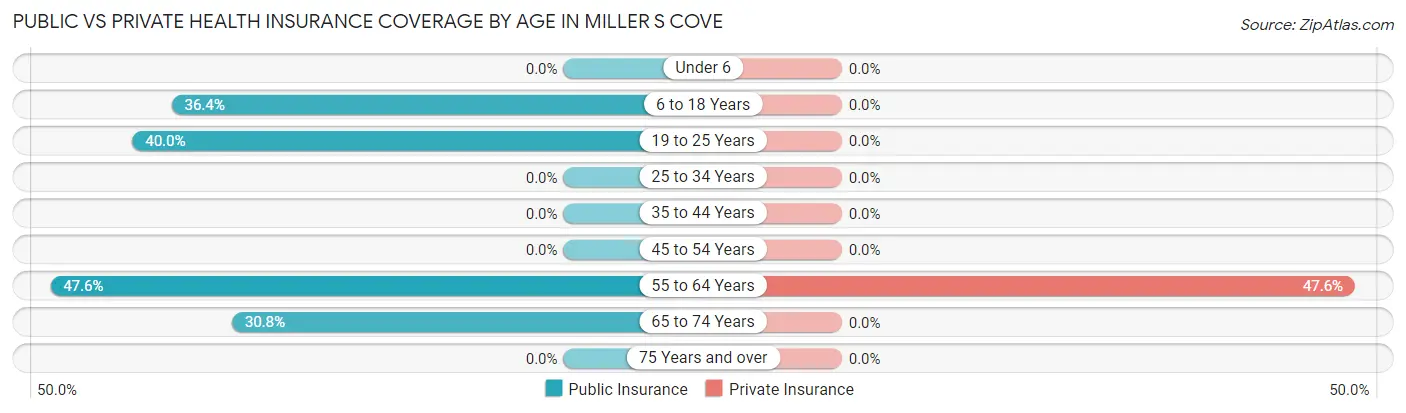
| Age Bracket | Public Insurance | Private Insurance |
| Under 6 | 0 (0.0%) | 0 (0.0%) |
| 6 to 18 Years | 4 (36.4%) | 0 (0.0%) |
| 19 to 25 Years | 10 (40.0%) | 0 (0.0%) |
| 25 to 34 Years | 0 (0.0%) | 0 (0.0%) |
| 35 to 44 Years | 0 (0.0%) | 0 (0.0%) |
| 45 to 54 Years | 0 (0.0%) | 0 (0.0%) |
| 55 to 64 Years | 10 (47.6%) | 10 (47.6%) |
| 65 to 74 Years | 4 (30.8%) | 0 (0.0%) |
| 75 Years and over | 0 (0.0%) | 0 (0.0%) |
| Total | 28 (37.8%) | 10 (13.5%) |
Disability Status by Sex by Age in Miller s Cove
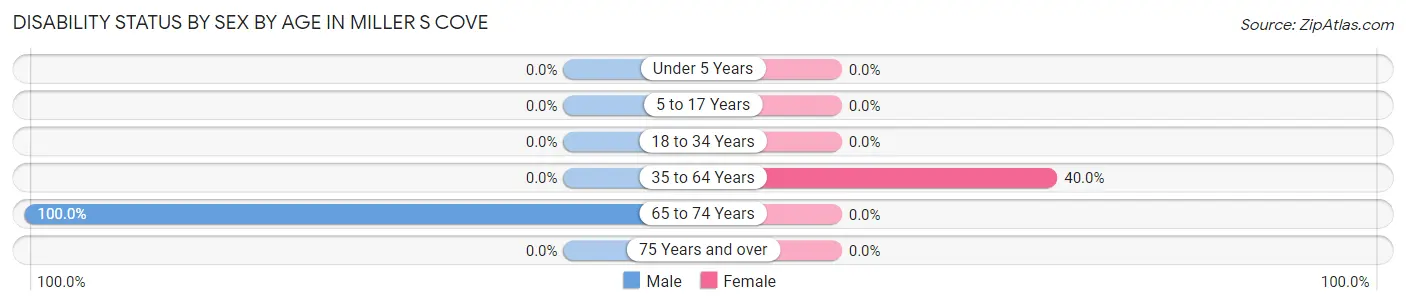
| Age Bracket | Male | Female |
| Under 5 Years | 0 (0.0%) | 0 (0.0%) |
| 5 to 17 Years | 0 (0.0%) | 0 (0.0%) |
| 18 to 34 Years | 0 (0.0%) | 0 (0.0%) |
| 35 to 64 Years | 0 (0.0%) | 6 (40.0%) |
| 65 to 74 Years | 13 (100.0%) | 0 (0.0%) |
| 75 Years and over | 0 (0.0%) | 0 (0.0%) |
Disability Class by Sex by Age in Miller s Cove
Disability Class: Hearing Difficulty
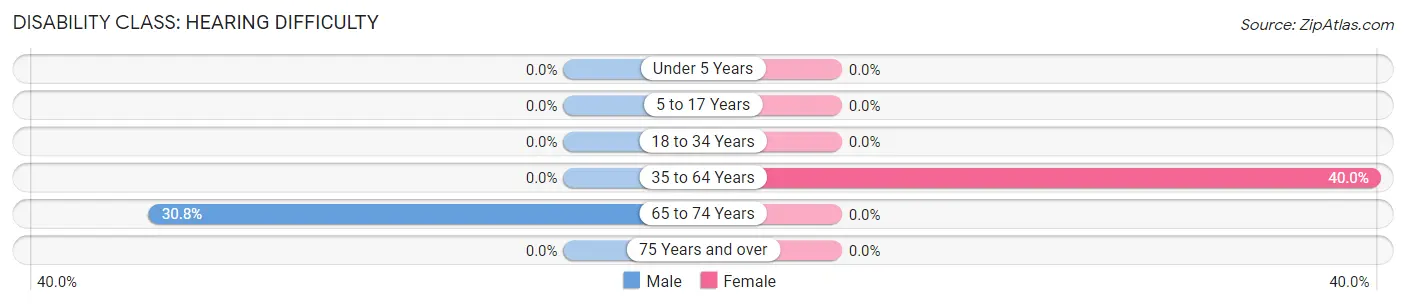
| Age Bracket | Male | Female |
| Under 5 Years | 0 (0.0%) | 0 (0.0%) |
| 5 to 17 Years | 0 (0.0%) | 0 (0.0%) |
| 18 to 34 Years | 0 (0.0%) | 0 (0.0%) |
| 35 to 64 Years | 0 (0.0%) | 6 (40.0%) |
| 65 to 74 Years | 4 (30.8%) | 0 (0.0%) |
| 75 Years and over | 0 (0.0%) | 0 (0.0%) |
Disability Class: Vision Difficulty
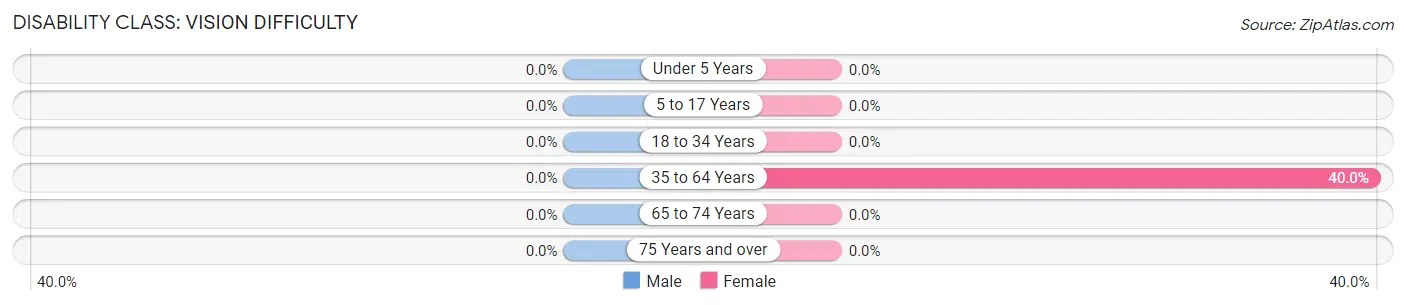
| Age Bracket | Male | Female |
| Under 5 Years | 0 (0.0%) | 0 (0.0%) |
| 5 to 17 Years | 0 (0.0%) | 0 (0.0%) |
| 18 to 34 Years | 0 (0.0%) | 0 (0.0%) |
| 35 to 64 Years | 0 (0.0%) | 6 (40.0%) |
| 65 to 74 Years | 0 (0.0%) | 0 (0.0%) |
| 75 Years and over | 0 (0.0%) | 0 (0.0%) |
Disability Class: Cognitive Difficulty
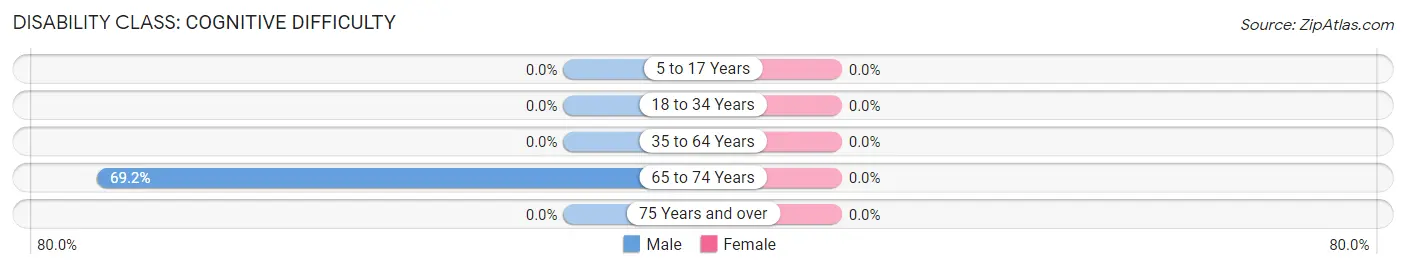
| Age Bracket | Male | Female |
| 5 to 17 Years | 0 (0.0%) | 0 (0.0%) |
| 18 to 34 Years | 0 (0.0%) | 0 (0.0%) |
| 35 to 64 Years | 0 (0.0%) | 0 (0.0%) |
| 65 to 74 Years | 9 (69.2%) | 0 (0.0%) |
| 75 Years and over | 0 (0.0%) | 0 (0.0%) |
Disability Class: Ambulatory Difficulty
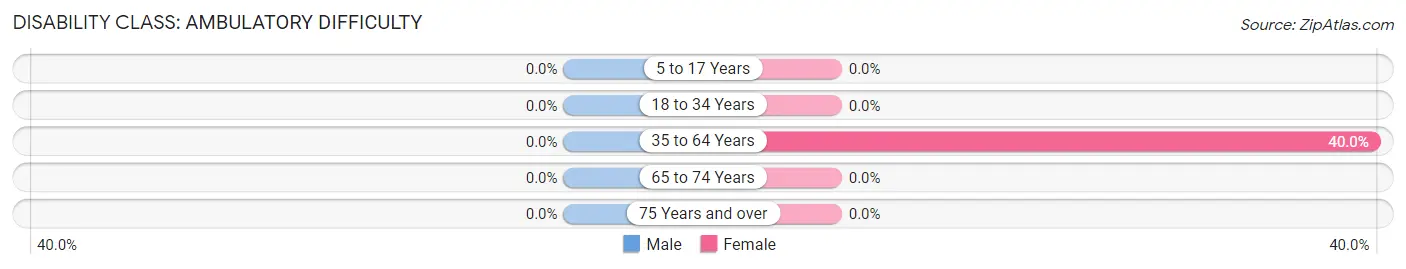
| Age Bracket | Male | Female |
| 5 to 17 Years | 0 (0.0%) | 0 (0.0%) |
| 18 to 34 Years | 0 (0.0%) | 0 (0.0%) |
| 35 to 64 Years | 0 (0.0%) | 6 (40.0%) |
| 65 to 74 Years | 0 (0.0%) | 0 (0.0%) |
| 75 Years and over | 0 (0.0%) | 0 (0.0%) |
Disability Class: Self-Care Difficulty
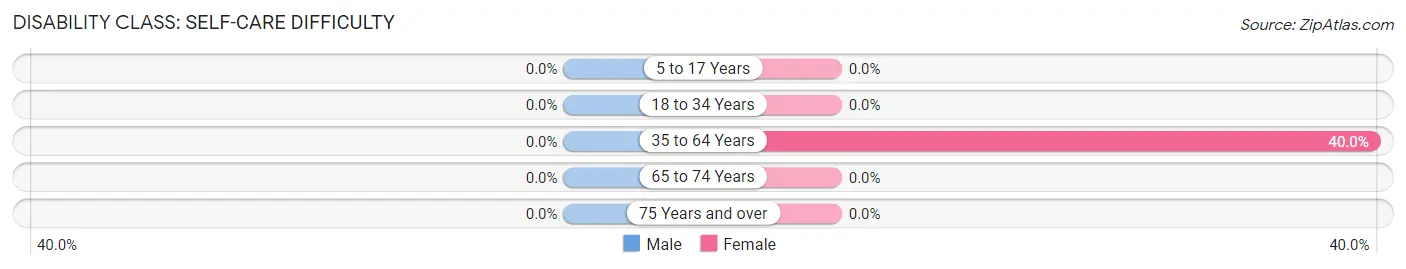
| Age Bracket | Male | Female |
| 5 to 17 Years | 0 (0.0%) | 0 (0.0%) |
| 18 to 34 Years | 0 (0.0%) | 0 (0.0%) |
| 35 to 64 Years | 0 (0.0%) | 6 (40.0%) |
| 65 to 74 Years | 0 (0.0%) | 0 (0.0%) |
| 75 Years and over | 0 (0.0%) | 0 (0.0%) |
Technology Access in Miller s Cove
Computing Device Access in Miller s Cove
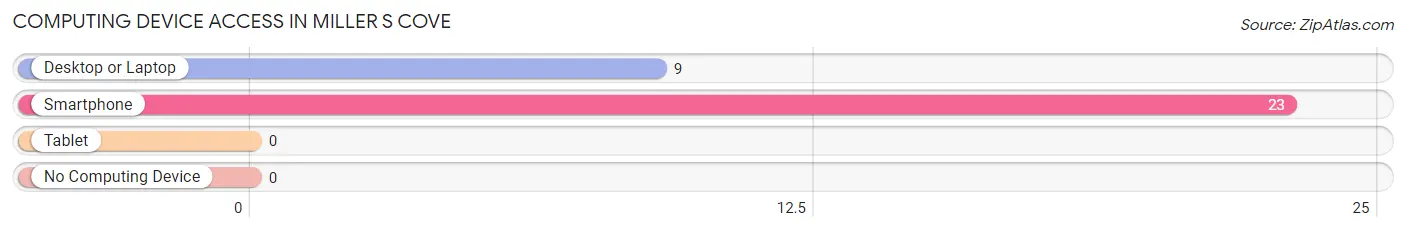
| Device Type | # Households | % Households |
| Desktop or Laptop | 9 | 39.1% |
| Smartphone | 23 | 100.0% |
| Tablet | 0 | 0.0% |
| No Computing Device | 0 | 0.0% |
| Total | 23 | 100.0% |
Internet Access in Miller s Cove
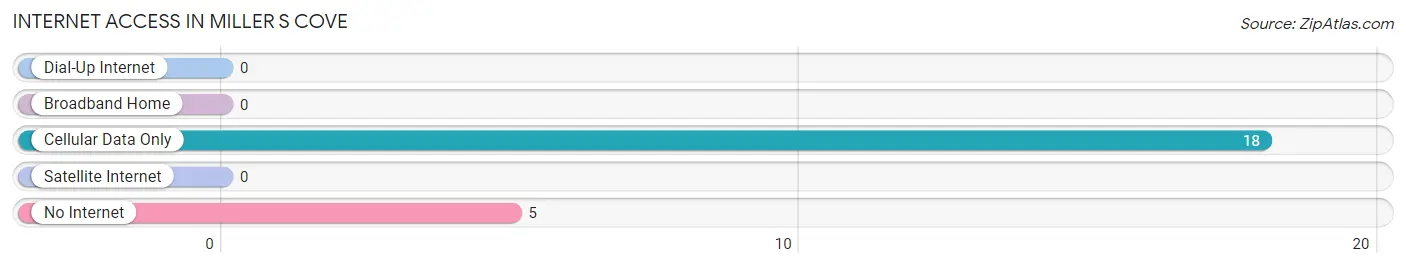
| Internet Type | # Households | % Households |
| Dial-Up Internet | 0 | 0.0% |
| Broadband Home | 0 | 0.0% |
| Cellular Data Only | 18 | 78.3% |
| Satellite Internet | 0 | 0.0% |
| No Internet | 5 | 21.7% |
| Total | 23 | 100.0% |
Miller s Cove Summary
Miller’s Cove is a small unincorporated community located in Hood County, Texas. It is situated on the banks of the Brazos River, approximately 25 miles southwest of Fort Worth. The community is named after the Miller family, who settled in the area in the late 1800s.
History
The Miller family first arrived in the area in the late 1800s, settling on the banks of the Brazos River. The family established a small farm and began to raise cattle and other livestock. The area was sparsely populated at the time, and the Millers were the only family living in the area.
In the early 1900s, the Miller family began to sell off portions of their land to other settlers. This led to the establishment of a small community, which was eventually named Miller’s Cove. The community grew slowly over the years, and by the 1950s it had a population of around 200 people.
Geography
Miller’s Cove is located in Hood County, Texas, approximately 25 miles southwest of Fort Worth. The community is situated on the banks of the Brazos River, and is surrounded by rolling hills and wooded areas. The climate in the area is generally mild, with temperatures ranging from the mid-50s in the winter to the mid-90s in the summer.
Economy
The economy of Miller’s Cove is largely based on agriculture and ranching. The area is home to several small farms and ranches, which produce a variety of crops and livestock. In addition, the community is home to several small businesses, including a general store, a gas station, and a few restaurants.
Demographics
As of the 2010 census, the population of Miller’s Cove was estimated to be around 200 people. The racial makeup of the community was 97.5% White, 0.5% African American, 0.5% Native American, and 1.5% from other races. The median household income in the area was estimated to be around $35,000.
Common Questions
What is Per Capita Income in Miller s Cove?
Per Capita income in Miller s Cove is $12,459.
What is the Median Household income in Miller s Cove?
Median Household Income in Miller s Cove is $29,583.
What is Inequality or Gini Index in Miller s Cove?
Inequality or Gini Index in Miller s Cove is 0.22.
What is the Total Population of Miller s Cove?
Total Population of Miller s Cove is 74.
What is the Total Male Population of Miller s Cove?
Total Male Population of Miller s Cove is 49.
What is the Total Female Population of Miller s Cove?
Total Female Population of Miller s Cove is 25.
What is the Ratio of Males per 100 Females in Miller s Cove?
There are 196.00 Males per 100 Females in Miller s Cove.
What is the Ratio of Females per 100 Males in Miller s Cove?
There are 51.02 Females per 100 Males in Miller s Cove.
What is the Median Population Age in Miller s Cove?
Median Population Age in Miller s Cove is 46.3 Years.
What is the Average Family Size in Miller s Cove
Average Family Size in Miller s Cove is 3.8 People.
What is the Average Household Size in Miller s Cove
Average Household Size in Miller s Cove is 3.2 People.
How Large is the Labor Force in Miller s Cove?
There are 43 People in the Labor Forcein in Miller s Cove.
What is the Percentage of People in the Labor Force in Miller s Cove?
58.1% of People are in the Labor Force in Miller s Cove.
What is the Unemployment Rate in Miller s Cove?
Unemployment Rate in Miller s Cove is 30.2%.