Bridgeport, WA Map & Demographics
Bridgeport Map
Bridgeport Overview
$17,318
PER CAPITA INCOME
$46,549
AVG FAMILY INCOME
$52,083
AVG HOUSEHOLD INCOME
19.6%
WAGE / INCOME GAP [ % ]
80.4¢/ $1
WAGE / INCOME GAP [ $ ]
$11,067
FAMILY INCOME DEFICIT
0.29
INEQUALITY / GINI INDEX
2,416
TOTAL POPULATION
1,238
MALE POPULATION
1,178
FEMALE POPULATION
105.09
MALES / 100 FEMALES
95.15
FEMALES / 100 MALES
27.6
MEDIAN AGE
3.8
AVG FAMILY SIZE
3.5
AVG HOUSEHOLD SIZE
1,120
LABOR FORCE [ PEOPLE ]
70.6%
PERCENT IN LABOR FORCE
6.3%
UNEMPLOYMENT RATE
Bridgeport Zip Codes
Bridgeport Area Codes
Income in Bridgeport
Income Overview in Bridgeport
Per Capita Income in Bridgeport is $17,318, while median incomes of families and households are $46,549 and $52,083 respectively.
| Characteristic | Number | Measure |
| Per Capita Income | 2,416 | $17,318 |
| Median Family Income | 561 | $46,549 |
| Mean Family Income | 561 | $55,938 |
| Median Household Income | 685 | $52,083 |
| Mean Household Income | 685 | $58,856 |
| Income Deficit | 561 | $11,067 |
| Wage / Income Gap (%) | 2,416 | 19.60% |
| Wage / Income Gap ($) | 2,416 | 80.40¢ per $1 |
| Gini / Inequality Index | 2,416 | 0.29 |
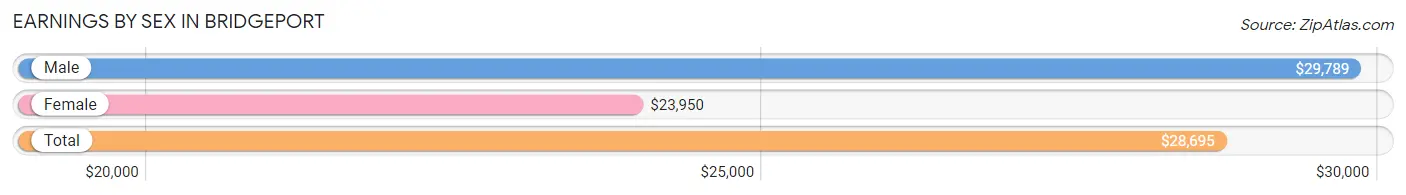
Earnings by Sex in Bridgeport
Average Earnings in Bridgeport are $28,695, $29,789 for men and $23,950 for women, a difference of 19.6%.
| Sex | Number | Average Earnings |
| Male | 655 (55.9%) | $29,789 |
| Female | 516 (44.1%) | $23,950 |
| Total | 1,171 (100.0%) | $28,695 |
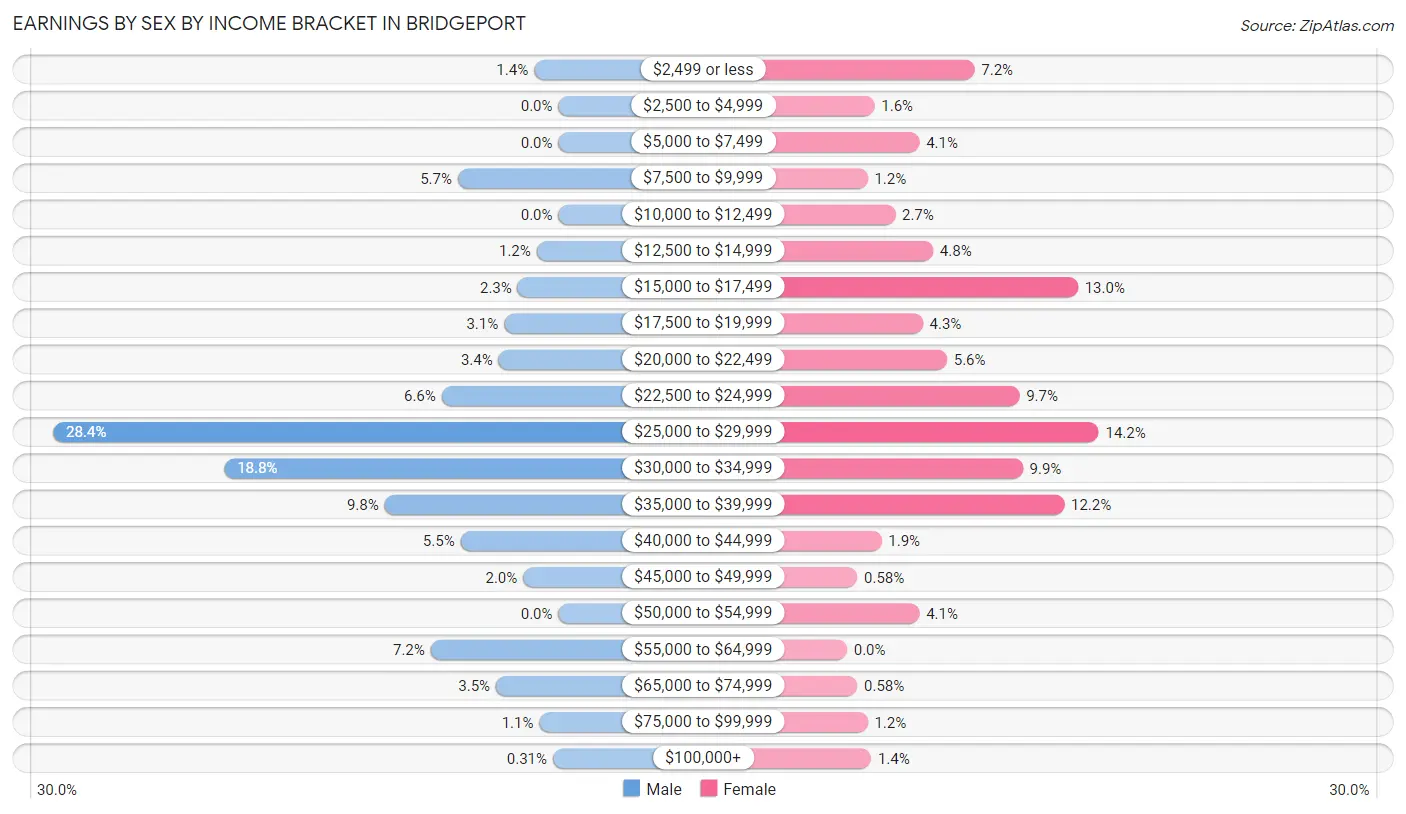
Earnings by Sex by Income Bracket in Bridgeport
The most common earnings brackets in Bridgeport are $25,000 to $29,999 for men (186 | 28.4%) and $25,000 to $29,999 for women (73 | 14.1%).
| Income | Male | Female |
| $2,499 or less | 9 (1.4%) | 37 (7.2%) |
| $2,500 to $4,999 | 0 (0.0%) | 8 (1.5%) |
| $5,000 to $7,499 | 0 (0.0%) | 21 (4.1%) |
| $7,500 to $9,999 | 37 (5.7%) | 6 (1.2%) |
| $10,000 to $12,499 | 0 (0.0%) | 14 (2.7%) |
| $12,500 to $14,999 | 8 (1.2%) | 25 (4.8%) |
| $15,000 to $17,499 | 15 (2.3%) | 67 (13.0%) |
| $17,500 to $19,999 | 20 (3.0%) | 22 (4.3%) |
| $20,000 to $22,499 | 22 (3.4%) | 29 (5.6%) |
| $22,500 to $24,999 | 43 (6.6%) | 50 (9.7%) |
| $25,000 to $29,999 | 186 (28.4%) | 73 (14.1%) |
| $30,000 to $34,999 | 123 (18.8%) | 51 (9.9%) |
| $35,000 to $39,999 | 64 (9.8%) | 63 (12.2%) |
| $40,000 to $44,999 | 36 (5.5%) | 10 (1.9%) |
| $45,000 to $49,999 | 13 (2.0%) | 3 (0.6%) |
| $50,000 to $54,999 | 0 (0.0%) | 21 (4.1%) |
| $55,000 to $64,999 | 47 (7.2%) | 0 (0.0%) |
| $65,000 to $74,999 | 23 (3.5%) | 3 (0.6%) |
| $75,000 to $99,999 | 7 (1.1%) | 6 (1.2%) |
| $100,000+ | 2 (0.3%) | 7 (1.4%) |
| Total | 655 (100.0%) | 516 (100.0%) |
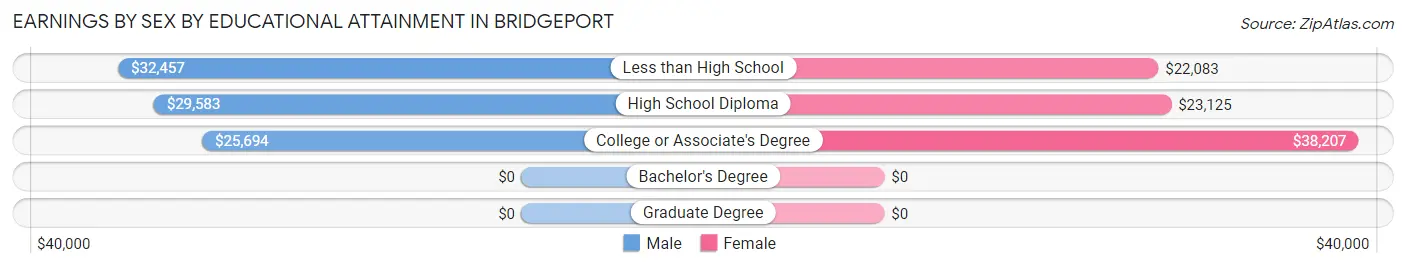
Earnings by Sex by Educational Attainment in Bridgeport
Average earnings in Bridgeport are $31,283 for men and $24,831 for women, a difference of 20.6%. Men with an educational attainment of less than high school enjoy the highest average annual earnings of $32,457, while those with college or associate's degree education earn the least with $25,694. Women with an educational attainment of college or associate's degree earn the most with the average annual earnings of $38,207, while those with less than high school education have the smallest earnings of $22,083.
| Educational Attainment | Male Income | Female Income |
| Less than High School | $32,457 | $22,083 |
| High School Diploma | $29,583 | $23,125 |
| College or Associate's Degree | $25,694 | $38,207 |
| Bachelor's Degree | - | - |
| Graduate Degree | - | - |
| Total | $31,283 | $24,831 |
Family Income in Bridgeport
Family Income Brackets in Bridgeport
According to the Bridgeport family income data, there are 147 families falling into the $35,000 to $49,999 income range, which is the most common income bracket and makes up 26.2% of all families.
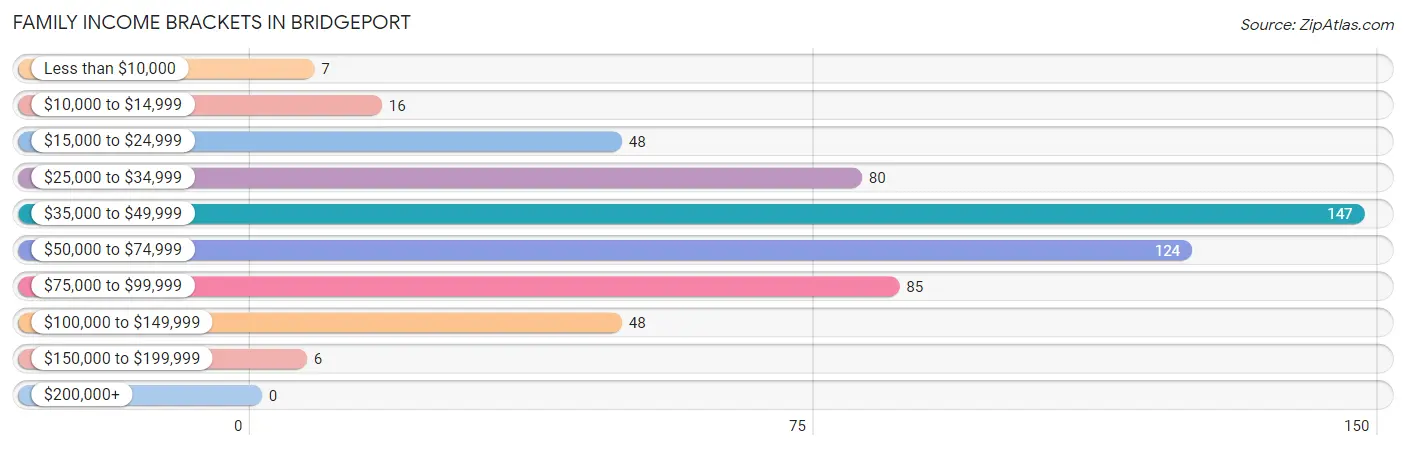
| Income Bracket | # Families | % Families |
| Less than $10,000 | 7 | 1.2% |
| $10,000 to $14,999 | 16 | 2.9% |
| $15,000 to $24,999 | 48 | 8.6% |
| $25,000 to $34,999 | 80 | 14.3% |
| $35,000 to $49,999 | 147 | 26.2% |
| $50,000 to $74,999 | 124 | 22.1% |
| $75,000 to $99,999 | 85 | 15.2% |
| $100,000 to $149,999 | 48 | 8.6% |
| $150,000 to $199,999 | 6 | 1.1% |
| $200,000+ | 0 | 0.0% |
Family Income by Famaliy Size in Bridgeport
5-person families (136 | 24.2%) account for the highest median family income in Bridgeport with $50,313 per family, while 2-person families (130 | 23.2%) have the highest median income of $22,916 per family member.
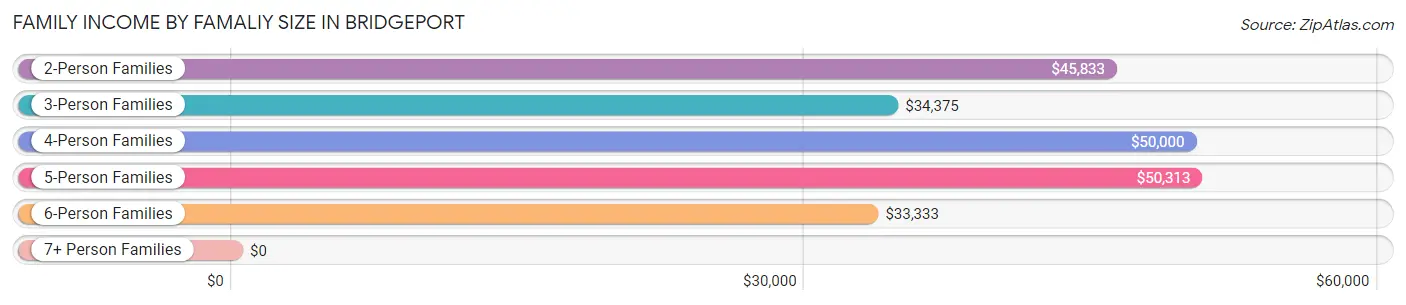
| Income Bracket | # Families | Median Income |
| 2-Person Families | 130 (23.2%) | $45,833 |
| 3-Person Families | 121 (21.6%) | $34,375 |
| 4-Person Families | 124 (22.1%) | $50,000 |
| 5-Person Families | 136 (24.2%) | $50,313 |
| 6-Person Families | 40 (7.1%) | $33,333 |
| 7+ Person Families | 10 (1.8%) | $0 |
| Total | 561 (100.0%) | $46,549 |
Family Income by Number of Earners in Bridgeport
The median family income in Bridgeport is $46,549, with families comprising 3+ earners (72) having the highest median family income of $90,500, while families with no earners (38) have the lowest median family income of $23,571, accounting for 12.8% and 6.8% of families, respectively.
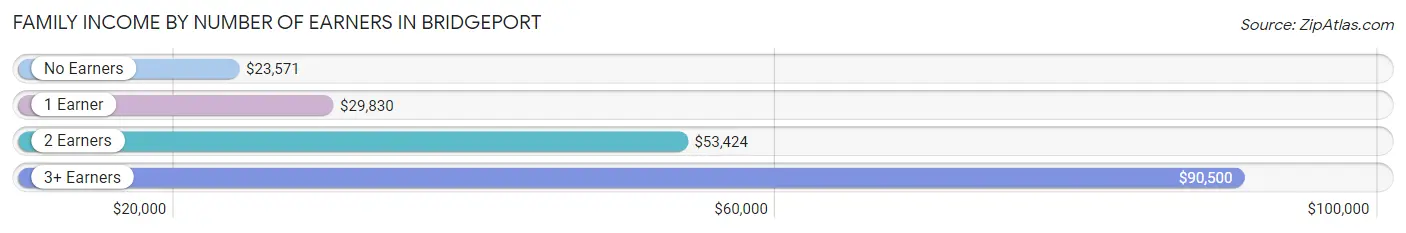
| Number of Earners | # Families | Median Income |
| No Earners | 38 (6.8%) | $23,571 |
| 1 Earner | 170 (30.3%) | $29,830 |
| 2 Earners | 281 (50.1%) | $53,424 |
| 3+ Earners | 72 (12.8%) | $90,500 |
| Total | 561 (100.0%) | $46,549 |
Household Income in Bridgeport
Household Income Brackets in Bridgeport
With 164 households falling in the category, the $50,000 to $74,999 income range is the most frequent in Bridgeport, accounting for 23.9% of all households.
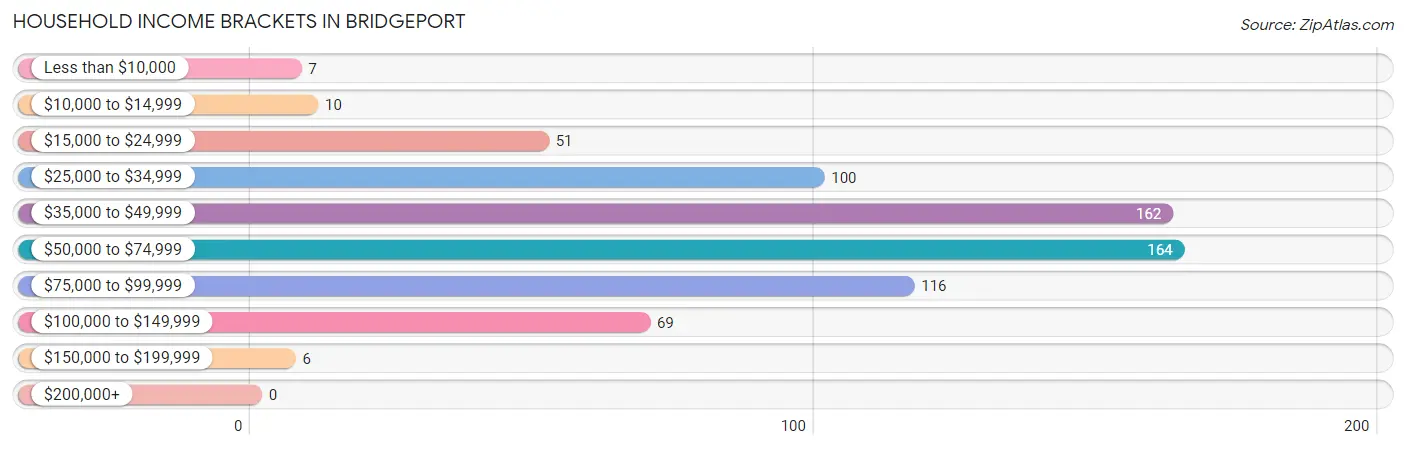
| Income Bracket | # Households | % Households |
| Less than $10,000 | 7 | 1.0% |
| $10,000 to $14,999 | 10 | 1.5% |
| $15,000 to $24,999 | 51 | 7.4% |
| $25,000 to $34,999 | 100 | 14.6% |
| $35,000 to $49,999 | 162 | 23.6% |
| $50,000 to $74,999 | 164 | 23.9% |
| $75,000 to $99,999 | 116 | 16.9% |
| $100,000 to $149,999 | 69 | 10.1% |
| $150,000 to $199,999 | 6 | 0.9% |
| $200,000+ | 0 | 0.0% |
Household Income by Householder Age in Bridgeport
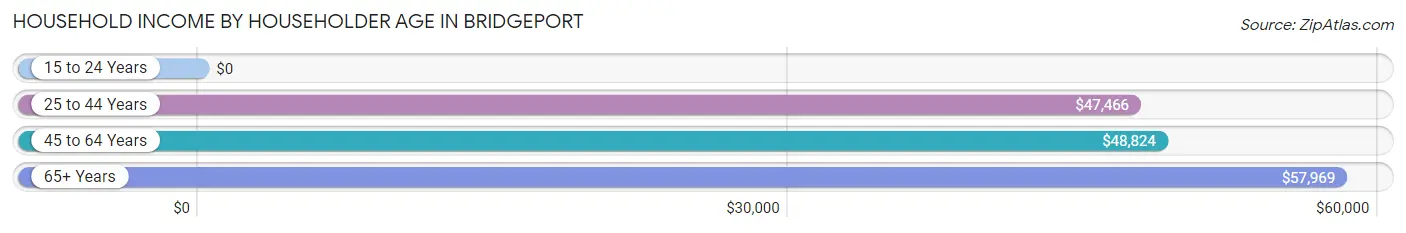
The median household income in Bridgeport is $52,083, with the highest median household income of $57,969 found in the 65+ years age bracket for the primary householder. A total of 103 households (15.0%) fall into this category. Meanwhile, the 15 to 24 years age bracket for the primary householder has the lowest median household income of $0, with 29 households (4.2%) in this group.
| Income Bracket | # Households | Median Income |
| 15 to 24 Years | 29 (4.2%) | $0 |
| 25 to 44 Years | 263 (38.4%) | $47,466 |
| 45 to 64 Years | 290 (42.3%) | $48,824 |
| 65+ Years | 103 (15.0%) | $57,969 |
| Total | 685 (100.0%) | $52,083 |
Poverty in Bridgeport
Income Below Poverty by Sex and Age in Bridgeport
With 18.1% poverty level for males and 22.0% for females among the residents of Bridgeport, 15 year old males and 18 to 24 year old females are the most vulnerable to poverty, with 15 males (100.0%) and 48 females (41.7%) in their respective age groups living below the poverty level.
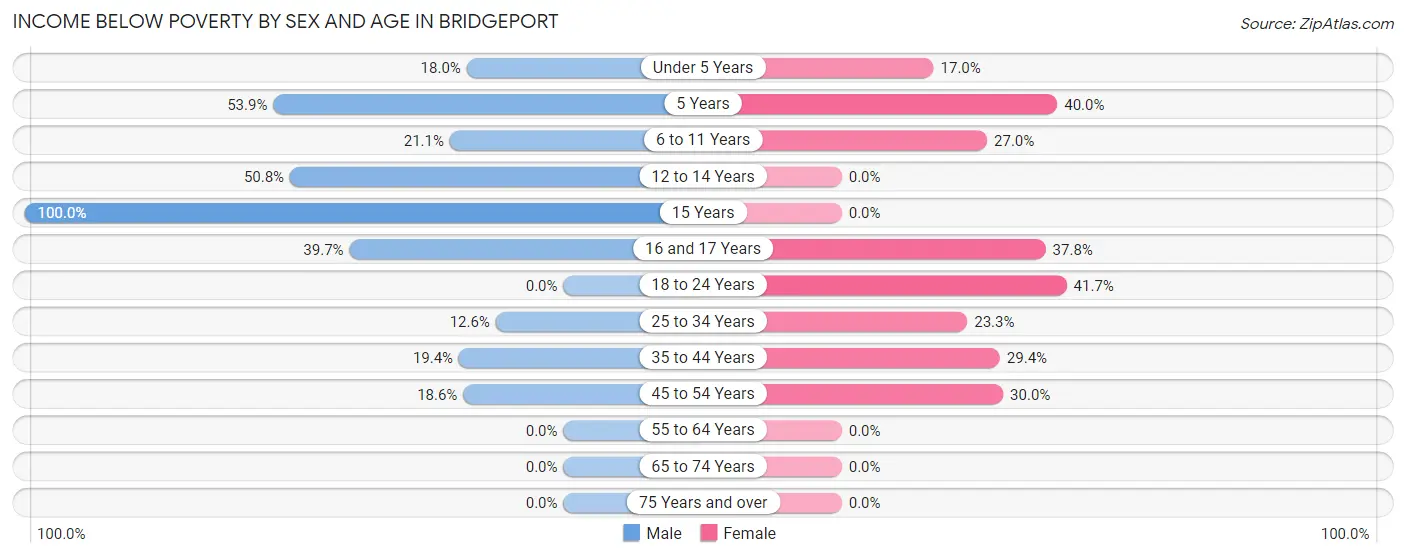
| Age Bracket | Male | Female |
| Under 5 Years | 21 (17.9%) | 23 (17.0%) |
| 5 Years | 7 (53.8%) | 8 (40.0%) |
| 6 to 11 Years | 35 (21.1%) | 41 (27.0%) |
| 12 to 14 Years | 34 (50.7%) | 0 (0.0%) |
| 15 Years | 15 (100.0%) | 0 (0.0%) |
| 16 and 17 Years | 27 (39.7%) | 14 (37.8%) |
| 18 to 24 Years | 0 (0.0%) | 48 (41.7%) |
| 25 to 34 Years | 28 (12.6%) | 34 (23.3%) |
| 35 to 44 Years | 25 (19.4%) | 27 (29.3%) |
| 45 to 54 Years | 29 (18.6%) | 56 (29.9%) |
| 55 to 64 Years | 0 (0.0%) | 0 (0.0%) |
| 65 to 74 Years | 0 (0.0%) | 0 (0.0%) |
| 75 Years and over | 0 (0.0%) | 0 (0.0%) |
| Total | 221 (18.1%) | 251 (22.0%) |
Income Above Poverty by Sex and Age in Bridgeport
According to the poverty statistics in Bridgeport, males aged 18 to 24 years and females aged 12 to 14 years are the age groups that are most secure financially, with 100.0% of males and 100.0% of females in these age groups living above the poverty line.
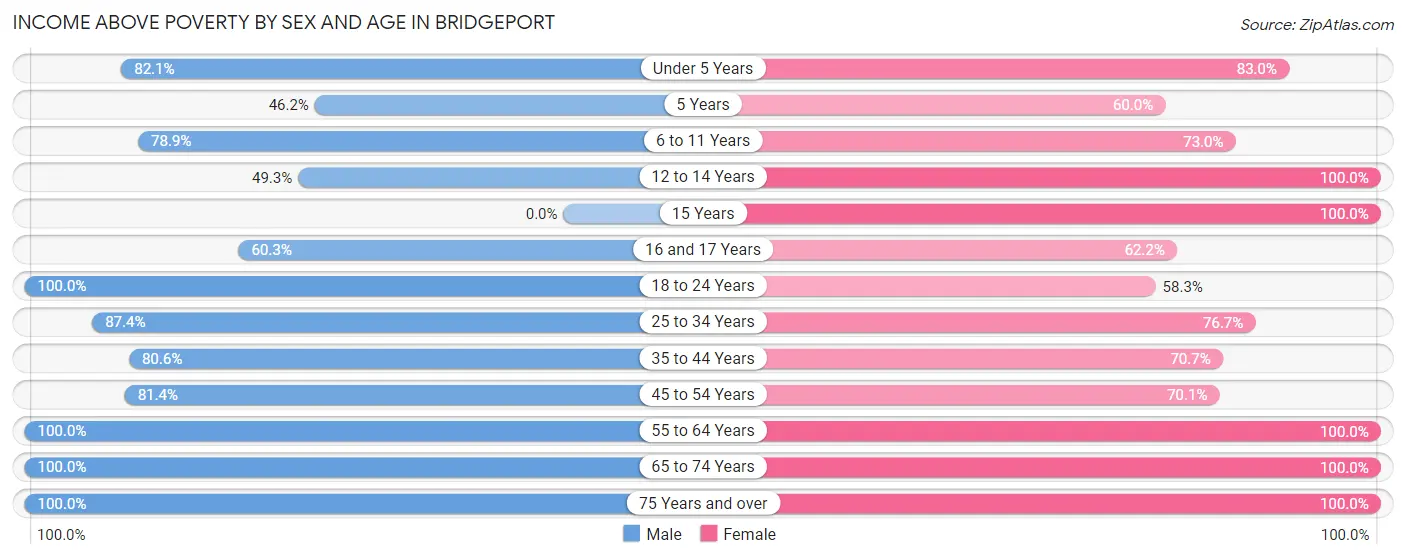
| Age Bracket | Male | Female |
| Under 5 Years | 96 (82.1%) | 112 (83.0%) |
| 5 Years | 6 (46.2%) | 12 (60.0%) |
| 6 to 11 Years | 131 (78.9%) | 111 (73.0%) |
| 12 to 14 Years | 33 (49.2%) | 67 (100.0%) |
| 15 Years | 0 (0.0%) | 24 (100.0%) |
| 16 and 17 Years | 41 (60.3%) | 23 (62.2%) |
| 18 to 24 Years | 89 (100.0%) | 67 (58.3%) |
| 25 to 34 Years | 195 (87.4%) | 112 (76.7%) |
| 35 to 44 Years | 104 (80.6%) | 65 (70.7%) |
| 45 to 54 Years | 127 (81.4%) | 131 (70.1%) |
| 55 to 64 Years | 98 (100.0%) | 82 (100.0%) |
| 65 to 74 Years | 37 (100.0%) | 49 (100.0%) |
| 75 Years and over | 46 (100.0%) | 33 (100.0%) |
| Total | 1,003 (81.9%) | 888 (78.0%) |
Income Below Poverty Among Married-Couple Families in Bridgeport
The poverty statistics for married-couple families in Bridgeport show that 13.0% or 53 of the total 408 families live below the poverty line. Families with 3 or 4 children have the highest poverty rate of 23.3%, comprising of 35 families. On the other hand, families with no children have the lowest poverty rate of 0.0%, which includes 0 families.
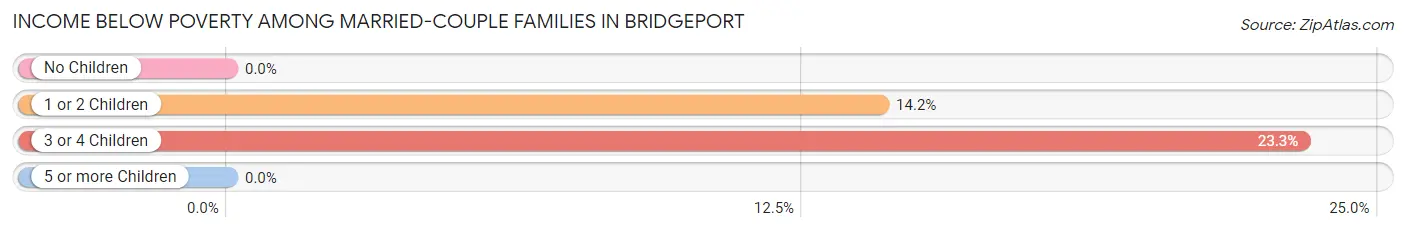
| Children | Above Poverty | Below Poverty |
| No Children | 131 (100.0%) | 0 (0.0%) |
| 1 or 2 Children | 109 (85.8%) | 18 (14.2%) |
| 3 or 4 Children | 115 (76.7%) | 35 (23.3%) |
| 5 or more Children | 0 (0.0%) | 0 (0.0%) |
| Total | 355 (87.0%) | 53 (13.0%) |
Income Below Poverty Among Single-Parent Households in Bridgeport
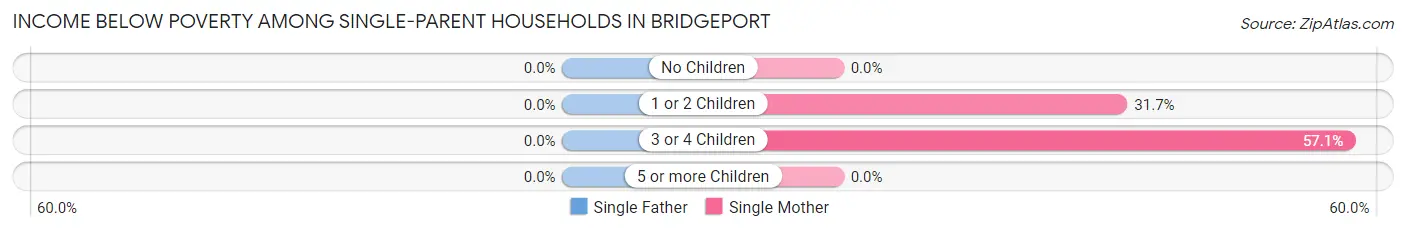
| Children | Single Father | Single Mother |
| No Children | 0 (0.0%) | 0 (0.0%) |
| 1 or 2 Children | 0 (0.0%) | 13 (31.7%) |
| 3 or 4 Children | 0 (0.0%) | 16 (57.1%) |
| 5 or more Children | 0 (0.0%) | 0 (0.0%) |
| Total | 0 (0.0%) | 29 (38.2%) |
Income Below Poverty Among Married-Couple vs Single-Parent Households in Bridgeport
The poverty data for Bridgeport shows that 53 of the married-couple family households (13.0%) and 29 of the single-parent households (19.0%) are living below the poverty level. Within the married-couple family households, those with 3 or 4 children have the highest poverty rate, with 35 households (23.3%) falling below the poverty line. Among the single-parent households, those with 3 or 4 children have the highest poverty rate, with 16 household (40.0%) living below poverty.
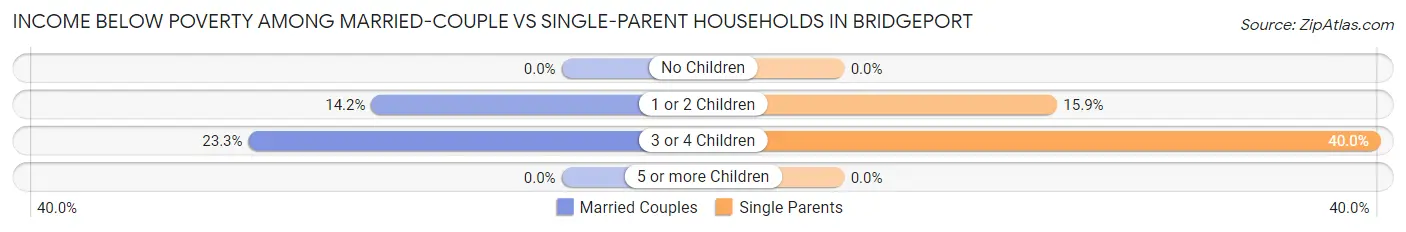
| Children | Married-Couple Families | Single-Parent Households |
| No Children | 0 (0.0%) | 0 (0.0%) |
| 1 or 2 Children | 18 (14.2%) | 13 (15.9%) |
| 3 or 4 Children | 35 (23.3%) | 16 (40.0%) |
| 5 or more Children | 0 (0.0%) | 0 (0.0%) |
| Total | 53 (13.0%) | 29 (19.0%) |
Race in Bridgeport
The most populous races in Bridgeport are Hispanic or Latino (2,188 | 90.6%), Some other Race (1,531 | 63.4%), and Two or more Races (528 | 21.8%).
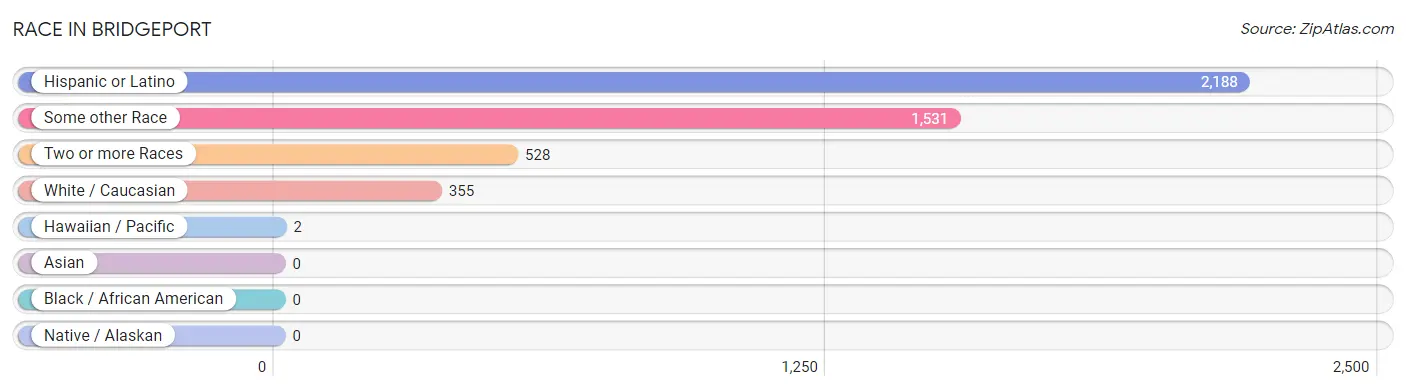
| Race | # Population | % Population |
| Asian | 0 | 0.0% |
| Black / African American | 0 | 0.0% |
| Hawaiian / Pacific | 2 | 0.1% |
| Hispanic or Latino | 2,188 | 90.6% |
| Native / Alaskan | 0 | 0.0% |
| White / Caucasian | 355 | 14.7% |
| Two or more Races | 528 | 21.8% |
| Some other Race | 1,531 | 63.4% |
| Total | 2,416 | 100.0% |
Ancestry in Bridgeport
The most populous ancestries reported in Bridgeport are Mexican (2,184 | 90.4%), German (67 | 2.8%), Irish (50 | 2.1%), English (38 | 1.6%), and Scottish (27 | 1.1%), together accounting for 97.9% of all Bridgeport residents.
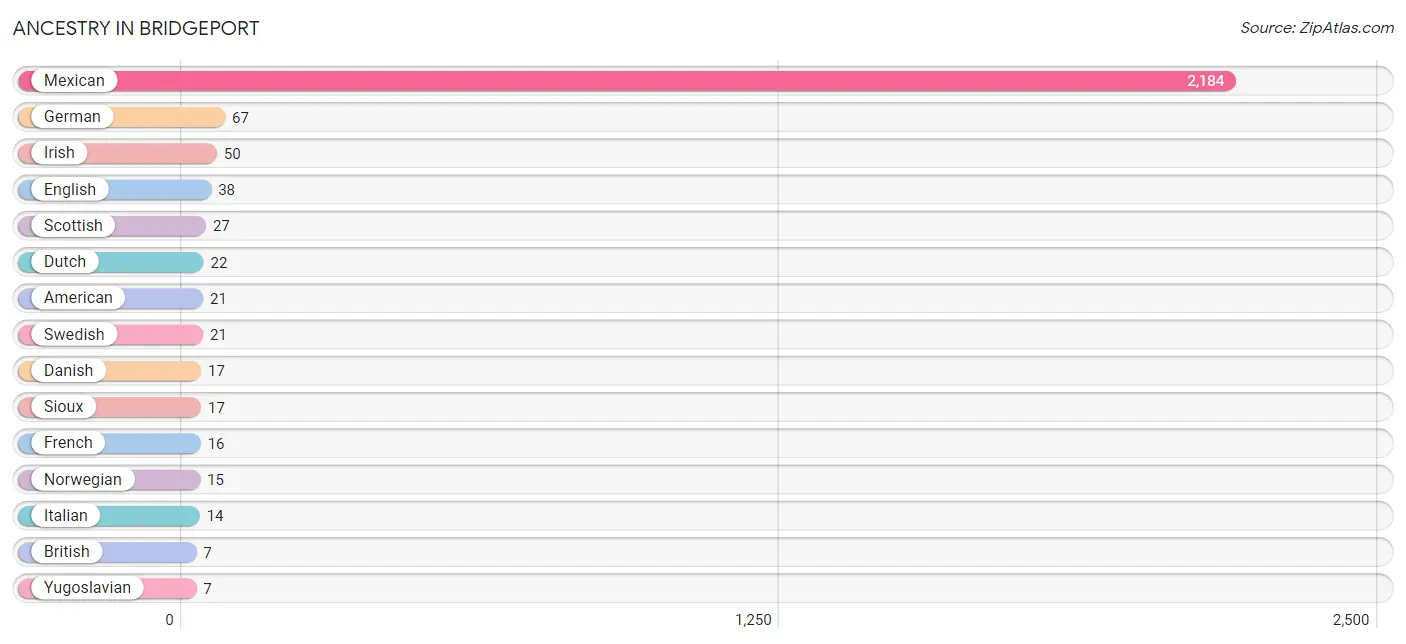
| Ancestry | # Population | % Population |
| American | 21 | 0.9% |
| British | 7 | 0.3% |
| Danish | 17 | 0.7% |
| Dutch | 22 | 0.9% |
| English | 38 | 1.6% |
| European | 1 | 0.0% |
| French | 16 | 0.7% |
| German | 67 | 2.8% |
| Irish | 50 | 2.1% |
| Italian | 14 | 0.6% |
| Mexican | 2,184 | 90.4% |
| Native Hawaiian | 3 | 0.1% |
| Navajo | 5 | 0.2% |
| Norwegian | 15 | 0.6% |
| Scottish | 27 | 1.1% |
| Sioux | 17 | 0.7% |
| Spaniard | 4 | 0.2% |
| Swedish | 21 | 0.9% |
| Welsh | 2 | 0.1% |
| Yugoslavian | 7 | 0.3% | View All 20 Rows |
Immigrants in Bridgeport
The most numerous immigrant groups reported in Bridgeport came from Central America (1,236 | 51.2%), Latin America (1,236 | 51.2%), and Mexico (1,236 | 51.2%), together accounting for 153.5% of all Bridgeport residents.
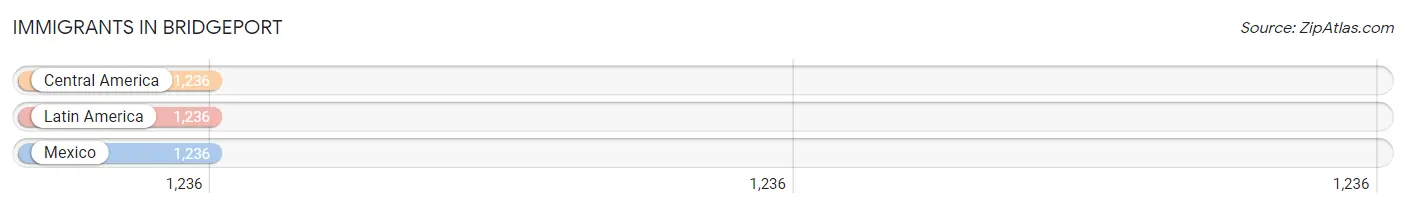
| Immigration Origin | # Population | % Population |
| Central America | 1,236 | 51.2% |
| Latin America | 1,236 | 51.2% |
| Mexico | 1,236 | 51.2% | View All 3 Rows |
Sex and Age in Bridgeport
Sex and Age in Bridgeport
The most populous age groups in Bridgeport are Under 5 Years (131 | 10.6%) for men and Under 5 Years (169 | 14.3%) for women.
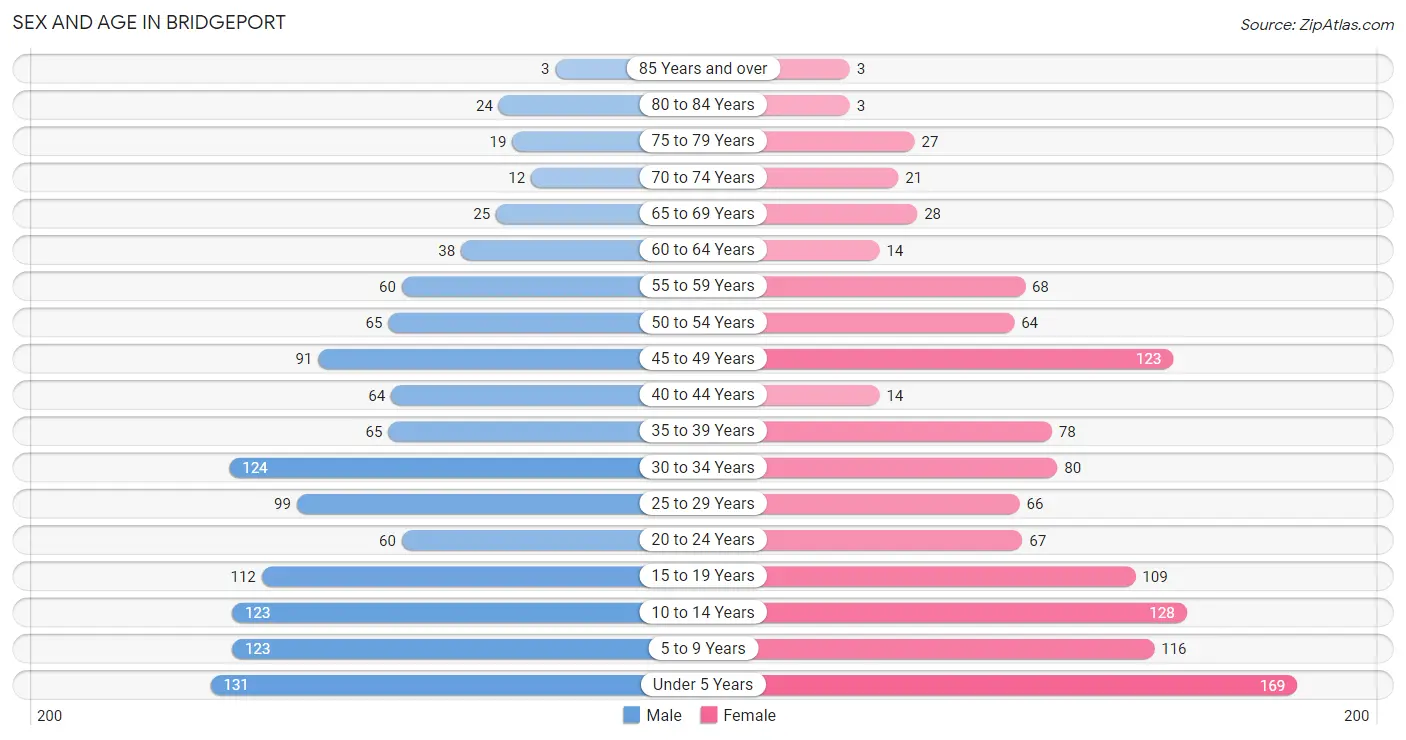
| Age Bracket | Male | Female |
| Under 5 Years | 131 (10.6%) | 169 (14.3%) |
| 5 to 9 Years | 123 (9.9%) | 116 (9.9%) |
| 10 to 14 Years | 123 (9.9%) | 128 (10.9%) |
| 15 to 19 Years | 112 (9.0%) | 109 (9.2%) |
| 20 to 24 Years | 60 (4.9%) | 67 (5.7%) |
| 25 to 29 Years | 99 (8.0%) | 66 (5.6%) |
| 30 to 34 Years | 124 (10.0%) | 80 (6.8%) |
| 35 to 39 Years | 65 (5.2%) | 78 (6.6%) |
| 40 to 44 Years | 64 (5.2%) | 14 (1.2%) |
| 45 to 49 Years | 91 (7.3%) | 123 (10.4%) |
| 50 to 54 Years | 65 (5.2%) | 64 (5.4%) |
| 55 to 59 Years | 60 (4.9%) | 68 (5.8%) |
| 60 to 64 Years | 38 (3.1%) | 14 (1.2%) |
| 65 to 69 Years | 25 (2.0%) | 28 (2.4%) |
| 70 to 74 Years | 12 (1.0%) | 21 (1.8%) |
| 75 to 79 Years | 19 (1.5%) | 27 (2.3%) |
| 80 to 84 Years | 24 (1.9%) | 3 (0.3%) |
| 85 Years and over | 3 (0.2%) | 3 (0.3%) |
| Total | 1,238 (100.0%) | 1,178 (100.0%) |
Families and Households in Bridgeport
Median Family Size in Bridgeport
The median family size in Bridgeport is 3.78 persons per family, with single female/mother families (76 | 13.6%) accounting for the largest median family size of 4.26 persons per family. On the other hand, single male/father families (77 | 13.7%) represent the smallest median family size with 2.42 persons per family.
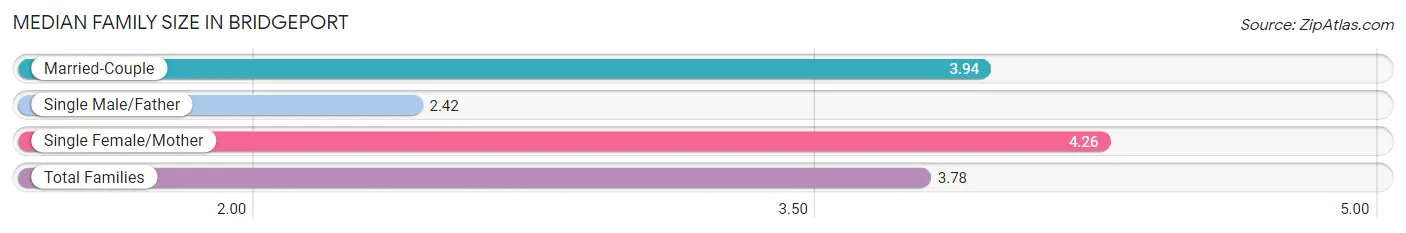
| Family Type | # Families | Family Size |
| Married-Couple | 408 (72.7%) | 3.94 |
| Single Male/Father | 77 (13.7%) | 2.42 |
| Single Female/Mother | 76 (13.6%) | 4.26 |
| Total Families | 561 (100.0%) | 3.78 |
Median Household Size in Bridgeport
The median household size in Bridgeport is 3.53 persons per household, with single female/mother households (76 | 11.1%) accounting for the largest median household size of 4.5 persons per household. non-family households (124 | 18.1%) represent the smallest median household size with 1.19 persons per household.
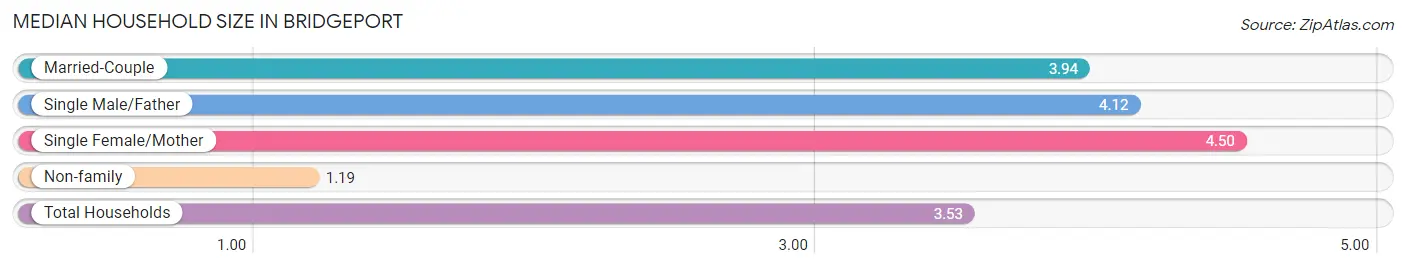
| Household Type | # Households | Household Size |
| Married-Couple | 408 (59.6%) | 3.94 |
| Single Male/Father | 77 (11.2%) | 4.12 |
| Single Female/Mother | 76 (11.1%) | 4.50 |
| Non-family | 124 (18.1%) | 1.19 |
| Total Households | 685 (100.0%) | 3.53 |
Household Size by Marriage Status in Bridgeport
Out of a total of 685 households in Bridgeport, 561 (81.9%) are family households, while 124 (18.1%) are nonfamily households. The most numerous type of family households are 5-person households, comprising 152, and the most common type of nonfamily households are 1-person households, comprising 99.
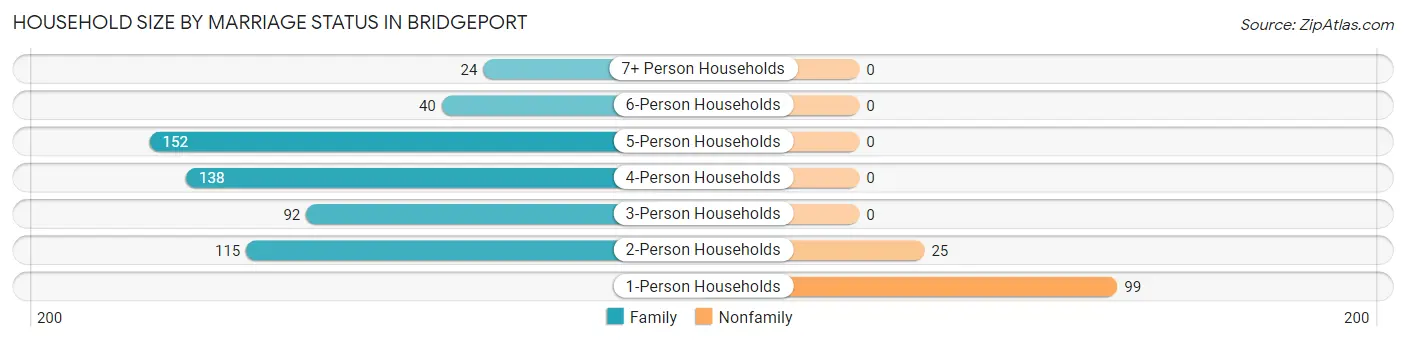
| Household Size | Family Households | Nonfamily Households |
| 1-Person Households | - | 99 (14.4%) |
| 2-Person Households | 115 (16.8%) | 25 (3.6%) |
| 3-Person Households | 92 (13.4%) | 0 (0.0%) |
| 4-Person Households | 138 (20.2%) | 0 (0.0%) |
| 5-Person Households | 152 (22.2%) | 0 (0.0%) |
| 6-Person Households | 40 (5.8%) | 0 (0.0%) |
| 7+ Person Households | 24 (3.5%) | 0 (0.0%) |
| Total | 561 (81.9%) | 124 (18.1%) |
Female Fertility in Bridgeport
Fertility by Age in Bridgeport
Average fertility rate in Bridgeport is 61.0 births per 1,000 women. Women in the age bracket of 20 to 34 years have the highest fertility rate with 141.0 births per 1,000 women. Women in the age bracket of 20 to 34 years acount for 83.3% of all women with births.
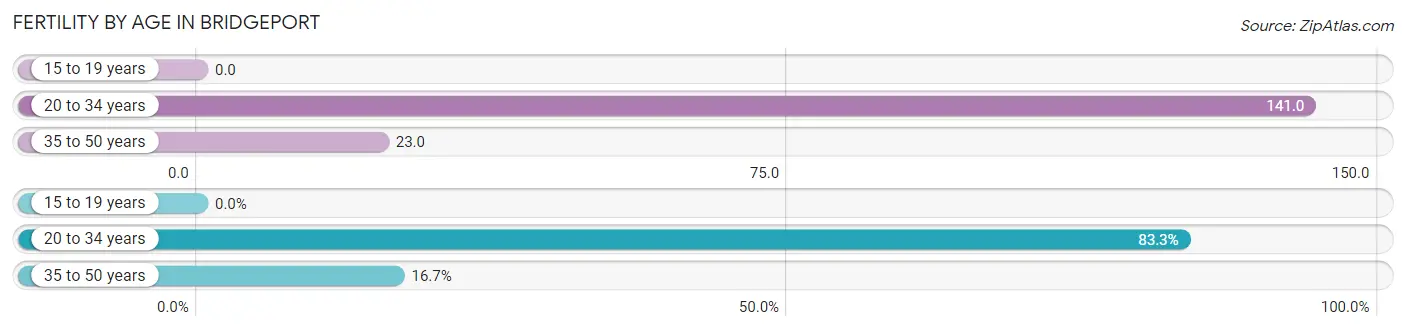
| Age Bracket | Women with Births | Births / 1,000 Women |
| 15 to 19 years | 0 (0.0%) | 0.0 |
| 20 to 34 years | 30 (83.3%) | 141.0 |
| 35 to 50 years | 6 (16.7%) | 23.0 |
| Total | 36 (100.0%) | 61.0 |
Fertility by Age by Marriage Status in Bridgeport
55.6% of women with births (36) in Bridgeport are married. The highest percentage of unmarried women with births falls into 20 to 34 years age bracket with 53.3% of them unmarried at the time of birth, while the lowest percentage of unmarried women with births belong to 35 to 50 years age bracket with 0.0% of them unmarried.
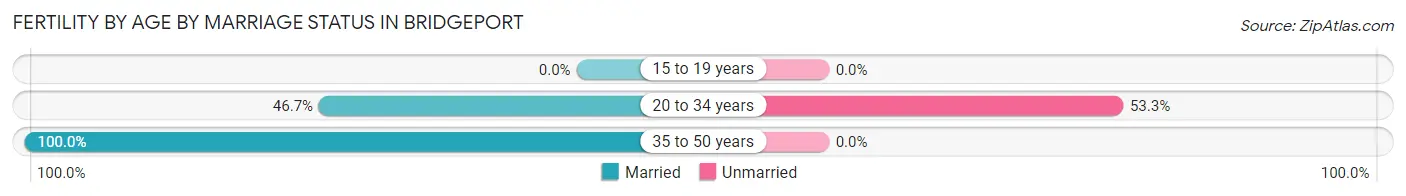
| Age Bracket | Married | Unmarried |
| 15 to 19 years | 0 (0.0%) | 0 (0.0%) |
| 20 to 34 years | 14 (46.7%) | 16 (53.3%) |
| 35 to 50 years | 6 (100.0%) | 0 (0.0%) |
| Total | 20 (55.6%) | 16 (44.4%) |
Fertility by Education in Bridgeport
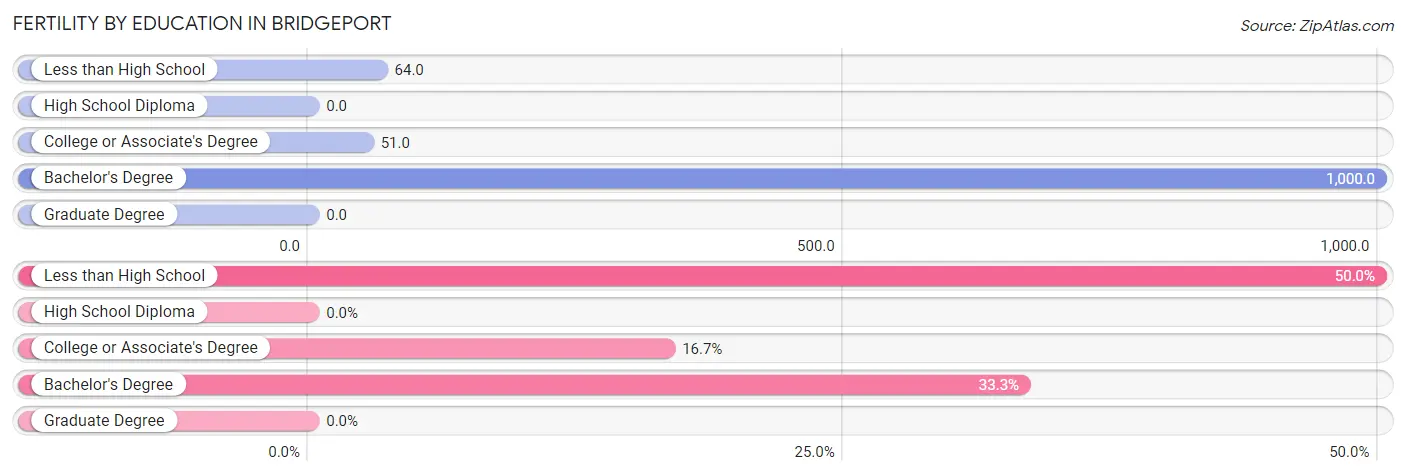
| Educational Attainment | Women with Births | Births / 1,000 Women |
| Less than High School | 18 (50.0%) | 64.0 |
| High School Diploma | 0 (0.0%) | 0.0 |
| College or Associate's Degree | 6 (16.7%) | 51.0 |
| Bachelor's Degree | 12 (33.3%) | 1,000.0 |
| Graduate Degree | 0 (0.0%) | 0.0 |
| Total | 36 (100.0%) | 61.0 |
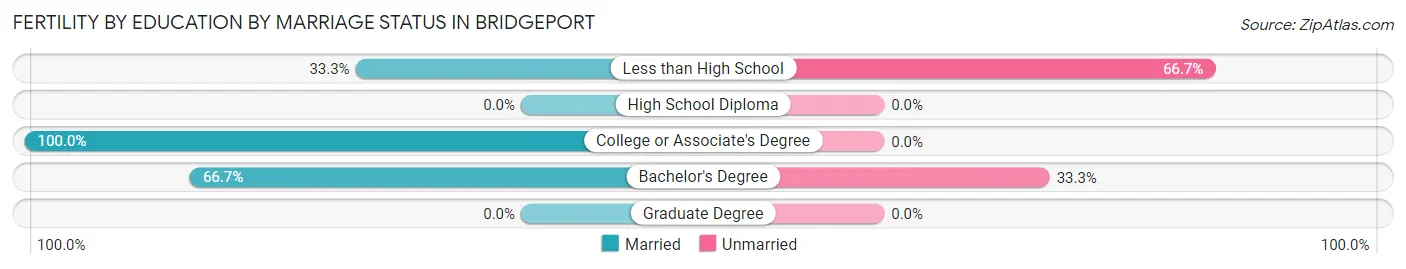
Fertility by Education by Marriage Status in Bridgeport
44.4% of women with births in Bridgeport are unmarried. Women with the educational attainment of college or associate's degree are most likely to be married with 100.0% of them married at childbirth, while women with the educational attainment of less than high school are least likely to be married with 66.7% of them unmarried at childbirth.
| Educational Attainment | Married | Unmarried |
| Less than High School | 6 (33.3%) | 12 (66.7%) |
| High School Diploma | 0 (0.0%) | 0 (0.0%) |
| College or Associate's Degree | 6 (100.0%) | 0 (0.0%) |
| Bachelor's Degree | 8 (66.7%) | 4 (33.3%) |
| Graduate Degree | 0 (0.0%) | 0 (0.0%) |
| Total | 20 (55.6%) | 16 (44.4%) |
Employment Characteristics in Bridgeport
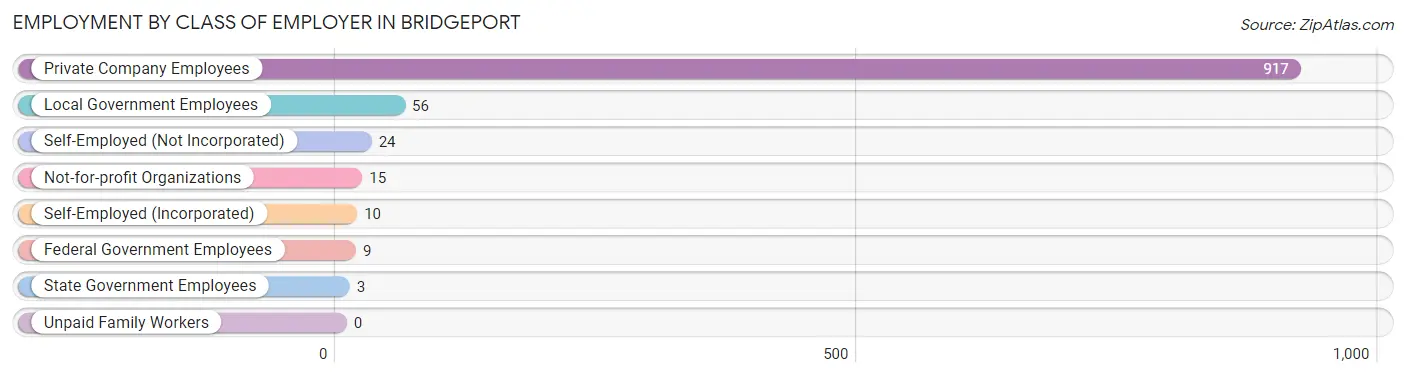
Employment by Class of Employer in Bridgeport
Among the 1,034 employed individuals in Bridgeport, private company employees (917 | 88.7%), local government employees (56 | 5.4%), and self-employed (not incorporated) (24 | 2.3%) make up the most common classes of employment.
| Employer Class | # Employees | % Employees |
| Private Company Employees | 917 | 88.7% |
| Self-Employed (Incorporated) | 10 | 1.0% |
| Self-Employed (Not Incorporated) | 24 | 2.3% |
| Not-for-profit Organizations | 15 | 1.5% |
| Local Government Employees | 56 | 5.4% |
| State Government Employees | 3 | 0.3% |
| Federal Government Employees | 9 | 0.9% |
| Unpaid Family Workers | 0 | 0.0% |
| Total | 1,034 | 100.0% |
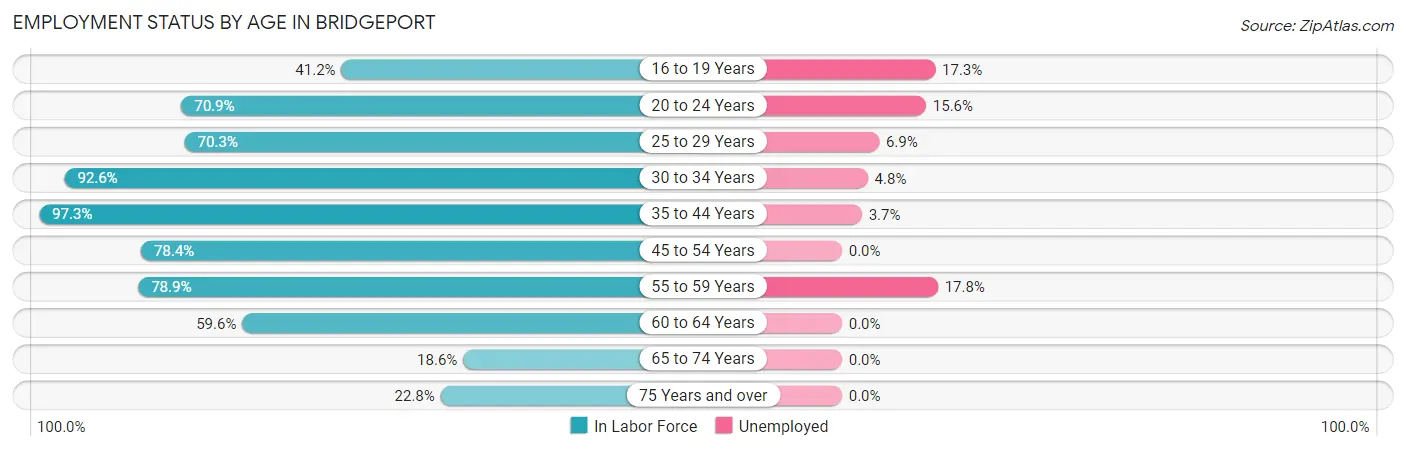
Employment Status by Age in Bridgeport
According to the labor force statistics for Bridgeport, out of the total population over 16 years of age (1,587), 70.6% or 1,120 individuals are in the labor force, with 6.3% or 71 of them unemployed. The age group with the highest labor force participation rate is 35 to 44 years, with 97.3% or 215 individuals in the labor force. Within the labor force, the 55 to 59 years age range has the highest percentage of unemployed individuals, with 17.8% or 18 of them being unemployed.
| Age Bracket | In Labor Force | Unemployed |
| 16 to 19 Years | 75 (41.2%) | 13 (17.3%) |
| 20 to 24 Years | 90 (70.9%) | 14 (15.6%) |
| 25 to 29 Years | 116 (70.3%) | 8 (6.9%) |
| 30 to 34 Years | 189 (92.6%) | 9 (4.8%) |
| 35 to 44 Years | 215 (97.3%) | 8 (3.7%) |
| 45 to 54 Years | 269 (78.4%) | 0 (0.0%) |
| 55 to 59 Years | 101 (78.9%) | 18 (17.8%) |
| 60 to 64 Years | 31 (59.6%) | 0 (0.0%) |
| 65 to 74 Years | 16 (18.6%) | 0 (0.0%) |
| 75 Years and over | 18 (22.8%) | 0 (0.0%) |
| Total | 1,120 (70.6%) | 71 (6.3%) |
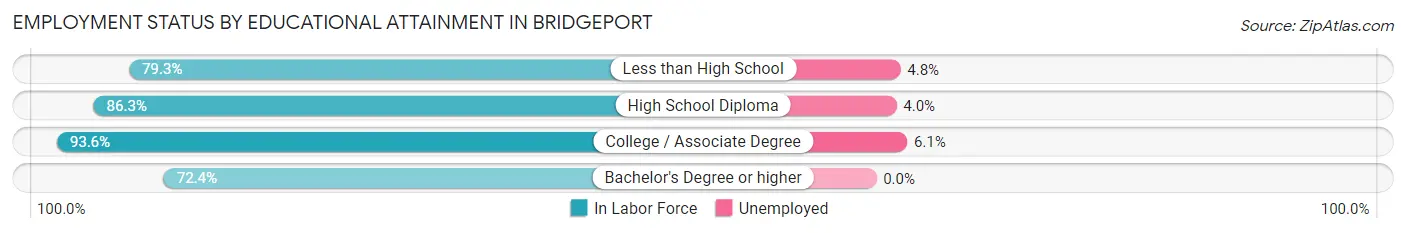
Employment Status by Educational Attainment in Bridgeport
According to labor force statistics for Bridgeport, 82.7% of individuals (920) out of the total population between 25 and 64 years of age (1,113) are in the labor force, with 4.7% or 43 of them being unemployed. The group with the highest labor force participation rate are those with the educational attainment of college / associate degree, with 93.6% or 132 individuals in the labor force. Within the labor force, individuals with college / associate degree education have the highest percentage of unemployment, with 6.1% or 8 of them being unemployed.
| Educational Attainment | In Labor Force | Unemployed |
| Less than High School | 517 (79.3%) | 31 (4.8%) |
| High School Diploma | 251 (86.3%) | 12 (4.0%) |
| College / Associate Degree | 132 (93.6%) | 9 (6.1%) |
| Bachelor's Degree or higher | 21 (72.4%) | 0 (0.0%) |
| Total | 920 (82.7%) | 52 (4.7%) |
Employment Occupations by Sex in Bridgeport
Management, Business, Science and Arts Occupations
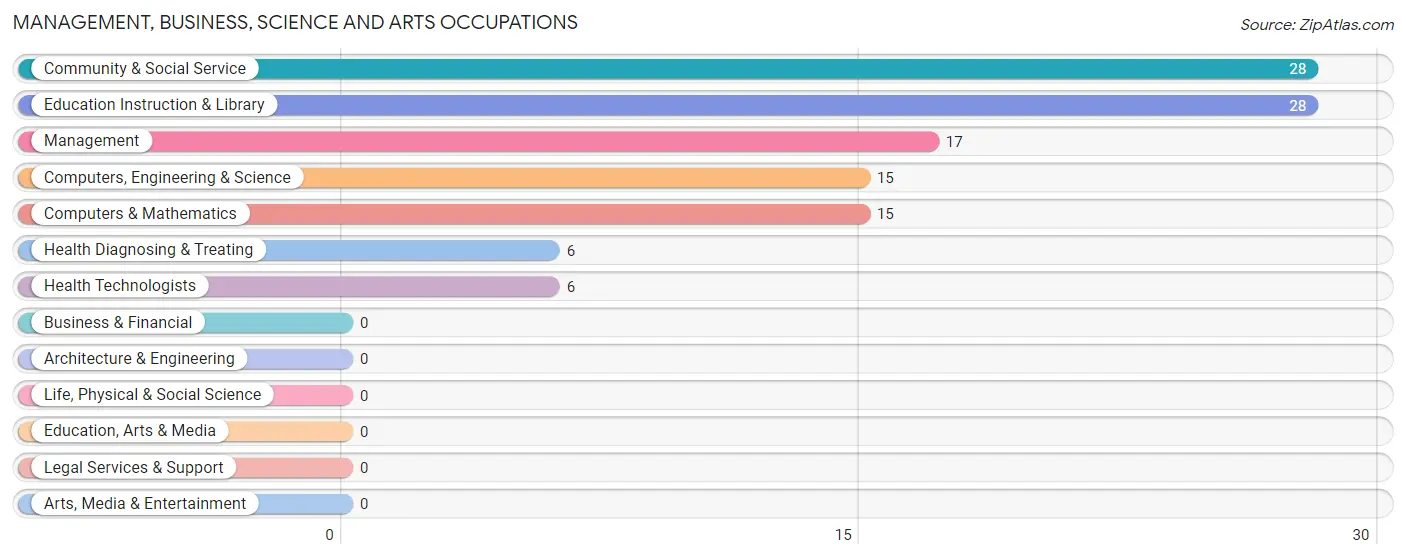
The most common Management, Business, Science and Arts occupations in Bridgeport are Community & Social Service (28 | 2.7%), Education Instruction & Library (28 | 2.7%), Management (17 | 1.6%), Computers, Engineering & Science (15 | 1.4%), and Computers & Mathematics (15 | 1.4%).
Management, Business, Science and Arts Occupations by Sex
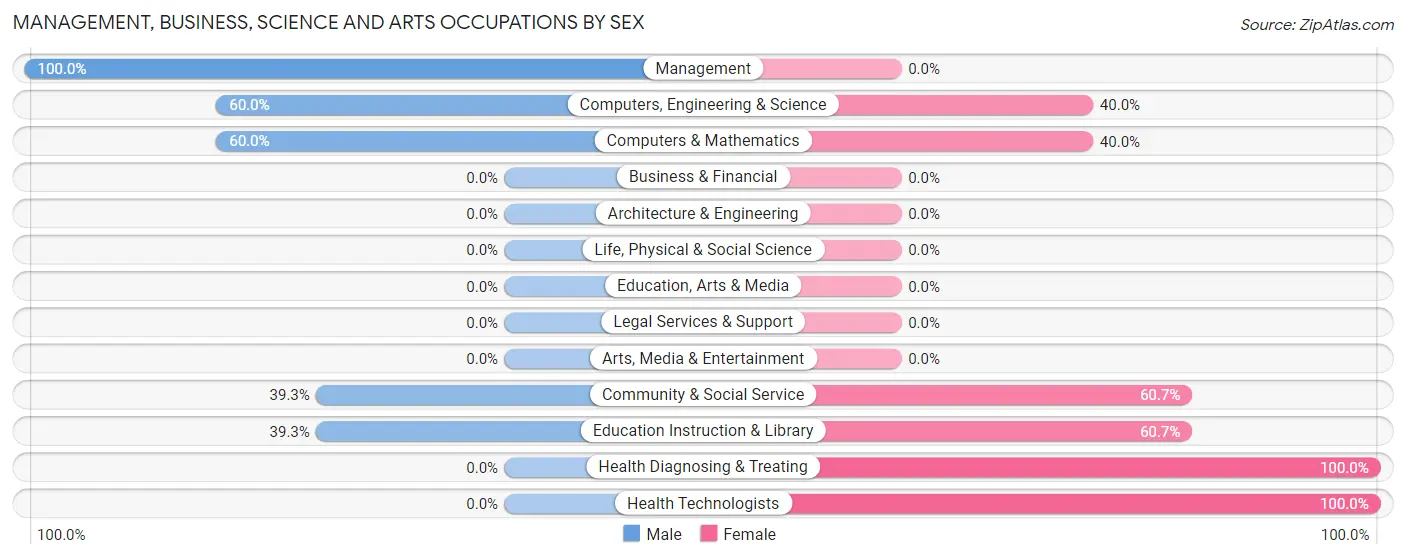
Within the Management, Business, Science and Arts occupations in Bridgeport, the most male-oriented occupations are Management (100.0%), Computers, Engineering & Science (60.0%), and Computers & Mathematics (60.0%), while the most female-oriented occupations are Health Diagnosing & Treating (100.0%), Health Technologists (100.0%), and Community & Social Service (60.7%).
| Occupation | Male | Female |
| Management | 17 (100.0%) | 0 (0.0%) |
| Business & Financial | 0 (0.0%) | 0 (0.0%) |
| Computers, Engineering & Science | 9 (60.0%) | 6 (40.0%) |
| Computers & Mathematics | 9 (60.0%) | 6 (40.0%) |
| Architecture & Engineering | 0 (0.0%) | 0 (0.0%) |
| Life, Physical & Social Science | 0 (0.0%) | 0 (0.0%) |
| Community & Social Service | 11 (39.3%) | 17 (60.7%) |
| Education, Arts & Media | 0 (0.0%) | 0 (0.0%) |
| Legal Services & Support | 0 (0.0%) | 0 (0.0%) |
| Education Instruction & Library | 11 (39.3%) | 17 (60.7%) |
| Arts, Media & Entertainment | 0 (0.0%) | 0 (0.0%) |
| Health Diagnosing & Treating | 0 (0.0%) | 6 (100.0%) |
| Health Technologists | 0 (0.0%) | 6 (100.0%) |
| Total (Category) | 37 (56.1%) | 29 (43.9%) |
| Total (Overall) | 613 (58.4%) | 437 (41.6%) |
Services Occupations
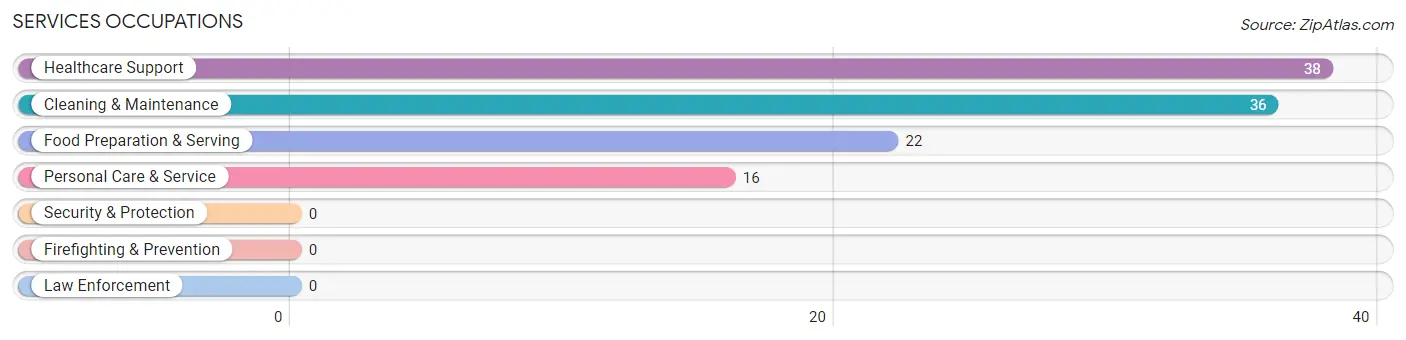
The most common Services occupations in Bridgeport are Healthcare Support (38 | 3.6%), Cleaning & Maintenance (36 | 3.4%), Food Preparation & Serving (22 | 2.1%), and Personal Care & Service (16 | 1.5%).
Services Occupations by Sex
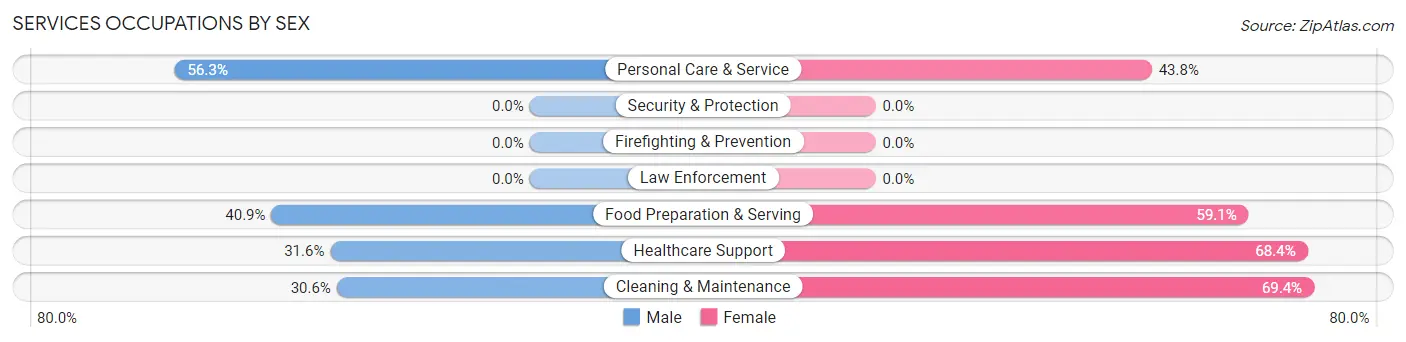
Within the Services occupations in Bridgeport, the most male-oriented occupations are Personal Care & Service (56.2%), Food Preparation & Serving (40.9%), and Healthcare Support (31.6%), while the most female-oriented occupations are Cleaning & Maintenance (69.4%), Healthcare Support (68.4%), and Food Preparation & Serving (59.1%).
| Occupation | Male | Female |
| Healthcare Support | 12 (31.6%) | 26 (68.4%) |
| Security & Protection | 0 (0.0%) | 0 (0.0%) |
| Firefighting & Prevention | 0 (0.0%) | 0 (0.0%) |
| Law Enforcement | 0 (0.0%) | 0 (0.0%) |
| Food Preparation & Serving | 9 (40.9%) | 13 (59.1%) |
| Cleaning & Maintenance | 11 (30.6%) | 25 (69.4%) |
| Personal Care & Service | 9 (56.2%) | 7 (43.8%) |
| Total (Category) | 41 (36.6%) | 71 (63.4%) |
| Total (Overall) | 613 (58.4%) | 437 (41.6%) |
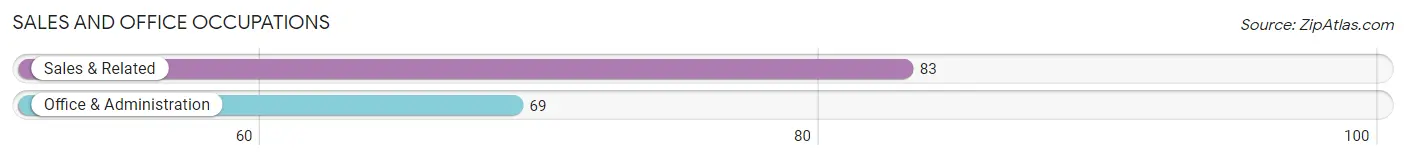
Sales and Office Occupations
The most common Sales and Office occupations in Bridgeport are Sales & Related (83 | 7.9%), and Office & Administration (69 | 6.6%).
Sales and Office Occupations by Sex
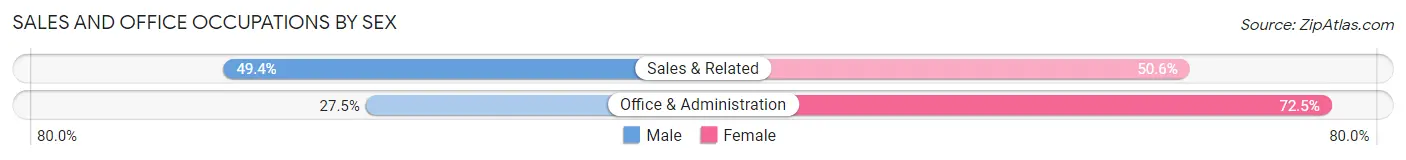
| Occupation | Male | Female |
| Sales & Related | 41 (49.4%) | 42 (50.6%) |
| Office & Administration | 19 (27.5%) | 50 (72.5%) |
| Total (Category) | 60 (39.5%) | 92 (60.5%) |
| Total (Overall) | 613 (58.4%) | 437 (41.6%) |
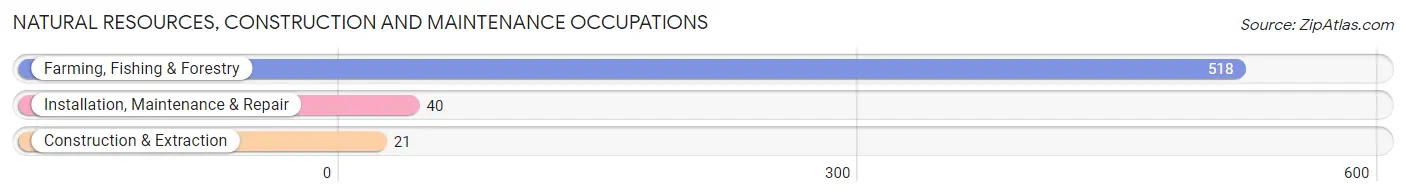
Natural Resources, Construction and Maintenance Occupations
The most common Natural Resources, Construction and Maintenance occupations in Bridgeport are Farming, Fishing & Forestry (518 | 49.3%), Installation, Maintenance & Repair (40 | 3.8%), and Construction & Extraction (21 | 2.0%).
Natural Resources, Construction and Maintenance Occupations by Sex
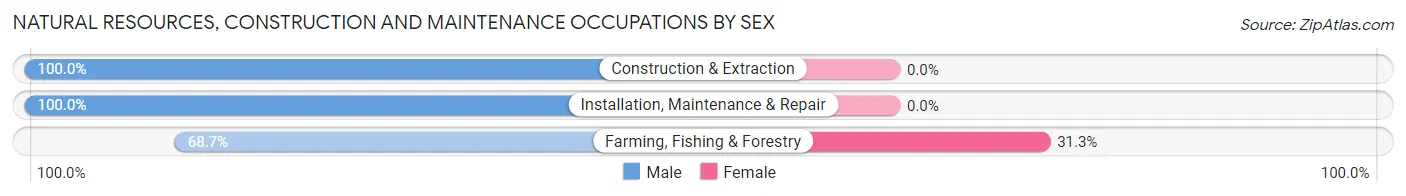
| Occupation | Male | Female |
| Farming, Fishing & Forestry | 356 (68.7%) | 162 (31.3%) |
| Construction & Extraction | 21 (100.0%) | 0 (0.0%) |
| Installation, Maintenance & Repair | 40 (100.0%) | 0 (0.0%) |
| Total (Category) | 417 (72.0%) | 162 (28.0%) |
| Total (Overall) | 613 (58.4%) | 437 (41.6%) |
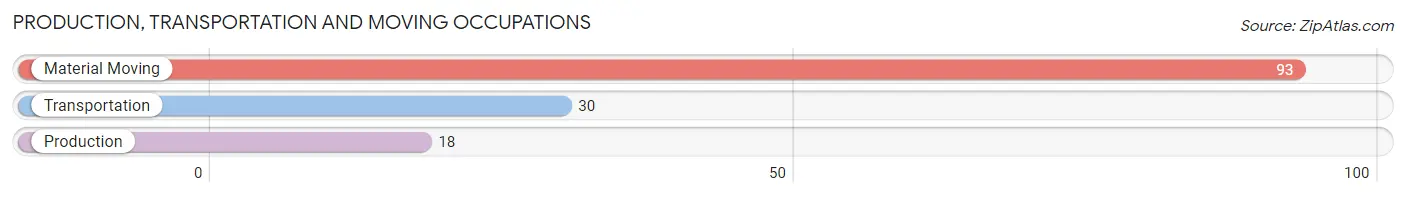
Production, Transportation and Moving Occupations
The most common Production, Transportation and Moving occupations in Bridgeport are Material Moving (93 | 8.9%), Transportation (30 | 2.9%), and Production (18 | 1.7%).
Production, Transportation and Moving Occupations by Sex
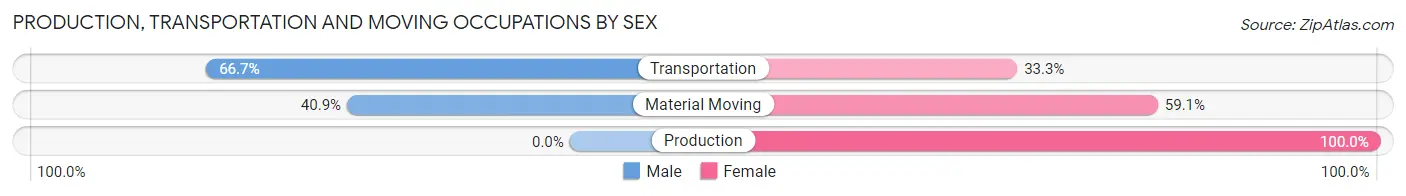
| Occupation | Male | Female |
| Production | 0 (0.0%) | 18 (100.0%) |
| Transportation | 20 (66.7%) | 10 (33.3%) |
| Material Moving | 38 (40.9%) | 55 (59.1%) |
| Total (Category) | 58 (41.1%) | 83 (58.9%) |
| Total (Overall) | 613 (58.4%) | 437 (41.6%) |
Employment Industries by Sex in Bridgeport
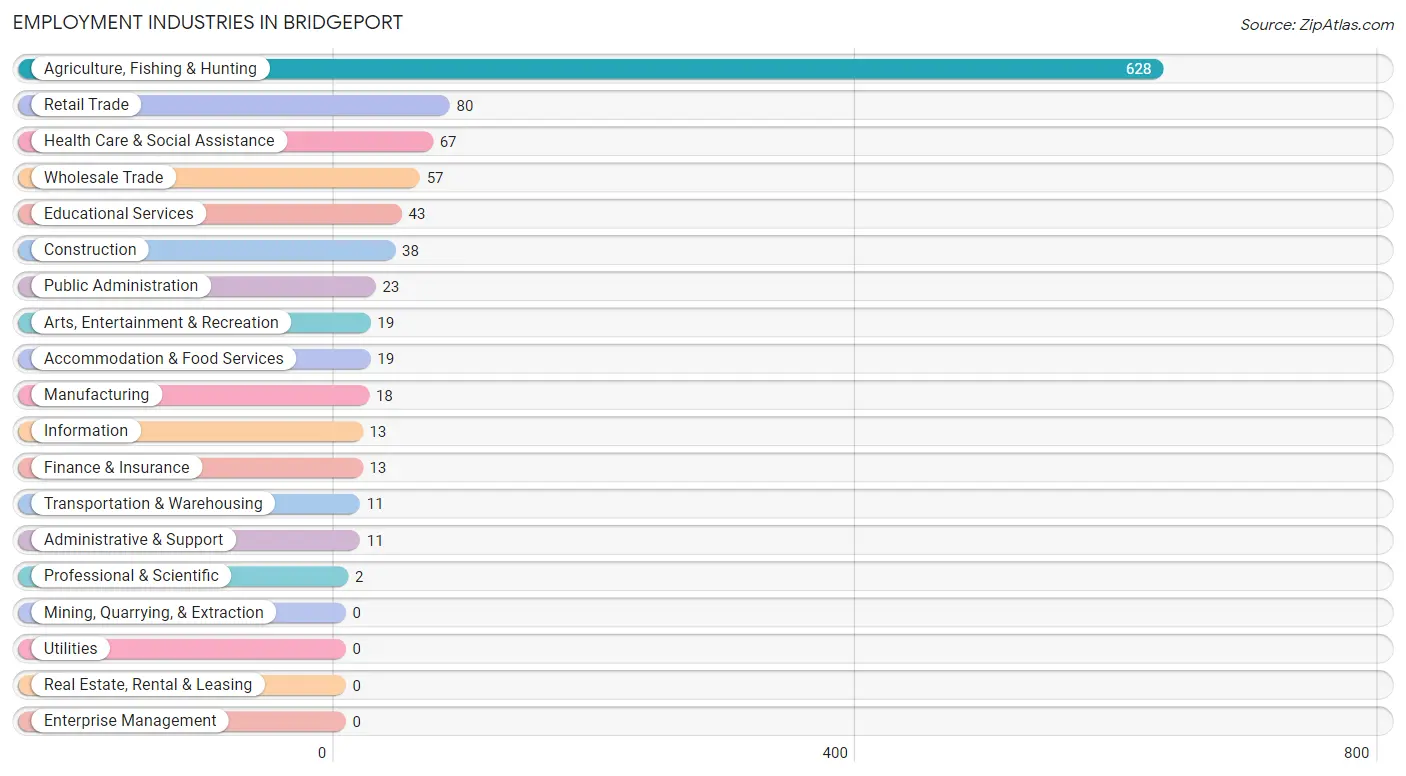
Employment Industries in Bridgeport
The major employment industries in Bridgeport include Agriculture, Fishing & Hunting (628 | 59.8%), Retail Trade (80 | 7.6%), Health Care & Social Assistance (67 | 6.4%), Wholesale Trade (57 | 5.4%), and Educational Services (43 | 4.1%).
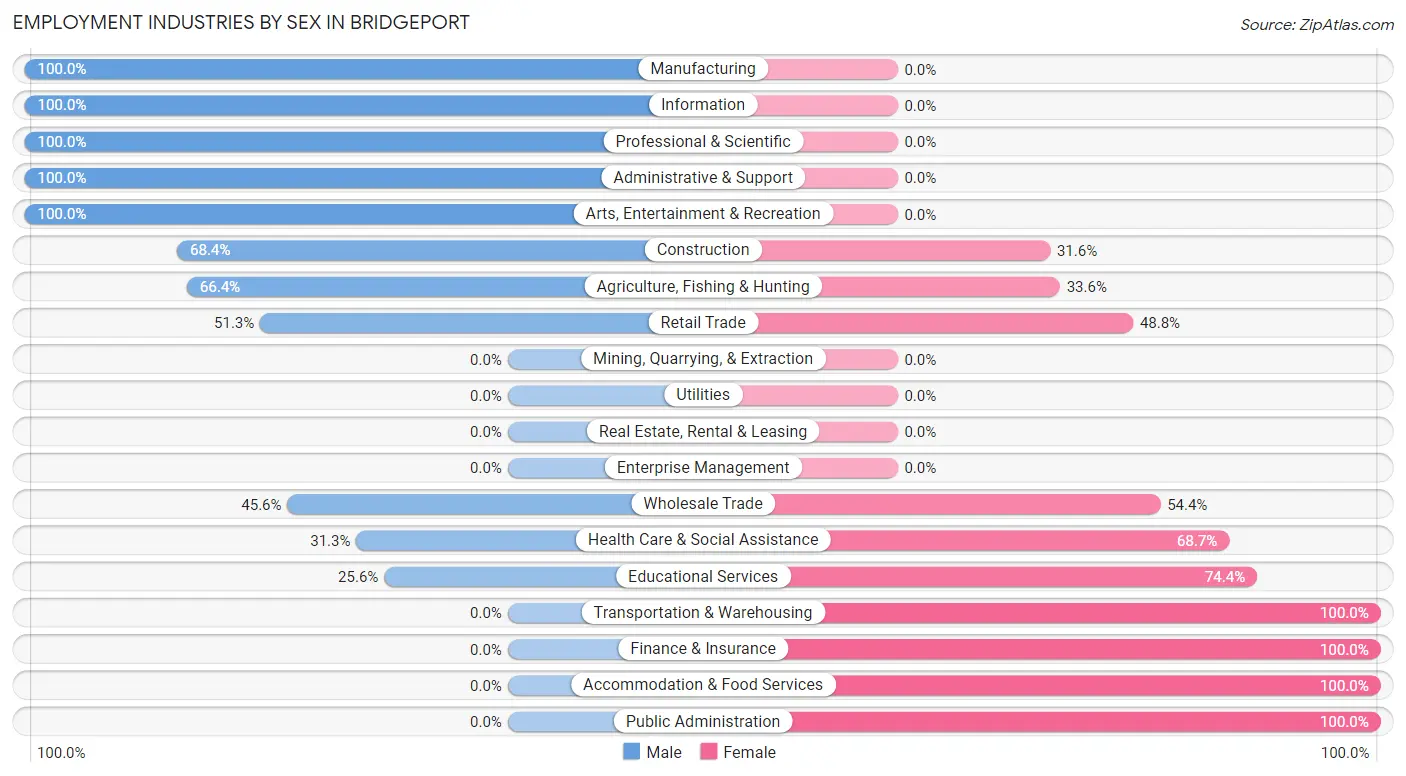
Employment Industries by Sex in Bridgeport
The Bridgeport industries that see more men than women are Manufacturing (100.0%), Information (100.0%), and Professional & Scientific (100.0%), whereas the industries that tend to have a higher number of women are Transportation & Warehousing (100.0%), Finance & Insurance (100.0%), and Accommodation & Food Services (100.0%).
| Industry | Male | Female |
| Agriculture, Fishing & Hunting | 417 (66.4%) | 211 (33.6%) |
| Mining, Quarrying, & Extraction | 0 (0.0%) | 0 (0.0%) |
| Construction | 26 (68.4%) | 12 (31.6%) |
| Manufacturing | 18 (100.0%) | 0 (0.0%) |
| Wholesale Trade | 26 (45.6%) | 31 (54.4%) |
| Retail Trade | 41 (51.2%) | 39 (48.7%) |
| Transportation & Warehousing | 0 (0.0%) | 11 (100.0%) |
| Utilities | 0 (0.0%) | 0 (0.0%) |
| Information | 13 (100.0%) | 0 (0.0%) |
| Finance & Insurance | 0 (0.0%) | 13 (100.0%) |
| Real Estate, Rental & Leasing | 0 (0.0%) | 0 (0.0%) |
| Professional & Scientific | 2 (100.0%) | 0 (0.0%) |
| Enterprise Management | 0 (0.0%) | 0 (0.0%) |
| Administrative & Support | 11 (100.0%) | 0 (0.0%) |
| Educational Services | 11 (25.6%) | 32 (74.4%) |
| Health Care & Social Assistance | 21 (31.3%) | 46 (68.7%) |
| Arts, Entertainment & Recreation | 19 (100.0%) | 0 (0.0%) |
| Accommodation & Food Services | 0 (0.0%) | 19 (100.0%) |
| Public Administration | 0 (0.0%) | 23 (100.0%) |
| Total | 613 (58.4%) | 437 (41.6%) |
Education in Bridgeport
School Enrollment in Bridgeport
The most common levels of schooling among the 704 students in Bridgeport are elementary school (228 | 32.4%), middle school (195 | 27.7%), and high school (181 | 25.7%).
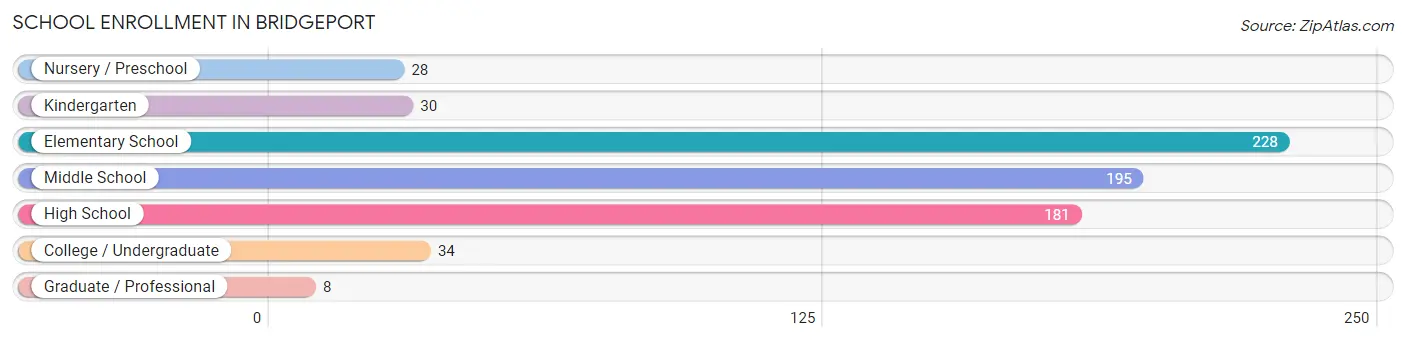
| School Level | # Students | % Students |
| Nursery / Preschool | 28 | 4.0% |
| Kindergarten | 30 | 4.3% |
| Elementary School | 228 | 32.4% |
| Middle School | 195 | 27.7% |
| High School | 181 | 25.7% |
| College / Undergraduate | 34 | 4.8% |
| Graduate / Professional | 8 | 1.1% |
| Total | 704 | 100.0% |
School Enrollment by Age by Funding Source in Bridgeport
Out of a total of 704 students who are enrolled in schools in Bridgeport, 42 (6.0%) attend a private institution, while the remaining 662 (94.0%) are enrolled in public schools. The age group of 25 to 34 year olds has the highest likelihood of being enrolled in private schools, with 8 (100.0% in the age bracket) enrolled. Conversely, the age group of 3 to 4 year olds has the lowest likelihood of being enrolled in a private school, with 28 (100.0% in the age bracket) attending a public institution.
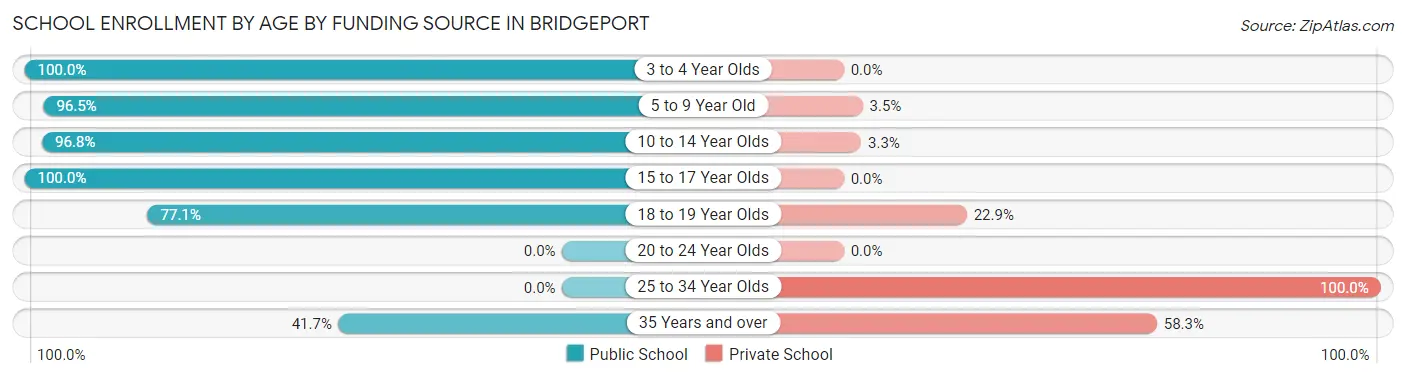
| Age Bracket | Public School | Private School |
| 3 to 4 Year Olds | 28 (100.0%) | 0 (0.0%) |
| 5 to 9 Year Old | 219 (96.5%) | 8 (3.5%) |
| 10 to 14 Year Olds | 238 (96.8%) | 8 (3.3%) |
| 15 to 17 Year Olds | 135 (100.0%) | 0 (0.0%) |
| 18 to 19 Year Olds | 37 (77.1%) | 11 (22.9%) |
| 20 to 24 Year Olds | 0 (0.0%) | 0 (0.0%) |
| 25 to 34 Year Olds | 0 (0.0%) | 8 (100.0%) |
| 35 Years and over | 5 (41.7%) | 7 (58.3%) |
| Total | 662 (94.0%) | 42 (6.0%) |
Educational Attainment by Field of Study in Bridgeport
Literature & languages (11 | 29.7%), psychology (8 | 21.6%), business (8 | 21.6%), arts & humanities (7 | 18.9%), and education (3 | 8.1%) are the most common fields of study among 37 individuals in Bridgeport who have obtained a bachelor's degree or higher.
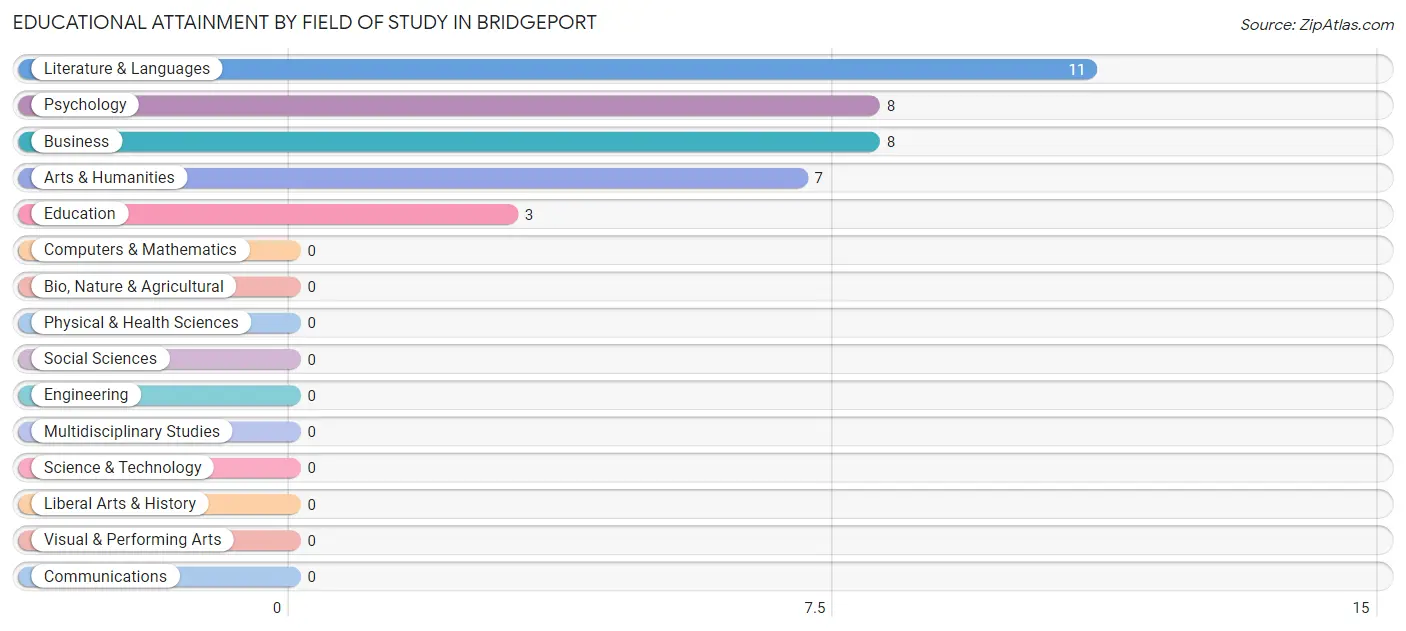
| Field of Study | # Graduates | % Graduates |
| Computers & Mathematics | 0 | 0.0% |
| Bio, Nature & Agricultural | 0 | 0.0% |
| Physical & Health Sciences | 0 | 0.0% |
| Psychology | 8 | 21.6% |
| Social Sciences | 0 | 0.0% |
| Engineering | 0 | 0.0% |
| Multidisciplinary Studies | 0 | 0.0% |
| Science & Technology | 0 | 0.0% |
| Business | 8 | 21.6% |
| Education | 3 | 8.1% |
| Literature & Languages | 11 | 29.7% |
| Liberal Arts & History | 0 | 0.0% |
| Visual & Performing Arts | 0 | 0.0% |
| Communications | 0 | 0.0% |
| Arts & Humanities | 7 | 18.9% |
| Total | 37 | 100.0% |
Transportation & Commute in Bridgeport
Vehicle Availability by Sex in Bridgeport
The most prevalent vehicle ownership categories in Bridgeport are males with 2 vehicles (222, accounting for 36.4%) and females with 2 vehicles (171, making up 52.4%).
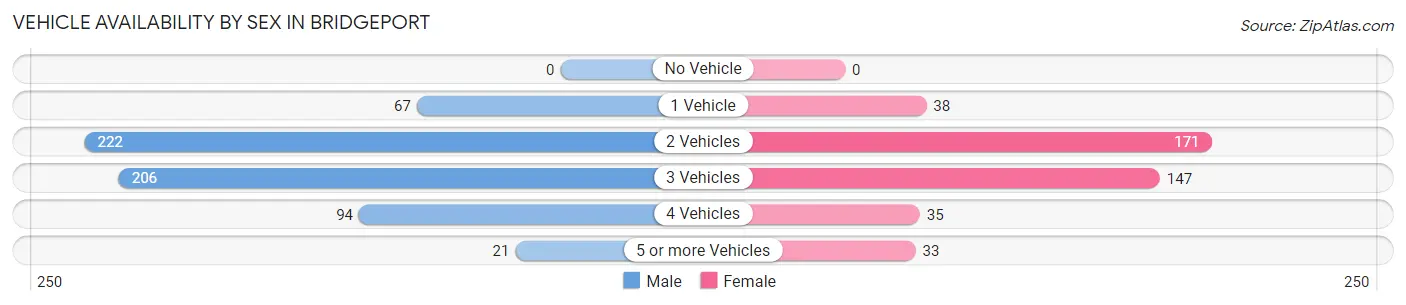
| Vehicles Available | Male | Female |
| No Vehicle | 0 (0.0%) | 0 (0.0%) |
| 1 Vehicle | 67 (11.0%) | 38 (9.0%) |
| 2 Vehicles | 222 (36.4%) | 171 (40.3%) |
| 3 Vehicles | 206 (33.8%) | 147 (34.7%) |
| 4 Vehicles | 94 (15.4%) | 35 (8.3%) |
| 5 or more Vehicles | 21 (3.4%) | 33 (7.8%) |
| Total | 610 (100.0%) | 424 (100.0%) |
Commute Time in Bridgeport
The most frequently occuring commute durations in Bridgeport are 30 to 34 minutes (203 commuters, 19.9%), 15 to 19 minutes (179 commuters, 17.6%), and 5 to 9 minutes (127 commuters, 12.5%).
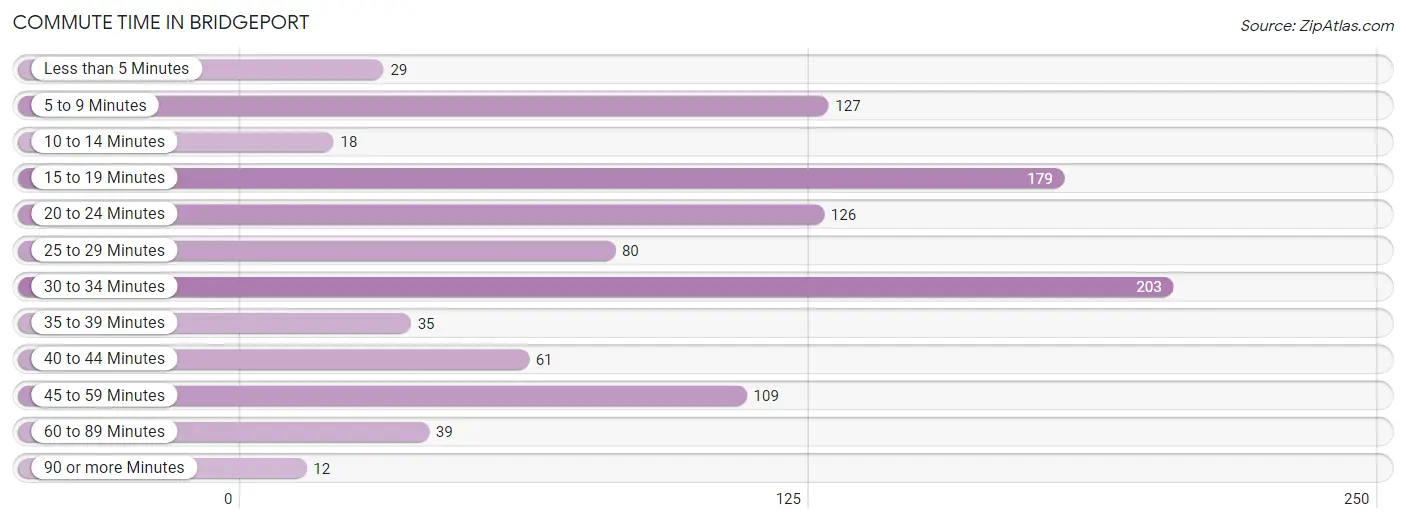
| Commute Time | # Commuters | % Commuters |
| Less than 5 Minutes | 29 | 2.9% |
| 5 to 9 Minutes | 127 | 12.5% |
| 10 to 14 Minutes | 18 | 1.8% |
| 15 to 19 Minutes | 179 | 17.6% |
| 20 to 24 Minutes | 126 | 12.4% |
| 25 to 29 Minutes | 80 | 7.9% |
| 30 to 34 Minutes | 203 | 19.9% |
| 35 to 39 Minutes | 35 | 3.4% |
| 40 to 44 Minutes | 61 | 6.0% |
| 45 to 59 Minutes | 109 | 10.7% |
| 60 to 89 Minutes | 39 | 3.8% |
| 90 or more Minutes | 12 | 1.2% |
Commute Time by Sex in Bridgeport
The most common commute times in Bridgeport are 15 to 19 minutes (152 commuters, 25.3%) for males and 30 to 34 minutes (94 commuters, 22.5%) for females.
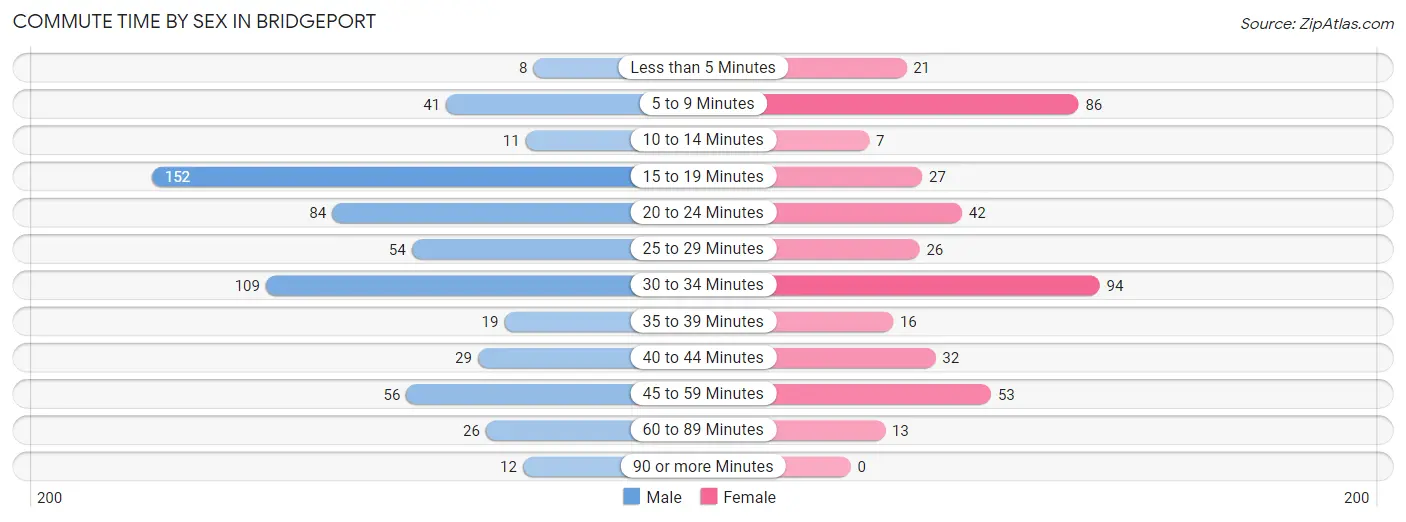
| Commute Time | Male | Female |
| Less than 5 Minutes | 8 (1.3%) | 21 (5.0%) |
| 5 to 9 Minutes | 41 (6.8%) | 86 (20.6%) |
| 10 to 14 Minutes | 11 (1.8%) | 7 (1.7%) |
| 15 to 19 Minutes | 152 (25.3%) | 27 (6.5%) |
| 20 to 24 Minutes | 84 (14.0%) | 42 (10.1%) |
| 25 to 29 Minutes | 54 (9.0%) | 26 (6.2%) |
| 30 to 34 Minutes | 109 (18.1%) | 94 (22.5%) |
| 35 to 39 Minutes | 19 (3.2%) | 16 (3.8%) |
| 40 to 44 Minutes | 29 (4.8%) | 32 (7.7%) |
| 45 to 59 Minutes | 56 (9.3%) | 53 (12.7%) |
| 60 to 89 Minutes | 26 (4.3%) | 13 (3.1%) |
| 90 or more Minutes | 12 (2.0%) | 0 (0.0%) |
Time of Departure to Work by Sex in Bridgeport
The most frequent times of departure to work in Bridgeport are 6:30 AM to 6:59 AM (153, 25.5%) for males and 12:00 AM to 4:59 AM (71, 17.0%) for females.
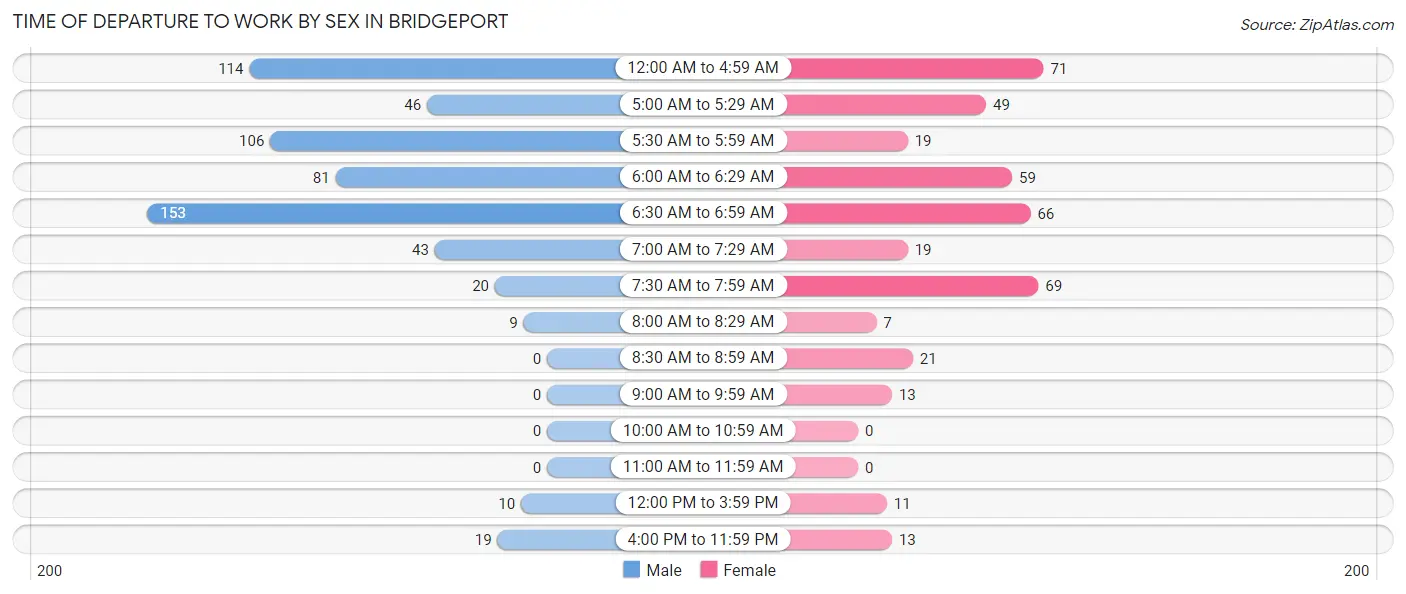
| Time of Departure | Male | Female |
| 12:00 AM to 4:59 AM | 114 (19.0%) | 71 (17.0%) |
| 5:00 AM to 5:29 AM | 46 (7.6%) | 49 (11.7%) |
| 5:30 AM to 5:59 AM | 106 (17.6%) | 19 (4.6%) |
| 6:00 AM to 6:29 AM | 81 (13.5%) | 59 (14.1%) |
| 6:30 AM to 6:59 AM | 153 (25.5%) | 66 (15.8%) |
| 7:00 AM to 7:29 AM | 43 (7.1%) | 19 (4.6%) |
| 7:30 AM to 7:59 AM | 20 (3.3%) | 69 (16.6%) |
| 8:00 AM to 8:29 AM | 9 (1.5%) | 7 (1.7%) |
| 8:30 AM to 8:59 AM | 0 (0.0%) | 21 (5.0%) |
| 9:00 AM to 9:59 AM | 0 (0.0%) | 13 (3.1%) |
| 10:00 AM to 10:59 AM | 0 (0.0%) | 0 (0.0%) |
| 11:00 AM to 11:59 AM | 0 (0.0%) | 0 (0.0%) |
| 12:00 PM to 3:59 PM | 10 (1.7%) | 11 (2.6%) |
| 4:00 PM to 11:59 PM | 19 (3.2%) | 13 (3.1%) |
| Total | 601 (100.0%) | 417 (100.0%) |
Housing Occupancy in Bridgeport
Occupancy by Ownership in Bridgeport
Of the total 685 dwellings in Bridgeport, owner-occupied units account for 429 (62.6%), while renter-occupied units make up 256 (37.4%).
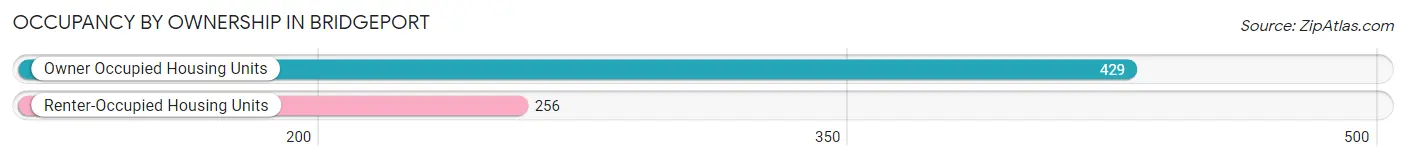
| Occupancy | # Housing Units | % Housing Units |
| Owner Occupied Housing Units | 429 | 62.6% |
| Renter-Occupied Housing Units | 256 | 37.4% |
| Total Occupied Housing Units | 685 | 100.0% |
Occupancy by Household Size in Bridgeport
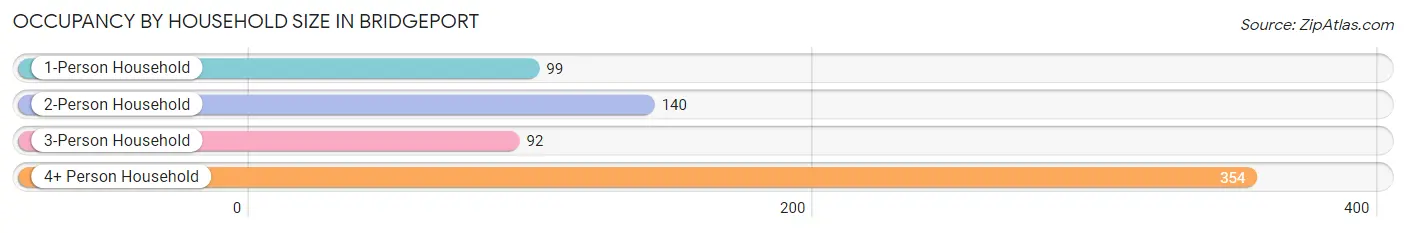
| Household Size | # Housing Units | % Housing Units |
| 1-Person Household | 99 | 14.4% |
| 2-Person Household | 140 | 20.4% |
| 3-Person Household | 92 | 13.4% |
| 4+ Person Household | 354 | 51.7% |
| Total Housing Units | 685 | 100.0% |
Occupancy by Ownership by Household Size in Bridgeport
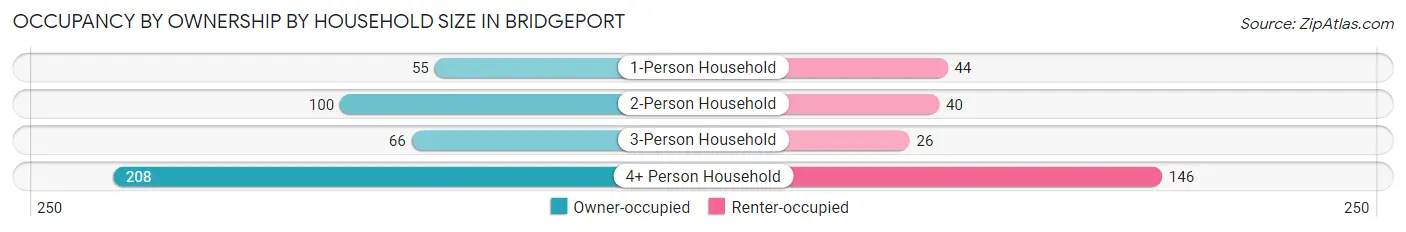
| Household Size | Owner-occupied | Renter-occupied |
| 1-Person Household | 55 (55.6%) | 44 (44.4%) |
| 2-Person Household | 100 (71.4%) | 40 (28.6%) |
| 3-Person Household | 66 (71.7%) | 26 (28.3%) |
| 4+ Person Household | 208 (58.8%) | 146 (41.2%) |
| Total Housing Units | 429 (62.6%) | 256 (37.4%) |
Occupancy by Educational Attainment in Bridgeport
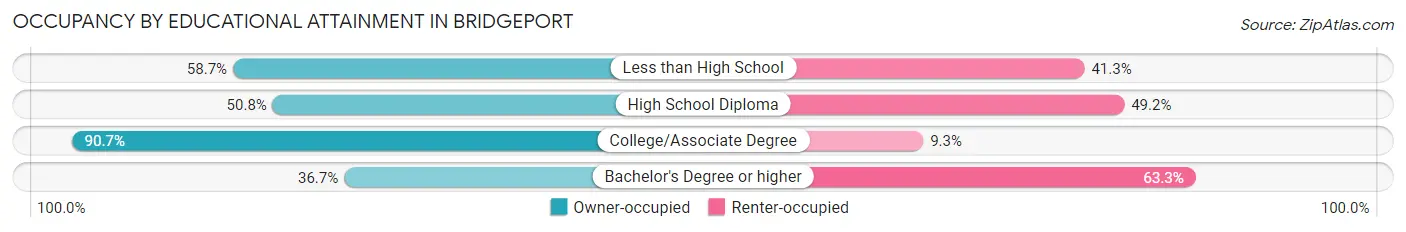
| Household Size | Owner-occupied | Renter-occupied |
| Less than High School | 189 (58.7%) | 133 (41.3%) |
| High School Diploma | 93 (50.8%) | 90 (49.2%) |
| College/Associate Degree | 136 (90.7%) | 14 (9.3%) |
| Bachelor's Degree or higher | 11 (36.7%) | 19 (63.3%) |
Occupancy by Age of Householder in Bridgeport
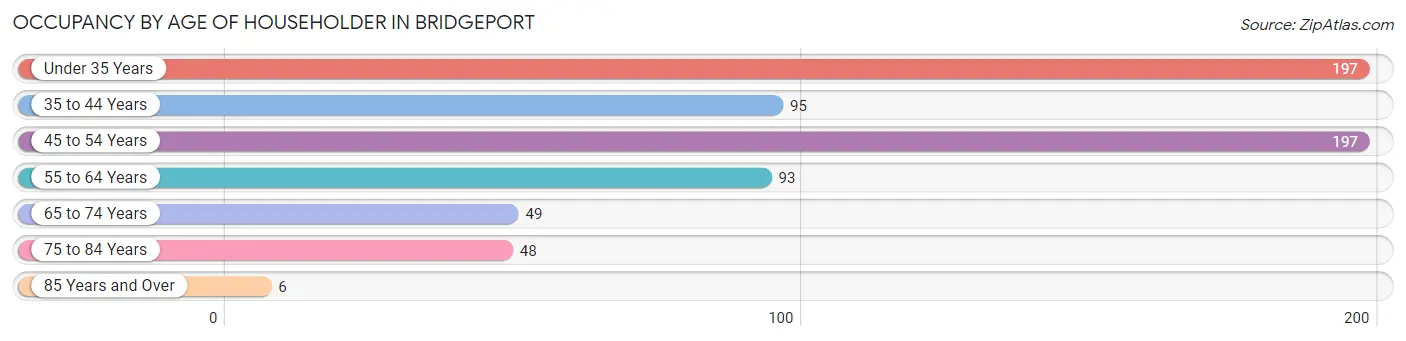
| Age Bracket | # Households | % Households |
| Under 35 Years | 197 | 28.8% |
| 35 to 44 Years | 95 | 13.9% |
| 45 to 54 Years | 197 | 28.8% |
| 55 to 64 Years | 93 | 13.6% |
| 65 to 74 Years | 49 | 7.1% |
| 75 to 84 Years | 48 | 7.0% |
| 85 Years and Over | 6 | 0.9% |
| Total | 685 | 100.0% |
Housing Finances in Bridgeport
Median Income by Occupancy in Bridgeport
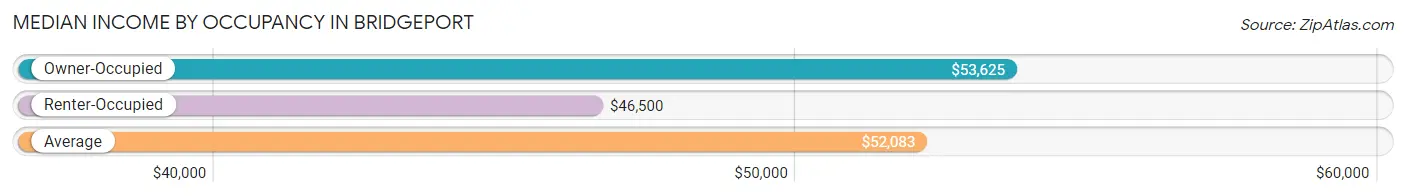
| Occupancy Type | # Households | Median Income |
| Owner-Occupied | 429 (62.6%) | $53,625 |
| Renter-Occupied | 256 (37.4%) | $46,500 |
| Average | 685 (100.0%) | $52,083 |
Occupancy by Householder Income Bracket in Bridgeport
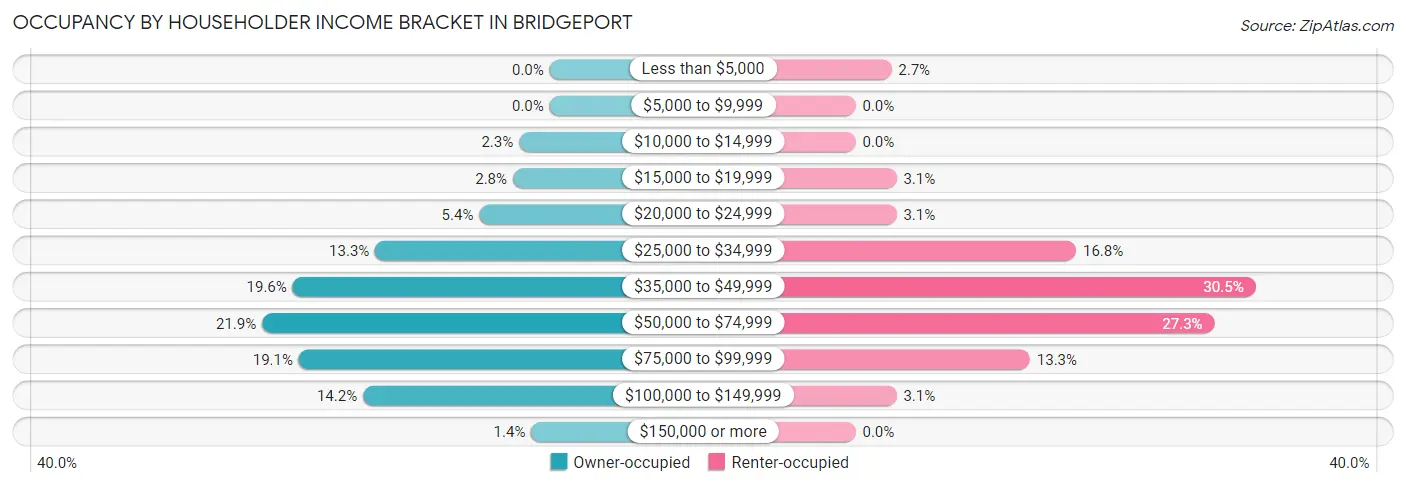
| Income Bracket | Owner-occupied | Renter-occupied |
| Less than $5,000 | 0 (0.0%) | 7 (2.7%) |
| $5,000 to $9,999 | 0 (0.0%) | 0 (0.0%) |
| $10,000 to $14,999 | 10 (2.3%) | 0 (0.0%) |
| $15,000 to $19,999 | 12 (2.8%) | 8 (3.1%) |
| $20,000 to $24,999 | 23 (5.4%) | 8 (3.1%) |
| $25,000 to $34,999 | 57 (13.3%) | 43 (16.8%) |
| $35,000 to $49,999 | 84 (19.6%) | 78 (30.5%) |
| $50,000 to $74,999 | 94 (21.9%) | 70 (27.3%) |
| $75,000 to $99,999 | 82 (19.1%) | 34 (13.3%) |
| $100,000 to $149,999 | 61 (14.2%) | 8 (3.1%) |
| $150,000 or more | 6 (1.4%) | 0 (0.0%) |
| Total | 429 (100.0%) | 256 (100.0%) |
Monthly Housing Cost Tiers in Bridgeport
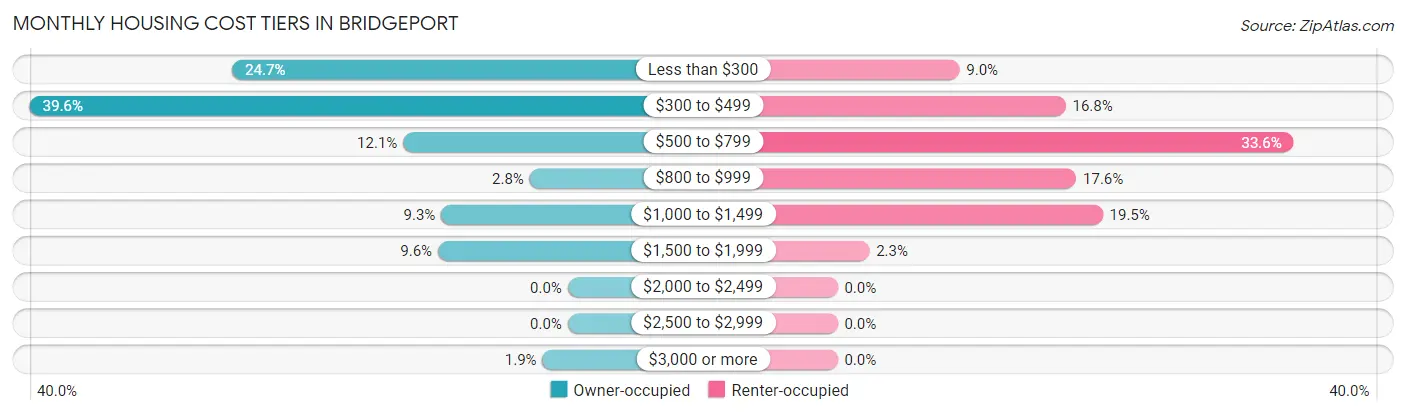
| Monthly Cost | Owner-occupied | Renter-occupied |
| Less than $300 | 106 (24.7%) | 23 (9.0%) |
| $300 to $499 | 170 (39.6%) | 43 (16.8%) |
| $500 to $799 | 52 (12.1%) | 86 (33.6%) |
| $800 to $999 | 12 (2.8%) | 45 (17.6%) |
| $1,000 to $1,499 | 40 (9.3%) | 50 (19.5%) |
| $1,500 to $1,999 | 41 (9.6%) | 6 (2.3%) |
| $2,000 to $2,499 | 0 (0.0%) | 0 (0.0%) |
| $2,500 to $2,999 | 0 (0.0%) | 0 (0.0%) |
| $3,000 or more | 8 (1.9%) | 0 (0.0%) |
| Total | 429 (100.0%) | 256 (100.0%) |
Physical Housing Characteristics in Bridgeport
Housing Structures in Bridgeport
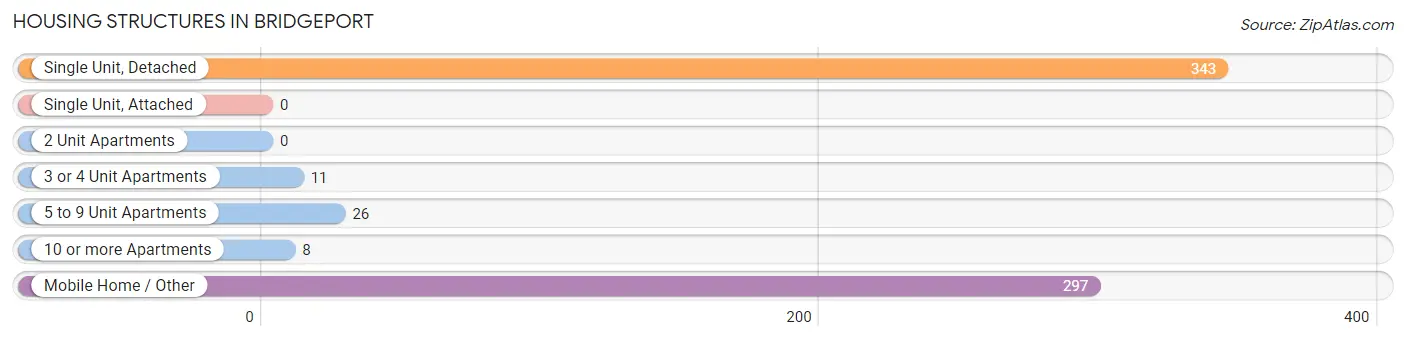
| Structure Type | # Housing Units | % Housing Units |
| Single Unit, Detached | 343 | 50.1% |
| Single Unit, Attached | 0 | 0.0% |
| 2 Unit Apartments | 0 | 0.0% |
| 3 or 4 Unit Apartments | 11 | 1.6% |
| 5 to 9 Unit Apartments | 26 | 3.8% |
| 10 or more Apartments | 8 | 1.2% |
| Mobile Home / Other | 297 | 43.4% |
| Total | 685 | 100.0% |
Housing Structures by Occupancy in Bridgeport
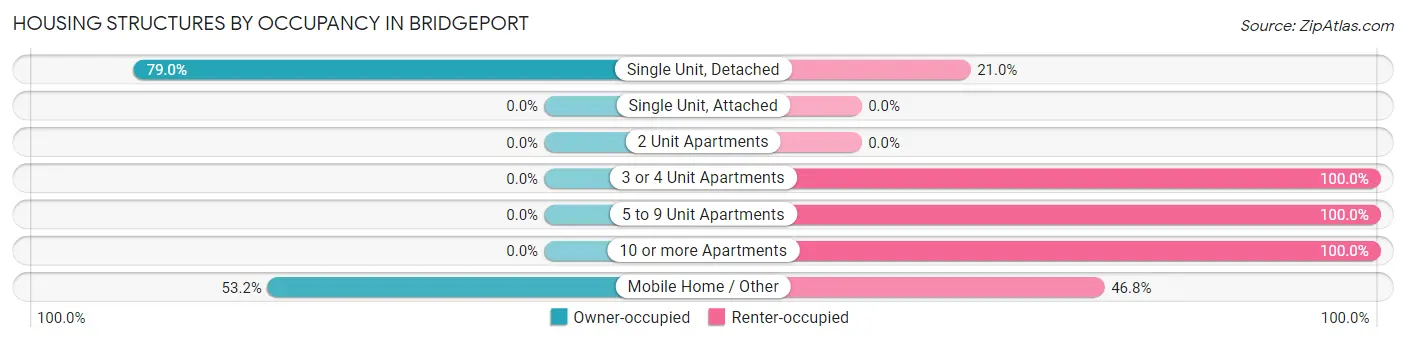
| Structure Type | Owner-occupied | Renter-occupied |
| Single Unit, Detached | 271 (79.0%) | 72 (21.0%) |
| Single Unit, Attached | 0 (0.0%) | 0 (0.0%) |
| 2 Unit Apartments | 0 (0.0%) | 0 (0.0%) |
| 3 or 4 Unit Apartments | 0 (0.0%) | 11 (100.0%) |
| 5 to 9 Unit Apartments | 0 (0.0%) | 26 (100.0%) |
| 10 or more Apartments | 0 (0.0%) | 8 (100.0%) |
| Mobile Home / Other | 158 (53.2%) | 139 (46.8%) |
| Total | 429 (62.6%) | 256 (37.4%) |
Housing Structures by Number of Rooms in Bridgeport
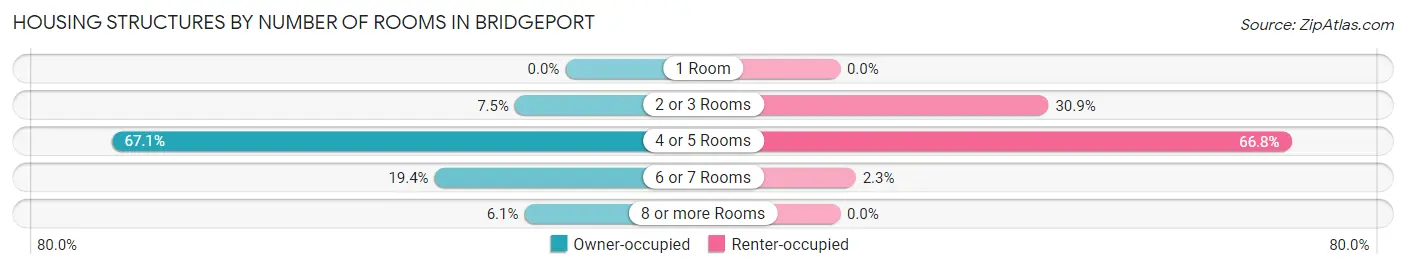
| Number of Rooms | Owner-occupied | Renter-occupied |
| 1 Room | 0 (0.0%) | 0 (0.0%) |
| 2 or 3 Rooms | 32 (7.5%) | 79 (30.9%) |
| 4 or 5 Rooms | 288 (67.1%) | 171 (66.8%) |
| 6 or 7 Rooms | 83 (19.4%) | 6 (2.3%) |
| 8 or more Rooms | 26 (6.1%) | 0 (0.0%) |
| Total | 429 (100.0%) | 256 (100.0%) |
Housing Structure by Heating Type in Bridgeport
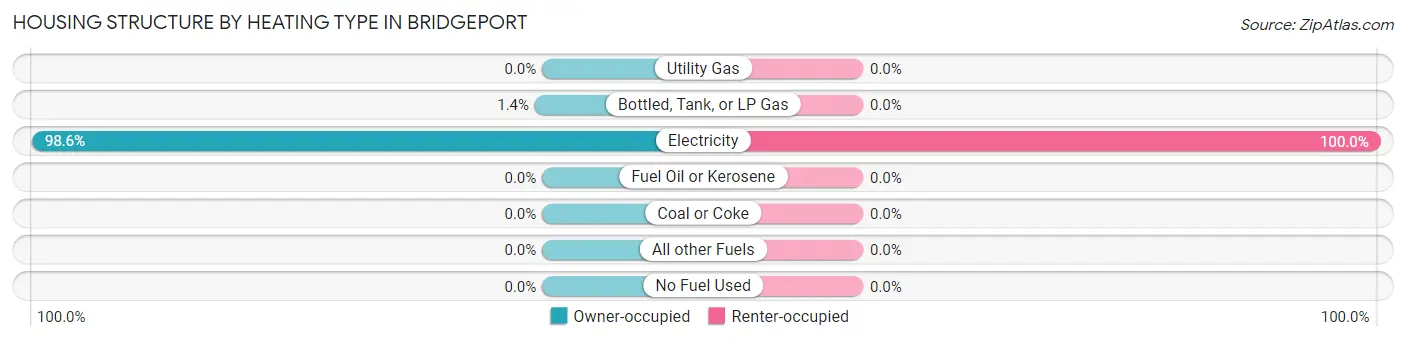
| Heating Type | Owner-occupied | Renter-occupied |
| Utility Gas | 0 (0.0%) | 0 (0.0%) |
| Bottled, Tank, or LP Gas | 6 (1.4%) | 0 (0.0%) |
| Electricity | 423 (98.6%) | 256 (100.0%) |
| Fuel Oil or Kerosene | 0 (0.0%) | 0 (0.0%) |
| Coal or Coke | 0 (0.0%) | 0 (0.0%) |
| All other Fuels | 0 (0.0%) | 0 (0.0%) |
| No Fuel Used | 0 (0.0%) | 0 (0.0%) |
| Total | 429 (100.0%) | 256 (100.0%) |
Household Vehicle Usage in Bridgeport
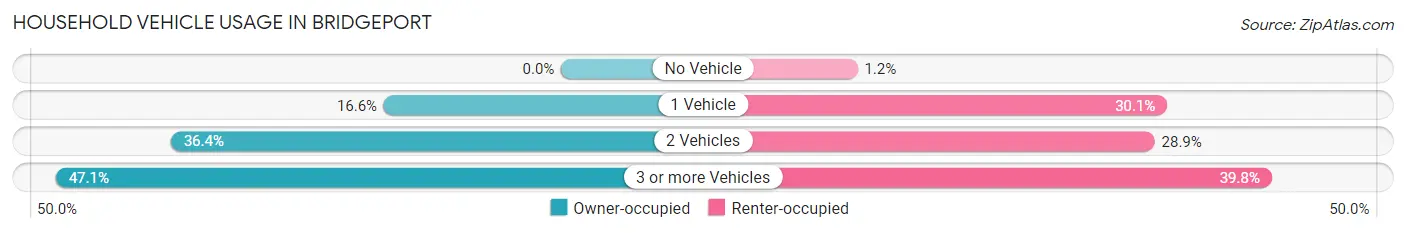
| Vehicles per Household | Owner-occupied | Renter-occupied |
| No Vehicle | 0 (0.0%) | 3 (1.2%) |
| 1 Vehicle | 71 (16.6%) | 77 (30.1%) |
| 2 Vehicles | 156 (36.4%) | 74 (28.9%) |
| 3 or more Vehicles | 202 (47.1%) | 102 (39.8%) |
| Total | 429 (100.0%) | 256 (100.0%) |
Real Estate & Mortgages in Bridgeport
Real Estate and Mortgage Overview in Bridgeport
| Characteristic | Without Mortgage | With Mortgage |
| Housing Units | 297 | 132 |
| Median Property Value | $145,000 | $144,200 |
| Median Household Income | $51,875 | $0 |
| Monthly Housing Costs | $389 | $8 |
| Real Estate Taxes | $1,205 | $8 |
Property Value by Mortgage Status in Bridgeport
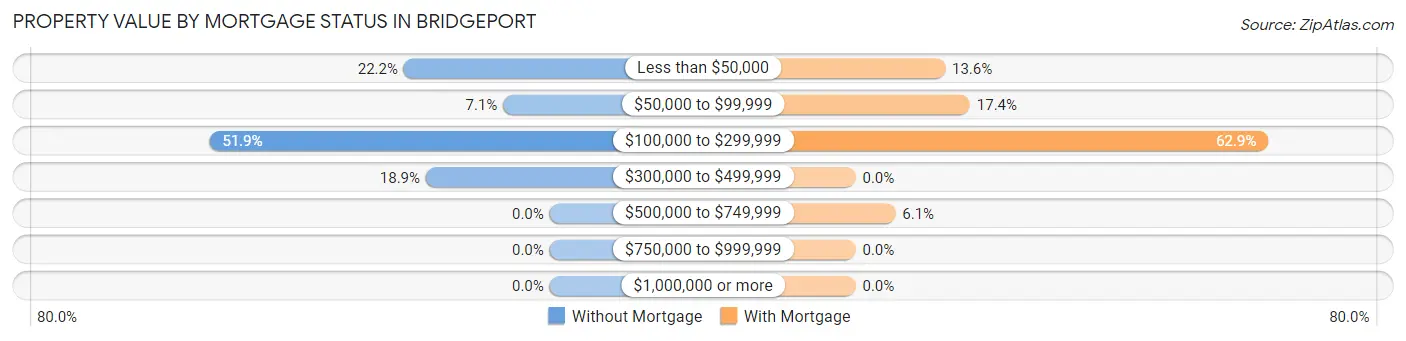
| Property Value | Without Mortgage | With Mortgage |
| Less than $50,000 | 66 (22.2%) | 18 (13.6%) |
| $50,000 to $99,999 | 21 (7.1%) | 23 (17.4%) |
| $100,000 to $299,999 | 154 (51.8%) | 83 (62.9%) |
| $300,000 to $499,999 | 56 (18.9%) | 0 (0.0%) |
| $500,000 to $749,999 | 0 (0.0%) | 8 (6.1%) |
| $750,000 to $999,999 | 0 (0.0%) | 0 (0.0%) |
| $1,000,000 or more | 0 (0.0%) | 0 (0.0%) |
| Total | 297 (100.0%) | 132 (100.0%) |
Household Income by Mortgage Status in Bridgeport
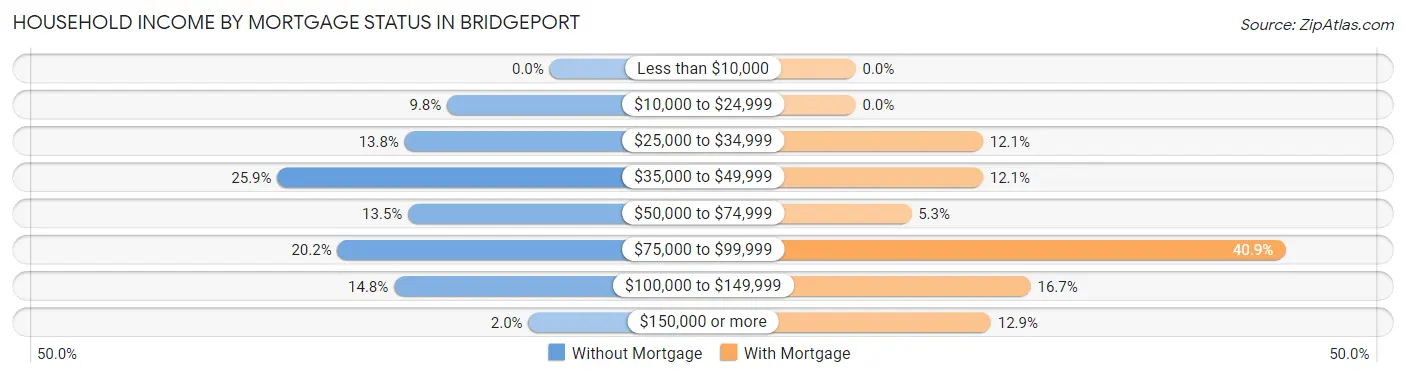
| Household Income | Without Mortgage | With Mortgage |
| Less than $10,000 | 0 (0.0%) | 0 (0.0%) |
| $10,000 to $24,999 | 29 (9.8%) | 0 (0.0%) |
| $25,000 to $34,999 | 41 (13.8%) | 16 (12.1%) |
| $35,000 to $49,999 | 77 (25.9%) | 16 (12.1%) |
| $50,000 to $74,999 | 40 (13.5%) | 7 (5.3%) |
| $75,000 to $99,999 | 60 (20.2%) | 54 (40.9%) |
| $100,000 to $149,999 | 44 (14.8%) | 22 (16.7%) |
| $150,000 or more | 6 (2.0%) | 17 (12.9%) |
| Total | 297 (100.0%) | 132 (100.0%) |
Property Value to Household Income Ratio in Bridgeport
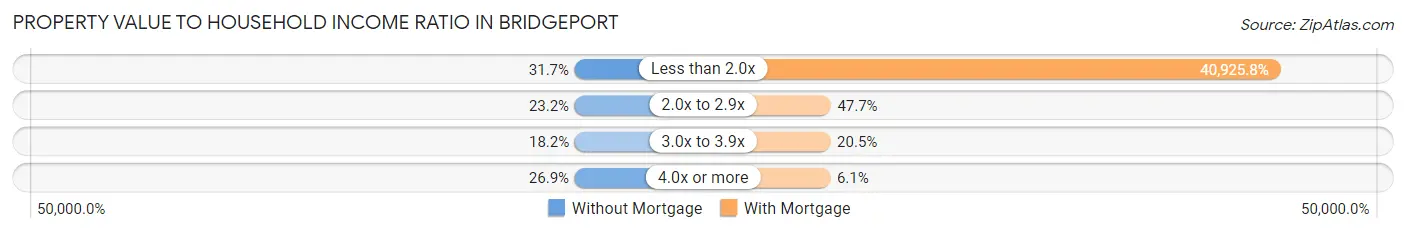
| Value-to-Income Ratio | Without Mortgage | With Mortgage |
| Less than 2.0x | 94 (31.7%) | 54,022 (40,925.8%) |
| 2.0x to 2.9x | 69 (23.2%) | 63 (47.7%) |
| 3.0x to 3.9x | 54 (18.2%) | 27 (20.4%) |
| 4.0x or more | 80 (26.9%) | 8 (6.1%) |
| Total | 297 (100.0%) | 132 (100.0%) |
Real Estate Taxes by Mortgage Status in Bridgeport
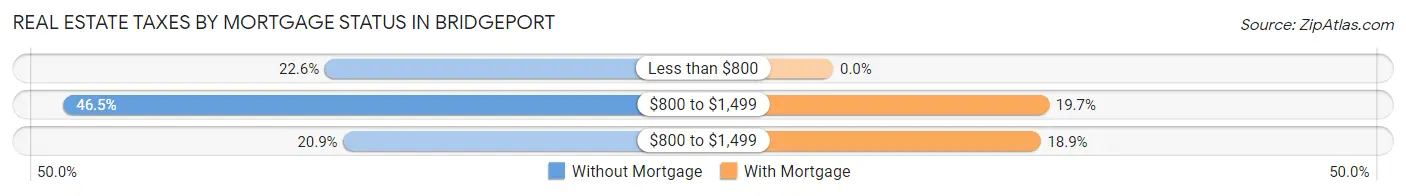
| Property Taxes | Without Mortgage | With Mortgage |
| Less than $800 | 67 (22.6%) | 0 (0.0%) |
| $800 to $1,499 | 138 (46.5%) | 26 (19.7%) |
| $800 to $1,499 | 62 (20.9%) | 25 (18.9%) |
| Total | 297 (100.0%) | 132 (100.0%) |
Health & Disability in Bridgeport
Health Insurance Coverage by Age in Bridgeport
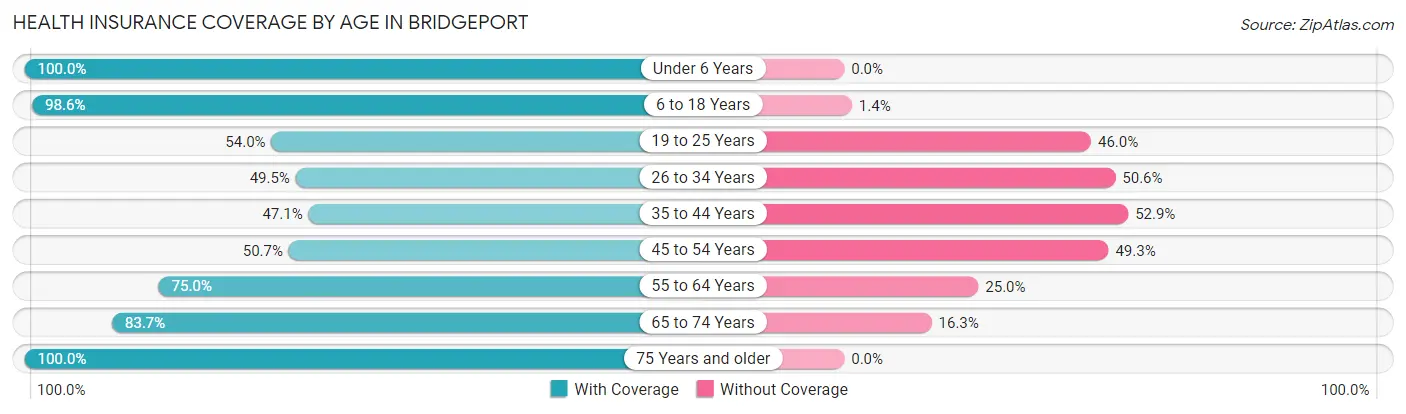
| Age Bracket | With Coverage | Without Coverage |
| Under 6 Years | 333 (100.0%) | 0 (0.0%) |
| 6 to 18 Years | 627 (98.6%) | 9 (1.4%) |
| 19 to 25 Years | 95 (54.0%) | 81 (46.0%) |
| 26 to 34 Years | 179 (49.4%) | 183 (50.5%) |
| 35 to 44 Years | 104 (47.1%) | 117 (52.9%) |
| 45 to 54 Years | 174 (50.7%) | 169 (49.3%) |
| 55 to 64 Years | 135 (75.0%) | 45 (25.0%) |
| 65 to 74 Years | 72 (83.7%) | 14 (16.3%) |
| 75 Years and older | 79 (100.0%) | 0 (0.0%) |
| Total | 1,798 (74.4%) | 618 (25.6%) |
Health Insurance Coverage by Citizenship Status in Bridgeport
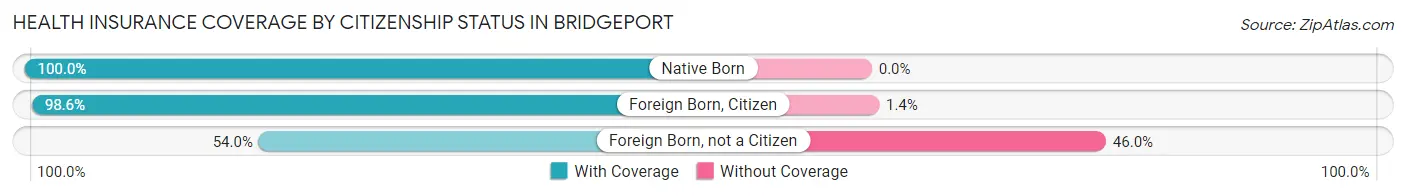
| Citizenship Status | With Coverage | Without Coverage |
| Native Born | 333 (100.0%) | 0 (0.0%) |
| Foreign Born, Citizen | 627 (98.6%) | 9 (1.4%) |
| Foreign Born, not a Citizen | 95 (54.0%) | 81 (46.0%) |
Health Insurance Coverage by Household Income in Bridgeport
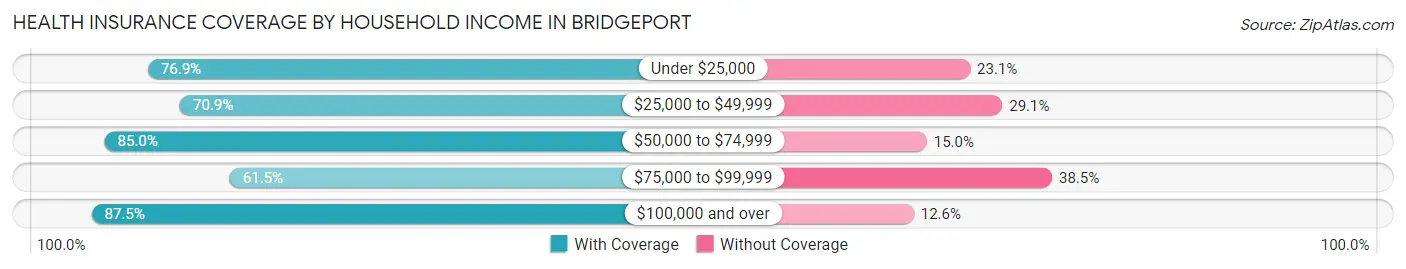
| Household Income | With Coverage | Without Coverage |
| Under $25,000 | 203 (76.9%) | 61 (23.1%) |
| $25,000 to $49,999 | 671 (70.9%) | 276 (29.1%) |
| $50,000 to $74,999 | 414 (85.0%) | 73 (15.0%) |
| $75,000 to $99,999 | 280 (61.5%) | 175 (38.5%) |
| $100,000 and over | 230 (87.5%) | 33 (12.6%) |
Public vs Private Health Insurance Coverage by Age in Bridgeport
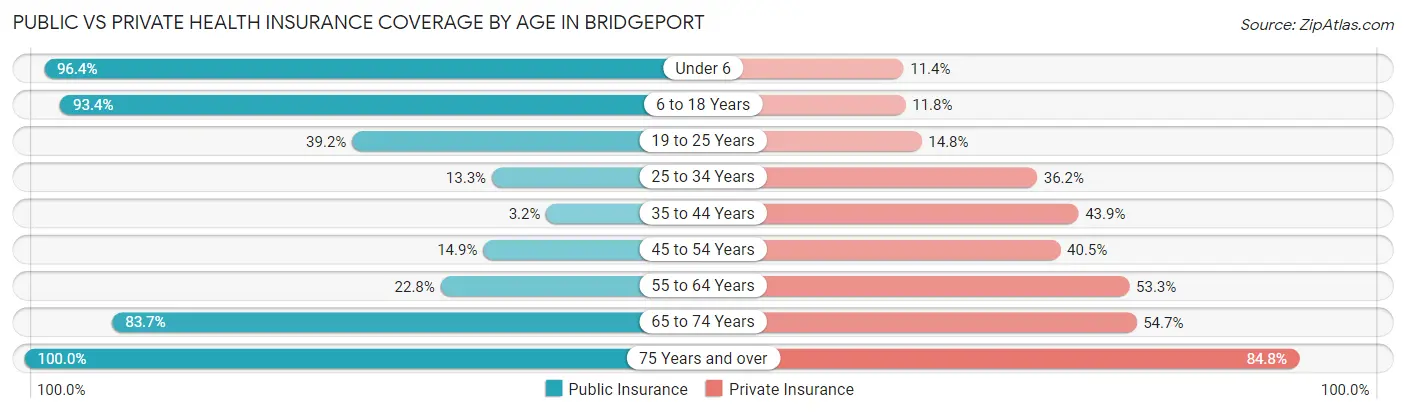
| Age Bracket | Public Insurance | Private Insurance |
| Under 6 | 321 (96.4%) | 38 (11.4%) |
| 6 to 18 Years | 594 (93.4%) | 75 (11.8%) |
| 19 to 25 Years | 69 (39.2%) | 26 (14.8%) |
| 25 to 34 Years | 48 (13.3%) | 131 (36.2%) |
| 35 to 44 Years | 7 (3.2%) | 97 (43.9%) |
| 45 to 54 Years | 51 (14.9%) | 139 (40.5%) |
| 55 to 64 Years | 41 (22.8%) | 96 (53.3%) |
| 65 to 74 Years | 72 (83.7%) | 47 (54.6%) |
| 75 Years and over | 79 (100.0%) | 67 (84.8%) |
| Total | 1,282 (53.1%) | 716 (29.6%) |
Disability Status by Sex by Age in Bridgeport
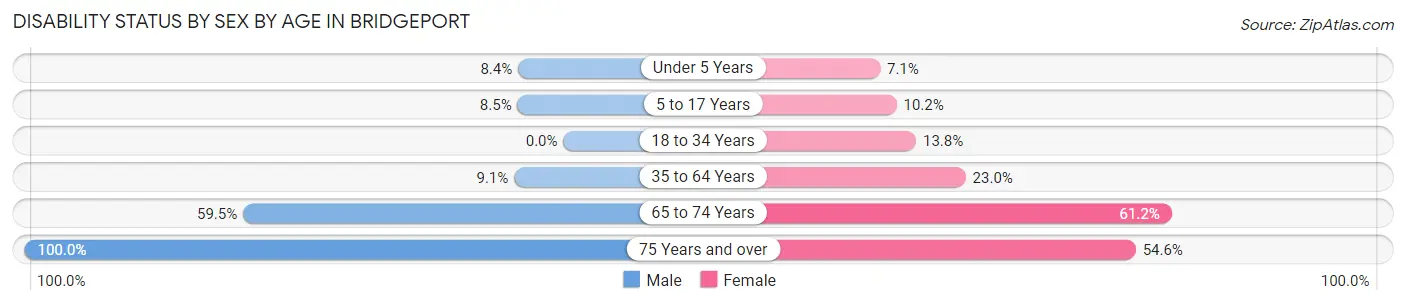
| Age Bracket | Male | Female |
| Under 5 Years | 11 (8.4%) | 12 (7.1%) |
| 5 to 17 Years | 28 (8.5%) | 31 (10.2%) |
| 18 to 34 Years | 0 (0.0%) | 36 (13.8%) |
| 35 to 64 Years | 35 (9.1%) | 83 (23.0%) |
| 65 to 74 Years | 22 (59.5%) | 30 (61.2%) |
| 75 Years and over | 46 (100.0%) | 18 (54.5%) |
Disability Class by Sex by Age in Bridgeport
Disability Class: Hearing Difficulty
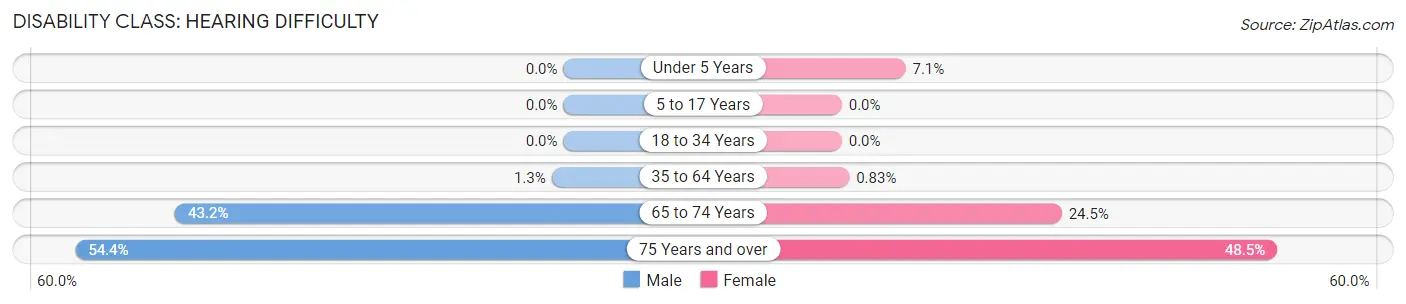
| Age Bracket | Male | Female |
| Under 5 Years | 0 (0.0%) | 12 (7.1%) |
| 5 to 17 Years | 0 (0.0%) | 0 (0.0%) |
| 18 to 34 Years | 0 (0.0%) | 0 (0.0%) |
| 35 to 64 Years | 5 (1.3%) | 3 (0.8%) |
| 65 to 74 Years | 16 (43.2%) | 12 (24.5%) |
| 75 Years and over | 25 (54.3%) | 16 (48.5%) |
Disability Class: Vision Difficulty
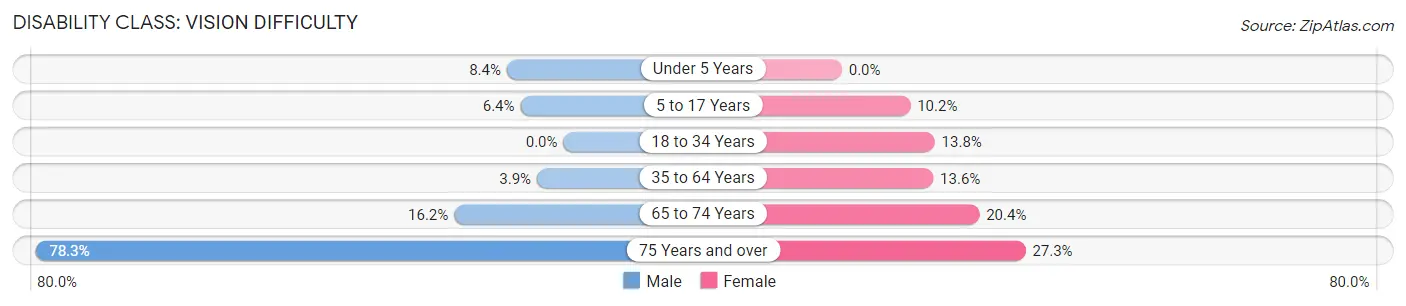
| Age Bracket | Male | Female |
| Under 5 Years | 11 (8.4%) | 0 (0.0%) |
| 5 to 17 Years | 21 (6.4%) | 31 (10.2%) |
| 18 to 34 Years | 0 (0.0%) | 36 (13.8%) |
| 35 to 64 Years | 15 (3.9%) | 49 (13.6%) |
| 65 to 74 Years | 6 (16.2%) | 10 (20.4%) |
| 75 Years and over | 36 (78.3%) | 9 (27.3%) |
Disability Class: Cognitive Difficulty
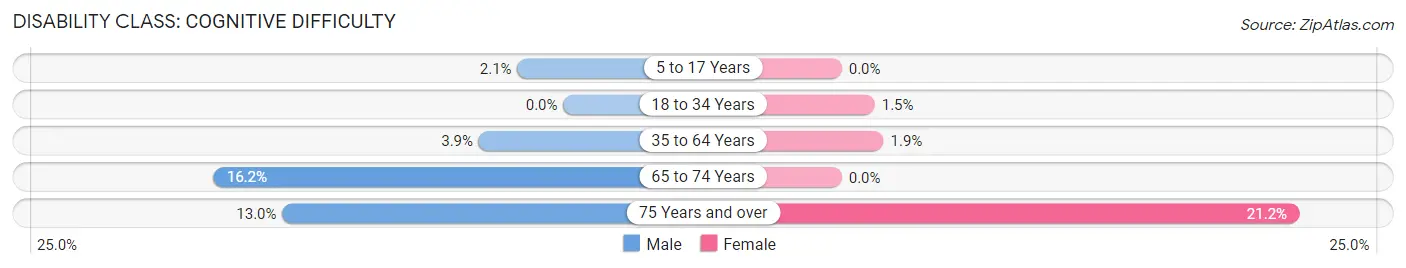
| Age Bracket | Male | Female |
| 5 to 17 Years | 7 (2.1%) | 0 (0.0%) |
| 18 to 34 Years | 0 (0.0%) | 4 (1.5%) |
| 35 to 64 Years | 15 (3.9%) | 7 (1.9%) |
| 65 to 74 Years | 6 (16.2%) | 0 (0.0%) |
| 75 Years and over | 6 (13.0%) | 7 (21.2%) |
Disability Class: Ambulatory Difficulty
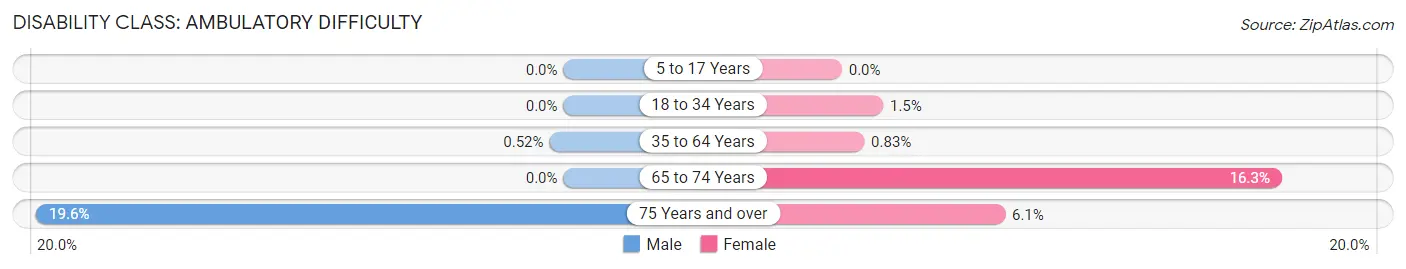
| Age Bracket | Male | Female |
| 5 to 17 Years | 0 (0.0%) | 0 (0.0%) |
| 18 to 34 Years | 0 (0.0%) | 4 (1.5%) |
| 35 to 64 Years | 2 (0.5%) | 3 (0.8%) |
| 65 to 74 Years | 0 (0.0%) | 8 (16.3%) |
| 75 Years and over | 9 (19.6%) | 2 (6.1%) |
Disability Class: Self-Care Difficulty
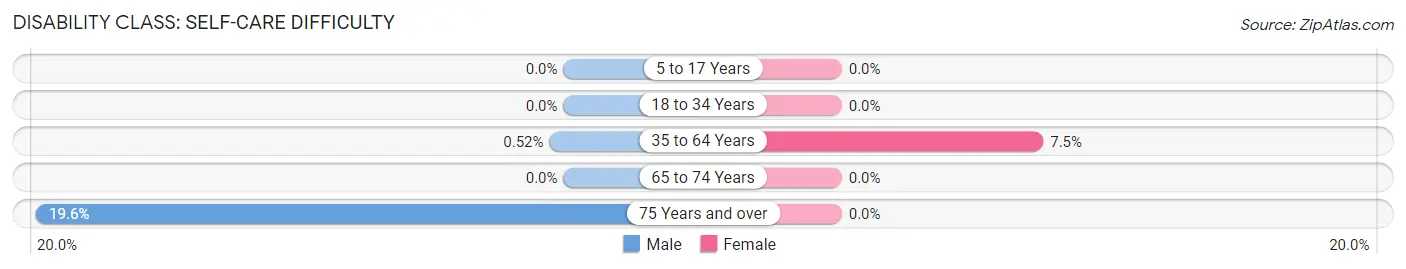
| Age Bracket | Male | Female |
| 5 to 17 Years | 0 (0.0%) | 0 (0.0%) |
| 18 to 34 Years | 0 (0.0%) | 0 (0.0%) |
| 35 to 64 Years | 2 (0.5%) | 27 (7.5%) |
| 65 to 74 Years | 0 (0.0%) | 0 (0.0%) |
| 75 Years and over | 9 (19.6%) | 0 (0.0%) |
Technology Access in Bridgeport
Computing Device Access in Bridgeport
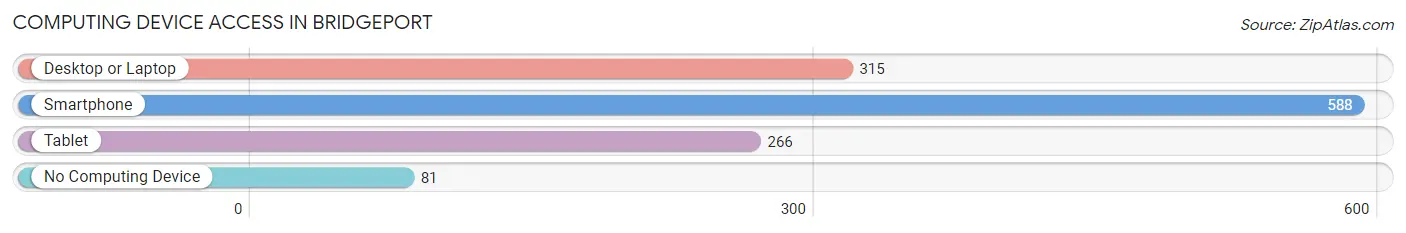
| Device Type | # Households | % Households |
| Desktop or Laptop | 315 | 46.0% |
| Smartphone | 588 | 85.8% |
| Tablet | 266 | 38.8% |
| No Computing Device | 81 | 11.8% |
| Total | 685 | 100.0% |
Internet Access in Bridgeport
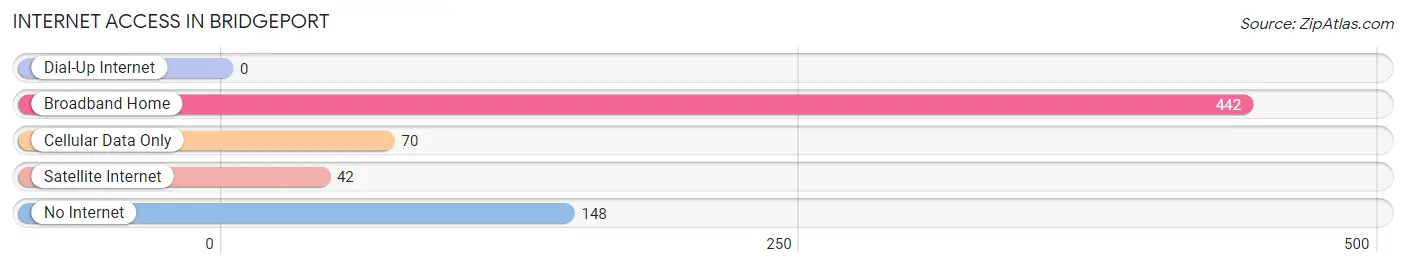
| Internet Type | # Households | % Households |
| Dial-Up Internet | 0 | 0.0% |
| Broadband Home | 442 | 64.5% |
| Cellular Data Only | 70 | 10.2% |
| Satellite Internet | 42 | 6.1% |
| No Internet | 148 | 21.6% |
| Total | 685 | 100.0% |
Bridgeport Summary
Bridgeport is a small town located in Douglas County, Washington, United States. It is situated on the banks of the Columbia River, just south of the Grand Coulee Dam. The town was founded in 1883 and was named after the bridge that was built across the Columbia River at the same time. The population of Bridgeport was 1,719 at the 2010 census.
History
The area around Bridgeport was first inhabited by Native Americans, including the Wanapum, Yakama, and Spokane tribes. The first white settlers arrived in the area in the late 1800s, and the town of Bridgeport was officially founded in 1883. The town was named after the bridge that was built across the Columbia River at the same time.
The town quickly grew and became an important trading center for the region. In the early 1900s, the town was home to several businesses, including a hotel, a general store, a saloon, and a blacksmith shop. The town also had a school, a post office, and a newspaper.
In the 1930s, the Grand Coulee Dam was built just north of Bridgeport, and the town became a popular tourist destination. The dam provided electricity to the region, and the town was able to take advantage of the new economic opportunities.
Geography
Bridgeport is located in Douglas County, Washington, United States. It is situated on the banks of the Columbia River, just south of the Grand Coulee Dam. The town is located at an elevation of 1,068 feet (325 m).
The climate in Bridgeport is semi-arid, with hot summers and cold winters. The average annual temperature is 54°F (12°C). The average annual precipitation is 8.5 inches (216 mm).
Economy
The economy of Bridgeport is largely based on tourism and agriculture. The town is home to several tourist attractions, including the Grand Coulee Dam, the Columbia River, and the nearby Lake Roosevelt.
Agriculture is also an important part of the local economy. The area is known for its wheat, barley, and alfalfa production. The town is also home to several wineries and vineyards.
Demographics
As of the 2010 census, the population of Bridgeport was 1,719. The racial makeup of the town was 94.3% White, 0.7% African American, 0.7% Native American, 0.3% Asian, 0.1% Pacific Islander, 1.2% from other races, and 2.1% from two or more races. Hispanic or Latino of any race were 4.2% of the population.
The median income for a household in Bridgeport was $35,938, and the median income for a family was $41,250. The per capita income for the town was $17,845. About 11.2% of families and 14.2% of the population were below the poverty line, including 18.2% of those under age 18 and 8.3% of those age 65 or over.
Common Questions
What is Per Capita Income in Bridgeport?
Per Capita income in Bridgeport is $17,318.
What is the Median Family Income in Bridgeport?
Median Family Income in Bridgeport is $46,549.
What is the Median Household income in Bridgeport?
Median Household Income in Bridgeport is $52,083.
What is Income or Wage Gap in Bridgeport?
Income or Wage Gap in Bridgeport is 19.6%.
Women in Bridgeport earn 80.4 cents for every dollar earned by a man.
What is Family Income Deficit in Bridgeport?
Family Income Deficit in Bridgeport is $11,067.
Families that are below poverty line in Bridgeport earn $11,067 less on average than the poverty threshold level.
What is Inequality or Gini Index in Bridgeport?
Inequality or Gini Index in Bridgeport is 0.29.
What is the Total Population of Bridgeport?
Total Population of Bridgeport is 2,416.
What is the Total Male Population of Bridgeport?
Total Male Population of Bridgeport is 1,238.
What is the Total Female Population of Bridgeport?
Total Female Population of Bridgeport is 1,178.
What is the Ratio of Males per 100 Females in Bridgeport?
There are 105.09 Males per 100 Females in Bridgeport.
What is the Ratio of Females per 100 Males in Bridgeport?
There are 95.15 Females per 100 Males in Bridgeport.
What is the Median Population Age in Bridgeport?
Median Population Age in Bridgeport is 27.6 Years.
What is the Average Family Size in Bridgeport
Average Family Size in Bridgeport is 3.8 People.
What is the Average Household Size in Bridgeport
Average Household Size in Bridgeport is 3.5 People.
How Large is the Labor Force in Bridgeport?
There are 1,120 People in the Labor Forcein in Bridgeport.
What is the Percentage of People in the Labor Force in Bridgeport?
70.6% of People are in the Labor Force in Bridgeport.
What is the Unemployment Rate in Bridgeport?
Unemployment Rate in Bridgeport is 6.3%.