El Prado Estates, AZ Map & Demographics
El Prado Estates Map
El Prado Estates Overview
$19,528
PER CAPITA INCOME
$41,875
AVG FAMILY INCOME
$44,071
AVG HOUSEHOLD INCOME
50.0%
WAGE / INCOME GAP [ % ]
50.0¢/ $1
WAGE / INCOME GAP [ $ ]
0.19
INEQUALITY / GINI INDEX
391
TOTAL POPULATION
130
MALE POPULATION
261
FEMALE POPULATION
49.81
MALES / 100 FEMALES
200.77
FEMALES / 100 MALES
33.4
MEDIAN AGE
1.9
AVG FAMILY SIZE
2.0
AVG HOUSEHOLD SIZE
234
LABOR FORCE [ PEOPLE ]
72.4%
PERCENT IN LABOR FORCE
Income in El Prado Estates
Income Overview in El Prado Estates
Per Capita Income in El Prado Estates is $19,528, while median incomes of families and households are $41,875 and $44,071 respectively.
| Characteristic | Number | Measure |
| Per Capita Income | 391 | $19,528 |
| Median Family Income | 174 | $41,875 |
| Mean Family Income | 174 | $37,511 |
| Median Household Income | 194 | $44,071 |
| Mean Household Income | 194 | $40,335 |
| Income Deficit | 174 | $0 |
| Wage / Income Gap (%) | 391 | 50.03% |
| Wage / Income Gap ($) | 391 | 49.97¢ per $1 |
| Gini / Inequality Index | 391 | 0.19 |
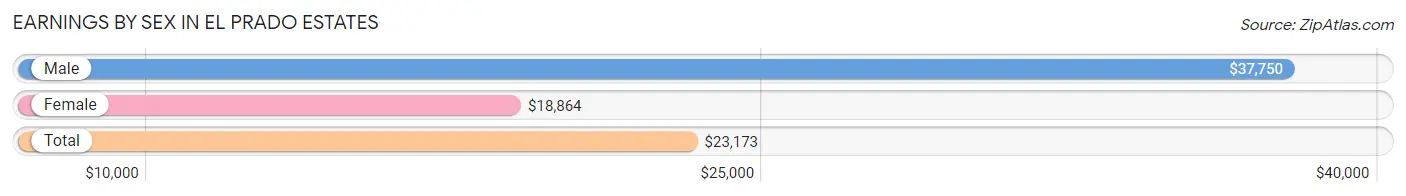
Earnings by Sex in El Prado Estates
Average Earnings in El Prado Estates are $23,173, $37,750 for men and $18,864 for women, a difference of 50.0%.
| Sex | Number | Average Earnings |
| Male | 72 (30.8%) | $37,750 |
| Female | 162 (69.2%) | $18,864 |
| Total | 234 (100.0%) | $23,173 |
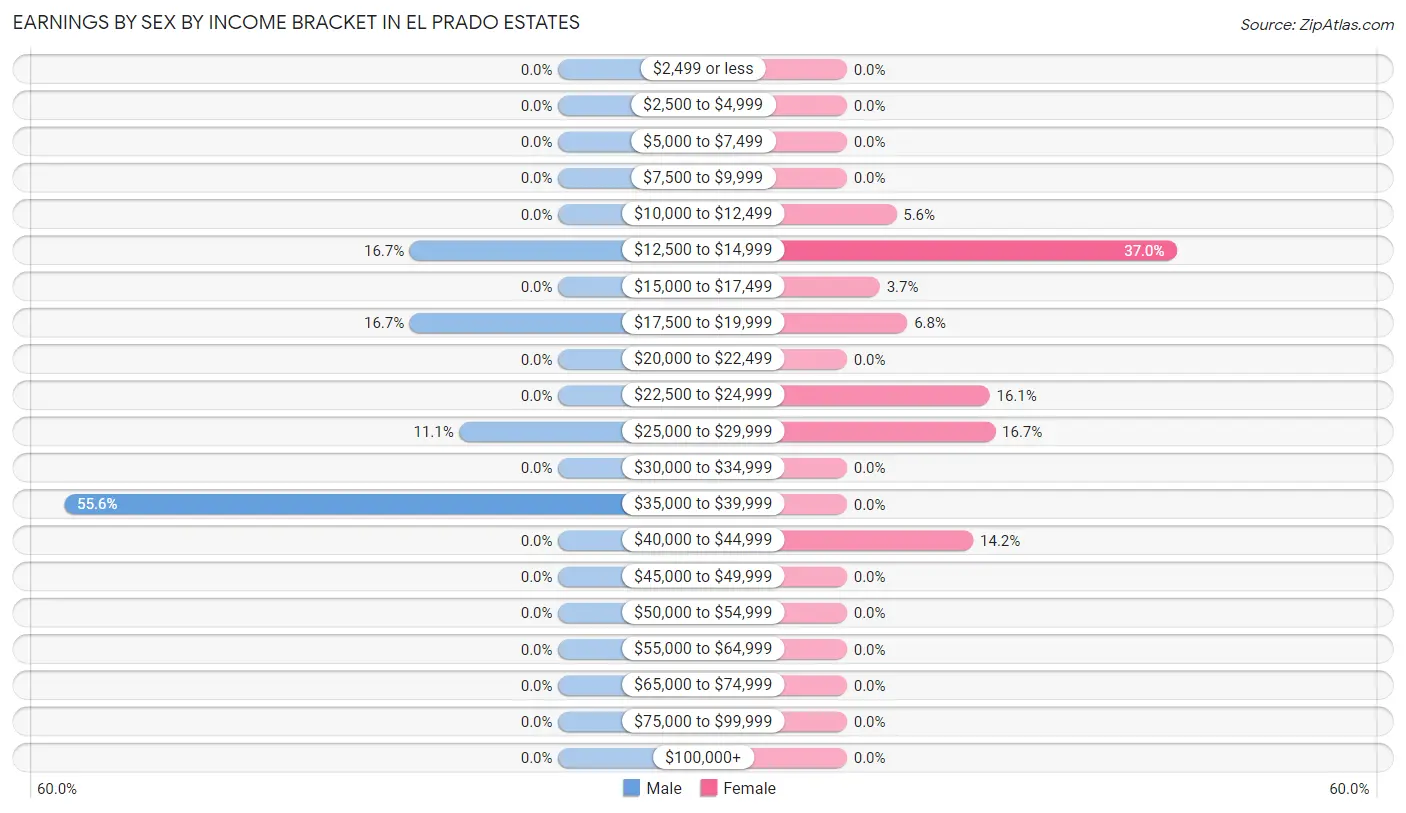
Earnings by Sex by Income Bracket in El Prado Estates
The most common earnings brackets in El Prado Estates are $35,000 to $39,999 for men (40 | 55.6%) and $12,500 to $14,999 for women (60 | 37.0%).
| Income | Male | Female |
| $2,499 or less | 0 (0.0%) | 0 (0.0%) |
| $2,500 to $4,999 | 0 (0.0%) | 0 (0.0%) |
| $5,000 to $7,499 | 0 (0.0%) | 0 (0.0%) |
| $7,500 to $9,999 | 0 (0.0%) | 0 (0.0%) |
| $10,000 to $12,499 | 0 (0.0%) | 9 (5.6%) |
| $12,500 to $14,999 | 12 (16.7%) | 60 (37.0%) |
| $15,000 to $17,499 | 0 (0.0%) | 6 (3.7%) |
| $17,500 to $19,999 | 12 (16.7%) | 11 (6.8%) |
| $20,000 to $22,499 | 0 (0.0%) | 0 (0.0%) |
| $22,500 to $24,999 | 0 (0.0%) | 26 (16.1%) |
| $25,000 to $29,999 | 8 (11.1%) | 27 (16.7%) |
| $30,000 to $34,999 | 0 (0.0%) | 0 (0.0%) |
| $35,000 to $39,999 | 40 (55.6%) | 0 (0.0%) |
| $40,000 to $44,999 | 0 (0.0%) | 23 (14.2%) |
| $45,000 to $49,999 | 0 (0.0%) | 0 (0.0%) |
| $50,000 to $54,999 | 0 (0.0%) | 0 (0.0%) |
| $55,000 to $64,999 | 0 (0.0%) | 0 (0.0%) |
| $65,000 to $74,999 | 0 (0.0%) | 0 (0.0%) |
| $75,000 to $99,999 | 0 (0.0%) | 0 (0.0%) |
| $100,000+ | 0 (0.0%) | 0 (0.0%) |
| Total | 72 (100.0%) | 162 (100.0%) |
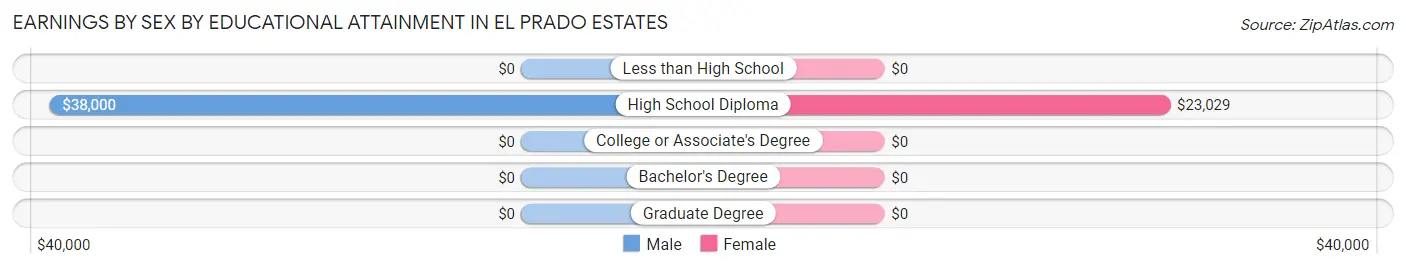
Earnings by Sex by Educational Attainment in El Prado Estates
Average earnings in El Prado Estates are $37,750 for men and $23,029 for women, a difference of 39.0%. Men with an educational attainment of high school diploma enjoy the highest average annual earnings of $38,000, while those with high school diploma education earn the least with $38,000. Women with an educational attainment of high school diploma earn the most with the average annual earnings of $23,029, while those with high school diploma education have the smallest earnings of $23,029.
| Educational Attainment | Male Income | Female Income |
| Less than High School | - | - |
| High School Diploma | $38,000 | $23,029 |
| College or Associate's Degree | - | - |
| Bachelor's Degree | - | - |
| Graduate Degree | - | - |
| Total | $37,750 | $23,029 |
Family Income in El Prado Estates
Family Income Brackets in El Prado Estates
According to the El Prado Estates family income data, there are 63 families falling into the $50,000 to $74,999 income range, which is the most common income bracket and makes up 36.2% of all families.
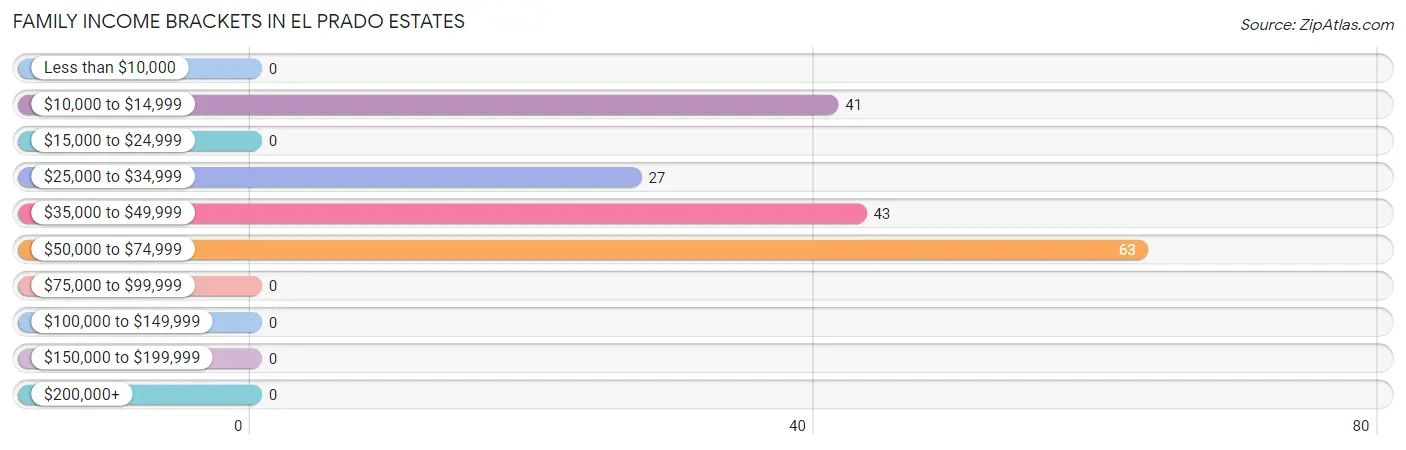
| Income Bracket | # Families | % Families |
| Less than $10,000 | 0 | 0.0% |
| $10,000 to $14,999 | 41 | 23.6% |
| $15,000 to $24,999 | 0 | 0.0% |
| $25,000 to $34,999 | 27 | 15.5% |
| $35,000 to $49,999 | 43 | 24.7% |
| $50,000 to $74,999 | 63 | 36.2% |
| $75,000 to $99,999 | 0 | 0.0% |
| $100,000 to $149,999 | 0 | 0.0% |
| $150,000 to $199,999 | 0 | 0.0% |
| $200,000+ | 0 | 0.0% |
Family Income by Famaliy Size in El Prado Estates
2-person families (139 | 79.9%) account for the highest median family income in El Prado Estates with $44,293 per family, while 2-person families (139 | 79.9%) have the highest median income of $22,146 per family member.
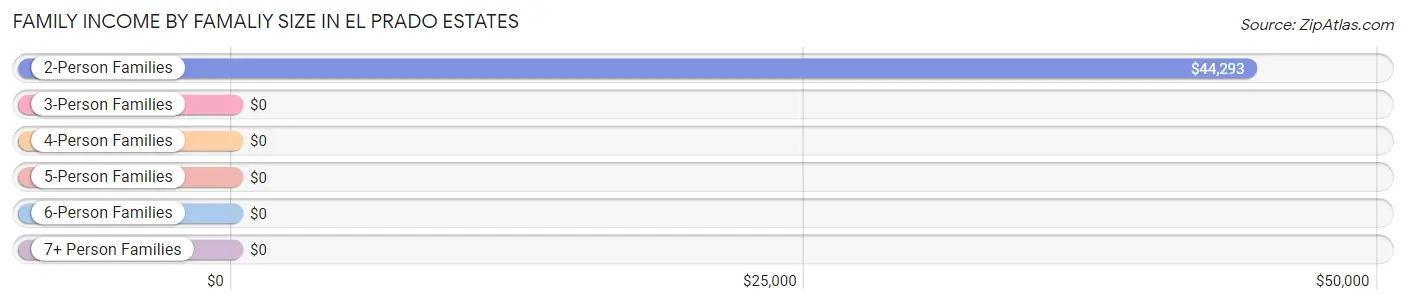
| Income Bracket | # Families | Median Income |
| 2-Person Families | 139 (79.9%) | $44,293 |
| 3-Person Families | 29 (16.7%) | $0 |
| 4-Person Families | 6 (3.5%) | $0 |
| 5-Person Families | 0 (0.0%) | $0 |
| 6-Person Families | 0 (0.0%) | $0 |
| 7+ Person Families | 0 (0.0%) | $0 |
| Total | 174 (100.0%) | $41,875 |
Family Income by Number of Earners in El Prado Estates
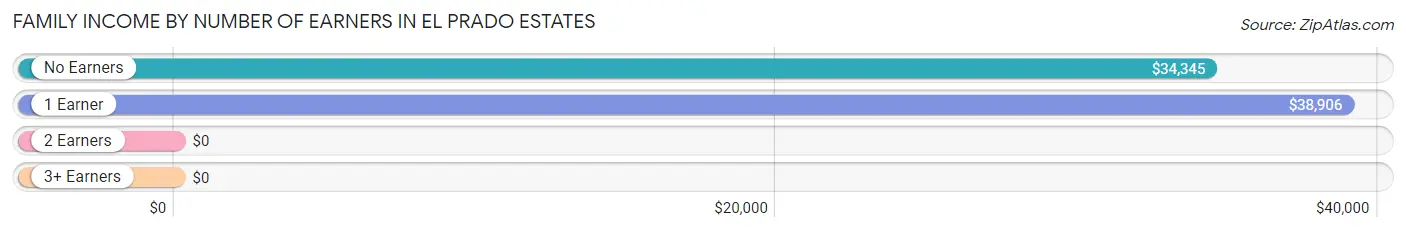
| Number of Earners | # Families | Median Income |
| No Earners | 31 (17.8%) | $34,345 |
| 1 Earner | 112 (64.4%) | $38,906 |
| 2 Earners | 31 (17.8%) | $0 |
| 3+ Earners | 0 (0.0%) | $0 |
| Total | 174 (100.0%) | $41,875 |
Household Income in El Prado Estates
Household Income Brackets in El Prado Estates
With 84 households falling in the category, the $50,000 to $74,999 income range is the most frequent in El Prado Estates, accounting for 43.3% of all households.
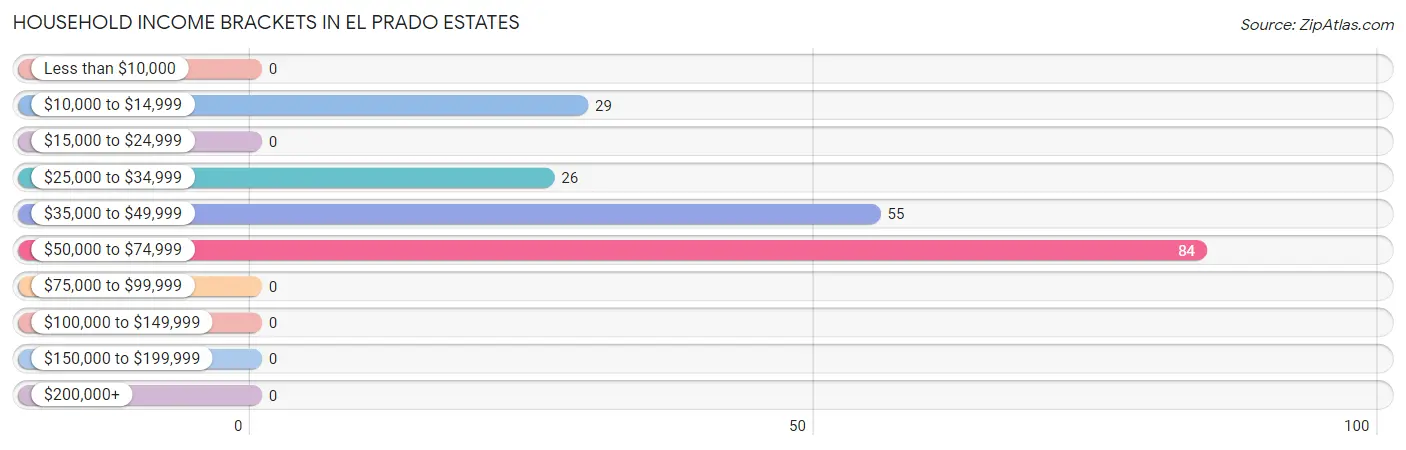
| Income Bracket | # Households | % Households |
| Less than $10,000 | 0 | 0.0% |
| $10,000 to $14,999 | 29 | 14.9% |
| $15,000 to $24,999 | 0 | 0.0% |
| $25,000 to $34,999 | 26 | 13.4% |
| $35,000 to $49,999 | 55 | 28.4% |
| $50,000 to $74,999 | 84 | 43.3% |
| $75,000 to $99,999 | 0 | 0.0% |
| $100,000 to $149,999 | 0 | 0.0% |
| $150,000 to $199,999 | 0 | 0.0% |
| $200,000+ | 0 | 0.0% |
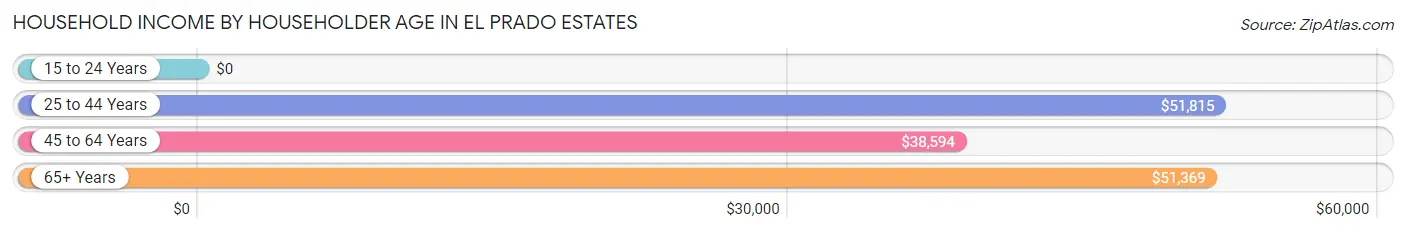
Household Income by Householder Age in El Prado Estates
The median household income in El Prado Estates is $44,071, with the highest median household income of $51,815 found in the 25 to 44 years age bracket for the primary householder. A total of 69 households (35.6%) fall into this category. Meanwhile, the 15 to 24 years age bracket for the primary householder has the lowest median household income of $0, with 52 households (26.8%) in this group.
| Income Bracket | # Households | Median Income |
| 15 to 24 Years | 52 (26.8%) | $0 |
| 25 to 44 Years | 69 (35.6%) | $51,815 |
| 45 to 64 Years | 42 (21.6%) | $38,594 |
| 65+ Years | 31 (16.0%) | $51,369 |
| Total | 194 (100.0%) | $44,071 |
Poverty in El Prado Estates
Income Below Poverty by Sex and Age in El Prado Estates
With 20.0% poverty level for males and 33.0% for females among the residents of El Prado Estates, 6 to 11 year old males and 6 to 11 year old females are the most vulnerable to poverty, with 6 males (100.0%) and 20 females (100.0%) in their respective age groups living below the poverty level.
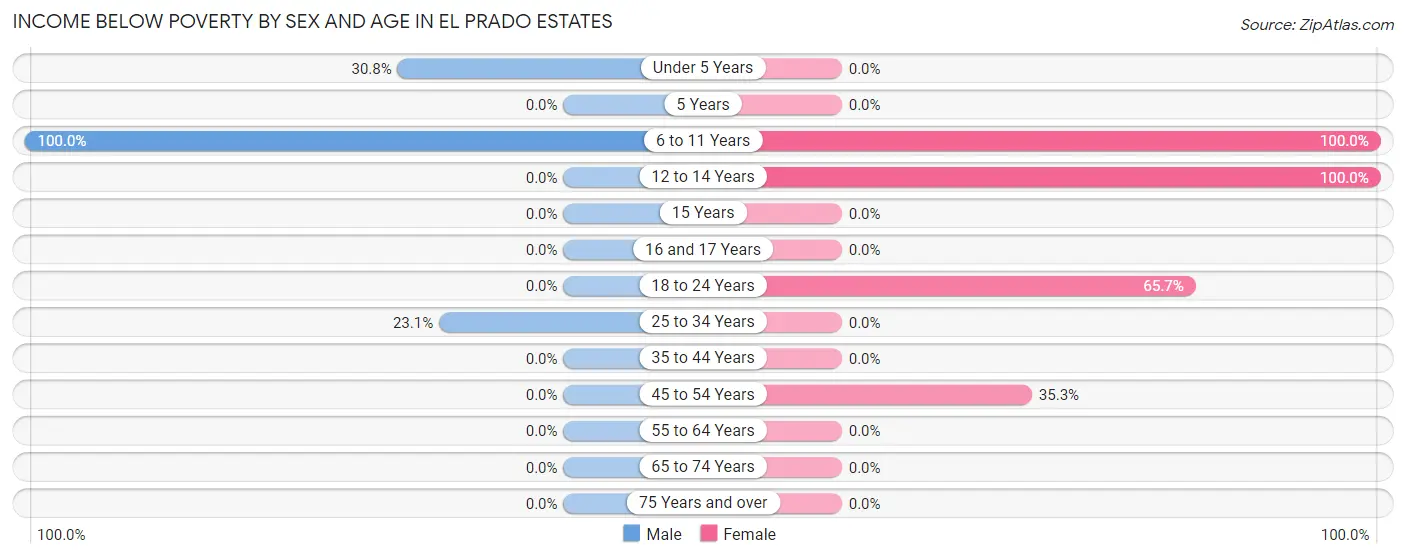
| Age Bracket | Male | Female |
| Under 5 Years | 8 (30.8%) | 0 (0.0%) |
| 5 Years | 0 (0.0%) | 0 (0.0%) |
| 6 to 11 Years | 6 (100.0%) | 20 (100.0%) |
| 12 to 14 Years | 0 (0.0%) | 16 (100.0%) |
| 15 Years | 0 (0.0%) | 0 (0.0%) |
| 16 and 17 Years | 0 (0.0%) | 0 (0.0%) |
| 18 to 24 Years | 0 (0.0%) | 44 (65.7%) |
| 25 to 34 Years | 12 (23.1%) | 0 (0.0%) |
| 35 to 44 Years | 0 (0.0%) | 0 (0.0%) |
| 45 to 54 Years | 0 (0.0%) | 6 (35.3%) |
| 55 to 64 Years | 0 (0.0%) | 0 (0.0%) |
| 65 to 74 Years | 0 (0.0%) | 0 (0.0%) |
| 75 Years and over | 0 (0.0%) | 0 (0.0%) |
| Total | 26 (20.0%) | 86 (33.0%) |
Income Above Poverty by Sex and Age in El Prado Estates
According to the poverty statistics in El Prado Estates, males aged 45 to 54 years and females aged 25 to 34 years are the age groups that are most secure financially, with 100.0% of males and 100.0% of females in these age groups living above the poverty line.
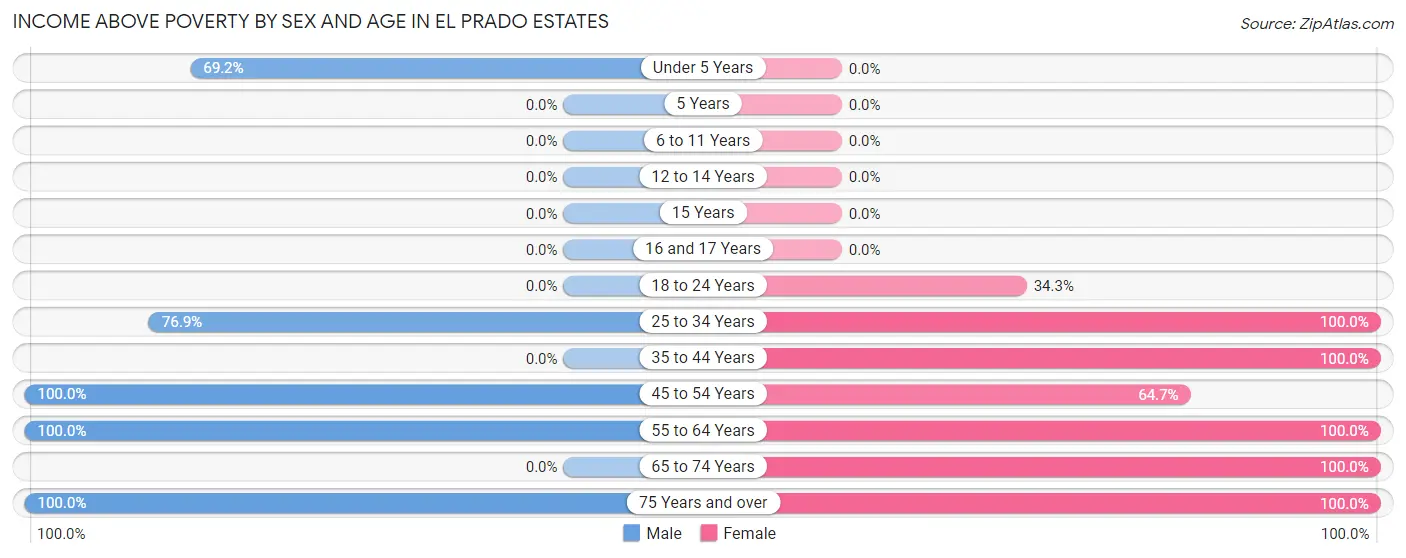
| Age Bracket | Male | Female |
| Under 5 Years | 18 (69.2%) | 0 (0.0%) |
| 5 Years | 0 (0.0%) | 0 (0.0%) |
| 6 to 11 Years | 0 (0.0%) | 0 (0.0%) |
| 12 to 14 Years | 0 (0.0%) | 0 (0.0%) |
| 15 Years | 0 (0.0%) | 0 (0.0%) |
| 16 and 17 Years | 0 (0.0%) | 0 (0.0%) |
| 18 to 24 Years | 0 (0.0%) | 23 (34.3%) |
| 25 to 34 Years | 40 (76.9%) | 31 (100.0%) |
| 35 to 44 Years | 0 (0.0%) | 37 (100.0%) |
| 45 to 54 Years | 12 (100.0%) | 11 (64.7%) |
| 55 to 64 Years | 24 (100.0%) | 16 (100.0%) |
| 65 to 74 Years | 0 (0.0%) | 15 (100.0%) |
| 75 Years and over | 10 (100.0%) | 42 (100.0%) |
| Total | 104 (80.0%) | 175 (67.0%) |
Income Below Poverty Among Married-Couple Families in El Prado Estates
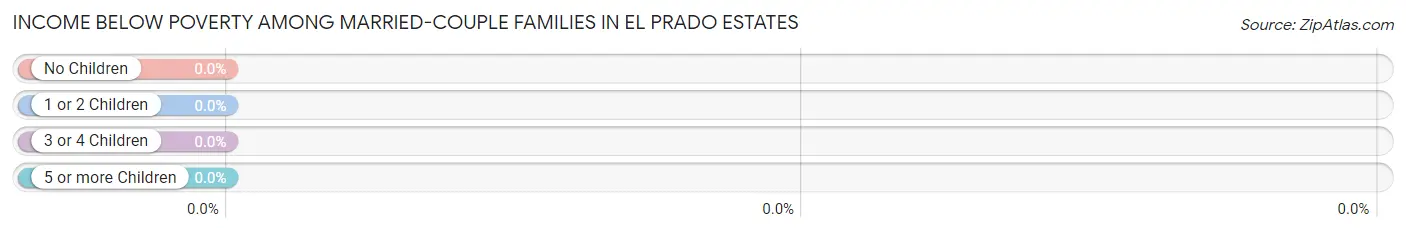
| Children | Above Poverty | Below Poverty |
| No Children | 57 (100.0%) | 0 (0.0%) |
| 1 or 2 Children | 0 (0.0%) | 0 (0.0%) |
| 3 or 4 Children | 0 (0.0%) | 0 (0.0%) |
| 5 or more Children | 0 (0.0%) | 0 (0.0%) |
| Total | 57 (100.0%) | 0 (0.0%) |
Income Below Poverty Among Single-Parent Households in El Prado Estates
According to the poverty data in El Prado Estates, 100.0% or 12 single-father households and 33.3% or 35 single-mother households are living below the poverty line. Among single-father households, those with 1 or 2 children have the highest poverty rate, with 12 households (100.0%) experiencing poverty. Likewise, among single-mother households, those with 1 or 2 children have the highest poverty rate, with 35 households (60.3%) falling below the poverty line.
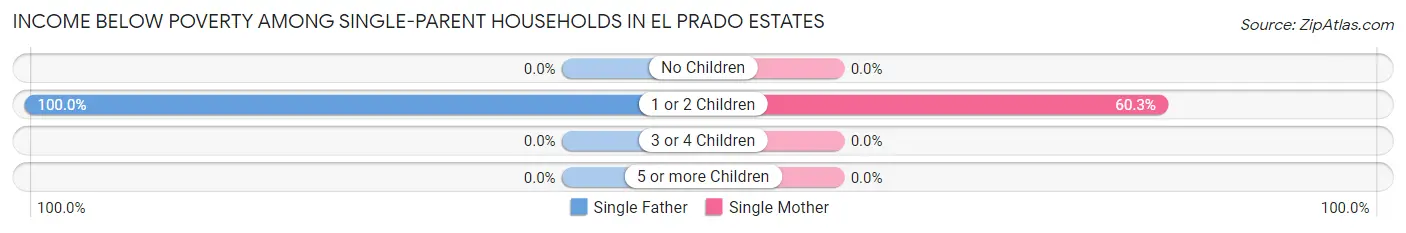
| Children | Single Father | Single Mother |
| No Children | 0 (0.0%) | 0 (0.0%) |
| 1 or 2 Children | 12 (100.0%) | 35 (60.3%) |
| 3 or 4 Children | 0 (0.0%) | 0 (0.0%) |
| 5 or more Children | 0 (0.0%) | 0 (0.0%) |
| Total | 12 (100.0%) | 35 (33.3%) |
Income Below Poverty Among Married-Couple vs Single-Parent Households in El Prado Estates
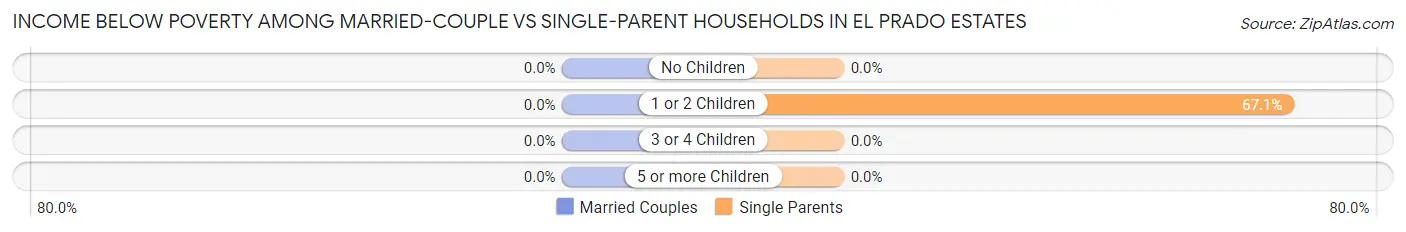
| Children | Married-Couple Families | Single-Parent Households |
| No Children | 0 (0.0%) | 0 (0.0%) |
| 1 or 2 Children | 0 (0.0%) | 47 (67.1%) |
| 3 or 4 Children | 0 (0.0%) | 0 (0.0%) |
| 5 or more Children | 0 (0.0%) | 0 (0.0%) |
| Total | 0 (0.0%) | 47 (40.2%) |
Race in El Prado Estates
The most populous races in El Prado Estates are Hispanic or Latino (348 | 89.0%), White / Caucasian (211 | 54.0%), and Some other Race (103 | 26.3%).
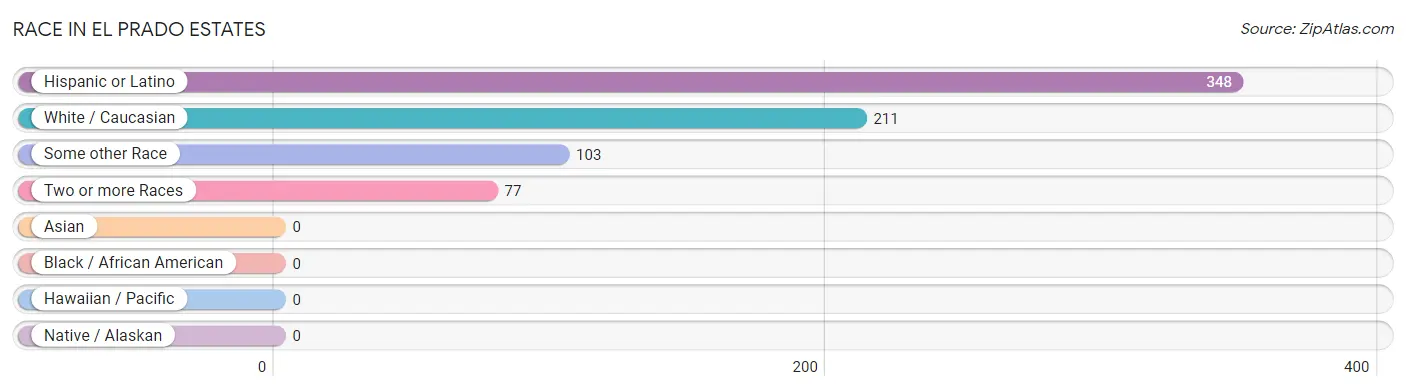
| Race | # Population | % Population |
| Asian | 0 | 0.0% |
| Black / African American | 0 | 0.0% |
| Hawaiian / Pacific | 0 | 0.0% |
| Hispanic or Latino | 348 | 89.0% |
| Native / Alaskan | 0 | 0.0% |
| White / Caucasian | 211 | 54.0% |
| Two or more Races | 77 | 19.7% |
| Some other Race | 103 | 26.3% |
| Total | 391 | 100.0% |
Ancestry in El Prado Estates
The most populous ancestries reported in El Prado Estates are Mexican (348 | 89.0%), German (14 | 3.6%), Dutch (8 | 2.1%), American (6 | 1.5%), and Swedish (6 | 1.5%), together accounting for 97.7% of all El Prado Estates residents.
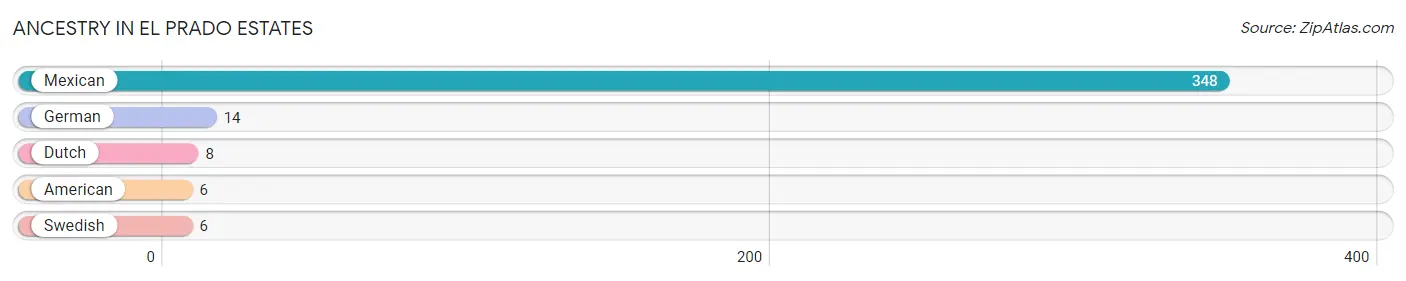
| Ancestry | # Population | % Population |
| American | 6 | 1.5% |
| Dutch | 8 | 2.1% |
| German | 14 | 3.6% |
| Mexican | 348 | 89.0% |
| Swedish | 6 | 1.5% | View All 5 Rows |
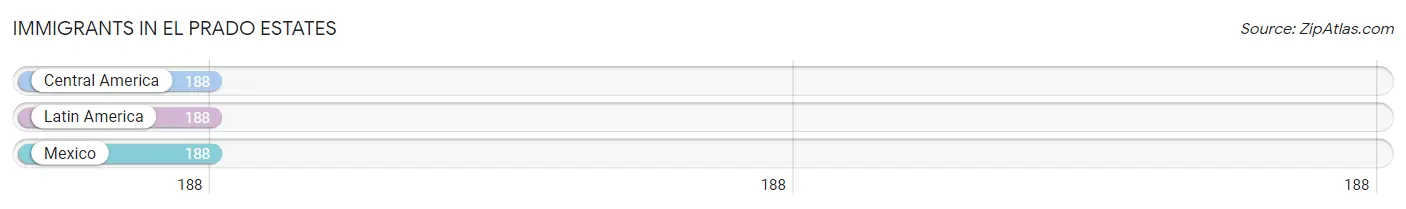
Immigrants in El Prado Estates
The most numerous immigrant groups reported in El Prado Estates came from Central America (188 | 48.1%), Latin America (188 | 48.1%), and Mexico (188 | 48.1%), together accounting for 144.2% of all El Prado Estates residents.
| Immigration Origin | # Population | % Population |
| Central America | 188 | 48.1% |
| Latin America | 188 | 48.1% |
| Mexico | 188 | 48.1% | View All 3 Rows |
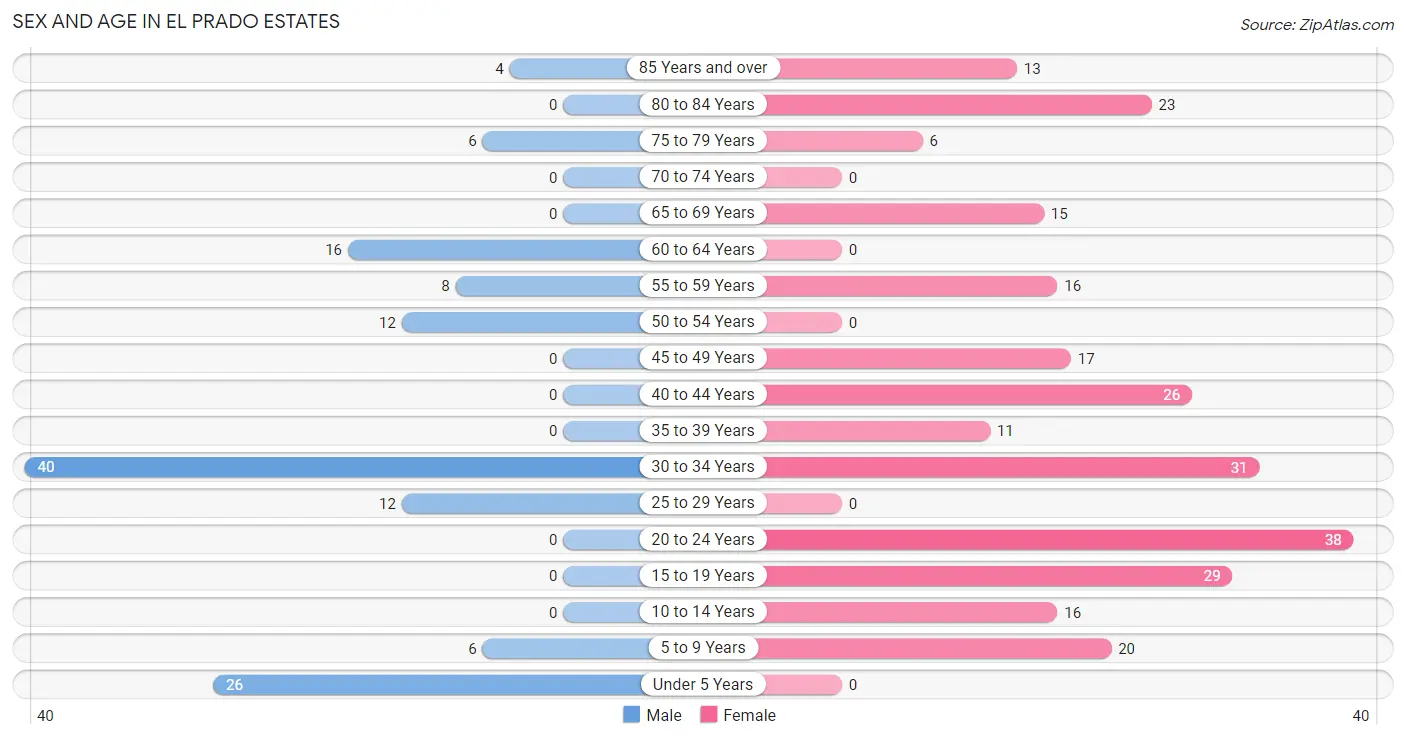
Sex and Age in El Prado Estates
Sex and Age in El Prado Estates
The most populous age groups in El Prado Estates are 30 to 34 Years (40 | 30.8%) for men and 20 to 24 Years (38 | 14.6%) for women.
| Age Bracket | Male | Female |
| Under 5 Years | 26 (20.0%) | 0 (0.0%) |
| 5 to 9 Years | 6 (4.6%) | 20 (7.7%) |
| 10 to 14 Years | 0 (0.0%) | 16 (6.1%) |
| 15 to 19 Years | 0 (0.0%) | 29 (11.1%) |
| 20 to 24 Years | 0 (0.0%) | 38 (14.6%) |
| 25 to 29 Years | 12 (9.2%) | 0 (0.0%) |
| 30 to 34 Years | 40 (30.8%) | 31 (11.9%) |
| 35 to 39 Years | 0 (0.0%) | 11 (4.2%) |
| 40 to 44 Years | 0 (0.0%) | 26 (10.0%) |
| 45 to 49 Years | 0 (0.0%) | 17 (6.5%) |
| 50 to 54 Years | 12 (9.2%) | 0 (0.0%) |
| 55 to 59 Years | 8 (6.1%) | 16 (6.1%) |
| 60 to 64 Years | 16 (12.3%) | 0 (0.0%) |
| 65 to 69 Years | 0 (0.0%) | 15 (5.8%) |
| 70 to 74 Years | 0 (0.0%) | 0 (0.0%) |
| 75 to 79 Years | 6 (4.6%) | 6 (2.3%) |
| 80 to 84 Years | 0 (0.0%) | 23 (8.8%) |
| 85 Years and over | 4 (3.1%) | 13 (5.0%) |
| Total | 130 (100.0%) | 261 (100.0%) |
Families and Households in El Prado Estates
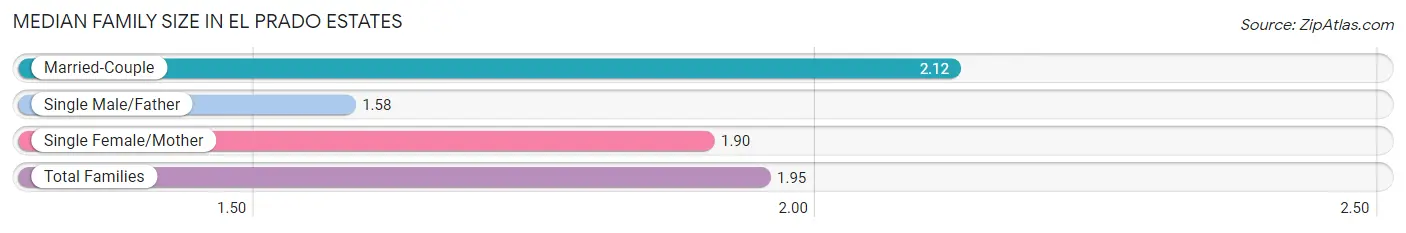
Median Family Size in El Prado Estates
The median family size in El Prado Estates is 1.95 persons per family, with married-couple families (57 | 32.8%) accounting for the largest median family size of 2.12 persons per family. On the other hand, single male/father families (12 | 6.9%) represent the smallest median family size with 1.58 persons per family.
| Family Type | # Families | Family Size |
| Married-Couple | 57 (32.8%) | 2.12 |
| Single Male/Father | 12 (6.9%) | 1.58 |
| Single Female/Mother | 105 (60.3%) | 1.90 |
| Total Families | 174 (100.0%) | 1.95 |
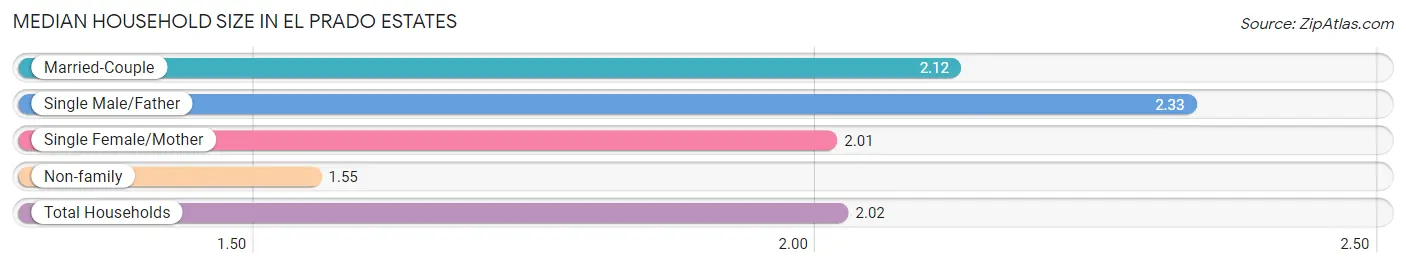
Median Household Size in El Prado Estates
The median household size in El Prado Estates is 2.02 persons per household, with single male/father households (12 | 6.2%) accounting for the largest median household size of 2.33 persons per household. non-family households (20 | 10.3%) represent the smallest median household size with 1.55 persons per household.
| Household Type | # Households | Household Size |
| Married-Couple | 57 (29.4%) | 2.12 |
| Single Male/Father | 12 (6.2%) | 2.33 |
| Single Female/Mother | 105 (54.1%) | 2.01 |
| Non-family | 20 (10.3%) | 1.55 |
| Total Households | 194 (100.0%) | 2.02 |
Household Size by Marriage Status in El Prado Estates
Out of a total of 194 households in El Prado Estates, 174 (89.7%) are family households, while 20 (10.3%) are nonfamily households. The most numerous type of family households are 2-person households, comprising 106, and the most common type of nonfamily households are 2-person households, comprising 12.
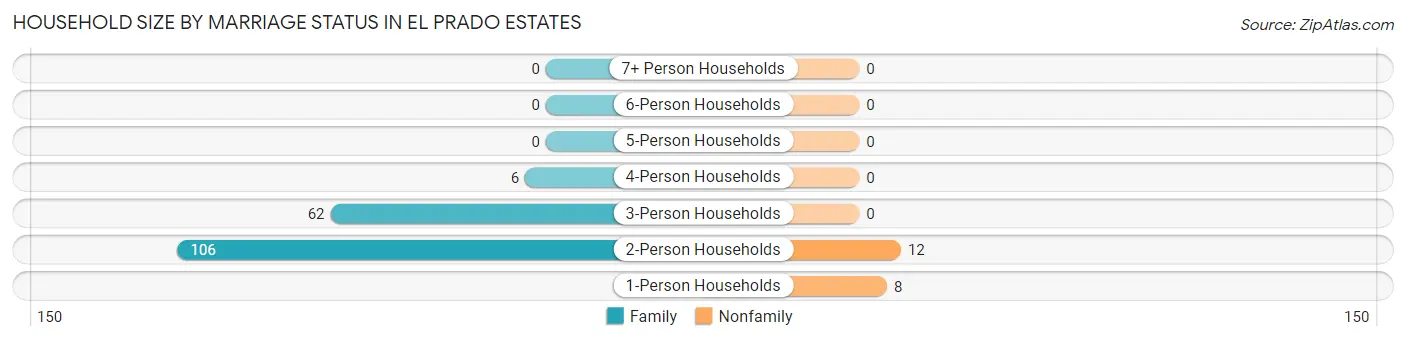
| Household Size | Family Households | Nonfamily Households |
| 1-Person Households | - | 8 (4.1%) |
| 2-Person Households | 106 (54.6%) | 12 (6.2%) |
| 3-Person Households | 62 (32.0%) | 0 (0.0%) |
| 4-Person Households | 6 (3.1%) | 0 (0.0%) |
| 5-Person Households | 0 (0.0%) | 0 (0.0%) |
| 6-Person Households | 0 (0.0%) | 0 (0.0%) |
| 7+ Person Households | 0 (0.0%) | 0 (0.0%) |
| Total | 174 (89.7%) | 20 (10.3%) |
Female Fertility in El Prado Estates
Fertility by Age in El Prado Estates
Average fertility rate in El Prado Estates is 39.0 births per 1,000 women. Women in the age bracket of 20 to 34 years have the highest fertility rate with 87.0 births per 1,000 women. Women in the age bracket of 20 to 34 years acount for 100.0% of all women with births.
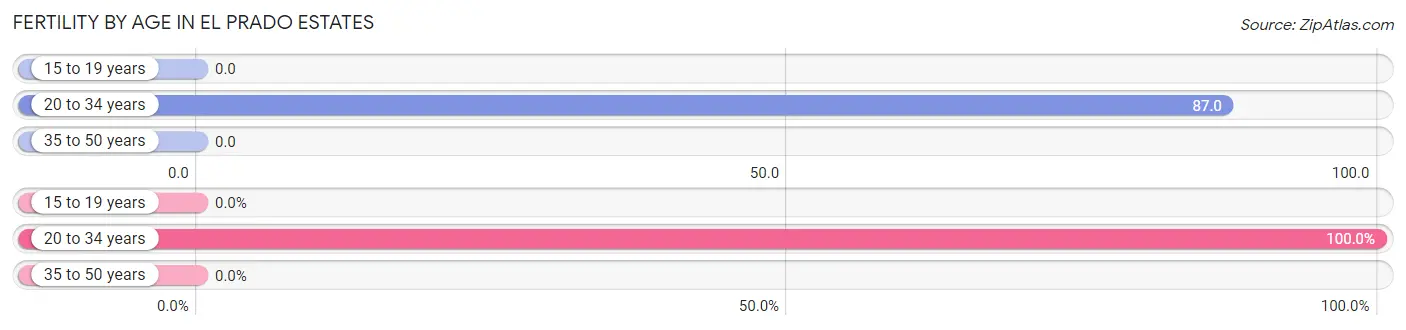
| Age Bracket | Women with Births | Births / 1,000 Women |
| 15 to 19 years | 0 (0.0%) | 0.0 |
| 20 to 34 years | 6 (100.0%) | 87.0 |
| 35 to 50 years | 0 (0.0%) | 0.0 |
| Total | 6 (100.0%) | 39.0 |
Fertility by Age by Marriage Status in El Prado Estates
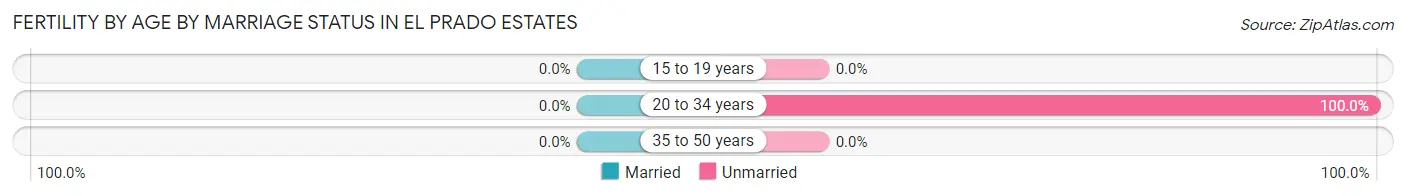
| Age Bracket | Married | Unmarried |
| 15 to 19 years | 0 (0.0%) | 0 (0.0%) |
| 20 to 34 years | 0 (0.0%) | 6 (100.0%) |
| 35 to 50 years | 0 (0.0%) | 0 (0.0%) |
| Total | 0 (0.0%) | 6 (100.0%) |
Fertility by Education in El Prado Estates
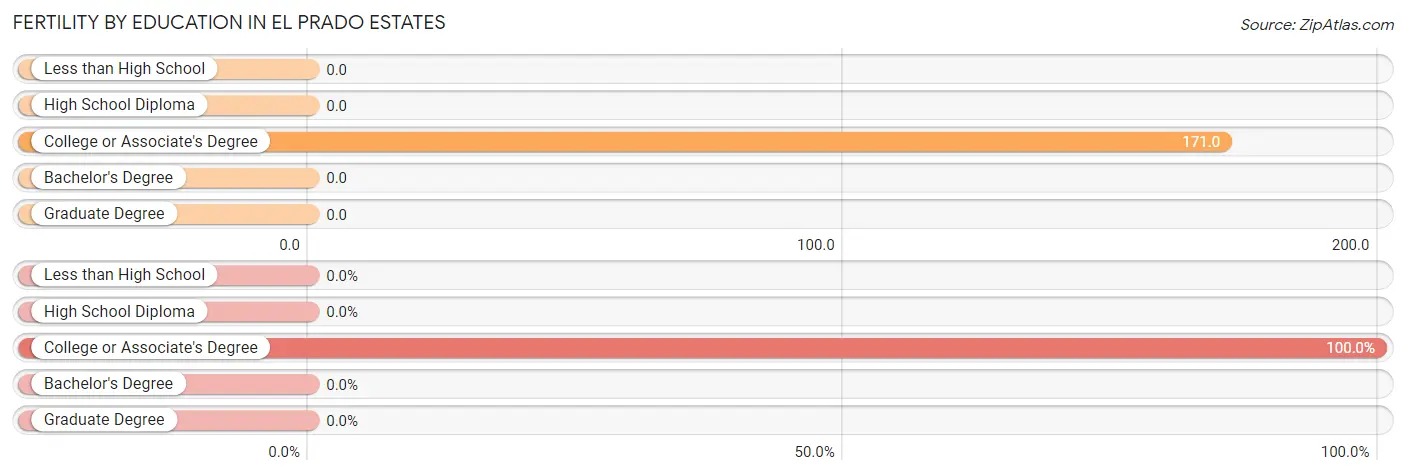
| Educational Attainment | Women with Births | Births / 1,000 Women |
| Less than High School | 0 (0.0%) | 0.0 |
| High School Diploma | 0 (0.0%) | 0.0 |
| College or Associate's Degree | 6 (100.0%) | 171.0 |
| Bachelor's Degree | 0 (0.0%) | 0.0 |
| Graduate Degree | 0 (0.0%) | 0.0 |
| Total | 6 (100.0%) | 39.0 |
Fertility by Education by Marriage Status in El Prado Estates
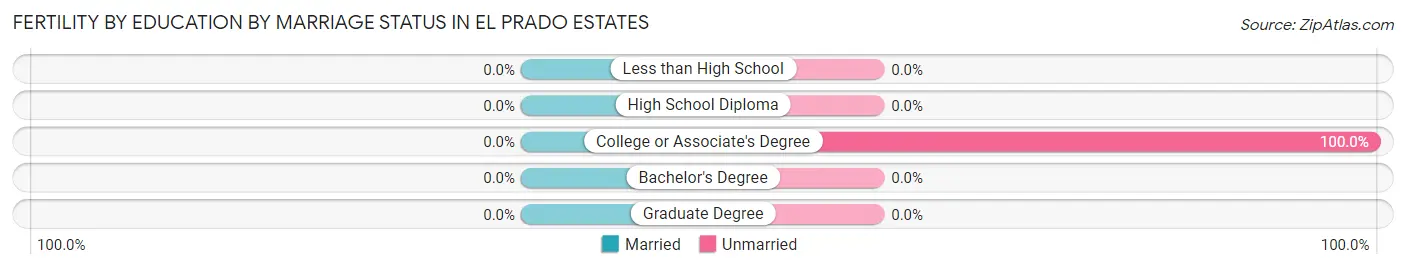
| Educational Attainment | Married | Unmarried |
| Less than High School | 0 (0.0%) | 0 (0.0%) |
| High School Diploma | 0 (0.0%) | 0 (0.0%) |
| College or Associate's Degree | 0 (0.0%) | 6 (100.0%) |
| Bachelor's Degree | 0 (0.0%) | 0 (0.0%) |
| Graduate Degree | 0 (0.0%) | 0 (0.0%) |
| Total | 0 (0.0%) | 6 (100.0%) |
Employment Characteristics in El Prado Estates
Employment by Class of Employer in El Prado Estates
Among the 234 employed individuals in El Prado Estates, private company employees (202 | 86.3%), local government employees (26 | 11.1%), and not-for-profit organizations (6 | 2.6%) make up the most common classes of employment.
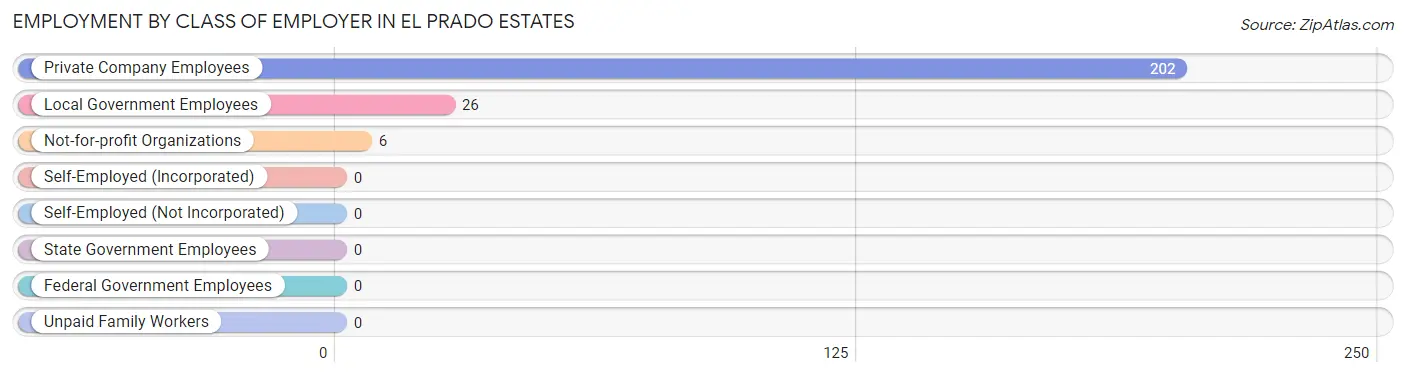
| Employer Class | # Employees | % Employees |
| Private Company Employees | 202 | 86.3% |
| Self-Employed (Incorporated) | 0 | 0.0% |
| Self-Employed (Not Incorporated) | 0 | 0.0% |
| Not-for-profit Organizations | 6 | 2.6% |
| Local Government Employees | 26 | 11.1% |
| State Government Employees | 0 | 0.0% |
| Federal Government Employees | 0 | 0.0% |
| Unpaid Family Workers | 0 | 0.0% |
| Total | 234 | 100.0% |
Employment Status by Age in El Prado Estates
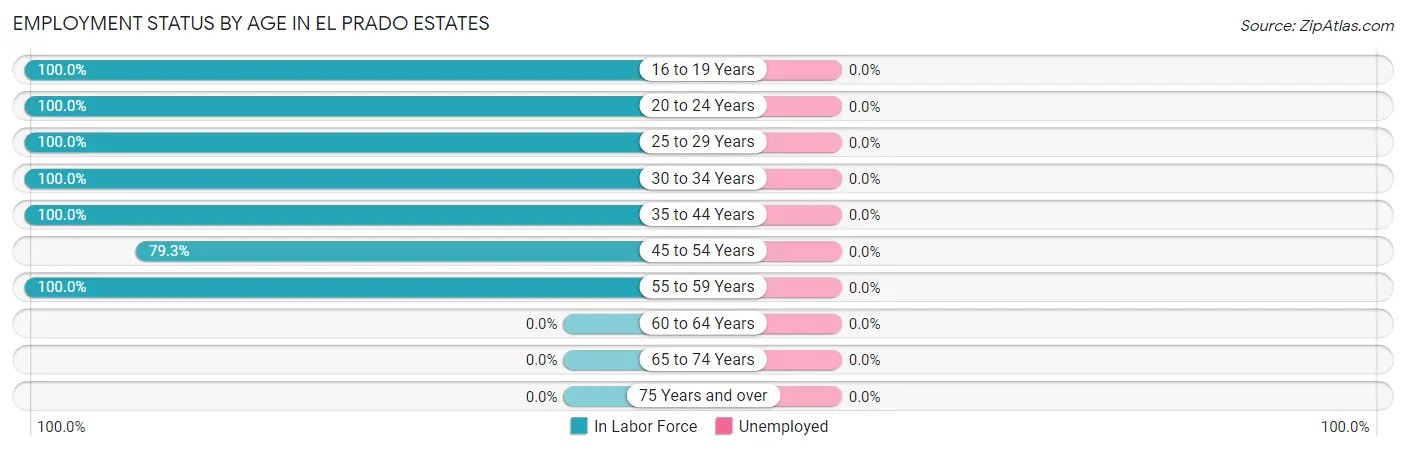
| Age Bracket | In Labor Force | Unemployed |
| 16 to 19 Years | 29 (100.0%) | 0 (0.0%) |
| 20 to 24 Years | 38 (100.0%) | 0 (0.0%) |
| 25 to 29 Years | 12 (100.0%) | 0 (0.0%) |
| 30 to 34 Years | 71 (100.0%) | 0 (0.0%) |
| 35 to 44 Years | 37 (100.0%) | 0 (0.0%) |
| 45 to 54 Years | 23 (79.3%) | 0 (0.0%) |
| 55 to 59 Years | 24 (100.0%) | 0 (0.0%) |
| 60 to 64 Years | 0 (0.0%) | 0 (0.0%) |
| 65 to 74 Years | 0 (0.0%) | 0 (0.0%) |
| 75 Years and over | 0 (0.0%) | 0 (0.0%) |
| Total | 234 (72.4%) | 0 (0.0%) |
Employment Status by Educational Attainment in El Prado Estates
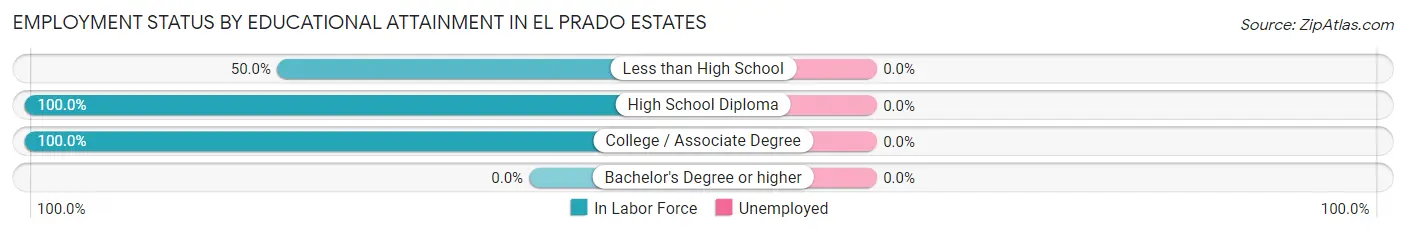
| Educational Attainment | In Labor Force | Unemployed |
| Less than High School | 22 (50.0%) | 0 (0.0%) |
| High School Diploma | 137 (100.0%) | 0 (0.0%) |
| College / Associate Degree | 8 (100.0%) | 0 (0.0%) |
| Bachelor's Degree or higher | 0 (0.0%) | 0 (0.0%) |
| Total | 167 (88.4%) | 0 (0.0%) |
Employment Occupations by Sex in El Prado Estates
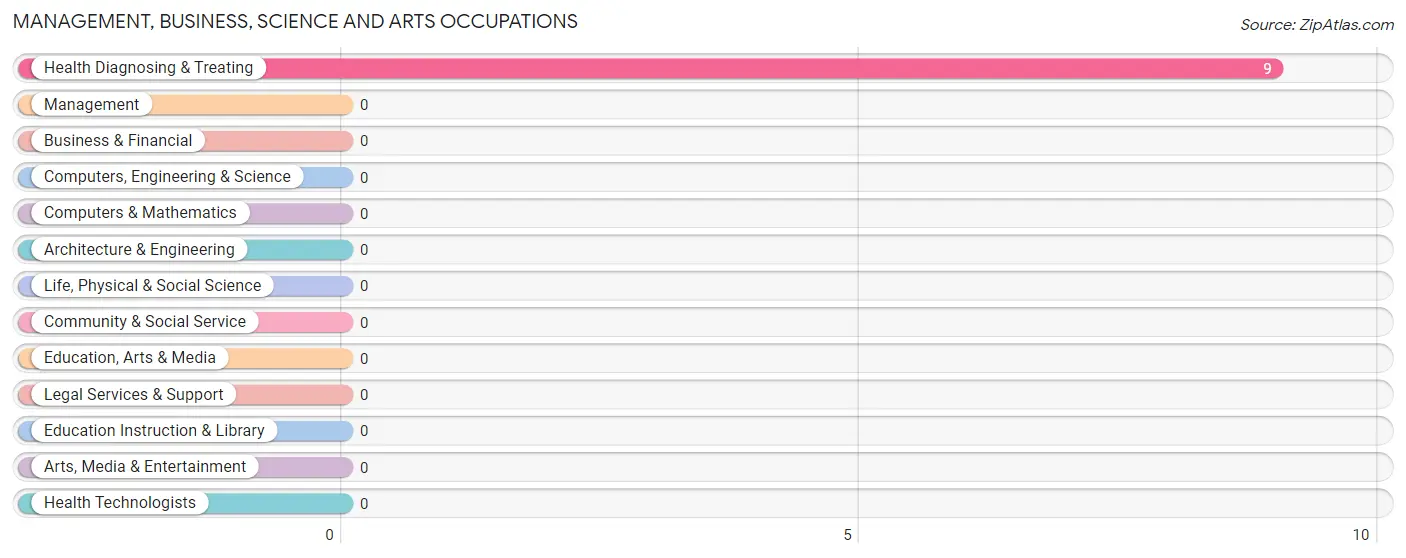
Management, Business, Science and Arts Occupations
The most common Management, Business, Science and Arts occupations in El Prado Estates are , and Health Diagnosing & Treating (9 | 3.8%).
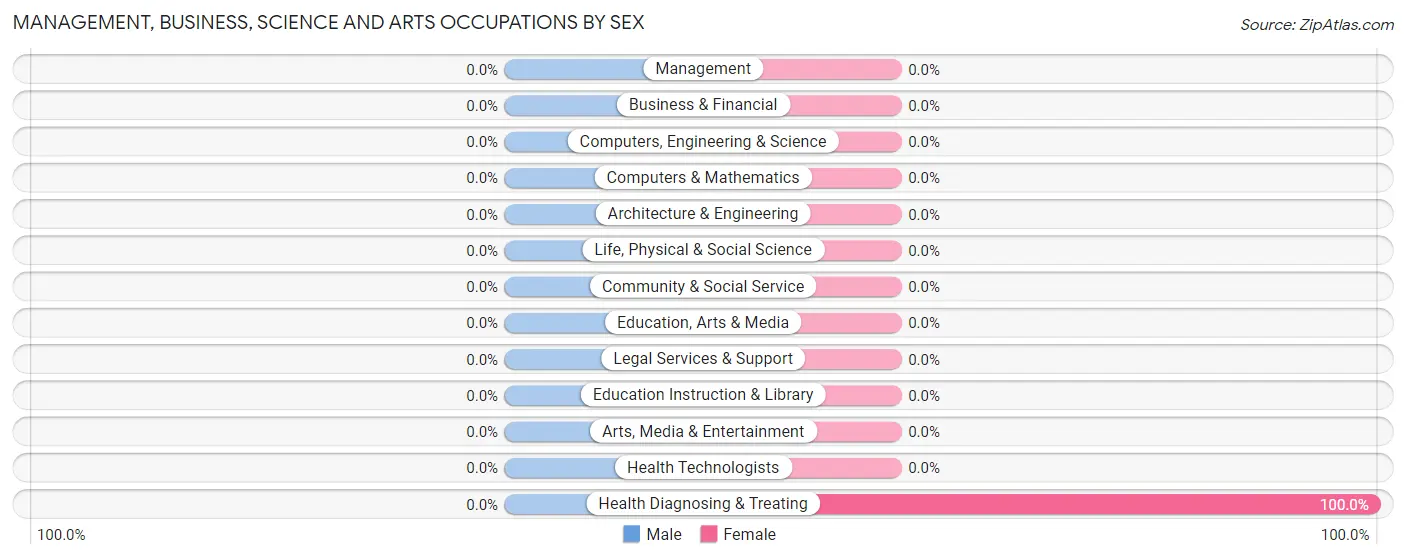
Management, Business, Science and Arts Occupations by Sex
| Occupation | Male | Female |
| Management | 0 (0.0%) | 0 (0.0%) |
| Business & Financial | 0 (0.0%) | 0 (0.0%) |
| Computers, Engineering & Science | 0 (0.0%) | 0 (0.0%) |
| Computers & Mathematics | 0 (0.0%) | 0 (0.0%) |
| Architecture & Engineering | 0 (0.0%) | 0 (0.0%) |
| Life, Physical & Social Science | 0 (0.0%) | 0 (0.0%) |
| Community & Social Service | 0 (0.0%) | 0 (0.0%) |
| Education, Arts & Media | 0 (0.0%) | 0 (0.0%) |
| Legal Services & Support | 0 (0.0%) | 0 (0.0%) |
| Education Instruction & Library | 0 (0.0%) | 0 (0.0%) |
| Arts, Media & Entertainment | 0 (0.0%) | 0 (0.0%) |
| Health Diagnosing & Treating | 0 (0.0%) | 9 (100.0%) |
| Health Technologists | 0 (0.0%) | 0 (0.0%) |
| Total (Category) | 0 (0.0%) | 9 (100.0%) |
| Total (Overall) | 72 (30.8%) | 162 (69.2%) |
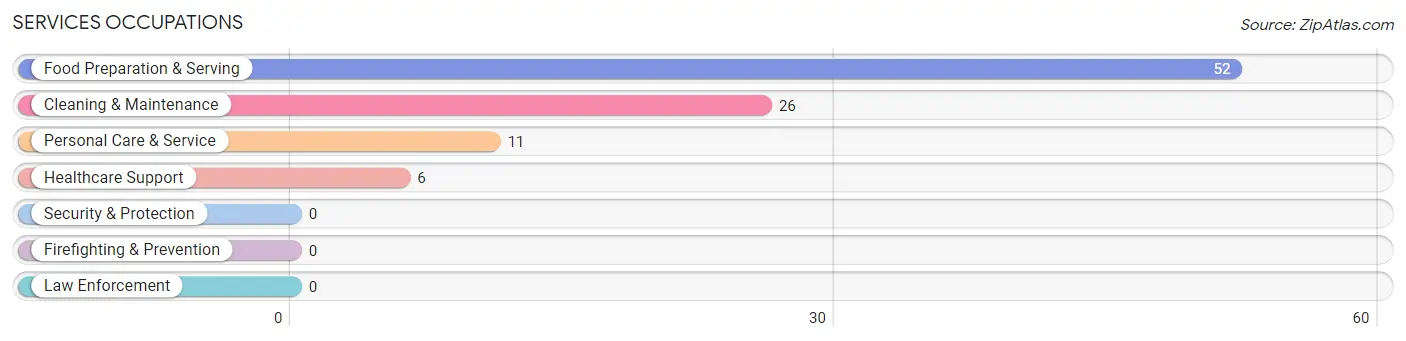
Services Occupations
The most common Services occupations in El Prado Estates are Food Preparation & Serving (52 | 22.2%), Cleaning & Maintenance (26 | 11.1%), Personal Care & Service (11 | 4.7%), and Healthcare Support (6 | 2.6%).
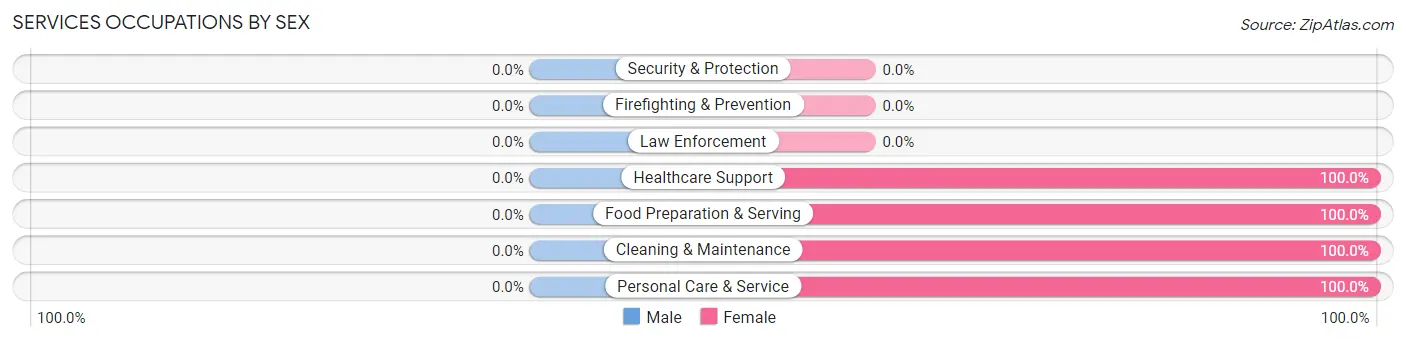
Services Occupations by Sex
| Occupation | Male | Female |
| Healthcare Support | 0 (0.0%) | 6 (100.0%) |
| Security & Protection | 0 (0.0%) | 0 (0.0%) |
| Firefighting & Prevention | 0 (0.0%) | 0 (0.0%) |
| Law Enforcement | 0 (0.0%) | 0 (0.0%) |
| Food Preparation & Serving | 0 (0.0%) | 52 (100.0%) |
| Cleaning & Maintenance | 0 (0.0%) | 26 (100.0%) |
| Personal Care & Service | 0 (0.0%) | 11 (100.0%) |
| Total (Category) | 0 (0.0%) | 95 (100.0%) |
| Total (Overall) | 72 (30.8%) | 162 (69.2%) |
Sales and Office Occupations
The most common Sales and Office occupations in El Prado Estates are , and Sales & Related (16 | 6.8%).

Sales and Office Occupations by Sex

| Occupation | Male | Female |
| Sales & Related | 0 (0.0%) | 16 (100.0%) |
| Office & Administration | 0 (0.0%) | 0 (0.0%) |
| Total (Category) | 0 (0.0%) | 16 (100.0%) |
| Total (Overall) | 72 (30.8%) | 162 (69.2%) |
Natural Resources, Construction and Maintenance Occupations
The most common Natural Resources, Construction and Maintenance occupations in El Prado Estates are Installation, Maintenance & Repair (52 | 22.2%), and Construction & Extraction (12 | 5.1%).
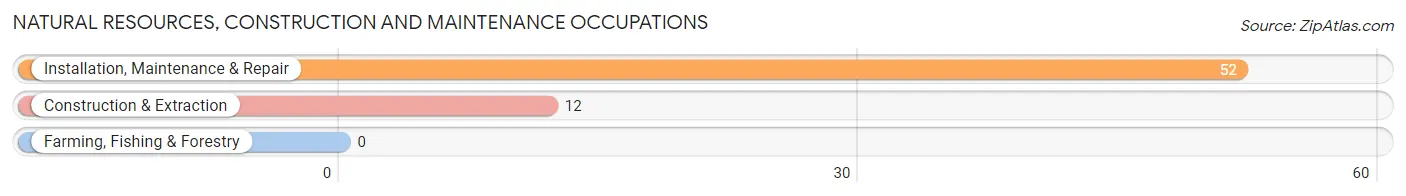
Natural Resources, Construction and Maintenance Occupations by Sex
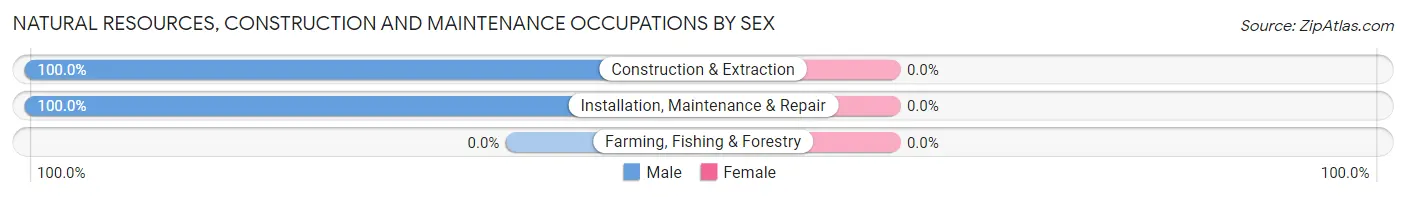
| Occupation | Male | Female |
| Farming, Fishing & Forestry | 0 (0.0%) | 0 (0.0%) |
| Construction & Extraction | 12 (100.0%) | 0 (0.0%) |
| Installation, Maintenance & Repair | 52 (100.0%) | 0 (0.0%) |
| Total (Category) | 64 (100.0%) | 0 (0.0%) |
| Total (Overall) | 72 (30.8%) | 162 (69.2%) |
Production, Transportation and Moving Occupations
The most common Production, Transportation and Moving occupations in El Prado Estates are Material Moving (42 | 17.9%), and Transportation (8 | 3.4%).
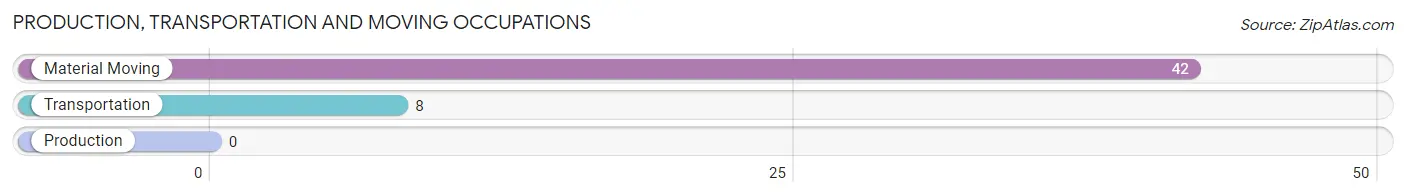
Production, Transportation and Moving Occupations by Sex
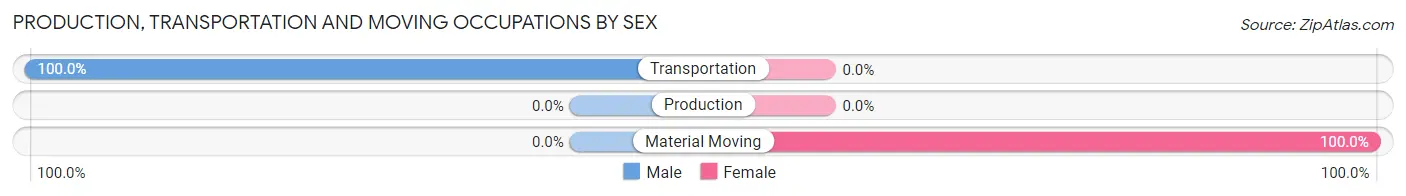
| Occupation | Male | Female |
| Production | 0 (0.0%) | 0 (0.0%) |
| Transportation | 8 (100.0%) | 0 (0.0%) |
| Material Moving | 0 (0.0%) | 42 (100.0%) |
| Total (Category) | 8 (16.0%) | 42 (84.0%) |
| Total (Overall) | 72 (30.8%) | 162 (69.2%) |
Employment Industries by Sex in El Prado Estates
Employment Industries in El Prado Estates
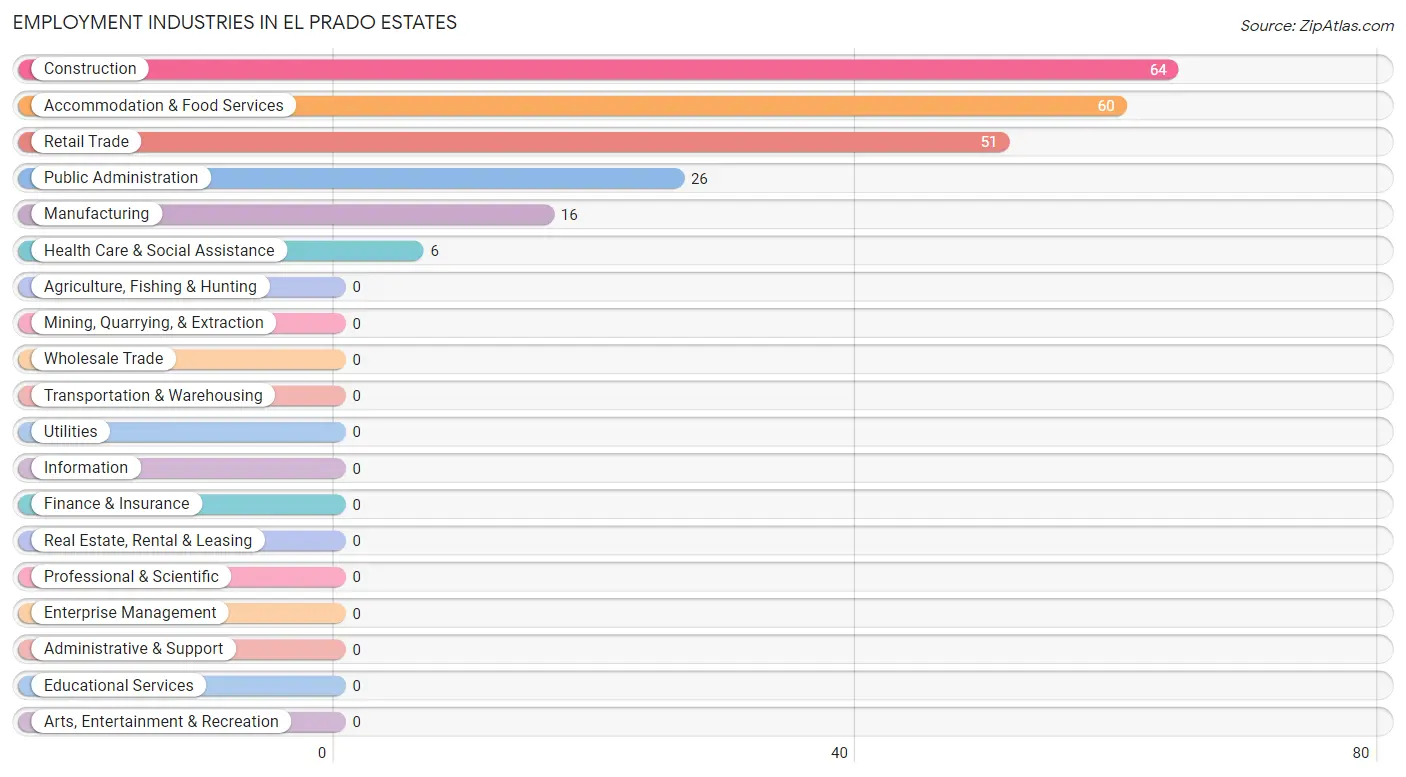
The major employment industries in El Prado Estates include Construction (64 | 27.4%), Accommodation & Food Services (60 | 25.6%), Retail Trade (51 | 21.8%), Public Administration (26 | 11.1%), and Manufacturing (16 | 6.8%).
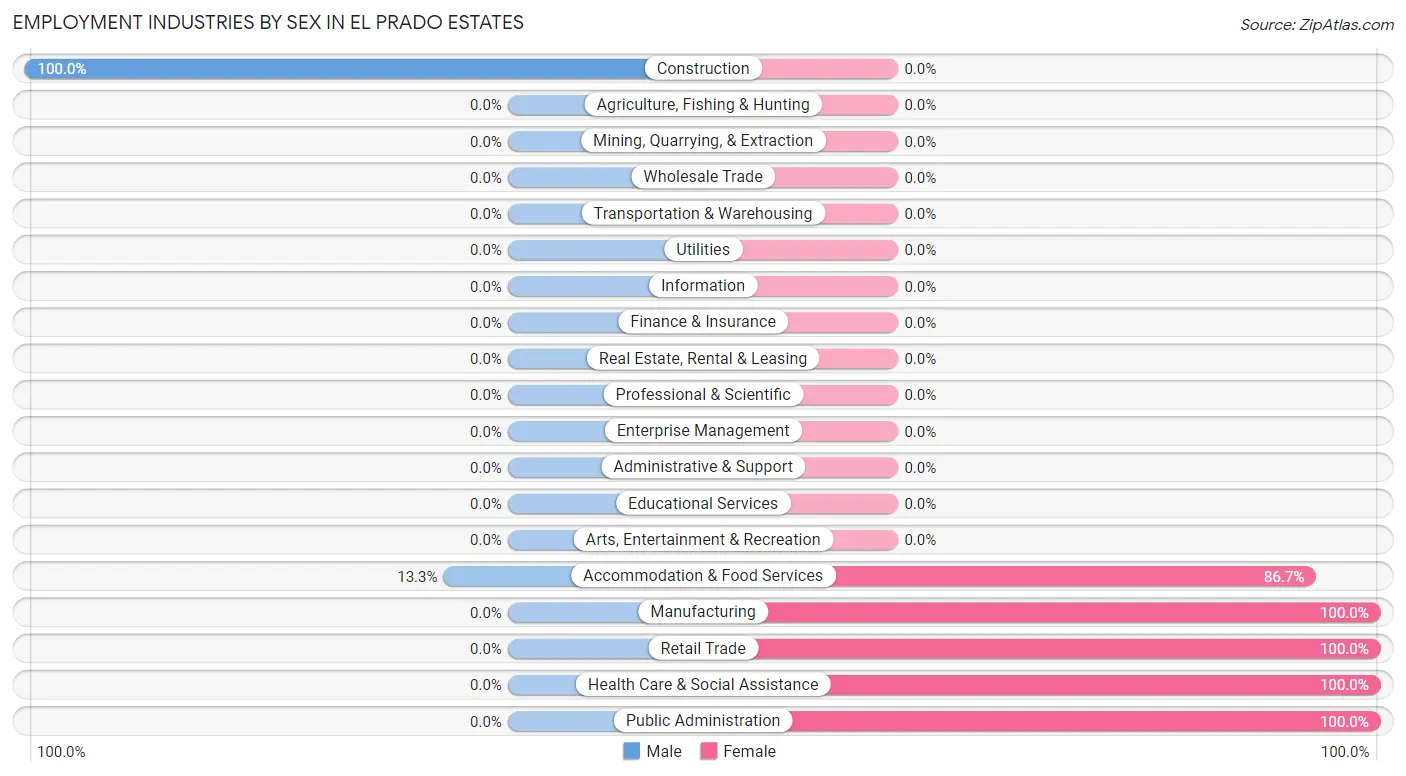
Employment Industries by Sex in El Prado Estates
The El Prado Estates industries that see more men than women are Construction (100.0%), and Accommodation & Food Services (13.3%), whereas the industries that tend to have a higher number of women are Manufacturing (100.0%), Retail Trade (100.0%), and Health Care & Social Assistance (100.0%).
| Industry | Male | Female |
| Agriculture, Fishing & Hunting | 0 (0.0%) | 0 (0.0%) |
| Mining, Quarrying, & Extraction | 0 (0.0%) | 0 (0.0%) |
| Construction | 64 (100.0%) | 0 (0.0%) |
| Manufacturing | 0 (0.0%) | 16 (100.0%) |
| Wholesale Trade | 0 (0.0%) | 0 (0.0%) |
| Retail Trade | 0 (0.0%) | 51 (100.0%) |
| Transportation & Warehousing | 0 (0.0%) | 0 (0.0%) |
| Utilities | 0 (0.0%) | 0 (0.0%) |
| Information | 0 (0.0%) | 0 (0.0%) |
| Finance & Insurance | 0 (0.0%) | 0 (0.0%) |
| Real Estate, Rental & Leasing | 0 (0.0%) | 0 (0.0%) |
| Professional & Scientific | 0 (0.0%) | 0 (0.0%) |
| Enterprise Management | 0 (0.0%) | 0 (0.0%) |
| Administrative & Support | 0 (0.0%) | 0 (0.0%) |
| Educational Services | 0 (0.0%) | 0 (0.0%) |
| Health Care & Social Assistance | 0 (0.0%) | 6 (100.0%) |
| Arts, Entertainment & Recreation | 0 (0.0%) | 0 (0.0%) |
| Accommodation & Food Services | 8 (13.3%) | 52 (86.7%) |
| Public Administration | 0 (0.0%) | 26 (100.0%) |
| Total | 72 (30.8%) | 162 (69.2%) |
Education in El Prado Estates
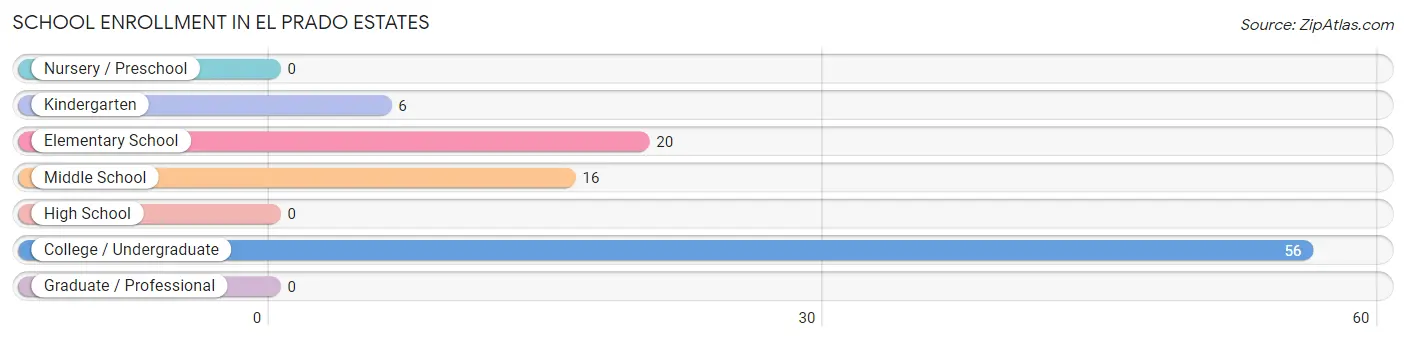
School Enrollment in El Prado Estates
The most common levels of schooling among the 98 students in El Prado Estates are college / undergraduate (56 | 57.1%), elementary school (20 | 20.4%), and middle school (16 | 16.3%).
| School Level | # Students | % Students |
| Nursery / Preschool | 0 | 0.0% |
| Kindergarten | 6 | 6.1% |
| Elementary School | 20 | 20.4% |
| Middle School | 16 | 16.3% |
| High School | 0 | 0.0% |
| College / Undergraduate | 56 | 57.1% |
| Graduate / Professional | 0 | 0.0% |
| Total | 98 | 100.0% |
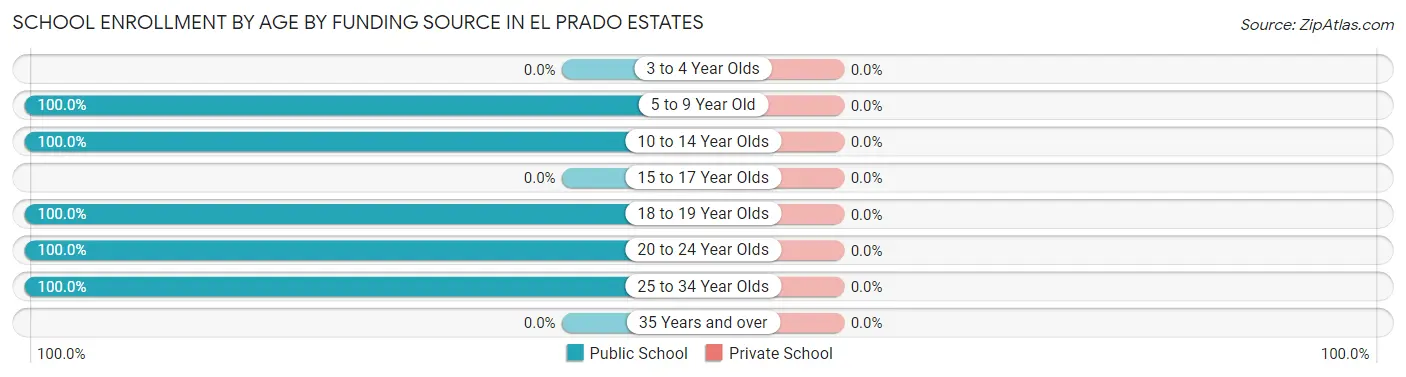
School Enrollment by Age by Funding Source in El Prado Estates
| Age Bracket | Public School | Private School |
| 3 to 4 Year Olds | 0 (0.0%) | 0 (0.0%) |
| 5 to 9 Year Old | 26 (100.0%) | 0 (0.0%) |
| 10 to 14 Year Olds | 16 (100.0%) | 0 (0.0%) |
| 15 to 17 Year Olds | 0 (0.0%) | 0 (0.0%) |
| 18 to 19 Year Olds | 29 (100.0%) | 0 (0.0%) |
| 20 to 24 Year Olds | 15 (100.0%) | 0 (0.0%) |
| 25 to 34 Year Olds | 12 (100.0%) | 0 (0.0%) |
| 35 Years and over | 0 (0.0%) | 0 (0.0%) |
| Total | 98 (100.0%) | 0 (0.0%) |
Educational Attainment by Field of Study in El Prado Estates
| Field of Study | # Graduates | % Graduates |
| Computers & Mathematics | 0 | 0.0% |
| Bio, Nature & Agricultural | 0 | 0.0% |
| Physical & Health Sciences | 0 | 0.0% |
| Psychology | 0 | 0.0% |
| Social Sciences | 0 | 0.0% |
| Engineering | 0 | 0.0% |
| Multidisciplinary Studies | 0 | 0.0% |
| Science & Technology | 0 | 0.0% |
| Business | 0 | 0.0% |
| Education | 0 | 0.0% |
| Literature & Languages | 0 | 0.0% |
| Liberal Arts & History | 0 | 0.0% |
| Visual & Performing Arts | 0 | 0.0% |
| Communications | 0 | 0.0% |
| Arts & Humanities | 0 | 0.0% |
| Total | 0 | 0.0% |
Transportation & Commute in El Prado Estates
Vehicle Availability by Sex in El Prado Estates
The most prevalent vehicle ownership categories in El Prado Estates are males with 2 vehicles (60, accounting for 83.3%) and females with 2 vehicles (95, making up 37.0%).
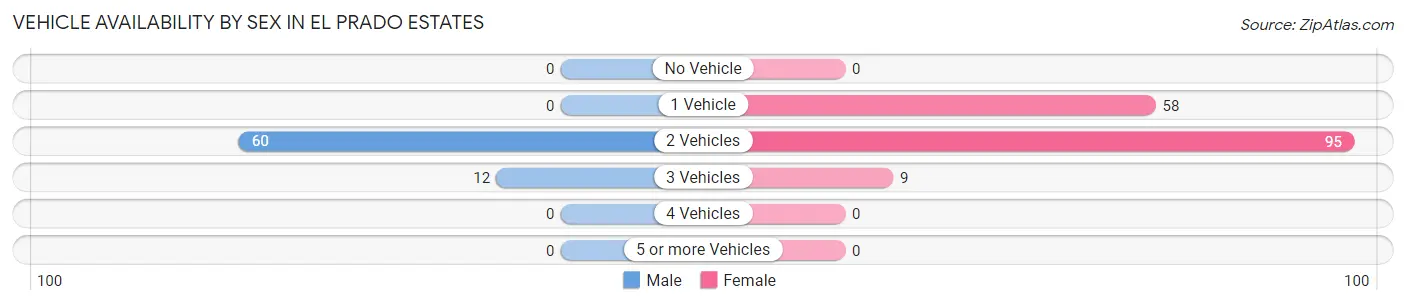
| Vehicles Available | Male | Female |
| No Vehicle | 0 (0.0%) | 0 (0.0%) |
| 1 Vehicle | 0 (0.0%) | 58 (35.8%) |
| 2 Vehicles | 60 (83.3%) | 95 (58.6%) |
| 3 Vehicles | 12 (16.7%) | 9 (5.6%) |
| 4 Vehicles | 0 (0.0%) | 0 (0.0%) |
| 5 or more Vehicles | 0 (0.0%) | 0 (0.0%) |
| Total | 72 (100.0%) | 162 (100.0%) |
Commute Time in El Prado Estates
The most frequently occuring commute durations in El Prado Estates are 10 to 14 minutes (103 commuters, 44.0%), 15 to 19 minutes (94 commuters, 40.2%), and 20 to 24 minutes (14 commuters, 6.0%).
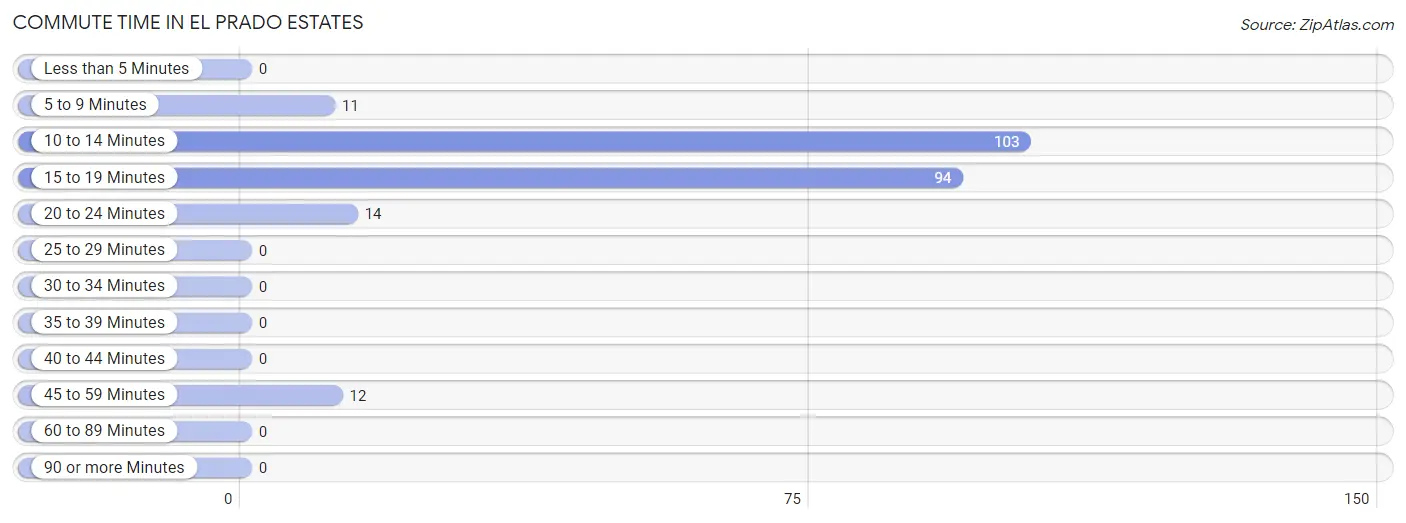
| Commute Time | # Commuters | % Commuters |
| Less than 5 Minutes | 0 | 0.0% |
| 5 to 9 Minutes | 11 | 4.7% |
| 10 to 14 Minutes | 103 | 44.0% |
| 15 to 19 Minutes | 94 | 40.2% |
| 20 to 24 Minutes | 14 | 6.0% |
| 25 to 29 Minutes | 0 | 0.0% |
| 30 to 34 Minutes | 0 | 0.0% |
| 35 to 39 Minutes | 0 | 0.0% |
| 40 to 44 Minutes | 0 | 0.0% |
| 45 to 59 Minutes | 12 | 5.1% |
| 60 to 89 Minutes | 0 | 0.0% |
| 90 or more Minutes | 0 | 0.0% |
Commute Time by Sex in El Prado Estates
The most common commute times in El Prado Estates are 15 to 19 minutes (40 commuters, 55.6%) for males and 10 to 14 minutes (91 commuters, 56.2%) for females.
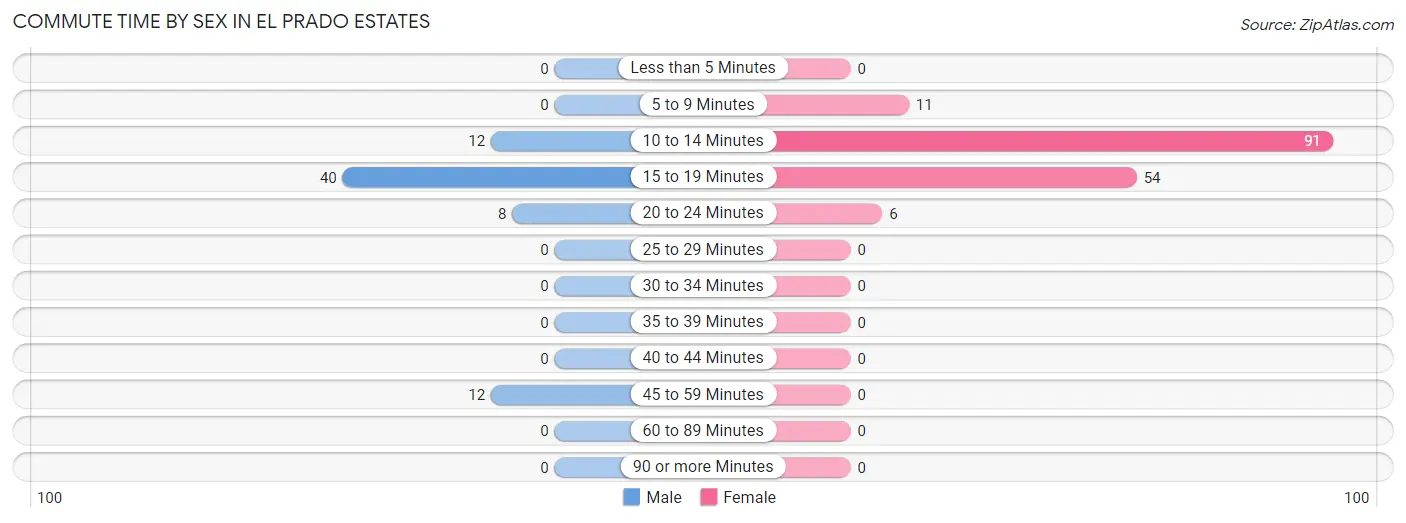
| Commute Time | Male | Female |
| Less than 5 Minutes | 0 (0.0%) | 0 (0.0%) |
| 5 to 9 Minutes | 0 (0.0%) | 11 (6.8%) |
| 10 to 14 Minutes | 12 (16.7%) | 91 (56.2%) |
| 15 to 19 Minutes | 40 (55.6%) | 54 (33.3%) |
| 20 to 24 Minutes | 8 (11.1%) | 6 (3.7%) |
| 25 to 29 Minutes | 0 (0.0%) | 0 (0.0%) |
| 30 to 34 Minutes | 0 (0.0%) | 0 (0.0%) |
| 35 to 39 Minutes | 0 (0.0%) | 0 (0.0%) |
| 40 to 44 Minutes | 0 (0.0%) | 0 (0.0%) |
| 45 to 59 Minutes | 12 (16.7%) | 0 (0.0%) |
| 60 to 89 Minutes | 0 (0.0%) | 0 (0.0%) |
| 90 or more Minutes | 0 (0.0%) | 0 (0.0%) |
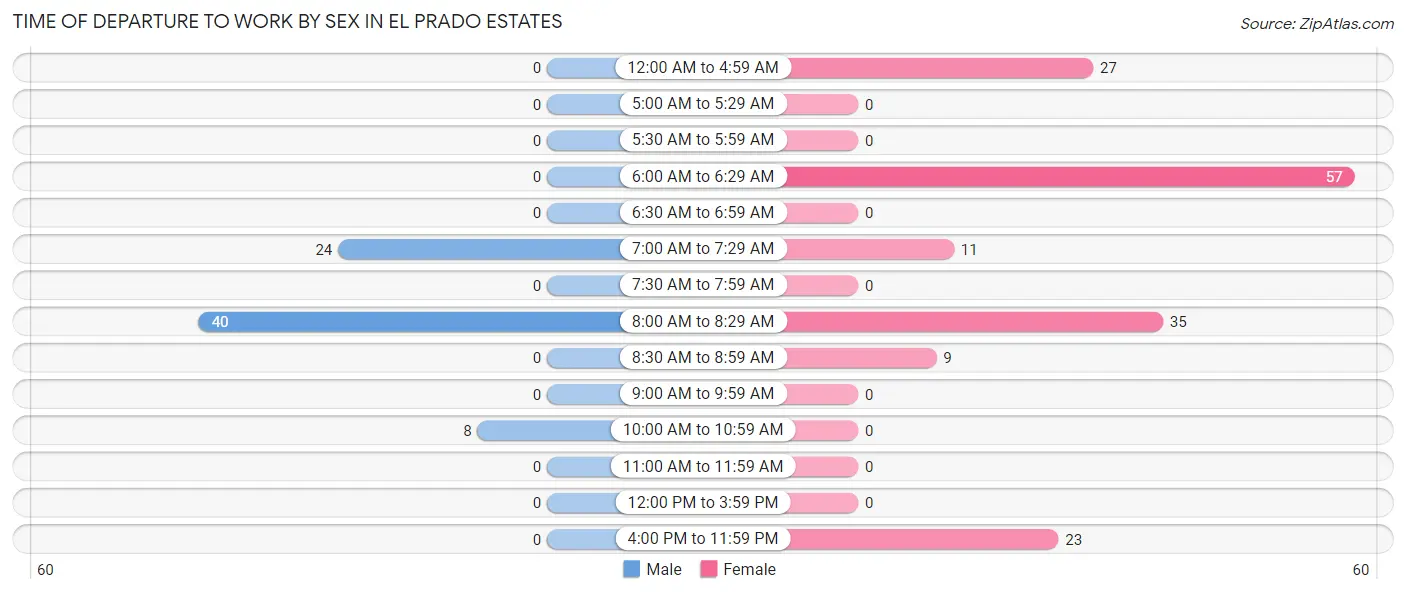
Time of Departure to Work by Sex in El Prado Estates
The most frequent times of departure to work in El Prado Estates are 8:00 AM to 8:29 AM (40, 55.6%) for males and 6:00 AM to 6:29 AM (57, 35.2%) for females.
| Time of Departure | Male | Female |
| 12:00 AM to 4:59 AM | 0 (0.0%) | 27 (16.7%) |
| 5:00 AM to 5:29 AM | 0 (0.0%) | 0 (0.0%) |
| 5:30 AM to 5:59 AM | 0 (0.0%) | 0 (0.0%) |
| 6:00 AM to 6:29 AM | 0 (0.0%) | 57 (35.2%) |
| 6:30 AM to 6:59 AM | 0 (0.0%) | 0 (0.0%) |
| 7:00 AM to 7:29 AM | 24 (33.3%) | 11 (6.8%) |
| 7:30 AM to 7:59 AM | 0 (0.0%) | 0 (0.0%) |
| 8:00 AM to 8:29 AM | 40 (55.6%) | 35 (21.6%) |
| 8:30 AM to 8:59 AM | 0 (0.0%) | 9 (5.6%) |
| 9:00 AM to 9:59 AM | 0 (0.0%) | 0 (0.0%) |
| 10:00 AM to 10:59 AM | 8 (11.1%) | 0 (0.0%) |
| 11:00 AM to 11:59 AM | 0 (0.0%) | 0 (0.0%) |
| 12:00 PM to 3:59 PM | 0 (0.0%) | 0 (0.0%) |
| 4:00 PM to 11:59 PM | 0 (0.0%) | 23 (14.2%) |
| Total | 72 (100.0%) | 162 (100.0%) |
Housing Occupancy in El Prado Estates
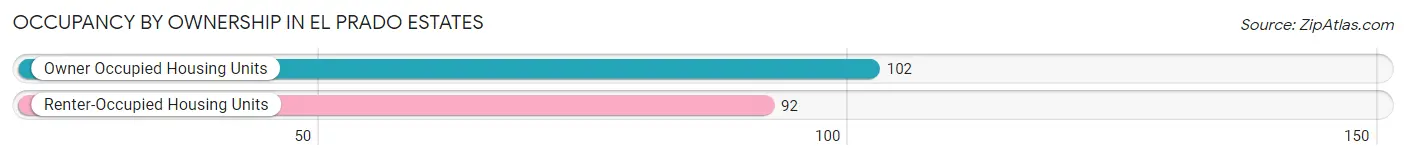
Occupancy by Ownership in El Prado Estates
Of the total 194 dwellings in El Prado Estates, owner-occupied units account for 102 (52.6%), while renter-occupied units make up 92 (47.4%).
| Occupancy | # Housing Units | % Housing Units |
| Owner Occupied Housing Units | 102 | 52.6% |
| Renter-Occupied Housing Units | 92 | 47.4% |
| Total Occupied Housing Units | 194 | 100.0% |
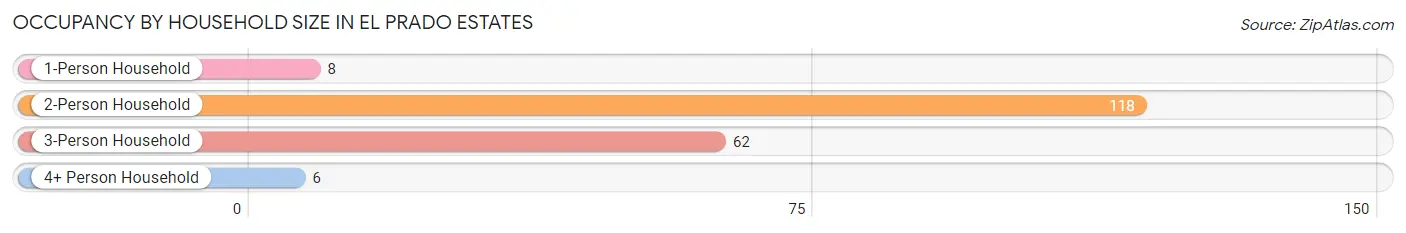
Occupancy by Household Size in El Prado Estates
| Household Size | # Housing Units | % Housing Units |
| 1-Person Household | 8 | 4.1% |
| 2-Person Household | 118 | 60.8% |
| 3-Person Household | 62 | 32.0% |
| 4+ Person Household | 6 | 3.1% |
| Total Housing Units | 194 | 100.0% |
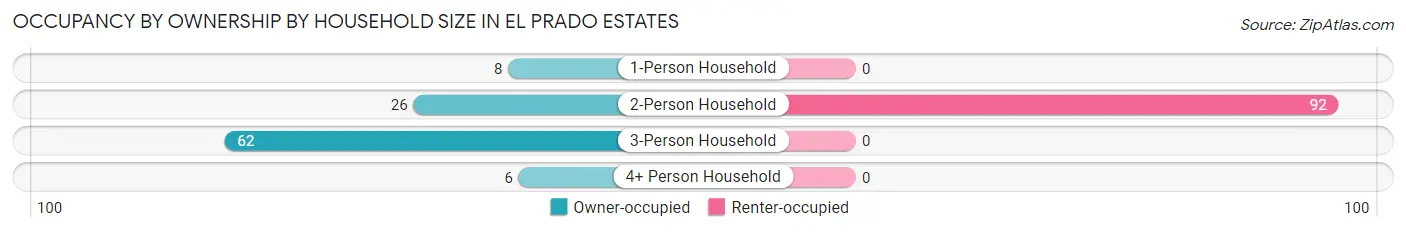
Occupancy by Ownership by Household Size in El Prado Estates
| Household Size | Owner-occupied | Renter-occupied |
| 1-Person Household | 8 (100.0%) | 0 (0.0%) |
| 2-Person Household | 26 (22.0%) | 92 (78.0%) |
| 3-Person Household | 62 (100.0%) | 0 (0.0%) |
| 4+ Person Household | 6 (100.0%) | 0 (0.0%) |
| Total Housing Units | 102 (52.6%) | 92 (47.4%) |
Occupancy by Educational Attainment in El Prado Estates
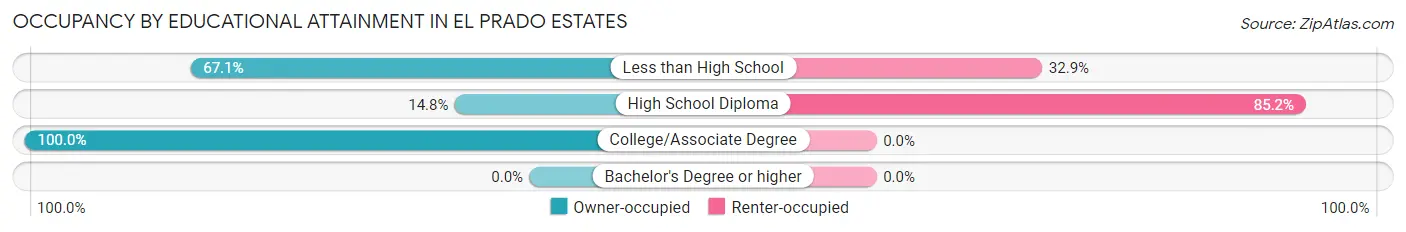
| Household Size | Owner-occupied | Renter-occupied |
| Less than High School | 47 (67.1%) | 23 (32.9%) |
| High School Diploma | 12 (14.8%) | 69 (85.2%) |
| College/Associate Degree | 43 (100.0%) | 0 (0.0%) |
| Bachelor's Degree or higher | 0 (0.0%) | 0 (0.0%) |
Occupancy by Age of Householder in El Prado Estates
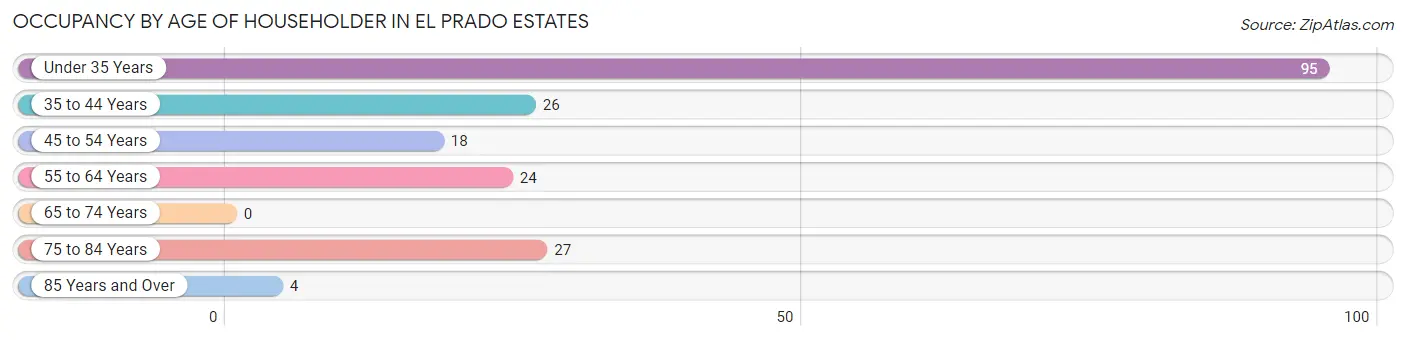
| Age Bracket | # Households | % Households |
| Under 35 Years | 95 | 49.0% |
| 35 to 44 Years | 26 | 13.4% |
| 45 to 54 Years | 18 | 9.3% |
| 55 to 64 Years | 24 | 12.4% |
| 65 to 74 Years | 0 | 0.0% |
| 75 to 84 Years | 27 | 13.9% |
| 85 Years and Over | 4 | 2.1% |
| Total | 194 | 100.0% |
Housing Finances in El Prado Estates
Median Income by Occupancy in El Prado Estates
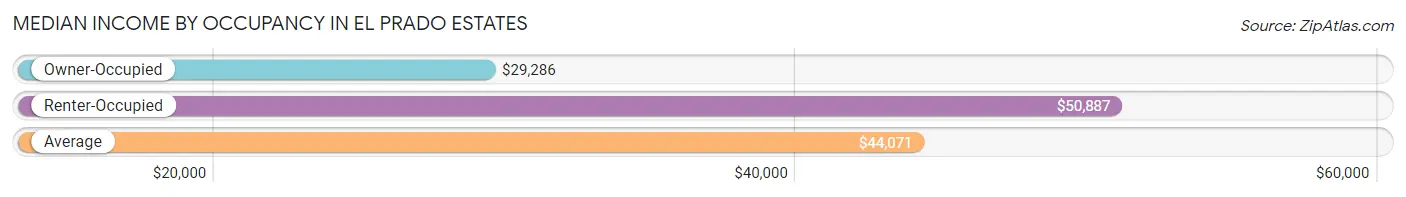
| Occupancy Type | # Households | Median Income |
| Owner-Occupied | 102 (52.6%) | $29,286 |
| Renter-Occupied | 92 (47.4%) | $50,887 |
| Average | 194 (100.0%) | $44,071 |
Occupancy by Householder Income Bracket in El Prado Estates
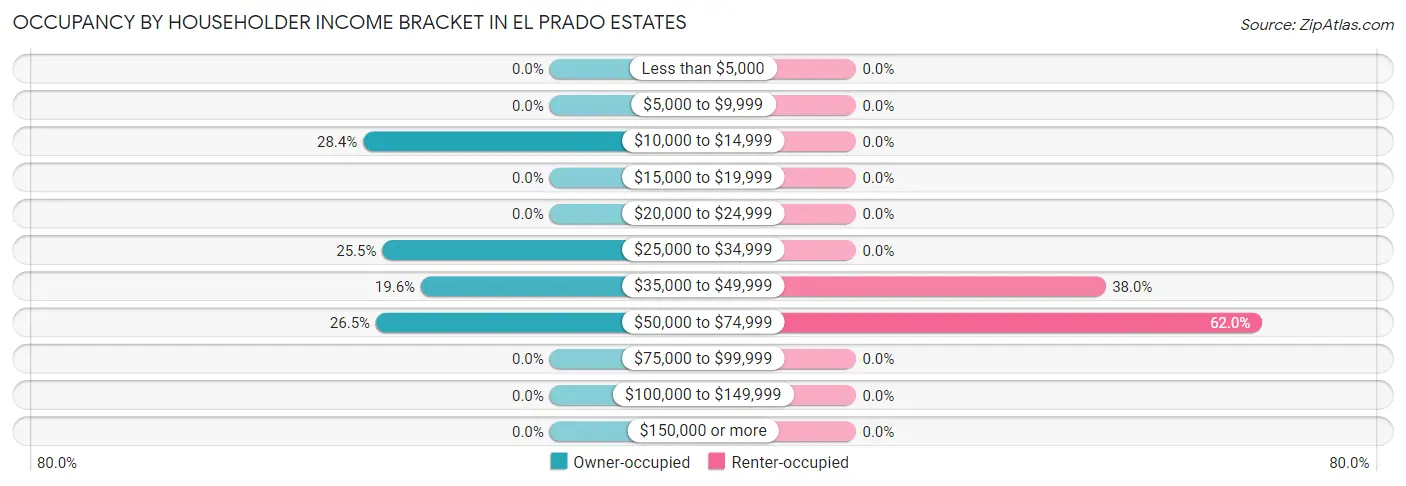
| Income Bracket | Owner-occupied | Renter-occupied |
| Less than $5,000 | 0 (0.0%) | 0 (0.0%) |
| $5,000 to $9,999 | 0 (0.0%) | 0 (0.0%) |
| $10,000 to $14,999 | 29 (28.4%) | 0 (0.0%) |
| $15,000 to $19,999 | 0 (0.0%) | 0 (0.0%) |
| $20,000 to $24,999 | 0 (0.0%) | 0 (0.0%) |
| $25,000 to $34,999 | 26 (25.5%) | 0 (0.0%) |
| $35,000 to $49,999 | 20 (19.6%) | 35 (38.0%) |
| $50,000 to $74,999 | 27 (26.5%) | 57 (62.0%) |
| $75,000 to $99,999 | 0 (0.0%) | 0 (0.0%) |
| $100,000 to $149,999 | 0 (0.0%) | 0 (0.0%) |
| $150,000 or more | 0 (0.0%) | 0 (0.0%) |
| Total | 102 (100.0%) | 92 (100.0%) |
Monthly Housing Cost Tiers in El Prado Estates
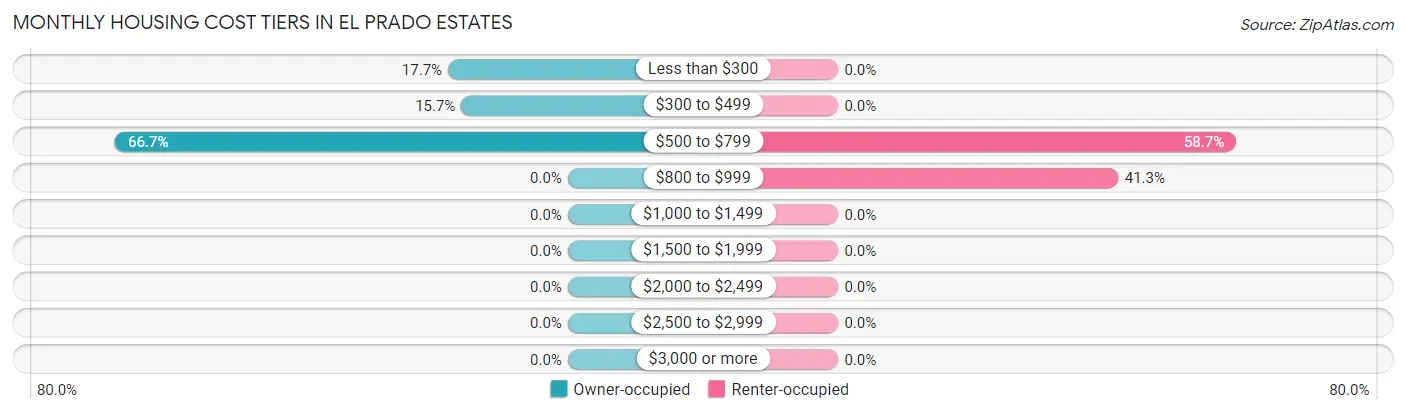
| Monthly Cost | Owner-occupied | Renter-occupied |
| Less than $300 | 18 (17.6%) | 0 (0.0%) |
| $300 to $499 | 16 (15.7%) | 0 (0.0%) |
| $500 to $799 | 68 (66.7%) | 54 (58.7%) |
| $800 to $999 | 0 (0.0%) | 38 (41.3%) |
| $1,000 to $1,499 | 0 (0.0%) | 0 (0.0%) |
| $1,500 to $1,999 | 0 (0.0%) | 0 (0.0%) |
| $2,000 to $2,499 | 0 (0.0%) | 0 (0.0%) |
| $2,500 to $2,999 | 0 (0.0%) | 0 (0.0%) |
| $3,000 or more | 0 (0.0%) | 0 (0.0%) |
| Total | 102 (100.0%) | 92 (100.0%) |
Physical Housing Characteristics in El Prado Estates
Housing Structures in El Prado Estates
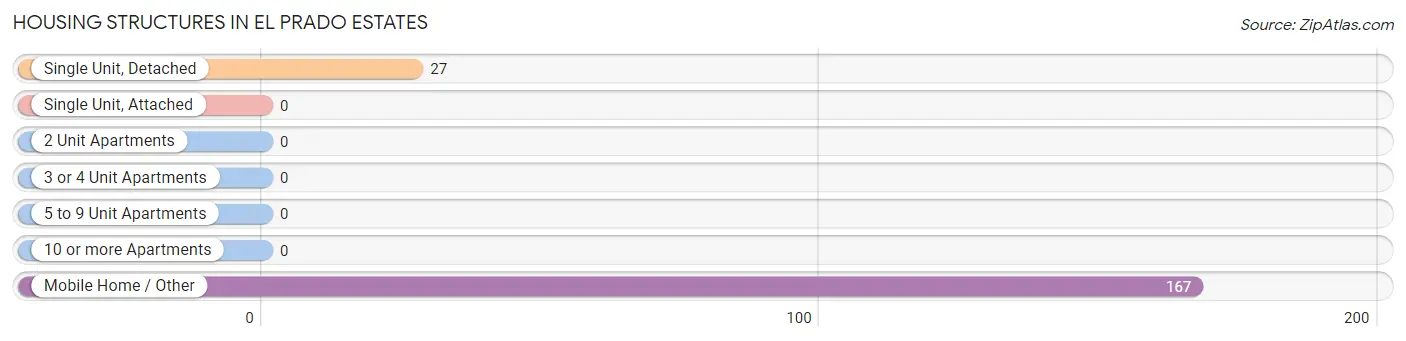
| Structure Type | # Housing Units | % Housing Units |
| Single Unit, Detached | 27 | 13.9% |
| Single Unit, Attached | 0 | 0.0% |
| 2 Unit Apartments | 0 | 0.0% |
| 3 or 4 Unit Apartments | 0 | 0.0% |
| 5 to 9 Unit Apartments | 0 | 0.0% |
| 10 or more Apartments | 0 | 0.0% |
| Mobile Home / Other | 167 | 86.1% |
| Total | 194 | 100.0% |
Housing Structures by Occupancy in El Prado Estates
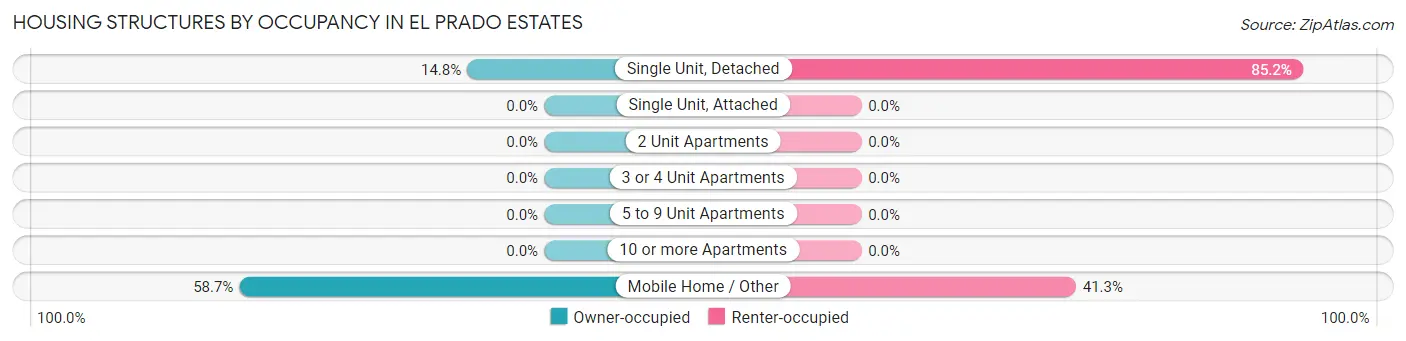
| Structure Type | Owner-occupied | Renter-occupied |
| Single Unit, Detached | 4 (14.8%) | 23 (85.2%) |
| Single Unit, Attached | 0 (0.0%) | 0 (0.0%) |
| 2 Unit Apartments | 0 (0.0%) | 0 (0.0%) |
| 3 or 4 Unit Apartments | 0 (0.0%) | 0 (0.0%) |
| 5 to 9 Unit Apartments | 0 (0.0%) | 0 (0.0%) |
| 10 or more Apartments | 0 (0.0%) | 0 (0.0%) |
| Mobile Home / Other | 98 (58.7%) | 69 (41.3%) |
| Total | 102 (52.6%) | 92 (47.4%) |
Housing Structures by Number of Rooms in El Prado Estates
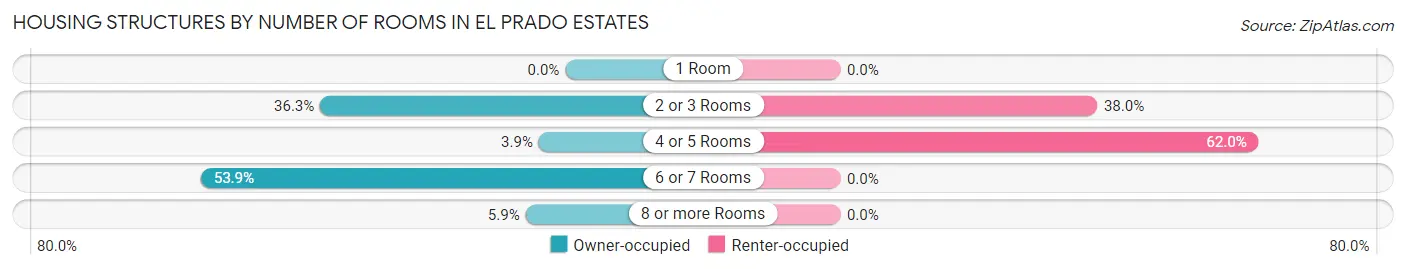
| Number of Rooms | Owner-occupied | Renter-occupied |
| 1 Room | 0 (0.0%) | 0 (0.0%) |
| 2 or 3 Rooms | 37 (36.3%) | 35 (38.0%) |
| 4 or 5 Rooms | 4 (3.9%) | 57 (62.0%) |
| 6 or 7 Rooms | 55 (53.9%) | 0 (0.0%) |
| 8 or more Rooms | 6 (5.9%) | 0 (0.0%) |
| Total | 102 (100.0%) | 92 (100.0%) |
Housing Structure by Heating Type in El Prado Estates
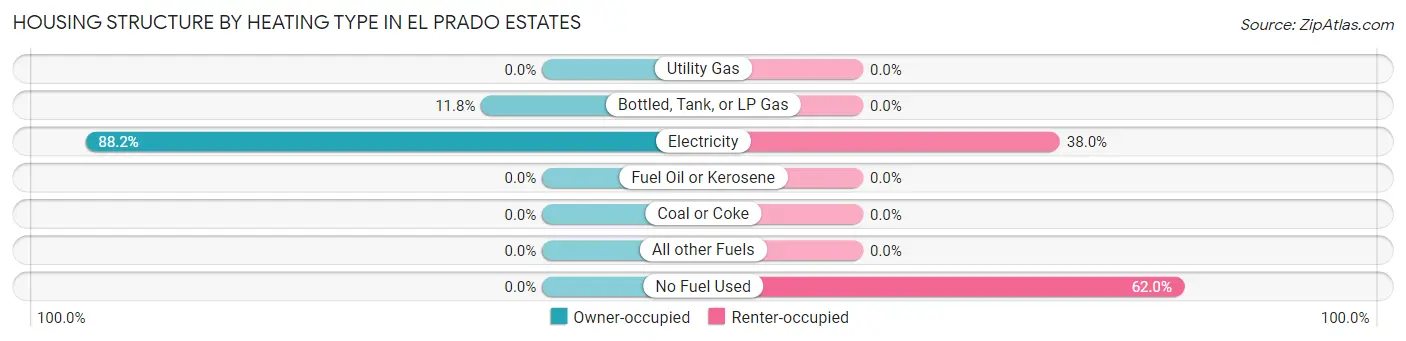
| Heating Type | Owner-occupied | Renter-occupied |
| Utility Gas | 0 (0.0%) | 0 (0.0%) |
| Bottled, Tank, or LP Gas | 12 (11.8%) | 0 (0.0%) |
| Electricity | 90 (88.2%) | 35 (38.0%) |
| Fuel Oil or Kerosene | 0 (0.0%) | 0 (0.0%) |
| Coal or Coke | 0 (0.0%) | 0 (0.0%) |
| All other Fuels | 0 (0.0%) | 0 (0.0%) |
| No Fuel Used | 0 (0.0%) | 57 (62.0%) |
| Total | 102 (100.0%) | 92 (100.0%) |
Household Vehicle Usage in El Prado Estates
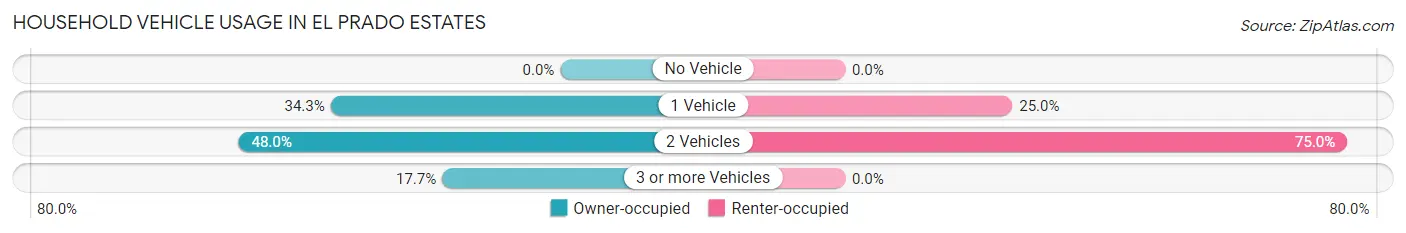
| Vehicles per Household | Owner-occupied | Renter-occupied |
| No Vehicle | 0 (0.0%) | 0 (0.0%) |
| 1 Vehicle | 35 (34.3%) | 23 (25.0%) |
| 2 Vehicles | 49 (48.0%) | 69 (75.0%) |
| 3 or more Vehicles | 18 (17.6%) | 0 (0.0%) |
| Total | 102 (100.0%) | 92 (100.0%) |
Real Estate & Mortgages in El Prado Estates
Real Estate and Mortgage Overview in El Prado Estates
| Characteristic | Without Mortgage | With Mortgage |
| Housing Units | 102 | 0 |
| Median Property Value | - | - |
| Median Household Income | $29,286 | $0 |
| Monthly Housing Costs | $541 | $0 |
| Real Estate Taxes | $1,250 | $0 |
Property Value by Mortgage Status in El Prado Estates
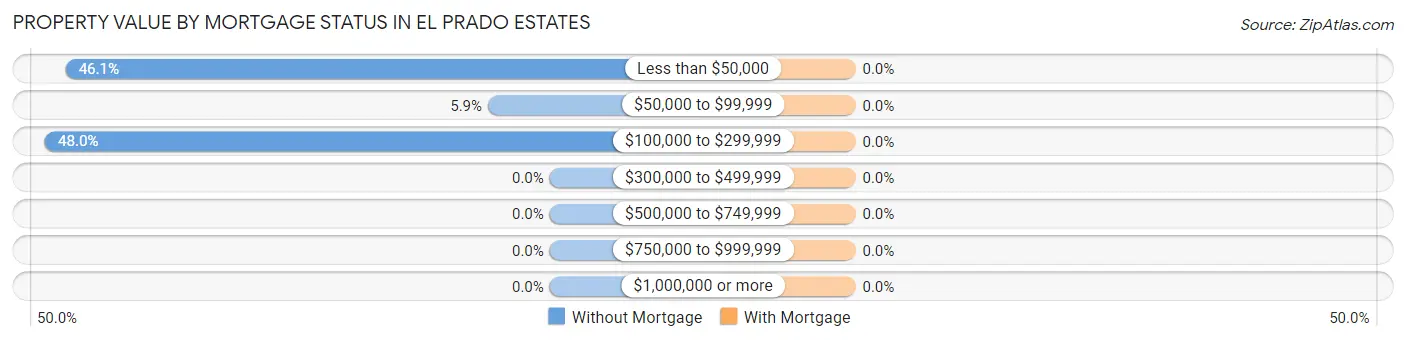
| Property Value | Without Mortgage | With Mortgage |
| Less than $50,000 | 47 (46.1%) | 0 (0.0%) |
| $50,000 to $99,999 | 6 (5.9%) | 0 (0.0%) |
| $100,000 to $299,999 | 49 (48.0%) | 0 (0.0%) |
| $300,000 to $499,999 | 0 (0.0%) | 0 (0.0%) |
| $500,000 to $749,999 | 0 (0.0%) | 0 (0.0%) |
| $750,000 to $999,999 | 0 (0.0%) | 0 (0.0%) |
| $1,000,000 or more | 0 (0.0%) | 0 (0.0%) |
| Total | 102 (100.0%) | 0 (0.0%) |
Household Income by Mortgage Status in El Prado Estates
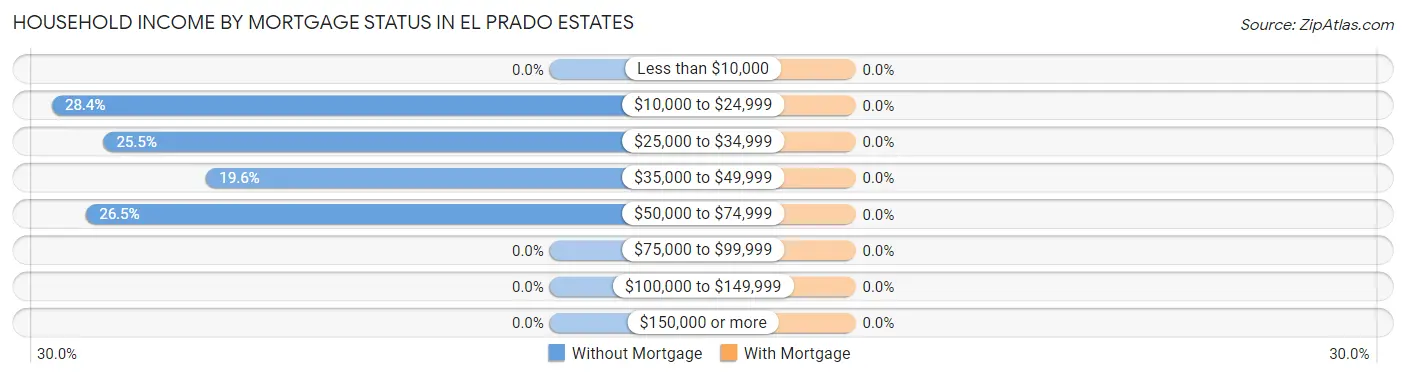
| Household Income | Without Mortgage | With Mortgage |
| Less than $10,000 | 0 (0.0%) | 0 (0.0%) |
| $10,000 to $24,999 | 29 (28.4%) | 0 (0.0%) |
| $25,000 to $34,999 | 26 (25.5%) | 0 (0.0%) |
| $35,000 to $49,999 | 20 (19.6%) | 0 (0.0%) |
| $50,000 to $74,999 | 27 (26.5%) | 0 (0.0%) |
| $75,000 to $99,999 | 0 (0.0%) | 0 (0.0%) |
| $100,000 to $149,999 | 0 (0.0%) | 0 (0.0%) |
| $150,000 or more | 0 (0.0%) | 0 (0.0%) |
| Total | 102 (100.0%) | 0 (0.0%) |
Property Value to Household Income Ratio in El Prado Estates
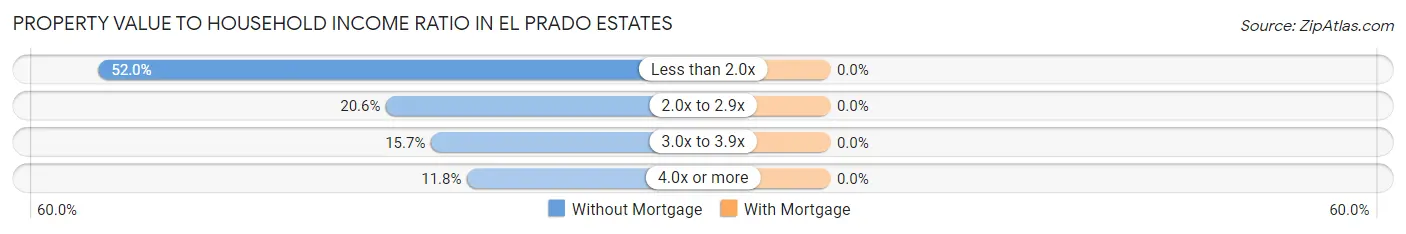
| Value-to-Income Ratio | Without Mortgage | With Mortgage |
| Less than 2.0x | 53 (52.0%) | 0 (0.0%) |
| 2.0x to 2.9x | 21 (20.6%) | 0 (0.0%) |
| 3.0x to 3.9x | 16 (15.7%) | 0 (0.0%) |
| 4.0x or more | 12 (11.8%) | 0 (0.0%) |
| Total | 102 (100.0%) | 0 (0.0%) |
Real Estate Taxes by Mortgage Status in El Prado Estates
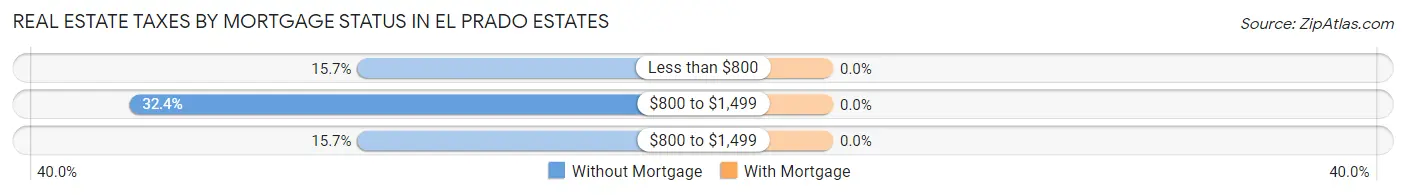
| Property Taxes | Without Mortgage | With Mortgage |
| Less than $800 | 16 (15.7%) | 0 (0.0%) |
| $800 to $1,499 | 33 (32.4%) | 0 (0.0%) |
| $800 to $1,499 | 16 (15.7%) | 0 (0.0%) |
| Total | 102 (100.0%) | 0 (0.0%) |
Health & Disability in El Prado Estates
Health Insurance Coverage by Age in El Prado Estates
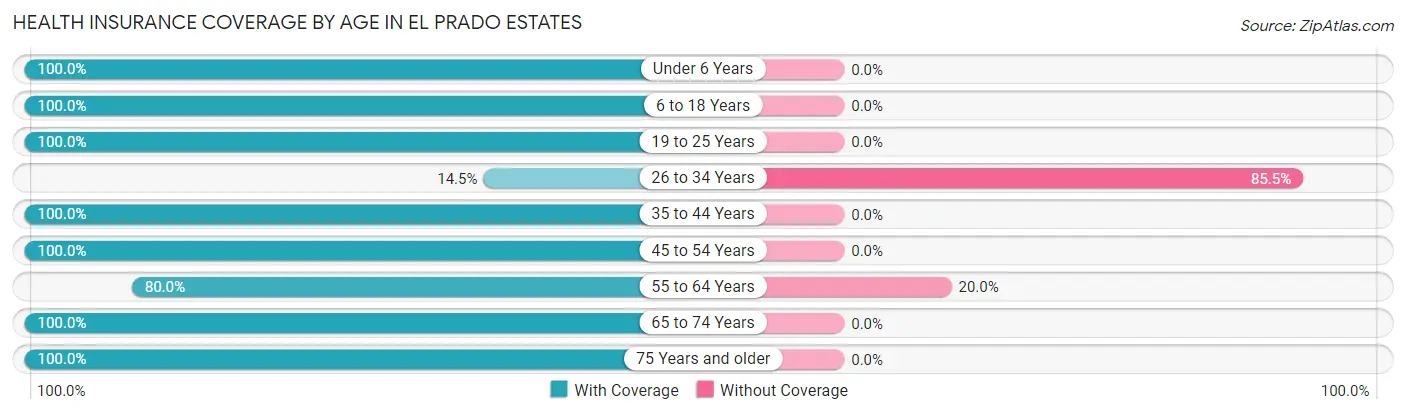
| Age Bracket | With Coverage | Without Coverage |
| Under 6 Years | 26 (100.0%) | 0 (0.0%) |
| 6 to 18 Years | 42 (100.0%) | 0 (0.0%) |
| 19 to 25 Years | 67 (100.0%) | 0 (0.0%) |
| 26 to 34 Years | 12 (14.5%) | 71 (85.5%) |
| 35 to 44 Years | 37 (100.0%) | 0 (0.0%) |
| 45 to 54 Years | 29 (100.0%) | 0 (0.0%) |
| 55 to 64 Years | 32 (80.0%) | 8 (20.0%) |
| 65 to 74 Years | 15 (100.0%) | 0 (0.0%) |
| 75 Years and older | 52 (100.0%) | 0 (0.0%) |
| Total | 312 (79.8%) | 79 (20.2%) |
Health Insurance Coverage by Citizenship Status in El Prado Estates
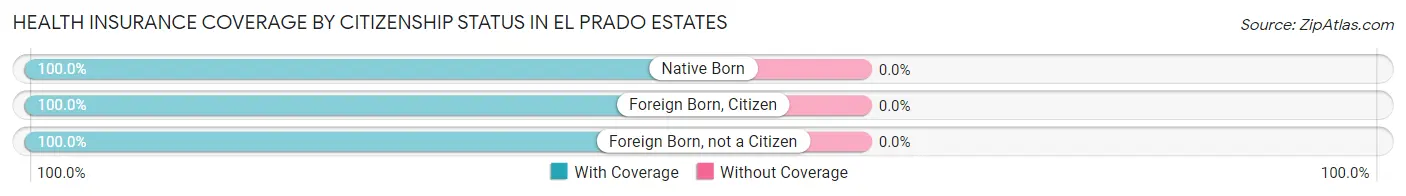
| Citizenship Status | With Coverage | Without Coverage |
| Native Born | 26 (100.0%) | 0 (0.0%) |
| Foreign Born, Citizen | 42 (100.0%) | 0 (0.0%) |
| Foreign Born, not a Citizen | 67 (100.0%) | 0 (0.0%) |
Health Insurance Coverage by Household Income in El Prado Estates
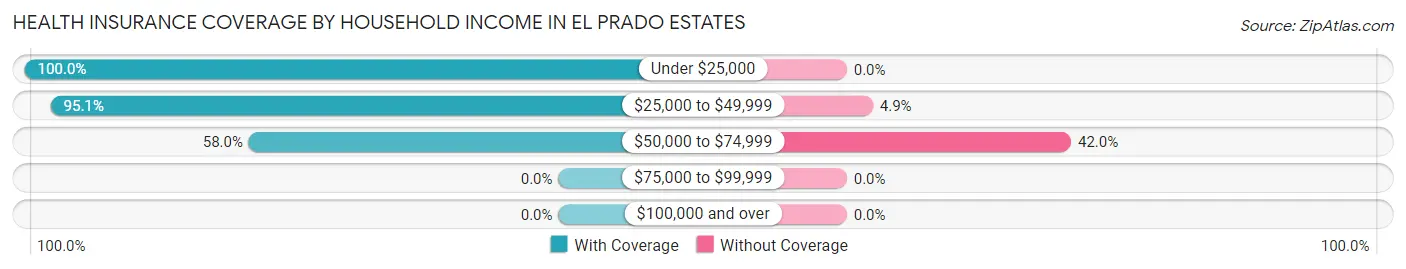
| Household Income | With Coverage | Without Coverage |
| Under $25,000 | 58 (100.0%) | 0 (0.0%) |
| $25,000 to $49,999 | 156 (95.1%) | 8 (4.9%) |
| $50,000 to $74,999 | 98 (58.0%) | 71 (42.0%) |
| $75,000 to $99,999 | 0 (0.0%) | 0 (0.0%) |
| $100,000 and over | 0 (0.0%) | 0 (0.0%) |
Public vs Private Health Insurance Coverage by Age in El Prado Estates
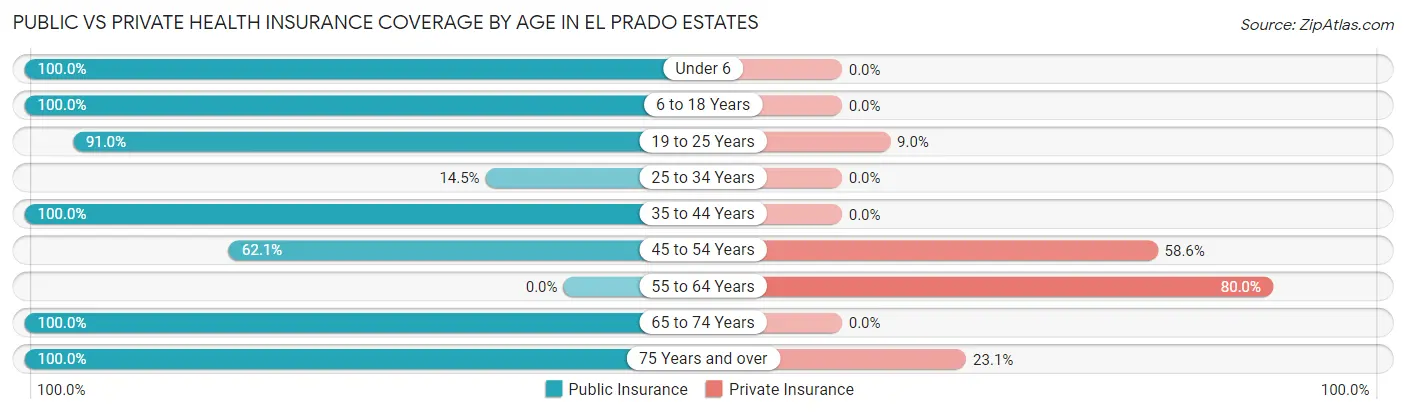
| Age Bracket | Public Insurance | Private Insurance |
| Under 6 | 26 (100.0%) | 0 (0.0%) |
| 6 to 18 Years | 42 (100.0%) | 0 (0.0%) |
| 19 to 25 Years | 61 (91.0%) | 6 (9.0%) |
| 25 to 34 Years | 12 (14.5%) | 0 (0.0%) |
| 35 to 44 Years | 37 (100.0%) | 0 (0.0%) |
| 45 to 54 Years | 18 (62.1%) | 17 (58.6%) |
| 55 to 64 Years | 0 (0.0%) | 32 (80.0%) |
| 65 to 74 Years | 15 (100.0%) | 0 (0.0%) |
| 75 Years and over | 52 (100.0%) | 12 (23.1%) |
| Total | 263 (67.3%) | 67 (17.1%) |
Disability Status by Sex by Age in El Prado Estates
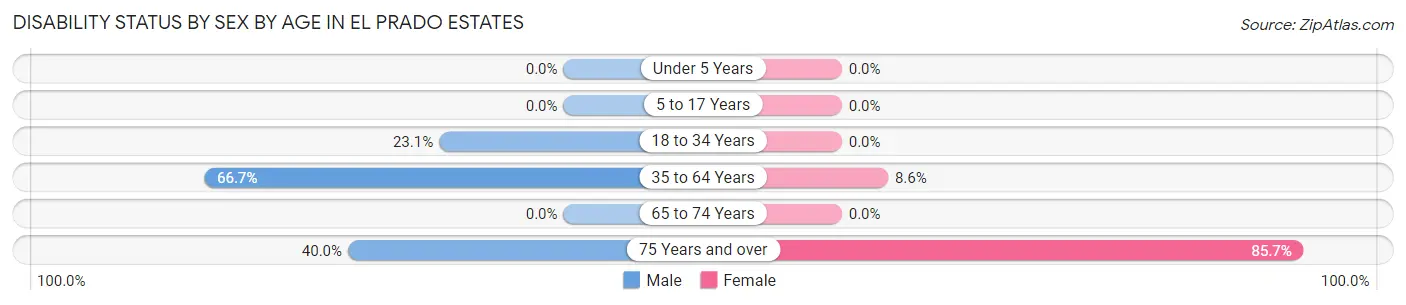
| Age Bracket | Male | Female |
| Under 5 Years | 0 (0.0%) | 0 (0.0%) |
| 5 to 17 Years | 0 (0.0%) | 0 (0.0%) |
| 18 to 34 Years | 12 (23.1%) | 0 (0.0%) |
| 35 to 64 Years | 24 (66.7%) | 6 (8.6%) |
| 65 to 74 Years | 0 (0.0%) | 0 (0.0%) |
| 75 Years and over | 4 (40.0%) | 36 (85.7%) |
Disability Class by Sex by Age in El Prado Estates
Disability Class: Hearing Difficulty
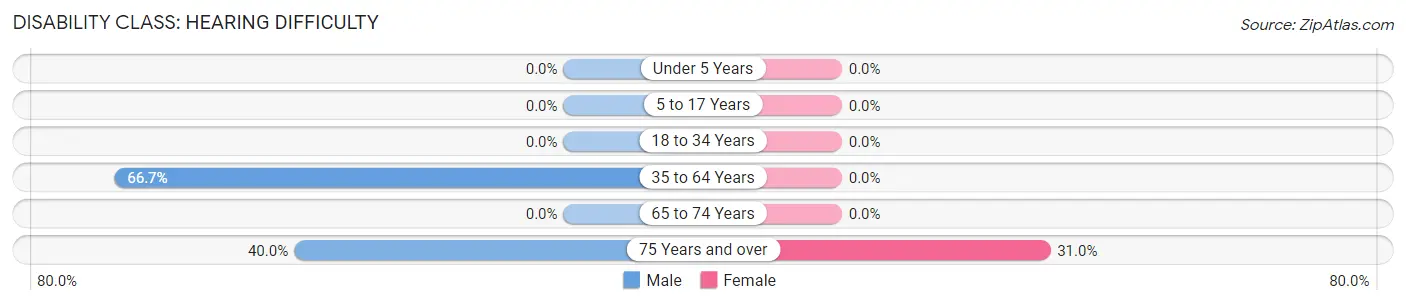
| Age Bracket | Male | Female |
| Under 5 Years | 0 (0.0%) | 0 (0.0%) |
| 5 to 17 Years | 0 (0.0%) | 0 (0.0%) |
| 18 to 34 Years | 0 (0.0%) | 0 (0.0%) |
| 35 to 64 Years | 24 (66.7%) | 0 (0.0%) |
| 65 to 74 Years | 0 (0.0%) | 0 (0.0%) |
| 75 Years and over | 4 (40.0%) | 13 (30.9%) |
Disability Class: Vision Difficulty
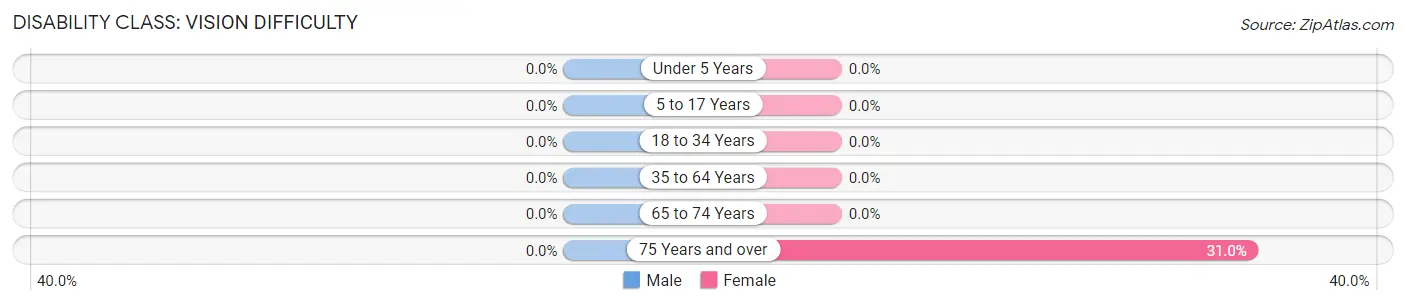
| Age Bracket | Male | Female |
| Under 5 Years | 0 (0.0%) | 0 (0.0%) |
| 5 to 17 Years | 0 (0.0%) | 0 (0.0%) |
| 18 to 34 Years | 0 (0.0%) | 0 (0.0%) |
| 35 to 64 Years | 0 (0.0%) | 0 (0.0%) |
| 65 to 74 Years | 0 (0.0%) | 0 (0.0%) |
| 75 Years and over | 0 (0.0%) | 13 (30.9%) |
Disability Class: Cognitive Difficulty
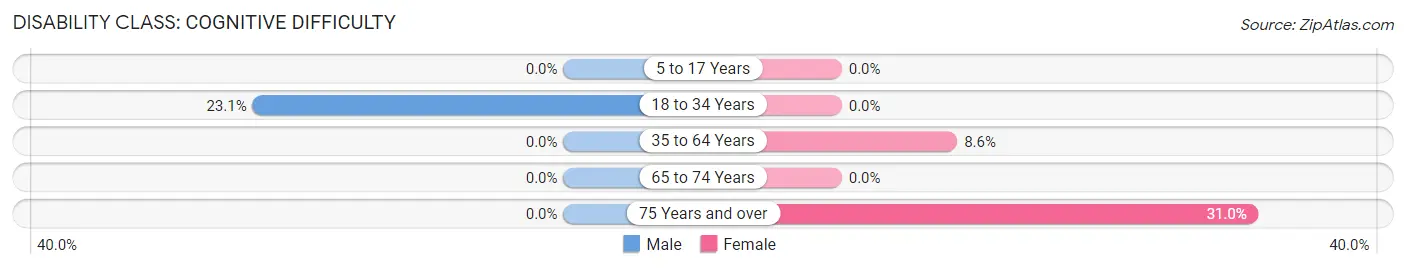
| Age Bracket | Male | Female |
| 5 to 17 Years | 0 (0.0%) | 0 (0.0%) |
| 18 to 34 Years | 12 (23.1%) | 0 (0.0%) |
| 35 to 64 Years | 0 (0.0%) | 6 (8.6%) |
| 65 to 74 Years | 0 (0.0%) | 0 (0.0%) |
| 75 Years and over | 0 (0.0%) | 13 (30.9%) |
Disability Class: Ambulatory Difficulty
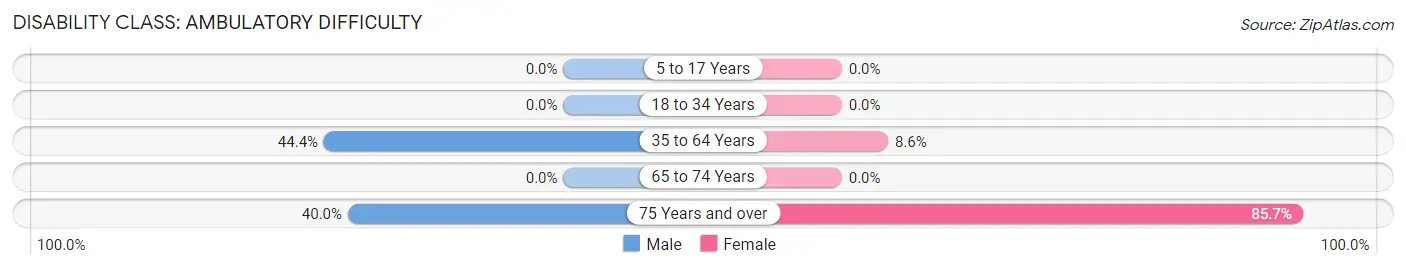
| Age Bracket | Male | Female |
| 5 to 17 Years | 0 (0.0%) | 0 (0.0%) |
| 18 to 34 Years | 0 (0.0%) | 0 (0.0%) |
| 35 to 64 Years | 16 (44.4%) | 6 (8.6%) |
| 65 to 74 Years | 0 (0.0%) | 0 (0.0%) |
| 75 Years and over | 4 (40.0%) | 36 (85.7%) |
Disability Class: Self-Care Difficulty
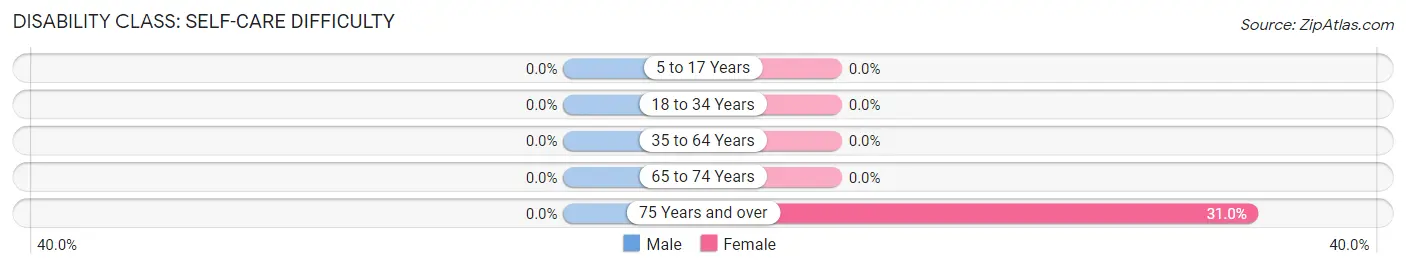
| Age Bracket | Male | Female |
| 5 to 17 Years | 0 (0.0%) | 0 (0.0%) |
| 18 to 34 Years | 0 (0.0%) | 0 (0.0%) |
| 35 to 64 Years | 0 (0.0%) | 0 (0.0%) |
| 65 to 74 Years | 0 (0.0%) | 0 (0.0%) |
| 75 Years and over | 0 (0.0%) | 13 (30.9%) |
Technology Access in El Prado Estates
Computing Device Access in El Prado Estates
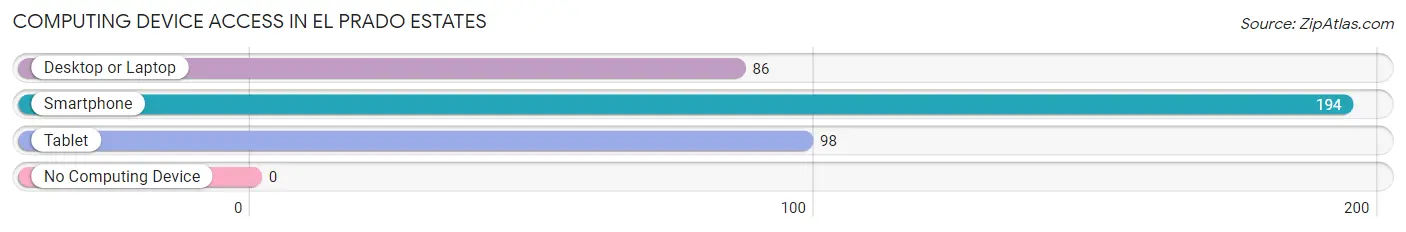
| Device Type | # Households | % Households |
| Desktop or Laptop | 86 | 44.3% |
| Smartphone | 194 | 100.0% |
| Tablet | 98 | 50.5% |
| No Computing Device | 0 | 0.0% |
| Total | 194 | 100.0% |
Internet Access in El Prado Estates
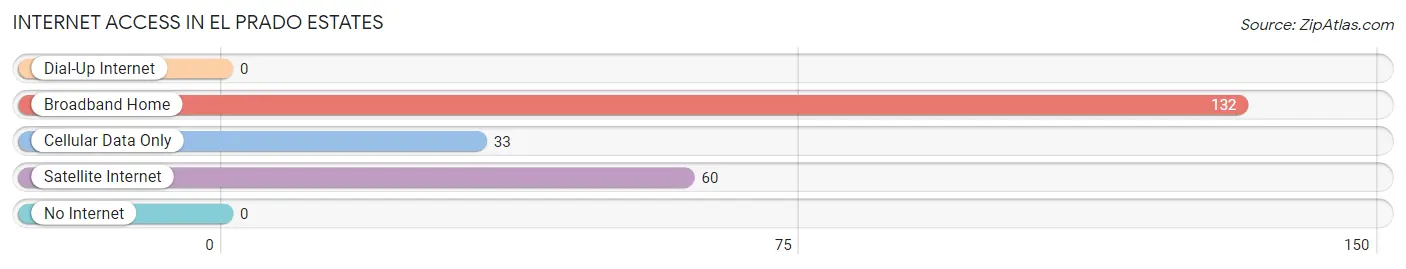
| Internet Type | # Households | % Households |
| Dial-Up Internet | 0 | 0.0% |
| Broadband Home | 132 | 68.0% |
| Cellular Data Only | 33 | 17.0% |
| Satellite Internet | 60 | 30.9% |
| No Internet | 0 | 0.0% |
| Total | 194 | 100.0% |
El Prado Estates Summary
Prado Estates is a census-designated place (CDP) located in Maricopa County, Arizona. It is situated in the Sonoran Desert, approximately 25 miles northwest of Phoenix. The CDP has a total area of 4.2 square miles, all of which is land. As of the 2010 census, the population of Prado Estates was 1,845.
History
The area that is now Prado Estates was originally inhabited by the Hohokam people, who were a Native American tribe that lived in the area from around 300 BC to 1450 AD. The area was later settled by Spanish missionaries and ranchers in the late 1700s. The area was then part of the Mexican territory of Alta California until 1848, when it became part of the United States following the Mexican-American War.
In the late 1800s, the area was settled by ranchers and farmers, who grew cotton, alfalfa, and other crops. The area was also home to several small mining operations. In the early 1900s, the area was developed as a residential community, and the first homes were built in the area in the 1920s.
Geography
Prado Estates is located in the Sonoran Desert, approximately 25 miles northwest of Phoenix. The CDP has a total area of 4.2 square miles, all of which is land. The terrain is mostly flat, with some rolling hills. The area is characterized by its dry climate, with hot summers and mild winters.
Economy
The economy of Prado Estates is largely based on agriculture and tourism. The area is home to several farms and ranches, which produce cotton, alfalfa, and other crops. The area is also home to several tourist attractions, including the Phoenix Zoo, the Arizona Science Center, and the Desert Botanical Garden.
Demographics
As of the 2010 census, the population of Prado Estates was 1,845. The racial makeup of the CDP was 79.2% White, 1.2% African American, 0.7% Native American, 0.7% Asian, 0.1% Pacific Islander, 16.2% from other races, and 2.1% from two or more races. Hispanic or Latino of any race were 33.2% of the population.
The median household income in Prado Estates was $45,938, and the median family income was $50,938. The per capita income for the CDP was $20,938. About 11.2% of families and 14.2% of the population were below the poverty line, including 19.2% of those under age 18 and 8.2% of those age 65 or over.
Common Questions
What is Per Capita Income in El Prado Estates?
Per Capita income in El Prado Estates is $19,528.
What is the Median Family Income in El Prado Estates?
Median Family Income in El Prado Estates is $41,875.
What is the Median Household income in El Prado Estates?
Median Household Income in El Prado Estates is $44,071.
What is Income or Wage Gap in El Prado Estates?
Income or Wage Gap in El Prado Estates is 50.0%.
Women in El Prado Estates earn 50.0 cents for every dollar earned by a man.
What is Inequality or Gini Index in El Prado Estates?
Inequality or Gini Index in El Prado Estates is 0.19.
What is the Total Population of El Prado Estates?
Total Population of El Prado Estates is 391.
What is the Total Male Population of El Prado Estates?
Total Male Population of El Prado Estates is 130.
What is the Total Female Population of El Prado Estates?
Total Female Population of El Prado Estates is 261.
What is the Ratio of Males per 100 Females in El Prado Estates?
There are 49.81 Males per 100 Females in El Prado Estates.
What is the Ratio of Females per 100 Males in El Prado Estates?
There are 200.77 Females per 100 Males in El Prado Estates.
What is the Median Population Age in El Prado Estates?
Median Population Age in El Prado Estates is 33.4 Years.
What is the Average Family Size in El Prado Estates
Average Family Size in El Prado Estates is 1.9 People.
What is the Average Household Size in El Prado Estates
Average Household Size in El Prado Estates is 2.0 People.
How Large is the Labor Force in El Prado Estates?
There are 234 People in the Labor Forcein in El Prado Estates.
What is the Percentage of People in the Labor Force in El Prado Estates?
72.4% of People are in the Labor Force in El Prado Estates.