Royal City, WA Map & Demographics
Royal City Map
Royal City Overview
$18,356
PER CAPITA INCOME
$45,076
AVG FAMILY INCOME
$45,795
AVG HOUSEHOLD INCOME
41.5%
WAGE / INCOME GAP [ % ]
58.5¢/ $1
WAGE / INCOME GAP [ $ ]
$8,418
FAMILY INCOME DEFICIT
0.42
INEQUALITY / GINI INDEX
2,060
TOTAL POPULATION
1,025
MALE POPULATION
1,035
FEMALE POPULATION
99.03
MALES / 100 FEMALES
100.98
FEMALES / 100 MALES
24.6
MEDIAN AGE
3.9
AVG FAMILY SIZE
3.8
AVG HOUSEHOLD SIZE
1,013
LABOR FORCE [ PEOPLE ]
70.6%
PERCENT IN LABOR FORCE
9.2%
UNEMPLOYMENT RATE
Royal City Zip Codes
Royal City Area Codes
Income in Royal City
Income Overview in Royal City
Per Capita Income in Royal City is $18,356, while median incomes of families and households are $45,076 and $45,795 respectively.
| Characteristic | Number | Measure |
| Per Capita Income | 2,060 | $18,356 |
| Median Family Income | 460 | $45,076 |
| Mean Family Income | 460 | $69,377 |
| Median Household Income | 545 | $45,795 |
| Mean Household Income | 545 | $67,994 |
| Income Deficit | 460 | $8,418 |
| Wage / Income Gap (%) | 2,060 | 41.45% |
| Wage / Income Gap ($) | 2,060 | 58.55¢ per $1 |
| Gini / Inequality Index | 2,060 | 0.42 |
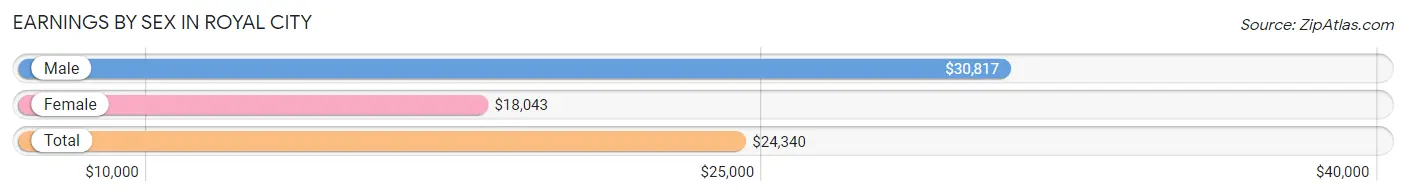
Earnings by Sex in Royal City
Average Earnings in Royal City are $24,340, $30,817 for men and $18,043 for women, a difference of 41.4%.
| Sex | Number | Average Earnings |
| Male | 630 (56.0%) | $30,817 |
| Female | 494 (44.0%) | $18,043 |
| Total | 1,124 (100.0%) | $24,340 |
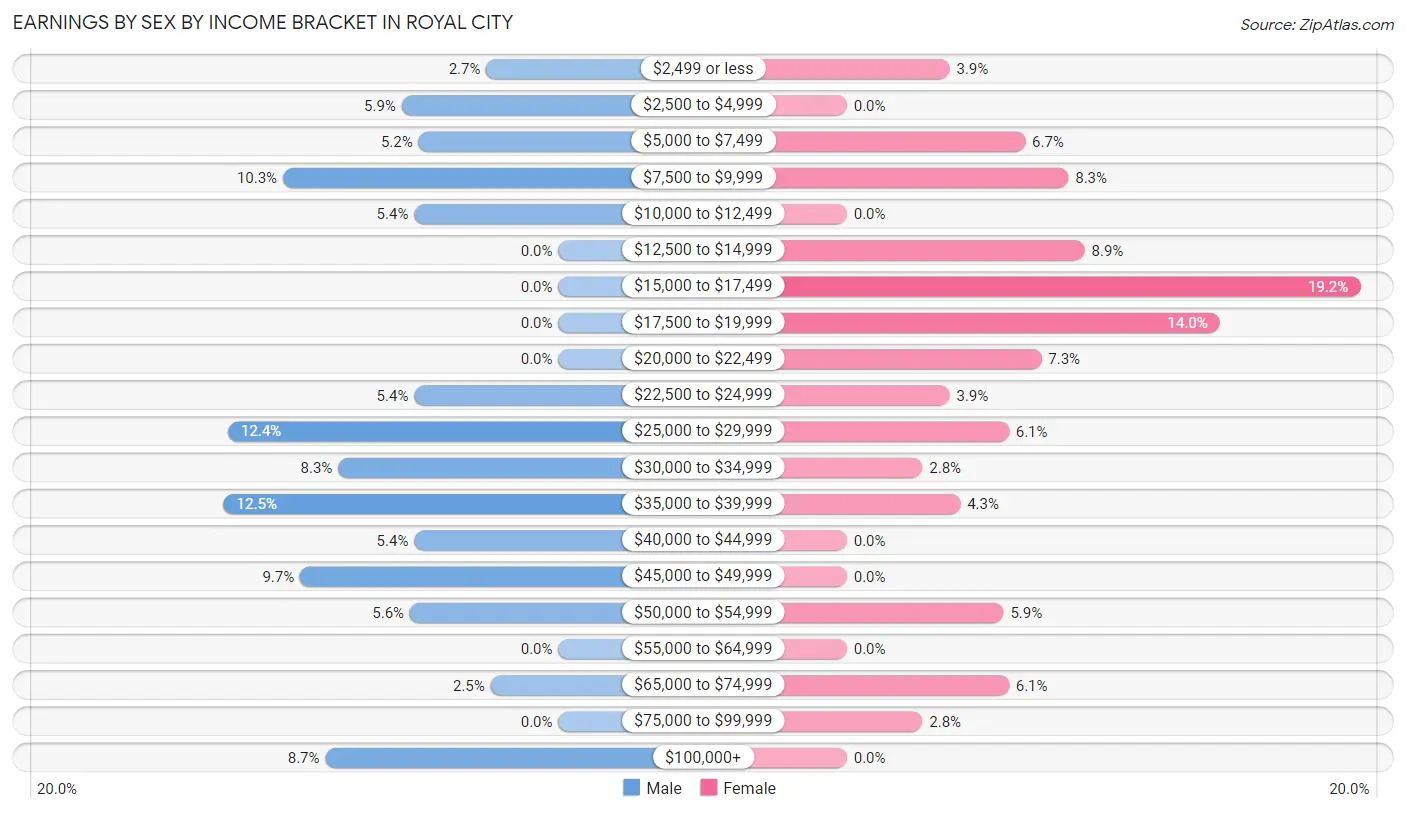
Earnings by Sex by Income Bracket in Royal City
The most common earnings brackets in Royal City are $35,000 to $39,999 for men (79 | 12.5%) and $15,000 to $17,499 for women (95 | 19.2%).
| Income | Male | Female |
| $2,499 or less | 17 (2.7%) | 19 (3.8%) |
| $2,500 to $4,999 | 37 (5.9%) | 0 (0.0%) |
| $5,000 to $7,499 | 33 (5.2%) | 33 (6.7%) |
| $7,500 to $9,999 | 65 (10.3%) | 41 (8.3%) |
| $10,000 to $12,499 | 34 (5.4%) | 0 (0.0%) |
| $12,500 to $14,999 | 0 (0.0%) | 44 (8.9%) |
| $15,000 to $17,499 | 0 (0.0%) | 95 (19.2%) |
| $17,500 to $19,999 | 0 (0.0%) | 69 (14.0%) |
| $20,000 to $22,499 | 0 (0.0%) | 36 (7.3%) |
| $22,500 to $24,999 | 34 (5.4%) | 19 (3.8%) |
| $25,000 to $29,999 | 78 (12.4%) | 30 (6.1%) |
| $30,000 to $34,999 | 52 (8.3%) | 14 (2.8%) |
| $35,000 to $39,999 | 79 (12.5%) | 21 (4.3%) |
| $40,000 to $44,999 | 34 (5.4%) | 0 (0.0%) |
| $45,000 to $49,999 | 61 (9.7%) | 0 (0.0%) |
| $50,000 to $54,999 | 35 (5.6%) | 29 (5.9%) |
| $55,000 to $64,999 | 0 (0.0%) | 0 (0.0%) |
| $65,000 to $74,999 | 16 (2.5%) | 30 (6.1%) |
| $75,000 to $99,999 | 0 (0.0%) | 14 (2.8%) |
| $100,000+ | 55 (8.7%) | 0 (0.0%) |
| Total | 630 (100.0%) | 494 (100.0%) |
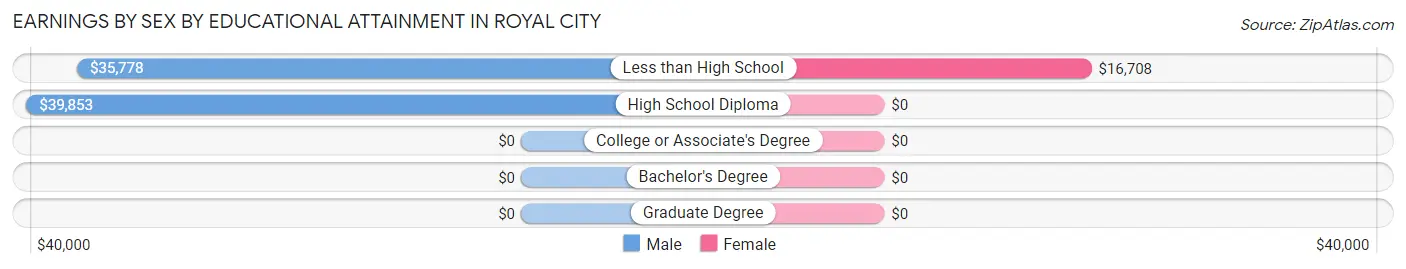
Earnings by Sex by Educational Attainment in Royal City
Average earnings in Royal City are $37,647 for men and $21,389 for women, a difference of 43.2%. Men with an educational attainment of high school diploma enjoy the highest average annual earnings of $39,853, while those with less than high school education earn the least with $35,778. Women with an educational attainment of less than high school earn the most with the average annual earnings of $16,708, while those with less than high school education have the smallest earnings of $16,708.
| Educational Attainment | Male Income | Female Income |
| Less than High School | $35,778 | $16,708 |
| High School Diploma | $39,853 | $0 |
| College or Associate's Degree | - | - |
| Bachelor's Degree | - | - |
| Graduate Degree | - | - |
| Total | $37,647 | $21,389 |
Family Income in Royal City
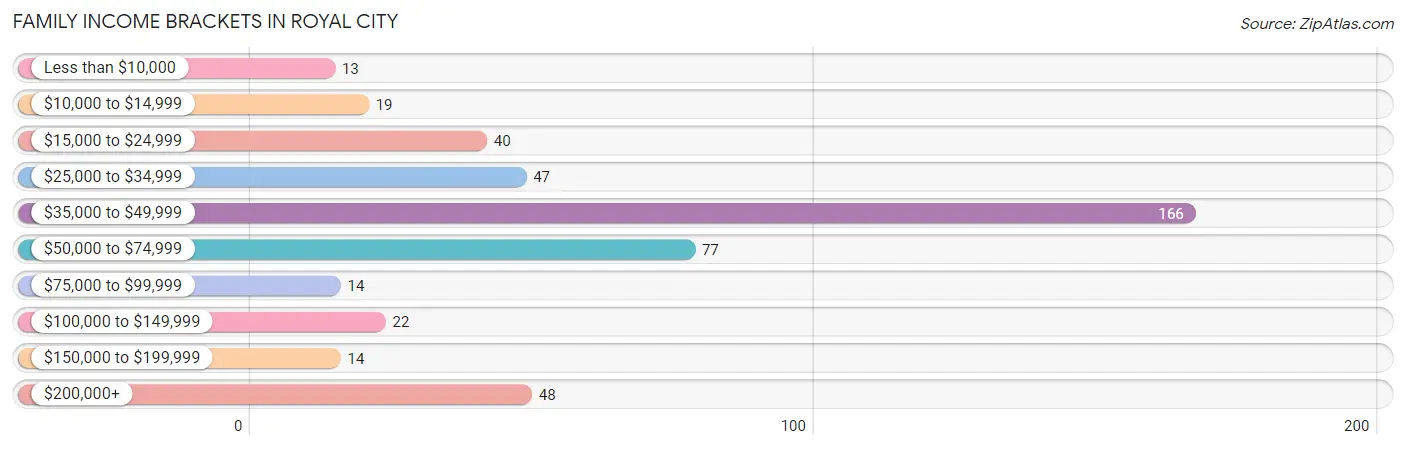
Family Income Brackets in Royal City
According to the Royal City family income data, there are 166 families falling into the $35,000 to $49,999 income range, which is the most common income bracket and makes up 36.1% of all families. Conversely, the less than $10,000 income bracket is the least frequent group with only 13 families (2.8%) belonging to this category.
| Income Bracket | # Families | % Families |
| Less than $10,000 | 13 | 2.8% |
| $10,000 to $14,999 | 19 | 4.1% |
| $15,000 to $24,999 | 40 | 8.7% |
| $25,000 to $34,999 | 47 | 10.2% |
| $35,000 to $49,999 | 166 | 36.1% |
| $50,000 to $74,999 | 77 | 16.7% |
| $75,000 to $99,999 | 14 | 3.0% |
| $100,000 to $149,999 | 22 | 4.8% |
| $150,000 to $199,999 | 14 | 3.0% |
| $200,000+ | 48 | 10.4% |
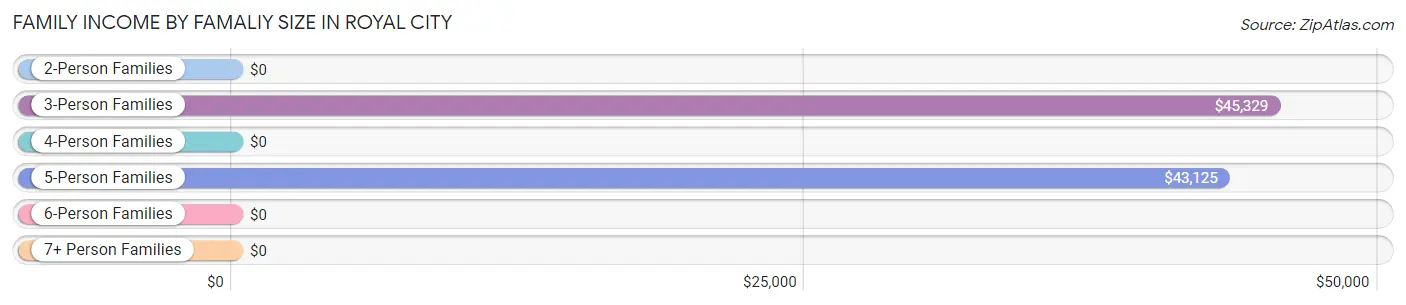
Family Income by Famaliy Size in Royal City
3-person families (161 | 35.0%) account for the highest median family income in Royal City with $45,329 per family, while 3-person families (161 | 35.0%) have the highest median income of $15,110 per family member.
| Income Bracket | # Families | Median Income |
| 2-Person Families | 44 (9.6%) | $0 |
| 3-Person Families | 161 (35.0%) | $45,329 |
| 4-Person Families | 101 (22.0%) | $0 |
| 5-Person Families | 137 (29.8%) | $43,125 |
| 6-Person Families | 17 (3.7%) | $0 |
| 7+ Person Families | 0 (0.0%) | $0 |
| Total | 460 (100.0%) | $45,076 |
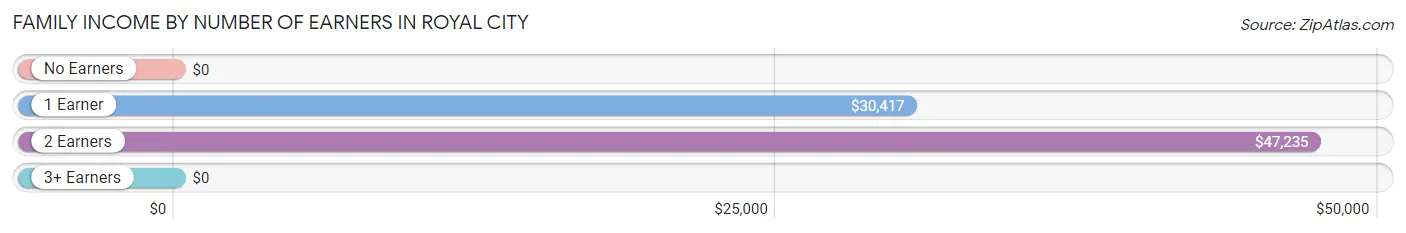
Family Income by Number of Earners in Royal City
| Number of Earners | # Families | Median Income |
| No Earners | 29 (6.3%) | $0 |
| 1 Earner | 160 (34.8%) | $30,417 |
| 2 Earners | 169 (36.7%) | $47,235 |
| 3+ Earners | 102 (22.2%) | $0 |
| Total | 460 (100.0%) | $45,076 |
Household Income in Royal City
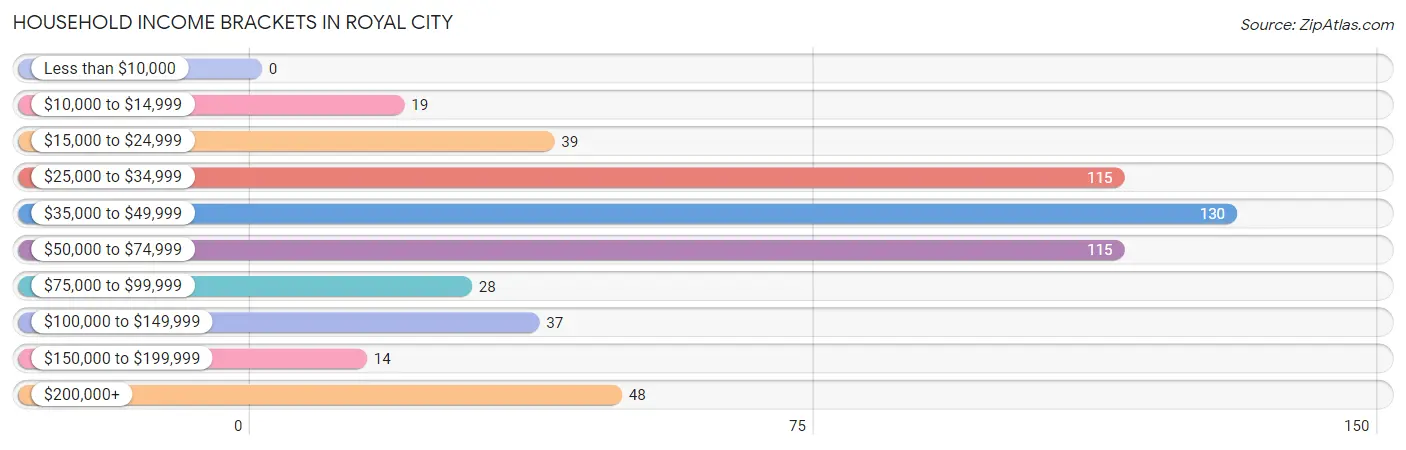
Household Income Brackets in Royal City
With 130 households falling in the category, the $35,000 to $49,999 income range is the most frequent in Royal City, accounting for 23.8% of all households.
| Income Bracket | # Households | % Households |
| Less than $10,000 | 0 | 0.0% |
| $10,000 to $14,999 | 19 | 3.5% |
| $15,000 to $24,999 | 39 | 7.2% |
| $25,000 to $34,999 | 115 | 21.1% |
| $35,000 to $49,999 | 130 | 23.9% |
| $50,000 to $74,999 | 115 | 21.1% |
| $75,000 to $99,999 | 28 | 5.1% |
| $100,000 to $149,999 | 37 | 6.8% |
| $150,000 to $199,999 | 14 | 2.6% |
| $200,000+ | 48 | 8.8% |
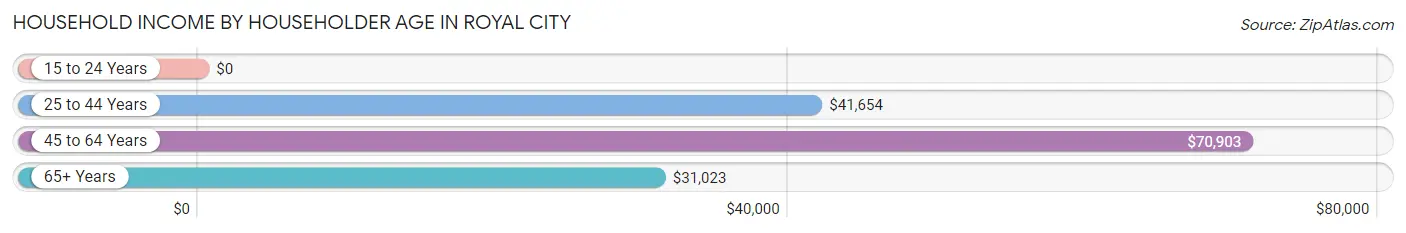
Household Income by Householder Age in Royal City
The median household income in Royal City is $45,795, with the highest median household income of $70,903 found in the 45 to 64 years age bracket for the primary householder. A total of 247 households (45.3%) fall into this category.
| Income Bracket | # Households | Median Income |
| 15 to 24 Years | 0 (0.0%) | $0 |
| 25 to 44 Years | 257 (47.2%) | $41,654 |
| 45 to 64 Years | 247 (45.3%) | $70,903 |
| 65+ Years | 41 (7.5%) | $31,023 |
| Total | 545 (100.0%) | $45,795 |
Poverty in Royal City
Income Below Poverty by Sex and Age in Royal City
With 21.0% poverty level for males and 34.4% for females among the residents of Royal City, 5 year old males and under 5 year old females are the most vulnerable to poverty, with 15 males (65.2%) and 64 females (82.1%) in their respective age groups living below the poverty level.
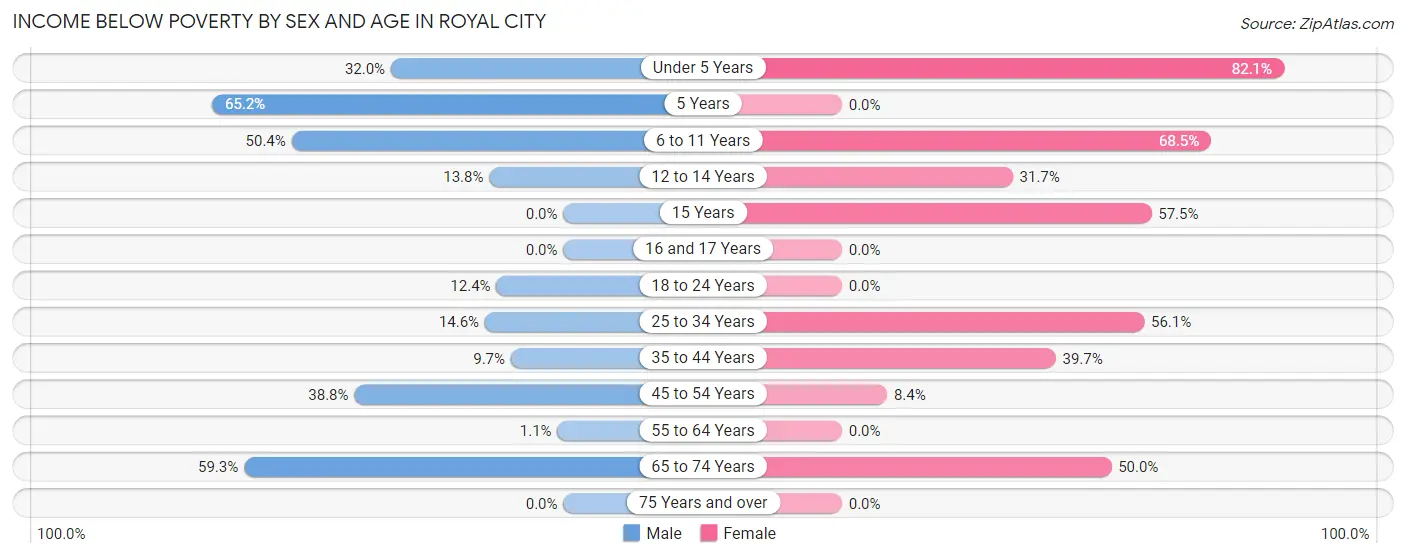
| Age Bracket | Male | Female |
| Under 5 Years | 16 (32.0%) | 64 (82.1%) |
| 5 Years | 15 (65.2%) | 0 (0.0%) |
| 6 to 11 Years | 57 (50.4%) | 61 (68.5%) |
| 12 to 14 Years | 11 (13.8%) | 26 (31.7%) |
| 15 Years | 0 (0.0%) | 27 (57.5%) |
| 16 and 17 Years | 0 (0.0%) | 0 (0.0%) |
| 18 to 24 Years | 23 (12.4%) | 0 (0.0%) |
| 25 to 34 Years | 16 (14.5%) | 69 (56.1%) |
| 35 to 44 Years | 15 (9.7%) | 73 (39.7%) |
| 45 to 54 Years | 45 (38.8%) | 14 (8.4%) |
| 55 to 64 Years | 1 (1.1%) | 0 (0.0%) |
| 65 to 74 Years | 16 (59.3%) | 14 (50.0%) |
| 75 Years and over | 0 (0.0%) | 0 (0.0%) |
| Total | 215 (21.0%) | 348 (34.4%) |
Income Above Poverty by Sex and Age in Royal City
According to the poverty statistics in Royal City, males aged 15 years and females aged 5 years are the age groups that are most secure financially, with 100.0% of males and 100.0% of females in these age groups living above the poverty line.
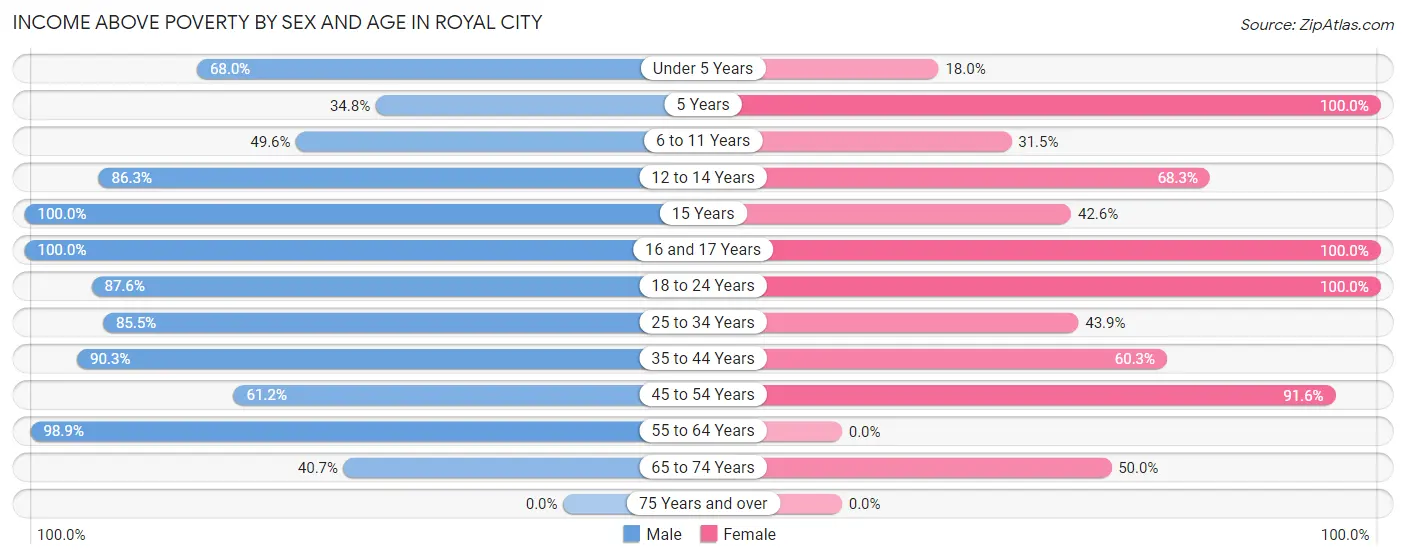
| Age Bracket | Male | Female |
| Under 5 Years | 34 (68.0%) | 14 (17.9%) |
| 5 Years | 8 (34.8%) | 27 (100.0%) |
| 6 to 11 Years | 56 (49.6%) | 28 (31.5%) |
| 12 to 14 Years | 69 (86.3%) | 56 (68.3%) |
| 15 Years | 14 (100.0%) | 20 (42.5%) |
| 16 and 17 Years | 62 (100.0%) | 39 (100.0%) |
| 18 to 24 Years | 162 (87.6%) | 149 (100.0%) |
| 25 to 34 Years | 94 (85.5%) | 54 (43.9%) |
| 35 to 44 Years | 139 (90.3%) | 111 (60.3%) |
| 45 to 54 Years | 71 (61.2%) | 153 (91.6%) |
| 55 to 64 Years | 90 (98.9%) | 0 (0.0%) |
| 65 to 74 Years | 11 (40.7%) | 14 (50.0%) |
| 75 Years and over | 0 (0.0%) | 0 (0.0%) |
| Total | 810 (79.0%) | 665 (65.6%) |
Income Below Poverty Among Married-Couple Families in Royal City
The poverty statistics for married-couple families in Royal City show that 20.7% or 63 of the total 305 families live below the poverty line. Families with 3 or 4 children have the highest poverty rate of 52.2%, comprising of 47 families. On the other hand, families with 1 or 2 children have the lowest poverty rate of 0.0%, which includes 0 families.
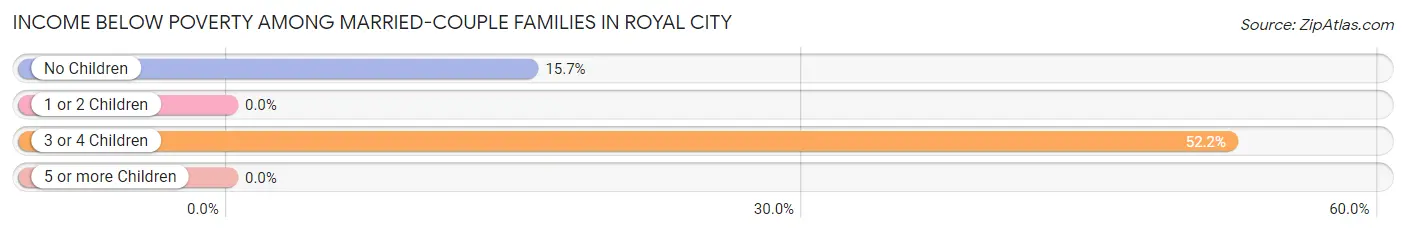
| Children | Above Poverty | Below Poverty |
| No Children | 86 (84.3%) | 16 (15.7%) |
| 1 or 2 Children | 113 (100.0%) | 0 (0.0%) |
| 3 or 4 Children | 43 (47.8%) | 47 (52.2%) |
| 5 or more Children | 0 (0.0%) | 0 (0.0%) |
| Total | 242 (79.3%) | 63 (20.7%) |
Income Below Poverty Among Single-Parent Households in Royal City
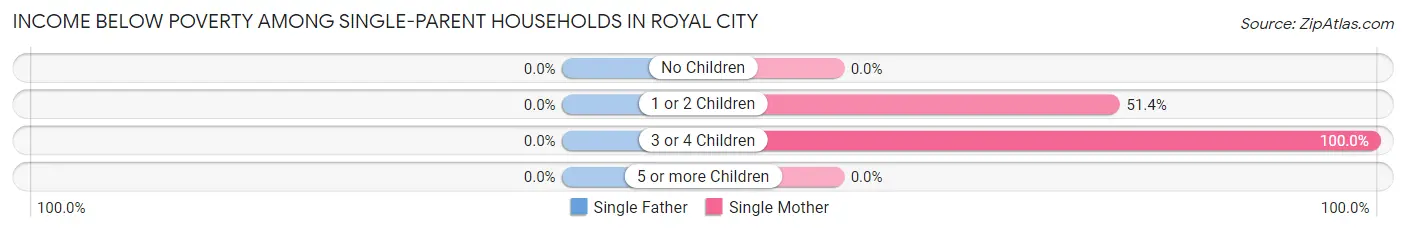
| Children | Single Father | Single Mother |
| No Children | 0 (0.0%) | 0 (0.0%) |
| 1 or 2 Children | 0 (0.0%) | 37 (51.4%) |
| 3 or 4 Children | 0 (0.0%) | 19 (100.0%) |
| 5 or more Children | 0 (0.0%) | 0 (0.0%) |
| Total | 0 (0.0%) | 56 (53.3%) |
Income Below Poverty Among Married-Couple vs Single-Parent Households in Royal City
The poverty data for Royal City shows that 63 of the married-couple family households (20.7%) and 56 of the single-parent households (36.1%) are living below the poverty level. Within the married-couple family households, those with 3 or 4 children have the highest poverty rate, with 47 households (52.2%) falling below the poverty line. Among the single-parent households, those with 1 or 2 children have the highest poverty rate, with 37 household (42.5%) living below poverty.
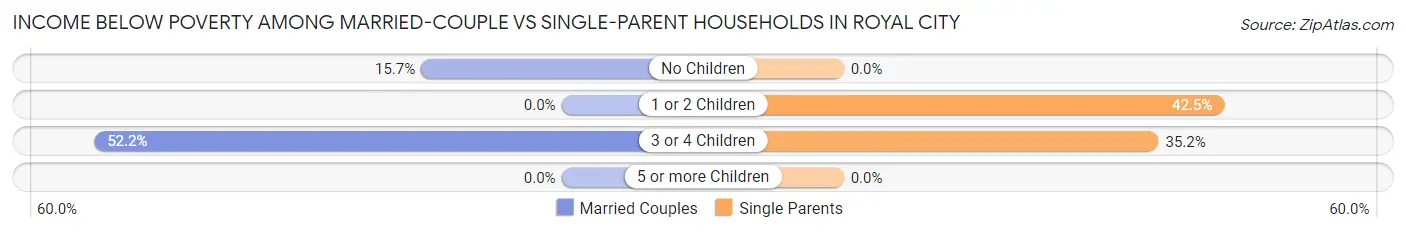
| Children | Married-Couple Families | Single-Parent Households |
| No Children | 16 (15.7%) | 0 (0.0%) |
| 1 or 2 Children | 0 (0.0%) | 37 (42.5%) |
| 3 or 4 Children | 47 (52.2%) | 19 (35.2%) |
| 5 or more Children | 0 (0.0%) | 0 (0.0%) |
| Total | 63 (20.7%) | 56 (36.1%) |
Race in Royal City
The most populous races in Royal City are Hispanic or Latino (1,934 | 93.9%), Some other Race (1,169 | 56.8%), and White / Caucasian (452 | 21.9%).
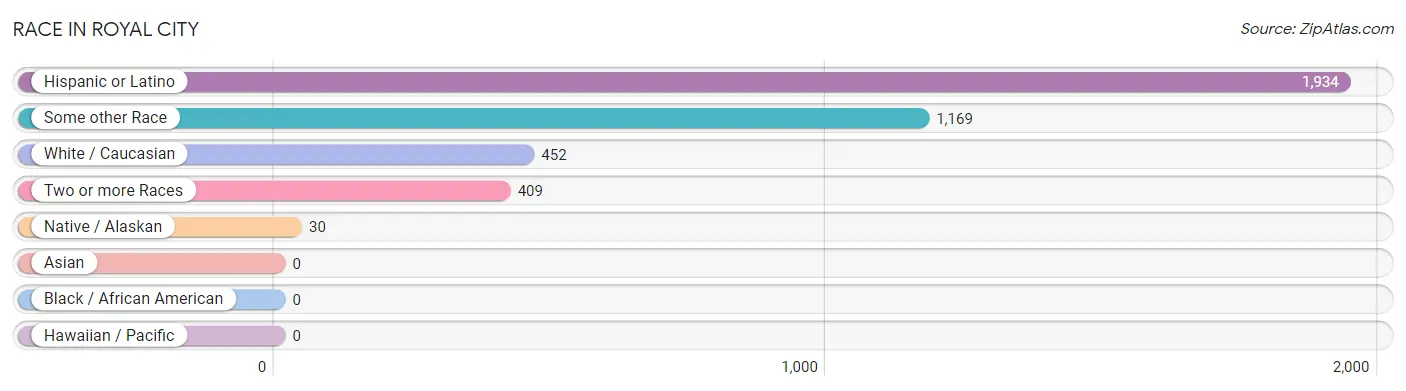
| Race | # Population | % Population |
| Asian | 0 | 0.0% |
| Black / African American | 0 | 0.0% |
| Hawaiian / Pacific | 0 | 0.0% |
| Hispanic or Latino | 1,934 | 93.9% |
| Native / Alaskan | 30 | 1.5% |
| White / Caucasian | 452 | 21.9% |
| Two or more Races | 409 | 19.9% |
| Some other Race | 1,169 | 56.8% |
| Total | 2,060 | 100.0% |
Ancestry in Royal City
The most populous ancestries reported in Royal City are Mexican (1,886 | 91.5%), Danish (75 | 3.6%), Dutch (63 | 3.1%), Spanish (31 | 1.5%), and Central American Indian (30 | 1.5%), together accounting for 101.2% of all Royal City residents.
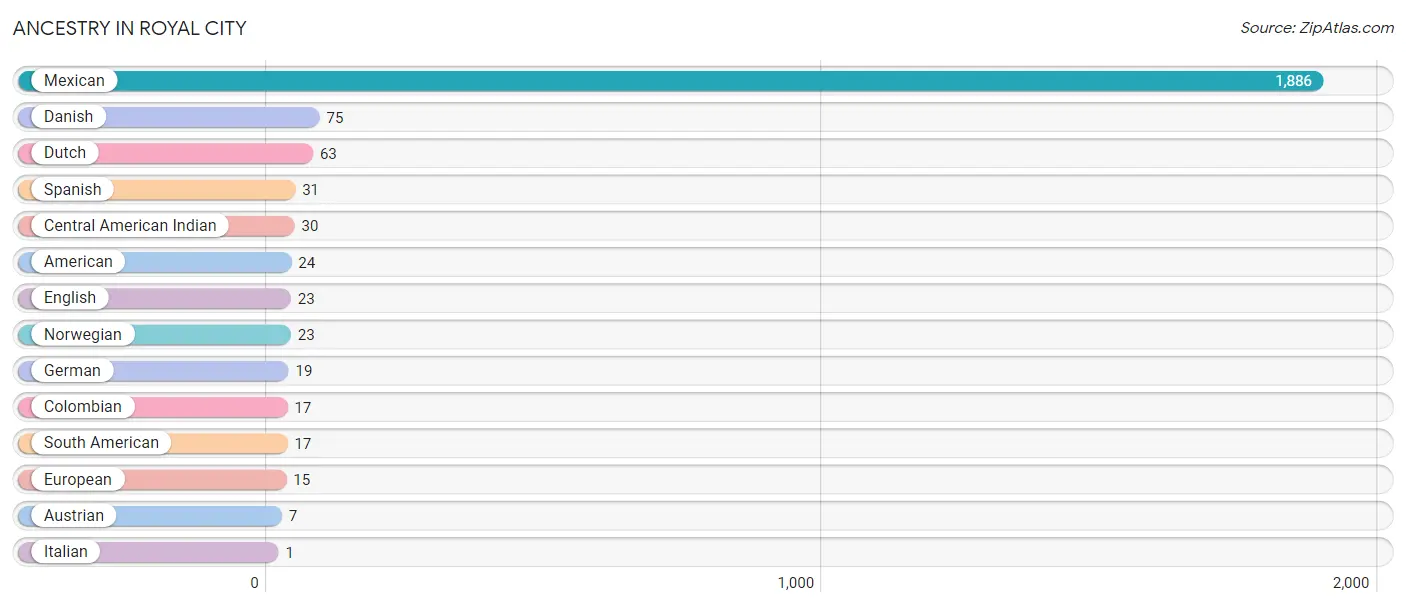
| Ancestry | # Population | % Population |
| American | 24 | 1.2% |
| Austrian | 7 | 0.3% |
| Central American Indian | 30 | 1.5% |
| Colombian | 17 | 0.8% |
| Danish | 75 | 3.6% |
| Dutch | 63 | 3.1% |
| English | 23 | 1.1% |
| European | 15 | 0.7% |
| German | 19 | 0.9% |
| Italian | 1 | 0.1% |
| Mexican | 1,886 | 91.5% |
| Norwegian | 23 | 1.1% |
| South American | 17 | 0.8% |
| Spanish | 31 | 1.5% | View All 14 Rows |
Immigrants in Royal City
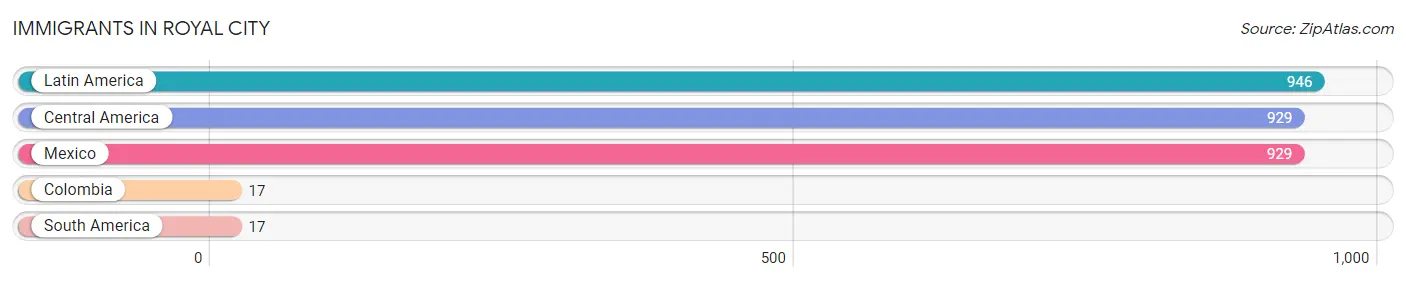
The most numerous immigrant groups reported in Royal City came from Latin America (946 | 45.9%), Central America (929 | 45.1%), Mexico (929 | 45.1%), Colombia (17 | 0.8%), and South America (17 | 0.8%), together accounting for 137.8% of all Royal City residents.
| Immigration Origin | # Population | % Population |
| Central America | 929 | 45.1% |
| Colombia | 17 | 0.8% |
| Latin America | 946 | 45.9% |
| Mexico | 929 | 45.1% |
| South America | 17 | 0.8% | View All 5 Rows |
Sex and Age in Royal City
Sex and Age in Royal City
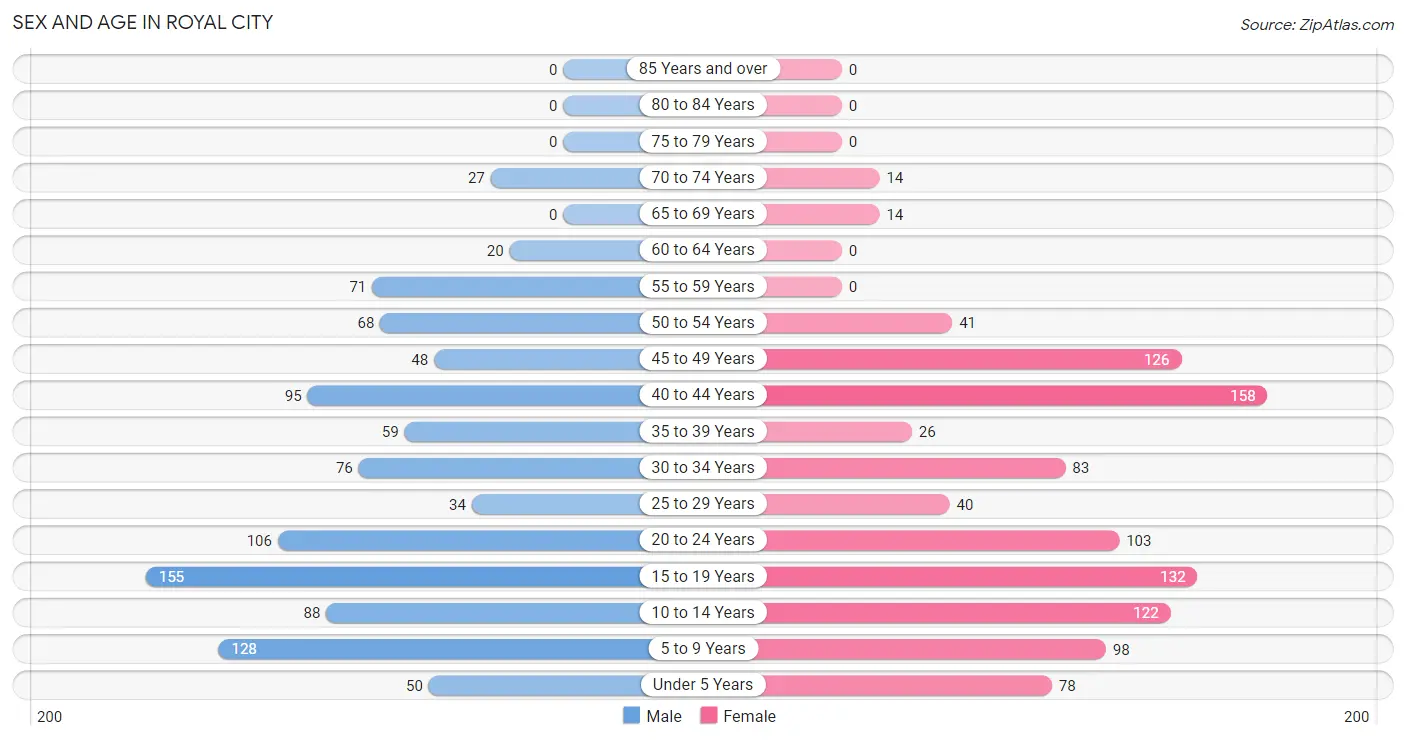
The most populous age groups in Royal City are 15 to 19 Years (155 | 15.1%) for men and 40 to 44 Years (158 | 15.3%) for women.
| Age Bracket | Male | Female |
| Under 5 Years | 50 (4.9%) | 78 (7.5%) |
| 5 to 9 Years | 128 (12.5%) | 98 (9.5%) |
| 10 to 14 Years | 88 (8.6%) | 122 (11.8%) |
| 15 to 19 Years | 155 (15.1%) | 132 (12.8%) |
| 20 to 24 Years | 106 (10.3%) | 103 (10.0%) |
| 25 to 29 Years | 34 (3.3%) | 40 (3.9%) |
| 30 to 34 Years | 76 (7.4%) | 83 (8.0%) |
| 35 to 39 Years | 59 (5.8%) | 26 (2.5%) |
| 40 to 44 Years | 95 (9.3%) | 158 (15.3%) |
| 45 to 49 Years | 48 (4.7%) | 126 (12.2%) |
| 50 to 54 Years | 68 (6.6%) | 41 (4.0%) |
| 55 to 59 Years | 71 (6.9%) | 0 (0.0%) |
| 60 to 64 Years | 20 (1.9%) | 0 (0.0%) |
| 65 to 69 Years | 0 (0.0%) | 14 (1.3%) |
| 70 to 74 Years | 27 (2.6%) | 14 (1.3%) |
| 75 to 79 Years | 0 (0.0%) | 0 (0.0%) |
| 80 to 84 Years | 0 (0.0%) | 0 (0.0%) |
| 85 Years and over | 0 (0.0%) | 0 (0.0%) |
| Total | 1,025 (100.0%) | 1,035 (100.0%) |
Families and Households in Royal City
Median Family Size in Royal City
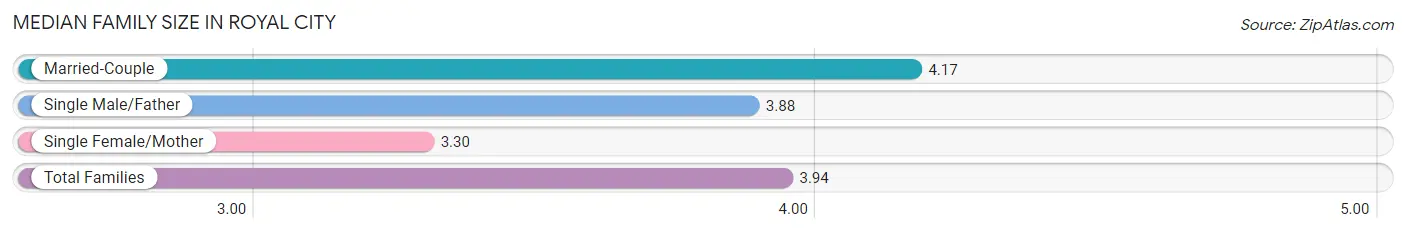
The median family size in Royal City is 3.94 persons per family, with married-couple families (305 | 66.3%) accounting for the largest median family size of 4.17 persons per family. On the other hand, single female/mother families (105 | 22.8%) represent the smallest median family size with 3.30 persons per family.
| Family Type | # Families | Family Size |
| Married-Couple | 305 (66.3%) | 4.17 |
| Single Male/Father | 50 (10.9%) | 3.88 |
| Single Female/Mother | 105 (22.8%) | 3.30 |
| Total Families | 460 (100.0%) | 3.94 |
Median Household Size in Royal City
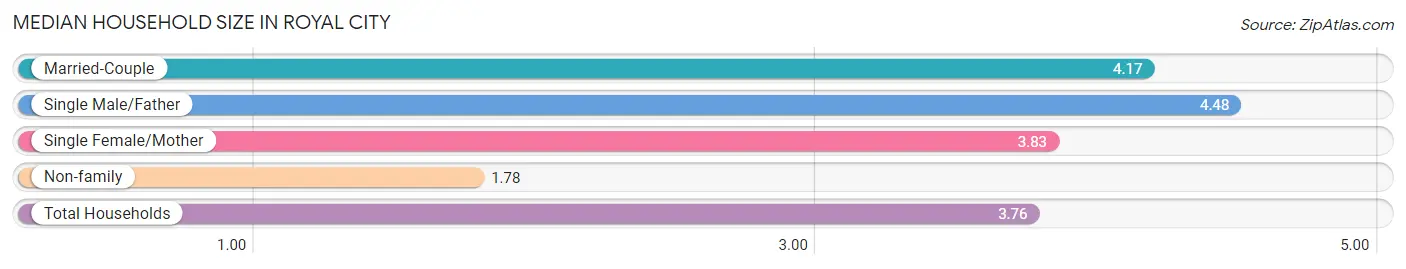
The median household size in Royal City is 3.76 persons per household, with single male/father households (50 | 9.2%) accounting for the largest median household size of 4.48 persons per household. non-family households (85 | 15.6%) represent the smallest median household size with 1.78 persons per household.
| Household Type | # Households | Household Size |
| Married-Couple | 305 (56.0%) | 4.17 |
| Single Male/Father | 50 (9.2%) | 4.48 |
| Single Female/Mother | 105 (19.3%) | 3.83 |
| Non-family | 85 (15.6%) | 1.78 |
| Total Households | 545 (100.0%) | 3.76 |
Household Size by Marriage Status in Royal City
Out of a total of 545 households in Royal City, 460 (84.4%) are family households, while 85 (15.6%) are nonfamily households. The most numerous type of family households are 4-person households, comprising 164, and the most common type of nonfamily households are 1-person households, comprising 56.
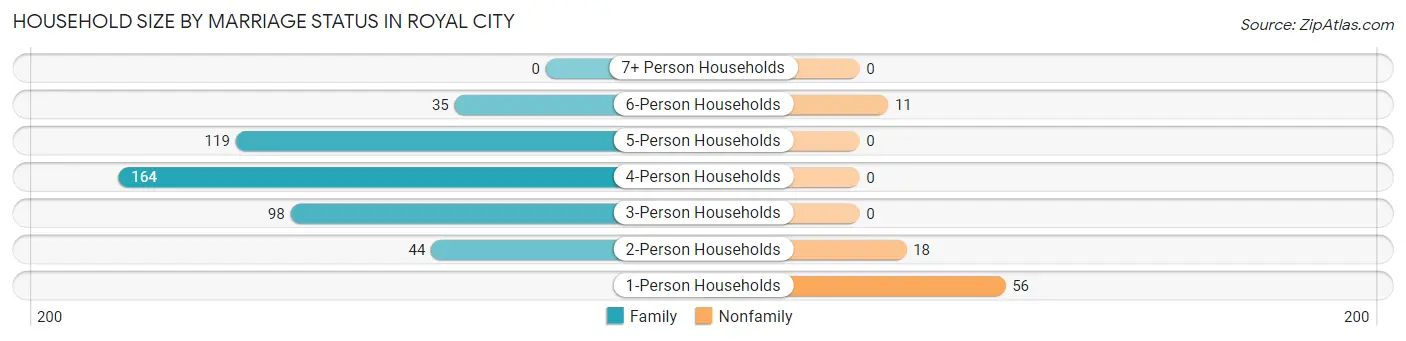
| Household Size | Family Households | Nonfamily Households |
| 1-Person Households | - | 56 (10.3%) |
| 2-Person Households | 44 (8.1%) | 18 (3.3%) |
| 3-Person Households | 98 (18.0%) | 0 (0.0%) |
| 4-Person Households | 164 (30.1%) | 0 (0.0%) |
| 5-Person Households | 119 (21.8%) | 0 (0.0%) |
| 6-Person Households | 35 (6.4%) | 11 (2.0%) |
| 7+ Person Households | 0 (0.0%) | 0 (0.0%) |
| Total | 460 (84.4%) | 85 (15.6%) |
Female Fertility in Royal City
Fertility by Age in Royal City
| Age Bracket | Women with Births | Births / 1,000 Women |
| 15 to 19 years | 0 (0.0%) | 0.0 |
| 20 to 34 years | 0 (0.0%) | 0.0 |
| 35 to 50 years | 0 (0.0%) | 0.0 |
| Total | 0 (0.0%) | 0.0 |
Fertility by Age by Marriage Status in Royal City
| Age Bracket | Married | Unmarried |
| 15 to 19 years | 0 (0.0%) | 0 (0.0%) |
| 20 to 34 years | 0 (0.0%) | 0 (0.0%) |
| 35 to 50 years | 0 (0.0%) | 0 (0.0%) |
| Total | 0 (0.0%) | 0 (0.0%) |
Fertility by Education in Royal City
| Educational Attainment | Women with Births | Births / 1,000 Women |
| Less than High School | 0 (0.0%) | 0.0 |
| High School Diploma | 0 (0.0%) | 0.0 |
| College or Associate's Degree | 0 (0.0%) | 0.0 |
| Bachelor's Degree | 0 (0.0%) | 0.0 |
| Graduate Degree | 0 (0.0%) | 0.0 |
| Total | 0 (0.0%) | 0.0 |
Fertility by Education by Marriage Status in Royal City
| Educational Attainment | Married | Unmarried |
| Less than High School | 0 (0.0%) | 0 (0.0%) |
| High School Diploma | 0 (0.0%) | 0 (0.0%) |
| College or Associate's Degree | 0 (0.0%) | 0 (0.0%) |
| Bachelor's Degree | 0 (0.0%) | 0 (0.0%) |
| Graduate Degree | 0 (0.0%) | 0 (0.0%) |
| Total | 0 (0.0%) | 0 (0.0%) |
Employment Characteristics in Royal City
Employment by Class of Employer in Royal City
Among the 904 employed individuals in Royal City, private company employees (650 | 71.9%), not-for-profit organizations (113 | 12.5%), and local government employees (84 | 9.3%) make up the most common classes of employment.
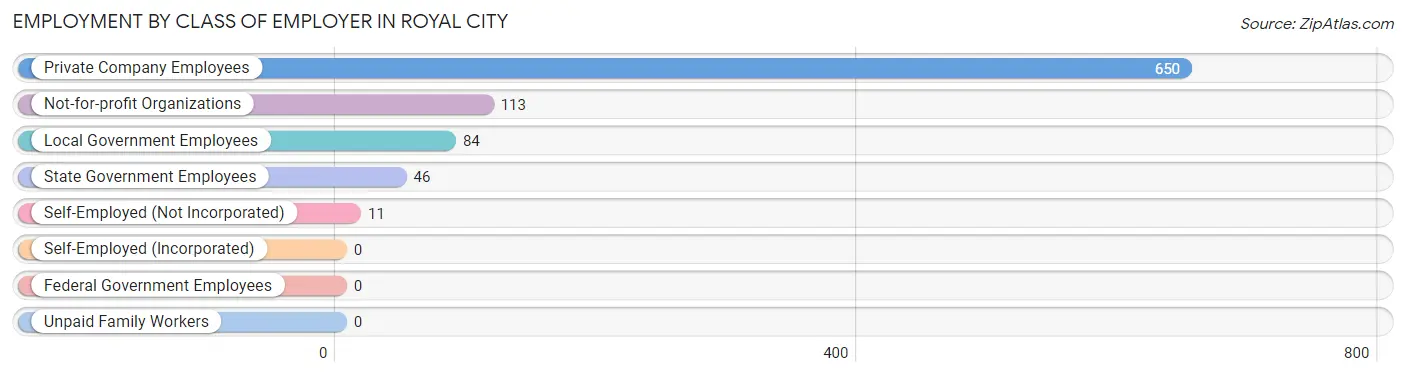
| Employer Class | # Employees | % Employees |
| Private Company Employees | 650 | 71.9% |
| Self-Employed (Incorporated) | 0 | 0.0% |
| Self-Employed (Not Incorporated) | 11 | 1.2% |
| Not-for-profit Organizations | 113 | 12.5% |
| Local Government Employees | 84 | 9.3% |
| State Government Employees | 46 | 5.1% |
| Federal Government Employees | 0 | 0.0% |
| Unpaid Family Workers | 0 | 0.0% |
| Total | 904 | 100.0% |
Employment Status by Age in Royal City
According to the labor force statistics for Royal City, out of the total population over 16 years of age (1,435), 70.6% or 1,013 individuals are in the labor force, with 9.2% or 93 of them unemployed. The age group with the highest labor force participation rate is 25 to 29 years, with 100.0% or 74 individuals in the labor force. Within the labor force, the 16 to 19 years age range has the highest percentage of unemployed individuals, with 20.0% or 19 of them being unemployed.
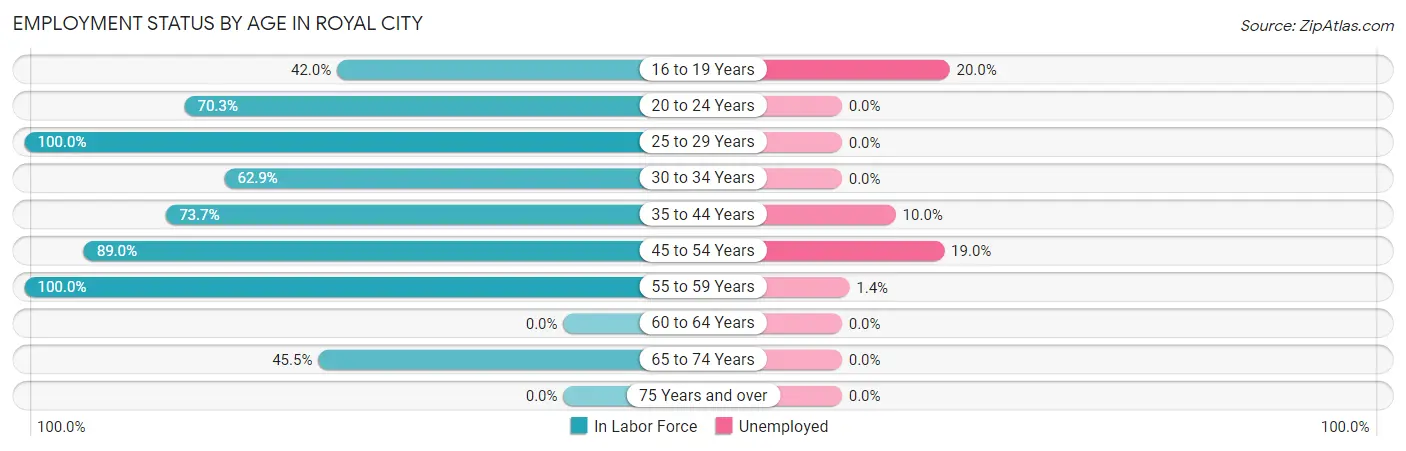
| Age Bracket | In Labor Force | Unemployed |
| 16 to 19 Years | 95 (42.0%) | 19 (20.0%) |
| 20 to 24 Years | 147 (70.3%) | 0 (0.0%) |
| 25 to 29 Years | 74 (100.0%) | 0 (0.0%) |
| 30 to 34 Years | 100 (62.9%) | 0 (0.0%) |
| 35 to 44 Years | 249 (73.7%) | 25 (10.0%) |
| 45 to 54 Years | 252 (89.0%) | 48 (19.0%) |
| 55 to 59 Years | 71 (100.0%) | 1 (1.4%) |
| 60 to 64 Years | 0 (0.0%) | 0 (0.0%) |
| 65 to 74 Years | 25 (45.5%) | 0 (0.0%) |
| 75 Years and over | 0 (0.0%) | 0 (0.0%) |
| Total | 1,013 (70.6%) | 93 (9.2%) |
Employment Status by Educational Attainment in Royal City
According to labor force statistics for Royal City, 78.9% of individuals (746) out of the total population between 25 and 64 years of age (945) are in the labor force, with 9.9% or 74 of them being unemployed. The group with the highest labor force participation rate are those with the educational attainment of bachelor's degree or higher, with 100.0% or 85 individuals in the labor force. Within the labor force, individuals with high school diploma education have the highest percentage of unemployment, with 25.2% or 31 of them being unemployed.
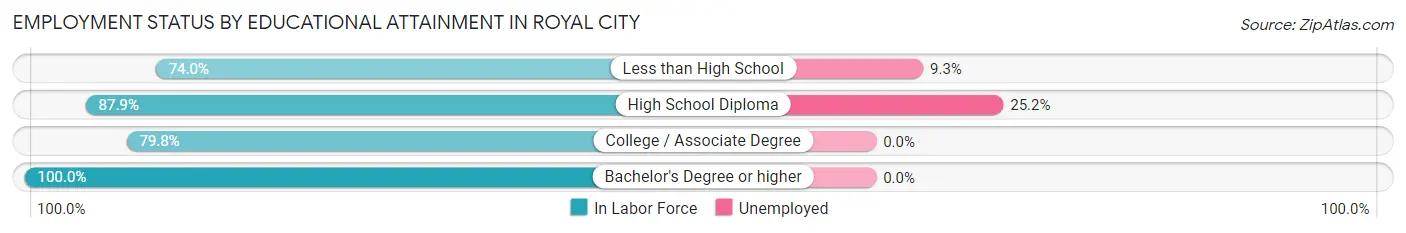
| Educational Attainment | In Labor Force | Unemployed |
| Less than High School | 463 (74.0%) | 58 (9.3%) |
| High School Diploma | 123 (87.9%) | 35 (25.2%) |
| College / Associate Degree | 75 (79.8%) | 0 (0.0%) |
| Bachelor's Degree or higher | 85 (100.0%) | 0 (0.0%) |
| Total | 746 (78.9%) | 94 (9.9%) |
Employment Occupations by Sex in Royal City
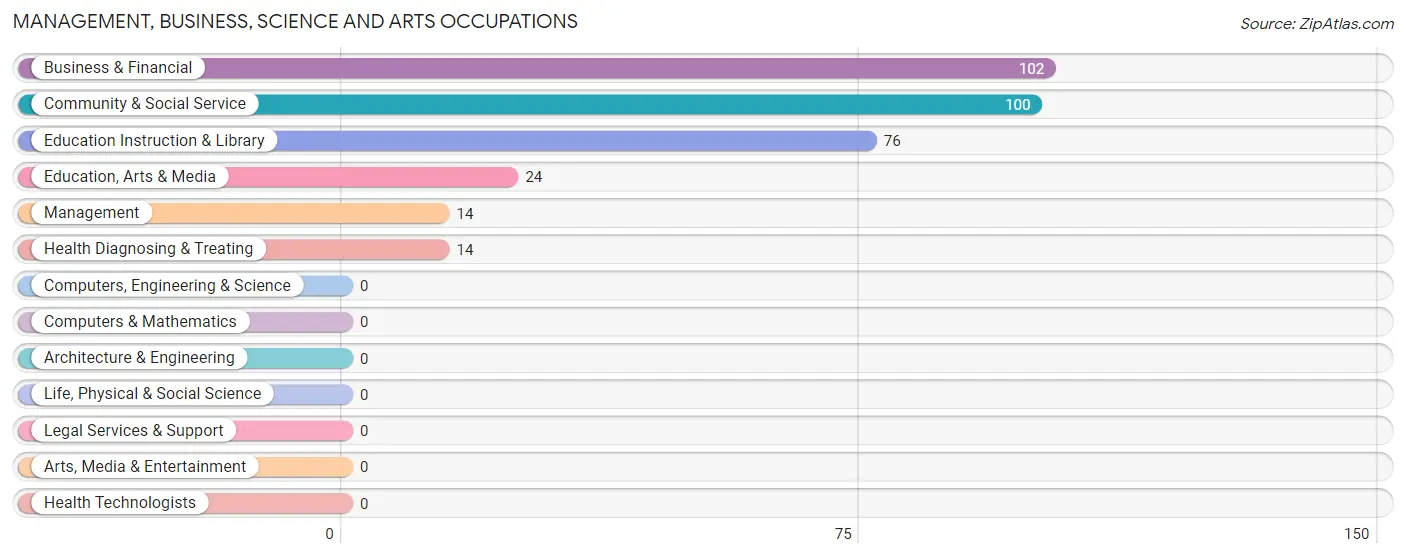
Management, Business, Science and Arts Occupations
The most common Management, Business, Science and Arts occupations in Royal City are Business & Financial (102 | 11.1%), Community & Social Service (100 | 10.9%), Education Instruction & Library (76 | 8.3%), Education, Arts & Media (24 | 2.6%), and Management (14 | 1.5%).
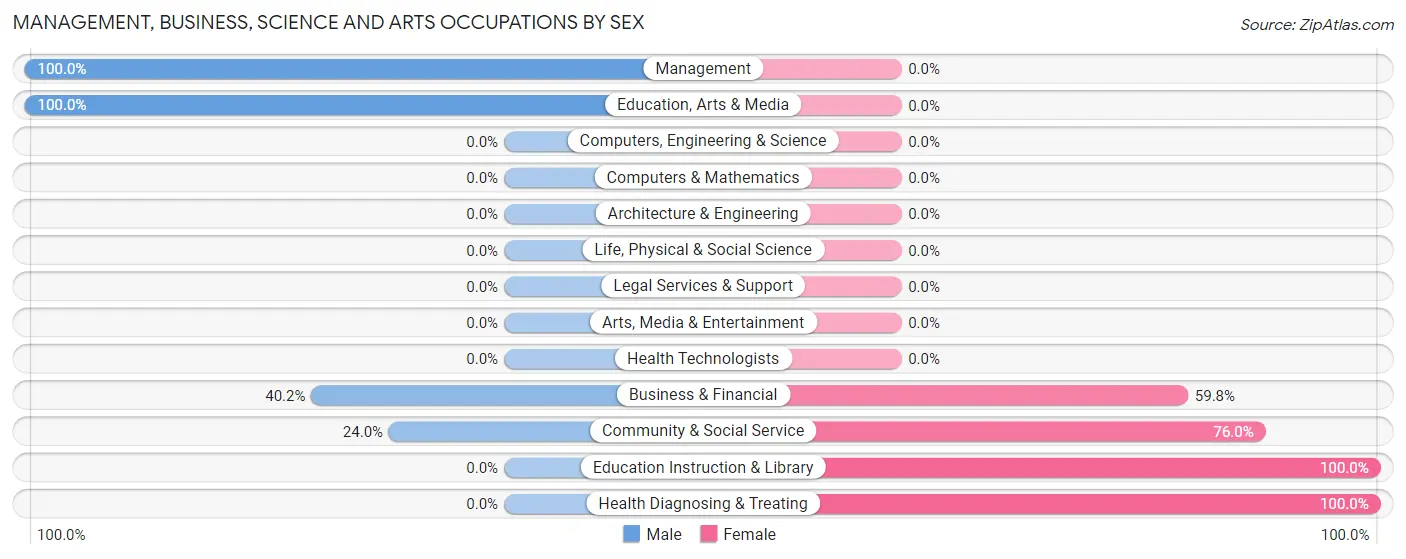
Management, Business, Science and Arts Occupations by Sex
Within the Management, Business, Science and Arts occupations in Royal City, the most male-oriented occupations are Management (100.0%), Education, Arts & Media (100.0%), and Business & Financial (40.2%), while the most female-oriented occupations are Education Instruction & Library (100.0%), Health Diagnosing & Treating (100.0%), and Community & Social Service (76.0%).
| Occupation | Male | Female |
| Management | 14 (100.0%) | 0 (0.0%) |
| Business & Financial | 41 (40.2%) | 61 (59.8%) |
| Computers, Engineering & Science | 0 (0.0%) | 0 (0.0%) |
| Computers & Mathematics | 0 (0.0%) | 0 (0.0%) |
| Architecture & Engineering | 0 (0.0%) | 0 (0.0%) |
| Life, Physical & Social Science | 0 (0.0%) | 0 (0.0%) |
| Community & Social Service | 24 (24.0%) | 76 (76.0%) |
| Education, Arts & Media | 24 (100.0%) | 0 (0.0%) |
| Legal Services & Support | 0 (0.0%) | 0 (0.0%) |
| Education Instruction & Library | 0 (0.0%) | 76 (100.0%) |
| Arts, Media & Entertainment | 0 (0.0%) | 0 (0.0%) |
| Health Diagnosing & Treating | 0 (0.0%) | 14 (100.0%) |
| Health Technologists | 0 (0.0%) | 0 (0.0%) |
| Total (Category) | 79 (34.4%) | 151 (65.6%) |
| Total (Overall) | 520 (56.5%) | 400 (43.5%) |
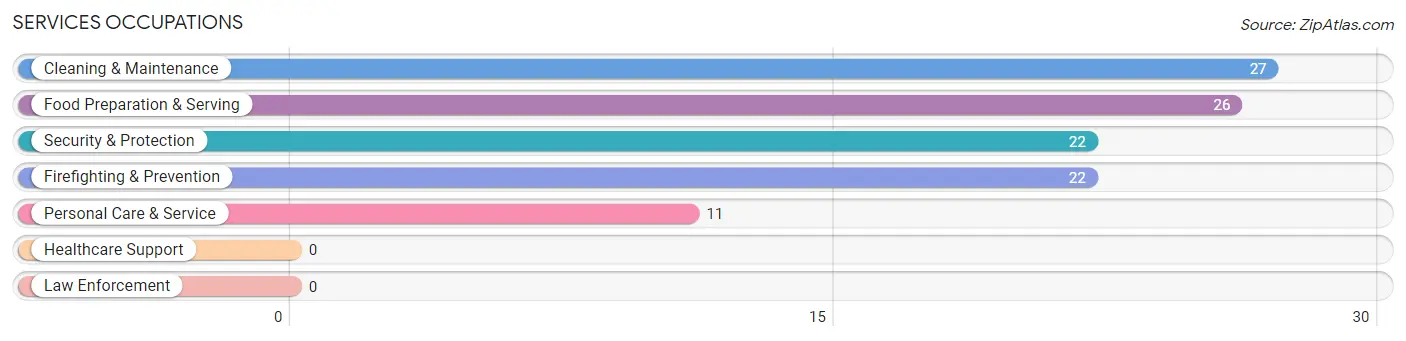
Services Occupations
The most common Services occupations in Royal City are Cleaning & Maintenance (27 | 2.9%), Food Preparation & Serving (26 | 2.8%), Security & Protection (22 | 2.4%), Firefighting & Prevention (22 | 2.4%), and Personal Care & Service (11 | 1.2%).
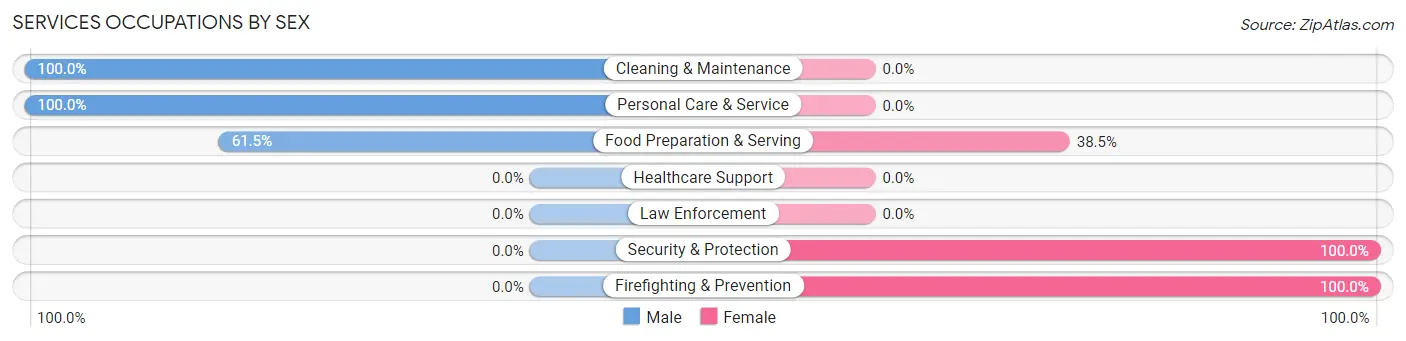
Services Occupations by Sex
Within the Services occupations in Royal City, the most male-oriented occupations are Cleaning & Maintenance (100.0%), Personal Care & Service (100.0%), and Food Preparation & Serving (61.5%), while the most female-oriented occupations are Security & Protection (100.0%), Firefighting & Prevention (100.0%), and Food Preparation & Serving (38.5%).
| Occupation | Male | Female |
| Healthcare Support | 0 (0.0%) | 0 (0.0%) |
| Security & Protection | 0 (0.0%) | 22 (100.0%) |
| Firefighting & Prevention | 0 (0.0%) | 22 (100.0%) |
| Law Enforcement | 0 (0.0%) | 0 (0.0%) |
| Food Preparation & Serving | 16 (61.5%) | 10 (38.5%) |
| Cleaning & Maintenance | 27 (100.0%) | 0 (0.0%) |
| Personal Care & Service | 11 (100.0%) | 0 (0.0%) |
| Total (Category) | 54 (62.8%) | 32 (37.2%) |
| Total (Overall) | 520 (56.5%) | 400 (43.5%) |
Sales and Office Occupations
The most common Sales and Office occupations in Royal City are Sales & Related (29 | 3.2%), and Office & Administration (19 | 2.1%).
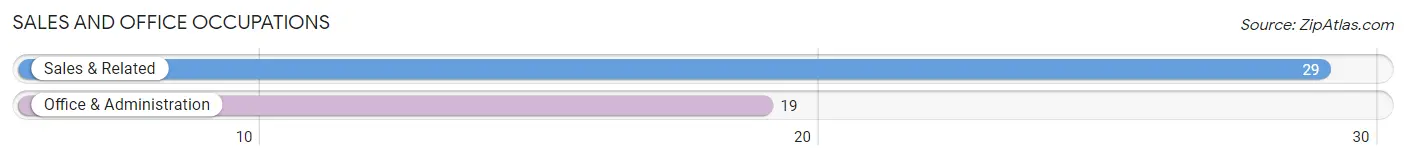
Sales and Office Occupations by Sex
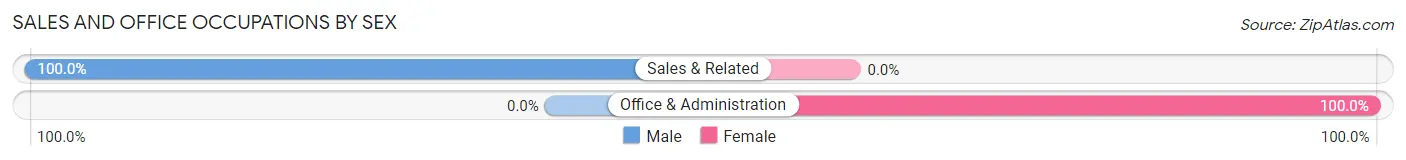
| Occupation | Male | Female |
| Sales & Related | 29 (100.0%) | 0 (0.0%) |
| Office & Administration | 0 (0.0%) | 19 (100.0%) |
| Total (Category) | 29 (60.4%) | 19 (39.6%) |
| Total (Overall) | 520 (56.5%) | 400 (43.5%) |
Natural Resources, Construction and Maintenance Occupations
The most common Natural Resources, Construction and Maintenance occupations in Royal City are Farming, Fishing & Forestry (300 | 32.6%), Construction & Extraction (16 | 1.7%), and Installation, Maintenance & Repair (13 | 1.4%).
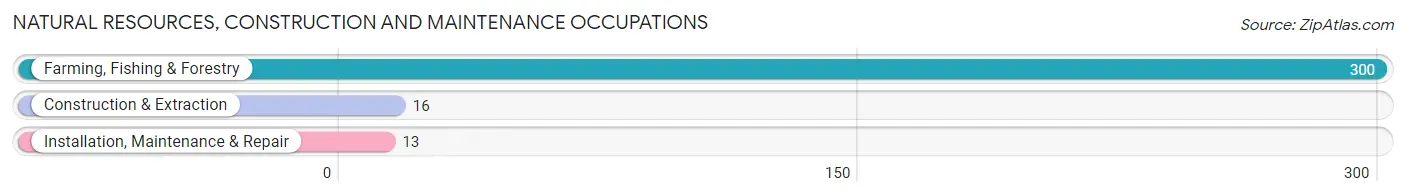
Natural Resources, Construction and Maintenance Occupations by Sex
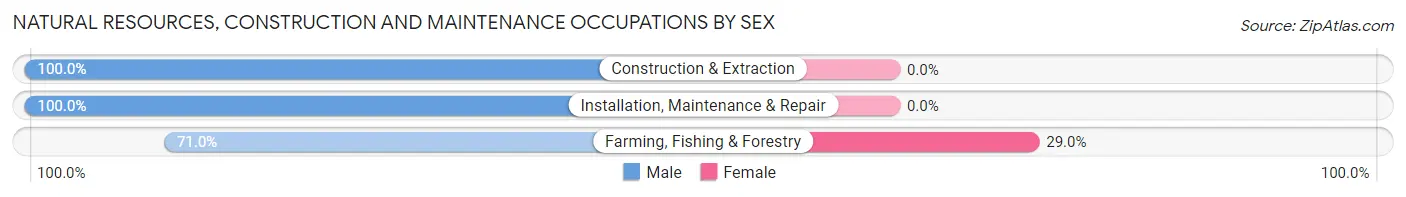
| Occupation | Male | Female |
| Farming, Fishing & Forestry | 213 (71.0%) | 87 (29.0%) |
| Construction & Extraction | 16 (100.0%) | 0 (0.0%) |
| Installation, Maintenance & Repair | 13 (100.0%) | 0 (0.0%) |
| Total (Category) | 242 (73.6%) | 87 (26.4%) |
| Total (Overall) | 520 (56.5%) | 400 (43.5%) |
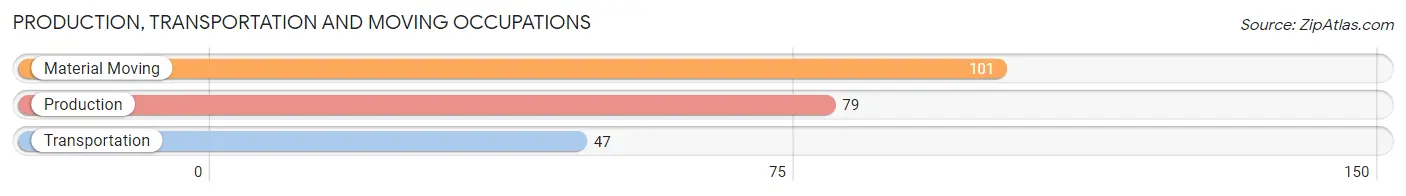
Production, Transportation and Moving Occupations
The most common Production, Transportation and Moving occupations in Royal City are Material Moving (101 | 11.0%), Production (79 | 8.6%), and Transportation (47 | 5.1%).
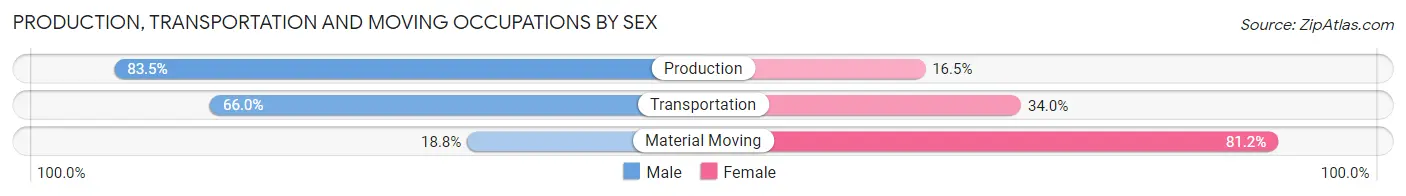
Production, Transportation and Moving Occupations by Sex
| Occupation | Male | Female |
| Production | 66 (83.5%) | 13 (16.5%) |
| Transportation | 31 (66.0%) | 16 (34.0%) |
| Material Moving | 19 (18.8%) | 82 (81.2%) |
| Total (Category) | 116 (51.1%) | 111 (48.9%) |
| Total (Overall) | 520 (56.5%) | 400 (43.5%) |
Employment Industries by Sex in Royal City
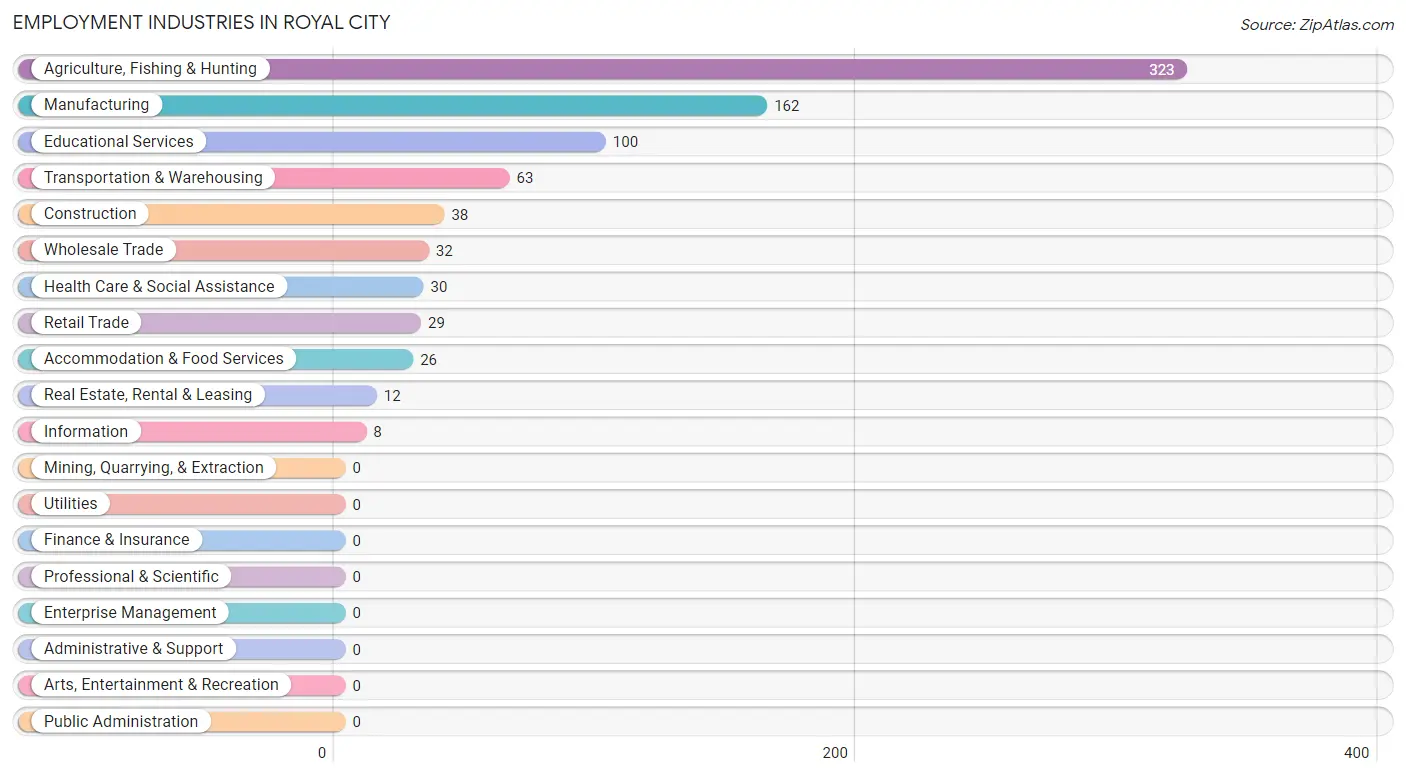
Employment Industries in Royal City
The major employment industries in Royal City include Agriculture, Fishing & Hunting (323 | 35.1%), Manufacturing (162 | 17.6%), Educational Services (100 | 10.9%), Transportation & Warehousing (63 | 6.9%), and Construction (38 | 4.1%).
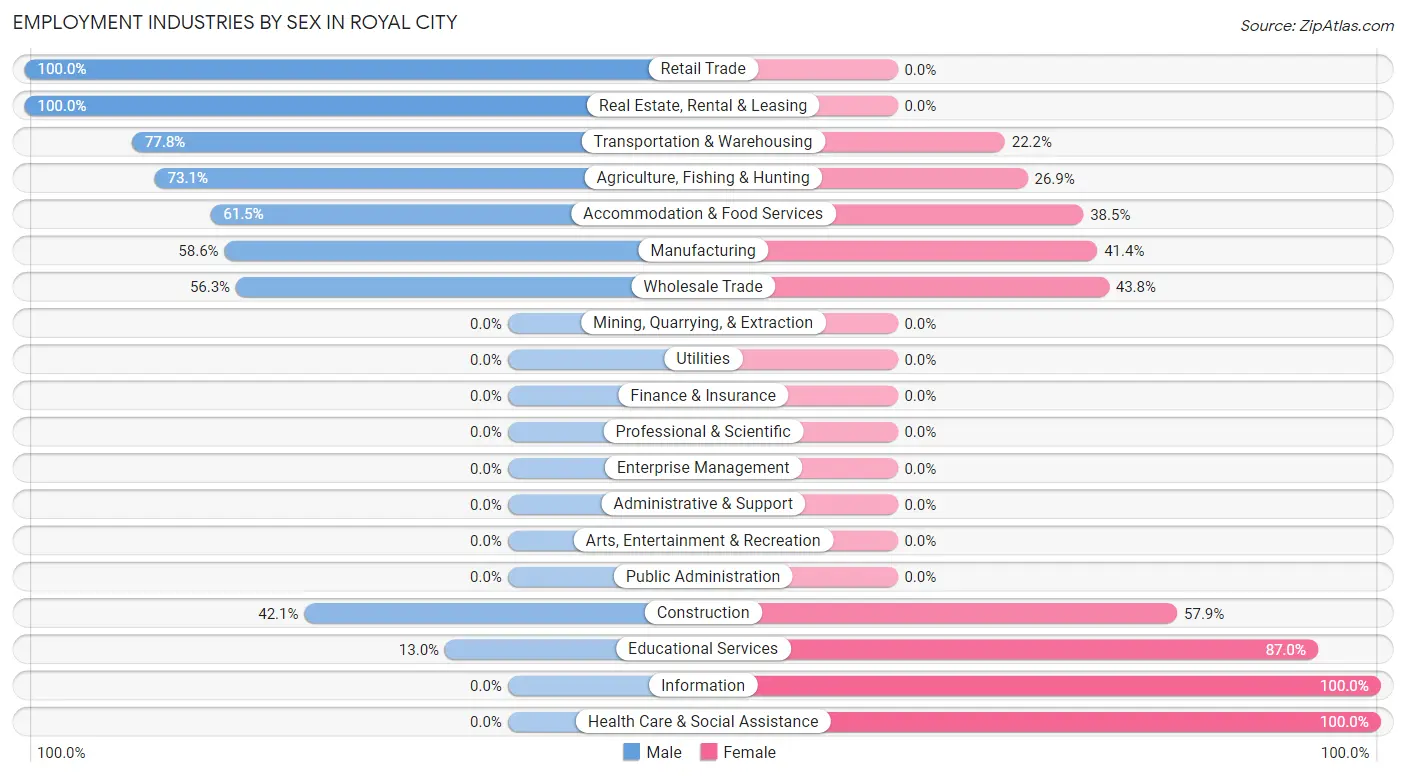
Employment Industries by Sex in Royal City
The Royal City industries that see more men than women are Retail Trade (100.0%), Real Estate, Rental & Leasing (100.0%), and Transportation & Warehousing (77.8%), whereas the industries that tend to have a higher number of women are Information (100.0%), Health Care & Social Assistance (100.0%), and Educational Services (87.0%).
| Industry | Male | Female |
| Agriculture, Fishing & Hunting | 236 (73.1%) | 87 (26.9%) |
| Mining, Quarrying, & Extraction | 0 (0.0%) | 0 (0.0%) |
| Construction | 16 (42.1%) | 22 (57.9%) |
| Manufacturing | 95 (58.6%) | 67 (41.4%) |
| Wholesale Trade | 18 (56.2%) | 14 (43.8%) |
| Retail Trade | 29 (100.0%) | 0 (0.0%) |
| Transportation & Warehousing | 49 (77.8%) | 14 (22.2%) |
| Utilities | 0 (0.0%) | 0 (0.0%) |
| Information | 0 (0.0%) | 8 (100.0%) |
| Finance & Insurance | 0 (0.0%) | 0 (0.0%) |
| Real Estate, Rental & Leasing | 12 (100.0%) | 0 (0.0%) |
| Professional & Scientific | 0 (0.0%) | 0 (0.0%) |
| Enterprise Management | 0 (0.0%) | 0 (0.0%) |
| Administrative & Support | 0 (0.0%) | 0 (0.0%) |
| Educational Services | 13 (13.0%) | 87 (87.0%) |
| Health Care & Social Assistance | 0 (0.0%) | 30 (100.0%) |
| Arts, Entertainment & Recreation | 0 (0.0%) | 0 (0.0%) |
| Accommodation & Food Services | 16 (61.5%) | 10 (38.5%) |
| Public Administration | 0 (0.0%) | 0 (0.0%) |
| Total | 520 (56.5%) | 400 (43.5%) |
Education in Royal City
School Enrollment in Royal City
The most common levels of schooling among the 682 students in Royal City are middle school (191 | 28.0%), high school (186 | 27.3%), and elementary school (163 | 23.9%).
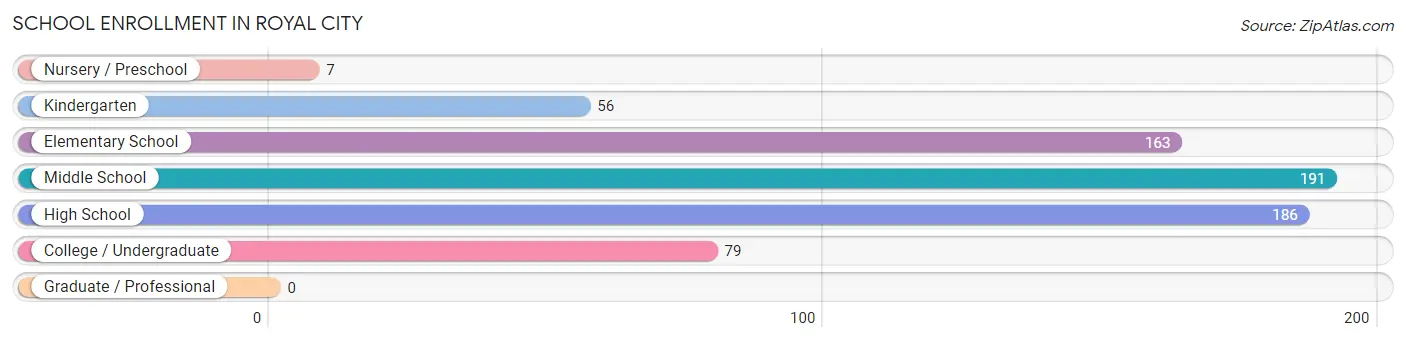
| School Level | # Students | % Students |
| Nursery / Preschool | 7 | 1.0% |
| Kindergarten | 56 | 8.2% |
| Elementary School | 163 | 23.9% |
| Middle School | 191 | 28.0% |
| High School | 186 | 27.3% |
| College / Undergraduate | 79 | 11.6% |
| Graduate / Professional | 0 | 0.0% |
| Total | 682 | 100.0% |
School Enrollment by Age by Funding Source in Royal City
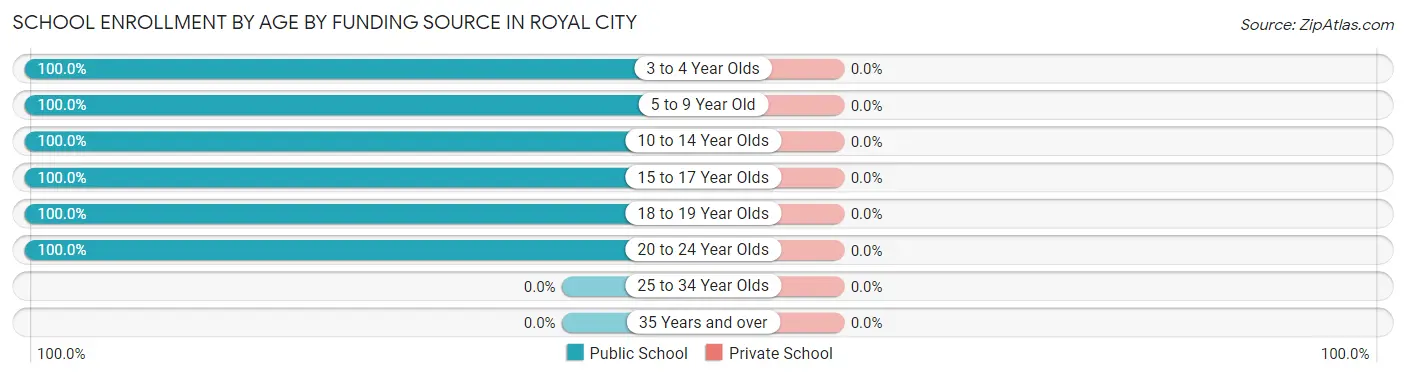
| Age Bracket | Public School | Private School |
| 3 to 4 Year Olds | 7 (100.0%) | 0 (0.0%) |
| 5 to 9 Year Old | 211 (100.0%) | 0 (0.0%) |
| 10 to 14 Year Olds | 199 (100.0%) | 0 (0.0%) |
| 15 to 17 Year Olds | 135 (100.0%) | 0 (0.0%) |
| 18 to 19 Year Olds | 68 (100.0%) | 0 (0.0%) |
| 20 to 24 Year Olds | 62 (100.0%) | 0 (0.0%) |
| 25 to 34 Year Olds | 0 (0.0%) | 0 (0.0%) |
| 35 Years and over | 0 (0.0%) | 0 (0.0%) |
| Total | 682 (100.0%) | 0 (0.0%) |
Educational Attainment by Field of Study in Royal City
Liberal arts & history (29 | 34.1%), business (21 | 24.7%), bio, nature & agricultural (19 | 22.4%), and education (16 | 18.8%) are the most common fields of study among 85 individuals in Royal City who have obtained a bachelor's degree or higher.
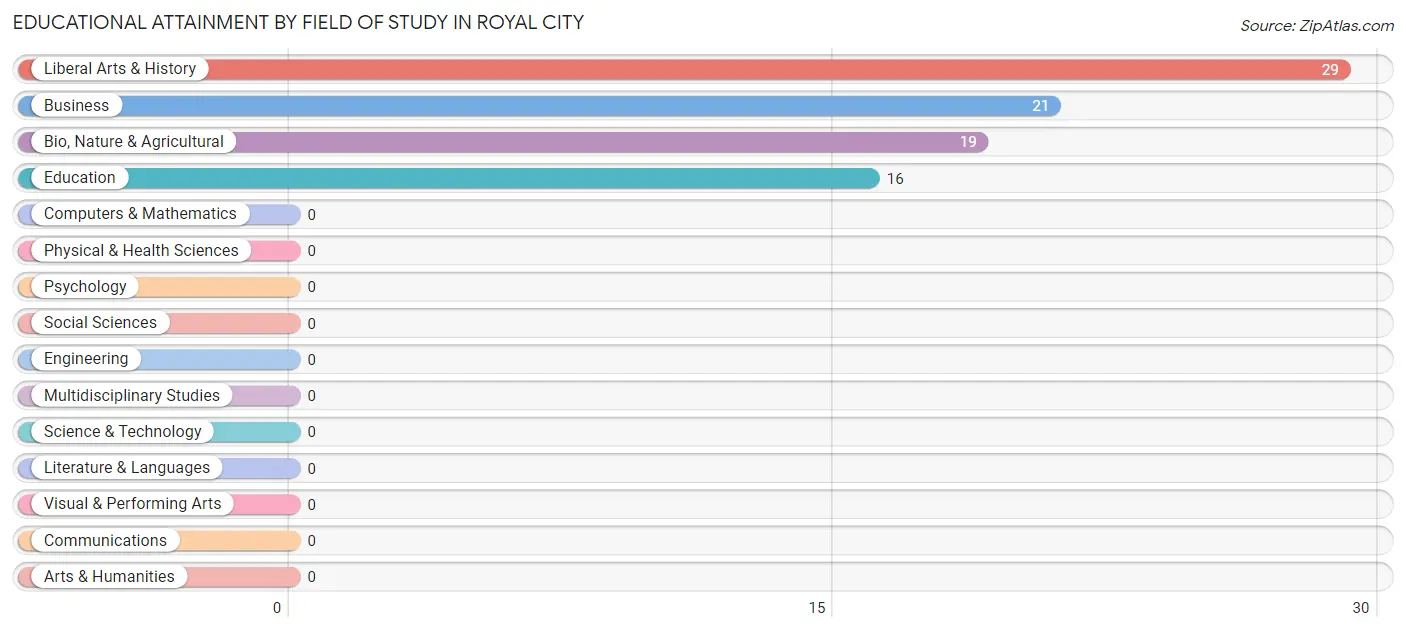
| Field of Study | # Graduates | % Graduates |
| Computers & Mathematics | 0 | 0.0% |
| Bio, Nature & Agricultural | 19 | 22.4% |
| Physical & Health Sciences | 0 | 0.0% |
| Psychology | 0 | 0.0% |
| Social Sciences | 0 | 0.0% |
| Engineering | 0 | 0.0% |
| Multidisciplinary Studies | 0 | 0.0% |
| Science & Technology | 0 | 0.0% |
| Business | 21 | 24.7% |
| Education | 16 | 18.8% |
| Literature & Languages | 0 | 0.0% |
| Liberal Arts & History | 29 | 34.1% |
| Visual & Performing Arts | 0 | 0.0% |
| Communications | 0 | 0.0% |
| Arts & Humanities | 0 | 0.0% |
| Total | 85 | 100.0% |
Transportation & Commute in Royal City
Vehicle Availability by Sex in Royal City
The most prevalent vehicle ownership categories in Royal City are males with 3 vehicles (188, accounting for 36.1%) and females with 3 vehicles (115, making up 50.3%).
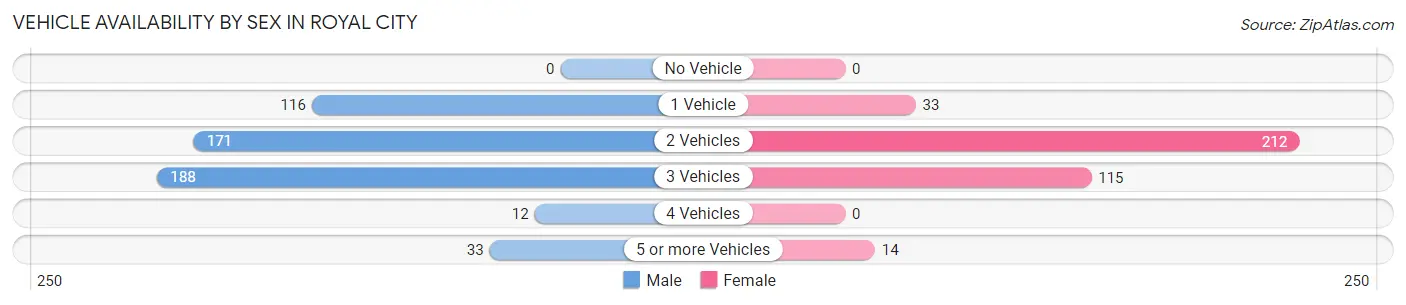
| Vehicles Available | Male | Female |
| No Vehicle | 0 (0.0%) | 0 (0.0%) |
| 1 Vehicle | 116 (22.3%) | 33 (8.8%) |
| 2 Vehicles | 171 (32.9%) | 212 (56.7%) |
| 3 Vehicles | 188 (36.1%) | 115 (30.7%) |
| 4 Vehicles | 12 (2.3%) | 0 (0.0%) |
| 5 or more Vehicles | 33 (6.4%) | 14 (3.7%) |
| Total | 520 (100.0%) | 374 (100.0%) |
Commute Time in Royal City
The most frequently occuring commute durations in Royal City are 5 to 9 minutes (259 commuters, 30.7%), less than 5 minutes (189 commuters, 22.4%), and 15 to 19 minutes (113 commuters, 13.4%).
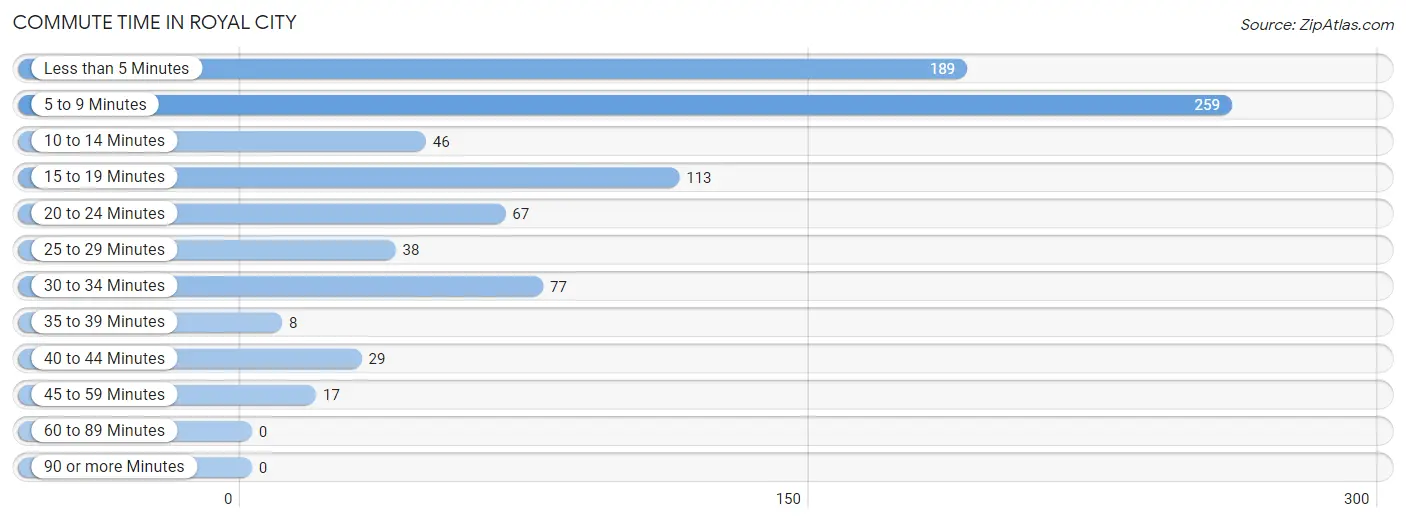
| Commute Time | # Commuters | % Commuters |
| Less than 5 Minutes | 189 | 22.4% |
| 5 to 9 Minutes | 259 | 30.7% |
| 10 to 14 Minutes | 46 | 5.5% |
| 15 to 19 Minutes | 113 | 13.4% |
| 20 to 24 Minutes | 67 | 8.0% |
| 25 to 29 Minutes | 38 | 4.5% |
| 30 to 34 Minutes | 77 | 9.1% |
| 35 to 39 Minutes | 8 | 0.9% |
| 40 to 44 Minutes | 29 | 3.4% |
| 45 to 59 Minutes | 17 | 2.0% |
| 60 to 89 Minutes | 0 | 0.0% |
| 90 or more Minutes | 0 | 0.0% |
Commute Time by Sex in Royal City
The most common commute times in Royal City are 5 to 9 minutes (127 commuters, 27.7%) for males and 5 to 9 minutes (132 commuters, 34.4%) for females.
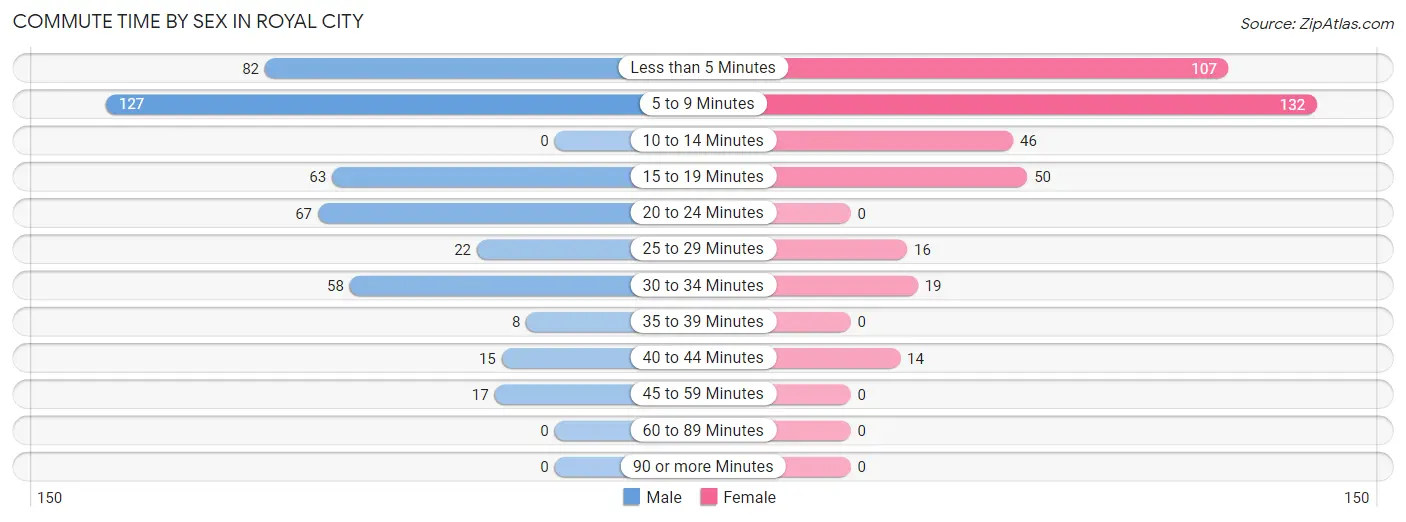
| Commute Time | Male | Female |
| Less than 5 Minutes | 82 (17.9%) | 107 (27.9%) |
| 5 to 9 Minutes | 127 (27.7%) | 132 (34.4%) |
| 10 to 14 Minutes | 0 (0.0%) | 46 (12.0%) |
| 15 to 19 Minutes | 63 (13.7%) | 50 (13.0%) |
| 20 to 24 Minutes | 67 (14.6%) | 0 (0.0%) |
| 25 to 29 Minutes | 22 (4.8%) | 16 (4.2%) |
| 30 to 34 Minutes | 58 (12.6%) | 19 (5.0%) |
| 35 to 39 Minutes | 8 (1.7%) | 0 (0.0%) |
| 40 to 44 Minutes | 15 (3.3%) | 14 (3.6%) |
| 45 to 59 Minutes | 17 (3.7%) | 0 (0.0%) |
| 60 to 89 Minutes | 0 (0.0%) | 0 (0.0%) |
| 90 or more Minutes | 0 (0.0%) | 0 (0.0%) |
Time of Departure to Work by Sex in Royal City
The most frequent times of departure to work in Royal City are 6:30 AM to 6:59 AM (112, 24.4%) for males and 5:30 AM to 5:59 AM (91, 23.7%) for females.
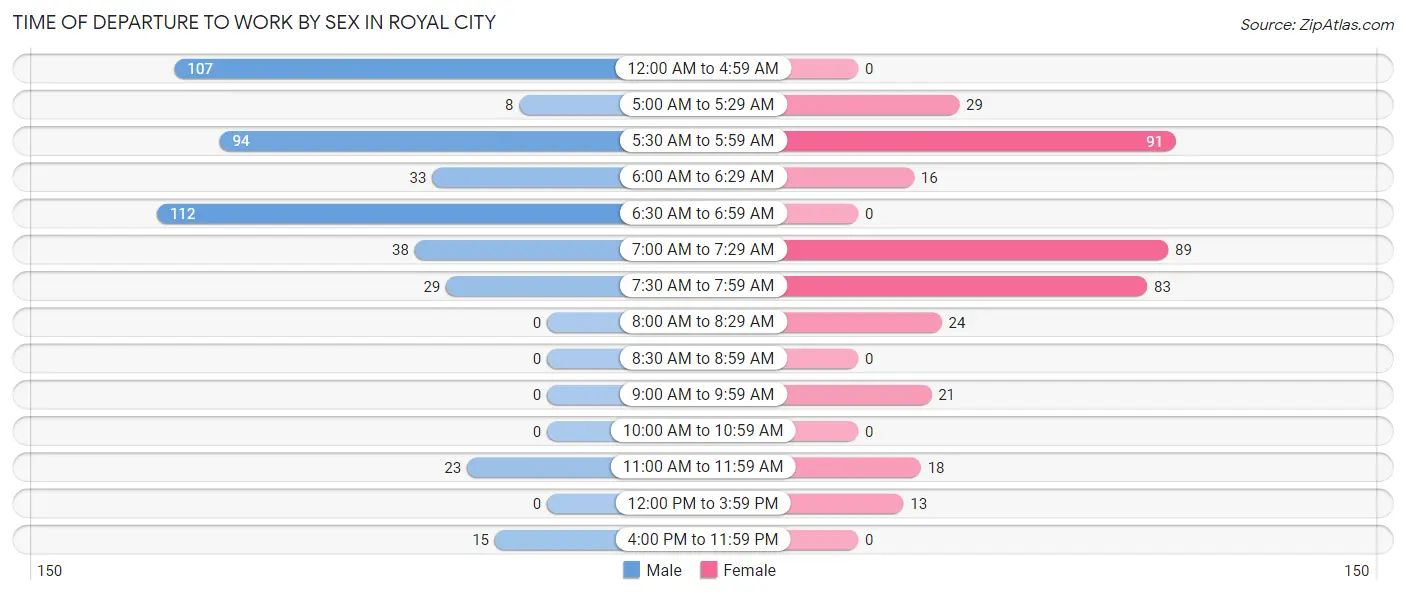
| Time of Departure | Male | Female |
| 12:00 AM to 4:59 AM | 107 (23.3%) | 0 (0.0%) |
| 5:00 AM to 5:29 AM | 8 (1.7%) | 29 (7.5%) |
| 5:30 AM to 5:59 AM | 94 (20.5%) | 91 (23.7%) |
| 6:00 AM to 6:29 AM | 33 (7.2%) | 16 (4.2%) |
| 6:30 AM to 6:59 AM | 112 (24.4%) | 0 (0.0%) |
| 7:00 AM to 7:29 AM | 38 (8.3%) | 89 (23.2%) |
| 7:30 AM to 7:59 AM | 29 (6.3%) | 83 (21.6%) |
| 8:00 AM to 8:29 AM | 0 (0.0%) | 24 (6.2%) |
| 8:30 AM to 8:59 AM | 0 (0.0%) | 0 (0.0%) |
| 9:00 AM to 9:59 AM | 0 (0.0%) | 21 (5.5%) |
| 10:00 AM to 10:59 AM | 0 (0.0%) | 0 (0.0%) |
| 11:00 AM to 11:59 AM | 23 (5.0%) | 18 (4.7%) |
| 12:00 PM to 3:59 PM | 0 (0.0%) | 13 (3.4%) |
| 4:00 PM to 11:59 PM | 15 (3.3%) | 0 (0.0%) |
| Total | 459 (100.0%) | 384 (100.0%) |
Housing Occupancy in Royal City
Occupancy by Ownership in Royal City
Of the total 545 dwellings in Royal City, owner-occupied units account for 261 (47.9%), while renter-occupied units make up 284 (52.1%).
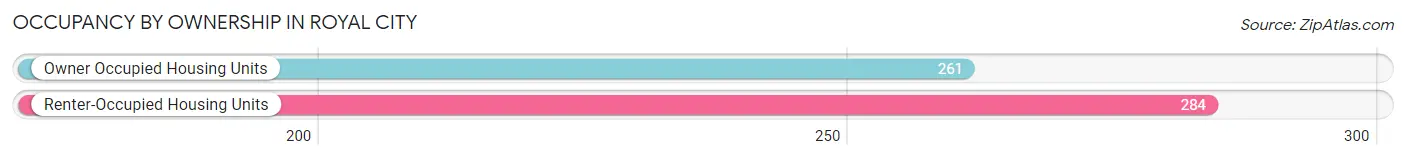
| Occupancy | # Housing Units | % Housing Units |
| Owner Occupied Housing Units | 261 | 47.9% |
| Renter-Occupied Housing Units | 284 | 52.1% |
| Total Occupied Housing Units | 545 | 100.0% |
Occupancy by Household Size in Royal City
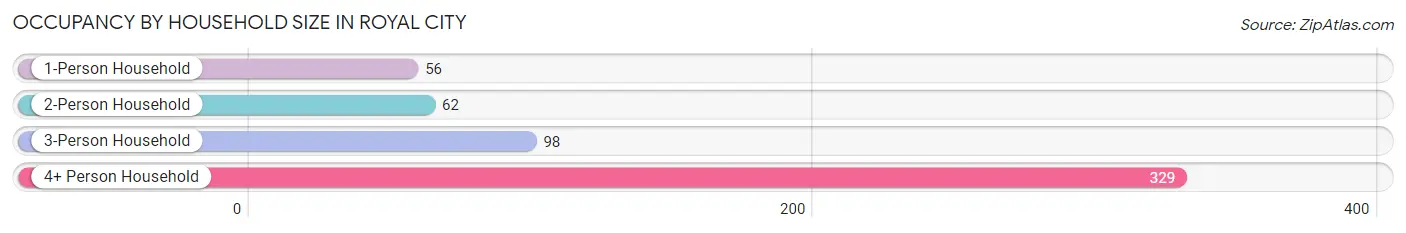
| Household Size | # Housing Units | % Housing Units |
| 1-Person Household | 56 | 10.3% |
| 2-Person Household | 62 | 11.4% |
| 3-Person Household | 98 | 18.0% |
| 4+ Person Household | 329 | 60.4% |
| Total Housing Units | 545 | 100.0% |
Occupancy by Ownership by Household Size in Royal City
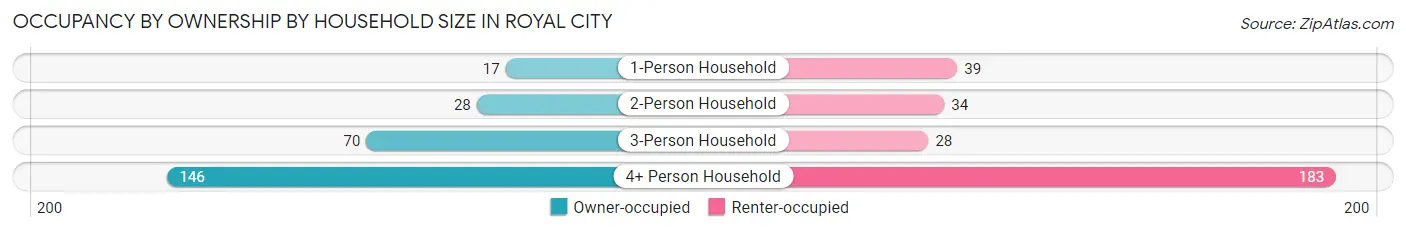
| Household Size | Owner-occupied | Renter-occupied |
| 1-Person Household | 17 (30.4%) | 39 (69.6%) |
| 2-Person Household | 28 (45.2%) | 34 (54.8%) |
| 3-Person Household | 70 (71.4%) | 28 (28.6%) |
| 4+ Person Household | 146 (44.4%) | 183 (55.6%) |
| Total Housing Units | 261 (47.9%) | 284 (52.1%) |
Occupancy by Educational Attainment in Royal City
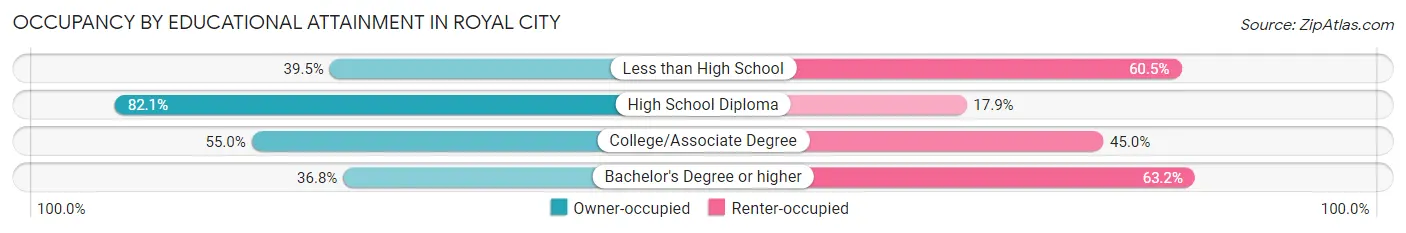
| Household Size | Owner-occupied | Renter-occupied |
| Less than High School | 147 (39.5%) | 225 (60.5%) |
| High School Diploma | 78 (82.1%) | 17 (17.9%) |
| College/Associate Degree | 22 (55.0%) | 18 (45.0%) |
| Bachelor's Degree or higher | 14 (36.8%) | 24 (63.2%) |
Occupancy by Age of Householder in Royal City
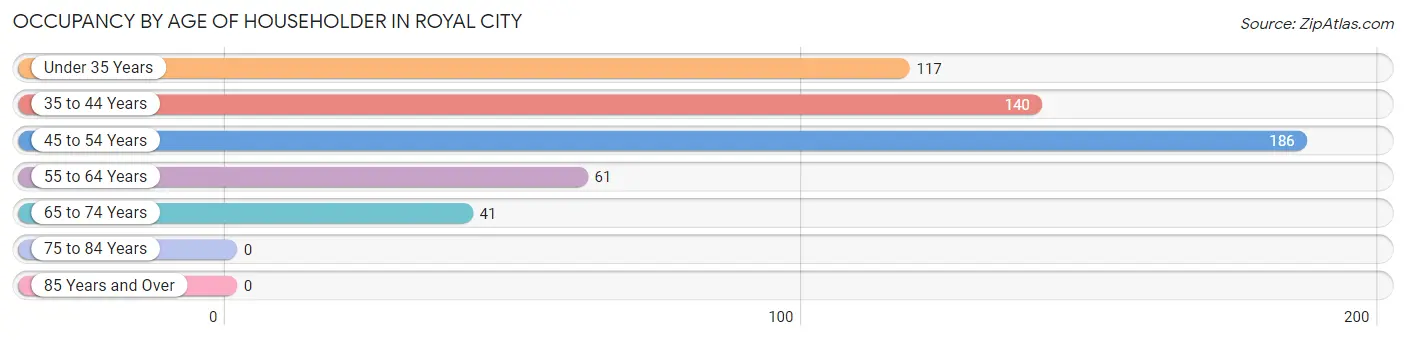
| Age Bracket | # Households | % Households |
| Under 35 Years | 117 | 21.5% |
| 35 to 44 Years | 140 | 25.7% |
| 45 to 54 Years | 186 | 34.1% |
| 55 to 64 Years | 61 | 11.2% |
| 65 to 74 Years | 41 | 7.5% |
| 75 to 84 Years | 0 | 0.0% |
| 85 Years and Over | 0 | 0.0% |
| Total | 545 | 100.0% |
Housing Finances in Royal City
Median Income by Occupancy in Royal City
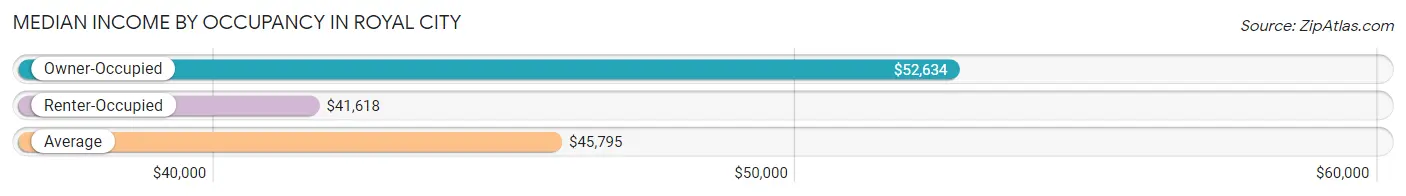
| Occupancy Type | # Households | Median Income |
| Owner-Occupied | 261 (47.9%) | $52,634 |
| Renter-Occupied | 284 (52.1%) | $41,618 |
| Average | 545 (100.0%) | $45,795 |
Occupancy by Householder Income Bracket in Royal City
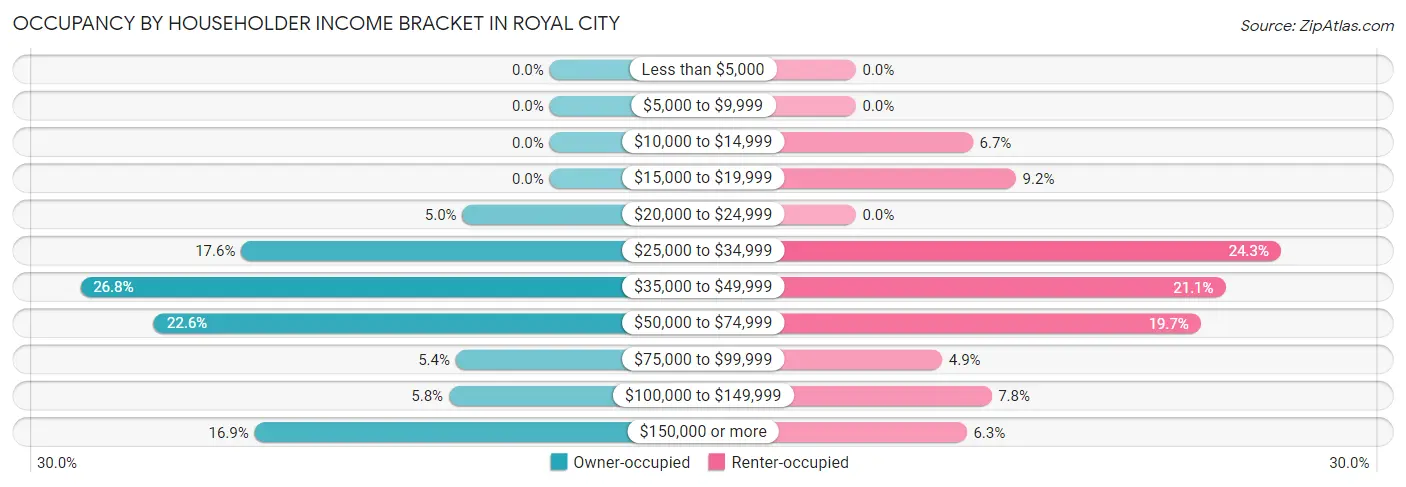
| Income Bracket | Owner-occupied | Renter-occupied |
| Less than $5,000 | 0 (0.0%) | 0 (0.0%) |
| $5,000 to $9,999 | 0 (0.0%) | 0 (0.0%) |
| $10,000 to $14,999 | 0 (0.0%) | 19 (6.7%) |
| $15,000 to $19,999 | 0 (0.0%) | 26 (9.1%) |
| $20,000 to $24,999 | 13 (5.0%) | 0 (0.0%) |
| $25,000 to $34,999 | 46 (17.6%) | 69 (24.3%) |
| $35,000 to $49,999 | 70 (26.8%) | 60 (21.1%) |
| $50,000 to $74,999 | 59 (22.6%) | 56 (19.7%) |
| $75,000 to $99,999 | 14 (5.4%) | 14 (4.9%) |
| $100,000 to $149,999 | 15 (5.8%) | 22 (7.7%) |
| $150,000 or more | 44 (16.9%) | 18 (6.3%) |
| Total | 261 (100.0%) | 284 (100.0%) |
Monthly Housing Cost Tiers in Royal City
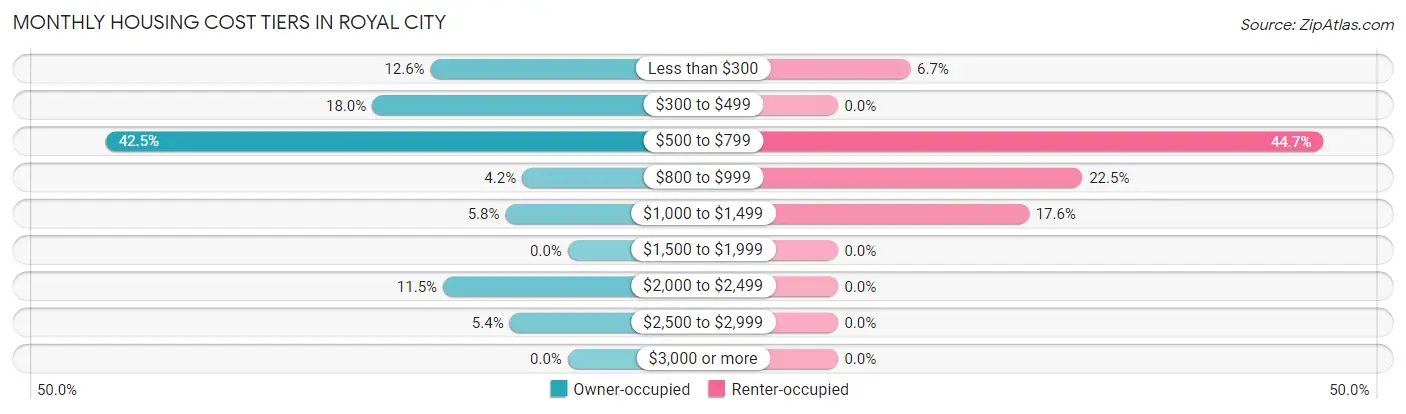
| Monthly Cost | Owner-occupied | Renter-occupied |
| Less than $300 | 33 (12.6%) | 19 (6.7%) |
| $300 to $499 | 47 (18.0%) | 0 (0.0%) |
| $500 to $799 | 111 (42.5%) | 127 (44.7%) |
| $800 to $999 | 11 (4.2%) | 64 (22.5%) |
| $1,000 to $1,499 | 15 (5.8%) | 50 (17.6%) |
| $1,500 to $1,999 | 0 (0.0%) | 0 (0.0%) |
| $2,000 to $2,499 | 30 (11.5%) | 0 (0.0%) |
| $2,500 to $2,999 | 14 (5.4%) | 0 (0.0%) |
| $3,000 or more | 0 (0.0%) | 0 (0.0%) |
| Total | 261 (100.0%) | 284 (100.0%) |
Physical Housing Characteristics in Royal City
Housing Structures in Royal City
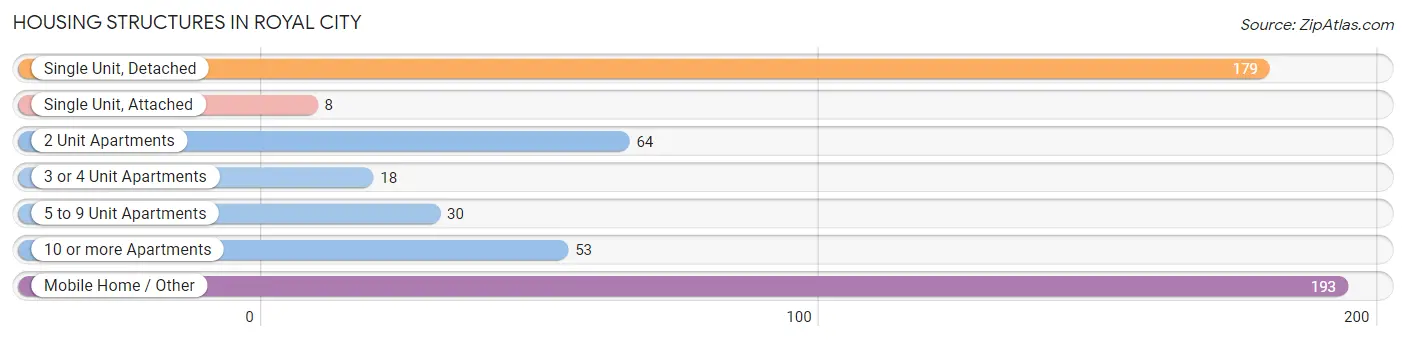
| Structure Type | # Housing Units | % Housing Units |
| Single Unit, Detached | 179 | 32.8% |
| Single Unit, Attached | 8 | 1.5% |
| 2 Unit Apartments | 64 | 11.7% |
| 3 or 4 Unit Apartments | 18 | 3.3% |
| 5 to 9 Unit Apartments | 30 | 5.5% |
| 10 or more Apartments | 53 | 9.7% |
| Mobile Home / Other | 193 | 35.4% |
| Total | 545 | 100.0% |
Housing Structures by Occupancy in Royal City
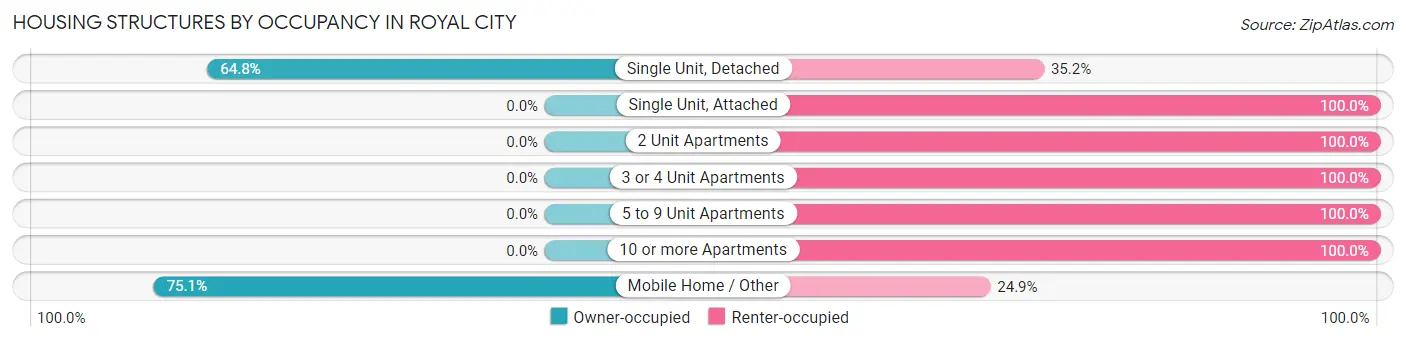
| Structure Type | Owner-occupied | Renter-occupied |
| Single Unit, Detached | 116 (64.8%) | 63 (35.2%) |
| Single Unit, Attached | 0 (0.0%) | 8 (100.0%) |
| 2 Unit Apartments | 0 (0.0%) | 64 (100.0%) |
| 3 or 4 Unit Apartments | 0 (0.0%) | 18 (100.0%) |
| 5 to 9 Unit Apartments | 0 (0.0%) | 30 (100.0%) |
| 10 or more Apartments | 0 (0.0%) | 53 (100.0%) |
| Mobile Home / Other | 145 (75.1%) | 48 (24.9%) |
| Total | 261 (47.9%) | 284 (52.1%) |
Housing Structures by Number of Rooms in Royal City
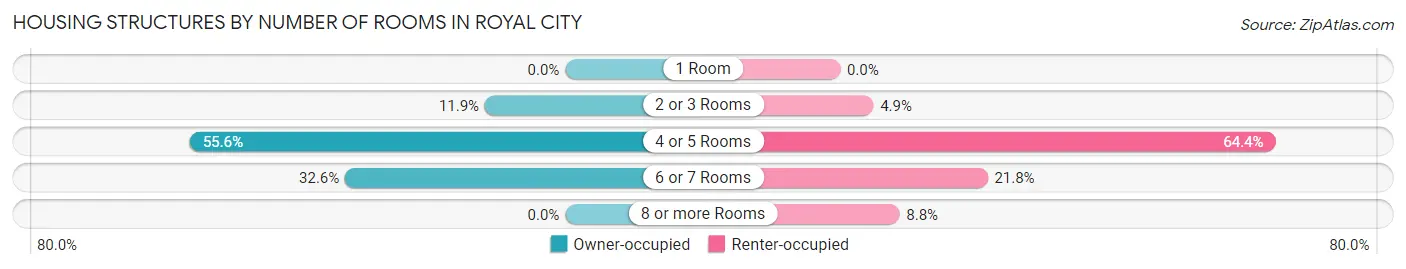
| Number of Rooms | Owner-occupied | Renter-occupied |
| 1 Room | 0 (0.0%) | 0 (0.0%) |
| 2 or 3 Rooms | 31 (11.9%) | 14 (4.9%) |
| 4 or 5 Rooms | 145 (55.6%) | 183 (64.4%) |
| 6 or 7 Rooms | 85 (32.6%) | 62 (21.8%) |
| 8 or more Rooms | 0 (0.0%) | 25 (8.8%) |
| Total | 261 (100.0%) | 284 (100.0%) |
Housing Structure by Heating Type in Royal City
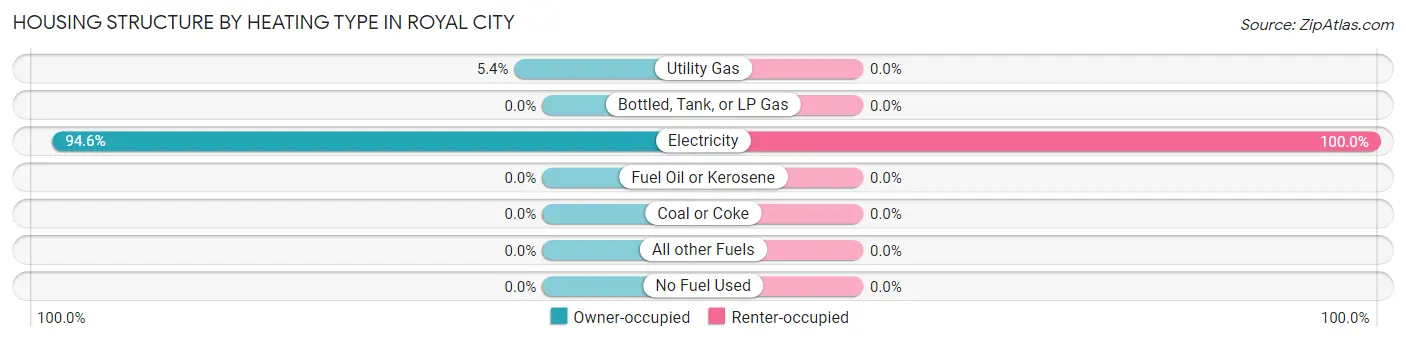
| Heating Type | Owner-occupied | Renter-occupied |
| Utility Gas | 14 (5.4%) | 0 (0.0%) |
| Bottled, Tank, or LP Gas | 0 (0.0%) | 0 (0.0%) |
| Electricity | 247 (94.6%) | 284 (100.0%) |
| Fuel Oil or Kerosene | 0 (0.0%) | 0 (0.0%) |
| Coal or Coke | 0 (0.0%) | 0 (0.0%) |
| All other Fuels | 0 (0.0%) | 0 (0.0%) |
| No Fuel Used | 0 (0.0%) | 0 (0.0%) |
| Total | 261 (100.0%) | 284 (100.0%) |
Household Vehicle Usage in Royal City
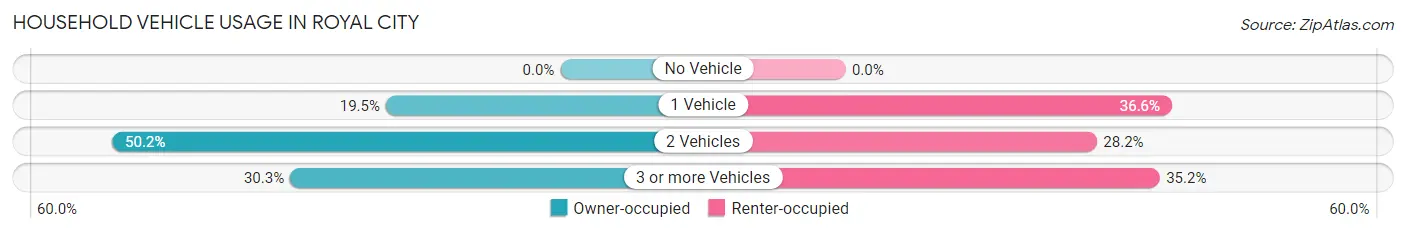
| Vehicles per Household | Owner-occupied | Renter-occupied |
| No Vehicle | 0 (0.0%) | 0 (0.0%) |
| 1 Vehicle | 51 (19.5%) | 104 (36.6%) |
| 2 Vehicles | 131 (50.2%) | 80 (28.2%) |
| 3 or more Vehicles | 79 (30.3%) | 100 (35.2%) |
| Total | 261 (100.0%) | 284 (100.0%) |
Real Estate & Mortgages in Royal City
Real Estate and Mortgage Overview in Royal City
| Characteristic | Without Mortgage | With Mortgage |
| Housing Units | 171 | 90 |
| Median Property Value | - | - |
| Median Household Income | $45,720 | $44 |
| Monthly Housing Costs | $508 | $0 |
| Real Estate Taxes | - | - |
Property Value by Mortgage Status in Royal City
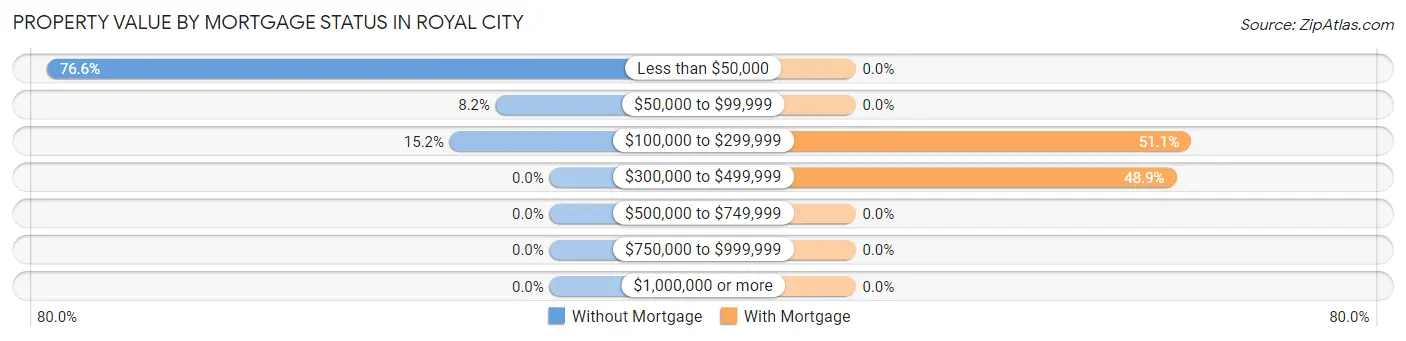
| Property Value | Without Mortgage | With Mortgage |
| Less than $50,000 | 131 (76.6%) | 0 (0.0%) |
| $50,000 to $99,999 | 14 (8.2%) | 0 (0.0%) |
| $100,000 to $299,999 | 26 (15.2%) | 46 (51.1%) |
| $300,000 to $499,999 | 0 (0.0%) | 44 (48.9%) |
| $500,000 to $749,999 | 0 (0.0%) | 0 (0.0%) |
| $750,000 to $999,999 | 0 (0.0%) | 0 (0.0%) |
| $1,000,000 or more | 0 (0.0%) | 0 (0.0%) |
| Total | 171 (100.0%) | 90 (100.0%) |
Household Income by Mortgage Status in Royal City
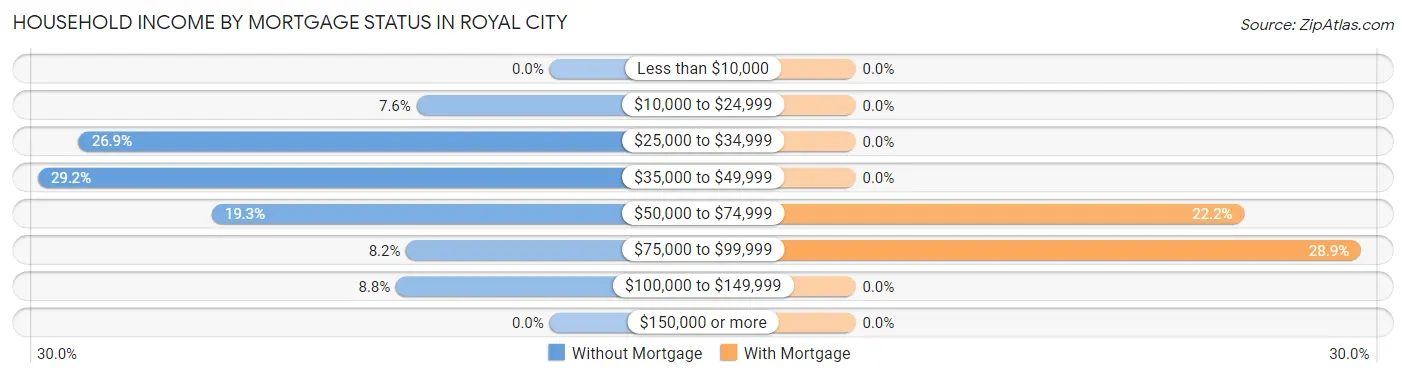
| Household Income | Without Mortgage | With Mortgage |
| Less than $10,000 | 0 (0.0%) | 0 (0.0%) |
| $10,000 to $24,999 | 13 (7.6%) | 0 (0.0%) |
| $25,000 to $34,999 | 46 (26.9%) | 0 (0.0%) |
| $35,000 to $49,999 | 50 (29.2%) | 0 (0.0%) |
| $50,000 to $74,999 | 33 (19.3%) | 20 (22.2%) |
| $75,000 to $99,999 | 14 (8.2%) | 26 (28.9%) |
| $100,000 to $149,999 | 15 (8.8%) | 0 (0.0%) |
| $150,000 or more | 0 (0.0%) | 0 (0.0%) |
| Total | 171 (100.0%) | 90 (100.0%) |
Property Value to Household Income Ratio in Royal City
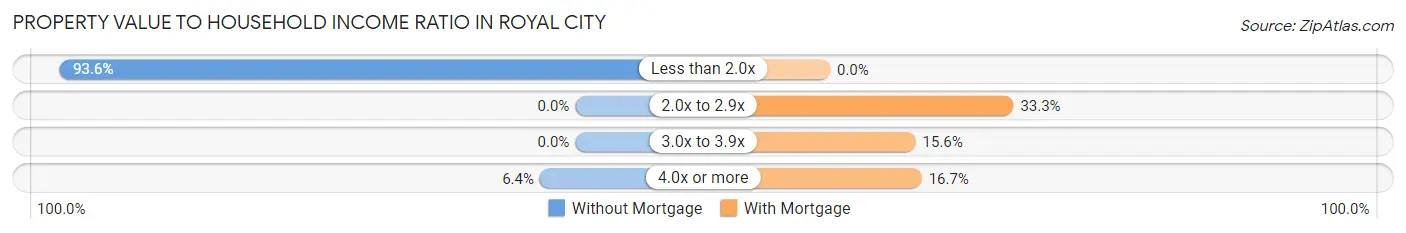
| Value-to-Income Ratio | Without Mortgage | With Mortgage |
| Less than 2.0x | 160 (93.6%) | 0 (0.0%) |
| 2.0x to 2.9x | 0 (0.0%) | 30 (33.3%) |
| 3.0x to 3.9x | 0 (0.0%) | 14 (15.6%) |
| 4.0x or more | 11 (6.4%) | 15 (16.7%) |
| Total | 171 (100.0%) | 90 (100.0%) |
Real Estate Taxes by Mortgage Status in Royal City
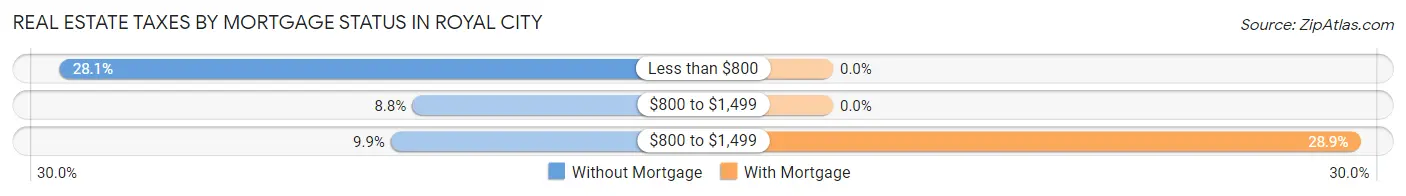
| Property Taxes | Without Mortgage | With Mortgage |
| Less than $800 | 48 (28.1%) | 0 (0.0%) |
| $800 to $1,499 | 15 (8.8%) | 0 (0.0%) |
| $800 to $1,499 | 17 (9.9%) | 26 (28.9%) |
| Total | 171 (100.0%) | 90 (100.0%) |
Health & Disability in Royal City
Health Insurance Coverage by Age in Royal City
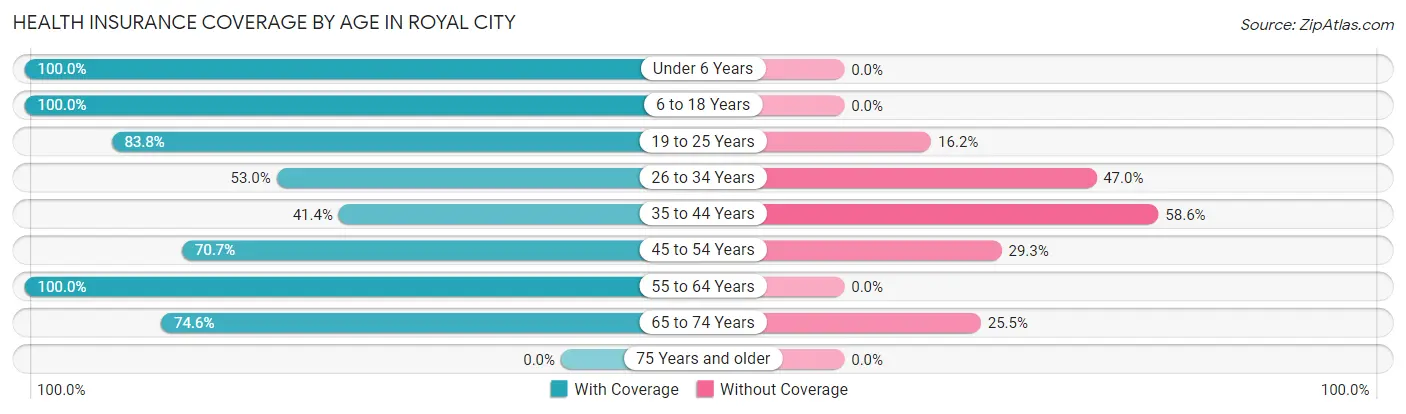
| Age Bracket | With Coverage | Without Coverage |
| Under 6 Years | 185 (100.0%) | 0 (0.0%) |
| 6 to 18 Years | 609 (100.0%) | 0 (0.0%) |
| 19 to 25 Years | 238 (83.8%) | 46 (16.2%) |
| 26 to 34 Years | 114 (53.0%) | 101 (47.0%) |
| 35 to 44 Years | 140 (41.4%) | 198 (58.6%) |
| 45 to 54 Years | 200 (70.7%) | 83 (29.3%) |
| 55 to 64 Years | 91 (100.0%) | 0 (0.0%) |
| 65 to 74 Years | 41 (74.6%) | 14 (25.5%) |
| 75 Years and older | 0 (0.0%) | 0 (0.0%) |
| Total | 1,618 (78.5%) | 442 (21.5%) |
Health Insurance Coverage by Citizenship Status in Royal City
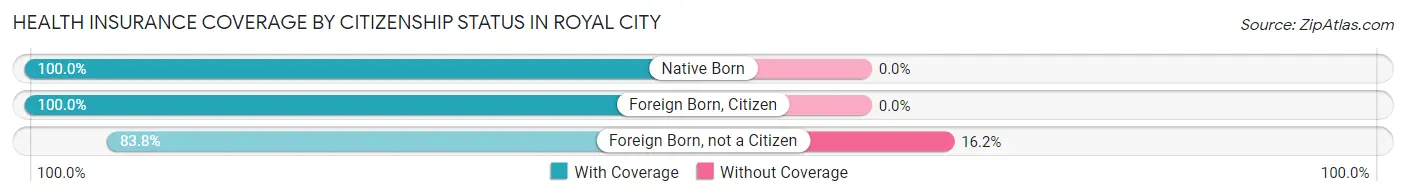
| Citizenship Status | With Coverage | Without Coverage |
| Native Born | 185 (100.0%) | 0 (0.0%) |
| Foreign Born, Citizen | 609 (100.0%) | 0 (0.0%) |
| Foreign Born, not a Citizen | 238 (83.8%) | 46 (16.2%) |
Health Insurance Coverage by Household Income in Royal City
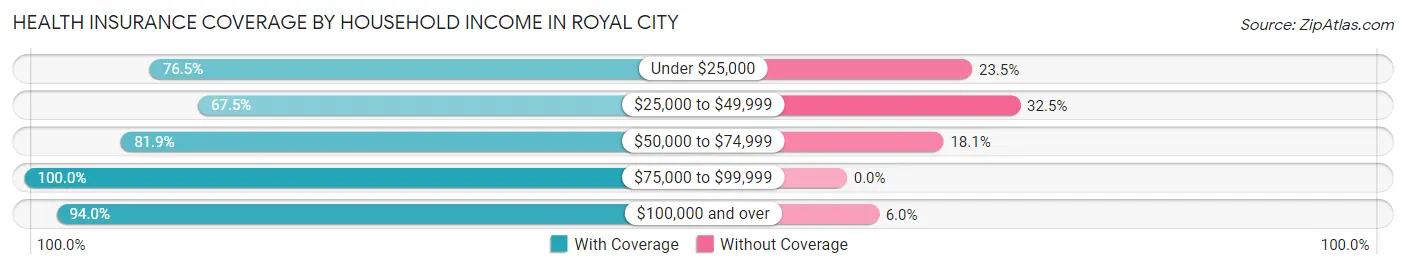
| Household Income | With Coverage | Without Coverage |
| Under $25,000 | 137 (76.5%) | 42 (23.5%) |
| $25,000 to $49,999 | 609 (67.5%) | 293 (32.5%) |
| $50,000 to $74,999 | 321 (81.9%) | 71 (18.1%) |
| $75,000 to $99,999 | 140 (100.0%) | 0 (0.0%) |
| $100,000 and over | 409 (94.0%) | 26 (6.0%) |
Public vs Private Health Insurance Coverage by Age in Royal City
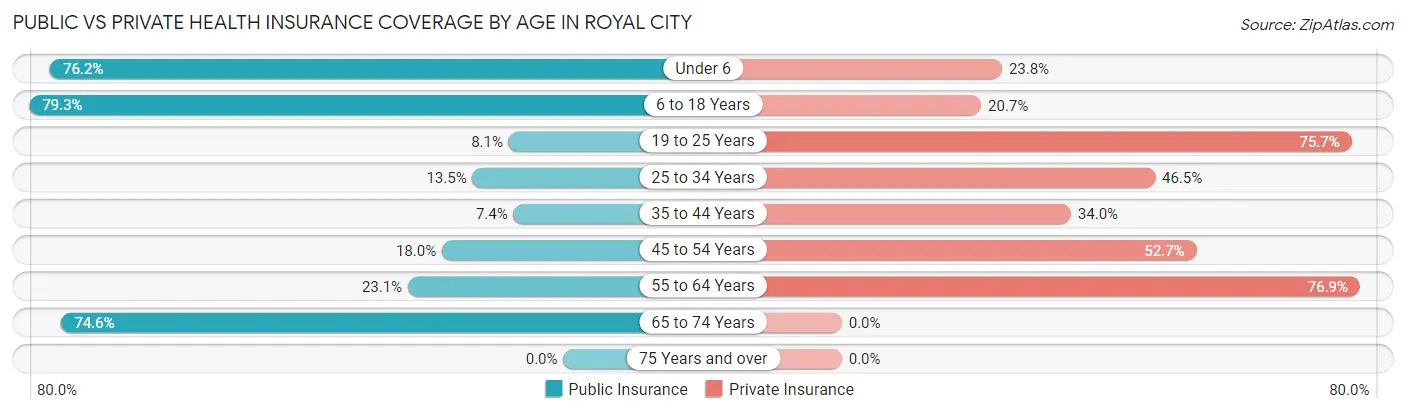
| Age Bracket | Public Insurance | Private Insurance |
| Under 6 | 141 (76.2%) | 44 (23.8%) |
| 6 to 18 Years | 483 (79.3%) | 126 (20.7%) |
| 19 to 25 Years | 23 (8.1%) | 215 (75.7%) |
| 25 to 34 Years | 29 (13.5%) | 100 (46.5%) |
| 35 to 44 Years | 25 (7.4%) | 115 (34.0%) |
| 45 to 54 Years | 51 (18.0%) | 149 (52.6%) |
| 55 to 64 Years | 21 (23.1%) | 70 (76.9%) |
| 65 to 74 Years | 41 (74.6%) | 0 (0.0%) |
| 75 Years and over | 0 (0.0%) | 0 (0.0%) |
| Total | 814 (39.5%) | 819 (39.8%) |
Disability Status by Sex by Age in Royal City
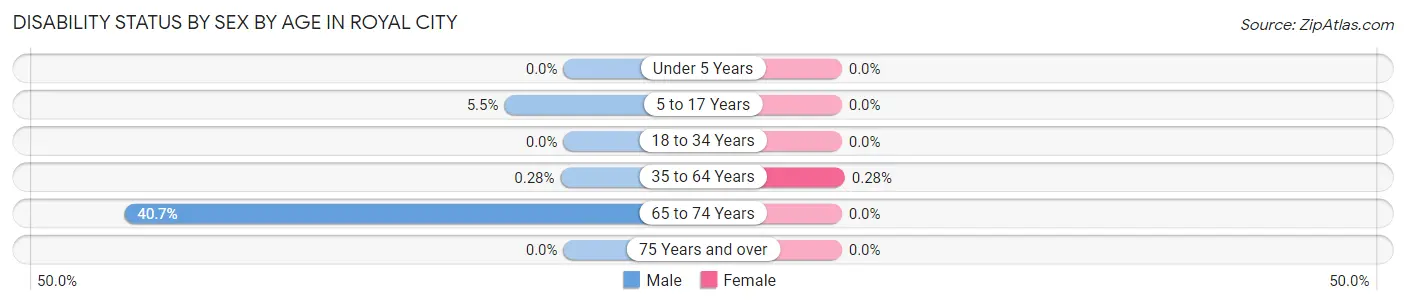
| Age Bracket | Male | Female |
| Under 5 Years | 0 (0.0%) | 0 (0.0%) |
| 5 to 17 Years | 16 (5.5%) | 0 (0.0%) |
| 18 to 34 Years | 0 (0.0%) | 0 (0.0%) |
| 35 to 64 Years | 1 (0.3%) | 1 (0.3%) |
| 65 to 74 Years | 11 (40.7%) | 0 (0.0%) |
| 75 Years and over | 0 (0.0%) | 0 (0.0%) |
Disability Class by Sex by Age in Royal City
Disability Class: Hearing Difficulty
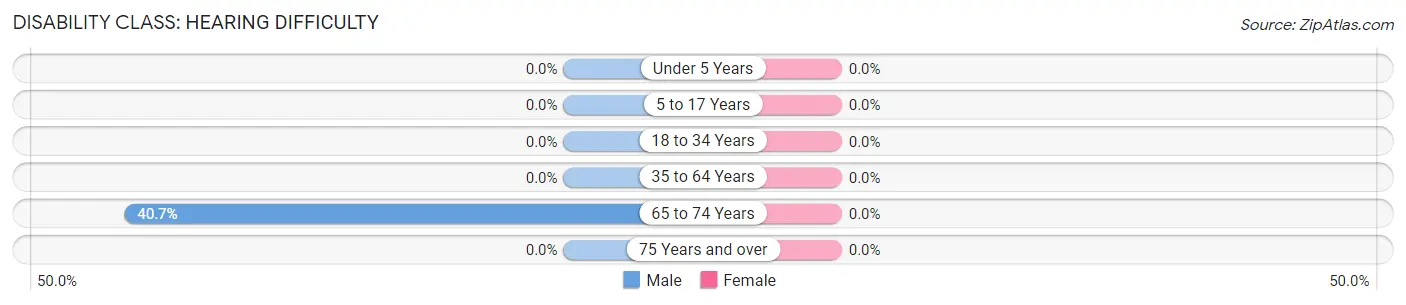
| Age Bracket | Male | Female |
| Under 5 Years | 0 (0.0%) | 0 (0.0%) |
| 5 to 17 Years | 0 (0.0%) | 0 (0.0%) |
| 18 to 34 Years | 0 (0.0%) | 0 (0.0%) |
| 35 to 64 Years | 0 (0.0%) | 0 (0.0%) |
| 65 to 74 Years | 11 (40.7%) | 0 (0.0%) |
| 75 Years and over | 0 (0.0%) | 0 (0.0%) |
Disability Class: Vision Difficulty
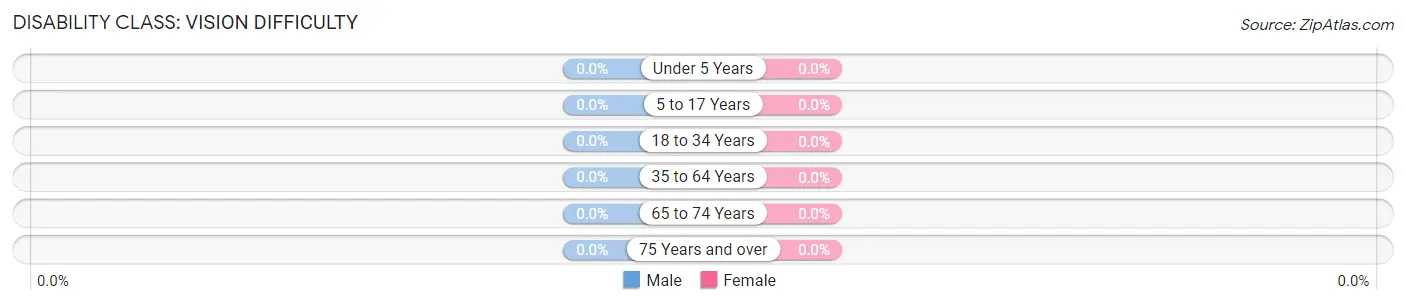
| Age Bracket | Male | Female |
| Under 5 Years | 0 (0.0%) | 0 (0.0%) |
| 5 to 17 Years | 0 (0.0%) | 0 (0.0%) |
| 18 to 34 Years | 0 (0.0%) | 0 (0.0%) |
| 35 to 64 Years | 0 (0.0%) | 0 (0.0%) |
| 65 to 74 Years | 0 (0.0%) | 0 (0.0%) |
| 75 Years and over | 0 (0.0%) | 0 (0.0%) |
Disability Class: Cognitive Difficulty
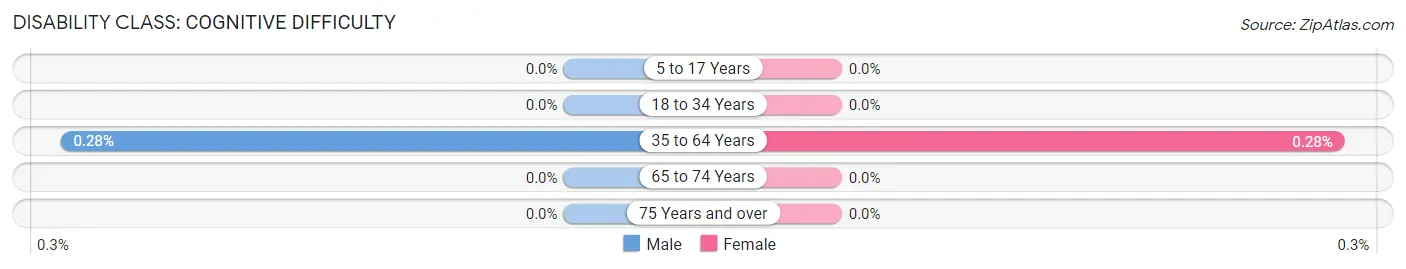
| Age Bracket | Male | Female |
| 5 to 17 Years | 0 (0.0%) | 0 (0.0%) |
| 18 to 34 Years | 0 (0.0%) | 0 (0.0%) |
| 35 to 64 Years | 1 (0.3%) | 1 (0.3%) |
| 65 to 74 Years | 0 (0.0%) | 0 (0.0%) |
| 75 Years and over | 0 (0.0%) | 0 (0.0%) |
Disability Class: Ambulatory Difficulty
| Age Bracket | Male | Female |
| 5 to 17 Years | 0 (0.0%) | 0 (0.0%) |
| 18 to 34 Years | 0 (0.0%) | 0 (0.0%) |
| 35 to 64 Years | 0 (0.0%) | 0 (0.0%) |
| 65 to 74 Years | 0 (0.0%) | 0 (0.0%) |
| 75 Years and over | 0 (0.0%) | 0 (0.0%) |
Disability Class: Self-Care Difficulty
| Age Bracket | Male | Female |
| 5 to 17 Years | 16 (5.5%) | 0 (0.0%) |
| 18 to 34 Years | 0 (0.0%) | 0 (0.0%) |
| 35 to 64 Years | 0 (0.0%) | 0 (0.0%) |
| 65 to 74 Years | 0 (0.0%) | 0 (0.0%) |
| 75 Years and over | 0 (0.0%) | 0 (0.0%) |
Technology Access in Royal City
Computing Device Access in Royal City
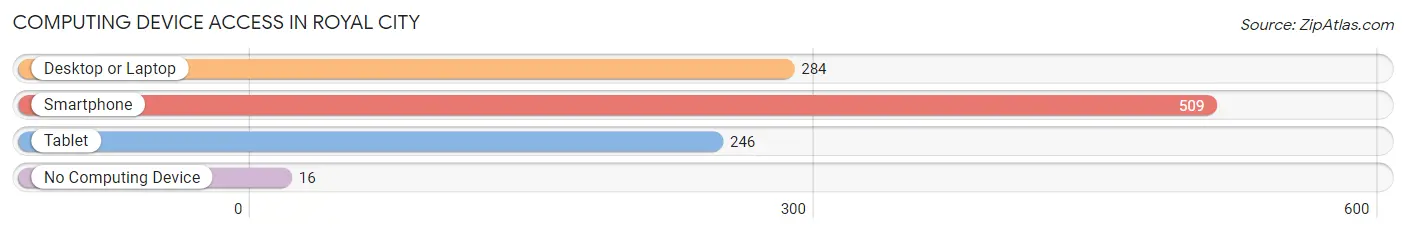
| Device Type | # Households | % Households |
| Desktop or Laptop | 284 | 52.1% |
| Smartphone | 509 | 93.4% |
| Tablet | 246 | 45.1% |
| No Computing Device | 16 | 2.9% |
| Total | 545 | 100.0% |
Internet Access in Royal City
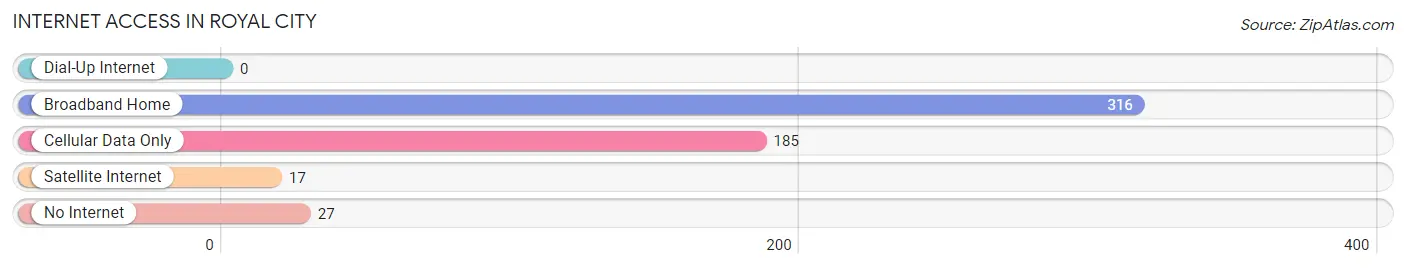
| Internet Type | # Households | % Households |
| Dial-Up Internet | 0 | 0.0% |
| Broadband Home | 316 | 58.0% |
| Cellular Data Only | 185 | 33.9% |
| Satellite Internet | 17 | 3.1% |
| No Internet | 27 | 5.0% |
| Total | 545 | 100.0% |
Royal City Summary
Royal City is a small city located in Grant County, Washington, United States. It is situated along the Columbia River, approximately 25 miles south of the Tri-Cities. The city was incorporated in 1909 and has a population of approximately 2,500 people.
History
The area that is now Royal City was first settled in the late 1800s by homesteaders. The town was originally known as "Royal Flats" and was named after the Royal Flats post office, which was established in 1891. The town was officially incorporated in 1909 and was named Royal City.
In the early 1900s, Royal City was a thriving agricultural community. The town was home to several grain elevators, a flour mill, and a creamery. The town also had a hotel, a bank, a movie theater, and several stores.
In the 1950s, Royal City began to experience a decline in population as many of its residents moved away to larger cities. The town was also affected by the construction of the Wanapum Dam, which flooded much of the surrounding area.
Geography
Royal City is located in Grant County, Washington, approximately 25 miles south of the Tri-Cities. The city is situated along the Columbia River, which forms the western boundary of the city. The city is located in a semi-arid region and has an average annual precipitation of 8.5 inches.
The city is located in the Columbia Basin, which is a large area of flat land that is surrounded by mountains. The area is known for its dry climate and is home to a variety of wildlife, including deer, elk, and antelope.
Economy
The economy of Royal City is largely based on agriculture. The city is home to several grain elevators, a flour mill, and a creamery. The city is also home to several businesses, including a grocery store, a hardware store, and a restaurant.
The city is also home to several manufacturing companies, including a furniture manufacturer and a plastics manufacturer. The city is also home to several service-based businesses, including a car dealership and a medical clinic.
Demographics
As of the 2010 census, the population of Royal City was 2,500. The racial makeup of the city was 94.2% White, 0.8% African American, 0.4% Native American, 0.4% Asian, 0.2% Pacific Islander, and 3.8% from other races. The median household income was $37,500 and the median family income was $45,000.
The city is home to several churches, including the Royal City United Methodist Church, the Royal City Baptist Church, and the Royal City Church of the Nazarene. The city is also home to several schools, including Royal City Elementary School, Royal City Middle School, and Royal City High School.
Conclusion
Royal City is a small city located in Grant County, Washington, United States. It is situated along the Columbia River, approximately 25 miles south of the Tri-Cities. The city was incorporated in 1909 and has a population of approximately 2,500 people. The economy of Royal City is largely based on agriculture and the city is home to several businesses, manufacturing companies, and service-based businesses. The racial makeup of the city is 94.2% White, 0.8% African American, 0.4% Native American, 0.4% Asian, 0.2% Pacific Islander, and 3.8% from other races. The median household income was $37,500 and the median family income was $45,000. Royal City is home to several churches and schools and is a thriving community.
Common Questions
What is Per Capita Income in Royal City?
Per Capita income in Royal City is $18,356.
What is the Median Family Income in Royal City?
Median Family Income in Royal City is $45,076.
What is the Median Household income in Royal City?
Median Household Income in Royal City is $45,795.
What is Income or Wage Gap in Royal City?
Income or Wage Gap in Royal City is 41.5%.
Women in Royal City earn 58.5 cents for every dollar earned by a man.
What is Family Income Deficit in Royal City?
Family Income Deficit in Royal City is $8,418.
Families that are below poverty line in Royal City earn $8,418 less on average than the poverty threshold level.
What is Inequality or Gini Index in Royal City?
Inequality or Gini Index in Royal City is 0.42.
What is the Total Population of Royal City?
Total Population of Royal City is 2,060.
What is the Total Male Population of Royal City?
Total Male Population of Royal City is 1,025.
What is the Total Female Population of Royal City?
Total Female Population of Royal City is 1,035.
What is the Ratio of Males per 100 Females in Royal City?
There are 99.03 Males per 100 Females in Royal City.
What is the Ratio of Females per 100 Males in Royal City?
There are 100.98 Females per 100 Males in Royal City.
What is the Median Population Age in Royal City?
Median Population Age in Royal City is 24.6 Years.
What is the Average Family Size in Royal City
Average Family Size in Royal City is 3.9 People.
What is the Average Household Size in Royal City
Average Household Size in Royal City is 3.8 People.
How Large is the Labor Force in Royal City?
There are 1,013 People in the Labor Forcein in Royal City.
What is the Percentage of People in the Labor Force in Royal City?
70.6% of People are in the Labor Force in Royal City.
What is the Unemployment Rate in Royal City?
Unemployment Rate in Royal City is 9.2%.