Madison, CA Map & Demographics
Madison Map
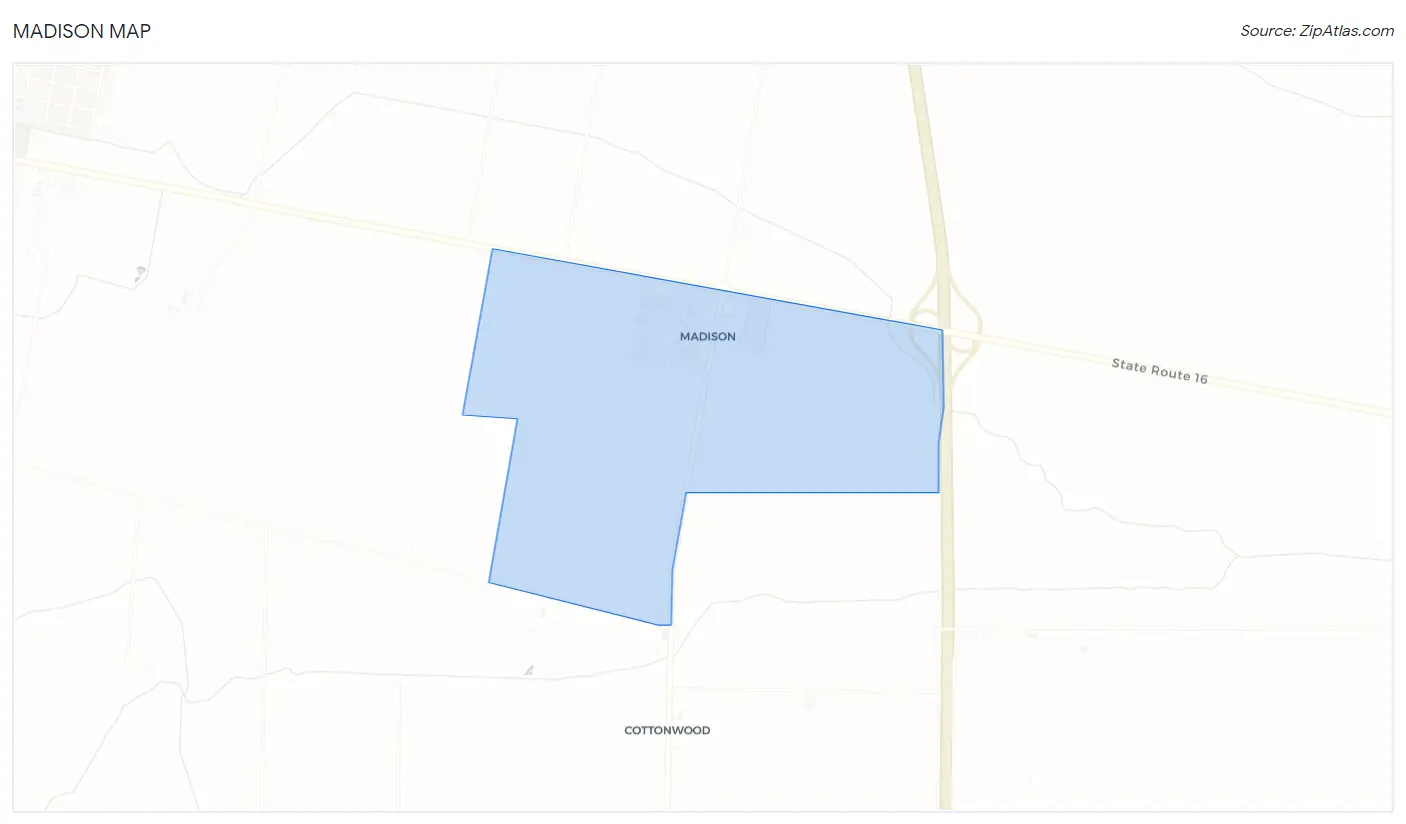
Madison Overview
$27,542
PER CAPITA INCOME
0.52
INEQUALITY / GINI INDEX
455
TOTAL POPULATION
177
MALE POPULATION
278
FEMALE POPULATION
63.67
MALES / 100 FEMALES
157.06
FEMALES / 100 MALES
57.6
MEDIAN AGE
3.2
AVG FAMILY SIZE
2.6
AVG HOUSEHOLD SIZE
208
LABOR FORCE [ PEOPLE ]
45.7%
PERCENT IN LABOR FORCE
Madison Zip Codes
Income in Madison
Income Overview in Madison
| Characteristic | Number | Measure |
| Per Capita Income | 455 | $27,542 |
| Median Family Income | 124 | $0 |
| Mean Family Income | 124 | $87,755 |
| Median Household Income | 175 | $0 |
| Mean Household Income | 175 | $67,578 |
| Income Deficit | 124 | $0 |
| Wage / Income Gap (%) | 455 | 0.00% |
| Wage / Income Gap ($) | 455 | 100.00¢ per $1 |
| Gini / Inequality Index | 455 | 0.52 |
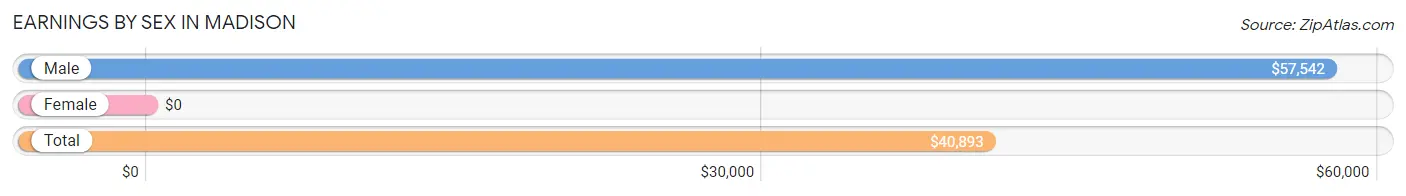
Earnings by Sex in Madison
| Sex | Number | Average Earnings |
| Male | 59 (28.4%) | $57,542 |
| Female | 149 (71.6%) | $0 |
| Total | 208 (100.0%) | $40,893 |
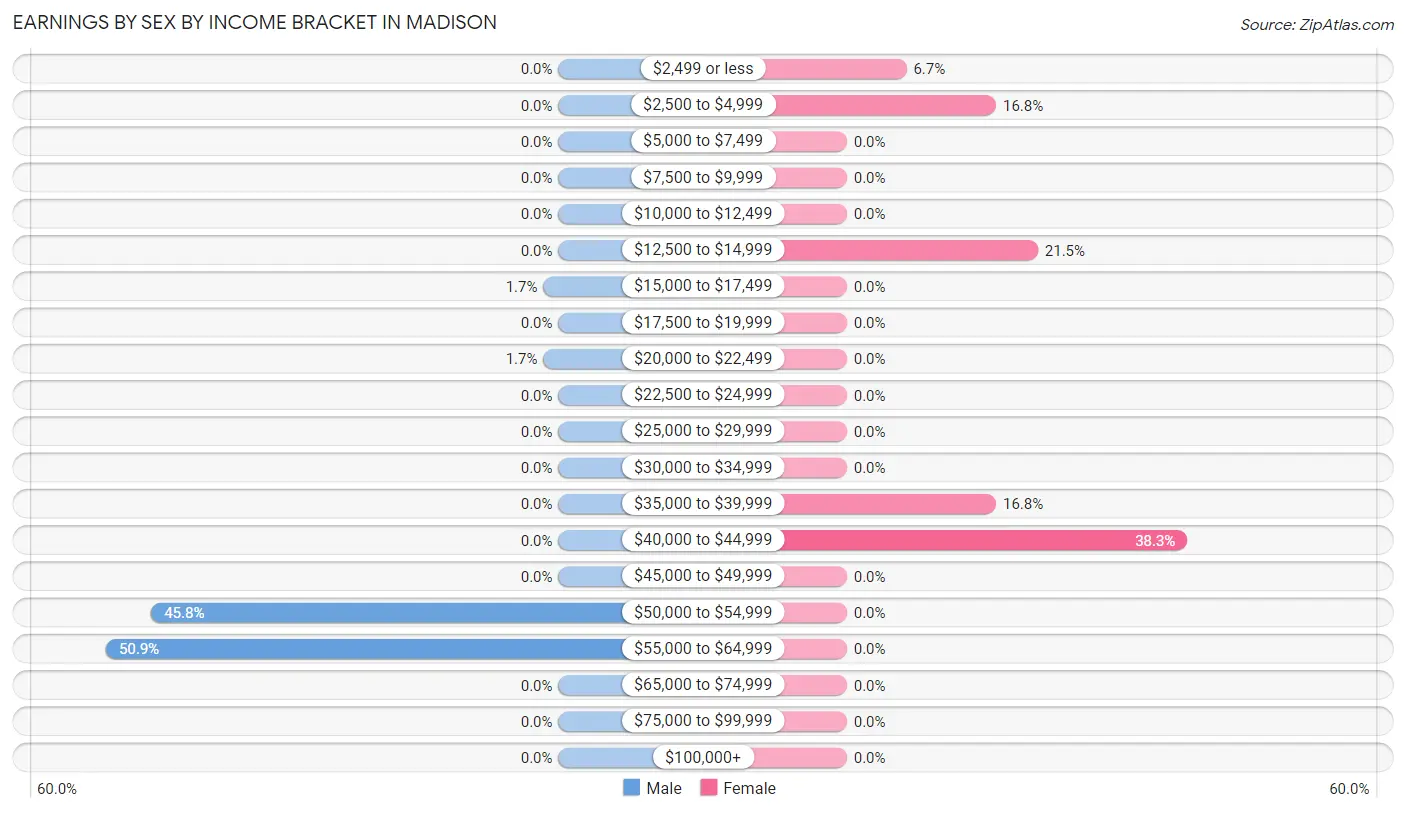
Earnings by Sex by Income Bracket in Madison
The most common earnings brackets in Madison are $55,000 to $64,999 for men (30 | 50.8%) and $40,000 to $44,999 for women (57 | 38.3%).
| Income | Male | Female |
| $2,499 or less | 0 (0.0%) | 10 (6.7%) |
| $2,500 to $4,999 | 0 (0.0%) | 25 (16.8%) |
| $5,000 to $7,499 | 0 (0.0%) | 0 (0.0%) |
| $7,500 to $9,999 | 0 (0.0%) | 0 (0.0%) |
| $10,000 to $12,499 | 0 (0.0%) | 0 (0.0%) |
| $12,500 to $14,999 | 0 (0.0%) | 32 (21.5%) |
| $15,000 to $17,499 | 1 (1.7%) | 0 (0.0%) |
| $17,500 to $19,999 | 0 (0.0%) | 0 (0.0%) |
| $20,000 to $22,499 | 1 (1.7%) | 0 (0.0%) |
| $22,500 to $24,999 | 0 (0.0%) | 0 (0.0%) |
| $25,000 to $29,999 | 0 (0.0%) | 0 (0.0%) |
| $30,000 to $34,999 | 0 (0.0%) | 0 (0.0%) |
| $35,000 to $39,999 | 0 (0.0%) | 25 (16.8%) |
| $40,000 to $44,999 | 0 (0.0%) | 57 (38.3%) |
| $45,000 to $49,999 | 0 (0.0%) | 0 (0.0%) |
| $50,000 to $54,999 | 27 (45.8%) | 0 (0.0%) |
| $55,000 to $64,999 | 30 (50.8%) | 0 (0.0%) |
| $65,000 to $74,999 | 0 (0.0%) | 0 (0.0%) |
| $75,000 to $99,999 | 0 (0.0%) | 0 (0.0%) |
| $100,000+ | 0 (0.0%) | 0 (0.0%) |
| Total | 59 (100.0%) | 149 (100.0%) |
Earnings by Sex by Educational Attainment in Madison
| Educational Attainment | Male Income | Female Income |
| Less than High School | - | - |
| High School Diploma | - | - |
| College or Associate's Degree | - | - |
| Bachelor's Degree | - | - |
| Graduate Degree | - | - |
| Total | $56,250 | $39,500 |
Family Income in Madison
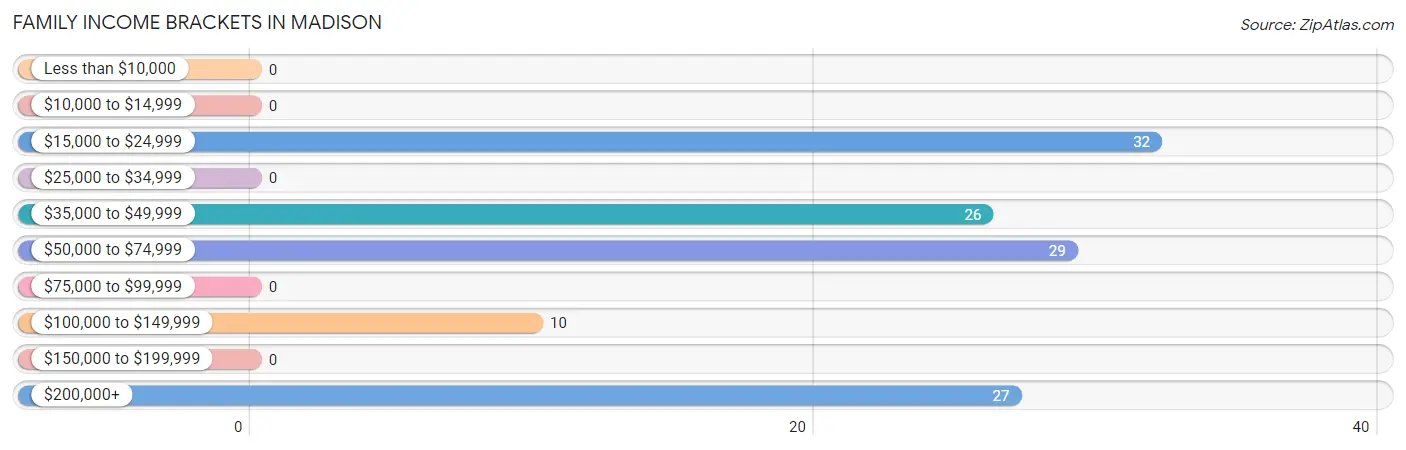
Family Income Brackets in Madison
According to the Madison family income data, there are 32 families falling into the $15,000 to $24,999 income range, which is the most common income bracket and makes up 25.8% of all families.
| Income Bracket | # Families | % Families |
| Less than $10,000 | 0 | 0.0% |
| $10,000 to $14,999 | 0 | 0.0% |
| $15,000 to $24,999 | 32 | 25.8% |
| $25,000 to $34,999 | 0 | 0.0% |
| $35,000 to $49,999 | 26 | 21.0% |
| $50,000 to $74,999 | 29 | 23.4% |
| $75,000 to $99,999 | 0 | 0.0% |
| $100,000 to $149,999 | 10 | 8.1% |
| $150,000 to $199,999 | 0 | 0.0% |
| $200,000+ | 27 | 21.8% |
Family Income by Famaliy Size in Madison
| Income Bracket | # Families | Median Income |
| 2-Person Families | 61 (49.2%) | $0 |
| 3-Person Families | 36 (29.0%) | $0 |
| 4-Person Families | 0 (0.0%) | $0 |
| 5-Person Families | 27 (21.8%) | $0 |
| 6-Person Families | 0 (0.0%) | $0 |
| 7+ Person Families | 0 (0.0%) | $0 |
| Total | 124 (100.0%) | $0 |
Family Income by Number of Earners in Madison
| Number of Earners | # Families | Median Income |
| No Earners | 55 (44.4%) | $0 |
| 1 Earner | 10 (8.1%) | $0 |
| 2 Earners | 32 (25.8%) | $0 |
| 3+ Earners | 27 (21.8%) | $0 |
| Total | 124 (100.0%) | $0 |
Household Income in Madison
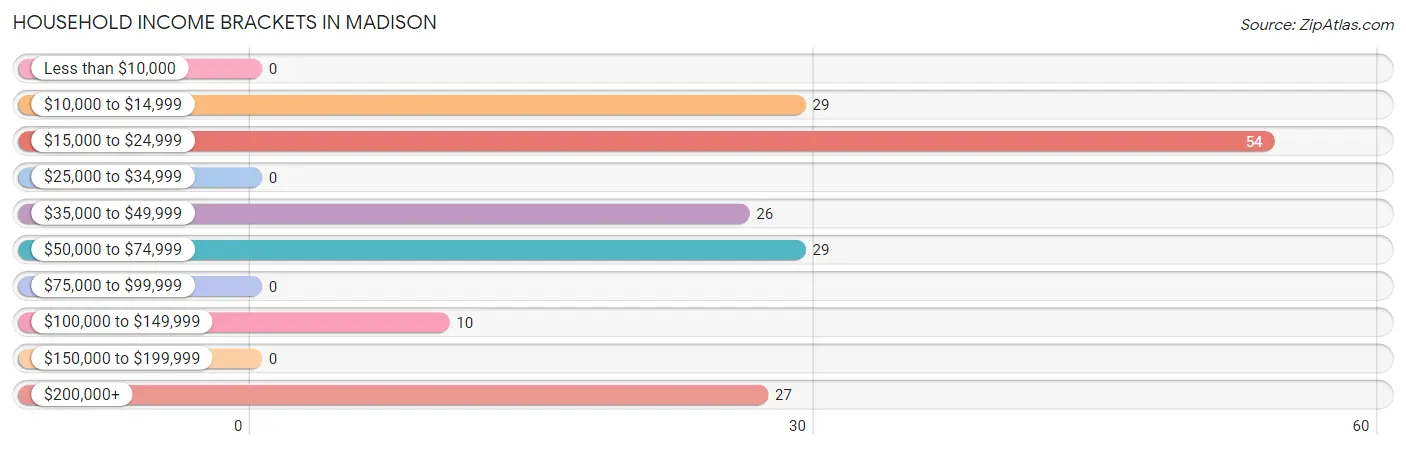
Household Income Brackets in Madison
With 54 households falling in the category, the $15,000 to $24,999 income range is the most frequent in Madison, accounting for 30.9% of all households.
| Income Bracket | # Households | % Households |
| Less than $10,000 | 0 | 0.0% |
| $10,000 to $14,999 | 29 | 16.6% |
| $15,000 to $24,999 | 54 | 30.9% |
| $25,000 to $34,999 | 0 | 0.0% |
| $35,000 to $49,999 | 26 | 14.9% |
| $50,000 to $74,999 | 29 | 16.6% |
| $75,000 to $99,999 | 0 | 0.0% |
| $100,000 to $149,999 | 10 | 5.7% |
| $150,000 to $199,999 | 0 | 0.0% |
| $200,000+ | 27 | 15.4% |
Household Income by Householder Age in Madison
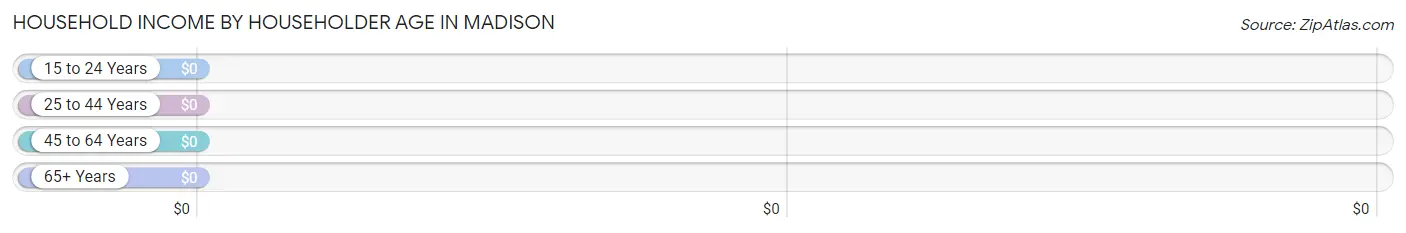
| Income Bracket | # Households | Median Income |
| 15 to 24 Years | 0 (0.0%) | $0 |
| 25 to 44 Years | 32 (18.3%) | $0 |
| 45 to 64 Years | 56 (32.0%) | $0 |
| 65+ Years | 87 (49.7%) | $0 |
| Total | 175 (100.0%) | $0 |
Poverty in Madison
Income Below Poverty by Sex and Age in Madison
With 0.6% poverty level for males and 31.3% for females among the residents of Madison, 45 to 54 year old males and 18 to 24 year old females are the most vulnerable to poverty, with 1 males (3.3%) and 25 females (100.0%) in their respective age groups living below the poverty level.
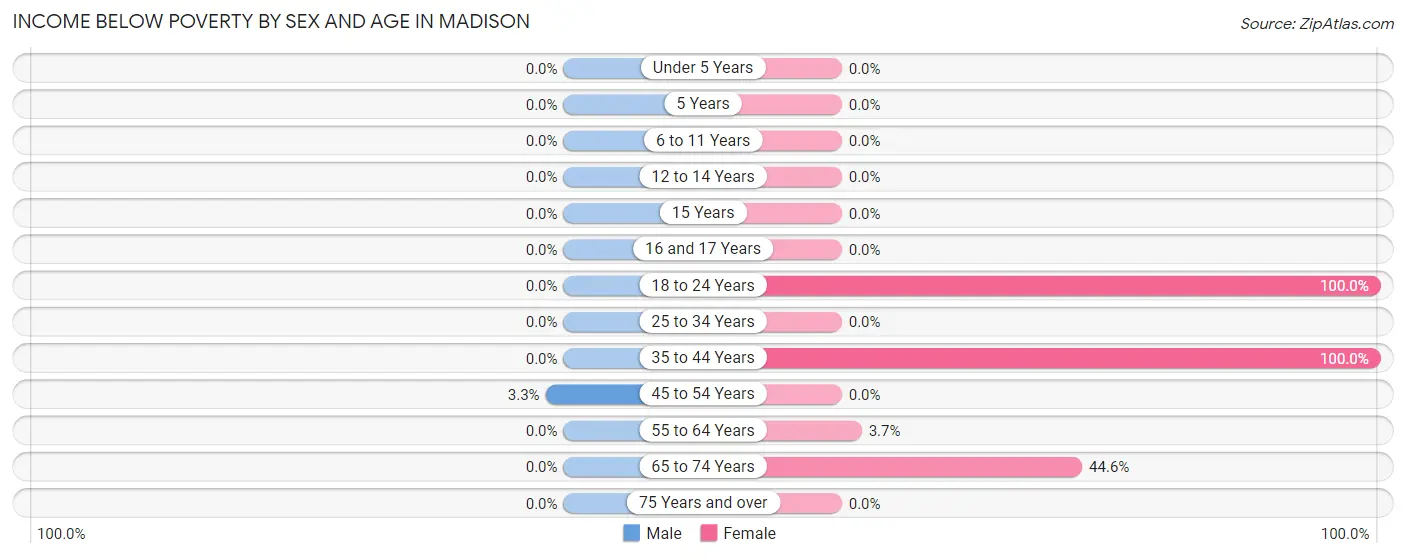
| Age Bracket | Male | Female |
| Under 5 Years | 0 (0.0%) | 0 (0.0%) |
| 5 Years | 0 (0.0%) | 0 (0.0%) |
| 6 to 11 Years | 0 (0.0%) | 0 (0.0%) |
| 12 to 14 Years | 0 (0.0%) | 0 (0.0%) |
| 15 Years | 0 (0.0%) | 0 (0.0%) |
| 16 and 17 Years | 0 (0.0%) | 0 (0.0%) |
| 18 to 24 Years | 0 (0.0%) | 25 (100.0%) |
| 25 to 34 Years | 0 (0.0%) | 0 (0.0%) |
| 35 to 44 Years | 0 (0.0%) | 32 (100.0%) |
| 45 to 54 Years | 1 (3.3%) | 0 (0.0%) |
| 55 to 64 Years | 0 (0.0%) | 1 (3.7%) |
| 65 to 74 Years | 0 (0.0%) | 29 (44.6%) |
| 75 Years and over | 0 (0.0%) | 0 (0.0%) |
| Total | 1 (0.6%) | 87 (31.3%) |
Income Above Poverty by Sex and Age in Madison
According to the poverty statistics in Madison, males aged 16 and 17 years and females aged 25 to 34 years are the age groups that are most secure financially, with 100.0% of males and 100.0% of females in these age groups living above the poverty line.
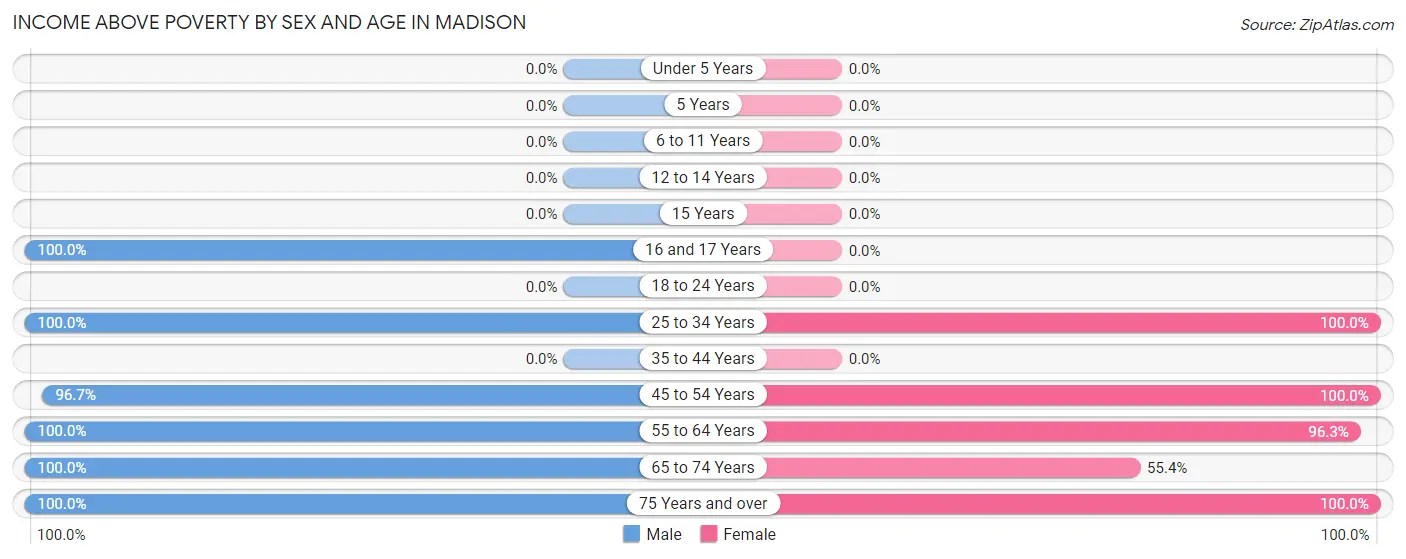
| Age Bracket | Male | Female |
| Under 5 Years | 0 (0.0%) | 0 (0.0%) |
| 5 Years | 0 (0.0%) | 0 (0.0%) |
| 6 to 11 Years | 0 (0.0%) | 0 (0.0%) |
| 12 to 14 Years | 0 (0.0%) | 0 (0.0%) |
| 15 Years | 0 (0.0%) | 0 (0.0%) |
| 16 and 17 Years | 1 (100.0%) | 0 (0.0%) |
| 18 to 24 Years | 0 (0.0%) | 0 (0.0%) |
| 25 to 34 Years | 31 (100.0%) | 54 (100.0%) |
| 35 to 44 Years | 0 (0.0%) | 0 (0.0%) |
| 45 to 54 Years | 29 (96.7%) | 37 (100.0%) |
| 55 to 64 Years | 27 (100.0%) | 26 (96.3%) |
| 65 to 74 Years | 80 (100.0%) | 36 (55.4%) |
| 75 Years and over | 8 (100.0%) | 38 (100.0%) |
| Total | 176 (99.4%) | 191 (68.7%) |
Income Below Poverty Among Married-Couple Families in Madison
| Children | Above Poverty | Below Poverty |
| No Children | 92 (100.0%) | 0 (0.0%) |
| 1 or 2 Children | 0 (0.0%) | 0 (0.0%) |
| 3 or 4 Children | 0 (0.0%) | 0 (0.0%) |
| 5 or more Children | 0 (0.0%) | 0 (0.0%) |
| Total | 92 (100.0%) | 0 (0.0%) |
Income Below Poverty Among Single-Parent Households in Madison
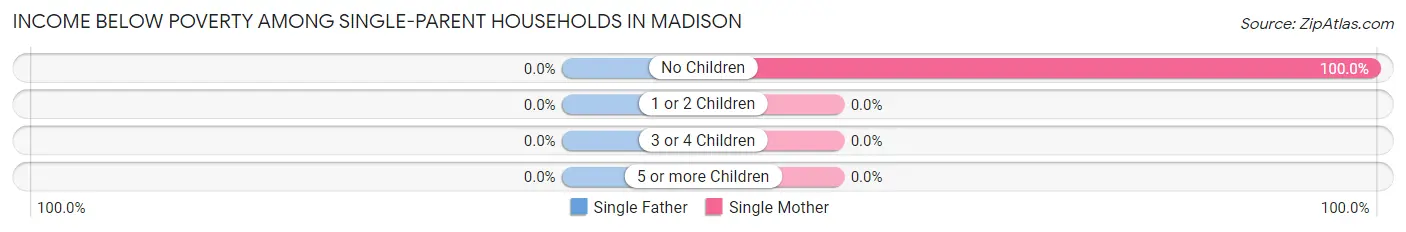
| Children | Single Father | Single Mother |
| No Children | 0 (0.0%) | 32 (100.0%) |
| 1 or 2 Children | 0 (0.0%) | 0 (0.0%) |
| 3 or 4 Children | 0 (0.0%) | 0 (0.0%) |
| 5 or more Children | 0 (0.0%) | 0 (0.0%) |
| Total | 0 (0.0%) | 32 (100.0%) |
Income Below Poverty Among Married-Couple vs Single-Parent Households in Madison
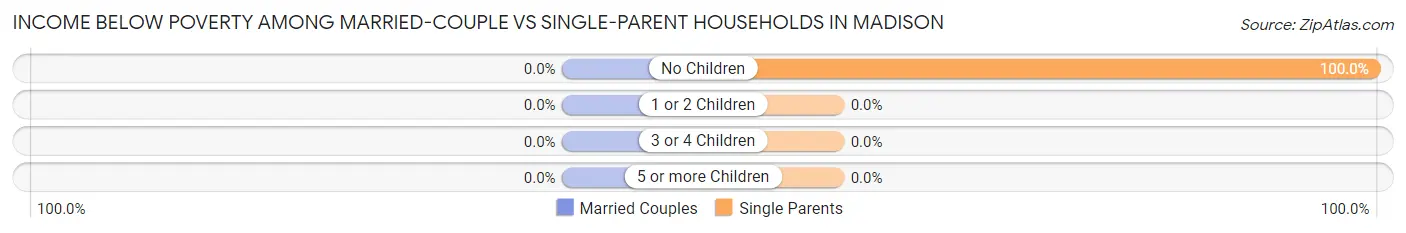
| Children | Married-Couple Families | Single-Parent Households |
| No Children | 0 (0.0%) | 32 (100.0%) |
| 1 or 2 Children | 0 (0.0%) | 0 (0.0%) |
| 3 or 4 Children | 0 (0.0%) | 0 (0.0%) |
| 5 or more Children | 0 (0.0%) | 0 (0.0%) |
| Total | 0 (0.0%) | 32 (100.0%) |
Race in Madison
The most populous races in Madison are Hispanic or Latino (374 | 82.2%), White / Caucasian (220 | 48.3%), and Some other Race (122 | 26.8%).
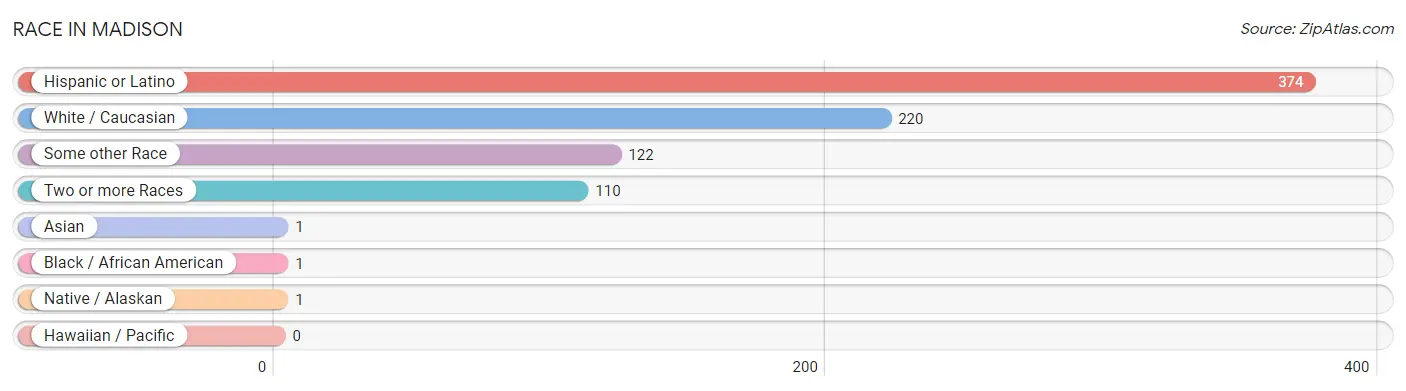
| Race | # Population | % Population |
| Asian | 1 | 0.2% |
| Black / African American | 1 | 0.2% |
| Hawaiian / Pacific | 0 | 0.0% |
| Hispanic or Latino | 374 | 82.2% |
| Native / Alaskan | 1 | 0.2% |
| White / Caucasian | 220 | 48.3% |
| Two or more Races | 110 | 24.2% |
| Some other Race | 122 | 26.8% |
| Total | 455 | 100.0% |
Ancestry in Madison
The most populous ancestries reported in Madison are Mexican (342 | 75.2%), German (63 | 13.9%), Spaniard (32 | 7.0%), American (29 | 6.4%), and French (19 | 4.2%), together accounting for 106.6% of all Madison residents.
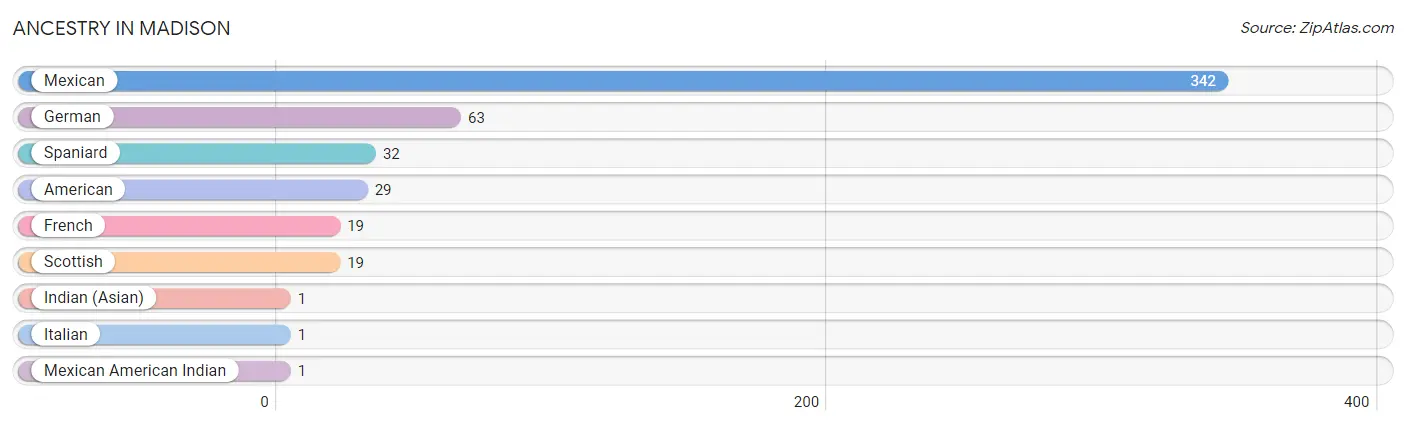
| Ancestry | # Population | % Population |
| American | 29 | 6.4% |
| French | 19 | 4.2% |
| German | 63 | 13.9% |
| Indian (Asian) | 1 | 0.2% |
| Italian | 1 | 0.2% |
| Mexican | 342 | 75.2% |
| Mexican American Indian | 1 | 0.2% |
| Scottish | 19 | 4.2% |
| Spaniard | 32 | 7.0% | View All 9 Rows |
Immigrants in Madison
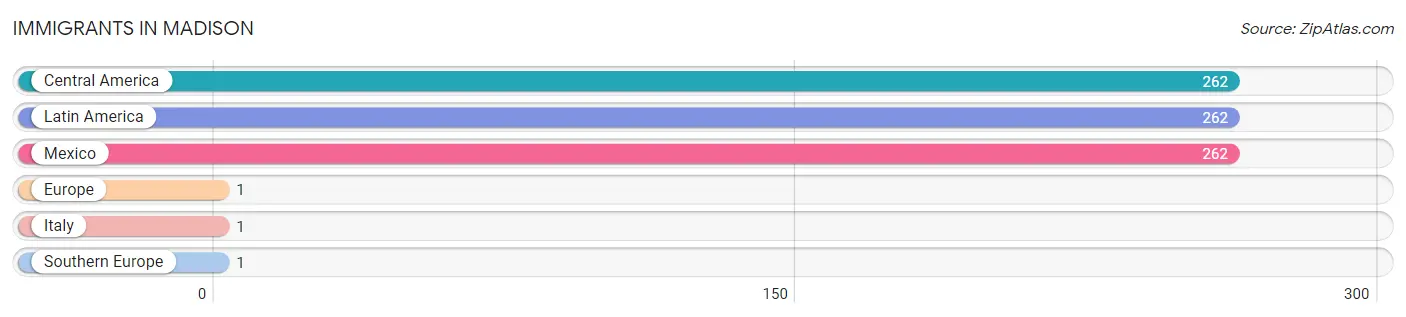
The most numerous immigrant groups reported in Madison came from Central America (262 | 57.6%), Latin America (262 | 57.6%), Mexico (262 | 57.6%), Europe (1 | 0.2%), and Italy (1 | 0.2%), together accounting for 173.2% of all Madison residents.
| Immigration Origin | # Population | % Population |
| Central America | 262 | 57.6% |
| Europe | 1 | 0.2% |
| Italy | 1 | 0.2% |
| Latin America | 262 | 57.6% |
| Mexico | 262 | 57.6% |
| Southern Europe | 1 | 0.2% | View All 6 Rows |
Sex and Age in Madison
Sex and Age in Madison
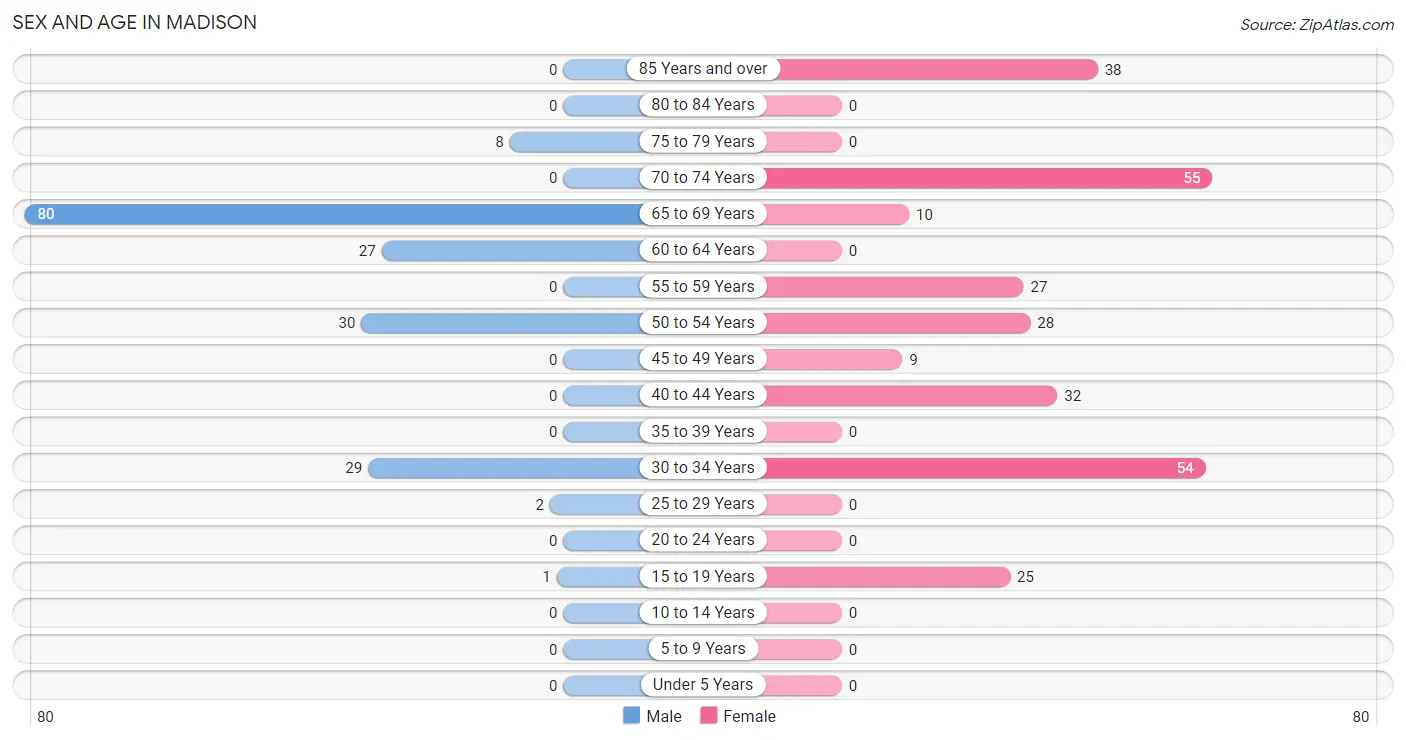
The most populous age groups in Madison are 65 to 69 Years (80 | 45.2%) for men and 70 to 74 Years (55 | 19.8%) for women.
| Age Bracket | Male | Female |
| Under 5 Years | 0 (0.0%) | 0 (0.0%) |
| 5 to 9 Years | 0 (0.0%) | 0 (0.0%) |
| 10 to 14 Years | 0 (0.0%) | 0 (0.0%) |
| 15 to 19 Years | 1 (0.6%) | 25 (9.0%) |
| 20 to 24 Years | 0 (0.0%) | 0 (0.0%) |
| 25 to 29 Years | 2 (1.1%) | 0 (0.0%) |
| 30 to 34 Years | 29 (16.4%) | 54 (19.4%) |
| 35 to 39 Years | 0 (0.0%) | 0 (0.0%) |
| 40 to 44 Years | 0 (0.0%) | 32 (11.5%) |
| 45 to 49 Years | 0 (0.0%) | 9 (3.2%) |
| 50 to 54 Years | 30 (17.0%) | 28 (10.1%) |
| 55 to 59 Years | 0 (0.0%) | 27 (9.7%) |
| 60 to 64 Years | 27 (15.2%) | 0 (0.0%) |
| 65 to 69 Years | 80 (45.2%) | 10 (3.6%) |
| 70 to 74 Years | 0 (0.0%) | 55 (19.8%) |
| 75 to 79 Years | 8 (4.5%) | 0 (0.0%) |
| 80 to 84 Years | 0 (0.0%) | 0 (0.0%) |
| 85 Years and over | 0 (0.0%) | 38 (13.7%) |
| Total | 177 (100.0%) | 278 (100.0%) |
Families and Households in Madison
Median Family Size in Madison
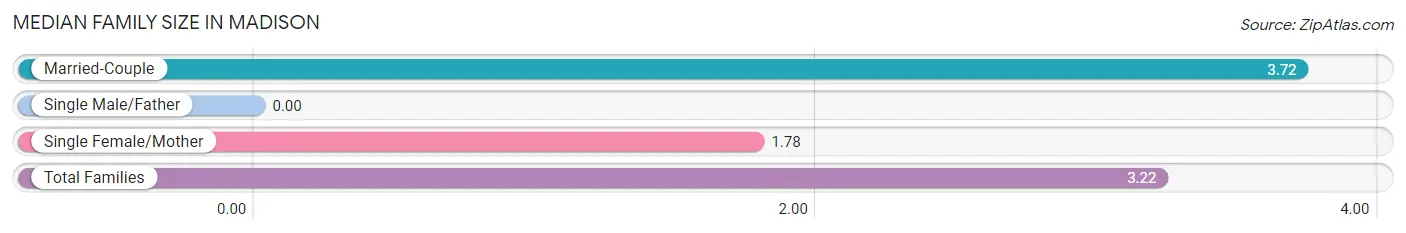
| Family Type | # Families | Family Size |
| Married-Couple | 92 (74.2%) | 3.72 |
| Single Male/Father | 0 (0.0%) | - |
| Single Female/Mother | 32 (25.8%) | 1.78 |
| Total Families | 124 (100.0%) | 3.22 |
Median Household Size in Madison
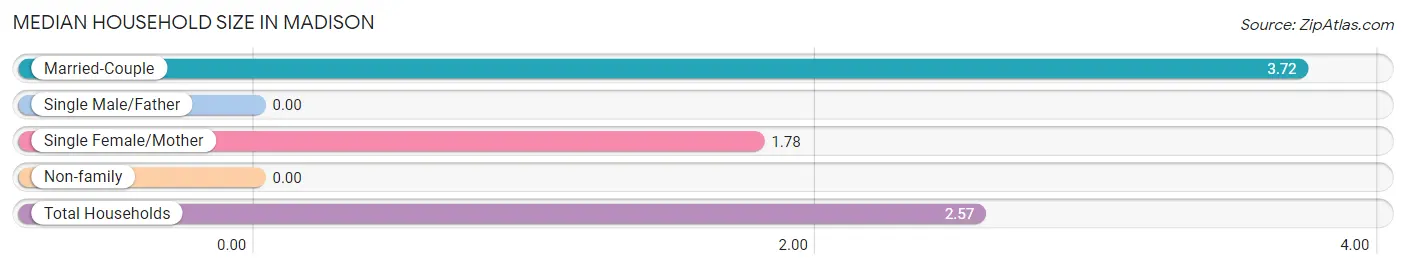
| Household Type | # Households | Household Size |
| Married-Couple | 92 (52.6%) | 3.72 |
| Single Male/Father | 0 (0.0%) | - |
| Single Female/Mother | 32 (18.3%) | 1.78 |
| Non-family | 51 (29.1%) | - |
| Total Households | 175 (100.0%) | 2.57 |
Household Size by Marriage Status in Madison
Out of a total of 175 households in Madison, 124 (70.9%) are family households, while 51 (29.1%) are nonfamily households. The most numerous type of family households are 2-person households, comprising 61, and the most common type of nonfamily households are 1-person households, comprising 51.
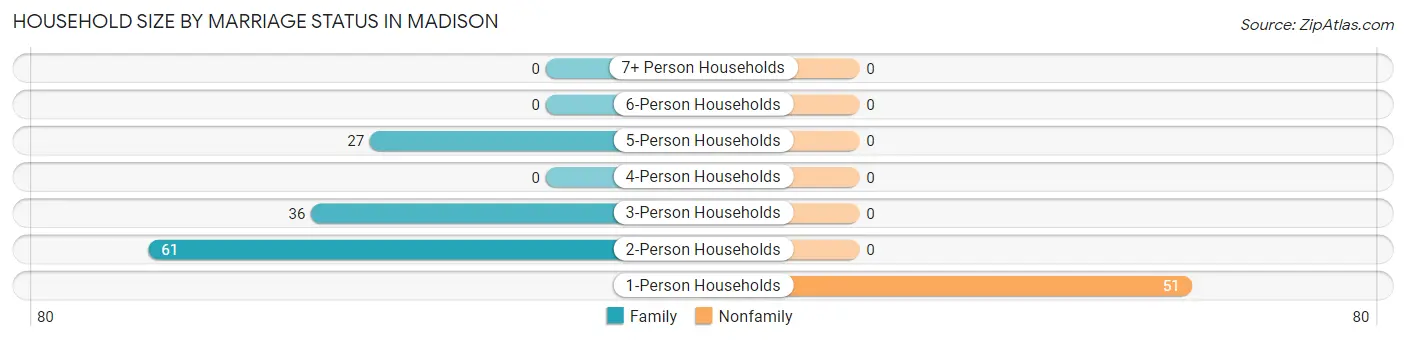
| Household Size | Family Households | Nonfamily Households |
| 1-Person Households | - | 51 (29.1%) |
| 2-Person Households | 61 (34.9%) | 0 (0.0%) |
| 3-Person Households | 36 (20.6%) | 0 (0.0%) |
| 4-Person Households | 0 (0.0%) | 0 (0.0%) |
| 5-Person Households | 27 (15.4%) | 0 (0.0%) |
| 6-Person Households | 0 (0.0%) | 0 (0.0%) |
| 7+ Person Households | 0 (0.0%) | 0 (0.0%) |
| Total | 124 (70.9%) | 51 (29.1%) |
Female Fertility in Madison
Fertility by Age in Madison
| Age Bracket | Women with Births | Births / 1,000 Women |
| 15 to 19 years | 0 (0.0%) | 0.0 |
| 20 to 34 years | 0 (0.0%) | 0.0 |
| 35 to 50 years | 0 (0.0%) | 0.0 |
| Total | 0 (0.0%) | 0.0 |
Fertility by Age by Marriage Status in Madison
| Age Bracket | Married | Unmarried |
| 15 to 19 years | 0 (0.0%) | 0 (0.0%) |
| 20 to 34 years | 0 (0.0%) | 0 (0.0%) |
| 35 to 50 years | 0 (0.0%) | 0 (0.0%) |
| Total | 0 (0.0%) | 0 (0.0%) |
Fertility by Education in Madison
| Educational Attainment | Women with Births | Births / 1,000 Women |
| Less than High School | 0 (0.0%) | 0.0 |
| High School Diploma | 0 (0.0%) | 0.0 |
| College or Associate's Degree | 0 (0.0%) | 0.0 |
| Bachelor's Degree | 0 (0.0%) | 0.0 |
| Graduate Degree | 0 (0.0%) | 0.0 |
| Total | 0 (0.0%) | 0.0 |
Fertility by Education by Marriage Status in Madison
| Educational Attainment | Married | Unmarried |
| Less than High School | 0 (0.0%) | 0 (0.0%) |
| High School Diploma | 0 (0.0%) | 0 (0.0%) |
| College or Associate's Degree | 0 (0.0%) | 0 (0.0%) |
| Bachelor's Degree | 0 (0.0%) | 0 (0.0%) |
| Graduate Degree | 0 (0.0%) | 0 (0.0%) |
| Total | 0 (0.0%) | 0 (0.0%) |
Employment Characteristics in Madison
Employment by Class of Employer in Madison
Among the 181 employed individuals in Madison, private company employees (147 | 81.2%), state government employees (33 | 18.2%), and not-for-profit organizations (1 | 0.5%) make up the most common classes of employment.
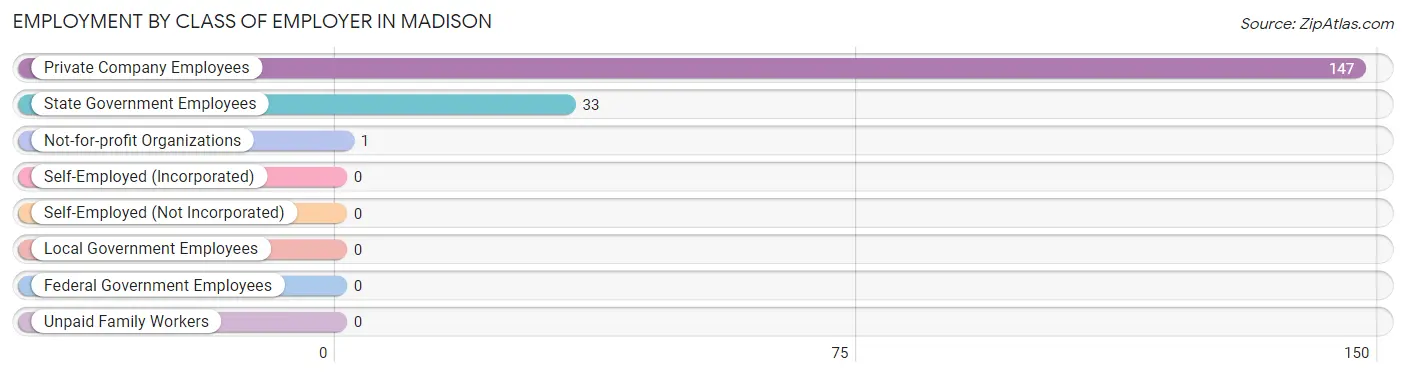
| Employer Class | # Employees | % Employees |
| Private Company Employees | 147 | 81.2% |
| Self-Employed (Incorporated) | 0 | 0.0% |
| Self-Employed (Not Incorporated) | 0 | 0.0% |
| Not-for-profit Organizations | 1 | 0.5% |
| Local Government Employees | 0 | 0.0% |
| State Government Employees | 33 | 18.2% |
| Federal Government Employees | 0 | 0.0% |
| Unpaid Family Workers | 0 | 0.0% |
| Total | 181 | 100.0% |
Employment Status by Age in Madison
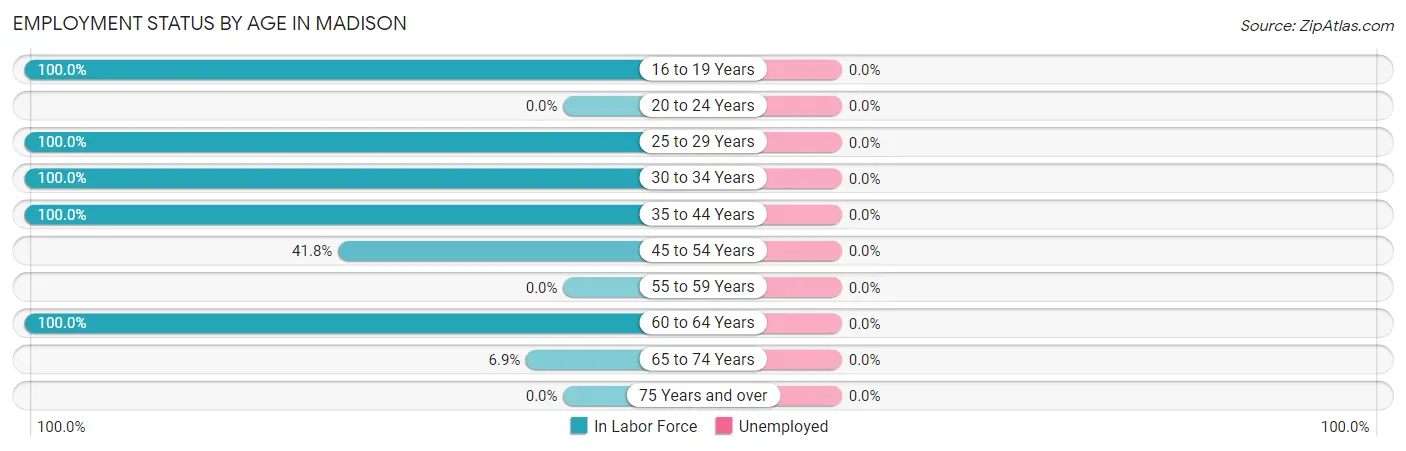
| Age Bracket | In Labor Force | Unemployed |
| 16 to 19 Years | 26 (100.0%) | 0 (0.0%) |
| 20 to 24 Years | 0 (0.0%) | 0 (0.0%) |
| 25 to 29 Years | 2 (100.0%) | 0 (0.0%) |
| 30 to 34 Years | 83 (100.0%) | 0 (0.0%) |
| 35 to 44 Years | 32 (100.0%) | 0 (0.0%) |
| 45 to 54 Years | 28 (41.8%) | 0 (0.0%) |
| 55 to 59 Years | 0 (0.0%) | 0 (0.0%) |
| 60 to 64 Years | 27 (100.0%) | 0 (0.0%) |
| 65 to 74 Years | 10 (6.9%) | 0 (0.0%) |
| 75 Years and over | 0 (0.0%) | 0 (0.0%) |
| Total | 208 (45.7%) | 0 (0.0%) |
Employment Status by Educational Attainment in Madison
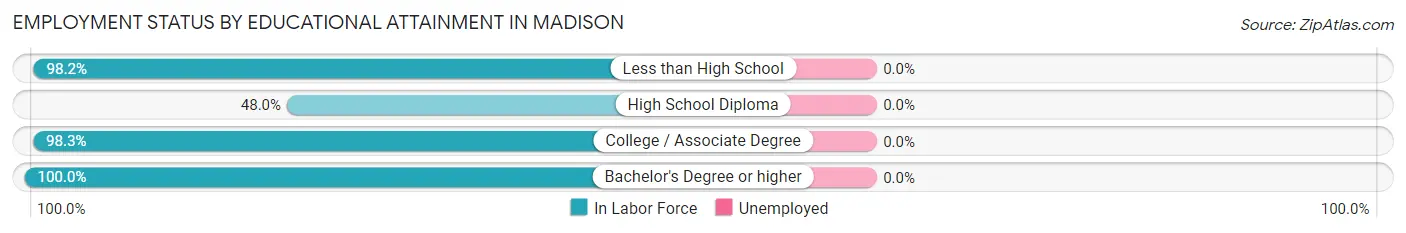
| Educational Attainment | In Labor Force | Unemployed |
| Less than High School | 55 (98.2%) | 0 (0.0%) |
| High School Diploma | 59 (48.0%) | 0 (0.0%) |
| College / Associate Degree | 57 (98.3%) | 0 (0.0%) |
| Bachelor's Degree or higher | 1 (100.0%) | 0 (0.0%) |
| Total | 172 (72.3%) | 0 (0.0%) |
Employment Occupations by Sex in Madison
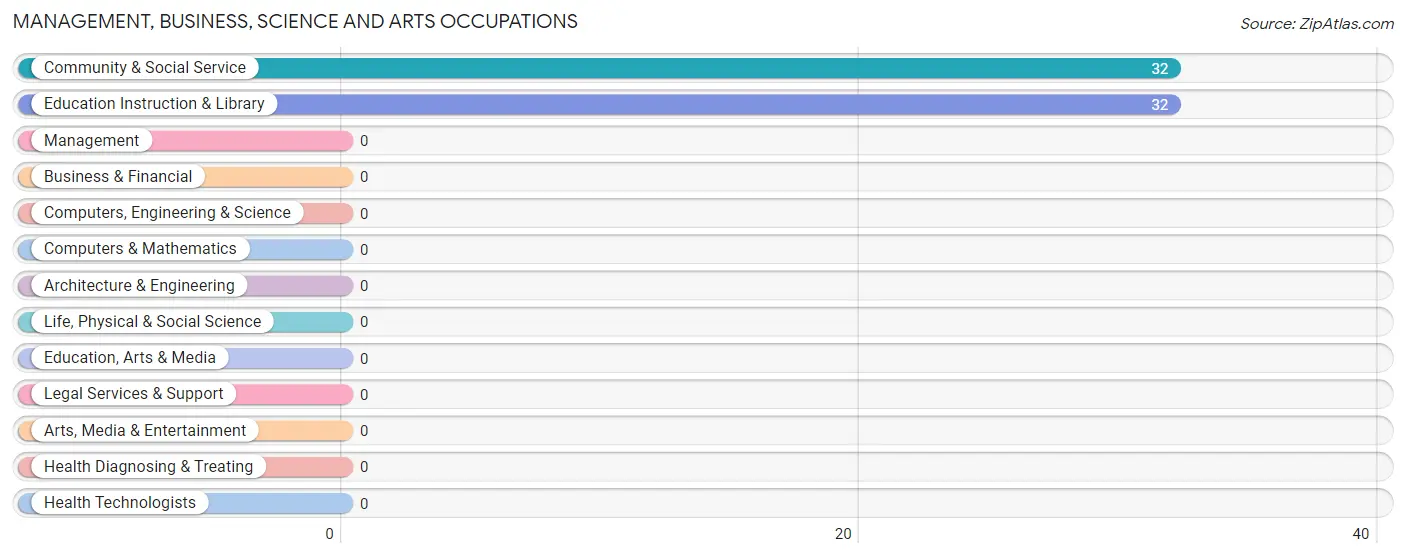
Management, Business, Science and Arts Occupations
The most common Management, Business, Science and Arts occupations in Madison are Community & Social Service (32 | 15.4%), and Education Instruction & Library (32 | 15.4%).
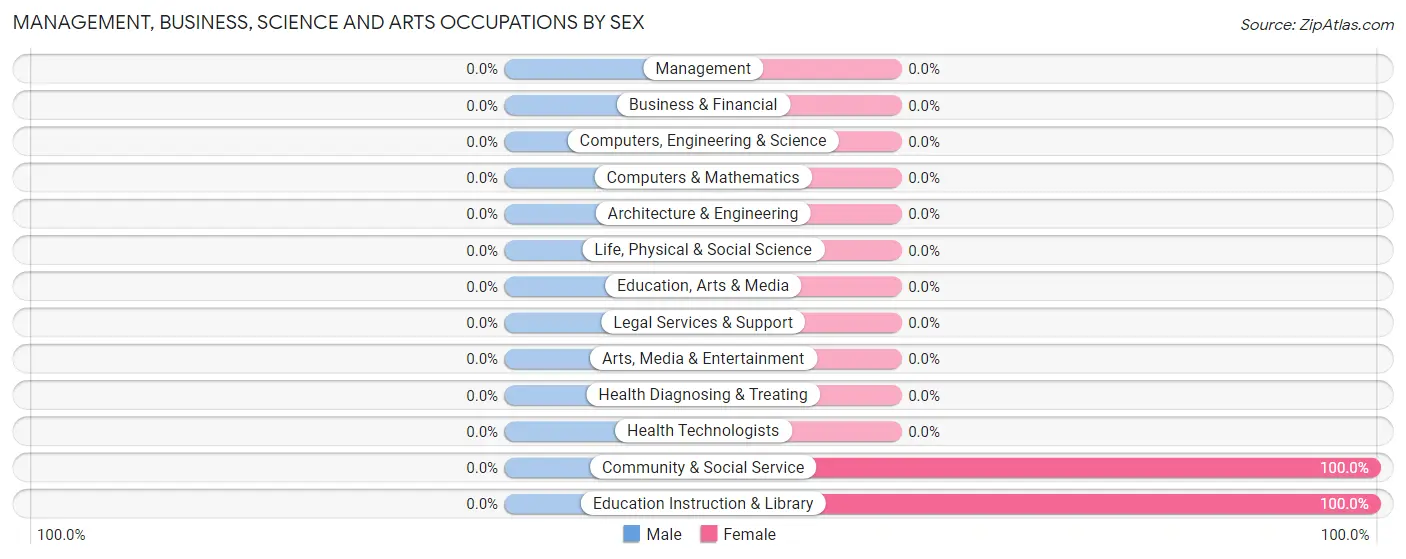
Management, Business, Science and Arts Occupations by Sex
| Occupation | Male | Female |
| Management | 0 (0.0%) | 0 (0.0%) |
| Business & Financial | 0 (0.0%) | 0 (0.0%) |
| Computers, Engineering & Science | 0 (0.0%) | 0 (0.0%) |
| Computers & Mathematics | 0 (0.0%) | 0 (0.0%) |
| Architecture & Engineering | 0 (0.0%) | 0 (0.0%) |
| Life, Physical & Social Science | 0 (0.0%) | 0 (0.0%) |
| Community & Social Service | 0 (0.0%) | 32 (100.0%) |
| Education, Arts & Media | 0 (0.0%) | 0 (0.0%) |
| Legal Services & Support | 0 (0.0%) | 0 (0.0%) |
| Education Instruction & Library | 0 (0.0%) | 32 (100.0%) |
| Arts, Media & Entertainment | 0 (0.0%) | 0 (0.0%) |
| Health Diagnosing & Treating | 0 (0.0%) | 0 (0.0%) |
| Health Technologists | 0 (0.0%) | 0 (0.0%) |
| Total (Category) | 0 (0.0%) | 32 (100.0%) |
| Total (Overall) | 59 (28.4%) | 149 (71.6%) |
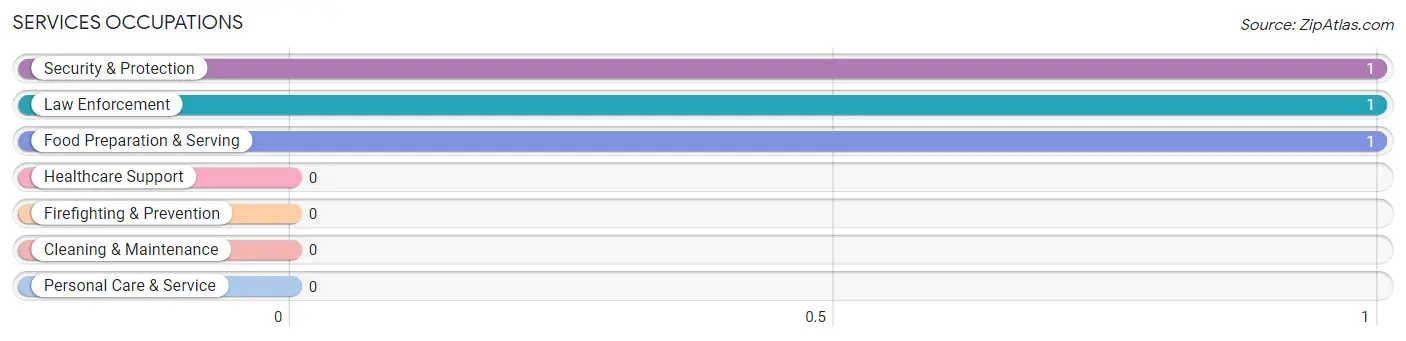
Services Occupations
The most common Services occupations in Madison are Security & Protection (1 | 0.5%), Law Enforcement (1 | 0.5%), and Food Preparation & Serving (1 | 0.5%).
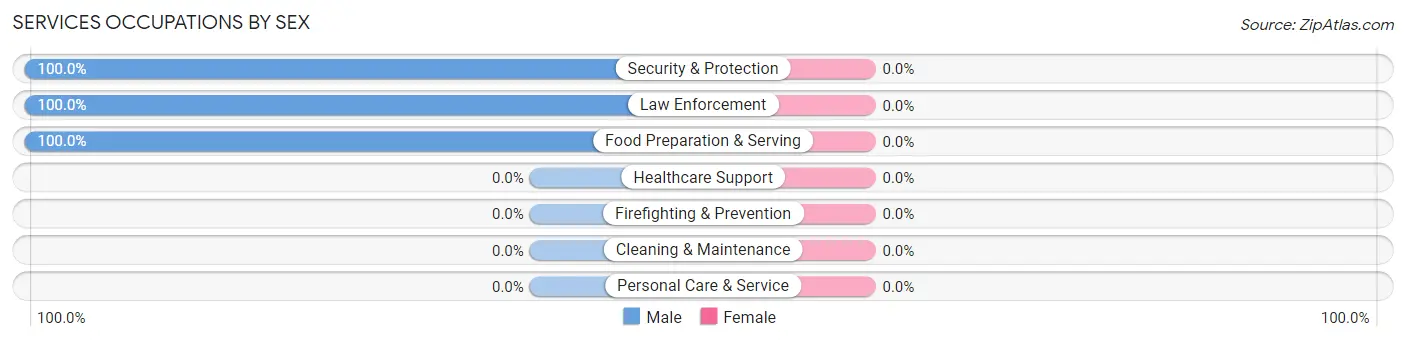
Services Occupations by Sex
| Occupation | Male | Female |
| Healthcare Support | 0 (0.0%) | 0 (0.0%) |
| Security & Protection | 1 (100.0%) | 0 (0.0%) |
| Firefighting & Prevention | 0 (0.0%) | 0 (0.0%) |
| Law Enforcement | 1 (100.0%) | 0 (0.0%) |
| Food Preparation & Serving | 1 (100.0%) | 0 (0.0%) |
| Cleaning & Maintenance | 0 (0.0%) | 0 (0.0%) |
| Personal Care & Service | 0 (0.0%) | 0 (0.0%) |
| Total (Category) | 2 (100.0%) | 0 (0.0%) |
| Total (Overall) | 59 (28.4%) | 149 (71.6%) |
Sales and Office Occupations
The most common Sales and Office occupations in Madison are Office & Administration (25 | 12.0%), and Sales & Related (10 | 4.8%).
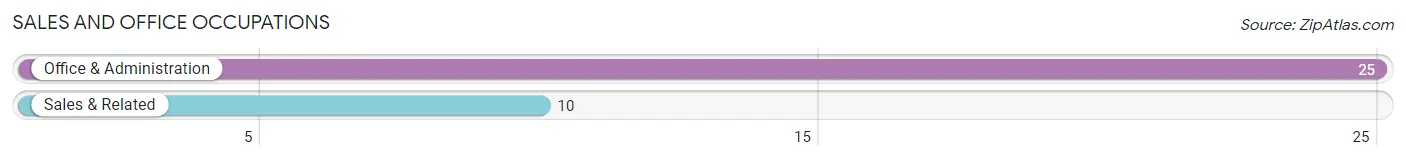
Sales and Office Occupations by Sex
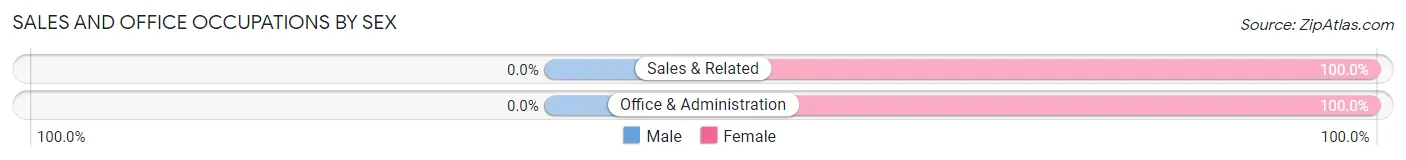
| Occupation | Male | Female |
| Sales & Related | 0 (0.0%) | 10 (100.0%) |
| Office & Administration | 0 (0.0%) | 25 (100.0%) |
| Total (Category) | 0 (0.0%) | 35 (100.0%) |
| Total (Overall) | 59 (28.4%) | 149 (71.6%) |
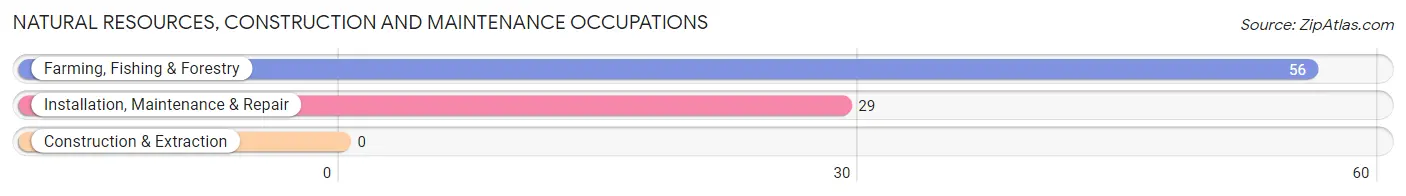
Natural Resources, Construction and Maintenance Occupations
The most common Natural Resources, Construction and Maintenance occupations in Madison are Farming, Fishing & Forestry (56 | 26.9%), and Installation, Maintenance & Repair (29 | 13.9%).
Natural Resources, Construction and Maintenance Occupations by Sex
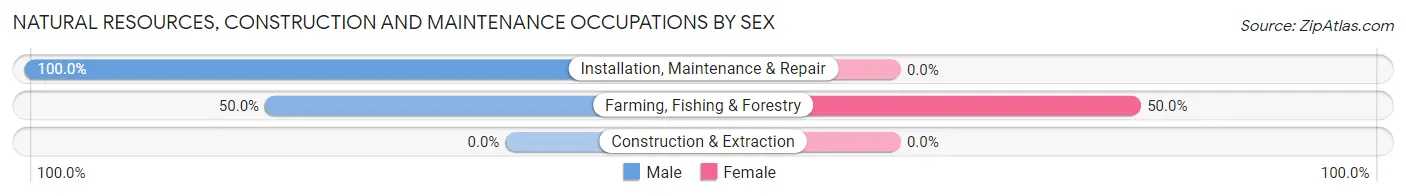
| Occupation | Male | Female |
| Farming, Fishing & Forestry | 28 (50.0%) | 28 (50.0%) |
| Construction & Extraction | 0 (0.0%) | 0 (0.0%) |
| Installation, Maintenance & Repair | 29 (100.0%) | 0 (0.0%) |
| Total (Category) | 57 (67.1%) | 28 (32.9%) |
| Total (Overall) | 59 (28.4%) | 149 (71.6%) |
Production, Transportation and Moving Occupations
The most common Production, Transportation and Moving occupations in Madison are , and Production (54 | 26.0%).
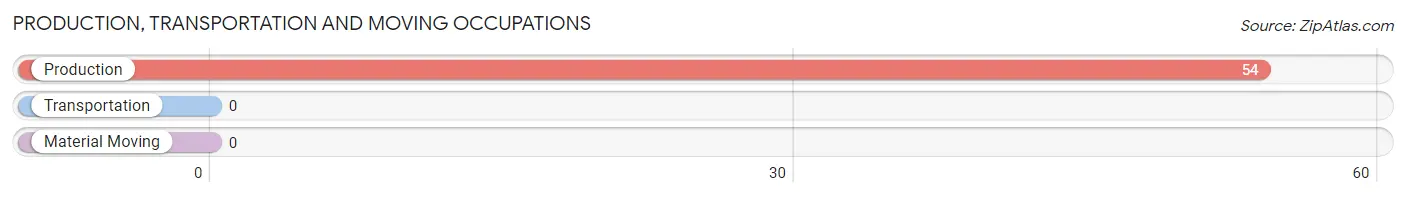
Production, Transportation and Moving Occupations by Sex
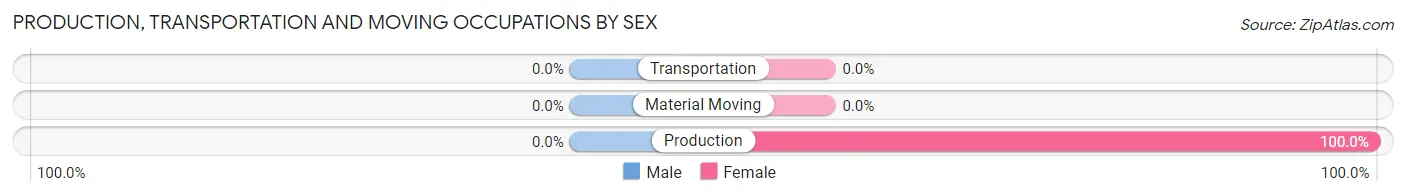
| Occupation | Male | Female |
| Production | 0 (0.0%) | 54 (100.0%) |
| Transportation | 0 (0.0%) | 0 (0.0%) |
| Material Moving | 0 (0.0%) | 0 (0.0%) |
| Total (Category) | 0 (0.0%) | 54 (100.0%) |
| Total (Overall) | 59 (28.4%) | 149 (71.6%) |
Employment Industries by Sex in Madison
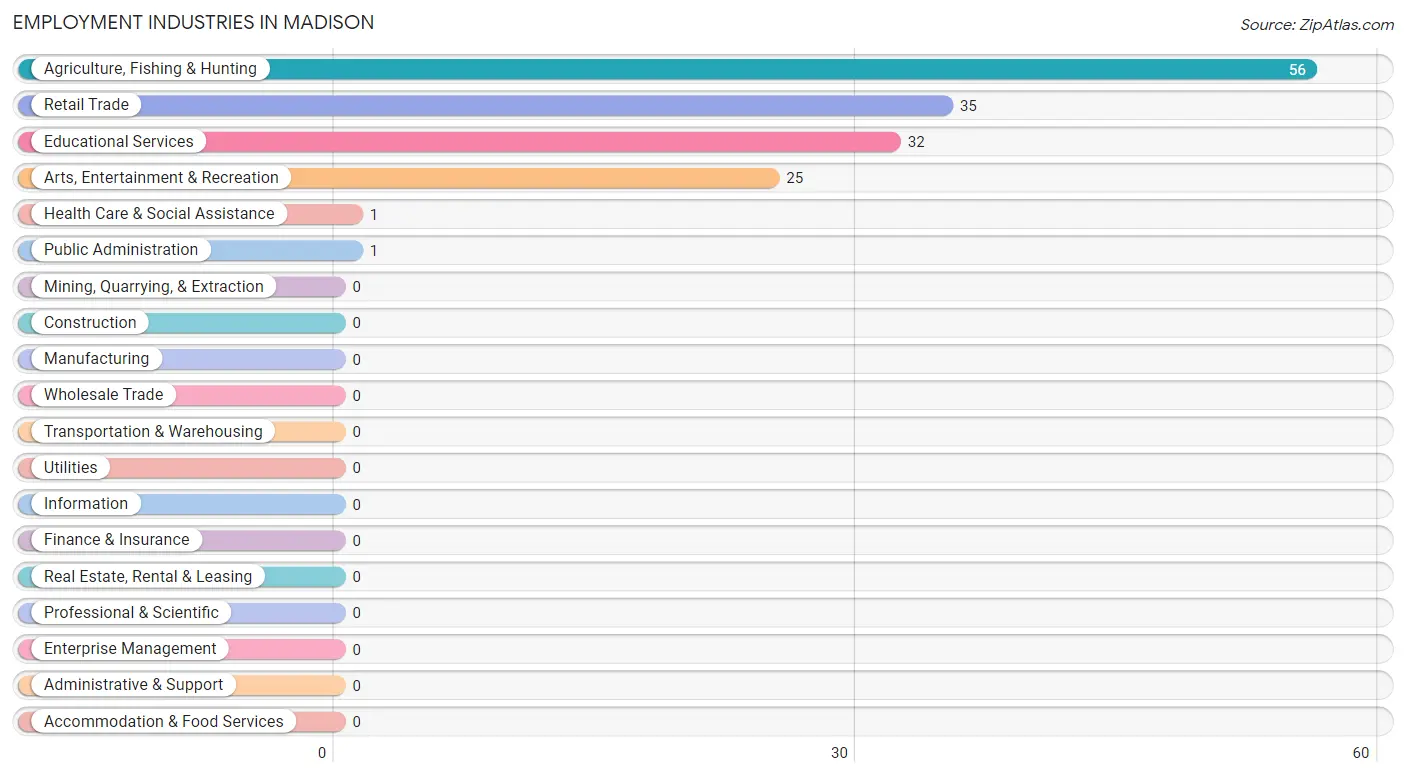
Employment Industries in Madison
The major employment industries in Madison include Agriculture, Fishing & Hunting (56 | 26.9%), Retail Trade (35 | 16.8%), Educational Services (32 | 15.4%), Arts, Entertainment & Recreation (25 | 12.0%), and Health Care & Social Assistance (1 | 0.5%).
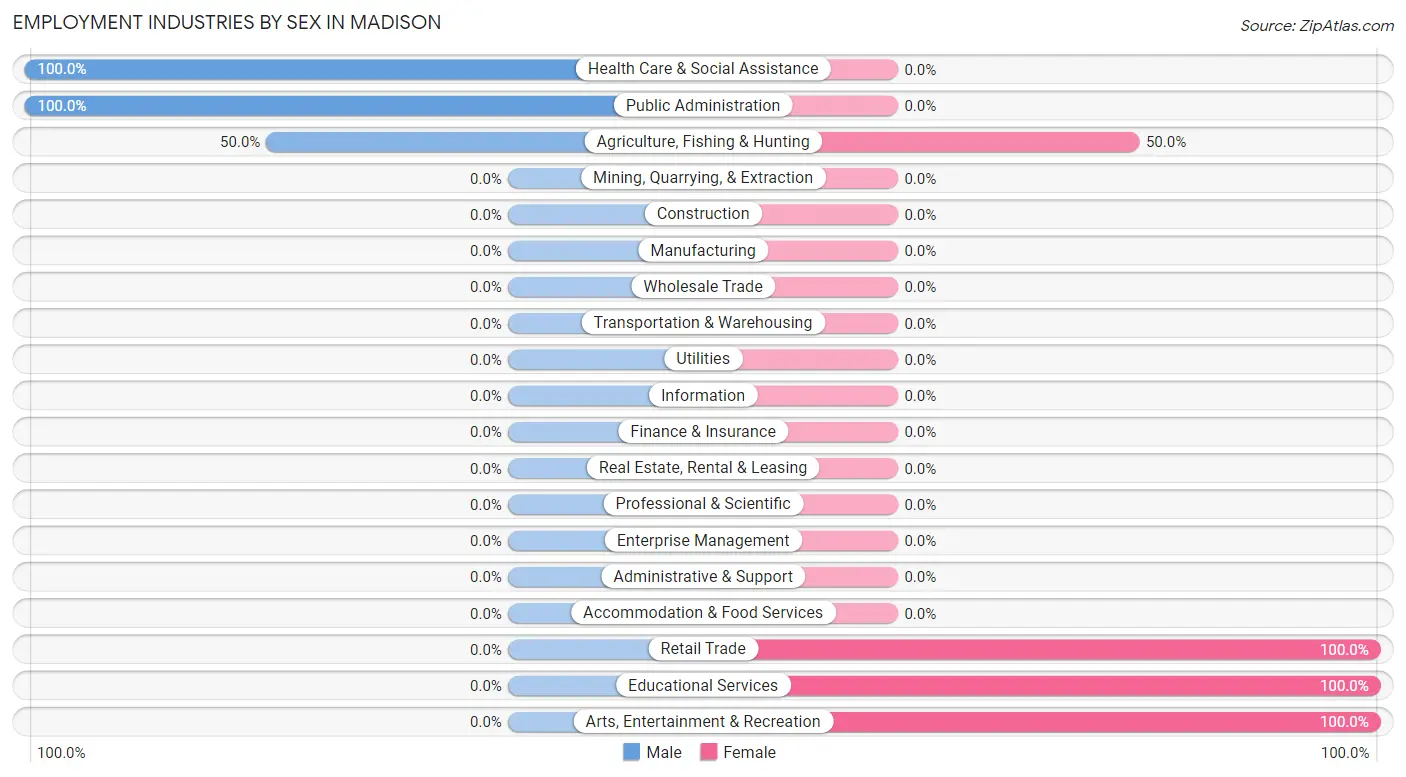
Employment Industries by Sex in Madison
The Madison industries that see more men than women are Health Care & Social Assistance (100.0%), Public Administration (100.0%), and Agriculture, Fishing & Hunting (50.0%), whereas the industries that tend to have a higher number of women are Retail Trade (100.0%), Educational Services (100.0%), and Arts, Entertainment & Recreation (100.0%).
| Industry | Male | Female |
| Agriculture, Fishing & Hunting | 28 (50.0%) | 28 (50.0%) |
| Mining, Quarrying, & Extraction | 0 (0.0%) | 0 (0.0%) |
| Construction | 0 (0.0%) | 0 (0.0%) |
| Manufacturing | 0 (0.0%) | 0 (0.0%) |
| Wholesale Trade | 0 (0.0%) | 0 (0.0%) |
| Retail Trade | 0 (0.0%) | 35 (100.0%) |
| Transportation & Warehousing | 0 (0.0%) | 0 (0.0%) |
| Utilities | 0 (0.0%) | 0 (0.0%) |
| Information | 0 (0.0%) | 0 (0.0%) |
| Finance & Insurance | 0 (0.0%) | 0 (0.0%) |
| Real Estate, Rental & Leasing | 0 (0.0%) | 0 (0.0%) |
| Professional & Scientific | 0 (0.0%) | 0 (0.0%) |
| Enterprise Management | 0 (0.0%) | 0 (0.0%) |
| Administrative & Support | 0 (0.0%) | 0 (0.0%) |
| Educational Services | 0 (0.0%) | 32 (100.0%) |
| Health Care & Social Assistance | 1 (100.0%) | 0 (0.0%) |
| Arts, Entertainment & Recreation | 0 (0.0%) | 25 (100.0%) |
| Accommodation & Food Services | 0 (0.0%) | 0 (0.0%) |
| Public Administration | 1 (100.0%) | 0 (0.0%) |
| Total | 59 (28.4%) | 149 (71.6%) |
Education in Madison
School Enrollment in Madison
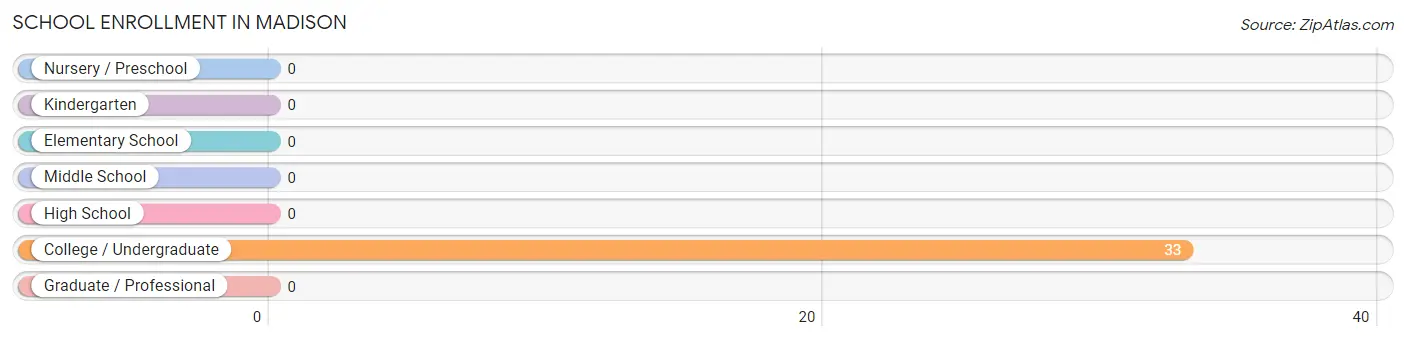
| School Level | # Students | % Students |
| Nursery / Preschool | 0 | 0.0% |
| Kindergarten | 0 | 0.0% |
| Elementary School | 0 | 0.0% |
| Middle School | 0 | 0.0% |
| High School | 0 | 0.0% |
| College / Undergraduate | 33 | 100.0% |
| Graduate / Professional | 0 | 0.0% |
| Total | 33 | 100.0% |
School Enrollment by Age by Funding Source in Madison
Out of a total of 33 students who are enrolled in schools in Madison, 1 (3.0%) attend a private institution, while the remaining 32 (97.0%) are enrolled in public schools. The age group of 15 to 17 year olds has the highest likelihood of being enrolled in private schools, with 1 (100.0% in the age bracket) enrolled. Conversely, the age group of 35 years and over has the lowest likelihood of being enrolled in a private school, with 32 (100.0% in the age bracket) attending a public institution.
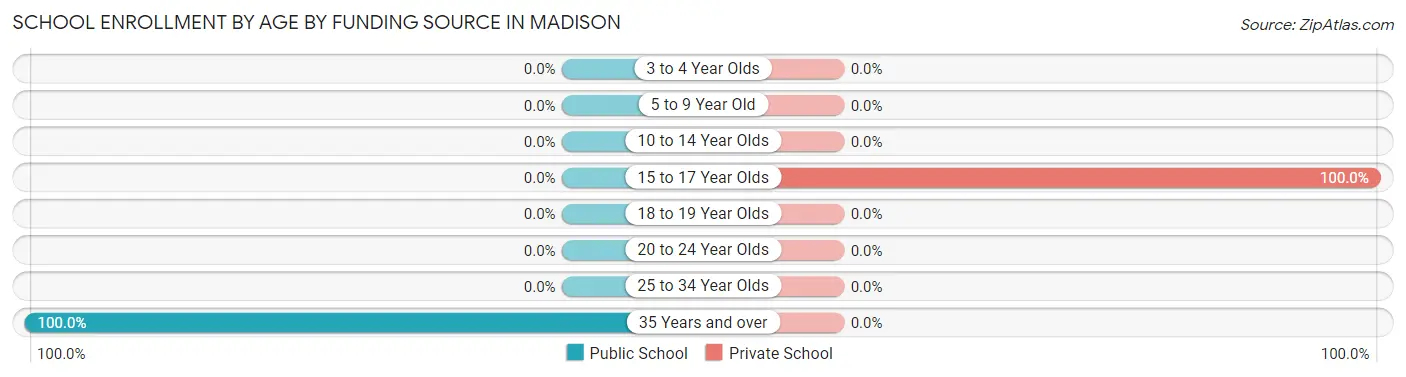
| Age Bracket | Public School | Private School |
| 3 to 4 Year Olds | 0 (0.0%) | 0 (0.0%) |
| 5 to 9 Year Old | 0 (0.0%) | 0 (0.0%) |
| 10 to 14 Year Olds | 0 (0.0%) | 0 (0.0%) |
| 15 to 17 Year Olds | 0 (0.0%) | 1 (100.0%) |
| 18 to 19 Year Olds | 0 (0.0%) | 0 (0.0%) |
| 20 to 24 Year Olds | 0 (0.0%) | 0 (0.0%) |
| 25 to 34 Year Olds | 0 (0.0%) | 0 (0.0%) |
| 35 Years and over | 32 (100.0%) | 0 (0.0%) |
| Total | 32 (97.0%) | 1 (3.0%) |
Educational Attainment by Field of Study in Madison
Engineering (22 | 95.7%), and arts & humanities (1 | 4.3%) are the most common fields of study among 23 individuals in Madison who have obtained a bachelor's degree or higher.
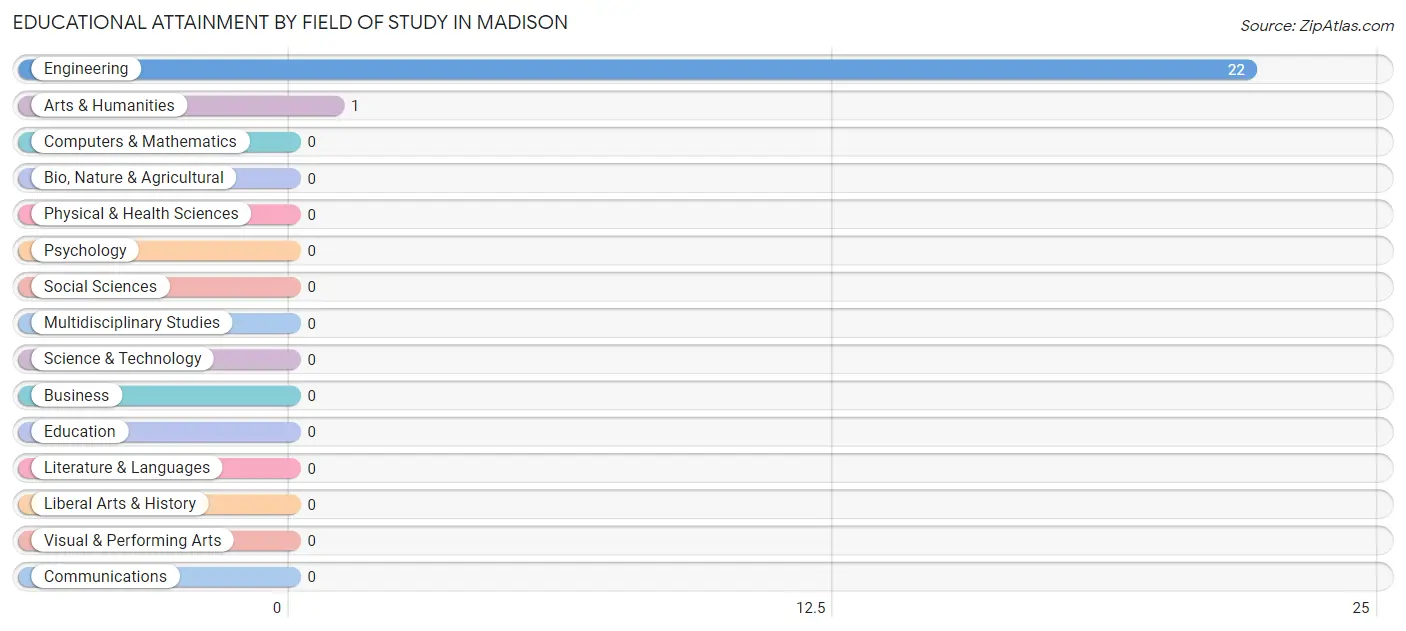
| Field of Study | # Graduates | % Graduates |
| Computers & Mathematics | 0 | 0.0% |
| Bio, Nature & Agricultural | 0 | 0.0% |
| Physical & Health Sciences | 0 | 0.0% |
| Psychology | 0 | 0.0% |
| Social Sciences | 0 | 0.0% |
| Engineering | 22 | 95.7% |
| Multidisciplinary Studies | 0 | 0.0% |
| Science & Technology | 0 | 0.0% |
| Business | 0 | 0.0% |
| Education | 0 | 0.0% |
| Literature & Languages | 0 | 0.0% |
| Liberal Arts & History | 0 | 0.0% |
| Visual & Performing Arts | 0 | 0.0% |
| Communications | 0 | 0.0% |
| Arts & Humanities | 1 | 4.3% |
| Total | 23 | 100.0% |
Transportation & Commute in Madison
Vehicle Availability by Sex in Madison
The most prevalent vehicle ownership categories in Madison are males with 5 or more vehicles (29, accounting for 100.0%) and females with 5 or more vehicles (82, making up 19.5%).
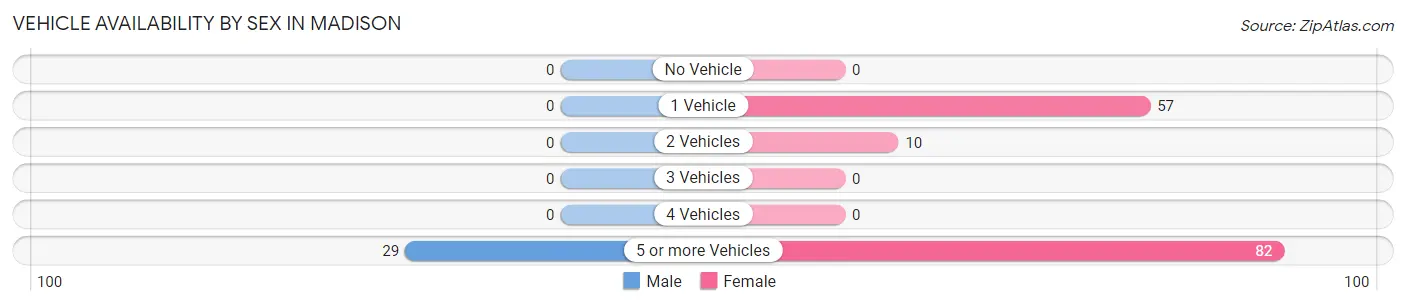
| Vehicles Available | Male | Female |
| No Vehicle | 0 (0.0%) | 0 (0.0%) |
| 1 Vehicle | 0 (0.0%) | 57 (38.3%) |
| 2 Vehicles | 0 (0.0%) | 10 (6.7%) |
| 3 Vehicles | 0 (0.0%) | 0 (0.0%) |
| 4 Vehicles | 0 (0.0%) | 0 (0.0%) |
| 5 or more Vehicles | 29 (100.0%) | 82 (55.0%) |
| Total | 29 (100.0%) | 149 (100.0%) |
Commute Time in Madison
The most frequently occuring commute durations in Madison are 20 to 24 minutes (68 commuters, 37.6%), 30 to 34 minutes (58 commuters, 32.0%), and 25 to 29 minutes (54 commuters, 29.8%).
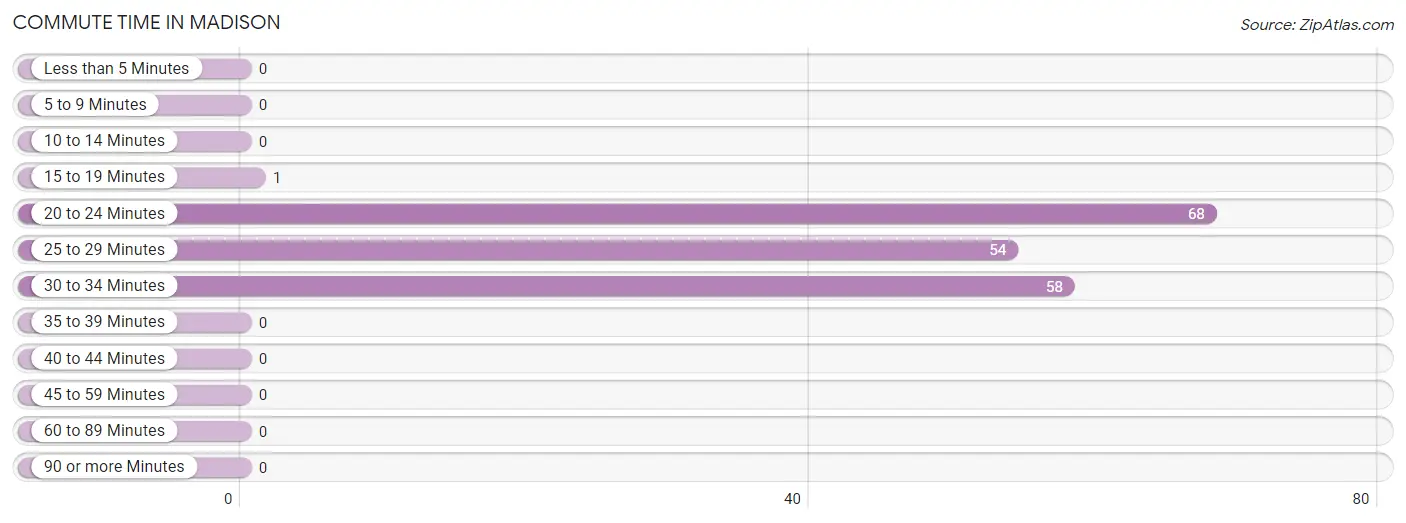
| Commute Time | # Commuters | % Commuters |
| Less than 5 Minutes | 0 | 0.0% |
| 5 to 9 Minutes | 0 | 0.0% |
| 10 to 14 Minutes | 0 | 0.0% |
| 15 to 19 Minutes | 1 | 0.5% |
| 20 to 24 Minutes | 68 | 37.6% |
| 25 to 29 Minutes | 54 | 29.8% |
| 30 to 34 Minutes | 58 | 32.0% |
| 35 to 39 Minutes | 0 | 0.0% |
| 40 to 44 Minutes | 0 | 0.0% |
| 45 to 59 Minutes | 0 | 0.0% |
| 60 to 89 Minutes | 0 | 0.0% |
| 90 or more Minutes | 0 | 0.0% |
Commute Time by Sex in Madison
The most common commute times in Madison are 20 to 24 minutes (29 commuters, 90.6%) for males and 30 to 34 minutes (57 commuters, 38.3%) for females.
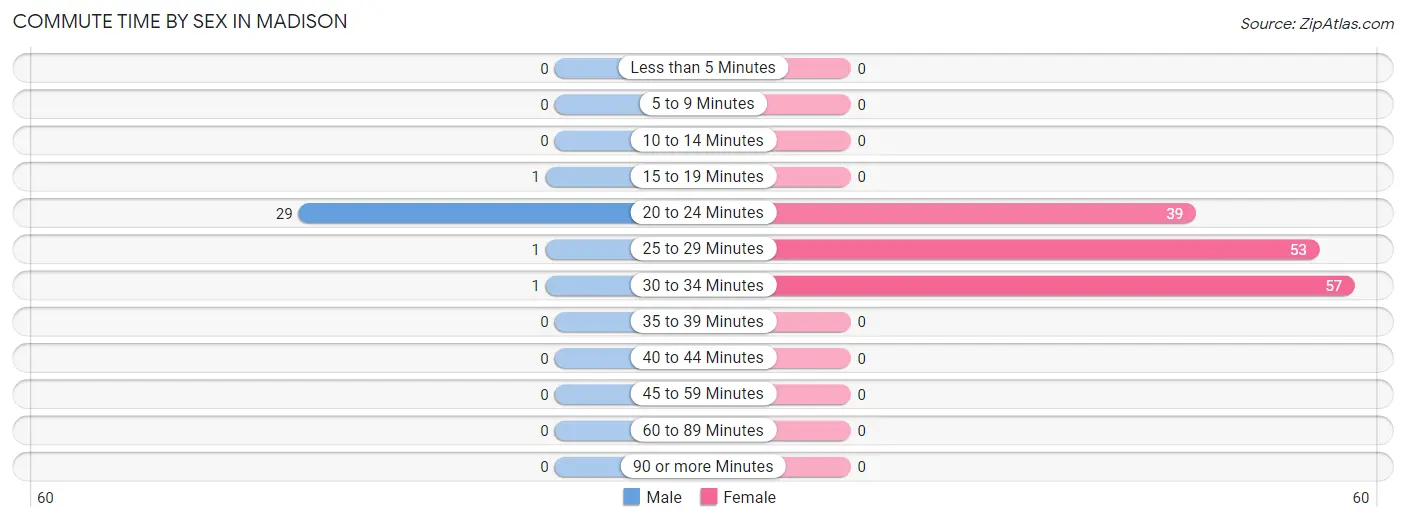
| Commute Time | Male | Female |
| Less than 5 Minutes | 0 (0.0%) | 0 (0.0%) |
| 5 to 9 Minutes | 0 (0.0%) | 0 (0.0%) |
| 10 to 14 Minutes | 0 (0.0%) | 0 (0.0%) |
| 15 to 19 Minutes | 1 (3.1%) | 0 (0.0%) |
| 20 to 24 Minutes | 29 (90.6%) | 39 (26.2%) |
| 25 to 29 Minutes | 1 (3.1%) | 53 (35.6%) |
| 30 to 34 Minutes | 1 (3.1%) | 57 (38.3%) |
| 35 to 39 Minutes | 0 (0.0%) | 0 (0.0%) |
| 40 to 44 Minutes | 0 (0.0%) | 0 (0.0%) |
| 45 to 59 Minutes | 0 (0.0%) | 0 (0.0%) |
| 60 to 89 Minutes | 0 (0.0%) | 0 (0.0%) |
| 90 or more Minutes | 0 (0.0%) | 0 (0.0%) |
Time of Departure to Work by Sex in Madison
The most frequent times of departure to work in Madison are 7:30 AM to 7:59 AM (29, 90.6%) for males and 9:00 AM to 9:59 AM (35, 23.5%) for females.
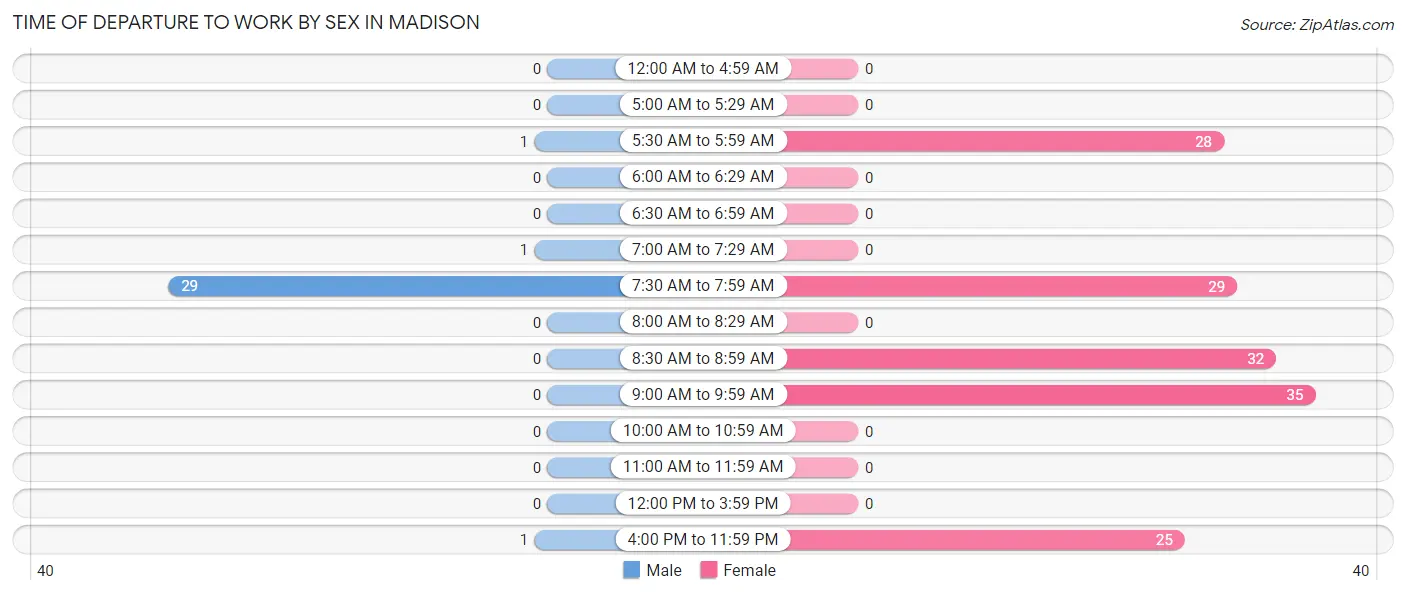
| Time of Departure | Male | Female |
| 12:00 AM to 4:59 AM | 0 (0.0%) | 0 (0.0%) |
| 5:00 AM to 5:29 AM | 0 (0.0%) | 0 (0.0%) |
| 5:30 AM to 5:59 AM | 1 (3.1%) | 28 (18.8%) |
| 6:00 AM to 6:29 AM | 0 (0.0%) | 0 (0.0%) |
| 6:30 AM to 6:59 AM | 0 (0.0%) | 0 (0.0%) |
| 7:00 AM to 7:29 AM | 1 (3.1%) | 0 (0.0%) |
| 7:30 AM to 7:59 AM | 29 (90.6%) | 29 (19.5%) |
| 8:00 AM to 8:29 AM | 0 (0.0%) | 0 (0.0%) |
| 8:30 AM to 8:59 AM | 0 (0.0%) | 32 (21.5%) |
| 9:00 AM to 9:59 AM | 0 (0.0%) | 35 (23.5%) |
| 10:00 AM to 10:59 AM | 0 (0.0%) | 0 (0.0%) |
| 11:00 AM to 11:59 AM | 0 (0.0%) | 0 (0.0%) |
| 12:00 PM to 3:59 PM | 0 (0.0%) | 0 (0.0%) |
| 4:00 PM to 11:59 PM | 1 (3.1%) | 25 (16.8%) |
| Total | 32 (100.0%) | 149 (100.0%) |
Housing Occupancy in Madison
Occupancy by Ownership in Madison
Of the total 175 dwellings in Madison, owner-occupied units account for 143 (81.7%), while renter-occupied units make up 32 (18.3%).
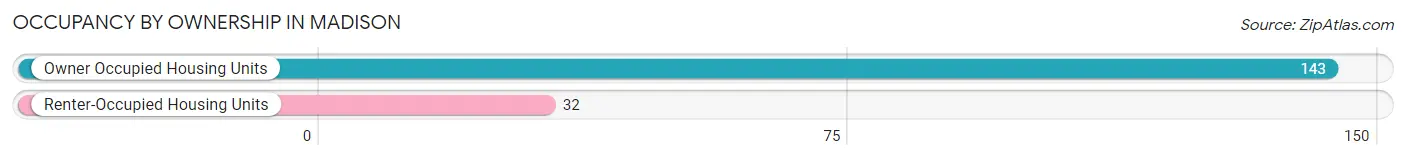
| Occupancy | # Housing Units | % Housing Units |
| Owner Occupied Housing Units | 143 | 81.7% |
| Renter-Occupied Housing Units | 32 | 18.3% |
| Total Occupied Housing Units | 175 | 100.0% |
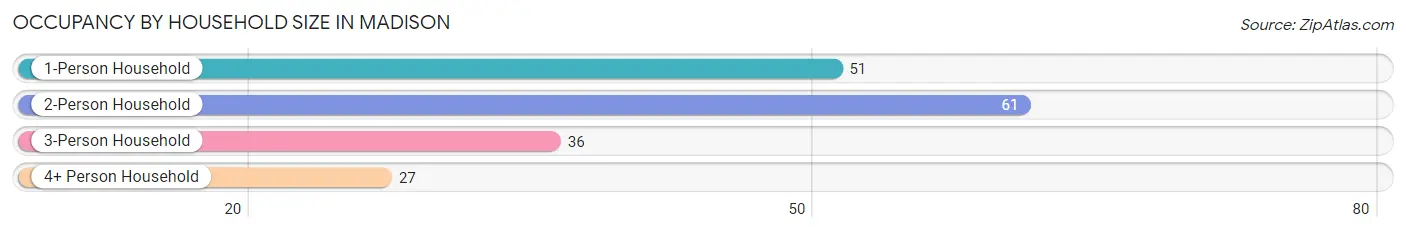
Occupancy by Household Size in Madison
| Household Size | # Housing Units | % Housing Units |
| 1-Person Household | 51 | 29.1% |
| 2-Person Household | 61 | 34.9% |
| 3-Person Household | 36 | 20.6% |
| 4+ Person Household | 27 | 15.4% |
| Total Housing Units | 175 | 100.0% |
Occupancy by Ownership by Household Size in Madison
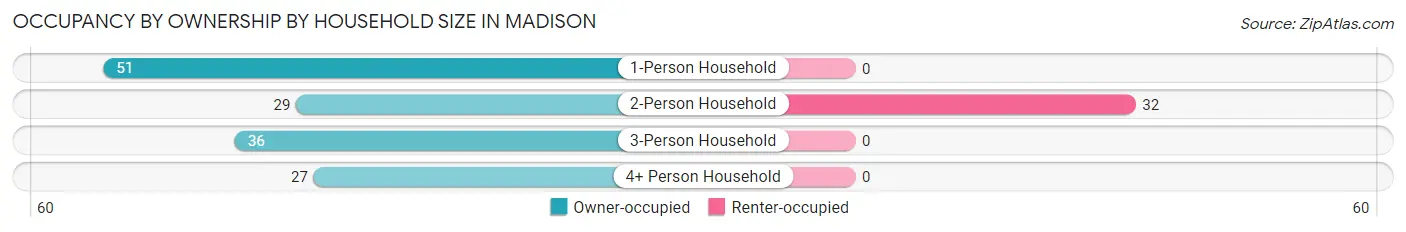
| Household Size | Owner-occupied | Renter-occupied |
| 1-Person Household | 51 (100.0%) | 0 (0.0%) |
| 2-Person Household | 29 (47.5%) | 32 (52.5%) |
| 3-Person Household | 36 (100.0%) | 0 (0.0%) |
| 4+ Person Household | 27 (100.0%) | 0 (0.0%) |
| Total Housing Units | 143 (81.7%) | 32 (18.3%) |
Occupancy by Educational Attainment in Madison
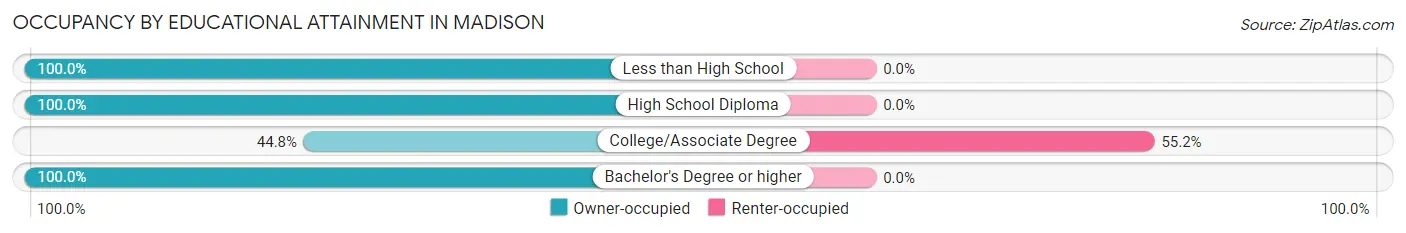
| Household Size | Owner-occupied | Renter-occupied |
| Less than High School | 56 (100.0%) | 0 (0.0%) |
| High School Diploma | 39 (100.0%) | 0 (0.0%) |
| College/Associate Degree | 26 (44.8%) | 32 (55.2%) |
| Bachelor's Degree or higher | 22 (100.0%) | 0 (0.0%) |
Occupancy by Age of Householder in Madison
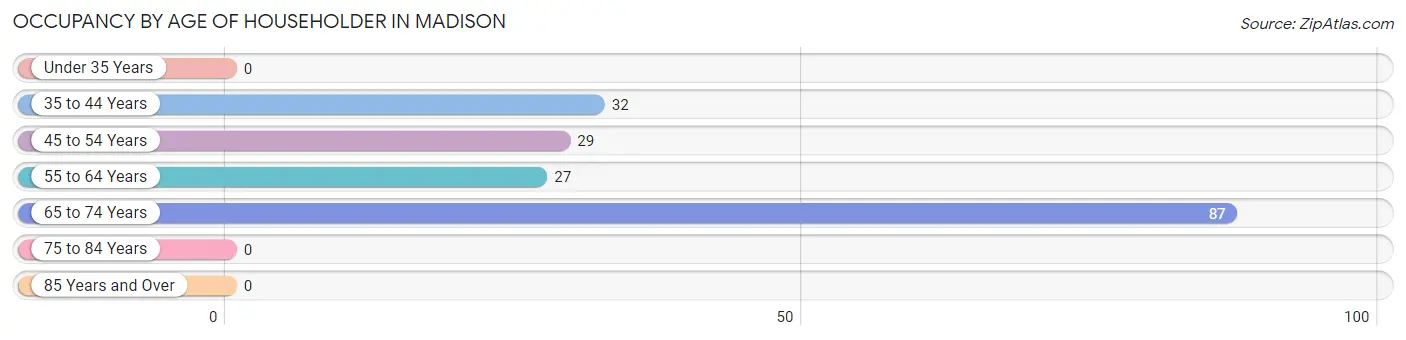
| Age Bracket | # Households | % Households |
| Under 35 Years | 0 | 0.0% |
| 35 to 44 Years | 32 | 18.3% |
| 45 to 54 Years | 29 | 16.6% |
| 55 to 64 Years | 27 | 15.4% |
| 65 to 74 Years | 87 | 49.7% |
| 75 to 84 Years | 0 | 0.0% |
| 85 Years and Over | 0 | 0.0% |
| Total | 175 | 100.0% |
Housing Finances in Madison
Median Income by Occupancy in Madison
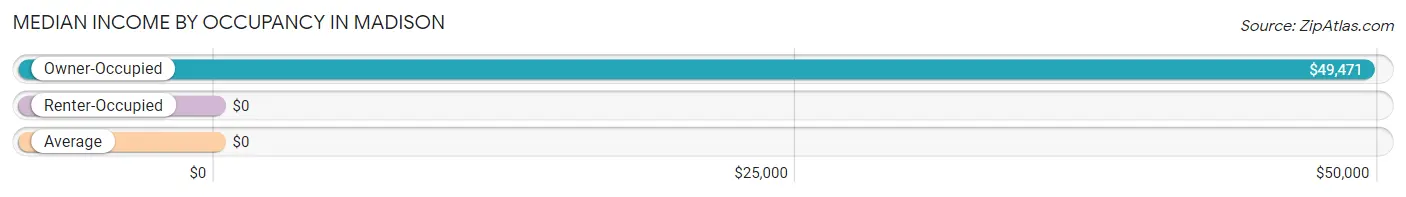
| Occupancy Type | # Households | Median Income |
| Owner-Occupied | 143 (81.7%) | $49,471 |
| Renter-Occupied | 32 (18.3%) | $0 |
| Average | 175 (100.0%) | $0 |
Occupancy by Householder Income Bracket in Madison
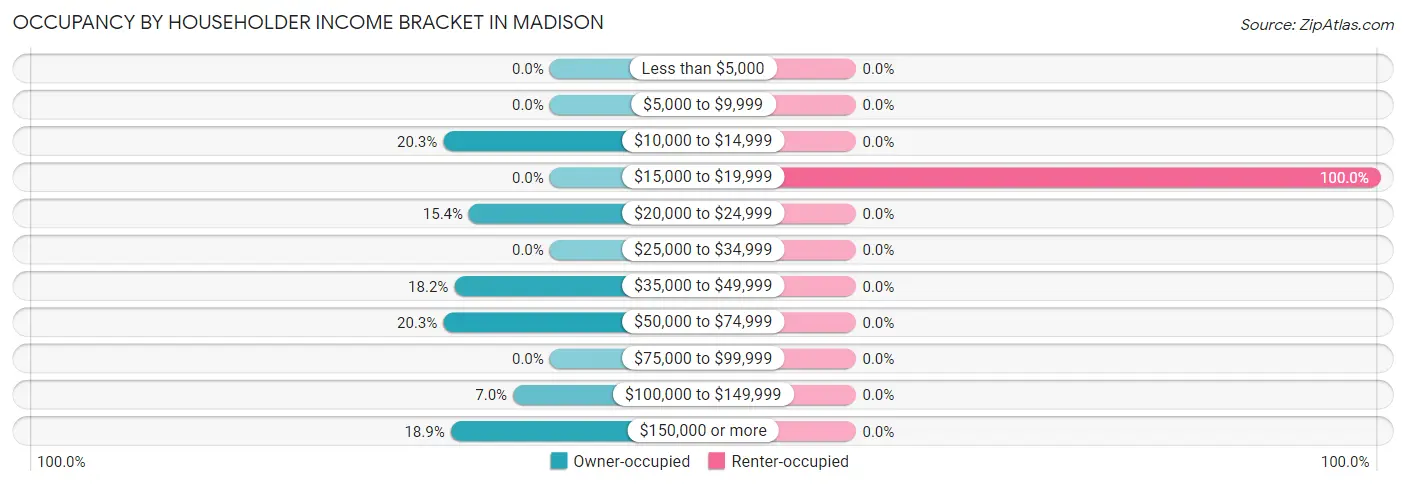
| Income Bracket | Owner-occupied | Renter-occupied |
| Less than $5,000 | 0 (0.0%) | 0 (0.0%) |
| $5,000 to $9,999 | 0 (0.0%) | 0 (0.0%) |
| $10,000 to $14,999 | 29 (20.3%) | 0 (0.0%) |
| $15,000 to $19,999 | 0 (0.0%) | 32 (100.0%) |
| $20,000 to $24,999 | 22 (15.4%) | 0 (0.0%) |
| $25,000 to $34,999 | 0 (0.0%) | 0 (0.0%) |
| $35,000 to $49,999 | 26 (18.2%) | 0 (0.0%) |
| $50,000 to $74,999 | 29 (20.3%) | 0 (0.0%) |
| $75,000 to $99,999 | 0 (0.0%) | 0 (0.0%) |
| $100,000 to $149,999 | 10 (7.0%) | 0 (0.0%) |
| $150,000 or more | 27 (18.9%) | 0 (0.0%) |
| Total | 143 (100.0%) | 32 (100.0%) |
Monthly Housing Cost Tiers in Madison
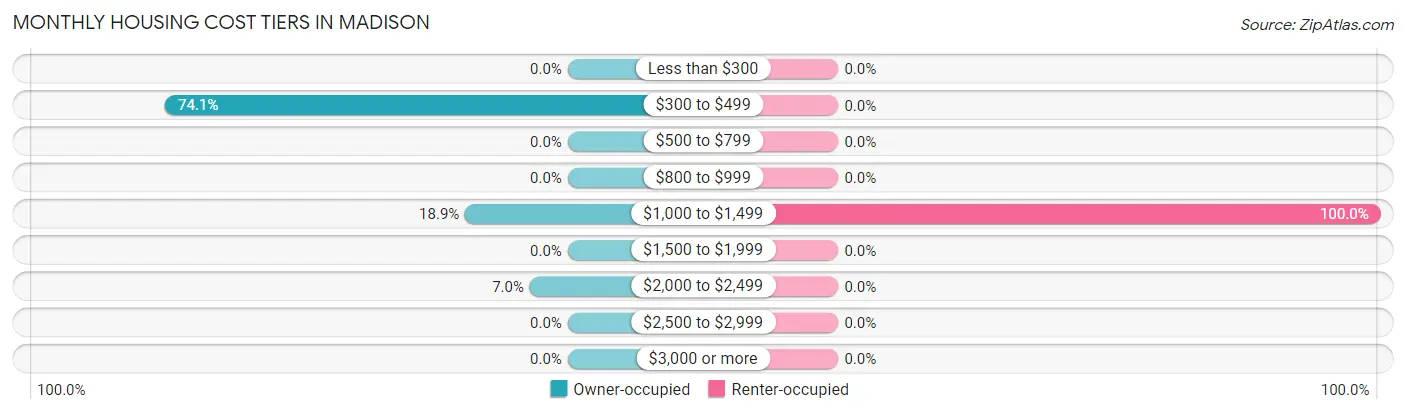
| Monthly Cost | Owner-occupied | Renter-occupied |
| Less than $300 | 0 (0.0%) | 0 (0.0%) |
| $300 to $499 | 106 (74.1%) | 0 (0.0%) |
| $500 to $799 | 0 (0.0%) | 0 (0.0%) |
| $800 to $999 | 0 (0.0%) | 0 (0.0%) |
| $1,000 to $1,499 | 27 (18.9%) | 32 (100.0%) |
| $1,500 to $1,999 | 0 (0.0%) | 0 (0.0%) |
| $2,000 to $2,499 | 10 (7.0%) | 0 (0.0%) |
| $2,500 to $2,999 | 0 (0.0%) | 0 (0.0%) |
| $3,000 or more | 0 (0.0%) | 0 (0.0%) |
| Total | 143 (100.0%) | 32 (100.0%) |
Physical Housing Characteristics in Madison
Housing Structures in Madison
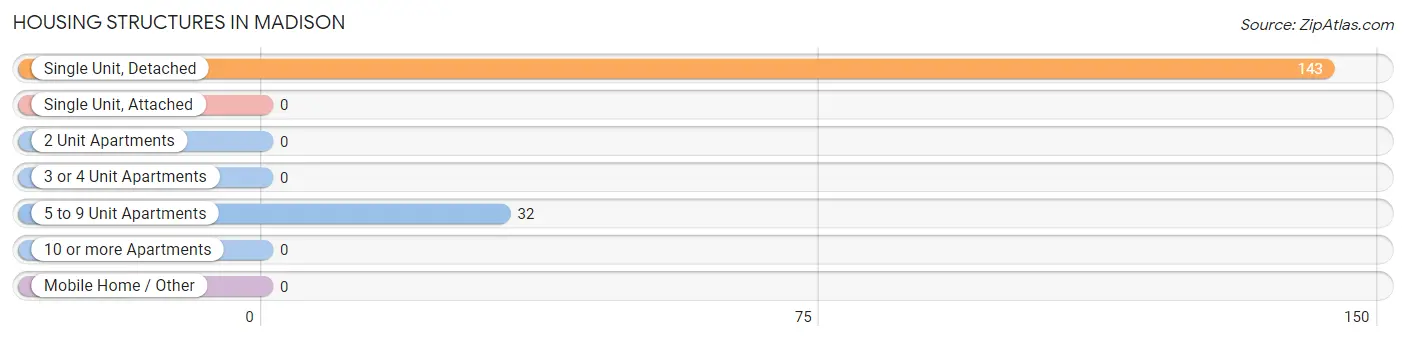
| Structure Type | # Housing Units | % Housing Units |
| Single Unit, Detached | 143 | 81.7% |
| Single Unit, Attached | 0 | 0.0% |
| 2 Unit Apartments | 0 | 0.0% |
| 3 or 4 Unit Apartments | 0 | 0.0% |
| 5 to 9 Unit Apartments | 32 | 18.3% |
| 10 or more Apartments | 0 | 0.0% |
| Mobile Home / Other | 0 | 0.0% |
| Total | 175 | 100.0% |
Housing Structures by Occupancy in Madison
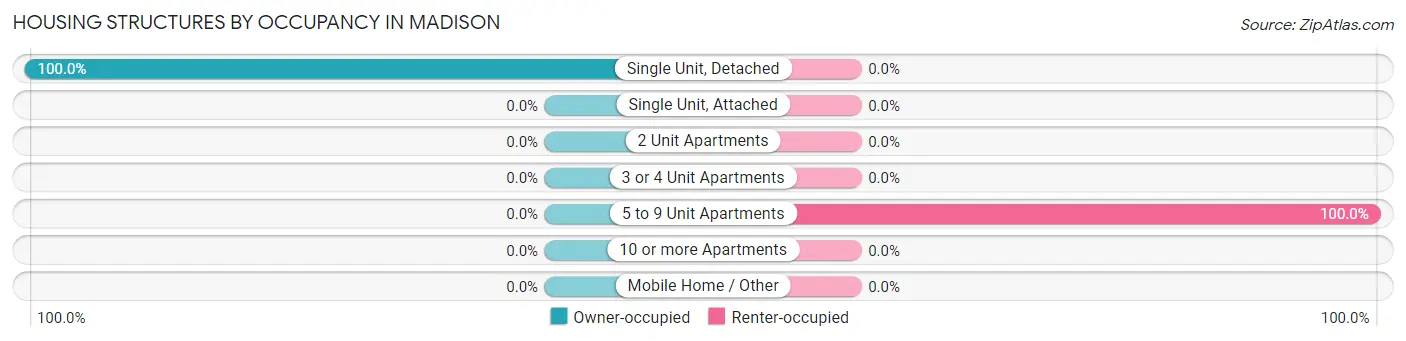
| Structure Type | Owner-occupied | Renter-occupied |
| Single Unit, Detached | 143 (100.0%) | 0 (0.0%) |
| Single Unit, Attached | 0 (0.0%) | 0 (0.0%) |
| 2 Unit Apartments | 0 (0.0%) | 0 (0.0%) |
| 3 or 4 Unit Apartments | 0 (0.0%) | 0 (0.0%) |
| 5 to 9 Unit Apartments | 0 (0.0%) | 32 (100.0%) |
| 10 or more Apartments | 0 (0.0%) | 0 (0.0%) |
| Mobile Home / Other | 0 (0.0%) | 0 (0.0%) |
| Total | 143 (81.7%) | 32 (18.3%) |
Housing Structures by Number of Rooms in Madison
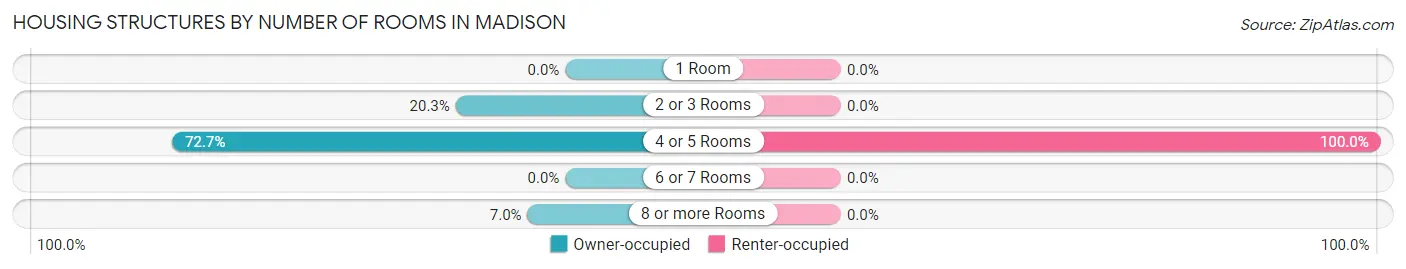
| Number of Rooms | Owner-occupied | Renter-occupied |
| 1 Room | 0 (0.0%) | 0 (0.0%) |
| 2 or 3 Rooms | 29 (20.3%) | 0 (0.0%) |
| 4 or 5 Rooms | 104 (72.7%) | 32 (100.0%) |
| 6 or 7 Rooms | 0 (0.0%) | 0 (0.0%) |
| 8 or more Rooms | 10 (7.0%) | 0 (0.0%) |
| Total | 143 (100.0%) | 32 (100.0%) |
Housing Structure by Heating Type in Madison
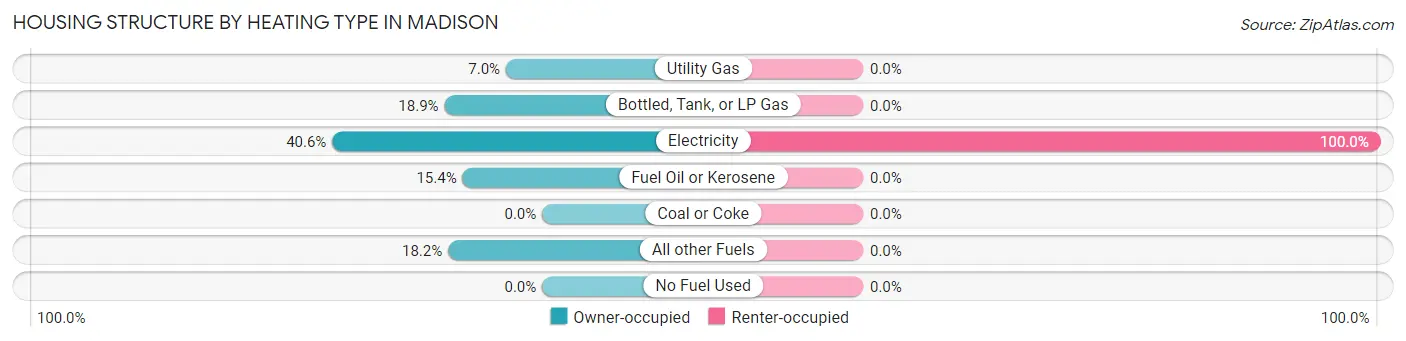
| Heating Type | Owner-occupied | Renter-occupied |
| Utility Gas | 10 (7.0%) | 0 (0.0%) |
| Bottled, Tank, or LP Gas | 27 (18.9%) | 0 (0.0%) |
| Electricity | 58 (40.6%) | 32 (100.0%) |
| Fuel Oil or Kerosene | 22 (15.4%) | 0 (0.0%) |
| Coal or Coke | 0 (0.0%) | 0 (0.0%) |
| All other Fuels | 26 (18.2%) | 0 (0.0%) |
| No Fuel Used | 0 (0.0%) | 0 (0.0%) |
| Total | 143 (100.0%) | 32 (100.0%) |
Household Vehicle Usage in Madison
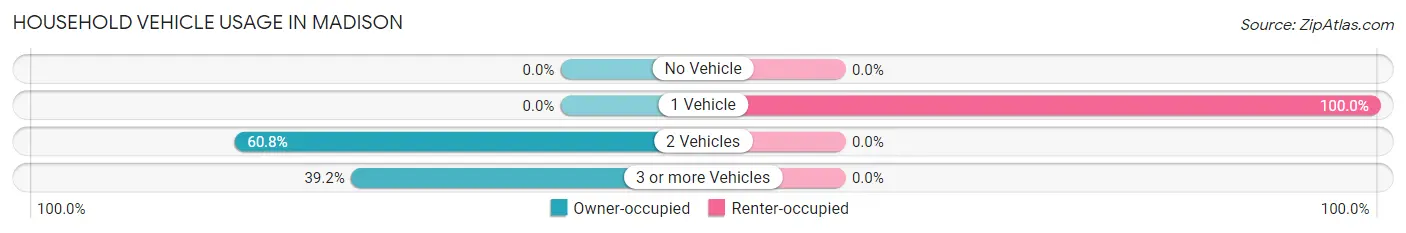
| Vehicles per Household | Owner-occupied | Renter-occupied |
| No Vehicle | 0 (0.0%) | 0 (0.0%) |
| 1 Vehicle | 0 (0.0%) | 32 (100.0%) |
| 2 Vehicles | 87 (60.8%) | 0 (0.0%) |
| 3 or more Vehicles | 56 (39.2%) | 0 (0.0%) |
| Total | 143 (100.0%) | 32 (100.0%) |
Real Estate & Mortgages in Madison
Real Estate and Mortgage Overview in Madison
| Characteristic | Without Mortgage | With Mortgage |
| Housing Units | 106 | 37 |
| Median Property Value | $173,100 | $0 |
| Median Household Income | - | - |
| Monthly Housing Costs | - | - |
| Real Estate Taxes | $662 | $27 |
Property Value by Mortgage Status in Madison
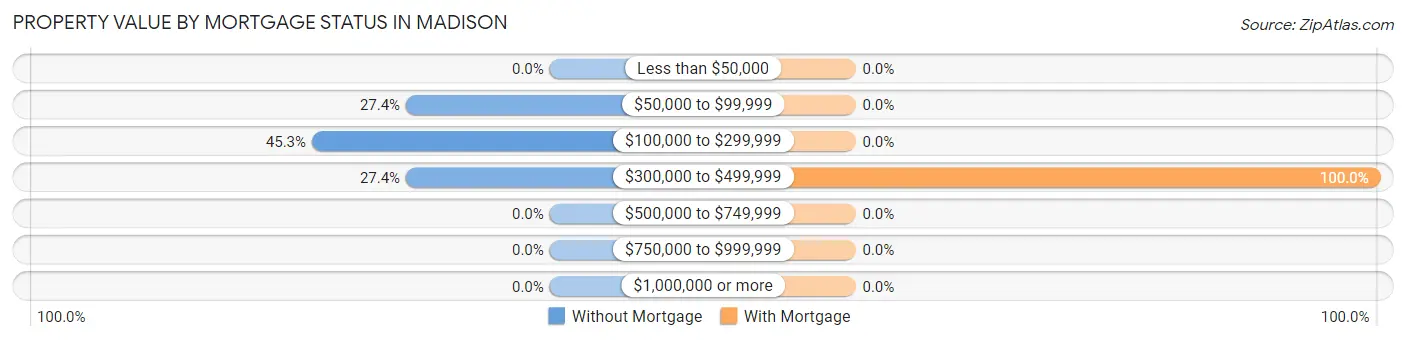
| Property Value | Without Mortgage | With Mortgage |
| Less than $50,000 | 0 (0.0%) | 0 (0.0%) |
| $50,000 to $99,999 | 29 (27.4%) | 0 (0.0%) |
| $100,000 to $299,999 | 48 (45.3%) | 0 (0.0%) |
| $300,000 to $499,999 | 29 (27.4%) | 37 (100.0%) |
| $500,000 to $749,999 | 0 (0.0%) | 0 (0.0%) |
| $750,000 to $999,999 | 0 (0.0%) | 0 (0.0%) |
| $1,000,000 or more | 0 (0.0%) | 0 (0.0%) |
| Total | 106 (100.0%) | 37 (100.0%) |
Household Income by Mortgage Status in Madison
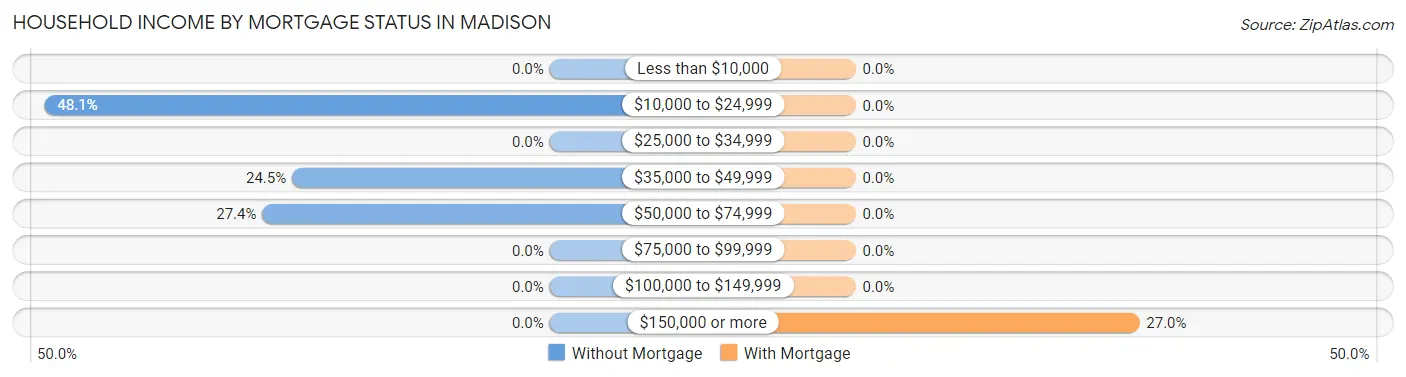
| Household Income | Without Mortgage | With Mortgage |
| Less than $10,000 | 0 (0.0%) | 0 (0.0%) |
| $10,000 to $24,999 | 51 (48.1%) | 0 (0.0%) |
| $25,000 to $34,999 | 0 (0.0%) | 0 (0.0%) |
| $35,000 to $49,999 | 26 (24.5%) | 0 (0.0%) |
| $50,000 to $74,999 | 29 (27.4%) | 0 (0.0%) |
| $75,000 to $99,999 | 0 (0.0%) | 0 (0.0%) |
| $100,000 to $149,999 | 0 (0.0%) | 0 (0.0%) |
| $150,000 or more | 0 (0.0%) | 10 (27.0%) |
| Total | 106 (100.0%) | 37 (100.0%) |
Property Value to Household Income Ratio in Madison
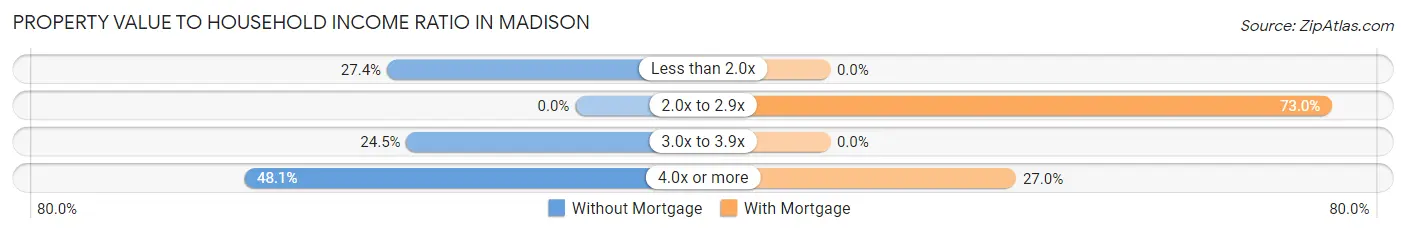
| Value-to-Income Ratio | Without Mortgage | With Mortgage |
| Less than 2.0x | 29 (27.4%) | 0 (0.0%) |
| 2.0x to 2.9x | 0 (0.0%) | 27 (73.0%) |
| 3.0x to 3.9x | 26 (24.5%) | 0 (0.0%) |
| 4.0x or more | 51 (48.1%) | 10 (27.0%) |
| Total | 106 (100.0%) | 37 (100.0%) |
Real Estate Taxes by Mortgage Status in Madison
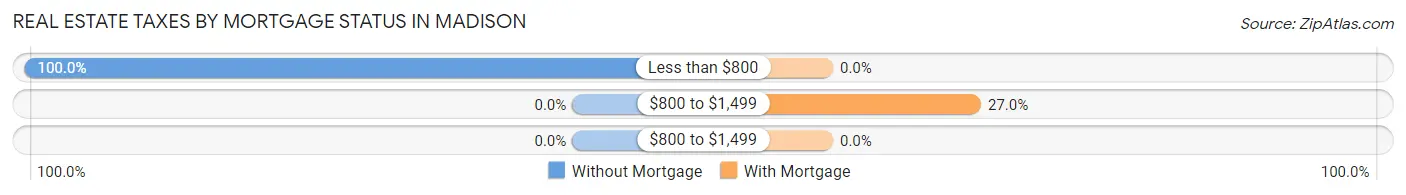
| Property Taxes | Without Mortgage | With Mortgage |
| Less than $800 | 106 (100.0%) | 0 (0.0%) |
| $800 to $1,499 | 0 (0.0%) | 10 (27.0%) |
| $800 to $1,499 | 0 (0.0%) | 0 (0.0%) |
| Total | 106 (100.0%) | 37 (100.0%) |
Health & Disability in Madison
Health Insurance Coverage by Age in Madison
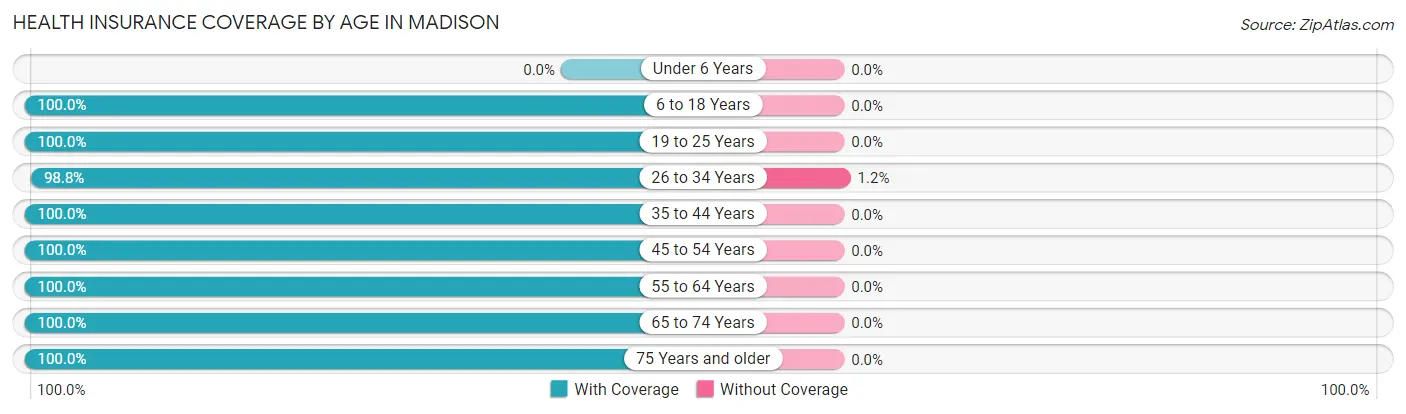
| Age Bracket | With Coverage | Without Coverage |
| Under 6 Years | 0 (0.0%) | 0 (0.0%) |
| 6 to 18 Years | 1 (100.0%) | 0 (0.0%) |
| 19 to 25 Years | 26 (100.0%) | 0 (0.0%) |
| 26 to 34 Years | 83 (98.8%) | 1 (1.2%) |
| 35 to 44 Years | 32 (100.0%) | 0 (0.0%) |
| 45 to 54 Years | 67 (100.0%) | 0 (0.0%) |
| 55 to 64 Years | 54 (100.0%) | 0 (0.0%) |
| 65 to 74 Years | 145 (100.0%) | 0 (0.0%) |
| 75 Years and older | 46 (100.0%) | 0 (0.0%) |
| Total | 454 (99.8%) | 1 (0.2%) |
Health Insurance Coverage by Citizenship Status in Madison
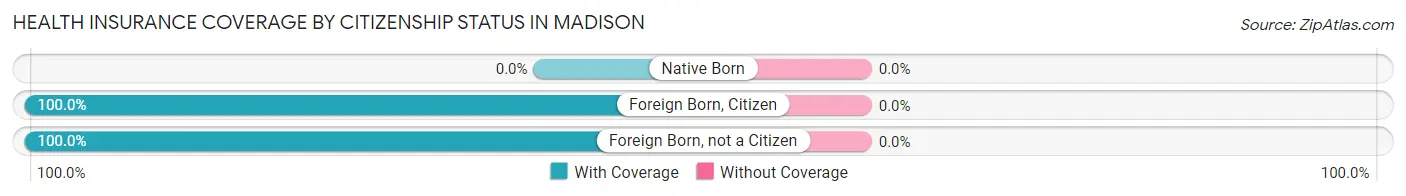
| Citizenship Status | With Coverage | Without Coverage |
| Native Born | 0 (0.0%) | 0 (0.0%) |
| Foreign Born, Citizen | 1 (100.0%) | 0 (0.0%) |
| Foreign Born, not a Citizen | 26 (100.0%) | 0 (0.0%) |
Health Insurance Coverage by Household Income in Madison
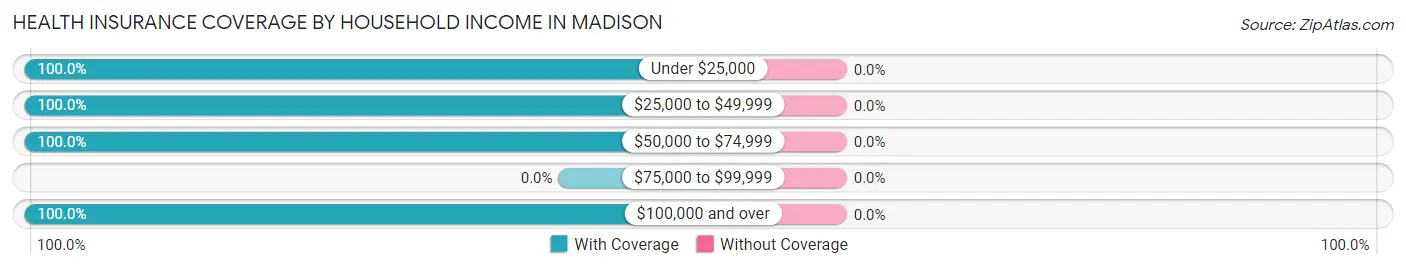
| Household Income | With Coverage | Without Coverage |
| Under $25,000 | 108 (100.0%) | 0 (0.0%) |
| $25,000 to $49,999 | 122 (100.0%) | 0 (0.0%) |
| $50,000 to $74,999 | 55 (100.0%) | 0 (0.0%) |
| $75,000 to $99,999 | 0 (0.0%) | 0 (0.0%) |
| $100,000 and over | 165 (100.0%) | 0 (0.0%) |
Public vs Private Health Insurance Coverage by Age in Madison
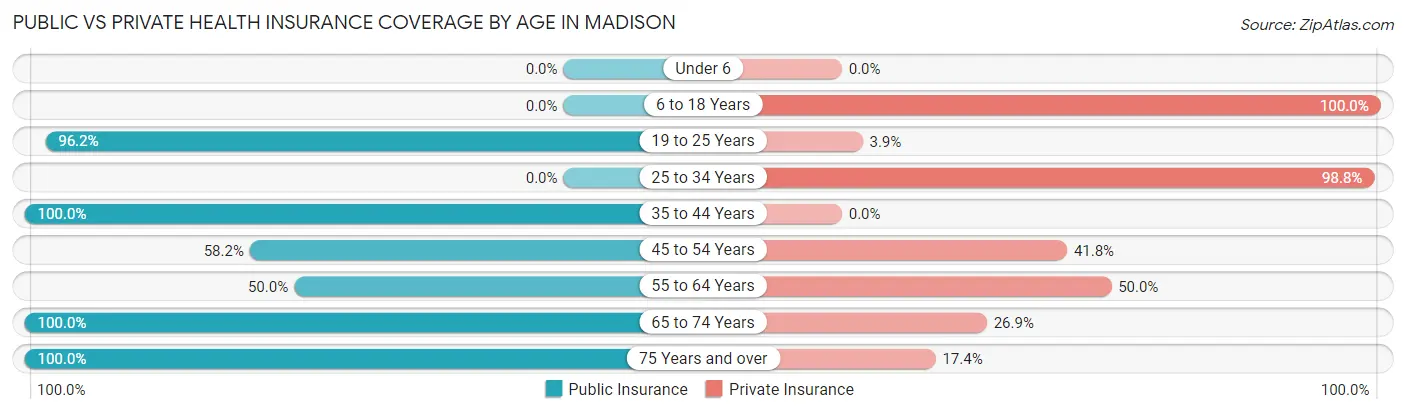
| Age Bracket | Public Insurance | Private Insurance |
| Under 6 | 0 (0.0%) | 0 (0.0%) |
| 6 to 18 Years | 0 (0.0%) | 1 (100.0%) |
| 19 to 25 Years | 25 (96.2%) | 1 (3.8%) |
| 25 to 34 Years | 0 (0.0%) | 83 (98.8%) |
| 35 to 44 Years | 32 (100.0%) | 0 (0.0%) |
| 45 to 54 Years | 39 (58.2%) | 28 (41.8%) |
| 55 to 64 Years | 27 (50.0%) | 27 (50.0%) |
| 65 to 74 Years | 145 (100.0%) | 39 (26.9%) |
| 75 Years and over | 46 (100.0%) | 8 (17.4%) |
| Total | 314 (69.0%) | 187 (41.1%) |
Disability Status by Sex by Age in Madison
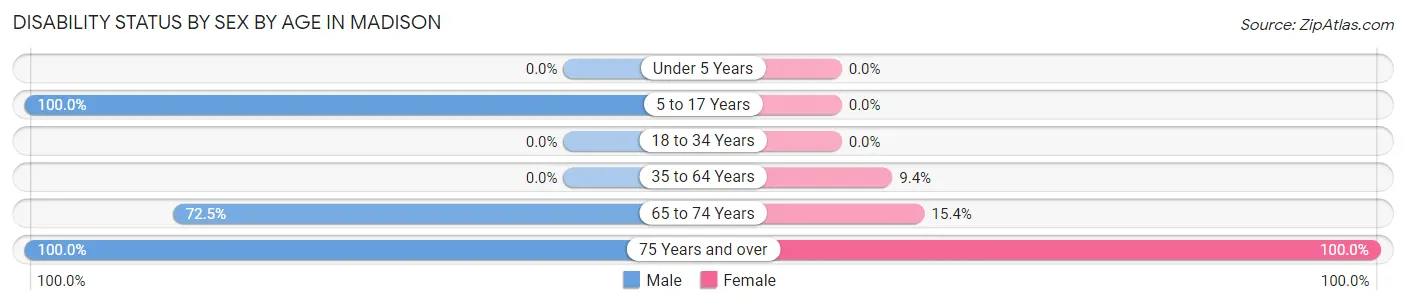
| Age Bracket | Male | Female |
| Under 5 Years | 0 (0.0%) | 0 (0.0%) |
| 5 to 17 Years | 1 (100.0%) | 0 (0.0%) |
| 18 to 34 Years | 0 (0.0%) | 0 (0.0%) |
| 35 to 64 Years | 0 (0.0%) | 9 (9.4%) |
| 65 to 74 Years | 58 (72.5%) | 10 (15.4%) |
| 75 Years and over | 8 (100.0%) | 38 (100.0%) |
Disability Class by Sex by Age in Madison
Disability Class: Hearing Difficulty
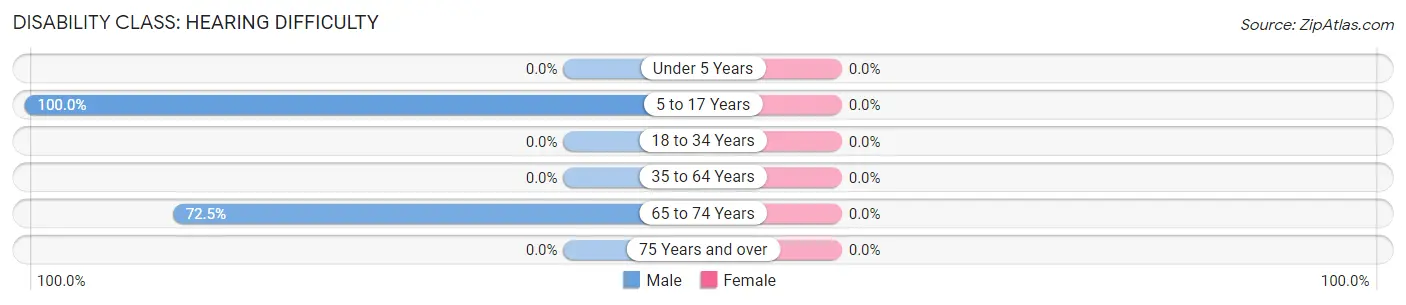
| Age Bracket | Male | Female |
| Under 5 Years | 0 (0.0%) | 0 (0.0%) |
| 5 to 17 Years | 1 (100.0%) | 0 (0.0%) |
| 18 to 34 Years | 0 (0.0%) | 0 (0.0%) |
| 35 to 64 Years | 0 (0.0%) | 0 (0.0%) |
| 65 to 74 Years | 58 (72.5%) | 0 (0.0%) |
| 75 Years and over | 0 (0.0%) | 0 (0.0%) |
Disability Class: Vision Difficulty
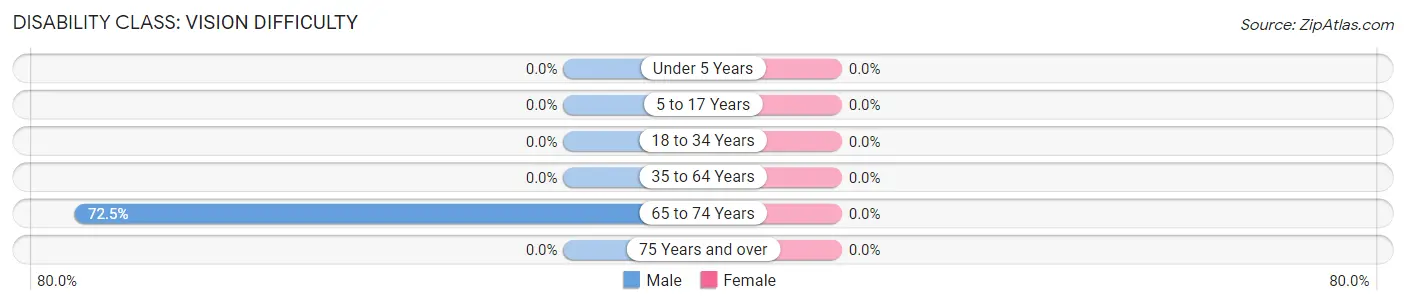
| Age Bracket | Male | Female |
| Under 5 Years | 0 (0.0%) | 0 (0.0%) |
| 5 to 17 Years | 0 (0.0%) | 0 (0.0%) |
| 18 to 34 Years | 0 (0.0%) | 0 (0.0%) |
| 35 to 64 Years | 0 (0.0%) | 0 (0.0%) |
| 65 to 74 Years | 58 (72.5%) | 0 (0.0%) |
| 75 Years and over | 0 (0.0%) | 0 (0.0%) |
Disability Class: Cognitive Difficulty
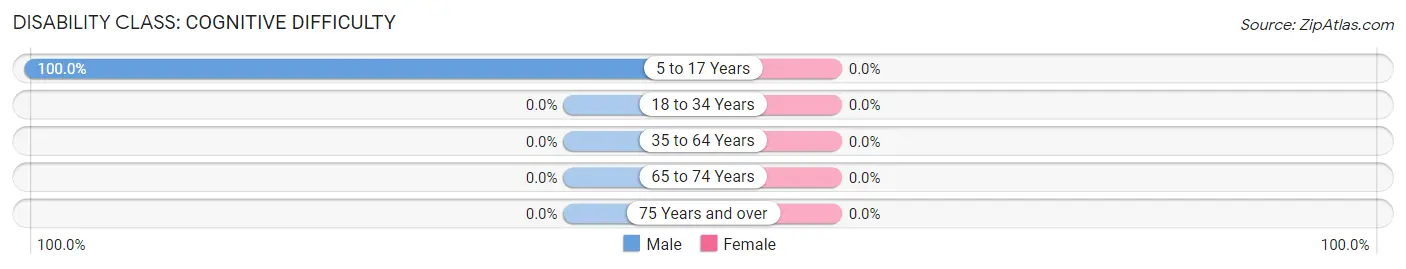
| Age Bracket | Male | Female |
| 5 to 17 Years | 1 (100.0%) | 0 (0.0%) |
| 18 to 34 Years | 0 (0.0%) | 0 (0.0%) |
| 35 to 64 Years | 0 (0.0%) | 0 (0.0%) |
| 65 to 74 Years | 0 (0.0%) | 0 (0.0%) |
| 75 Years and over | 0 (0.0%) | 0 (0.0%) |
Disability Class: Ambulatory Difficulty
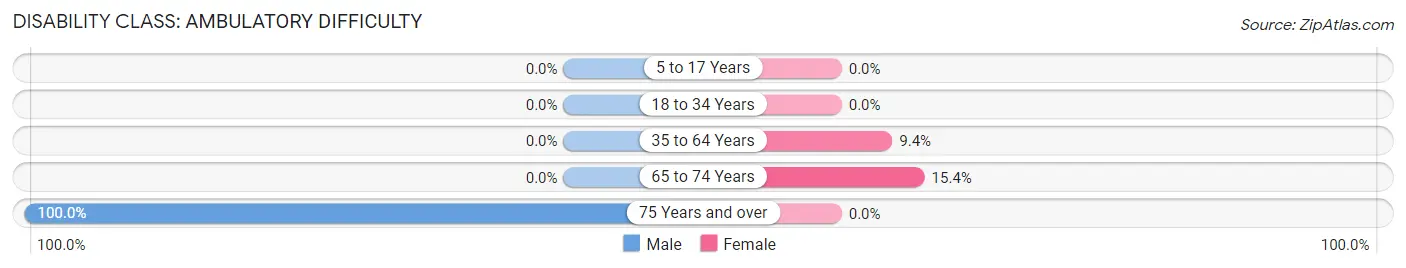
| Age Bracket | Male | Female |
| 5 to 17 Years | 0 (0.0%) | 0 (0.0%) |
| 18 to 34 Years | 0 (0.0%) | 0 (0.0%) |
| 35 to 64 Years | 0 (0.0%) | 9 (9.4%) |
| 65 to 74 Years | 0 (0.0%) | 10 (15.4%) |
| 75 Years and over | 8 (100.0%) | 0 (0.0%) |
Disability Class: Self-Care Difficulty
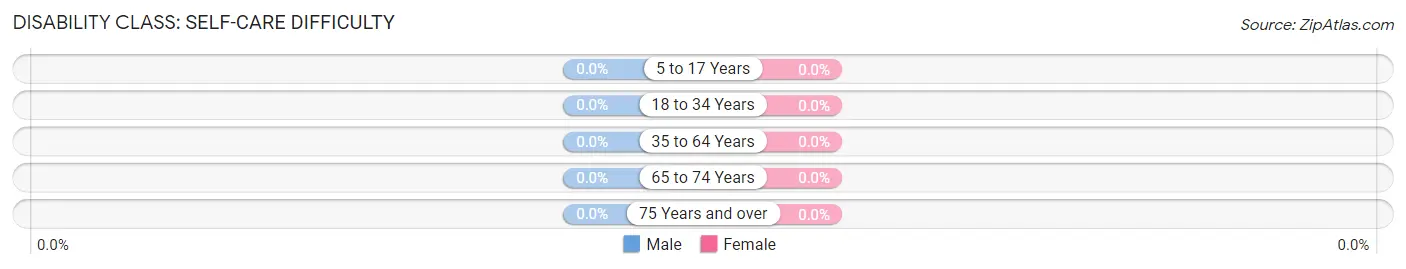
| Age Bracket | Male | Female |
| 5 to 17 Years | 0 (0.0%) | 0 (0.0%) |
| 18 to 34 Years | 0 (0.0%) | 0 (0.0%) |
| 35 to 64 Years | 0 (0.0%) | 0 (0.0%) |
| 65 to 74 Years | 0 (0.0%) | 0 (0.0%) |
| 75 Years and over | 0 (0.0%) | 0 (0.0%) |
Technology Access in Madison
Computing Device Access in Madison
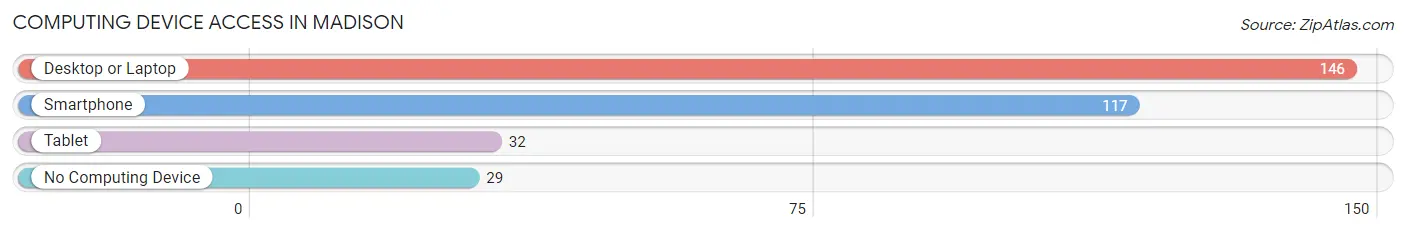
| Device Type | # Households | % Households |
| Desktop or Laptop | 146 | 83.4% |
| Smartphone | 117 | 66.9% |
| Tablet | 32 | 18.3% |
| No Computing Device | 29 | 16.6% |
| Total | 175 | 100.0% |
Internet Access in Madison
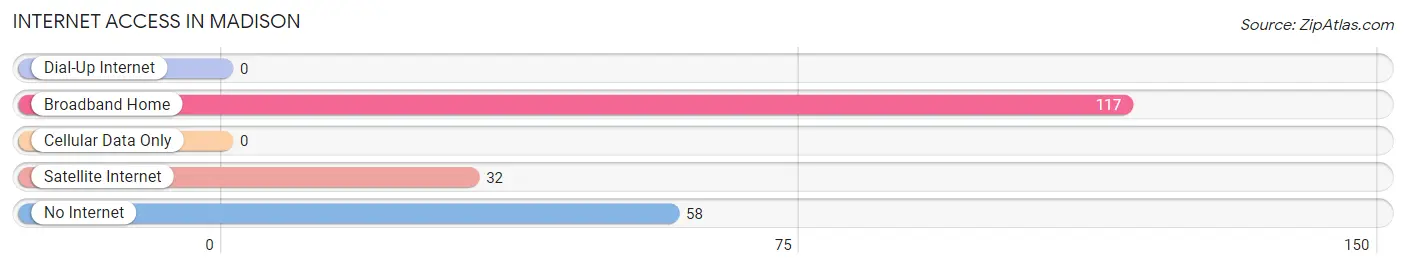
| Internet Type | # Households | % Households |
| Dial-Up Internet | 0 | 0.0% |
| Broadband Home | 117 | 66.9% |
| Cellular Data Only | 0 | 0.0% |
| Satellite Internet | 32 | 18.3% |
| No Internet | 58 | 33.1% |
| Total | 175 | 100.0% |
Madison Summary
Madison is a small city located in Yolo County, California. It is situated in the Central Valley, about 20 miles west of Sacramento. The city has a population of approximately 2,500 people and covers an area of 1.2 square miles.
History
The area that is now Madison was originally inhabited by the Patwin Native American tribe. The first European settlers arrived in the area in the mid-1800s, and the city was officially incorporated in 1876. The city was named after James Madison, the fourth President of the United States.
In the early 1900s, Madison was a thriving agricultural community, with many farms and orchards. The city was also home to a number of businesses, including a cannery, a creamery, and a brickyard.
Geography
Madison is located in the Central Valley of California, about 20 miles west of Sacramento. The city is situated on the banks of the Yolo Bypass, a flood control channel that connects the Sacramento and San Joaquin Rivers.
The city has a Mediterranean climate, with hot, dry summers and mild, wet winters. The average annual temperature is around 60 degrees Fahrenheit, and the average annual precipitation is around 20 inches.
Economy
The economy of Madison is largely based on agriculture. The city is home to a number of farms and orchards, which produce a variety of crops, including tomatoes, corn, and almonds.
The city is also home to a number of businesses, including a winery, a brewery, and a distillery. In addition, Madison is home to a number of retail stores, restaurants, and other businesses.
Demographics
As of the 2010 census, the population of Madison was 2,500. The racial makeup of the city was 75.2% White, 0.8% African American, 0.4% Native American, 0.8% Asian, 0.1% Pacific Islander, 19.2% from other races, and 3.5% from two or more races. Hispanic or Latino of any race were 33.2% of the population.
The median household income in Madison was $45,000, and the median family income was $50,000. The per capita income was $20,000. About 15.2% of the population was below the poverty line.
Common Questions
What is Per Capita Income in Madison?
Per Capita income in Madison is $27,542.
What is Inequality or Gini Index in Madison?
Inequality or Gini Index in Madison is 0.52.
What is the Total Population of Madison?
Total Population of Madison is 455.
What is the Total Male Population of Madison?
Total Male Population of Madison is 177.
What is the Total Female Population of Madison?
Total Female Population of Madison is 278.
What is the Ratio of Males per 100 Females in Madison?
There are 63.67 Males per 100 Females in Madison.
What is the Ratio of Females per 100 Males in Madison?
There are 157.06 Females per 100 Males in Madison.
What is the Median Population Age in Madison?
Median Population Age in Madison is 57.6 Years.
What is the Average Family Size in Madison
Average Family Size in Madison is 3.2 People.
What is the Average Household Size in Madison
Average Household Size in Madison is 2.6 People.
How Large is the Labor Force in Madison?
There are 208 People in the Labor Forcein in Madison.
What is the Percentage of People in the Labor Force in Madison?
45.7% of People are in the Labor Force in Madison.