Crows Landing, CA Map & Demographics
Crows Landing Map
Crows Landing Overview
$28,580
PER CAPITA INCOME
$34,648
AVG HOUSEHOLD INCOME
0.34
INEQUALITY / GINI INDEX
212
TOTAL POPULATION
110
MALE POPULATION
102
FEMALE POPULATION
107.84
MALES / 100 FEMALES
92.73
FEMALES / 100 MALES
45.4
MEDIAN AGE
2.6
AVG FAMILY SIZE
1.8
AVG HOUSEHOLD SIZE
99
LABOR FORCE [ PEOPLE ]
51.3%
PERCENT IN LABOR FORCE
Crows Landing Zip Codes
Crows Landing Area Codes
Income in Crows Landing
Income Overview in Crows Landing
| Characteristic | Number | Measure |
| Per Capita Income | 212 | $28,580 |
| Median Family Income | 46 | $0 |
| Mean Family Income | 46 | $68,520 |
| Median Household Income | 121 | $34,648 |
| Mean Household Income | 121 | $49,136 |
| Income Deficit | 46 | $0 |
| Wage / Income Gap (%) | 212 | 0.00% |
| Wage / Income Gap ($) | 212 | 100.00¢ per $1 |
| Gini / Inequality Index | 212 | 0.34 |
Earnings by Sex in Crows Landing
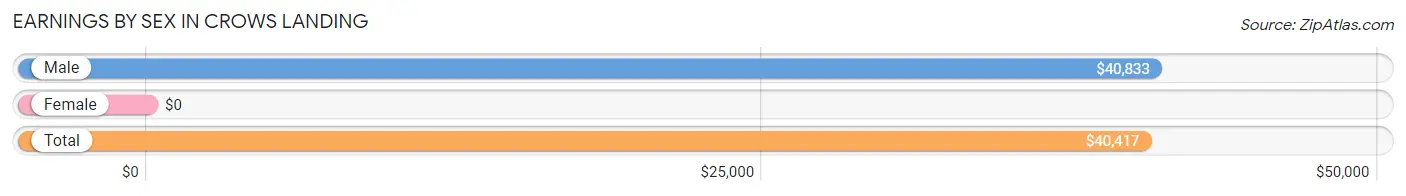
| Sex | Number | Average Earnings |
| Male | 88 (76.5%) | $40,833 |
| Female | 27 (23.5%) | $0 |
| Total | 115 (100.0%) | $40,417 |
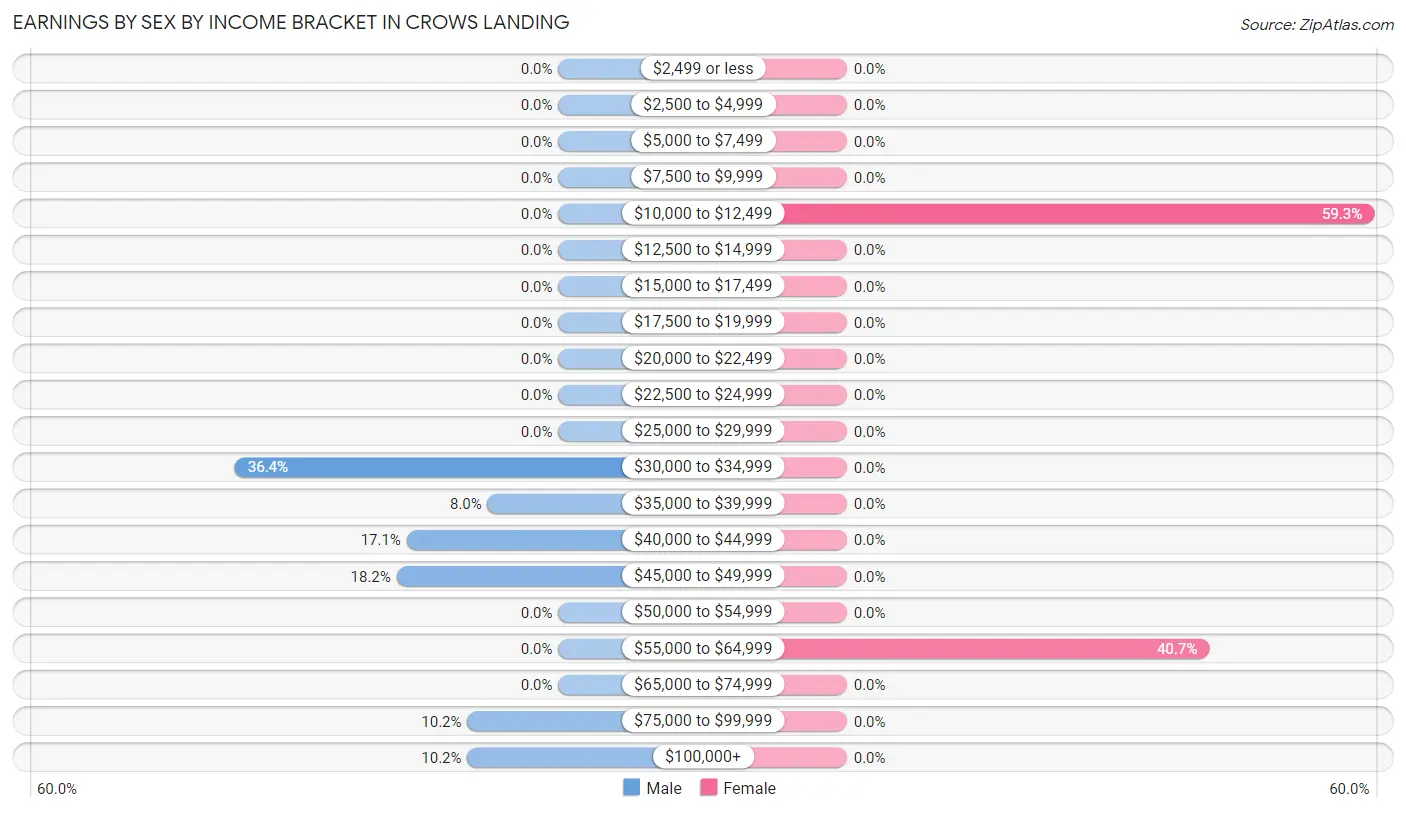
Earnings by Sex by Income Bracket in Crows Landing
The most common earnings brackets in Crows Landing are $30,000 to $34,999 for men (32 | 36.4%) and $10,000 to $12,499 for women (16 | 59.3%).
| Income | Male | Female |
| $2,499 or less | 0 (0.0%) | 0 (0.0%) |
| $2,500 to $4,999 | 0 (0.0%) | 0 (0.0%) |
| $5,000 to $7,499 | 0 (0.0%) | 0 (0.0%) |
| $7,500 to $9,999 | 0 (0.0%) | 0 (0.0%) |
| $10,000 to $12,499 | 0 (0.0%) | 16 (59.3%) |
| $12,500 to $14,999 | 0 (0.0%) | 0 (0.0%) |
| $15,000 to $17,499 | 0 (0.0%) | 0 (0.0%) |
| $17,500 to $19,999 | 0 (0.0%) | 0 (0.0%) |
| $20,000 to $22,499 | 0 (0.0%) | 0 (0.0%) |
| $22,500 to $24,999 | 0 (0.0%) | 0 (0.0%) |
| $25,000 to $29,999 | 0 (0.0%) | 0 (0.0%) |
| $30,000 to $34,999 | 32 (36.4%) | 0 (0.0%) |
| $35,000 to $39,999 | 7 (8.0%) | 0 (0.0%) |
| $40,000 to $44,999 | 15 (17.1%) | 0 (0.0%) |
| $45,000 to $49,999 | 16 (18.2%) | 0 (0.0%) |
| $50,000 to $54,999 | 0 (0.0%) | 0 (0.0%) |
| $55,000 to $64,999 | 0 (0.0%) | 11 (40.7%) |
| $65,000 to $74,999 | 0 (0.0%) | 0 (0.0%) |
| $75,000 to $99,999 | 9 (10.2%) | 0 (0.0%) |
| $100,000+ | 9 (10.2%) | 0 (0.0%) |
| Total | 88 (100.0%) | 27 (100.0%) |
Earnings by Sex by Educational Attainment in Crows Landing
| Educational Attainment | Male Income | Female Income |
| Less than High School | - | - |
| High School Diploma | - | - |
| College or Associate's Degree | - | - |
| Bachelor's Degree | - | - |
| Graduate Degree | - | - |
| Total | $41,417 | $0 |
Family Income in Crows Landing
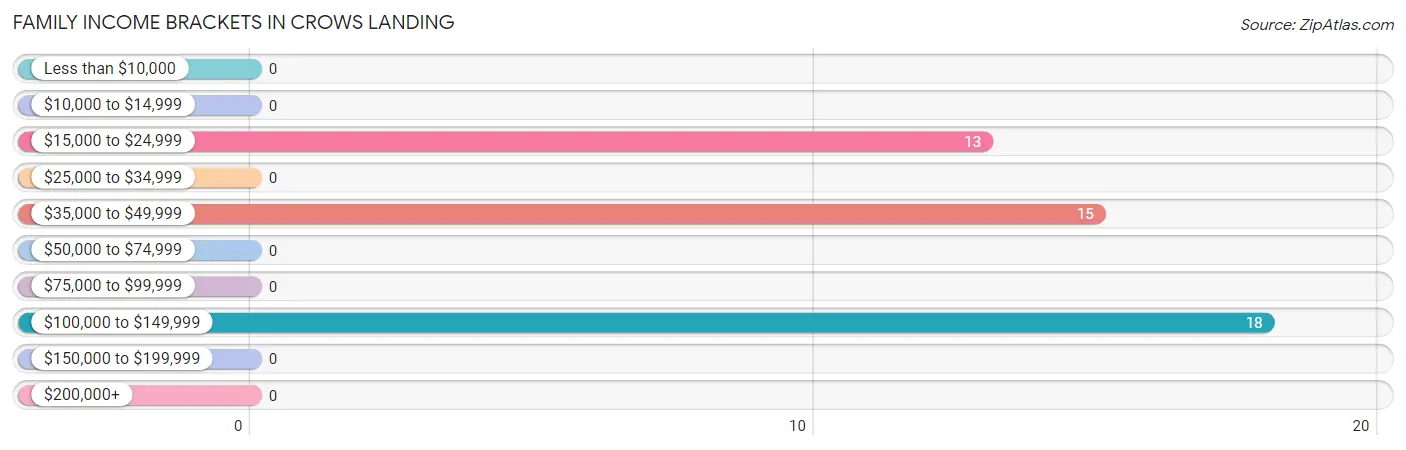
Family Income Brackets in Crows Landing
According to the Crows Landing family income data, there are 18 families falling into the $100,000 to $149,999 income range, which is the most common income bracket and makes up 39.1% of all families.
| Income Bracket | # Families | % Families |
| Less than $10,000 | 0 | 0.0% |
| $10,000 to $14,999 | 0 | 0.0% |
| $15,000 to $24,999 | 13 | 28.3% |
| $25,000 to $34,999 | 0 | 0.0% |
| $35,000 to $49,999 | 15 | 32.6% |
| $50,000 to $74,999 | 0 | 0.0% |
| $75,000 to $99,999 | 0 | 0.0% |
| $100,000 to $149,999 | 18 | 39.1% |
| $150,000 to $199,999 | 0 | 0.0% |
| $200,000+ | 0 | 0.0% |
Family Income by Famaliy Size in Crows Landing
| Income Bracket | # Families | Median Income |
| 2-Person Families | 37 (80.4%) | $0 |
| 3-Person Families | 0 (0.0%) | $0 |
| 4-Person Families | 0 (0.0%) | $0 |
| 5-Person Families | 9 (19.6%) | $0 |
| 6-Person Families | 0 (0.0%) | $0 |
| 7+ Person Families | 0 (0.0%) | $0 |
| Total | 46 (100.0%) | $0 |
Family Income by Number of Earners in Crows Landing
| Number of Earners | # Families | Median Income |
| No Earners | 13 (28.3%) | $0 |
| 1 Earner | 24 (52.2%) | $0 |
| 2 Earners | 9 (19.6%) | $0 |
| 3+ Earners | 0 (0.0%) | $0 |
| Total | 46 (100.0%) | $0 |
Household Income in Crows Landing
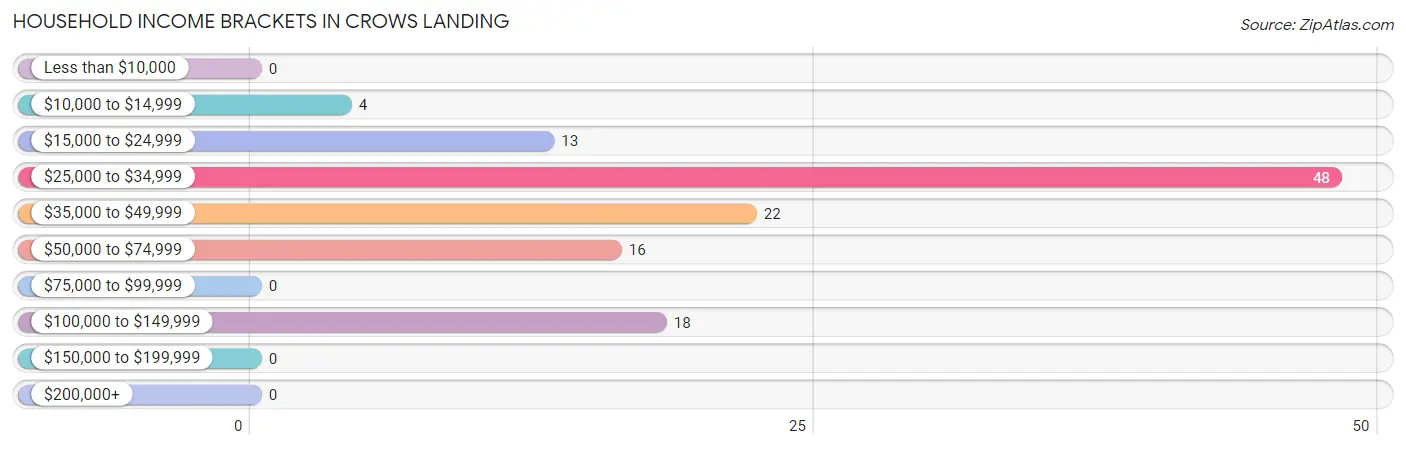
Household Income Brackets in Crows Landing
With 48 households falling in the category, the $25,000 to $34,999 income range is the most frequent in Crows Landing, accounting for 39.7% of all households.
| Income Bracket | # Households | % Households |
| Less than $10,000 | 0 | 0.0% |
| $10,000 to $14,999 | 4 | 3.3% |
| $15,000 to $24,999 | 13 | 10.7% |
| $25,000 to $34,999 | 48 | 39.7% |
| $35,000 to $49,999 | 22 | 18.2% |
| $50,000 to $74,999 | 16 | 13.2% |
| $75,000 to $99,999 | 0 | 0.0% |
| $100,000 to $149,999 | 18 | 14.9% |
| $150,000 to $199,999 | 0 | 0.0% |
| $200,000+ | 0 | 0.0% |
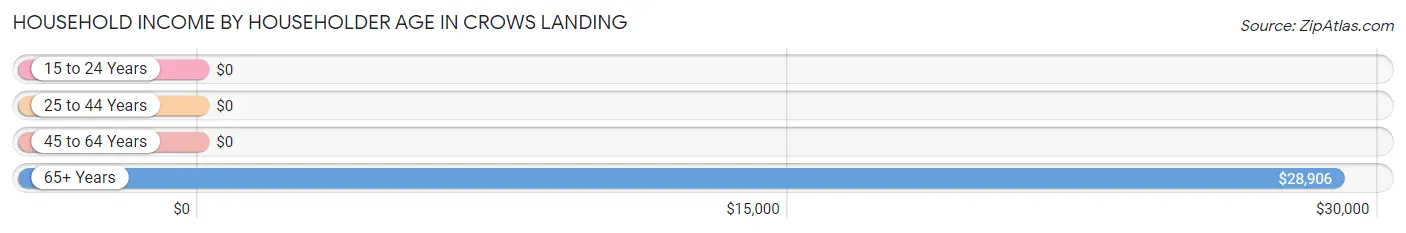
Household Income by Householder Age in Crows Landing
The median household income in Crows Landing is $34,648, with the highest median household income of $28,906 found in the 65+ years age bracket for the primary householder. A total of 44 households (36.4%) fall into this category. Meanwhile, the 15 to 24 years age bracket for the primary householder has the lowest median household income of $0, with 7 households (5.8%) in this group.
| Income Bracket | # Households | Median Income |
| 15 to 24 Years | 7 (5.8%) | $0 |
| 25 to 44 Years | 25 (20.7%) | $0 |
| 45 to 64 Years | 45 (37.2%) | $0 |
| 65+ Years | 44 (36.4%) | $28,906 |
| Total | 121 (100.0%) | $34,648 |
Poverty in Crows Landing
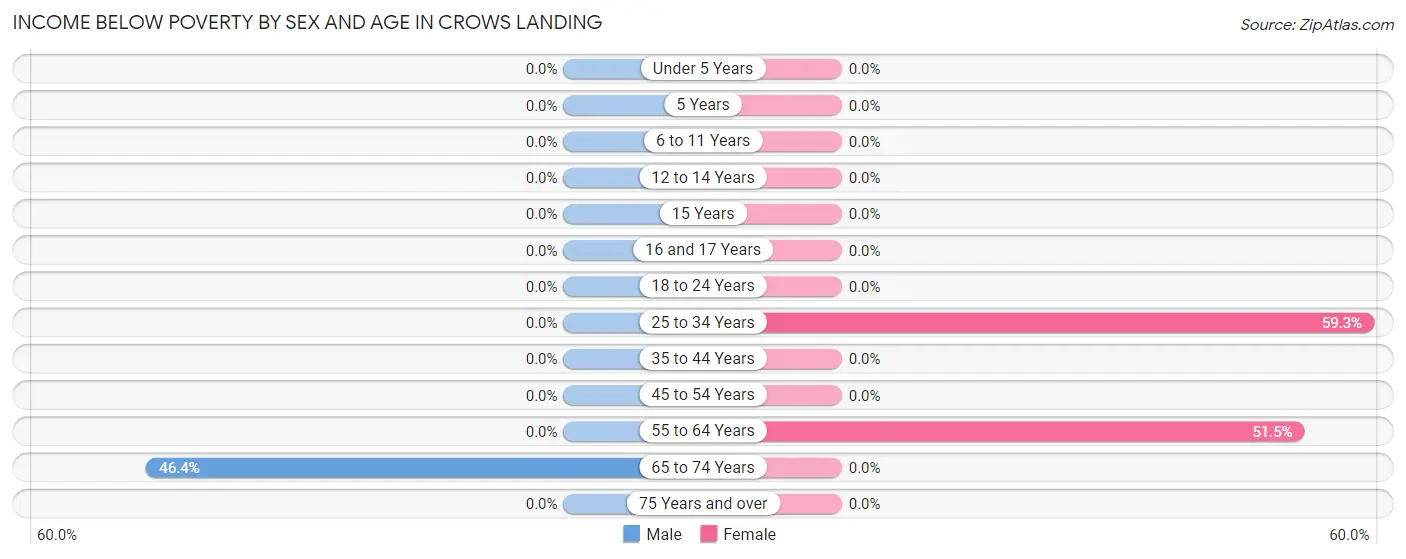
Income Below Poverty by Sex and Age in Crows Landing
With 11.8% poverty level for males and 32.4% for females among the residents of Crows Landing, 65 to 74 year old males and 25 to 34 year old females are the most vulnerable to poverty, with 13 males (46.4%) and 16 females (59.3%) in their respective age groups living below the poverty level.
| Age Bracket | Male | Female |
| Under 5 Years | 0 (0.0%) | 0 (0.0%) |
| 5 Years | 0 (0.0%) | 0 (0.0%) |
| 6 to 11 Years | 0 (0.0%) | 0 (0.0%) |
| 12 to 14 Years | 0 (0.0%) | 0 (0.0%) |
| 15 Years | 0 (0.0%) | 0 (0.0%) |
| 16 and 17 Years | 0 (0.0%) | 0 (0.0%) |
| 18 to 24 Years | 0 (0.0%) | 0 (0.0%) |
| 25 to 34 Years | 0 (0.0%) | 16 (59.3%) |
| 35 to 44 Years | 0 (0.0%) | 0 (0.0%) |
| 45 to 54 Years | 0 (0.0%) | 0 (0.0%) |
| 55 to 64 Years | 0 (0.0%) | 17 (51.5%) |
| 65 to 74 Years | 13 (46.4%) | 0 (0.0%) |
| 75 Years and over | 0 (0.0%) | 0 (0.0%) |
| Total | 13 (11.8%) | 33 (32.4%) |
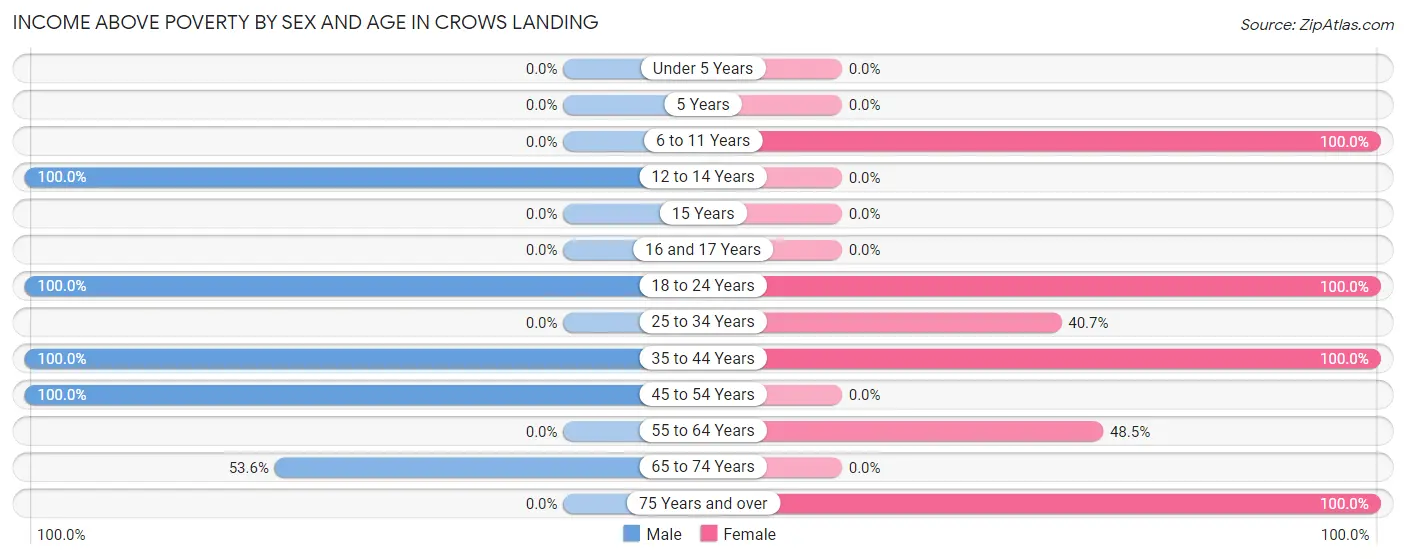
Income Above Poverty by Sex and Age in Crows Landing
According to the poverty statistics in Crows Landing, males aged 12 to 14 years and females aged 6 to 11 years are the age groups that are most secure financially, with 100.0% of males and 100.0% of females in these age groups living above the poverty line.
| Age Bracket | Male | Female |
| Under 5 Years | 0 (0.0%) | 0 (0.0%) |
| 5 Years | 0 (0.0%) | 0 (0.0%) |
| 6 to 11 Years | 0 (0.0%) | 10 (100.0%) |
| 12 to 14 Years | 9 (100.0%) | 0 (0.0%) |
| 15 Years | 0 (0.0%) | 0 (0.0%) |
| 16 and 17 Years | 0 (0.0%) | 0 (0.0%) |
| 18 to 24 Years | 7 (100.0%) | 8 (100.0%) |
| 25 to 34 Years | 0 (0.0%) | 11 (40.7%) |
| 35 to 44 Years | 25 (100.0%) | 8 (100.0%) |
| 45 to 54 Years | 41 (100.0%) | 0 (0.0%) |
| 55 to 64 Years | 0 (0.0%) | 16 (48.5%) |
| 65 to 74 Years | 15 (53.6%) | 0 (0.0%) |
| 75 Years and over | 0 (0.0%) | 16 (100.0%) |
| Total | 97 (88.2%) | 69 (67.6%) |
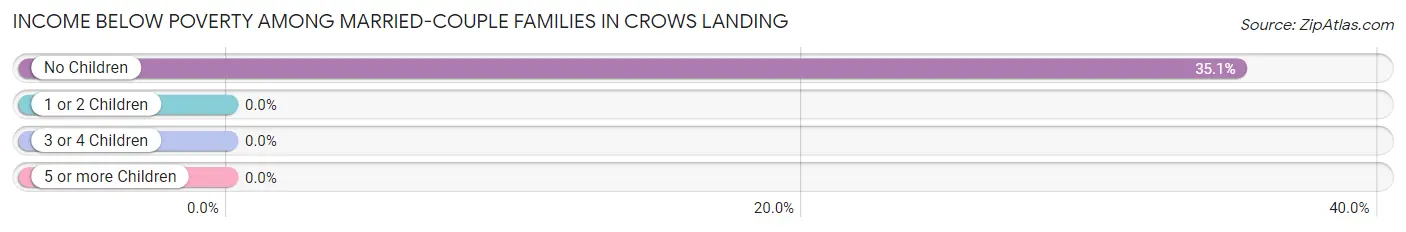
Income Below Poverty Among Married-Couple Families in Crows Landing
The poverty statistics for married-couple families in Crows Landing show that 28.3% or 13 of the total 46 families live below the poverty line. Families with no children have the highest poverty rate of 35.1%, comprising of 13 families. On the other hand, families with 1 or 2 children have the lowest poverty rate of 0.0%, which includes 0 families.
| Children | Above Poverty | Below Poverty |
| No Children | 24 (64.9%) | 13 (35.1%) |
| 1 or 2 Children | 9 (100.0%) | 0 (0.0%) |
| 3 or 4 Children | 0 (0.0%) | 0 (0.0%) |
| 5 or more Children | 0 (0.0%) | 0 (0.0%) |
| Total | 33 (71.7%) | 13 (28.3%) |
Income Below Poverty Among Single-Parent Households in Crows Landing
| Children | Single Father | Single Mother |
| No Children | 0 (0.0%) | 0 (0.0%) |
| 1 or 2 Children | 0 (0.0%) | 0 (0.0%) |
| 3 or 4 Children | 0 (0.0%) | 0 (0.0%) |
| 5 or more Children | 0 (0.0%) | 0 (0.0%) |
| Total | 0 (0.0%) | 0 (0.0%) |
Income Below Poverty Among Married-Couple vs Single-Parent Households in Crows Landing
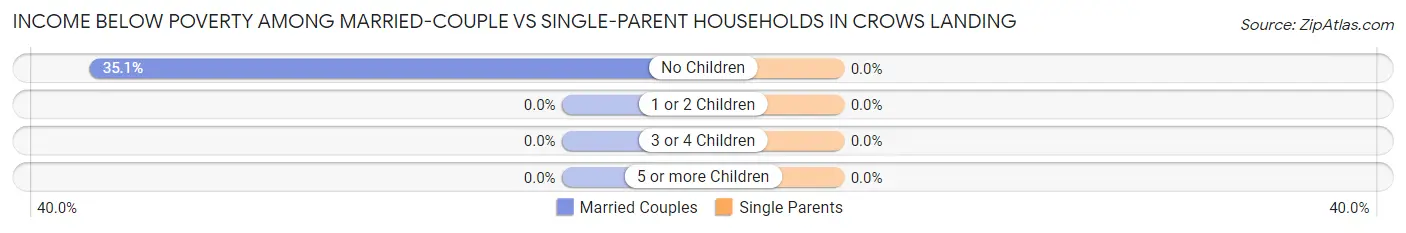
| Children | Married-Couple Families | Single-Parent Households |
| No Children | 13 (35.1%) | 0 (0.0%) |
| 1 or 2 Children | 0 (0.0%) | 0 (0.0%) |
| 3 or 4 Children | 0 (0.0%) | 0 (0.0%) |
| 5 or more Children | 0 (0.0%) | 0 (0.0%) |
| Total | 13 (28.3%) | 0 (0.0%) |
Race in Crows Landing
The most populous races in Crows Landing are Hispanic or Latino (165 | 77.8%), White / Caucasian (154 | 72.6%), and Two or more Races (58 | 27.4%).
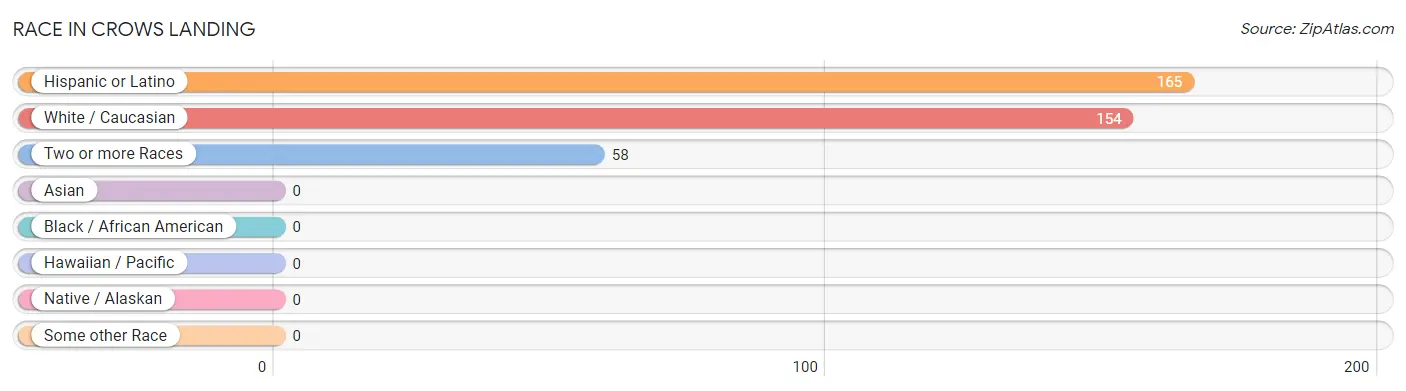
| Race | # Population | % Population |
| Asian | 0 | 0.0% |
| Black / African American | 0 | 0.0% |
| Hawaiian / Pacific | 0 | 0.0% |
| Hispanic or Latino | 165 | 77.8% |
| Native / Alaskan | 0 | 0.0% |
| White / Caucasian | 154 | 72.6% |
| Two or more Races | 58 | 27.4% |
| Some other Race | 0 | 0.0% |
| Total | 212 | 100.0% |
Ancestry in Crows Landing
The most populous ancestries reported in Crows Landing are Mexican (165 | 77.8%), American (23 | 10.8%), and Italian (20 | 9.4%), together accounting for 98.1% of all Crows Landing residents.
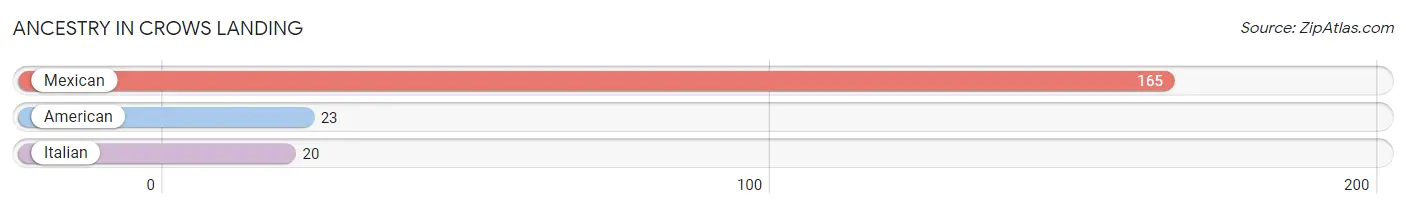
| Ancestry | # Population | % Population |
| American | 23 | 10.8% |
| Italian | 20 | 9.4% |
| Mexican | 165 | 77.8% | View All 3 Rows |
Immigrants in Crows Landing
The most numerous immigrant groups reported in Crows Landing came from Central America (106 | 50.0%), Latin America (106 | 50.0%), and Mexico (106 | 50.0%), together accounting for 150.0% of all Crows Landing residents.
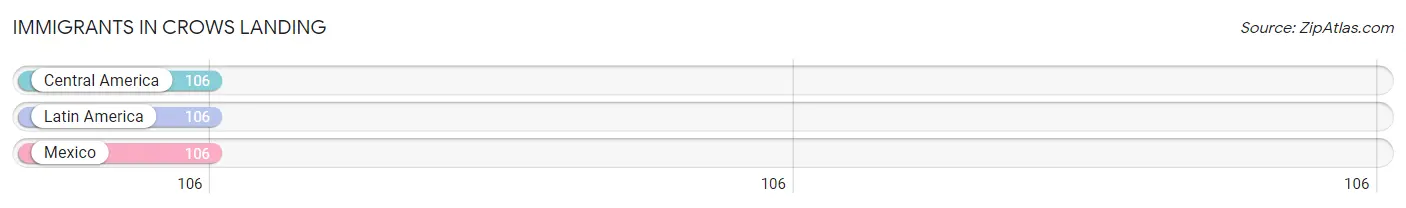
| Immigration Origin | # Population | % Population |
| Central America | 106 | 50.0% |
| Latin America | 106 | 50.0% |
| Mexico | 106 | 50.0% | View All 3 Rows |
Sex and Age in Crows Landing
Sex and Age in Crows Landing
The most populous age groups in Crows Landing are 45 to 49 Years (41 | 37.3%) for men and 30 to 34 Years (27 | 26.5%) for women.
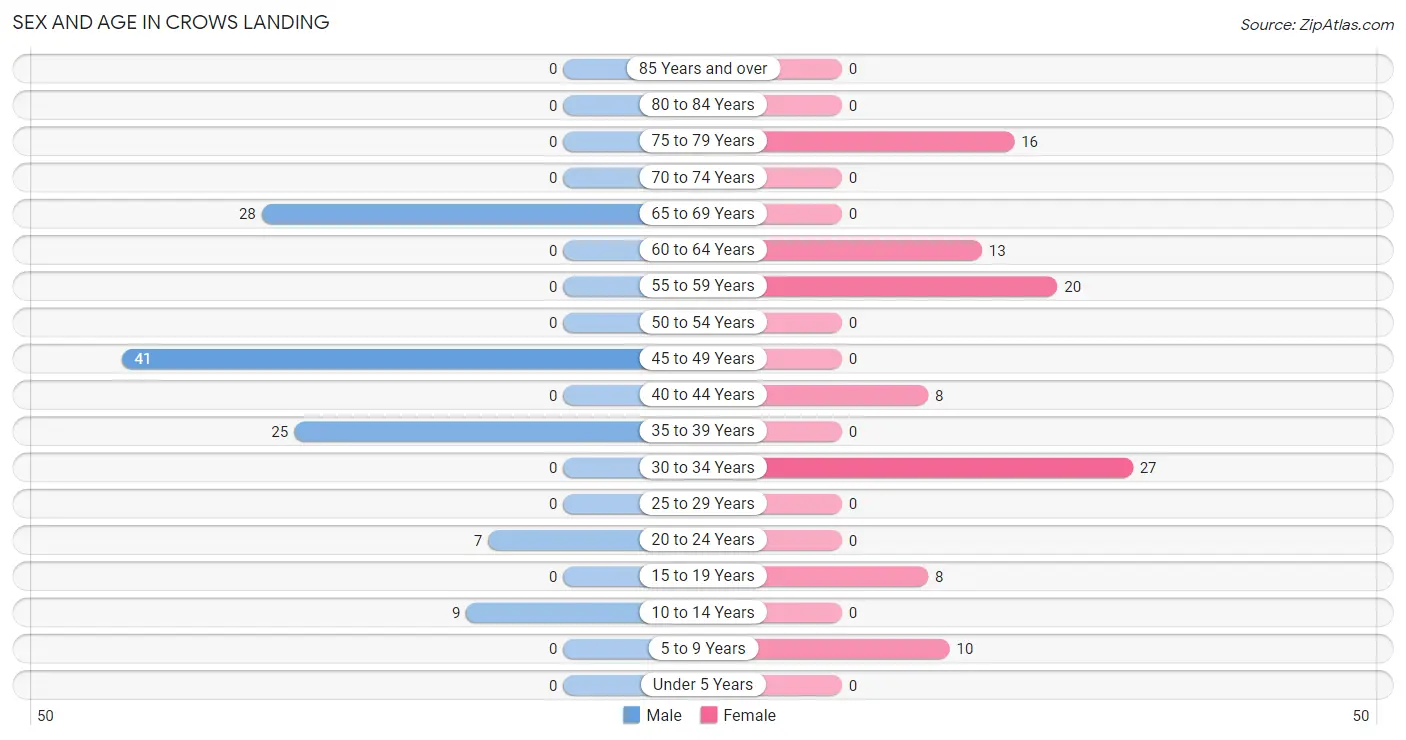
| Age Bracket | Male | Female |
| Under 5 Years | 0 (0.0%) | 0 (0.0%) |
| 5 to 9 Years | 0 (0.0%) | 10 (9.8%) |
| 10 to 14 Years | 9 (8.2%) | 0 (0.0%) |
| 15 to 19 Years | 0 (0.0%) | 8 (7.8%) |
| 20 to 24 Years | 7 (6.4%) | 0 (0.0%) |
| 25 to 29 Years | 0 (0.0%) | 0 (0.0%) |
| 30 to 34 Years | 0 (0.0%) | 27 (26.5%) |
| 35 to 39 Years | 25 (22.7%) | 0 (0.0%) |
| 40 to 44 Years | 0 (0.0%) | 8 (7.8%) |
| 45 to 49 Years | 41 (37.3%) | 0 (0.0%) |
| 50 to 54 Years | 0 (0.0%) | 0 (0.0%) |
| 55 to 59 Years | 0 (0.0%) | 20 (19.6%) |
| 60 to 64 Years | 0 (0.0%) | 13 (12.8%) |
| 65 to 69 Years | 28 (25.5%) | 0 (0.0%) |
| 70 to 74 Years | 0 (0.0%) | 0 (0.0%) |
| 75 to 79 Years | 0 (0.0%) | 16 (15.7%) |
| 80 to 84 Years | 0 (0.0%) | 0 (0.0%) |
| 85 Years and over | 0 (0.0%) | 0 (0.0%) |
| Total | 110 (100.0%) | 102 (100.0%) |
Families and Households in Crows Landing
Median Family Size in Crows Landing
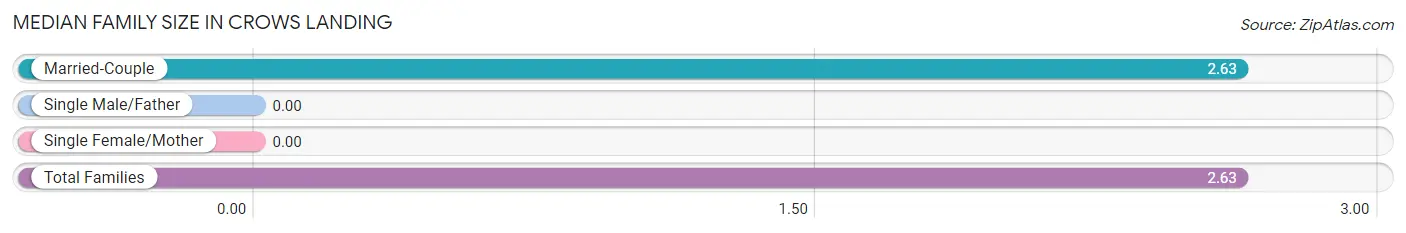
| Family Type | # Families | Family Size |
| Married-Couple | 46 (100.0%) | 2.63 |
| Single Male/Father | 0 (0.0%) | - |
| Single Female/Mother | 0 (0.0%) | - |
| Total Families | 46 (100.0%) | 2.63 |
Median Household Size in Crows Landing
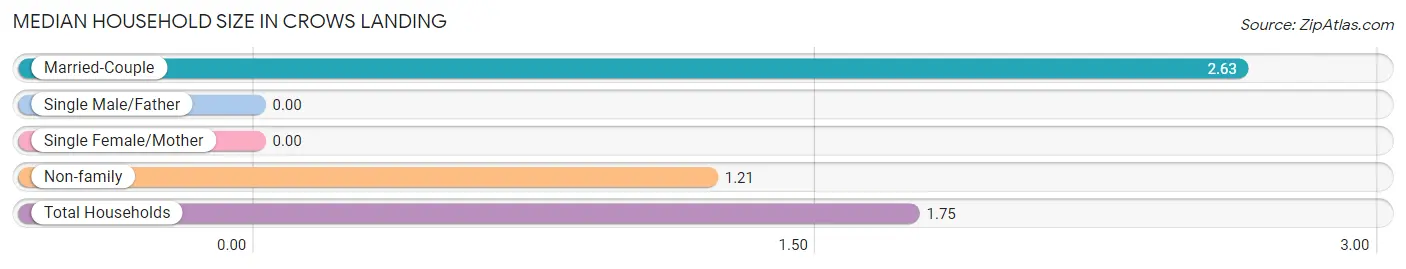
| Household Type | # Households | Household Size |
| Married-Couple | 46 (38.0%) | 2.63 |
| Single Male/Father | 0 (0.0%) | - |
| Single Female/Mother | 0 (0.0%) | - |
| Non-family | 75 (62.0%) | 1.21 |
| Total Households | 121 (100.0%) | 1.75 |
Household Size by Marriage Status in Crows Landing
Out of a total of 121 households in Crows Landing, 46 (38.0%) are family households, while 75 (62.0%) are nonfamily households. The most numerous type of family households are 2-person households, comprising 37, and the most common type of nonfamily households are 1-person households, comprising 59.
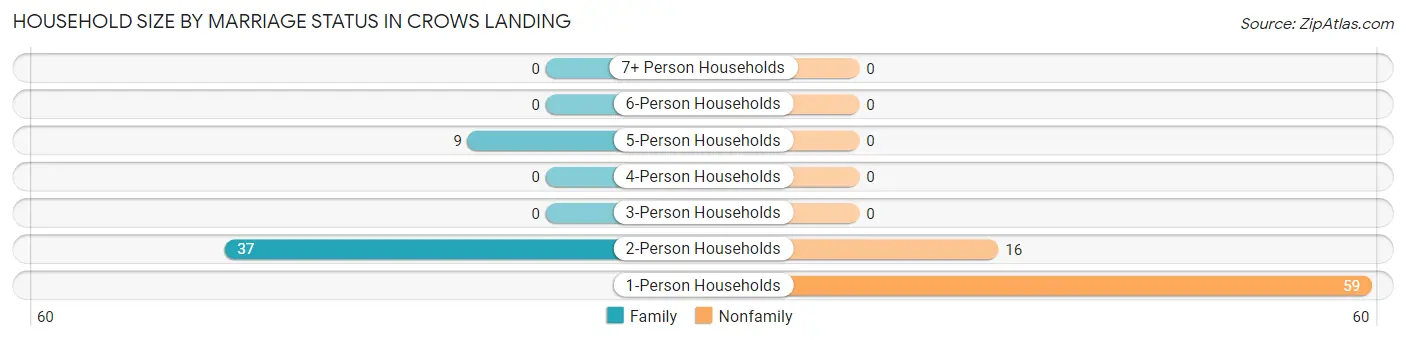
| Household Size | Family Households | Nonfamily Households |
| 1-Person Households | - | 59 (48.8%) |
| 2-Person Households | 37 (30.6%) | 16 (13.2%) |
| 3-Person Households | 0 (0.0%) | 0 (0.0%) |
| 4-Person Households | 0 (0.0%) | 0 (0.0%) |
| 5-Person Households | 9 (7.4%) | 0 (0.0%) |
| 6-Person Households | 0 (0.0%) | 0 (0.0%) |
| 7+ Person Households | 0 (0.0%) | 0 (0.0%) |
| Total | 46 (38.0%) | 75 (62.0%) |
Female Fertility in Crows Landing
Fertility by Age in Crows Landing
| Age Bracket | Women with Births | Births / 1,000 Women |
| 15 to 19 years | 0 (0.0%) | 0.0 |
| 20 to 34 years | 0 (0.0%) | 0.0 |
| 35 to 50 years | 0 (0.0%) | 0.0 |
| Total | 0 (0.0%) | 0.0 |
Fertility by Age by Marriage Status in Crows Landing
| Age Bracket | Married | Unmarried |
| 15 to 19 years | 0 (0.0%) | 0 (0.0%) |
| 20 to 34 years | 0 (0.0%) | 0 (0.0%) |
| 35 to 50 years | 0 (0.0%) | 0 (0.0%) |
| Total | 0 (0.0%) | 0 (0.0%) |
Fertility by Education in Crows Landing
| Educational Attainment | Women with Births | Births / 1,000 Women |
| Less than High School | 0 (0.0%) | 0.0 |
| High School Diploma | 0 (0.0%) | 0.0 |
| College or Associate's Degree | 0 (0.0%) | 0.0 |
| Bachelor's Degree | 0 (0.0%) | 0.0 |
| Graduate Degree | 0 (0.0%) | 0.0 |
| Total | 0 (0.0%) | 0.0 |
Fertility by Education by Marriage Status in Crows Landing
| Educational Attainment | Married | Unmarried |
| Less than High School | 0 (0.0%) | 0 (0.0%) |
| High School Diploma | 0 (0.0%) | 0 (0.0%) |
| College or Associate's Degree | 0 (0.0%) | 0 (0.0%) |
| Bachelor's Degree | 0 (0.0%) | 0 (0.0%) |
| Graduate Degree | 0 (0.0%) | 0 (0.0%) |
| Total | 0 (0.0%) | 0 (0.0%) |
Employment Characteristics in Crows Landing
Employment by Class of Employer in Crows Landing
Among the 99 employed individuals in Crows Landing, private company employees (92 | 92.9%), and self-employed (not incorporated) (7 | 7.1%) make up the most common classes of employment.
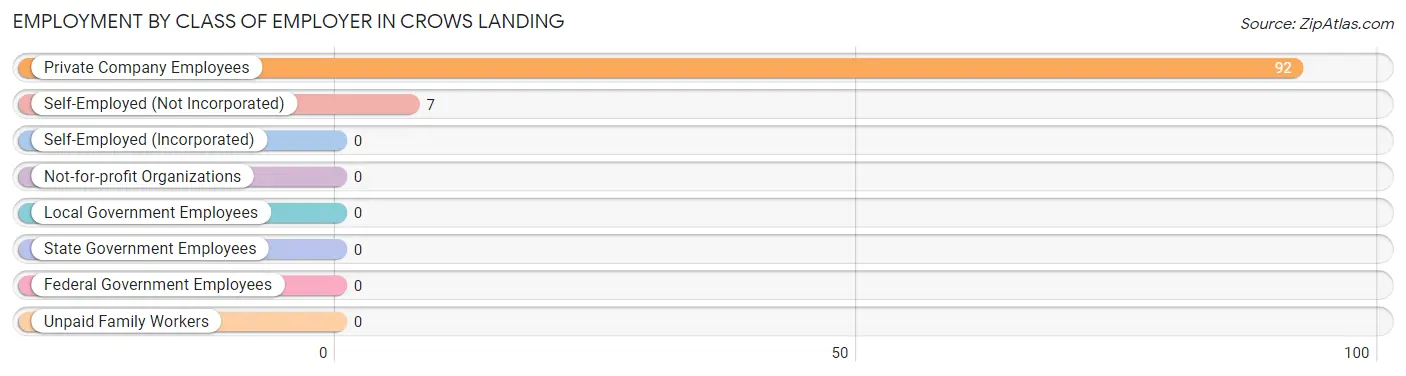
| Employer Class | # Employees | % Employees |
| Private Company Employees | 92 | 92.9% |
| Self-Employed (Incorporated) | 0 | 0.0% |
| Self-Employed (Not Incorporated) | 7 | 7.1% |
| Not-for-profit Organizations | 0 | 0.0% |
| Local Government Employees | 0 | 0.0% |
| State Government Employees | 0 | 0.0% |
| Federal Government Employees | 0 | 0.0% |
| Unpaid Family Workers | 0 | 0.0% |
| Total | 99 | 100.0% |
Employment Status by Age in Crows Landing
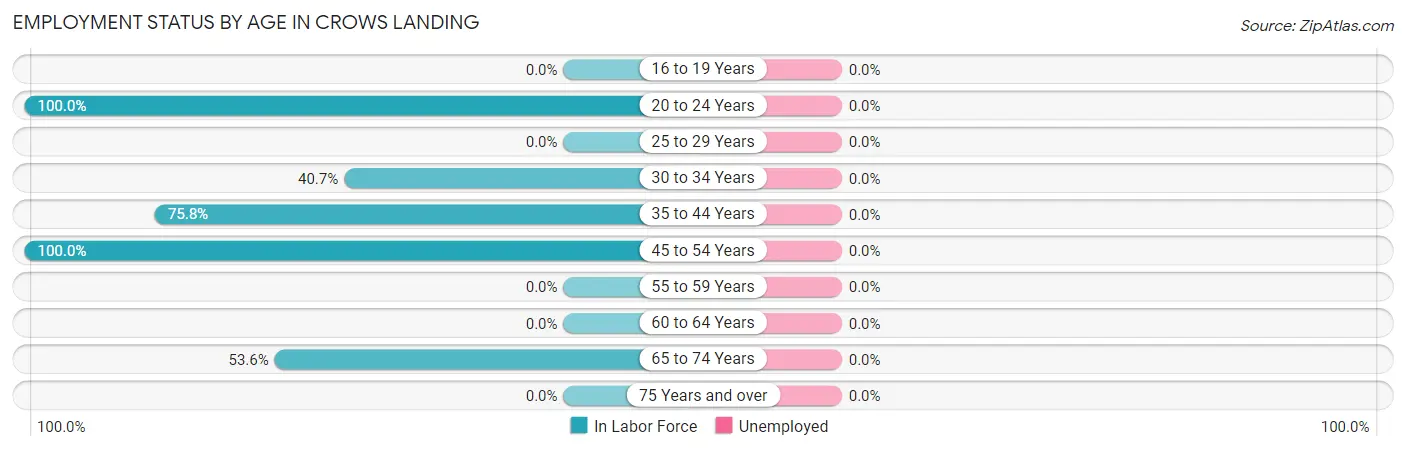
| Age Bracket | In Labor Force | Unemployed |
| 16 to 19 Years | 0 (0.0%) | 0 (0.0%) |
| 20 to 24 Years | 7 (100.0%) | 0 (0.0%) |
| 25 to 29 Years | 0 (0.0%) | 0 (0.0%) |
| 30 to 34 Years | 11 (40.7%) | 0 (0.0%) |
| 35 to 44 Years | 25 (75.8%) | 0 (0.0%) |
| 45 to 54 Years | 41 (100.0%) | 0 (0.0%) |
| 55 to 59 Years | 0 (0.0%) | 0 (0.0%) |
| 60 to 64 Years | 0 (0.0%) | 0 (0.0%) |
| 65 to 74 Years | 15 (53.6%) | 0 (0.0%) |
| 75 Years and over | 0 (0.0%) | 0 (0.0%) |
| Total | 99 (51.3%) | 0 (0.0%) |
Employment Status by Educational Attainment in Crows Landing
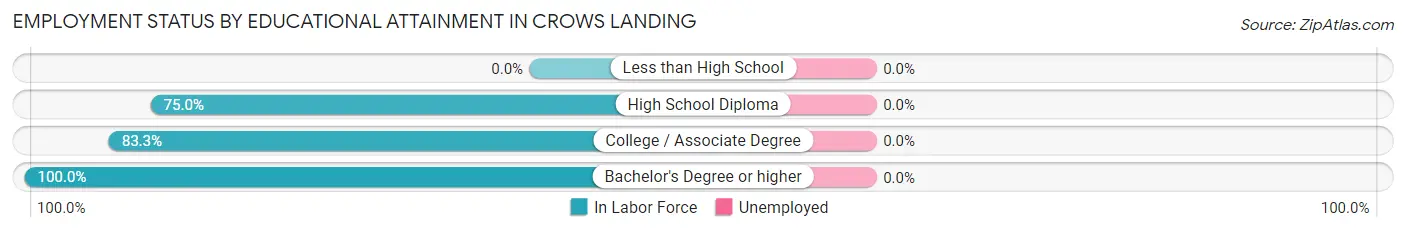
| Educational Attainment | In Labor Force | Unemployed |
| Less than High School | 0 (0.0%) | 0 (0.0%) |
| High School Diploma | 48 (75.0%) | 0 (0.0%) |
| College / Associate Degree | 20 (83.3%) | 0 (0.0%) |
| Bachelor's Degree or higher | 9 (100.0%) | 0 (0.0%) |
| Total | 77 (57.5%) | 0 (0.0%) |
Employment Occupations by Sex in Crows Landing
Management, Business, Science and Arts Occupations
The most common Management, Business, Science and Arts occupations in Crows Landing are Management (9 | 9.1%), Computers, Engineering & Science (7 | 7.1%), and Life, Physical & Social Science (7 | 7.1%).
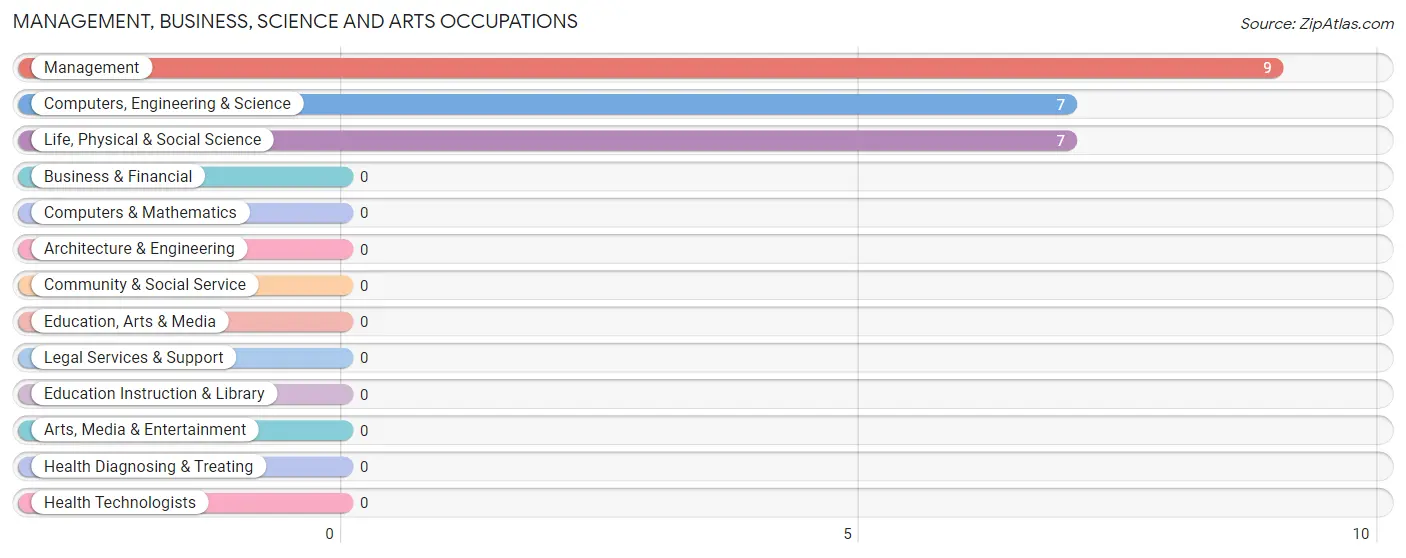
Management, Business, Science and Arts Occupations by Sex
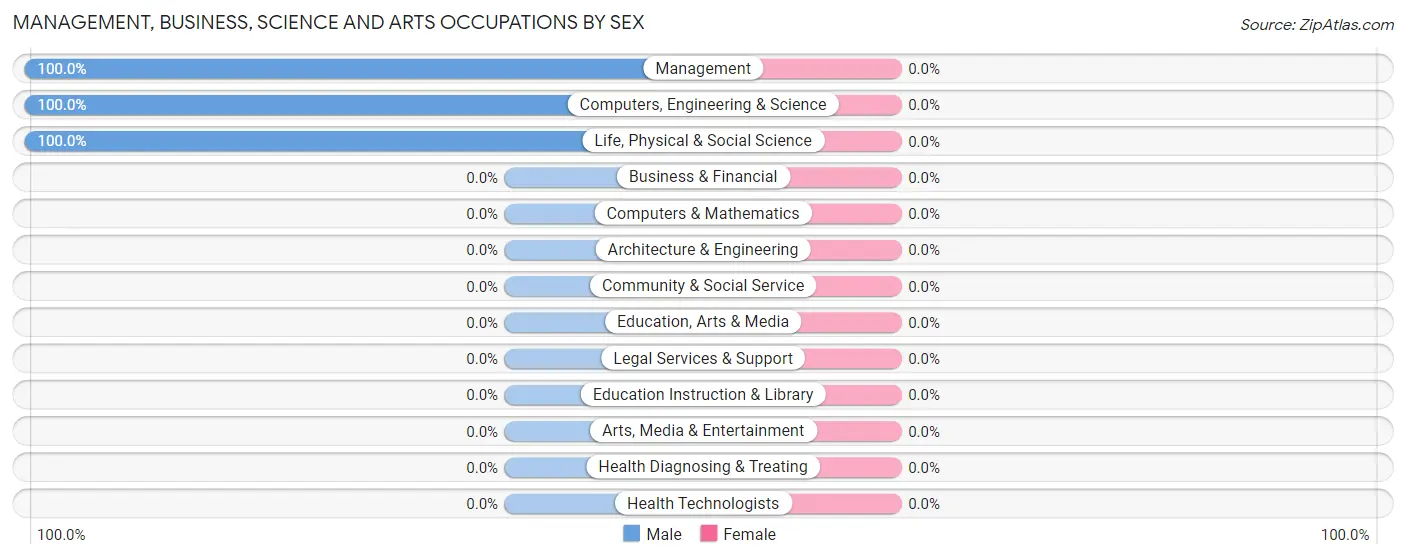
| Occupation | Male | Female |
| Management | 9 (100.0%) | 0 (0.0%) |
| Business & Financial | 0 (0.0%) | 0 (0.0%) |
| Computers, Engineering & Science | 7 (100.0%) | 0 (0.0%) |
| Computers & Mathematics | 0 (0.0%) | 0 (0.0%) |
| Architecture & Engineering | 0 (0.0%) | 0 (0.0%) |
| Life, Physical & Social Science | 7 (100.0%) | 0 (0.0%) |
| Community & Social Service | 0 (0.0%) | 0 (0.0%) |
| Education, Arts & Media | 0 (0.0%) | 0 (0.0%) |
| Legal Services & Support | 0 (0.0%) | 0 (0.0%) |
| Education Instruction & Library | 0 (0.0%) | 0 (0.0%) |
| Arts, Media & Entertainment | 0 (0.0%) | 0 (0.0%) |
| Health Diagnosing & Treating | 0 (0.0%) | 0 (0.0%) |
| Health Technologists | 0 (0.0%) | 0 (0.0%) |
| Total (Category) | 16 (100.0%) | 0 (0.0%) |
| Total (Overall) | 88 (88.9%) | 11 (11.1%) |
Services Occupations
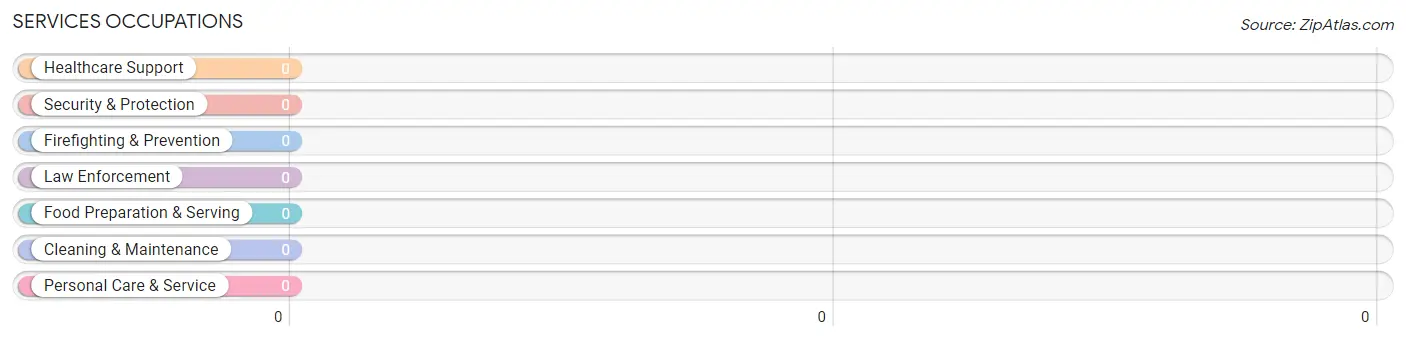
Services Occupations by Sex
| Occupation | Male | Female |
| Healthcare Support | 0 (0.0%) | 0 (0.0%) |
| Security & Protection | 0 (0.0%) | 0 (0.0%) |
| Firefighting & Prevention | 0 (0.0%) | 0 (0.0%) |
| Law Enforcement | 0 (0.0%) | 0 (0.0%) |
| Food Preparation & Serving | 0 (0.0%) | 0 (0.0%) |
| Cleaning & Maintenance | 0 (0.0%) | 0 (0.0%) |
| Personal Care & Service | 0 (0.0%) | 0 (0.0%) |
| Total (Category) | 0 (0.0%) | 0 (0.0%) |
| Total (Overall) | 88 (88.9%) | 11 (11.1%) |
Sales and Office Occupations
The most common Sales and Office occupations in Crows Landing are , and Office & Administration (11 | 11.1%).
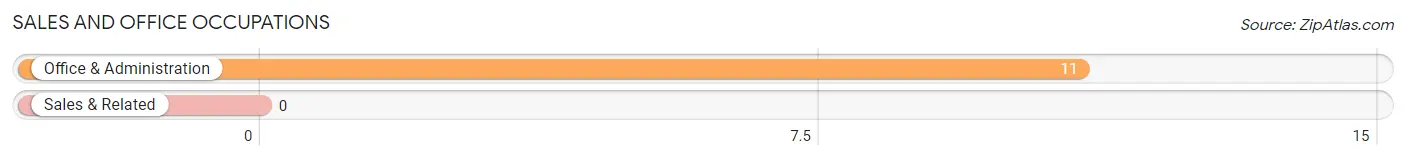
Sales and Office Occupations by Sex
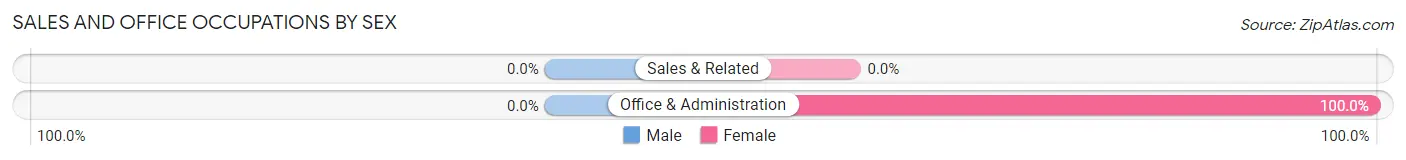
| Occupation | Male | Female |
| Sales & Related | 0 (0.0%) | 0 (0.0%) |
| Office & Administration | 0 (0.0%) | 11 (100.0%) |
| Total (Category) | 0 (0.0%) | 11 (100.0%) |
| Total (Overall) | 88 (88.9%) | 11 (11.1%) |
Natural Resources, Construction and Maintenance Occupations
The most common Natural Resources, Construction and Maintenance occupations in Crows Landing are Farming, Fishing & Forestry (47 | 47.5%), and Installation, Maintenance & Repair (25 | 25.3%).
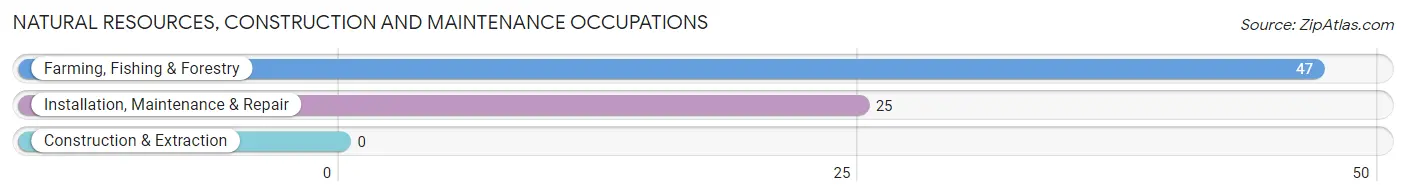
Natural Resources, Construction and Maintenance Occupations by Sex
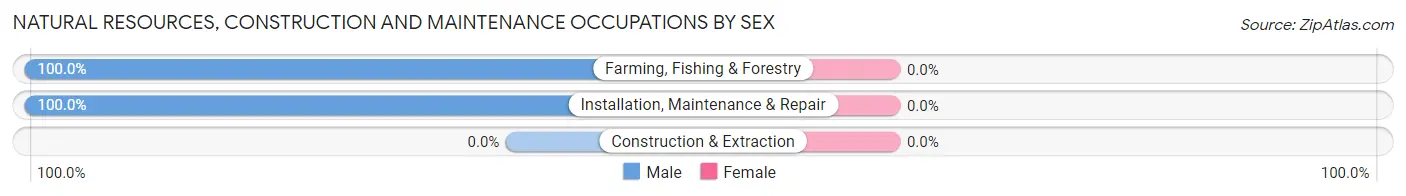
| Occupation | Male | Female |
| Farming, Fishing & Forestry | 47 (100.0%) | 0 (0.0%) |
| Construction & Extraction | 0 (0.0%) | 0 (0.0%) |
| Installation, Maintenance & Repair | 25 (100.0%) | 0 (0.0%) |
| Total (Category) | 72 (100.0%) | 0 (0.0%) |
| Total (Overall) | 88 (88.9%) | 11 (11.1%) |
Production, Transportation and Moving Occupations
Production, Transportation and Moving Occupations by Sex
| Occupation | Male | Female |
| Production | 0 (0.0%) | 0 (0.0%) |
| Transportation | 0 (0.0%) | 0 (0.0%) |
| Material Moving | 0 (0.0%) | 0 (0.0%) |
| Total (Category) | 0 (0.0%) | 0 (0.0%) |
| Total (Overall) | 88 (88.9%) | 11 (11.1%) |
Employment Industries by Sex in Crows Landing
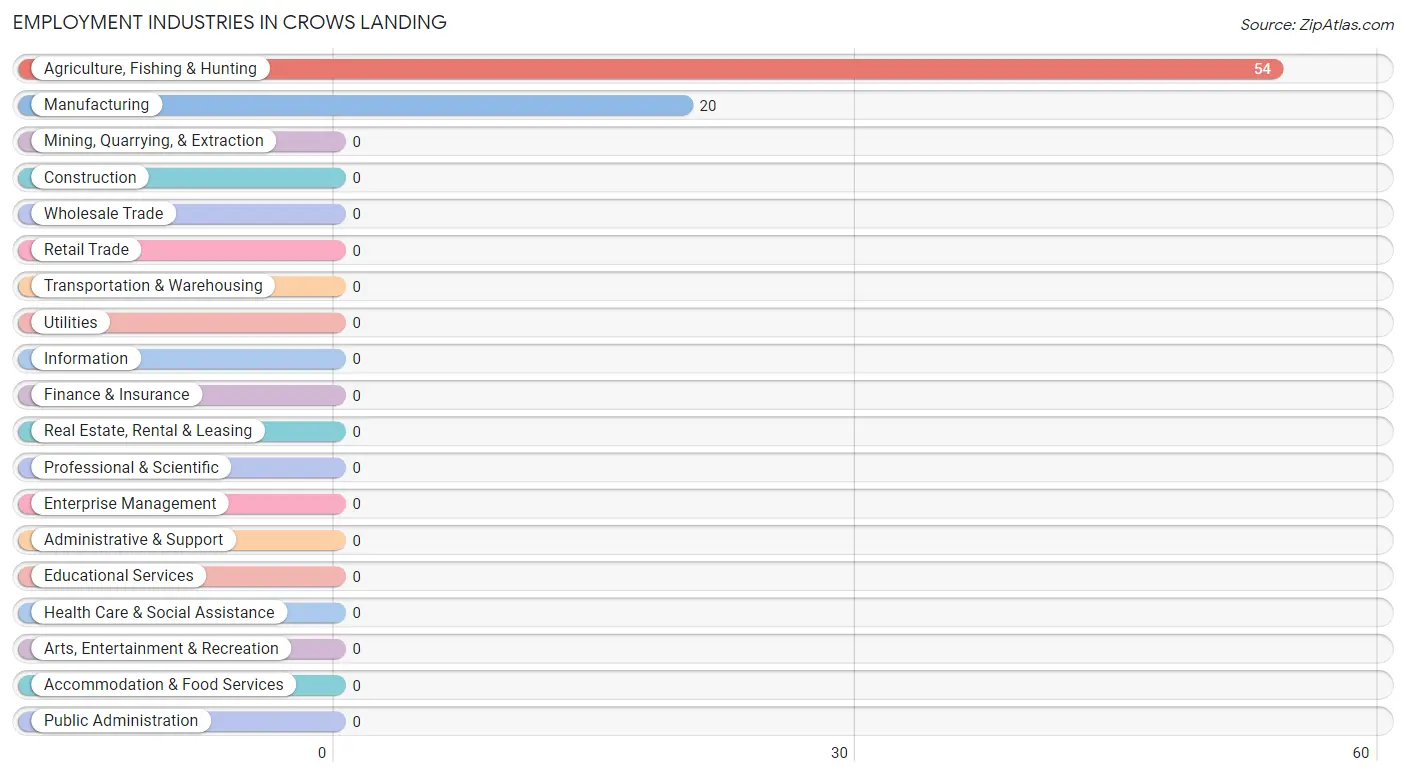
Employment Industries in Crows Landing
The major employment industries in Crows Landing include Agriculture, Fishing & Hunting (54 | 54.5%), and Manufacturing (20 | 20.2%).
Employment Industries by Sex in Crows Landing
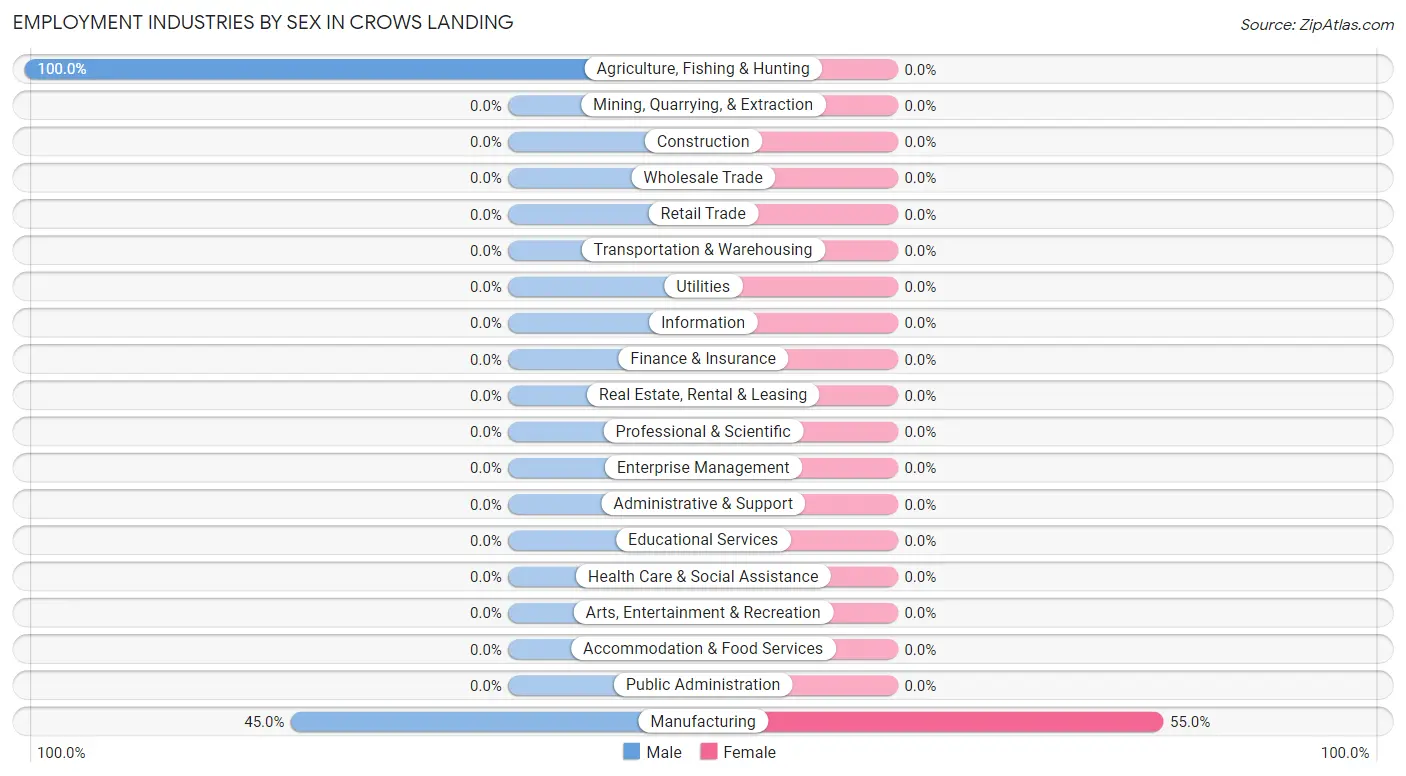
| Industry | Male | Female |
| Agriculture, Fishing & Hunting | 54 (100.0%) | 0 (0.0%) |
| Mining, Quarrying, & Extraction | 0 (0.0%) | 0 (0.0%) |
| Construction | 0 (0.0%) | 0 (0.0%) |
| Manufacturing | 9 (45.0%) | 11 (55.0%) |
| Wholesale Trade | 0 (0.0%) | 0 (0.0%) |
| Retail Trade | 0 (0.0%) | 0 (0.0%) |
| Transportation & Warehousing | 0 (0.0%) | 0 (0.0%) |
| Utilities | 0 (0.0%) | 0 (0.0%) |
| Information | 0 (0.0%) | 0 (0.0%) |
| Finance & Insurance | 0 (0.0%) | 0 (0.0%) |
| Real Estate, Rental & Leasing | 0 (0.0%) | 0 (0.0%) |
| Professional & Scientific | 0 (0.0%) | 0 (0.0%) |
| Enterprise Management | 0 (0.0%) | 0 (0.0%) |
| Administrative & Support | 0 (0.0%) | 0 (0.0%) |
| Educational Services | 0 (0.0%) | 0 (0.0%) |
| Health Care & Social Assistance | 0 (0.0%) | 0 (0.0%) |
| Arts, Entertainment & Recreation | 0 (0.0%) | 0 (0.0%) |
| Accommodation & Food Services | 0 (0.0%) | 0 (0.0%) |
| Public Administration | 0 (0.0%) | 0 (0.0%) |
| Total | 88 (88.9%) | 11 (11.1%) |
Education in Crows Landing
School Enrollment in Crows Landing
The most common levels of schooling among the 27 students in Crows Landing are elementary school (10 | 37.0%), middle school (9 | 33.3%), and college / undergraduate (8 | 29.6%).
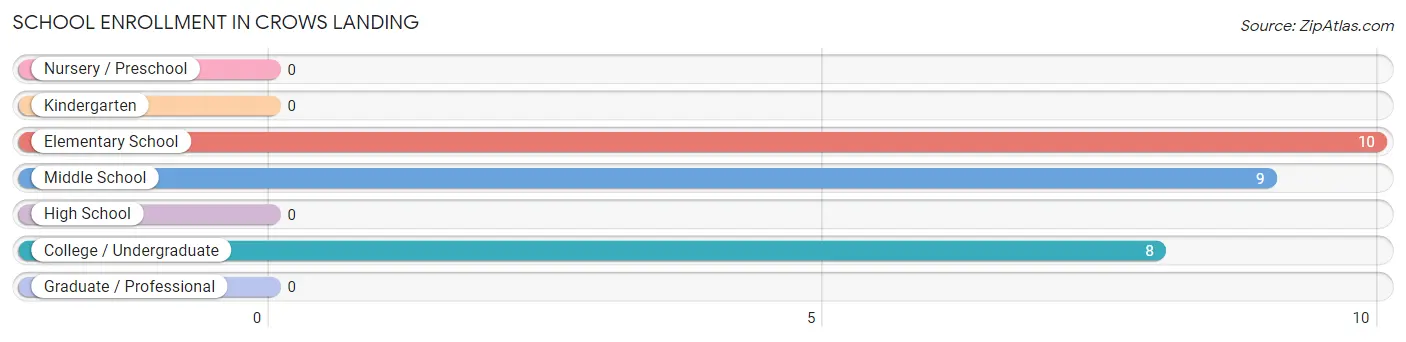
| School Level | # Students | % Students |
| Nursery / Preschool | 0 | 0.0% |
| Kindergarten | 0 | 0.0% |
| Elementary School | 10 | 37.0% |
| Middle School | 9 | 33.3% |
| High School | 0 | 0.0% |
| College / Undergraduate | 8 | 29.6% |
| Graduate / Professional | 0 | 0.0% |
| Total | 27 | 100.0% |
School Enrollment by Age by Funding Source in Crows Landing
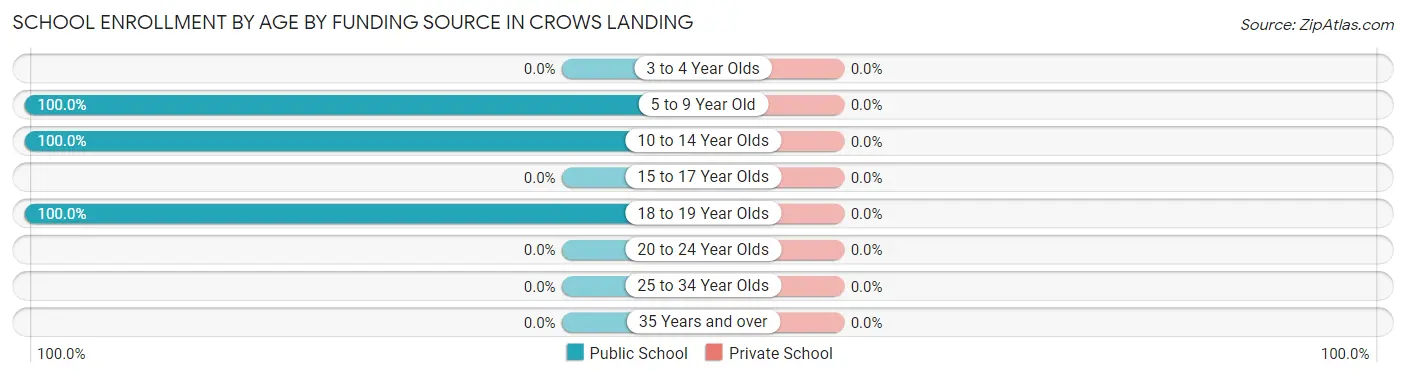
| Age Bracket | Public School | Private School |
| 3 to 4 Year Olds | 0 (0.0%) | 0 (0.0%) |
| 5 to 9 Year Old | 10 (100.0%) | 0 (0.0%) |
| 10 to 14 Year Olds | 9 (100.0%) | 0 (0.0%) |
| 15 to 17 Year Olds | 0 (0.0%) | 0 (0.0%) |
| 18 to 19 Year Olds | 8 (100.0%) | 0 (0.0%) |
| 20 to 24 Year Olds | 0 (0.0%) | 0 (0.0%) |
| 25 to 34 Year Olds | 0 (0.0%) | 0 (0.0%) |
| 35 Years and over | 0 (0.0%) | 0 (0.0%) |
| Total | 27 (100.0%) | 0 (0.0%) |
Educational Attainment by Field of Study in Crows Landing
, and business (9 | 100.0%) are the most common fields of study among 9 individuals in Crows Landing who have obtained a bachelor's degree or higher.
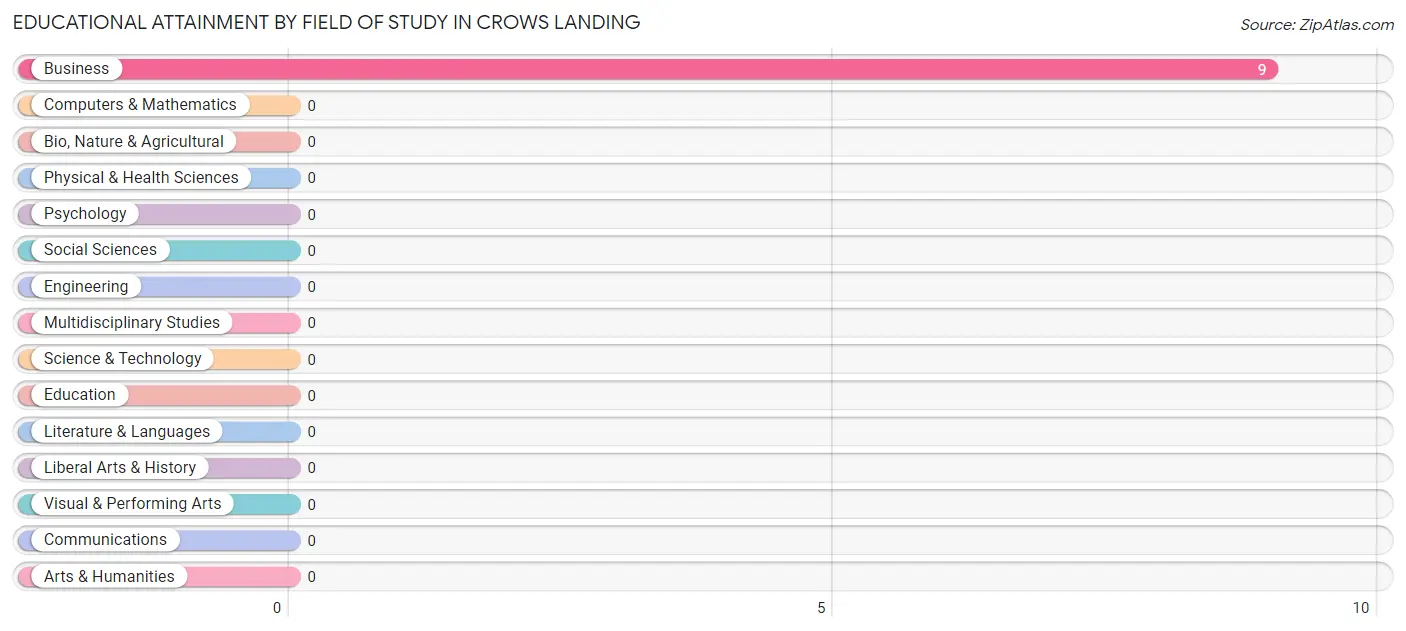
| Field of Study | # Graduates | % Graduates |
| Computers & Mathematics | 0 | 0.0% |
| Bio, Nature & Agricultural | 0 | 0.0% |
| Physical & Health Sciences | 0 | 0.0% |
| Psychology | 0 | 0.0% |
| Social Sciences | 0 | 0.0% |
| Engineering | 0 | 0.0% |
| Multidisciplinary Studies | 0 | 0.0% |
| Science & Technology | 0 | 0.0% |
| Business | 9 | 100.0% |
| Education | 0 | 0.0% |
| Literature & Languages | 0 | 0.0% |
| Liberal Arts & History | 0 | 0.0% |
| Visual & Performing Arts | 0 | 0.0% |
| Communications | 0 | 0.0% |
| Arts & Humanities | 0 | 0.0% |
| Total | 9 | 100.0% |
Transportation & Commute in Crows Landing
Vehicle Availability by Sex in Crows Landing
The most prevalent vehicle ownership categories in Crows Landing are males with 2 vehicles (40, accounting for 45.5%) and females with 2 vehicles (11, making up 363.6%).
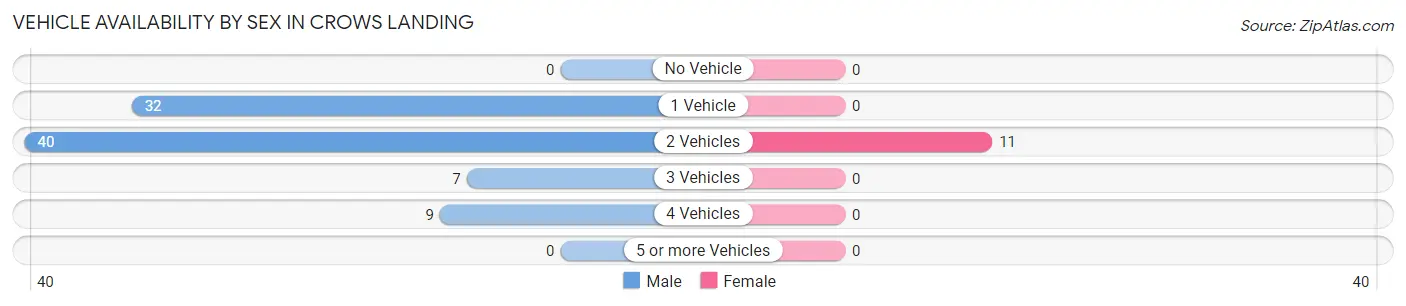
| Vehicles Available | Male | Female |
| No Vehicle | 0 (0.0%) | 0 (0.0%) |
| 1 Vehicle | 32 (36.4%) | 0 (0.0%) |
| 2 Vehicles | 40 (45.5%) | 11 (100.0%) |
| 3 Vehicles | 7 (8.0%) | 0 (0.0%) |
| 4 Vehicles | 9 (10.2%) | 0 (0.0%) |
| 5 or more Vehicles | 0 (0.0%) | 0 (0.0%) |
| Total | 88 (100.0%) | 11 (100.0%) |
Commute Time in Crows Landing
The most frequently occuring commute durations in Crows Landing are 10 to 14 minutes (27 commuters, 60.0%), 30 to 34 minutes (9 commuters, 20.0%), and 40 to 44 minutes (9 commuters, 20.0%).
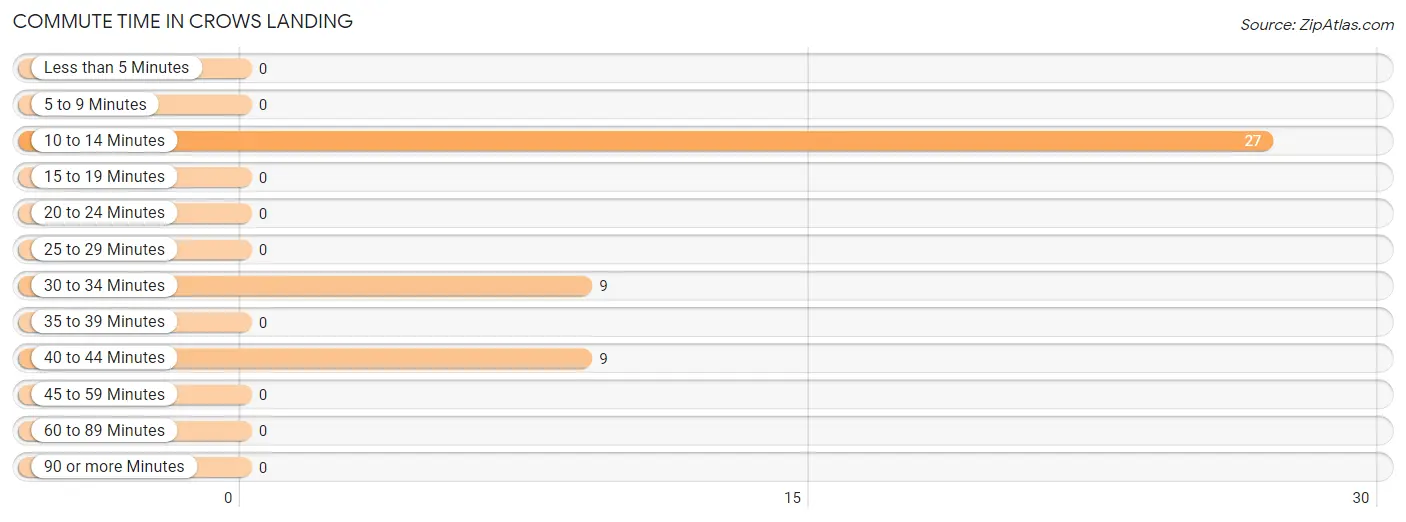
| Commute Time | # Commuters | % Commuters |
| Less than 5 Minutes | 0 | 0.0% |
| 5 to 9 Minutes | 0 | 0.0% |
| 10 to 14 Minutes | 27 | 60.0% |
| 15 to 19 Minutes | 0 | 0.0% |
| 20 to 24 Minutes | 0 | 0.0% |
| 25 to 29 Minutes | 0 | 0.0% |
| 30 to 34 Minutes | 9 | 20.0% |
| 35 to 39 Minutes | 0 | 0.0% |
| 40 to 44 Minutes | 9 | 20.0% |
| 45 to 59 Minutes | 0 | 0.0% |
| 60 to 89 Minutes | 0 | 0.0% |
| 90 or more Minutes | 0 | 0.0% |
Commute Time by Sex in Crows Landing
The most common commute times in Crows Landing are 10 to 14 minutes (16 commuters, 47.1%) for males and 10 to 14 minutes (11 commuters, 100.0%) for females.
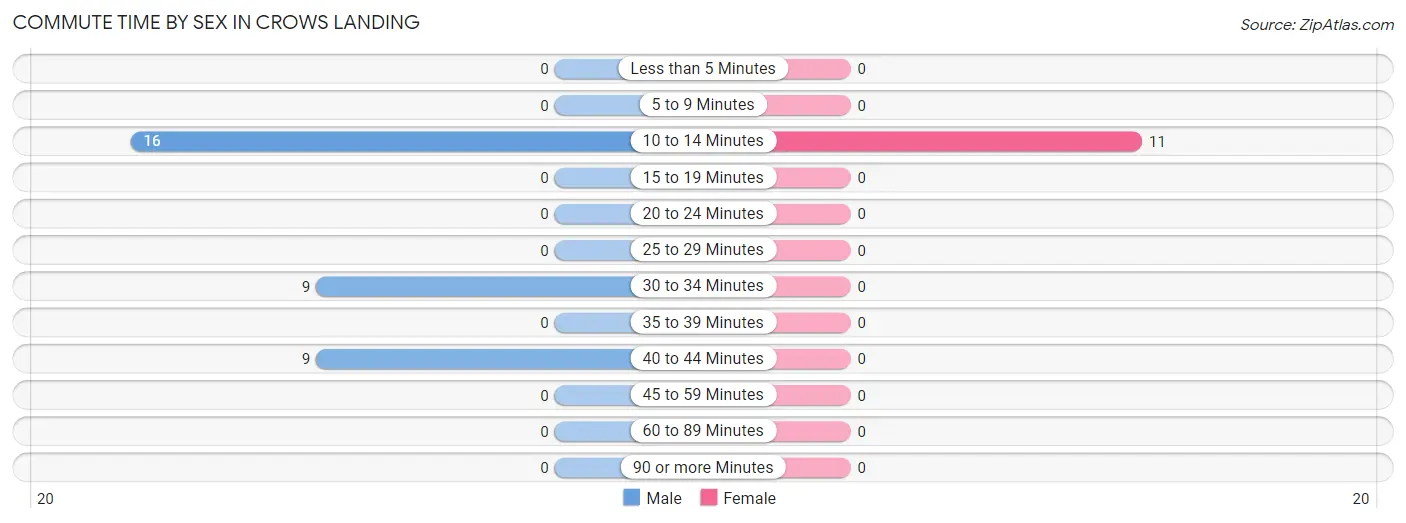
| Commute Time | Male | Female |
| Less than 5 Minutes | 0 (0.0%) | 0 (0.0%) |
| 5 to 9 Minutes | 0 (0.0%) | 0 (0.0%) |
| 10 to 14 Minutes | 16 (47.1%) | 11 (100.0%) |
| 15 to 19 Minutes | 0 (0.0%) | 0 (0.0%) |
| 20 to 24 Minutes | 0 (0.0%) | 0 (0.0%) |
| 25 to 29 Minutes | 0 (0.0%) | 0 (0.0%) |
| 30 to 34 Minutes | 9 (26.5%) | 0 (0.0%) |
| 35 to 39 Minutes | 0 (0.0%) | 0 (0.0%) |
| 40 to 44 Minutes | 9 (26.5%) | 0 (0.0%) |
| 45 to 59 Minutes | 0 (0.0%) | 0 (0.0%) |
| 60 to 89 Minutes | 0 (0.0%) | 0 (0.0%) |
| 90 or more Minutes | 0 (0.0%) | 0 (0.0%) |
Time of Departure to Work by Sex in Crows Landing
The most frequent times of departure to work in Crows Landing are 7:30 AM to 7:59 AM (25, 73.5%) for males and 7:30 AM to 7:59 AM (11, 100.0%) for females.
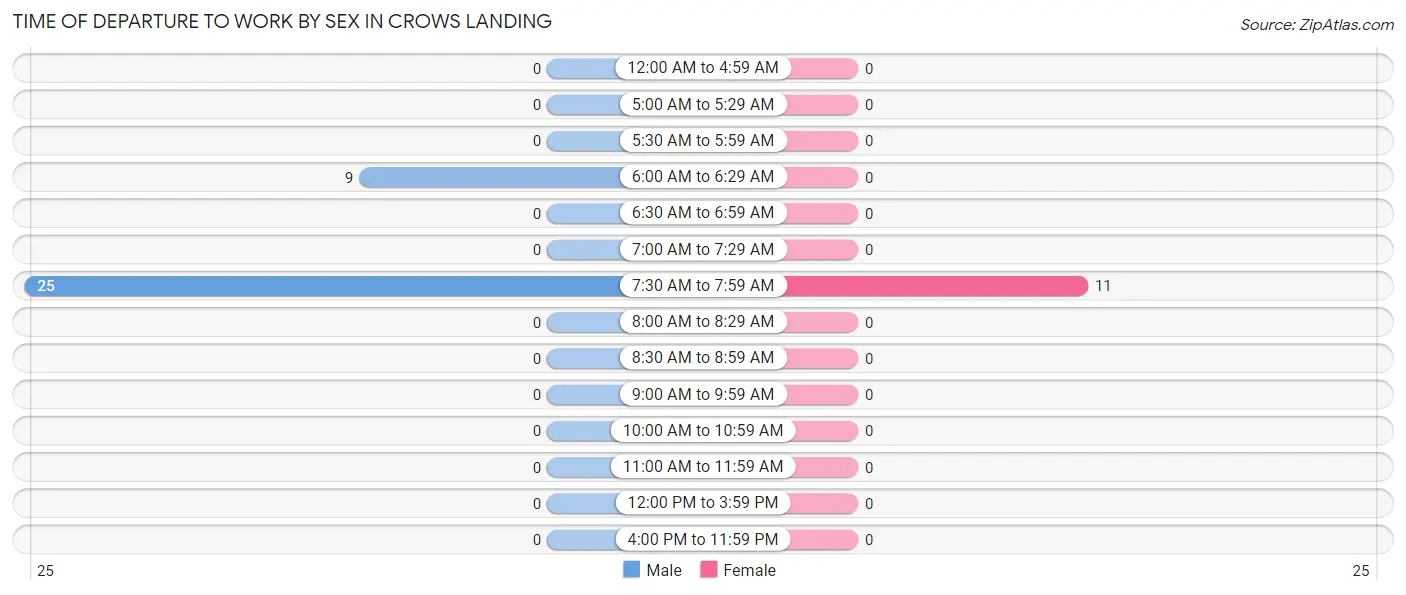
| Time of Departure | Male | Female |
| 12:00 AM to 4:59 AM | 0 (0.0%) | 0 (0.0%) |
| 5:00 AM to 5:29 AM | 0 (0.0%) | 0 (0.0%) |
| 5:30 AM to 5:59 AM | 0 (0.0%) | 0 (0.0%) |
| 6:00 AM to 6:29 AM | 9 (26.5%) | 0 (0.0%) |
| 6:30 AM to 6:59 AM | 0 (0.0%) | 0 (0.0%) |
| 7:00 AM to 7:29 AM | 0 (0.0%) | 0 (0.0%) |
| 7:30 AM to 7:59 AM | 25 (73.5%) | 11 (100.0%) |
| 8:00 AM to 8:29 AM | 0 (0.0%) | 0 (0.0%) |
| 8:30 AM to 8:59 AM | 0 (0.0%) | 0 (0.0%) |
| 9:00 AM to 9:59 AM | 0 (0.0%) | 0 (0.0%) |
| 10:00 AM to 10:59 AM | 0 (0.0%) | 0 (0.0%) |
| 11:00 AM to 11:59 AM | 0 (0.0%) | 0 (0.0%) |
| 12:00 PM to 3:59 PM | 0 (0.0%) | 0 (0.0%) |
| 4:00 PM to 11:59 PM | 0 (0.0%) | 0 (0.0%) |
| Total | 34 (100.0%) | 11 (100.0%) |
Housing Occupancy in Crows Landing
Occupancy by Ownership in Crows Landing
Of the total 121 dwellings in Crows Landing, owner-occupied units account for 41 (33.9%), while renter-occupied units make up 80 (66.1%).
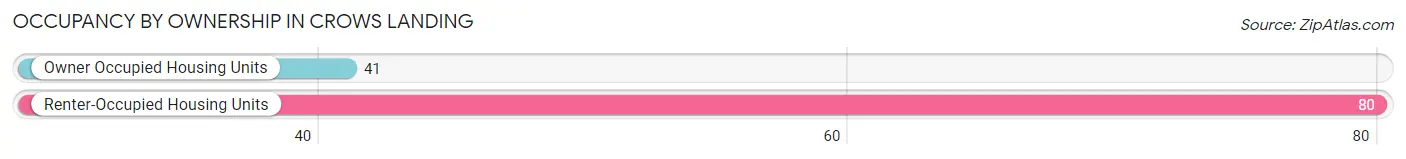
| Occupancy | # Housing Units | % Housing Units |
| Owner Occupied Housing Units | 41 | 33.9% |
| Renter-Occupied Housing Units | 80 | 66.1% |
| Total Occupied Housing Units | 121 | 100.0% |
Occupancy by Household Size in Crows Landing
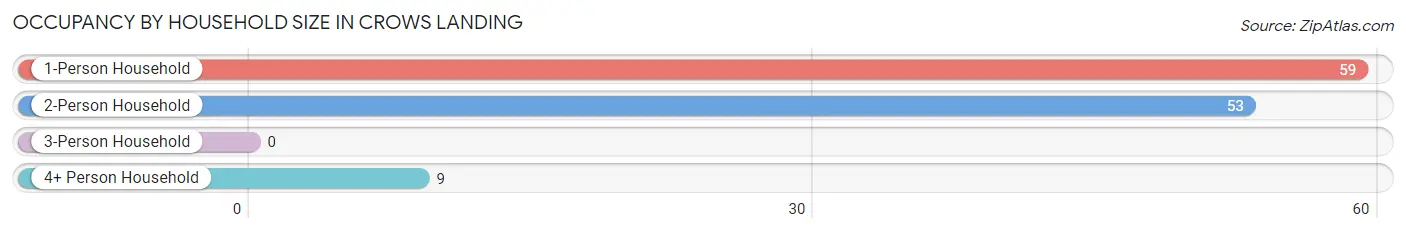
| Household Size | # Housing Units | % Housing Units |
| 1-Person Household | 59 | 48.8% |
| 2-Person Household | 53 | 43.8% |
| 3-Person Household | 0 | 0.0% |
| 4+ Person Household | 9 | 7.4% |
| Total Housing Units | 121 | 100.0% |
Occupancy by Ownership by Household Size in Crows Landing
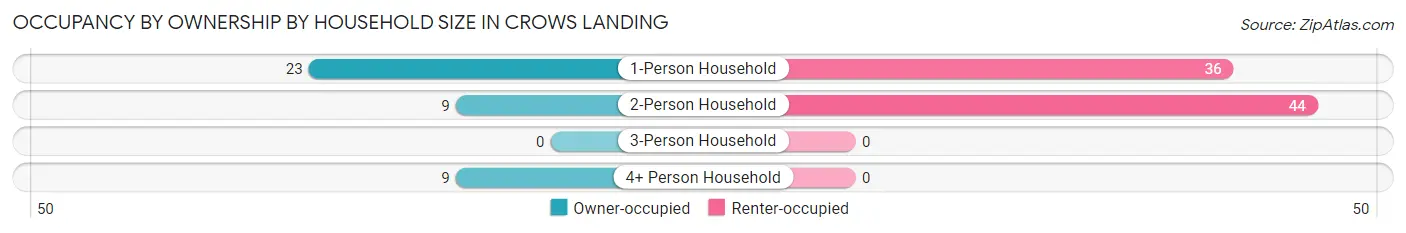
| Household Size | Owner-occupied | Renter-occupied |
| 1-Person Household | 23 (39.0%) | 36 (61.0%) |
| 2-Person Household | 9 (17.0%) | 44 (83.0%) |
| 3-Person Household | 0 (0.0%) | 0 (0.0%) |
| 4+ Person Household | 9 (100.0%) | 0 (0.0%) |
| Total Housing Units | 41 (33.9%) | 80 (66.1%) |
Occupancy by Educational Attainment in Crows Landing
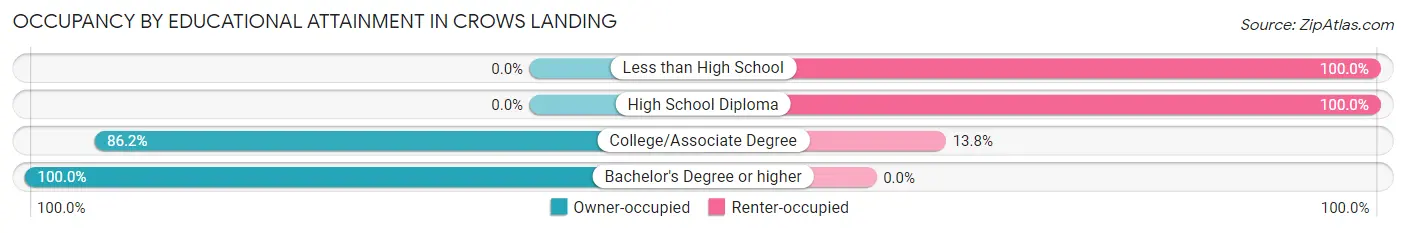
| Household Size | Owner-occupied | Renter-occupied |
| Less than High School | 0 (0.0%) | 28 (100.0%) |
| High School Diploma | 0 (0.0%) | 48 (100.0%) |
| College/Associate Degree | 25 (86.2%) | 4 (13.8%) |
| Bachelor's Degree or higher | 16 (100.0%) | 0 (0.0%) |
Occupancy by Age of Householder in Crows Landing
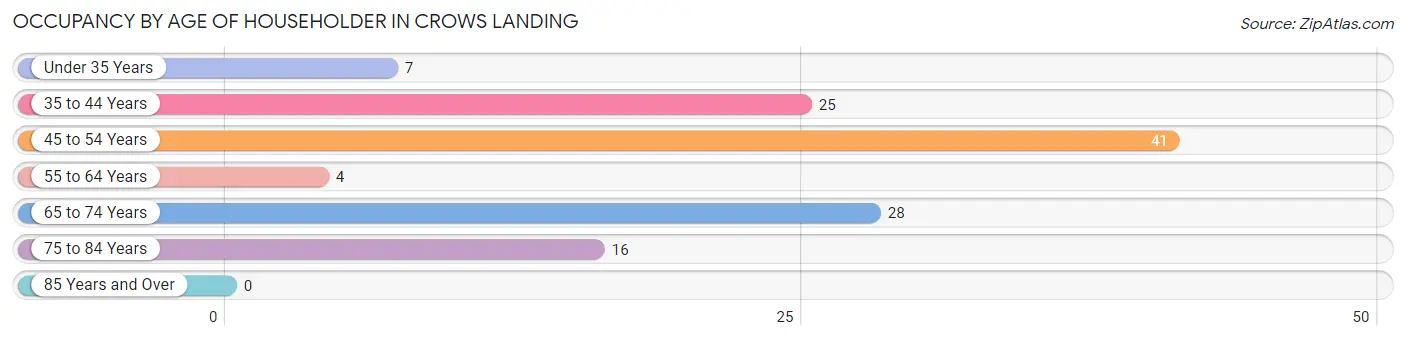
| Age Bracket | # Households | % Households |
| Under 35 Years | 7 | 5.8% |
| 35 to 44 Years | 25 | 20.7% |
| 45 to 54 Years | 41 | 33.9% |
| 55 to 64 Years | 4 | 3.3% |
| 65 to 74 Years | 28 | 23.1% |
| 75 to 84 Years | 16 | 13.2% |
| 85 Years and Over | 0 | 0.0% |
| Total | 121 | 100.0% |
Housing Finances in Crows Landing
Median Income by Occupancy in Crows Landing
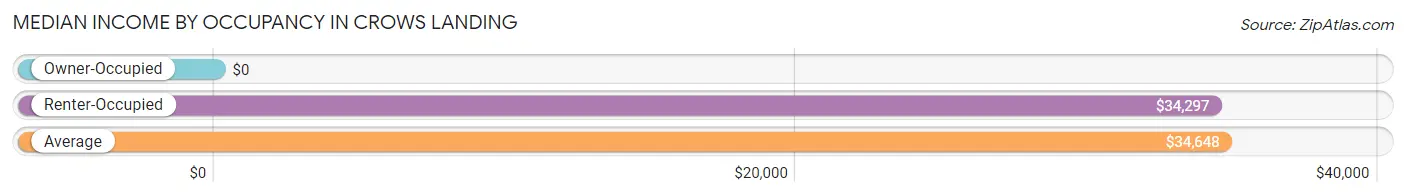
| Occupancy Type | # Households | Median Income |
| Owner-Occupied | 41 (33.9%) | $0 |
| Renter-Occupied | 80 (66.1%) | $34,297 |
| Average | 121 (100.0%) | $34,648 |
Occupancy by Householder Income Bracket in Crows Landing
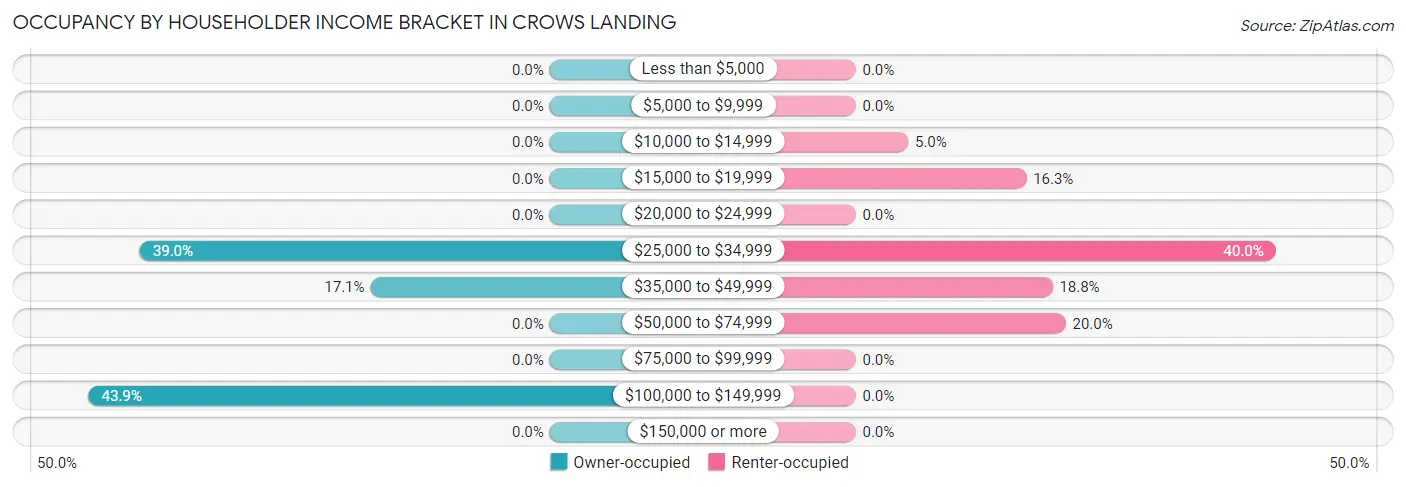
| Income Bracket | Owner-occupied | Renter-occupied |
| Less than $5,000 | 0 (0.0%) | 0 (0.0%) |
| $5,000 to $9,999 | 0 (0.0%) | 0 (0.0%) |
| $10,000 to $14,999 | 0 (0.0%) | 4 (5.0%) |
| $15,000 to $19,999 | 0 (0.0%) | 13 (16.3%) |
| $20,000 to $24,999 | 0 (0.0%) | 0 (0.0%) |
| $25,000 to $34,999 | 16 (39.0%) | 32 (40.0%) |
| $35,000 to $49,999 | 7 (17.1%) | 15 (18.8%) |
| $50,000 to $74,999 | 0 (0.0%) | 16 (20.0%) |
| $75,000 to $99,999 | 0 (0.0%) | 0 (0.0%) |
| $100,000 to $149,999 | 18 (43.9%) | 0 (0.0%) |
| $150,000 or more | 0 (0.0%) | 0 (0.0%) |
| Total | 41 (100.0%) | 80 (100.0%) |
Monthly Housing Cost Tiers in Crows Landing
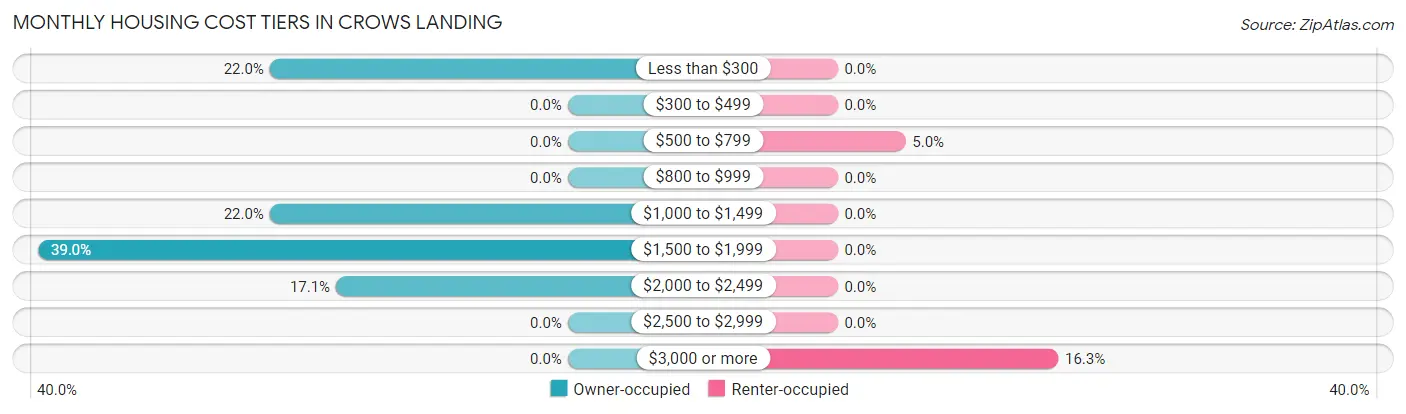
| Monthly Cost | Owner-occupied | Renter-occupied |
| Less than $300 | 9 (22.0%) | 0 (0.0%) |
| $300 to $499 | 0 (0.0%) | 0 (0.0%) |
| $500 to $799 | 0 (0.0%) | 4 (5.0%) |
| $800 to $999 | 0 (0.0%) | 0 (0.0%) |
| $1,000 to $1,499 | 9 (22.0%) | 0 (0.0%) |
| $1,500 to $1,999 | 16 (39.0%) | 0 (0.0%) |
| $2,000 to $2,499 | 7 (17.1%) | 0 (0.0%) |
| $2,500 to $2,999 | 0 (0.0%) | 0 (0.0%) |
| $3,000 or more | 0 (0.0%) | 13 (16.3%) |
| Total | 41 (100.0%) | 80 (100.0%) |
Physical Housing Characteristics in Crows Landing
Housing Structures in Crows Landing
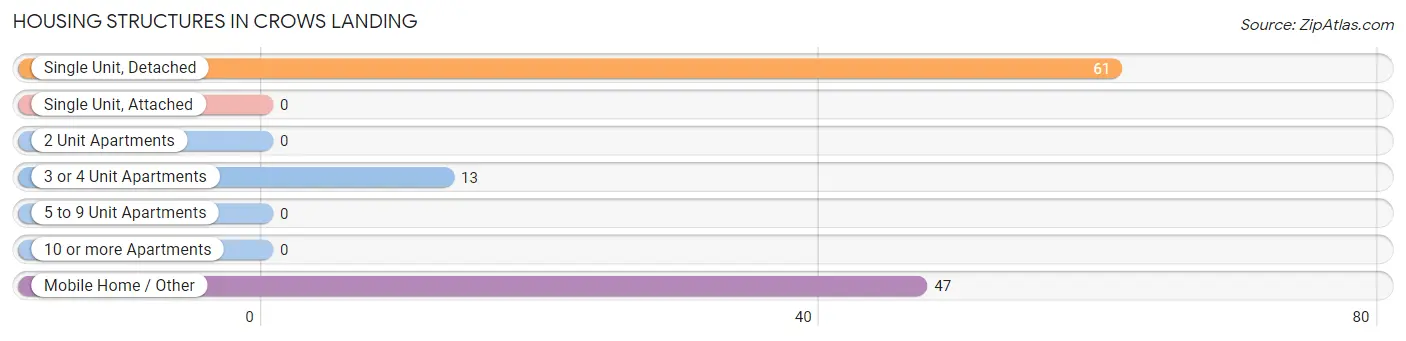
| Structure Type | # Housing Units | % Housing Units |
| Single Unit, Detached | 61 | 50.4% |
| Single Unit, Attached | 0 | 0.0% |
| 2 Unit Apartments | 0 | 0.0% |
| 3 or 4 Unit Apartments | 13 | 10.7% |
| 5 to 9 Unit Apartments | 0 | 0.0% |
| 10 or more Apartments | 0 | 0.0% |
| Mobile Home / Other | 47 | 38.8% |
| Total | 121 | 100.0% |
Housing Structures by Occupancy in Crows Landing
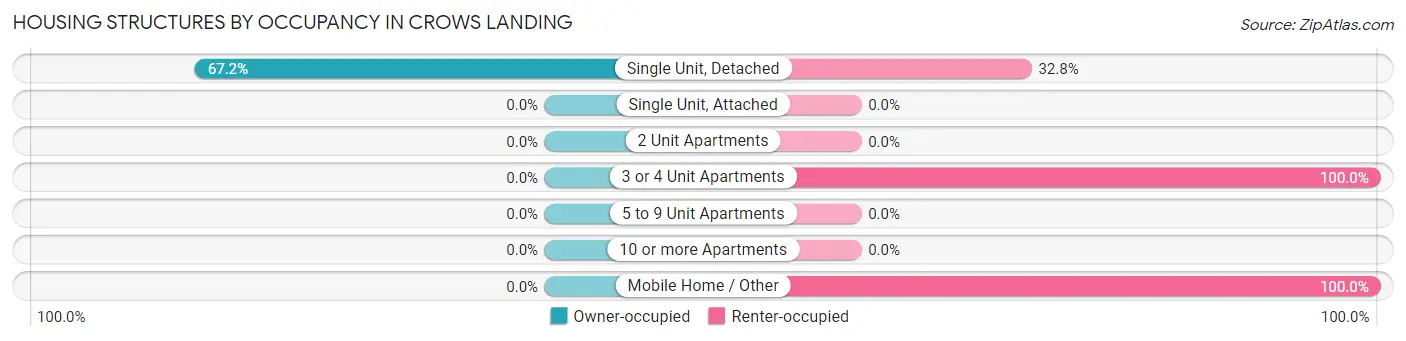
| Structure Type | Owner-occupied | Renter-occupied |
| Single Unit, Detached | 41 (67.2%) | 20 (32.8%) |
| Single Unit, Attached | 0 (0.0%) | 0 (0.0%) |
| 2 Unit Apartments | 0 (0.0%) | 0 (0.0%) |
| 3 or 4 Unit Apartments | 0 (0.0%) | 13 (100.0%) |
| 5 to 9 Unit Apartments | 0 (0.0%) | 0 (0.0%) |
| 10 or more Apartments | 0 (0.0%) | 0 (0.0%) |
| Mobile Home / Other | 0 (0.0%) | 47 (100.0%) |
| Total | 41 (33.9%) | 80 (66.1%) |
Housing Structures by Number of Rooms in Crows Landing
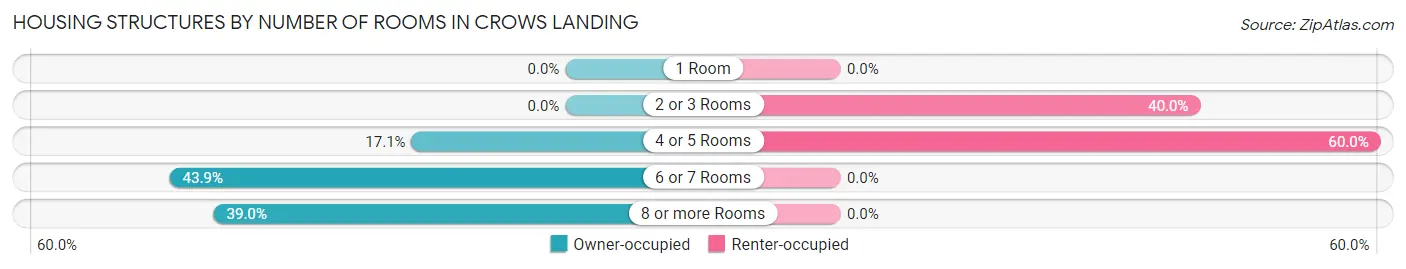
| Number of Rooms | Owner-occupied | Renter-occupied |
| 1 Room | 0 (0.0%) | 0 (0.0%) |
| 2 or 3 Rooms | 0 (0.0%) | 32 (40.0%) |
| 4 or 5 Rooms | 7 (17.1%) | 48 (60.0%) |
| 6 or 7 Rooms | 18 (43.9%) | 0 (0.0%) |
| 8 or more Rooms | 16 (39.0%) | 0 (0.0%) |
| Total | 41 (100.0%) | 80 (100.0%) |
Housing Structure by Heating Type in Crows Landing
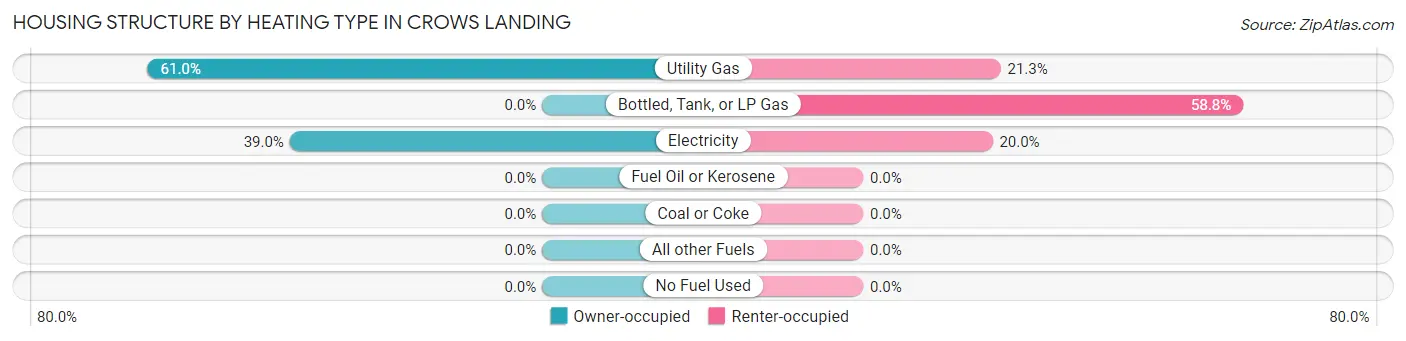
| Heating Type | Owner-occupied | Renter-occupied |
| Utility Gas | 25 (61.0%) | 17 (21.2%) |
| Bottled, Tank, or LP Gas | 0 (0.0%) | 47 (58.8%) |
| Electricity | 16 (39.0%) | 16 (20.0%) |
| Fuel Oil or Kerosene | 0 (0.0%) | 0 (0.0%) |
| Coal or Coke | 0 (0.0%) | 0 (0.0%) |
| All other Fuels | 0 (0.0%) | 0 (0.0%) |
| No Fuel Used | 0 (0.0%) | 0 (0.0%) |
| Total | 41 (100.0%) | 80 (100.0%) |
Household Vehicle Usage in Crows Landing
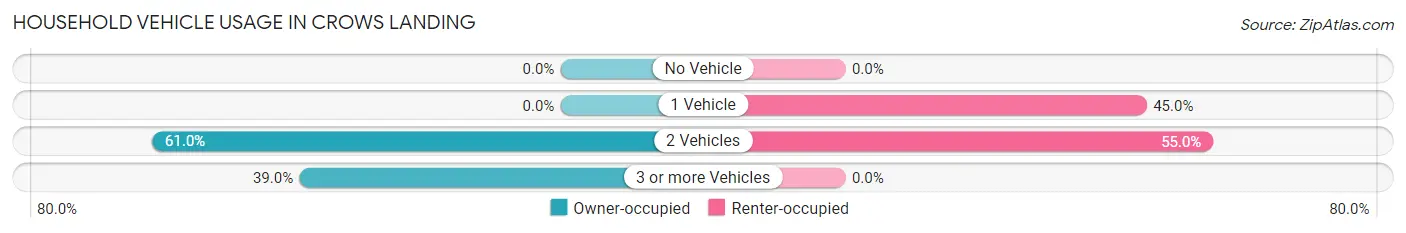
| Vehicles per Household | Owner-occupied | Renter-occupied |
| No Vehicle | 0 (0.0%) | 0 (0.0%) |
| 1 Vehicle | 0 (0.0%) | 36 (45.0%) |
| 2 Vehicles | 25 (61.0%) | 44 (55.0%) |
| 3 or more Vehicles | 16 (39.0%) | 0 (0.0%) |
| Total | 41 (100.0%) | 80 (100.0%) |
Real Estate & Mortgages in Crows Landing
Real Estate and Mortgage Overview in Crows Landing
| Characteristic | Without Mortgage | With Mortgage |
| Housing Units | 0 | 41 |
| Median Property Value | - | - |
| Median Household Income | - | - |
| Monthly Housing Costs | - | - |
| Real Estate Taxes | - | - |
Property Value by Mortgage Status in Crows Landing
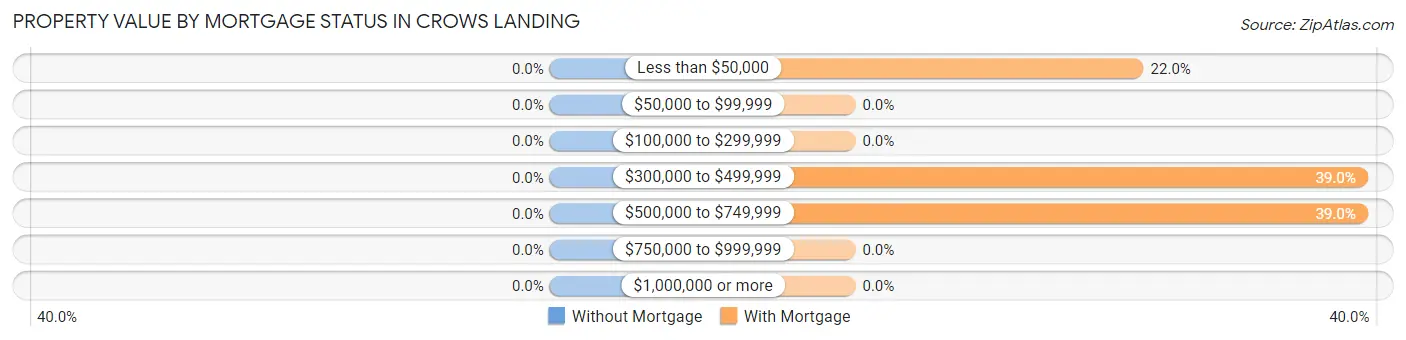
| Property Value | Without Mortgage | With Mortgage |
| Less than $50,000 | 0 (0.0%) | 9 (22.0%) |
| $50,000 to $99,999 | 0 (0.0%) | 0 (0.0%) |
| $100,000 to $299,999 | 0 (0.0%) | 0 (0.0%) |
| $300,000 to $499,999 | 0 (0.0%) | 16 (39.0%) |
| $500,000 to $749,999 | 0 (0.0%) | 16 (39.0%) |
| $750,000 to $999,999 | 0 (0.0%) | 0 (0.0%) |
| $1,000,000 or more | 0 (0.0%) | 0 (0.0%) |
| Total | 0 (0.0%) | 41 (100.0%) |
Household Income by Mortgage Status in Crows Landing
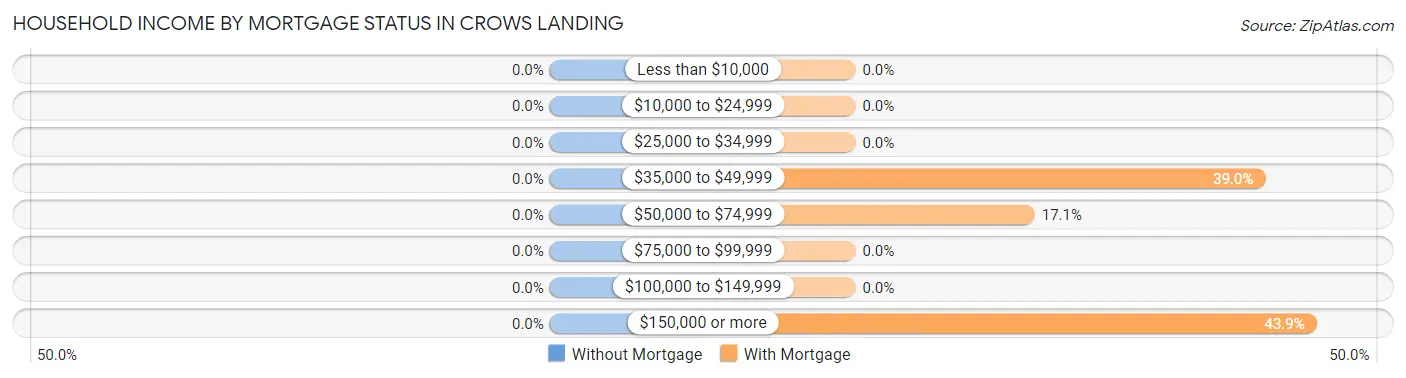
| Household Income | Without Mortgage | With Mortgage |
| Less than $10,000 | 0 (0.0%) | 0 (0.0%) |
| $10,000 to $24,999 | 0 (0.0%) | 0 (0.0%) |
| $25,000 to $34,999 | 0 (0.0%) | 0 (0.0%) |
| $35,000 to $49,999 | 0 (0.0%) | 16 (39.0%) |
| $50,000 to $74,999 | 0 (0.0%) | 7 (17.1%) |
| $75,000 to $99,999 | 0 (0.0%) | 0 (0.0%) |
| $100,000 to $149,999 | 0 (0.0%) | 0 (0.0%) |
| $150,000 or more | 0 (0.0%) | 18 (43.9%) |
| Total | 0 (0.0%) | 41 (100.0%) |
Property Value to Household Income Ratio in Crows Landing
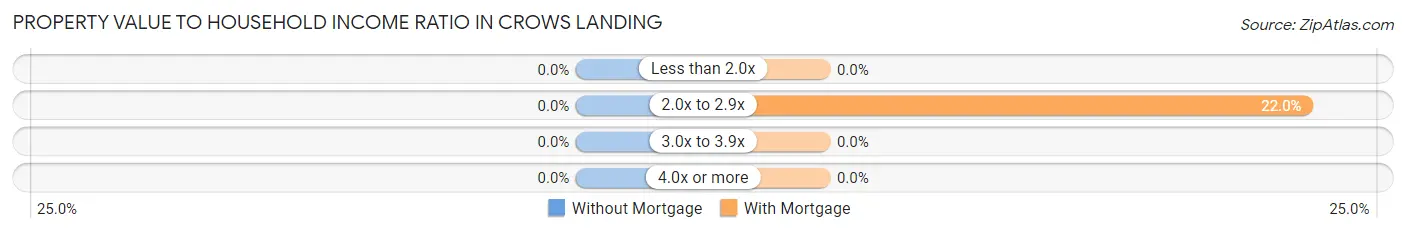
| Value-to-Income Ratio | Without Mortgage | With Mortgage |
| Less than 2.0x | 0 (0.0%) | 0 (0.0%) |
| 2.0x to 2.9x | 0 (0.0%) | 9 (22.0%) |
| 3.0x to 3.9x | 0 (0.0%) | 0 (0.0%) |
| 4.0x or more | 0 (0.0%) | 0 (0.0%) |
| Total | 0 (0.0%) | 41 (100.0%) |
Real Estate Taxes by Mortgage Status in Crows Landing
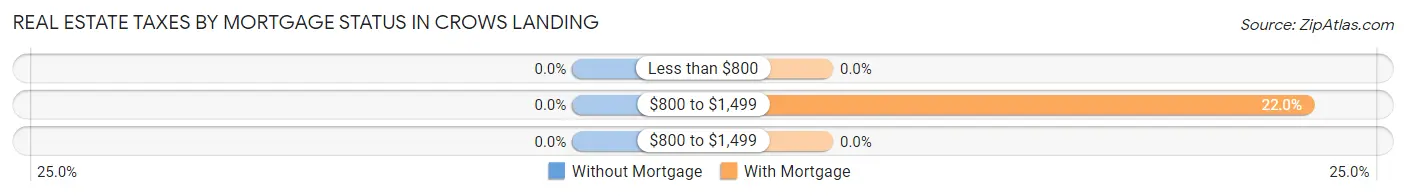
| Property Taxes | Without Mortgage | With Mortgage |
| Less than $800 | 0 (0.0%) | 0 (0.0%) |
| $800 to $1,499 | 0 (0.0%) | 9 (22.0%) |
| $800 to $1,499 | 0 (0.0%) | 0 (0.0%) |
| Total | 0 (0.0%) | 41 (100.0%) |
Health & Disability in Crows Landing
Health Insurance Coverage by Age in Crows Landing
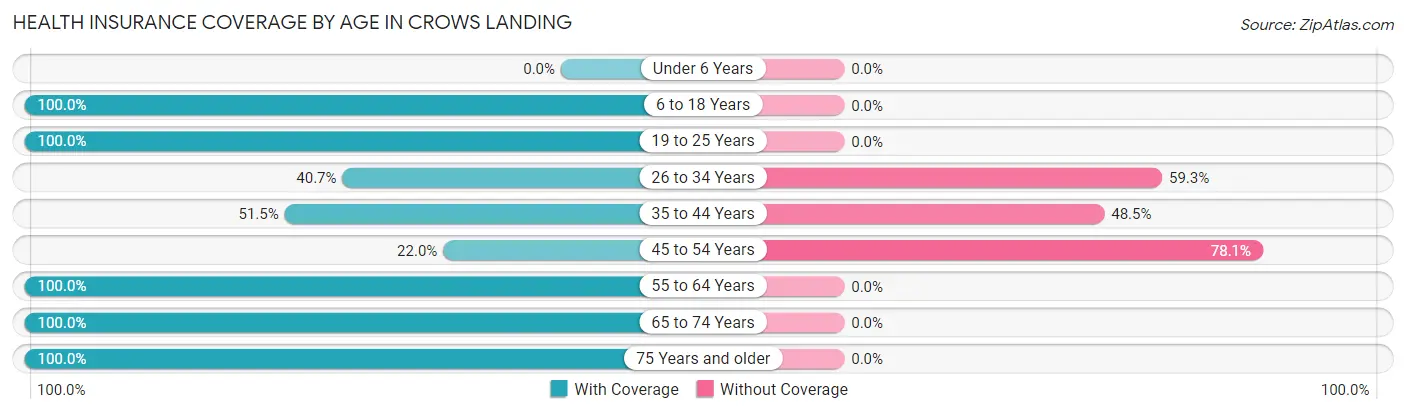
| Age Bracket | With Coverage | Without Coverage |
| Under 6 Years | 0 (0.0%) | 0 (0.0%) |
| 6 to 18 Years | 27 (100.0%) | 0 (0.0%) |
| 19 to 25 Years | 7 (100.0%) | 0 (0.0%) |
| 26 to 34 Years | 11 (40.7%) | 16 (59.3%) |
| 35 to 44 Years | 17 (51.5%) | 16 (48.5%) |
| 45 to 54 Years | 9 (22.0%) | 32 (78.0%) |
| 55 to 64 Years | 33 (100.0%) | 0 (0.0%) |
| 65 to 74 Years | 28 (100.0%) | 0 (0.0%) |
| 75 Years and older | 16 (100.0%) | 0 (0.0%) |
| Total | 148 (69.8%) | 64 (30.2%) |
Health Insurance Coverage by Citizenship Status in Crows Landing
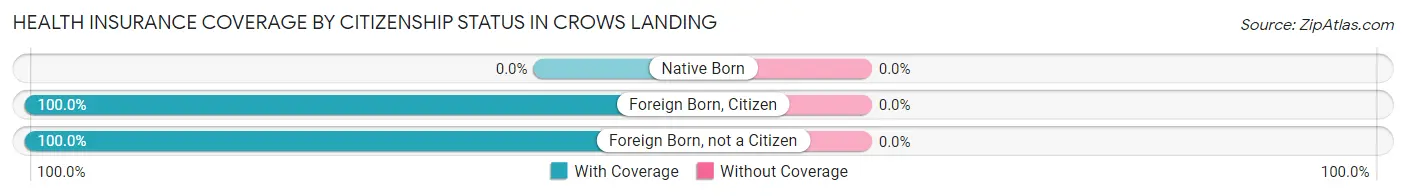
| Citizenship Status | With Coverage | Without Coverage |
| Native Born | 0 (0.0%) | 0 (0.0%) |
| Foreign Born, Citizen | 27 (100.0%) | 0 (0.0%) |
| Foreign Born, not a Citizen | 7 (100.0%) | 0 (0.0%) |
Health Insurance Coverage by Household Income in Crows Landing
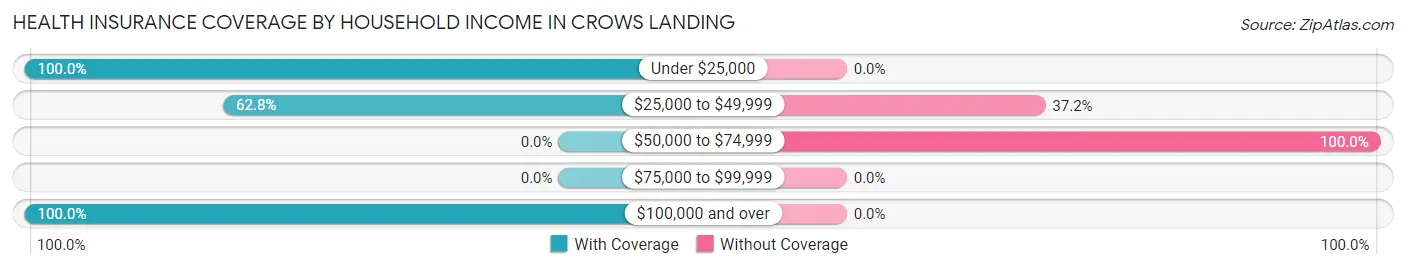
| Household Income | With Coverage | Without Coverage |
| Under $25,000 | 30 (100.0%) | 0 (0.0%) |
| $25,000 to $49,999 | 54 (62.8%) | 32 (37.2%) |
| $50,000 to $74,999 | 0 (0.0%) | 32 (100.0%) |
| $75,000 to $99,999 | 0 (0.0%) | 0 (0.0%) |
| $100,000 and over | 64 (100.0%) | 0 (0.0%) |
Public vs Private Health Insurance Coverage by Age in Crows Landing
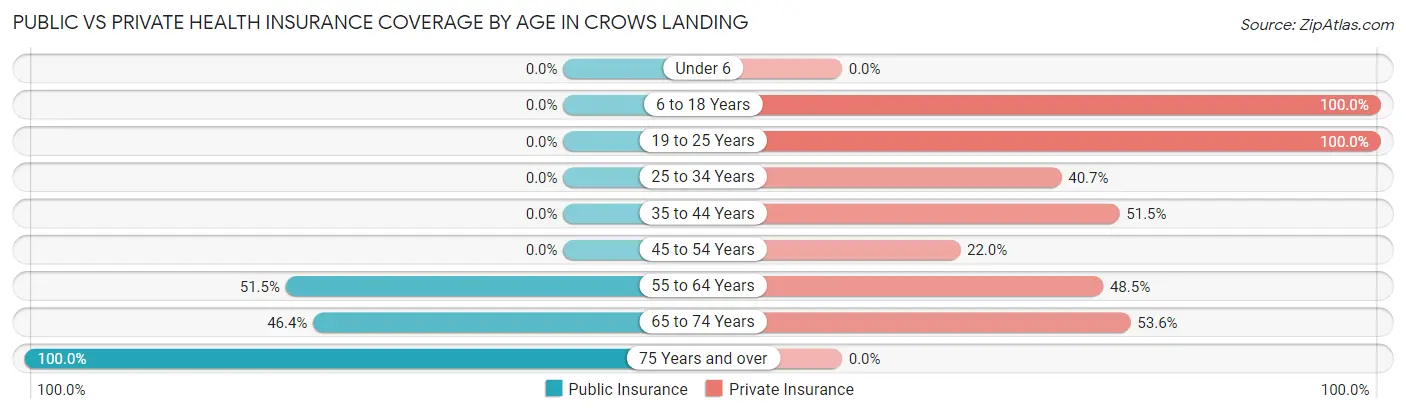
| Age Bracket | Public Insurance | Private Insurance |
| Under 6 | 0 (0.0%) | 0 (0.0%) |
| 6 to 18 Years | 0 (0.0%) | 27 (100.0%) |
| 19 to 25 Years | 0 (0.0%) | 7 (100.0%) |
| 25 to 34 Years | 0 (0.0%) | 11 (40.7%) |
| 35 to 44 Years | 0 (0.0%) | 17 (51.5%) |
| 45 to 54 Years | 0 (0.0%) | 9 (22.0%) |
| 55 to 64 Years | 17 (51.5%) | 16 (48.5%) |
| 65 to 74 Years | 13 (46.4%) | 15 (53.6%) |
| 75 Years and over | 16 (100.0%) | 0 (0.0%) |
| Total | 46 (21.7%) | 102 (48.1%) |
Disability Status by Sex by Age in Crows Landing
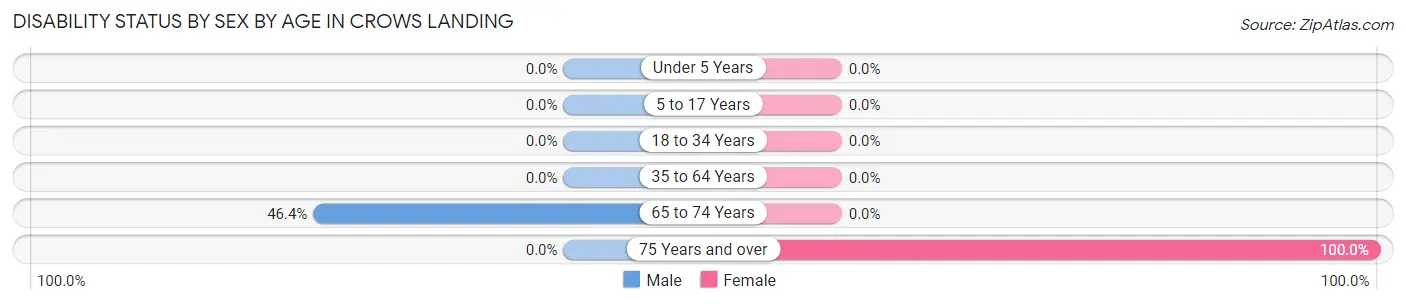
| Age Bracket | Male | Female |
| Under 5 Years | 0 (0.0%) | 0 (0.0%) |
| 5 to 17 Years | 0 (0.0%) | 0 (0.0%) |
| 18 to 34 Years | 0 (0.0%) | 0 (0.0%) |
| 35 to 64 Years | 0 (0.0%) | 0 (0.0%) |
| 65 to 74 Years | 13 (46.4%) | 0 (0.0%) |
| 75 Years and over | 0 (0.0%) | 16 (100.0%) |
Disability Class by Sex by Age in Crows Landing
Disability Class: Hearing Difficulty
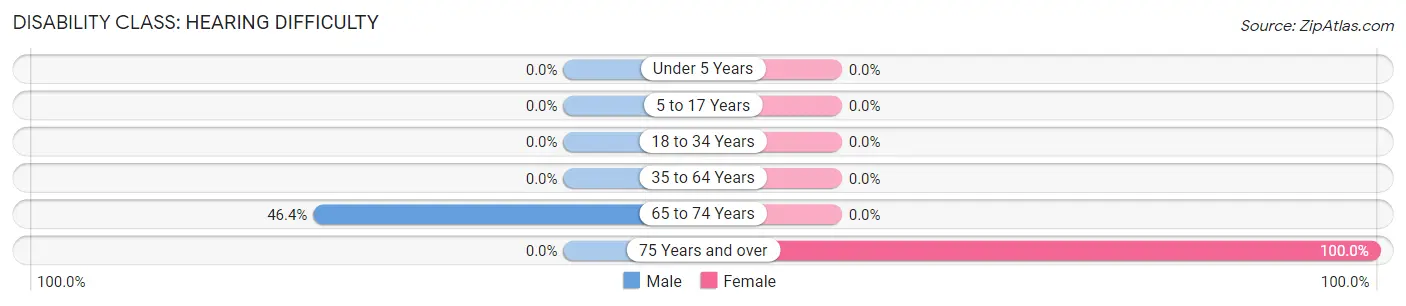
| Age Bracket | Male | Female |
| Under 5 Years | 0 (0.0%) | 0 (0.0%) |
| 5 to 17 Years | 0 (0.0%) | 0 (0.0%) |
| 18 to 34 Years | 0 (0.0%) | 0 (0.0%) |
| 35 to 64 Years | 0 (0.0%) | 0 (0.0%) |
| 65 to 74 Years | 13 (46.4%) | 0 (0.0%) |
| 75 Years and over | 0 (0.0%) | 16 (100.0%) |
Disability Class: Vision Difficulty
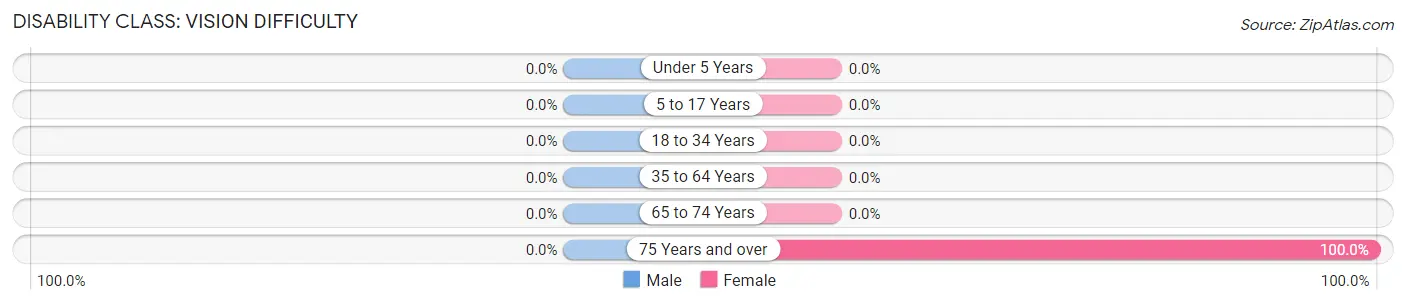
| Age Bracket | Male | Female |
| Under 5 Years | 0 (0.0%) | 0 (0.0%) |
| 5 to 17 Years | 0 (0.0%) | 0 (0.0%) |
| 18 to 34 Years | 0 (0.0%) | 0 (0.0%) |
| 35 to 64 Years | 0 (0.0%) | 0 (0.0%) |
| 65 to 74 Years | 0 (0.0%) | 0 (0.0%) |
| 75 Years and over | 0 (0.0%) | 16 (100.0%) |
Disability Class: Cognitive Difficulty
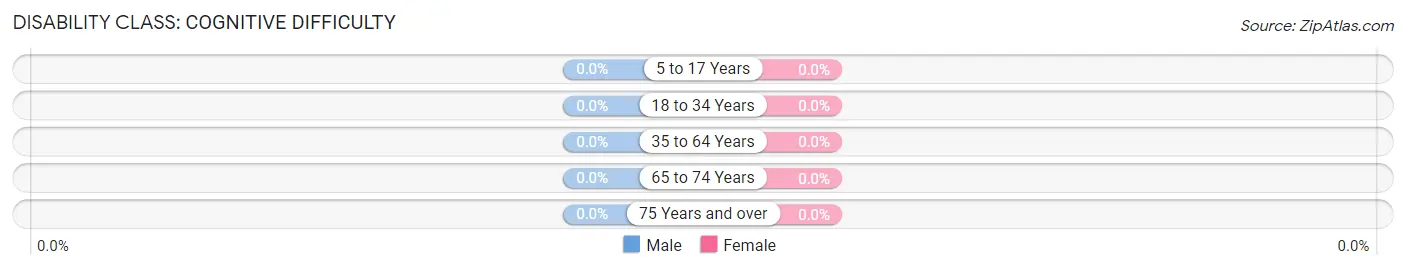
| Age Bracket | Male | Female |
| 5 to 17 Years | 0 (0.0%) | 0 (0.0%) |
| 18 to 34 Years | 0 (0.0%) | 0 (0.0%) |
| 35 to 64 Years | 0 (0.0%) | 0 (0.0%) |
| 65 to 74 Years | 0 (0.0%) | 0 (0.0%) |
| 75 Years and over | 0 (0.0%) | 0 (0.0%) |
Disability Class: Ambulatory Difficulty
| Age Bracket | Male | Female |
| 5 to 17 Years | 0 (0.0%) | 0 (0.0%) |
| 18 to 34 Years | 0 (0.0%) | 0 (0.0%) |
| 35 to 64 Years | 0 (0.0%) | 0 (0.0%) |
| 65 to 74 Years | 0 (0.0%) | 0 (0.0%) |
| 75 Years and over | 0 (0.0%) | 0 (0.0%) |
Disability Class: Self-Care Difficulty
| Age Bracket | Male | Female |
| 5 to 17 Years | 0 (0.0%) | 0 (0.0%) |
| 18 to 34 Years | 0 (0.0%) | 0 (0.0%) |
| 35 to 64 Years | 0 (0.0%) | 0 (0.0%) |
| 65 to 74 Years | 0 (0.0%) | 0 (0.0%) |
| 75 Years and over | 0 (0.0%) | 0 (0.0%) |
Technology Access in Crows Landing
Computing Device Access in Crows Landing
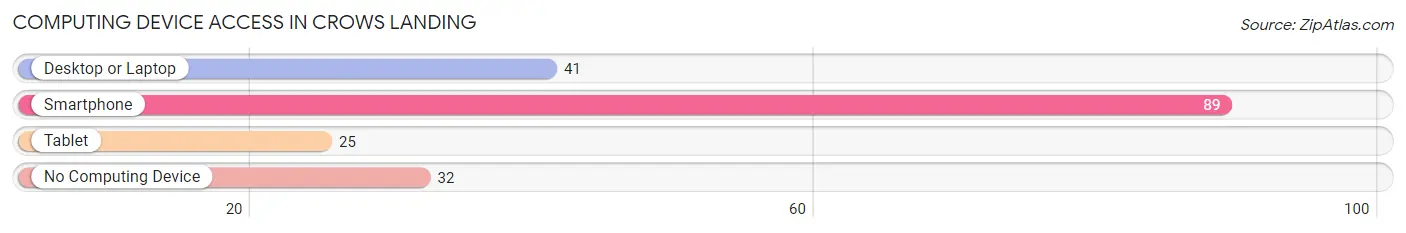
| Device Type | # Households | % Households |
| Desktop or Laptop | 41 | 33.9% |
| Smartphone | 89 | 73.6% |
| Tablet | 25 | 20.7% |
| No Computing Device | 32 | 26.5% |
| Total | 121 | 100.0% |
Internet Access in Crows Landing
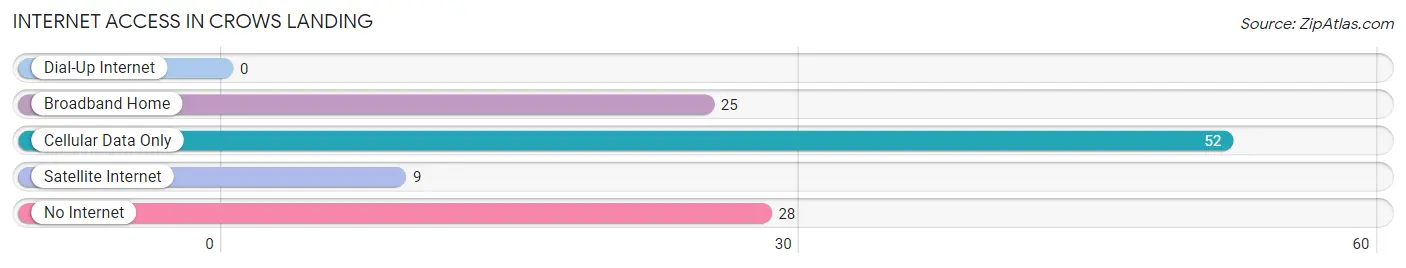
| Internet Type | # Households | % Households |
| Dial-Up Internet | 0 | 0.0% |
| Broadband Home | 25 | 20.7% |
| Cellular Data Only | 52 | 43.0% |
| Satellite Internet | 9 | 7.4% |
| No Internet | 28 | 23.1% |
| Total | 121 | 100.0% |
Crows Landing Summary
Crows Landing is a small unincorporated community located in Stanislaus County, California. It is situated in the San Joaquin Valley, approximately 10 miles east of Modesto. The population of Crows Landing was estimated to be 1,845 in 2019.
History
Crows Landing was originally inhabited by the Yokuts Indians, who were the first people to settle in the area. The Yokuts were a peaceful people who lived off the land and were known for their basket weaving and pottery.
In the late 1800s, the area was settled by European immigrants, primarily from Germany and Italy. The first post office was established in 1887 and the town was officially incorporated in 1888.
The town was named after the large number of crows that inhabited the area. The crows were attracted to the area due to the abundance of grain fields in the area.
Geography
Crows Landing is located in the San Joaquin Valley, approximately 10 miles east of Modesto. The town is situated at an elevation of approximately 100 feet above sea level.
The climate in Crows Landing is hot and dry in the summer months, with temperatures reaching up to 100 degrees Fahrenheit. In the winter months, temperatures can drop to as low as 30 degrees Fahrenheit.
The town is located in a rural area and is surrounded by farmland. The nearest major city is Modesto, which is approximately 10 miles away.
Economy
The economy of Crows Landing is primarily based on agriculture. The town is surrounded by farmland and is home to several large farms and ranches.
The town is also home to several small businesses, including a grocery store, a gas station, and a few restaurants.
Demographics
As of 2019, the population of Crows Landing was estimated to be 1,845. The racial makeup of the town was 79.3% White, 0.7% African American, 0.3% Native American, 0.2% Asian, 0.1% Pacific Islander, 16.2% from other races, and 3.4% from two or more races.
The median household income in Crows Landing was $45,000 in 2019. The median age of the population was 33.7 years.
Conclusion
Crows Landing is a small unincorporated community located in Stanislaus County, California. It is situated in the San Joaquin Valley, approximately 10 miles east of Modesto. The population of Crows Landing was estimated to be 1,845 in 2019. The economy of Crows Landing is primarily based on agriculture, with the town surrounded by farmland and home to several large farms and ranches. The racial makeup of the town was 79.3% White, 0.7% African American, 0.3% Native American, 0.2% Asian, 0.1% Pacific Islander, 16.2% from other races, and 3.4% from two or more races. The median household income in Crows Landing was $45,000 in 2019.
Common Questions
What is Per Capita Income in Crows Landing?
Per Capita income in Crows Landing is $28,580.
What is the Median Household income in Crows Landing?
Median Household Income in Crows Landing is $34,648.
What is Inequality or Gini Index in Crows Landing?
Inequality or Gini Index in Crows Landing is 0.34.
What is the Total Population of Crows Landing?
Total Population of Crows Landing is 212.
What is the Total Male Population of Crows Landing?
Total Male Population of Crows Landing is 110.
What is the Total Female Population of Crows Landing?
Total Female Population of Crows Landing is 102.
What is the Ratio of Males per 100 Females in Crows Landing?
There are 107.84 Males per 100 Females in Crows Landing.
What is the Ratio of Females per 100 Males in Crows Landing?
There are 92.73 Females per 100 Males in Crows Landing.
What is the Median Population Age in Crows Landing?
Median Population Age in Crows Landing is 45.4 Years.
What is the Average Family Size in Crows Landing
Average Family Size in Crows Landing is 2.6 People.
What is the Average Household Size in Crows Landing
Average Household Size in Crows Landing is 1.8 People.
How Large is the Labor Force in Crows Landing?
There are 99 People in the Labor Forcein in Crows Landing.
What is the Percentage of People in the Labor Force in Crows Landing?
51.3% of People are in the Labor Force in Crows Landing.