Cities with the Highest Percentage of Immigrants from Mexico in Massachusetts
RELATED REPORTS & OPTIONS
Mexico
Massachusetts
Compare Cities
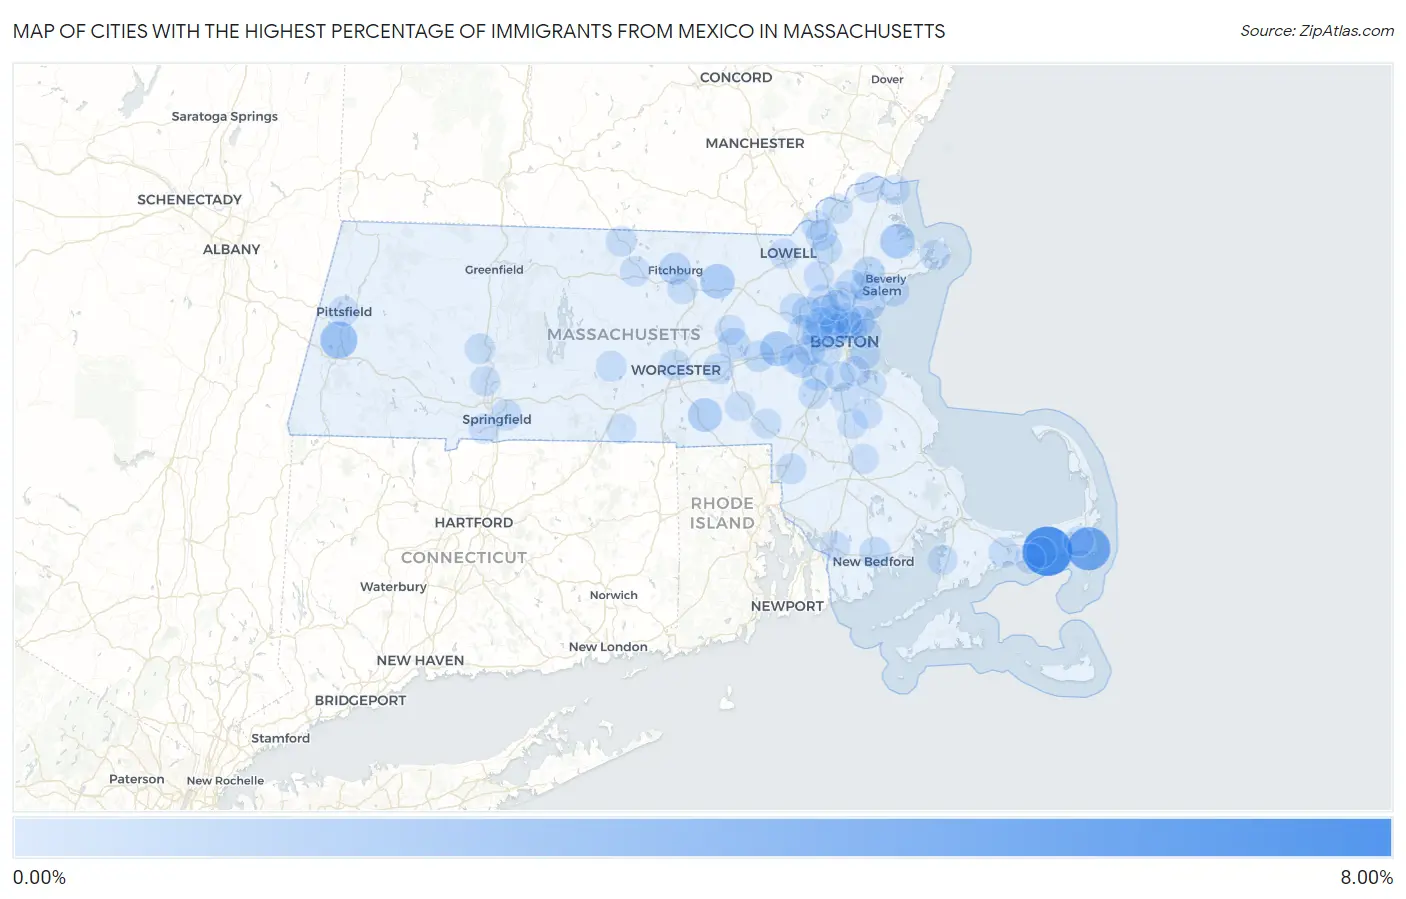
Map of Cities with the Highest Percentage of Immigrants from Mexico in Massachusetts
0.00%
8.00%
Cities with the Highest Percentage of Immigrants from Mexico in Massachusetts
| City | Mexico | vs State | vs National | |
| 1. | West Dennis | 7.21% | 0.19%(+7.02)#-1 | 3.25%(+3.96)#0 |
| 2. | West Chatham | 4.84% | 0.19%(+4.65)#0 | 3.25%(+1.59)#1 |
| 3. | Lenox | 2.50% | 0.19%(+2.31)#1 | 3.25%(-0.751)#2 |
| 4. | Cochituate | 1.66% | 0.19%(+1.47)#2 | 3.25%(-1.59)#3 |
| 5. | Ipswich | 1.60% | 0.19%(+1.41)#3 | 3.25%(-1.65)#4 |
| 6. | Devens | 1.59% | 0.19%(+1.40)#4 | 3.25%(-1.66)#5 |
| 7. | Whitinsville | 1.31% | 0.19%(+1.12)#5 | 3.25%(-1.95)#6 |
| 8. | Lynn | 0.95% | 0.19%(+0.765)#6 | 3.25%(-2.30)#7 |
| 9. | Everett | 0.73% | 0.19%(+0.538)#7 | 3.25%(-2.53)#8 |
| 10. | Fitchburg | 0.70% | 0.19%(+0.510)#8 | 3.25%(-2.56)#9 |
| 11. | Danvers | 0.68% | 0.19%(+0.494)#9 | 3.25%(-2.57)#10 |
| 12. | Marlborough | 0.56% | 0.19%(+0.373)#10 | 3.25%(-2.69)#11 |
| 13. | Chelsea | 0.51% | 0.19%(+0.322)#11 | 3.25%(-2.74)#12 |
| 14. | Dedham | 0.49% | 0.19%(+0.298)#12 | 3.25%(-2.77)#13 |
| 15. | Lexington | 0.48% | 0.19%(+0.292)#13 | 3.25%(-2.77)#14 |
| 16. | Framingham | 0.47% | 0.19%(+0.278)#14 | 3.25%(-2.79)#15 |
| 17. | New Bedford | 0.45% | 0.19%(+0.260)#15 | 3.25%(-2.80)#16 |
| 18. | Lawrence | 0.38% | 0.19%(+0.193)#16 | 3.25%(-2.87)#17 |
| 19. | Westborough | 0.37% | 0.19%(+0.178)#17 | 3.25%(-2.89)#18 |
| 20. | Andover | 0.36% | 0.19%(+0.174)#18 | 3.25%(-2.89)#19 |
| 21. | Boston | 0.36% | 0.19%(+0.171)#19 | 3.25%(-2.89)#158 |
| 22. | Amherst | 0.35% | 0.19%(+0.160)#20 | 3.25%(-2.90)#159 |
| 23. | Salem | 0.35% | 0.19%(+0.159)#21 | 3.25%(-2.91)#160 |
| 24. | Springfield | 0.34% | 0.19%(+0.149)#22 | 3.25%(-2.92)#161 |
| 25. | Cambridge | 0.31% | 0.19%(+0.127)#23 | 3.25%(-2.94)#162 |
| 26. | Worcester | 0.30% | 0.19%(+0.110)#24 | 3.25%(-2.96)#163 |
| 27. | Belmont | 0.30% | 0.19%(+0.109)#25 | 3.25%(-2.96)#164 |
| 28. | Needham | 0.29% | 0.19%(+0.101)#26 | 3.25%(-2.96)#165 |
| 29. | Hanscom Afb | 0.28% | 0.19%(+0.093)#27 | 3.25%(-2.97)#166 |
| 30. | Revere | 0.27% | 0.19%(+0.079)#28 | 3.25%(-2.99)#167 |
| 31. | Watertown Town | 0.26% | 0.19%(+0.077)#29 | 3.25%(-2.99)#168 |
| 32. | North Brookfield | 0.25% | 0.19%(+0.059)#30 | 3.25%(-3.01)#169 |
| 33. | Brookline | 0.25% | 0.19%(+0.059)#31 | 3.25%(-3.01)#170 |
| 34. | Norwood | 0.24% | 0.19%(+0.052)#32 | 3.25%(-3.01)#171 |
| 35. | Malden | 0.24% | 0.19%(+0.048)#33 | 3.25%(-3.02)#172 |
| 36. | Waltham | 0.23% | 0.19%(+0.043)#34 | 3.25%(-3.02)#173 |
| 37. | Woburn | 0.22% | 0.19%(+0.035)#35 | 3.25%(-3.03)#174 |
| 38. | Newton | 0.21% | 0.19%(+0.024)#36 | 3.25%(-3.04)#175 |
| 39. | Barnstable Town | 0.21% | 0.19%(+0.021)#37 | 3.25%(-3.04)#178 |
| 40. | Attleboro | 0.21% | 0.19%(+0.020)#38 | 3.25%(-3.04)#179 |
| 41. | Northampton | 0.20% | 0.19%(+0.015)#39 | 3.25%(-3.05)#180 |
| 42. | Winchendon | 0.20% | 0.19%(+0.015)#40 | 3.25%(-3.05)#181 |
| 43. | Medford | 0.20% | 0.19%(+0.011)#41 | 3.25%(-3.05)#182 |
| 44. | Leominster | 0.19% | 0.19%(+0.006)#42 | 3.25%(-3.06)#183 |
| 45. | South Yarmouth | 0.19% | 0.19%(-0.001)#43 | 3.25%(-3.07)#184 |
| 46. | Somerville | 0.19% | 0.19%(-0.002)#44 | 3.25%(-3.07)#185 |
| 47. | Arlington | 0.19% | 0.19%(-0.002)#45 | 3.25%(-3.07)#186 |
| 48. | Winthrop Town | 0.18% | 0.19%(-0.003)#46 | 3.25%(-3.07)#187 |
| 49. | Gloucester | 0.18% | 0.19%(-0.006)#47 | 3.25%(-3.07)#188 |
| 50. | Gardner | 0.17% | 0.19%(-0.016)#48 | 3.25%(-3.08)#189 |
| 51. | Pittsfield | 0.16% | 0.19%(-0.027)#49 | 3.25%(-3.09)#190 |
| 52. | East Harwich | 0.16% | 0.19%(-0.029)#50 | 3.25%(-3.09)#191 |
| 53. | Milton | 0.13% | 0.19%(-0.057)#51 | 3.25%(-3.12)#192 |
| 54. | Lowell | 0.13% | 0.19%(-0.060)#52 | 3.25%(-3.12)#193 |
| 55. | Salisbury | 0.11% | 0.19%(-0.073)#53 | 3.25%(-3.14)#194 |
| 56. | Wilmington | 0.11% | 0.19%(-0.079)#54 | 3.25%(-3.14)#195 |
| 57. | Agawam Town | 0.098% | 0.19%(-0.089)#55 | 3.25%(-3.15)#196 |
| 58. | Lynnfield | 0.093% | 0.19%(-0.094)#56 | 3.25%(-3.16)#197 |
| 59. | North Falmouth | 0.086% | 0.19%(-0.101)#57 | 3.25%(-3.17)#198 |
| 60. | Haverhill | 0.085% | 0.19%(-0.102)#58 | 3.25%(-3.17)#199 |
| 61. | Holyoke | 0.084% | 0.19%(-0.103)#59 | 3.25%(-3.17)#200 |
| 62. | Winchester | 0.083% | 0.19%(-0.104)#60 | 3.25%(-3.17)#201 |
| 63. | Quincy | 0.082% | 0.19%(-0.105)#61 | 3.25%(-3.17)#202 |
| 64. | West Yarmouth | 0.082% | 0.19%(-0.105)#62 | 3.25%(-3.17)#203 |
| 65. | Hudson | 0.077% | 0.19%(-0.110)#63 | 3.25%(-3.17)#204 |
| 66. | Methuen Town | 0.074% | 0.19%(-0.113)#64 | 3.25%(-3.18)#205 |
| 67. | Fall River | 0.074% | 0.19%(-0.113)#65 | 3.25%(-3.18)#206 |
| 68. | Wakefield | 0.070% | 0.19%(-0.117)#66 | 3.25%(-3.18)#207 |
| 69. | Amesbury Town | 0.069% | 0.19%(-0.118)#67 | 3.25%(-3.18)#208 |
| 70. | Brockton | 0.069% | 0.19%(-0.118)#68 | 3.25%(-3.18)#209 |
| 71. | Stoneham | 0.065% | 0.19%(-0.122)#69 | 3.25%(-3.19)#210 |
| 72. | Franklin Town | 0.064% | 0.19%(-0.123)#70 | 3.25%(-3.19)#211 |
| 73. | Weymouth Town | 0.063% | 0.19%(-0.124)#71 | 3.25%(-3.19)#212 |
| 74. | Milford | 0.058% | 0.19%(-0.129)#72 | 3.25%(-3.19)#213 |
| 75. | Abington | 0.041% | 0.19%(-0.146)#73 | 3.25%(-3.21)#214 |
| 76. | Wellesley | 0.037% | 0.19%(-0.150)#74 | 3.25%(-3.22)#215 |
| 77. | Bridgewater Town | 0.028% | 0.19%(-0.159)#75 | 3.25%(-3.22)#216 |
| 78. | Randolph Town | 0.026% | 0.19%(-0.161)#76 | 3.25%(-3.23)#217 |
| 79. | Peabody | 0.013% | 0.19%(-0.174)#77 | 3.25%(-3.24)#218 |
| 80. | Southbridge Town | 0.011% | 0.19%(-0.176)#78 | 3.25%(-3.24)#219 |
Common Questions
What are the Top 10 Cities with the Highest Percentage of Immigrants from Mexico in Massachusetts?
Top 10 Cities with the Highest Percentage of Immigrants from Mexico in Massachusetts are:
#1
7.21%
#2
4.84%
#3
2.50%
#4
1.66%
#5
1.60%
#6
1.59%
#7
1.31%
#8
0.95%
#9
0.73%
#10
0.70%
What city has the Highest Percentage of Immigrants from Mexico in Massachusetts?
West Dennis has the Highest Percentage of Immigrants from Mexico in Massachusetts with 7.21%.
What is the Percentage of Immigrants from Mexico in the State of Massachusetts?
Percentage of Immigrants from Mexico in Massachusetts is 0.19%.
What is the Percentage of Immigrants from Mexico in the United States?
Percentage of Immigrants from Mexico in the United States is 3.25%.