Mattawa, WA Map & Demographics
Mattawa Map
Mattawa Overview
$15,025
PER CAPITA INCOME
$41,250
AVG FAMILY INCOME
$45,500
AVG HOUSEHOLD INCOME
25.4%
WAGE / INCOME GAP [ % ]
74.6¢/ $1
WAGE / INCOME GAP [ $ ]
$12,636
FAMILY INCOME DEFICIT
0.36
INEQUALITY / GINI INDEX
3,506
TOTAL POPULATION
1,840
MALE POPULATION
1,666
FEMALE POPULATION
110.44
MALES / 100 FEMALES
90.54
FEMALES / 100 MALES
23.7
MEDIAN AGE
3.9
AVG FAMILY SIZE
3.9
AVG HOUSEHOLD SIZE
1,731
LABOR FORCE [ PEOPLE ]
70.7%
PERCENT IN LABOR FORCE
10.9%
UNEMPLOYMENT RATE
Mattawa Zip Codes
Mattawa Area Codes
Income in Mattawa
Income Overview in Mattawa
Per Capita Income in Mattawa is $15,025, while median incomes of families and households are $41,250 and $45,500 respectively.
| Characteristic | Number | Measure |
| Per Capita Income | 3,506 | $15,025 |
| Median Family Income | 800 | $41,250 |
| Mean Family Income | 800 | $48,060 |
| Median Household Income | 892 | $45,500 |
| Mean Household Income | 892 | $53,036 |
| Income Deficit | 800 | $12,636 |
| Wage / Income Gap (%) | 3,506 | 25.40% |
| Wage / Income Gap ($) | 3,506 | 74.60¢ per $1 |
| Gini / Inequality Index | 3,506 | 0.36 |
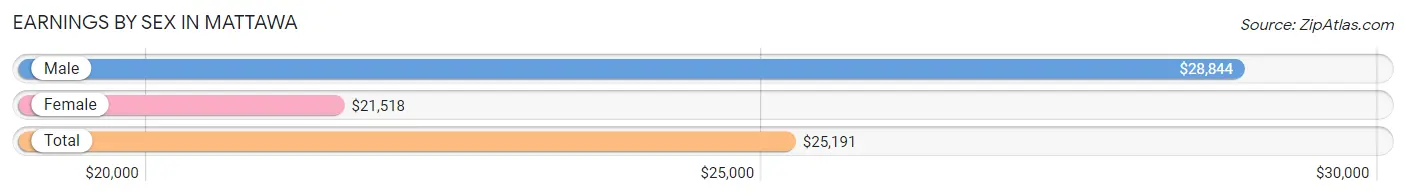
Earnings by Sex in Mattawa
Average Earnings in Mattawa are $25,191, $28,844 for men and $21,518 for women, a difference of 25.4%.
| Sex | Number | Average Earnings |
| Male | 986 (53.4%) | $28,844 |
| Female | 861 (46.6%) | $21,518 |
| Total | 1,847 (100.0%) | $25,191 |
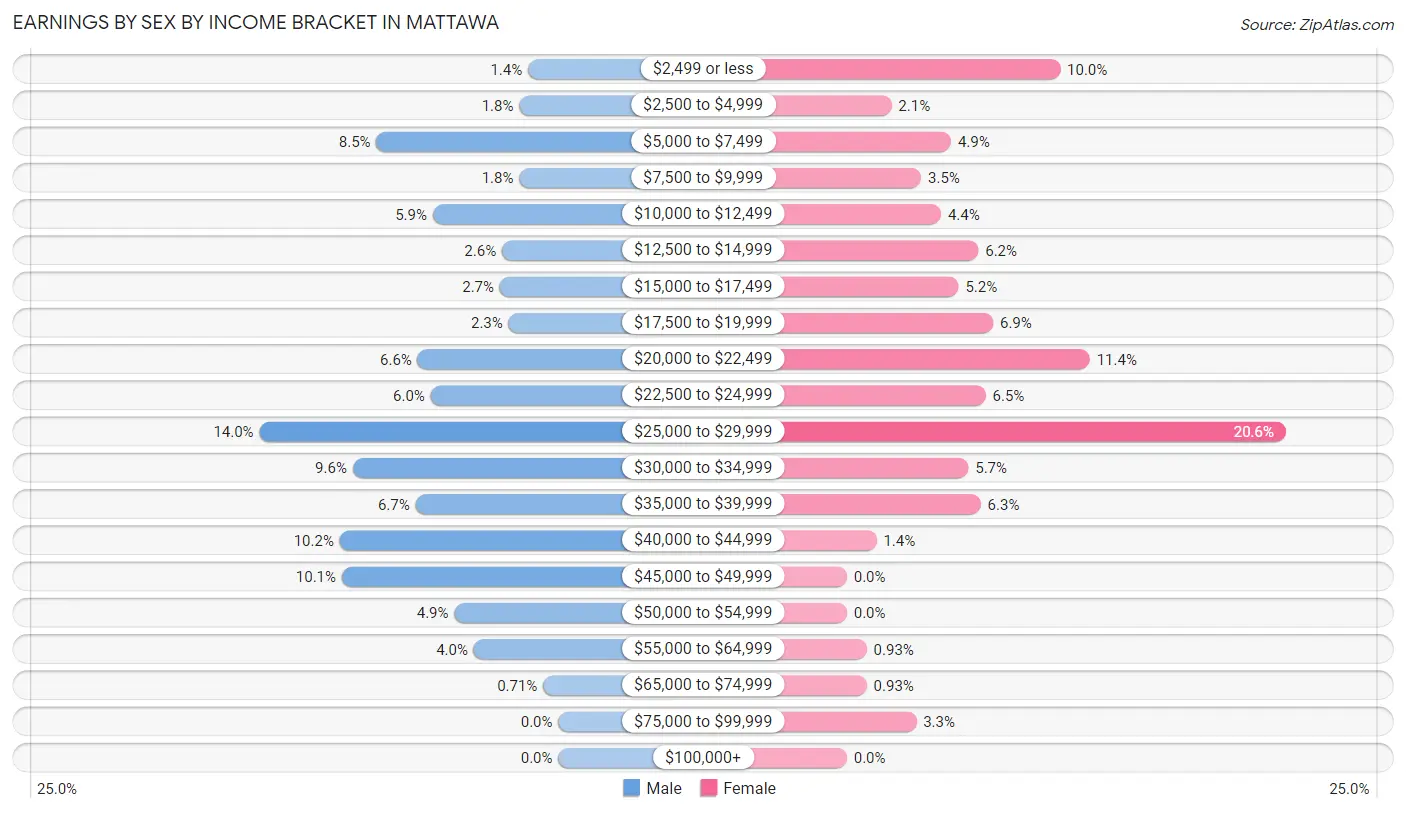
Earnings by Sex by Income Bracket in Mattawa
The most common earnings brackets in Mattawa are $25,000 to $29,999 for men (138 | 14.0%) and $25,000 to $29,999 for women (177 | 20.6%).
| Income | Male | Female |
| $2,499 or less | 14 (1.4%) | 86 (10.0%) |
| $2,500 to $4,999 | 18 (1.8%) | 18 (2.1%) |
| $5,000 to $7,499 | 84 (8.5%) | 42 (4.9%) |
| $7,500 to $9,999 | 18 (1.8%) | 30 (3.5%) |
| $10,000 to $12,499 | 58 (5.9%) | 38 (4.4%) |
| $12,500 to $14,999 | 26 (2.6%) | 53 (6.2%) |
| $15,000 to $17,499 | 27 (2.7%) | 45 (5.2%) |
| $17,500 to $19,999 | 23 (2.3%) | 59 (6.9%) |
| $20,000 to $22,499 | 65 (6.6%) | 98 (11.4%) |
| $22,500 to $24,999 | 59 (6.0%) | 56 (6.5%) |
| $25,000 to $29,999 | 138 (14.0%) | 177 (20.6%) |
| $30,000 to $34,999 | 95 (9.6%) | 49 (5.7%) |
| $35,000 to $39,999 | 66 (6.7%) | 54 (6.3%) |
| $40,000 to $44,999 | 101 (10.2%) | 12 (1.4%) |
| $45,000 to $49,999 | 100 (10.1%) | 0 (0.0%) |
| $50,000 to $54,999 | 48 (4.9%) | 0 (0.0%) |
| $55,000 to $64,999 | 39 (4.0%) | 8 (0.9%) |
| $65,000 to $74,999 | 7 (0.7%) | 8 (0.9%) |
| $75,000 to $99,999 | 0 (0.0%) | 28 (3.3%) |
| $100,000+ | 0 (0.0%) | 0 (0.0%) |
| Total | 986 (100.0%) | 861 (100.0%) |
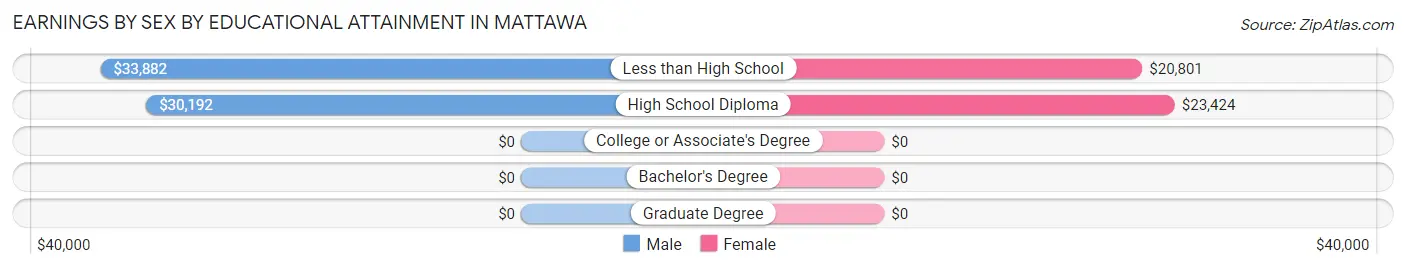
Earnings by Sex by Educational Attainment in Mattawa
Average earnings in Mattawa are $31,976 for men and $22,056 for women, a difference of 31.0%. Men with an educational attainment of less than high school enjoy the highest average annual earnings of $33,882, while those with high school diploma education earn the least with $30,192. Women with an educational attainment of high school diploma earn the most with the average annual earnings of $23,424, while those with less than high school education have the smallest earnings of $20,801.
| Educational Attainment | Male Income | Female Income |
| Less than High School | $33,882 | $20,801 |
| High School Diploma | $30,192 | $23,424 |
| College or Associate's Degree | - | - |
| Bachelor's Degree | - | - |
| Graduate Degree | - | - |
| Total | $31,976 | $22,056 |
Family Income in Mattawa
Family Income Brackets in Mattawa
According to the Mattawa family income data, there are 184 families falling into the $25,000 to $34,999 income range, which is the most common income bracket and makes up 23.0% of all families.
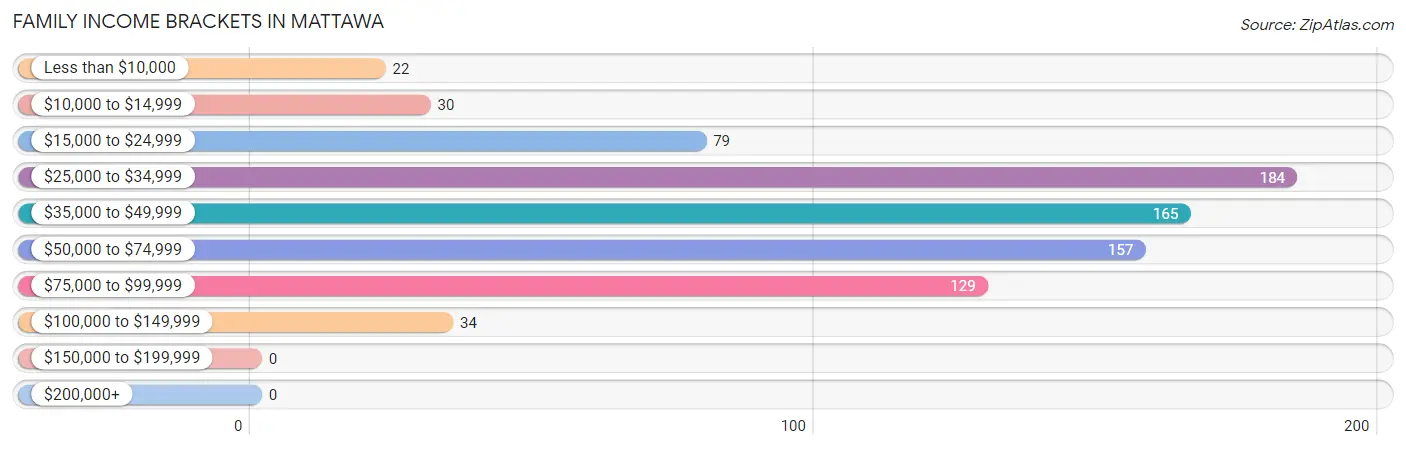
| Income Bracket | # Families | % Families |
| Less than $10,000 | 22 | 2.8% |
| $10,000 to $14,999 | 30 | 3.8% |
| $15,000 to $24,999 | 79 | 9.9% |
| $25,000 to $34,999 | 184 | 23.0% |
| $35,000 to $49,999 | 165 | 20.6% |
| $50,000 to $74,999 | 157 | 19.6% |
| $75,000 to $99,999 | 129 | 16.1% |
| $100,000 to $149,999 | 34 | 4.3% |
| $150,000 to $199,999 | 0 | 0.0% |
| $200,000+ | 0 | 0.0% |
Family Income by Famaliy Size in Mattawa
6-person families (28 | 3.5%) account for the highest median family income in Mattawa with $117,222 per family, while 2-person families (112 | 14.0%) have the highest median income of $24,302 per family member.
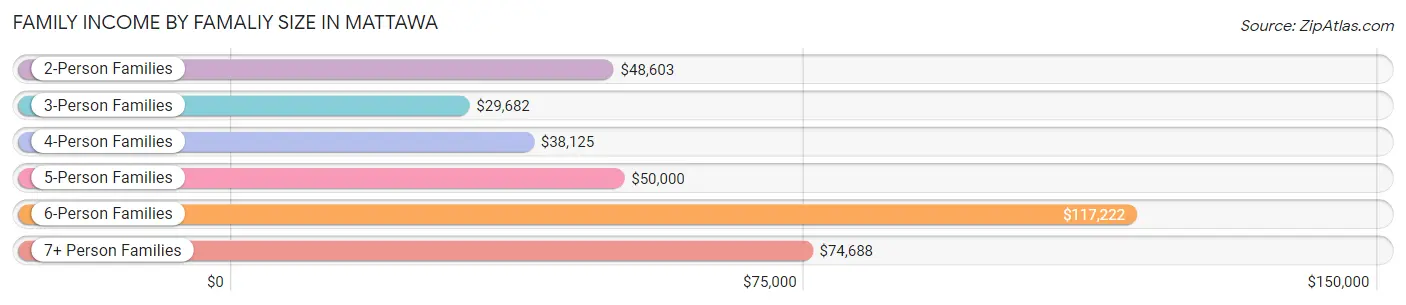
| Income Bracket | # Families | Median Income |
| 2-Person Families | 112 (14.0%) | $48,603 |
| 3-Person Families | 229 (28.6%) | $29,682 |
| 4-Person Families | 242 (30.2%) | $38,125 |
| 5-Person Families | 148 (18.5%) | $50,000 |
| 6-Person Families | 28 (3.5%) | $117,222 |
| 7+ Person Families | 41 (5.1%) | $74,688 |
| Total | 800 (100.0%) | $41,250 |
Family Income by Number of Earners in Mattawa
The median family income in Mattawa is $41,250, with families comprising 3+ earners (140) having the highest median family income of $83,333, while families with no earners (32) have the lowest median family income of $2,499, accounting for 17.5% and 4.0% of families, respectively.
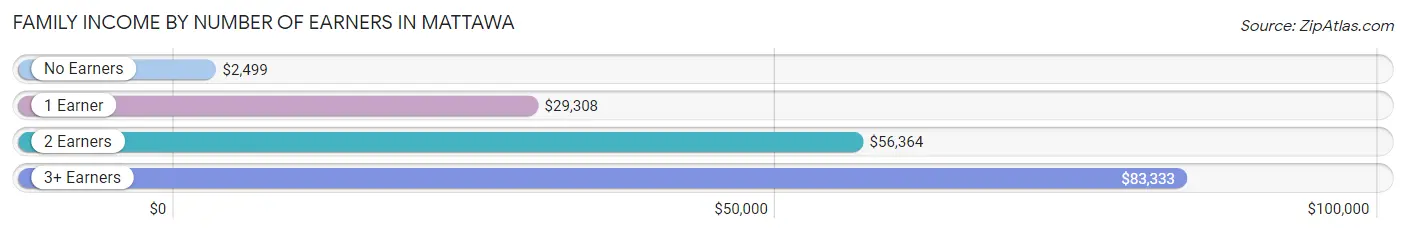
| Number of Earners | # Families | Median Income |
| No Earners | 32 (4.0%) | $2,499 |
| 1 Earner | 364 (45.5%) | $29,308 |
| 2 Earners | 264 (33.0%) | $56,364 |
| 3+ Earners | 140 (17.5%) | $83,333 |
| Total | 800 (100.0%) | $41,250 |
Household Income in Mattawa
Household Income Brackets in Mattawa
With 189 households falling in the category, the $25,000 to $34,999 income range is the most frequent in Mattawa, accounting for 21.2% of all households.
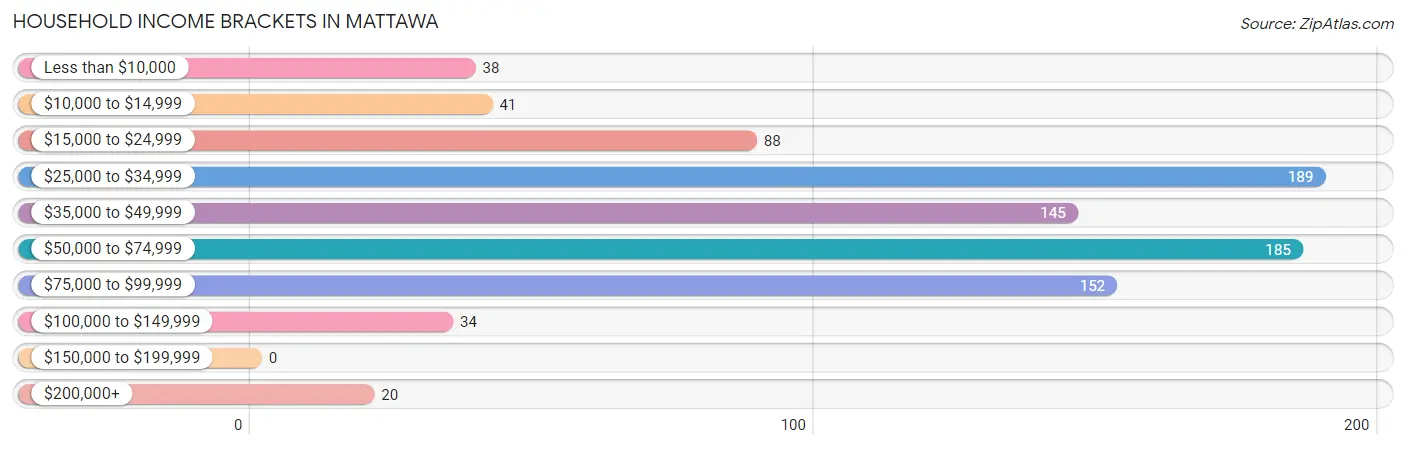
| Income Bracket | # Households | % Households |
| Less than $10,000 | 38 | 4.3% |
| $10,000 to $14,999 | 41 | 4.6% |
| $15,000 to $24,999 | 88 | 9.9% |
| $25,000 to $34,999 | 189 | 21.2% |
| $35,000 to $49,999 | 145 | 16.3% |
| $50,000 to $74,999 | 185 | 20.7% |
| $75,000 to $99,999 | 152 | 17.0% |
| $100,000 to $149,999 | 34 | 3.8% |
| $150,000 to $199,999 | 0 | 0.0% |
| $200,000+ | 20 | 2.2% |
Household Income by Householder Age in Mattawa
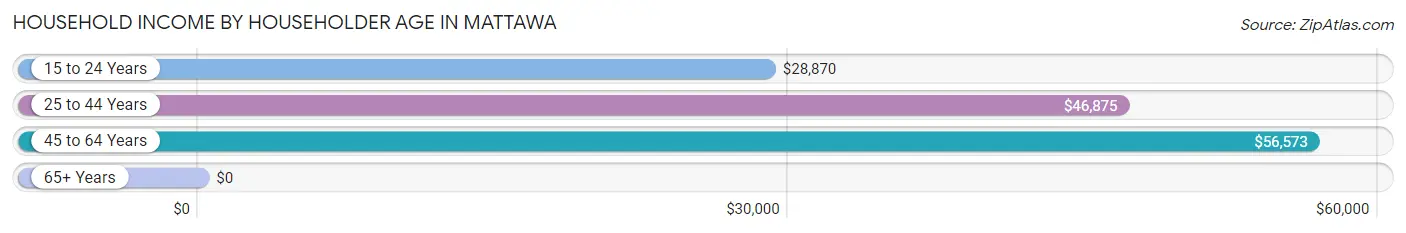
The median household income in Mattawa is $45,500, with the highest median household income of $56,573 found in the 45 to 64 years age bracket for the primary householder. A total of 305 households (34.2%) fall into this category. Meanwhile, the 65+ years age bracket for the primary householder has the lowest median household income of $0, with 71 households (8.0%) in this group.
| Income Bracket | # Households | Median Income |
| 15 to 24 Years | 127 (14.2%) | $28,870 |
| 25 to 44 Years | 389 (43.6%) | $46,875 |
| 45 to 64 Years | 305 (34.2%) | $56,573 |
| 65+ Years | 71 (8.0%) | $0 |
| Total | 892 (100.0%) | $45,500 |
Poverty in Mattawa
Income Below Poverty by Sex and Age in Mattawa
With 23.8% poverty level for males and 19.8% for females among the residents of Mattawa, 65 to 74 year old males and under 5 year old females are the most vulnerable to poverty, with 28 males (65.1%) and 43 females (41.7%) in their respective age groups living below the poverty level.
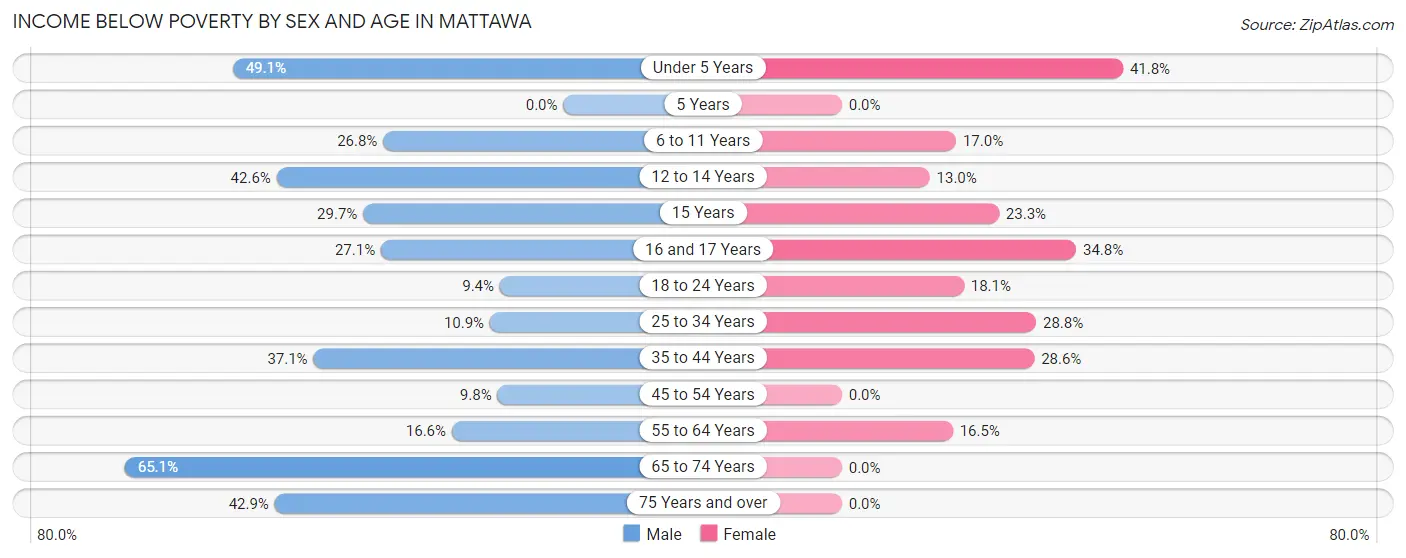
| Age Bracket | Male | Female |
| Under 5 Years | 81 (49.1%) | 43 (41.7%) |
| 5 Years | 0 (0.0%) | 0 (0.0%) |
| 6 to 11 Years | 61 (26.8%) | 38 (17.0%) |
| 12 to 14 Years | 63 (42.6%) | 6 (13.0%) |
| 15 Years | 11 (29.7%) | 7 (23.3%) |
| 16 and 17 Years | 13 (27.1%) | 32 (34.8%) |
| 18 to 24 Years | 33 (9.4%) | 67 (18.1%) |
| 25 to 34 Years | 23 (10.9%) | 62 (28.8%) |
| 35 to 44 Years | 59 (37.1%) | 60 (28.6%) |
| 45 to 54 Years | 18 (9.8%) | 0 (0.0%) |
| 55 to 64 Years | 27 (16.6%) | 14 (16.5%) |
| 65 to 74 Years | 28 (65.1%) | 0 (0.0%) |
| 75 Years and over | 21 (42.9%) | 0 (0.0%) |
| Total | 438 (23.8%) | 329 (19.8%) |
Income Above Poverty by Sex and Age in Mattawa
According to the poverty statistics in Mattawa, males aged 5 years and females aged 5 years are the age groups that are most secure financially, with 100.0% of males and 100.0% of females in these age groups living above the poverty line.
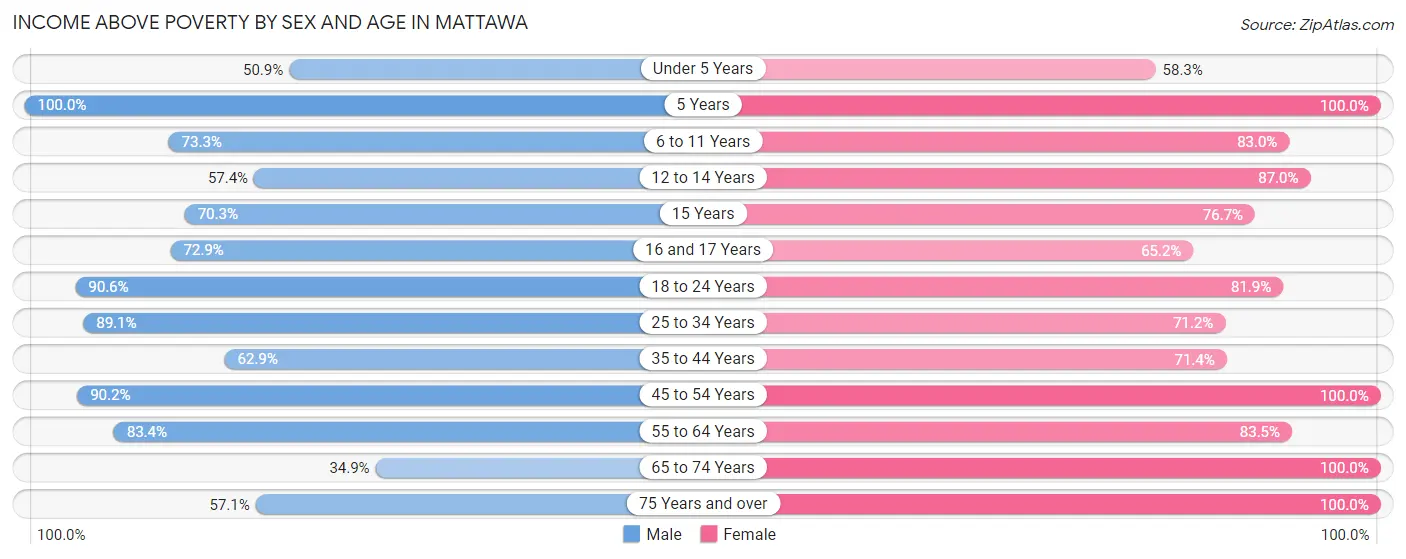
| Age Bracket | Male | Female |
| Under 5 Years | 84 (50.9%) | 60 (58.3%) |
| 5 Years | 55 (100.0%) | 22 (100.0%) |
| 6 to 11 Years | 167 (73.3%) | 186 (83.0%) |
| 12 to 14 Years | 85 (57.4%) | 40 (87.0%) |
| 15 Years | 26 (70.3%) | 23 (76.7%) |
| 16 and 17 Years | 35 (72.9%) | 60 (65.2%) |
| 18 to 24 Years | 317 (90.6%) | 303 (81.9%) |
| 25 to 34 Years | 188 (89.1%) | 153 (71.2%) |
| 35 to 44 Years | 100 (62.9%) | 150 (71.4%) |
| 45 to 54 Years | 166 (90.2%) | 212 (100.0%) |
| 55 to 64 Years | 136 (83.4%) | 71 (83.5%) |
| 65 to 74 Years | 15 (34.9%) | 10 (100.0%) |
| 75 Years and over | 28 (57.1%) | 47 (100.0%) |
| Total | 1,402 (76.2%) | 1,337 (80.2%) |
Income Below Poverty Among Married-Couple Families in Mattawa
The poverty statistics for married-couple families in Mattawa show that 9.9% or 32 of the total 323 families live below the poverty line. Families with 3 or 4 children have the highest poverty rate of 30.8%, comprising of 20 families. On the other hand, families with no children have the lowest poverty rate of 0.0%, which includes 0 families.
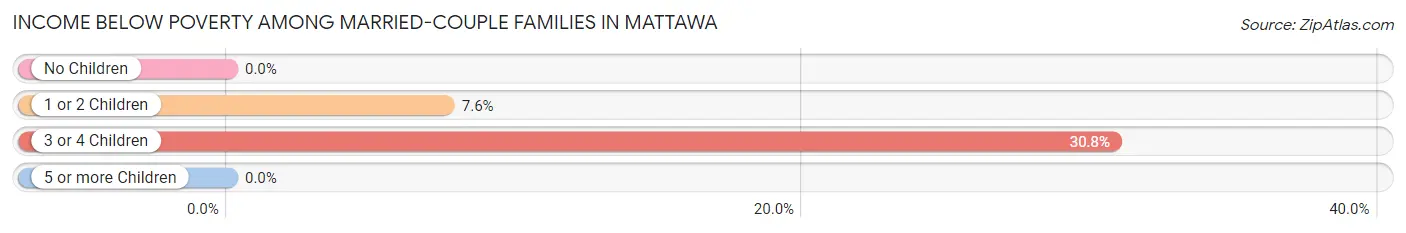
| Children | Above Poverty | Below Poverty |
| No Children | 99 (100.0%) | 0 (0.0%) |
| 1 or 2 Children | 147 (92.4%) | 12 (7.5%) |
| 3 or 4 Children | 45 (69.2%) | 20 (30.8%) |
| 5 or more Children | 0 (0.0%) | 0 (0.0%) |
| Total | 291 (90.1%) | 32 (9.9%) |
Income Below Poverty Among Single-Parent Households in Mattawa
According to the poverty data in Mattawa, 29.4% or 32 single-father households and 22.8% or 84 single-mother households are living below the poverty line. Among single-father households, those with 3 or 4 children have the highest poverty rate, with 22 households (41.5%) experiencing poverty. Likewise, among single-mother households, those with 3 or 4 children have the highest poverty rate, with 53 households (40.5%) falling below the poverty line.
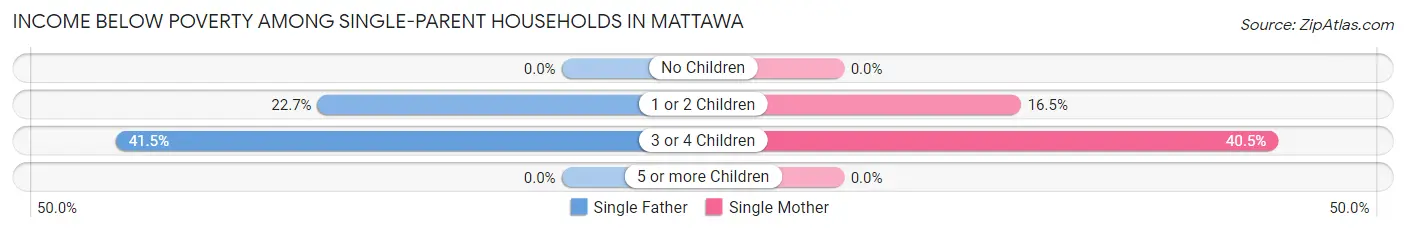
| Children | Single Father | Single Mother |
| No Children | 0 (0.0%) | 0 (0.0%) |
| 1 or 2 Children | 10 (22.7%) | 31 (16.5%) |
| 3 or 4 Children | 22 (41.5%) | 53 (40.5%) |
| 5 or more Children | 0 (0.0%) | 0 (0.0%) |
| Total | 32 (29.4%) | 84 (22.8%) |
Income Below Poverty Among Married-Couple vs Single-Parent Households in Mattawa
The poverty data for Mattawa shows that 32 of the married-couple family households (9.9%) and 116 of the single-parent households (24.3%) are living below the poverty level. Within the married-couple family households, those with 3 or 4 children have the highest poverty rate, with 20 households (30.8%) falling below the poverty line. Among the single-parent households, those with 3 or 4 children have the highest poverty rate, with 75 household (40.8%) living below poverty.
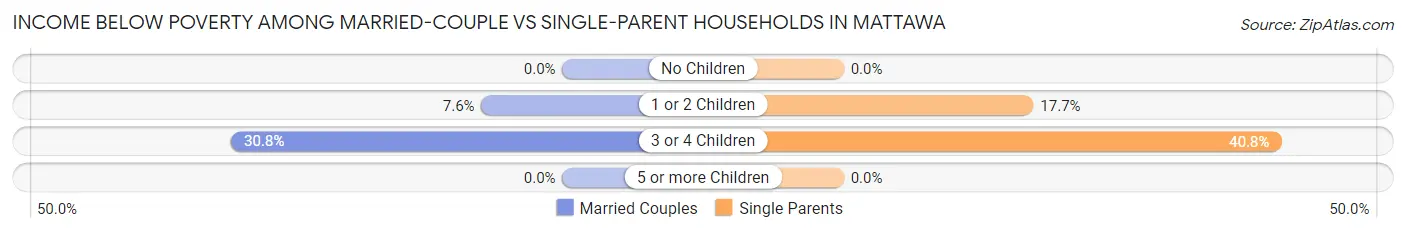
| Children | Married-Couple Families | Single-Parent Households |
| No Children | 0 (0.0%) | 0 (0.0%) |
| 1 or 2 Children | 12 (7.5%) | 41 (17.7%) |
| 3 or 4 Children | 20 (30.8%) | 75 (40.8%) |
| 5 or more Children | 0 (0.0%) | 0 (0.0%) |
| Total | 32 (9.9%) | 116 (24.3%) |
Race in Mattawa
The most populous races in Mattawa are Hispanic or Latino (3,506 | 100.0%), Some other Race (1,948 | 55.6%), and Two or more Races (766 | 21.8%).
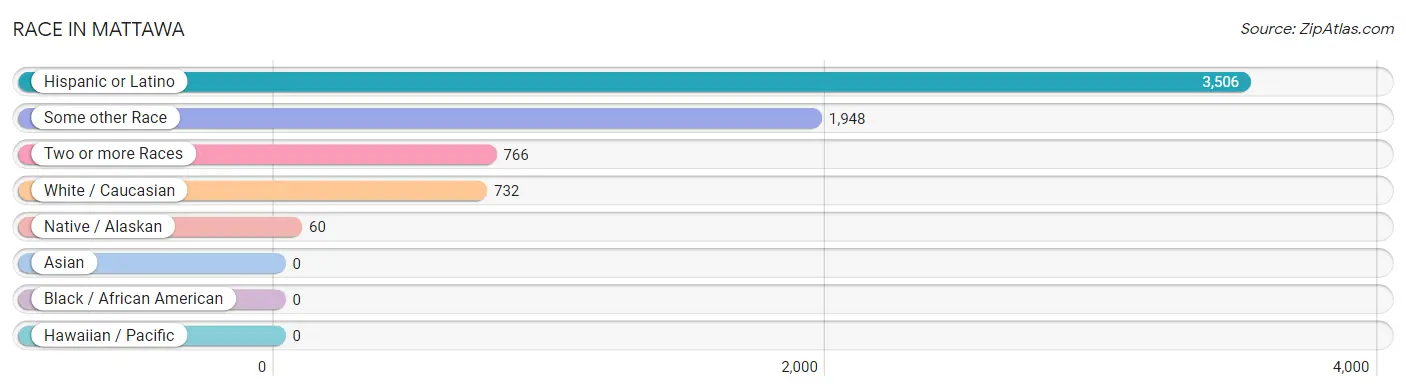
| Race | # Population | % Population |
| Asian | 0 | 0.0% |
| Black / African American | 0 | 0.0% |
| Hawaiian / Pacific | 0 | 0.0% |
| Hispanic or Latino | 3,506 | 100.0% |
| Native / Alaskan | 60 | 1.7% |
| White / Caucasian | 732 | 20.9% |
| Two or more Races | 766 | 21.8% |
| Some other Race | 1,948 | 55.6% |
| Total | 3,506 | 100.0% |
Ancestry in Mattawa
The most populous ancestries reported in Mattawa are Mexican (3,251 | 92.7%), Central American (227 | 6.5%), Guatemalan (150 | 4.3%), Salvadoran (77 | 2.2%), and Mexican American Indian (60 | 1.7%), together accounting for 107.4% of all Mattawa residents.
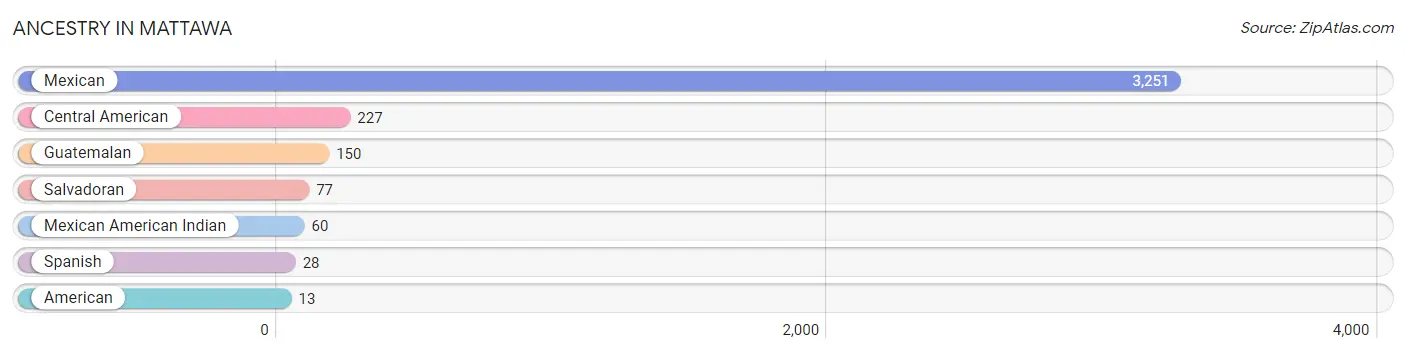
| Ancestry | # Population | % Population |
| American | 13 | 0.4% |
| Central American | 227 | 6.5% |
| Guatemalan | 150 | 4.3% |
| Mexican | 3,251 | 92.7% |
| Mexican American Indian | 60 | 1.7% |
| Salvadoran | 77 | 2.2% |
| Spanish | 28 | 0.8% | View All 7 Rows |
Immigrants in Mattawa
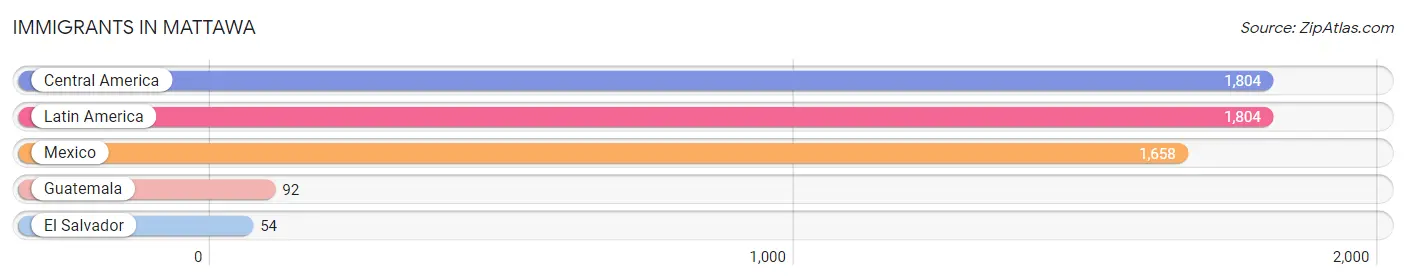
The most numerous immigrant groups reported in Mattawa came from Central America (1,804 | 51.4%), Latin America (1,804 | 51.4%), Mexico (1,658 | 47.3%), Guatemala (92 | 2.6%), and El Salvador (54 | 1.5%), together accounting for 154.4% of all Mattawa residents.
| Immigration Origin | # Population | % Population |
| Central America | 1,804 | 51.4% |
| El Salvador | 54 | 1.5% |
| Guatemala | 92 | 2.6% |
| Latin America | 1,804 | 51.4% |
| Mexico | 1,658 | 47.3% | View All 5 Rows |
Sex and Age in Mattawa
Sex and Age in Mattawa
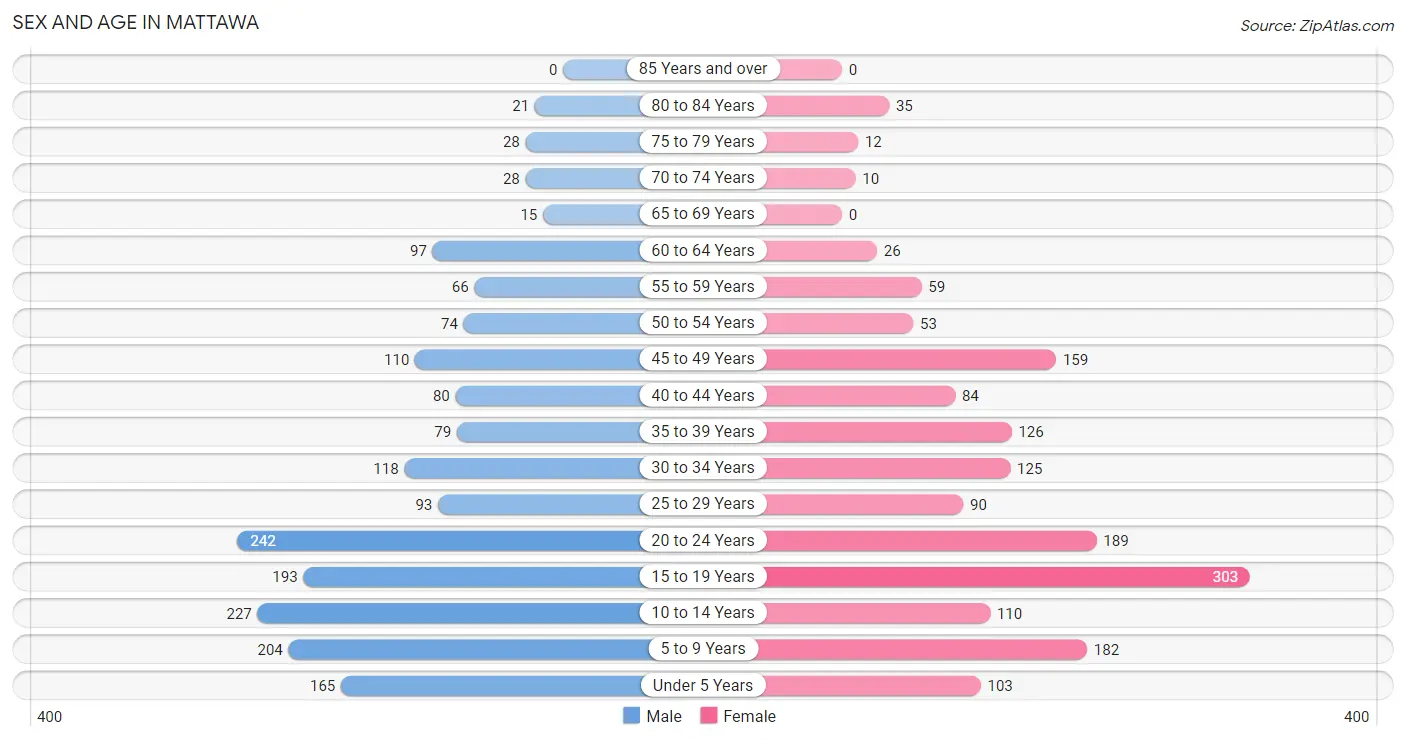
The most populous age groups in Mattawa are 20 to 24 Years (242 | 13.2%) for men and 15 to 19 Years (303 | 18.2%) for women.
| Age Bracket | Male | Female |
| Under 5 Years | 165 (9.0%) | 103 (6.2%) |
| 5 to 9 Years | 204 (11.1%) | 182 (10.9%) |
| 10 to 14 Years | 227 (12.3%) | 110 (6.6%) |
| 15 to 19 Years | 193 (10.5%) | 303 (18.2%) |
| 20 to 24 Years | 242 (13.2%) | 189 (11.3%) |
| 25 to 29 Years | 93 (5.1%) | 90 (5.4%) |
| 30 to 34 Years | 118 (6.4%) | 125 (7.5%) |
| 35 to 39 Years | 79 (4.3%) | 126 (7.6%) |
| 40 to 44 Years | 80 (4.3%) | 84 (5.0%) |
| 45 to 49 Years | 110 (6.0%) | 159 (9.5%) |
| 50 to 54 Years | 74 (4.0%) | 53 (3.2%) |
| 55 to 59 Years | 66 (3.6%) | 59 (3.5%) |
| 60 to 64 Years | 97 (5.3%) | 26 (1.6%) |
| 65 to 69 Years | 15 (0.8%) | 0 (0.0%) |
| 70 to 74 Years | 28 (1.5%) | 10 (0.6%) |
| 75 to 79 Years | 28 (1.5%) | 12 (0.7%) |
| 80 to 84 Years | 21 (1.1%) | 35 (2.1%) |
| 85 Years and over | 0 (0.0%) | 0 (0.0%) |
| Total | 1,840 (100.0%) | 1,666 (100.0%) |
Families and Households in Mattawa
Median Family Size in Mattawa
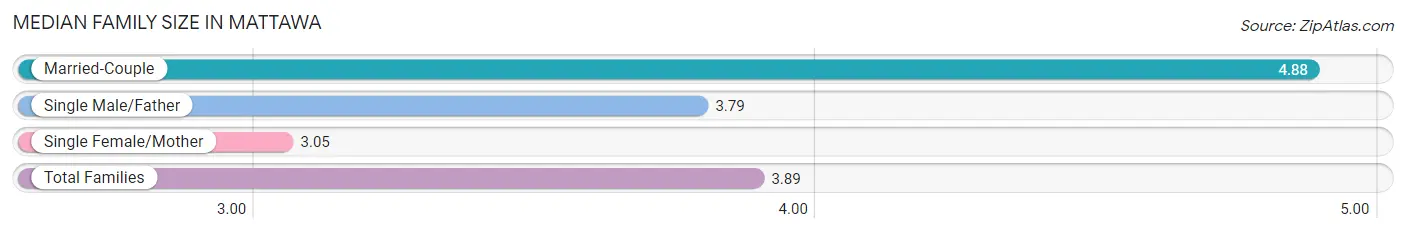
The median family size in Mattawa is 3.89 persons per family, with married-couple families (323 | 40.4%) accounting for the largest median family size of 4.88 persons per family. On the other hand, single female/mother families (368 | 46.0%) represent the smallest median family size with 3.05 persons per family.
| Family Type | # Families | Family Size |
| Married-Couple | 323 (40.4%) | 4.88 |
| Single Male/Father | 109 (13.6%) | 3.79 |
| Single Female/Mother | 368 (46.0%) | 3.05 |
| Total Families | 800 (100.0%) | 3.89 |
Median Household Size in Mattawa
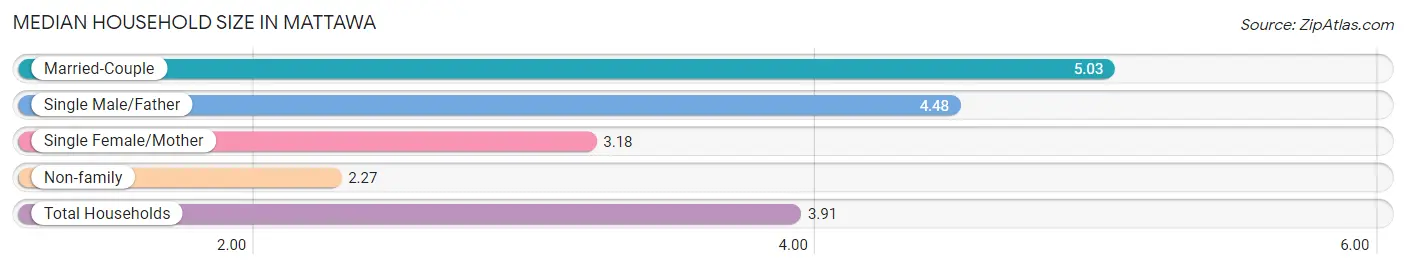
The median household size in Mattawa is 3.91 persons per household, with married-couple households (323 | 36.2%) accounting for the largest median household size of 5.03 persons per household. non-family households (92 | 10.3%) represent the smallest median household size with 2.27 persons per household.
| Household Type | # Households | Household Size |
| Married-Couple | 323 (36.2%) | 5.03 |
| Single Male/Father | 109 (12.2%) | 4.48 |
| Single Female/Mother | 368 (41.3%) | 3.18 |
| Non-family | 92 (10.3%) | 2.27 |
| Total Households | 892 (100.0%) | 3.91 |
Household Size by Marriage Status in Mattawa
Out of a total of 892 households in Mattawa, 800 (89.7%) are family households, while 92 (10.3%) are nonfamily households. The most numerous type of family households are 3-person households, comprising 217, and the most common type of nonfamily households are 1-person households, comprising 49.
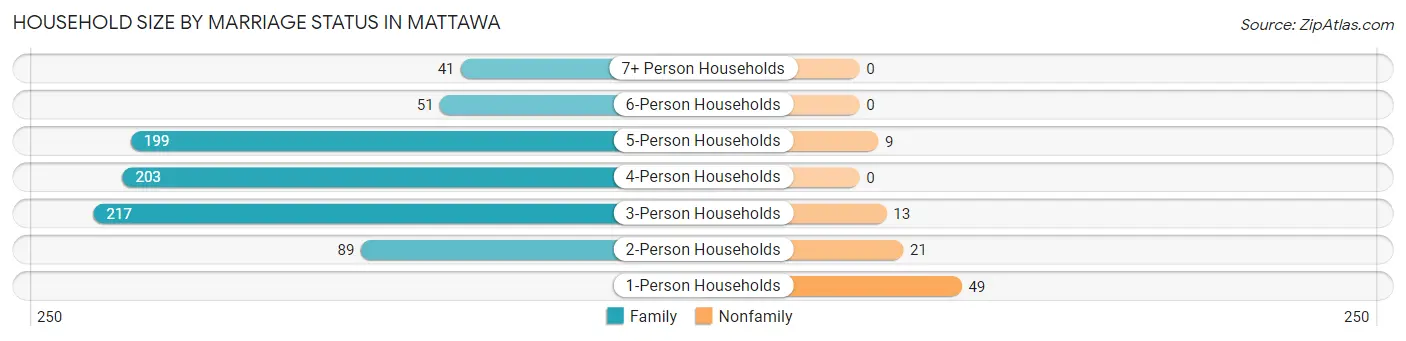
| Household Size | Family Households | Nonfamily Households |
| 1-Person Households | - | 49 (5.5%) |
| 2-Person Households | 89 (10.0%) | 21 (2.4%) |
| 3-Person Households | 217 (24.3%) | 13 (1.5%) |
| 4-Person Households | 203 (22.8%) | 0 (0.0%) |
| 5-Person Households | 199 (22.3%) | 9 (1.0%) |
| 6-Person Households | 51 (5.7%) | 0 (0.0%) |
| 7+ Person Households | 41 (4.6%) | 0 (0.0%) |
| Total | 800 (89.7%) | 92 (10.3%) |
Female Fertility in Mattawa
Fertility by Age in Mattawa
Average fertility rate in Mattawa is 36.0 births per 1,000 women. Women in the age bracket of 20 to 34 years have the highest fertility rate with 77.0 births per 1,000 women. Women in the age bracket of 20 to 34 years acount for 79.5% of all women with births.
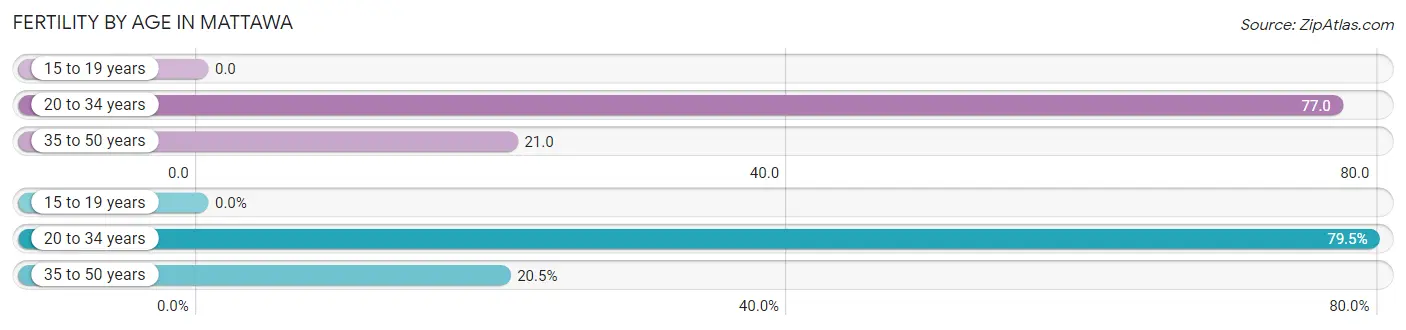
| Age Bracket | Women with Births | Births / 1,000 Women |
| 15 to 19 years | 0 (0.0%) | 0.0 |
| 20 to 34 years | 31 (79.5%) | 77.0 |
| 35 to 50 years | 8 (20.5%) | 21.0 |
| Total | 39 (100.0%) | 36.0 |
Fertility by Age by Marriage Status in Mattawa
79.5% of women with births (39) in Mattawa are married. The highest percentage of unmarried women with births falls into 20 to 34 years age bracket with 25.8% of them unmarried at the time of birth, while the lowest percentage of unmarried women with births belong to 35 to 50 years age bracket with 0.0% of them unmarried.
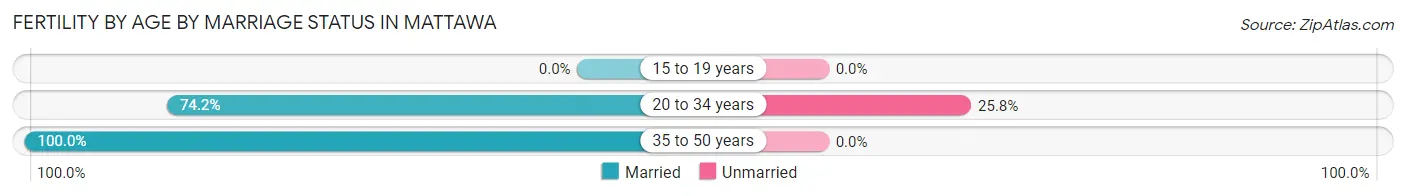
| Age Bracket | Married | Unmarried |
| 15 to 19 years | 0 (0.0%) | 0 (0.0%) |
| 20 to 34 years | 23 (74.2%) | 8 (25.8%) |
| 35 to 50 years | 8 (100.0%) | 0 (0.0%) |
| Total | 31 (79.5%) | 8 (20.5%) |
Fertility by Education in Mattawa
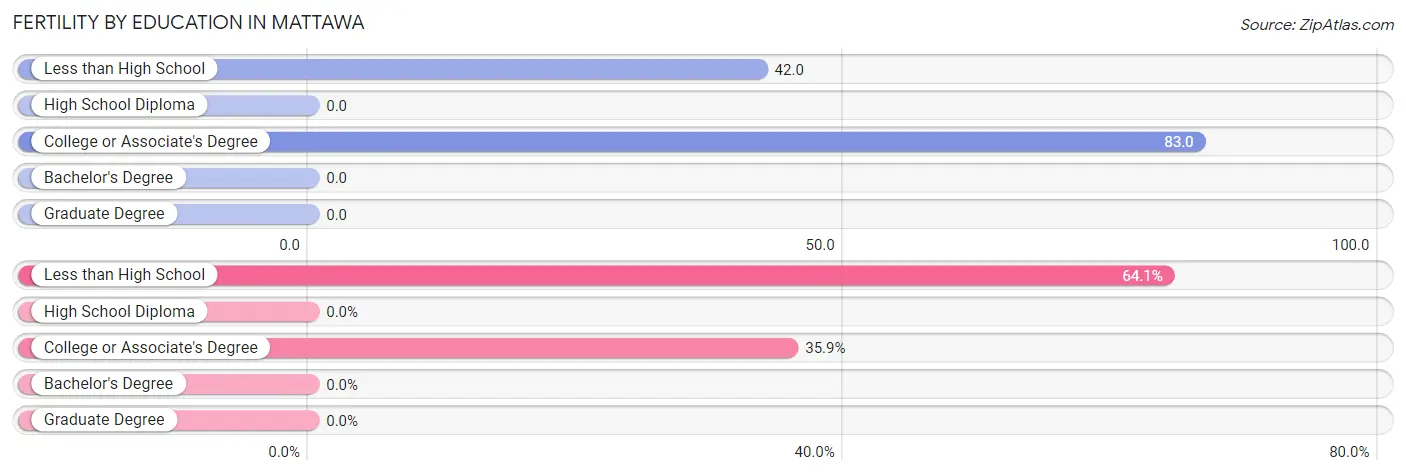
| Educational Attainment | Women with Births | Births / 1,000 Women |
| Less than High School | 25 (64.1%) | 42.0 |
| High School Diploma | 0 (0.0%) | 0.0 |
| College or Associate's Degree | 14 (35.9%) | 83.0 |
| Bachelor's Degree | 0 (0.0%) | 0.0 |
| Graduate Degree | 0 (0.0%) | 0.0 |
| Total | 39 (100.0%) | 36.0 |
Fertility by Education by Marriage Status in Mattawa
20.5% of women with births in Mattawa are unmarried. Women with the educational attainment of college or associate's degree are most likely to be married with 100.0% of them married at childbirth, while women with the educational attainment of less than high school are least likely to be married with 32.0% of them unmarried at childbirth.
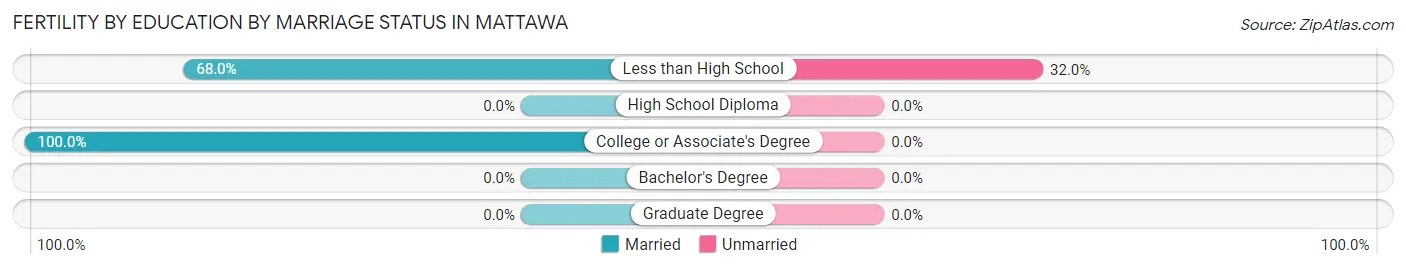
| Educational Attainment | Married | Unmarried |
| Less than High School | 17 (68.0%) | 8 (32.0%) |
| High School Diploma | 0 (0.0%) | 0 (0.0%) |
| College or Associate's Degree | 14 (100.0%) | 0 (0.0%) |
| Bachelor's Degree | 0 (0.0%) | 0 (0.0%) |
| Graduate Degree | 0 (0.0%) | 0 (0.0%) |
| Total | 31 (79.5%) | 8 (20.5%) |
Employment Characteristics in Mattawa
Employment by Class of Employer in Mattawa
Among the 1,413 employed individuals in Mattawa, private company employees (1,252 | 88.6%), local government employees (77 | 5.4%), and state government employees (54 | 3.8%) make up the most common classes of employment.
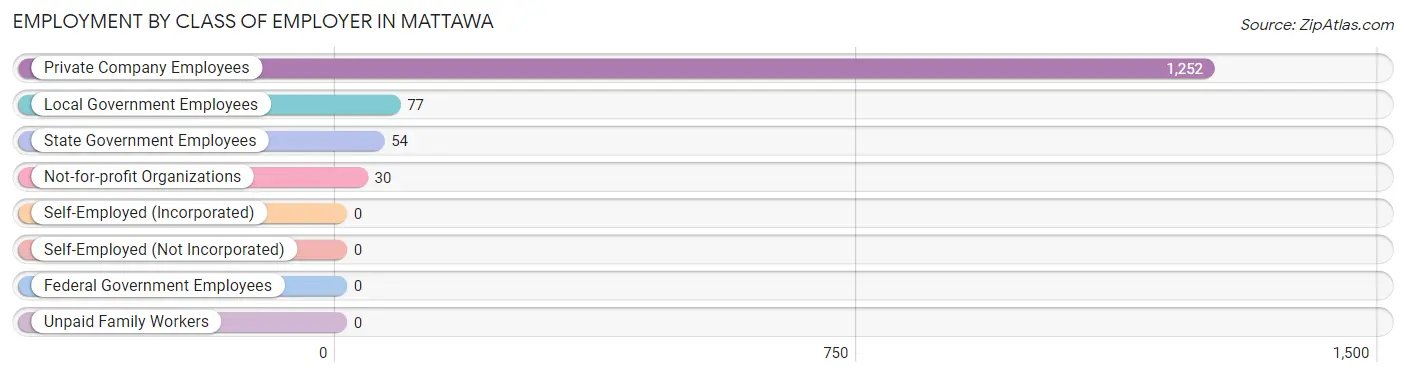
| Employer Class | # Employees | % Employees |
| Private Company Employees | 1,252 | 88.6% |
| Self-Employed (Incorporated) | 0 | 0.0% |
| Self-Employed (Not Incorporated) | 0 | 0.0% |
| Not-for-profit Organizations | 30 | 2.1% |
| Local Government Employees | 77 | 5.4% |
| State Government Employees | 54 | 3.8% |
| Federal Government Employees | 0 | 0.0% |
| Unpaid Family Workers | 0 | 0.0% |
| Total | 1,413 | 100.0% |
Employment Status by Age in Mattawa
According to the labor force statistics for Mattawa, out of the total population over 16 years of age (2,448), 70.7% or 1,731 individuals are in the labor force, with 10.9% or 189 of them unemployed. The age group with the highest labor force participation rate is 35 to 44 years, with 89.2% or 329 individuals in the labor force. Within the labor force, the 16 to 19 years age range has the highest percentage of unemployed individuals, with 57.9% or 110 of them being unemployed.
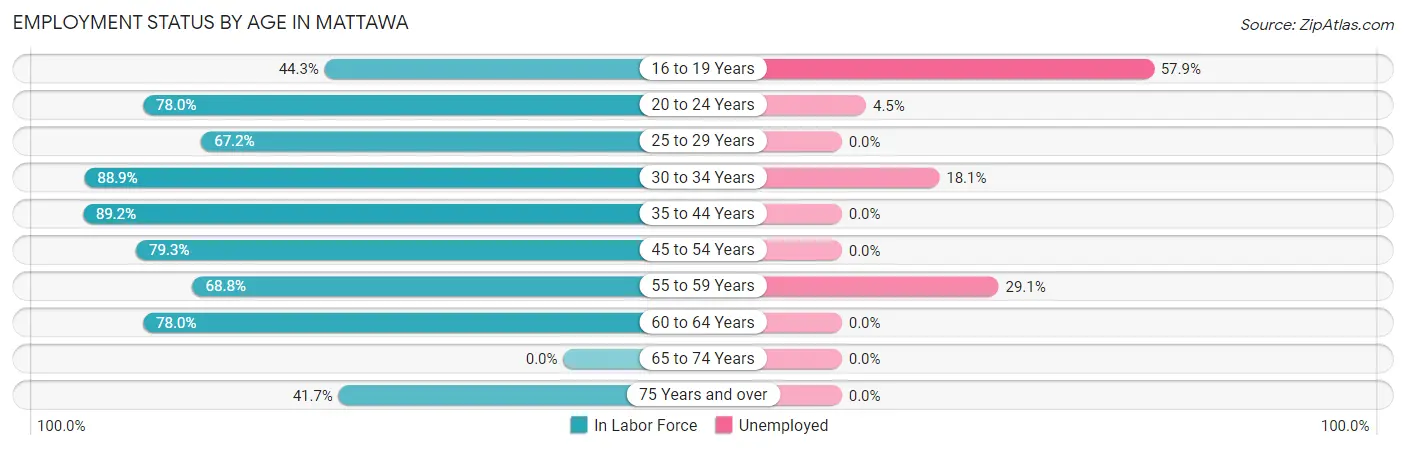
| Age Bracket | In Labor Force | Unemployed |
| 16 to 19 Years | 190 (44.3%) | 110 (57.9%) |
| 20 to 24 Years | 336 (78.0%) | 15 (4.5%) |
| 25 to 29 Years | 123 (67.2%) | 0 (0.0%) |
| 30 to 34 Years | 216 (88.9%) | 39 (18.1%) |
| 35 to 44 Years | 329 (89.2%) | 0 (0.0%) |
| 45 to 54 Years | 314 (79.3%) | 0 (0.0%) |
| 55 to 59 Years | 86 (68.8%) | 25 (29.1%) |
| 60 to 64 Years | 96 (78.0%) | 0 (0.0%) |
| 65 to 74 Years | 0 (0.0%) | 0 (0.0%) |
| 75 Years and over | 40 (41.7%) | 0 (0.0%) |
| Total | 1,731 (70.7%) | 189 (10.9%) |
Employment Status by Educational Attainment in Mattawa
According to labor force statistics for Mattawa, 80.9% of individuals (1,164) out of the total population between 25 and 64 years of age (1,439) are in the labor force, with 5.5% or 64 of them being unemployed. The group with the highest labor force participation rate are those with the educational attainment of college / associate degree, with 100.0% or 64 individuals in the labor force. Within the labor force, individuals with less than high school education have the highest percentage of unemployment, with 7.2% or 59 of them being unemployed.
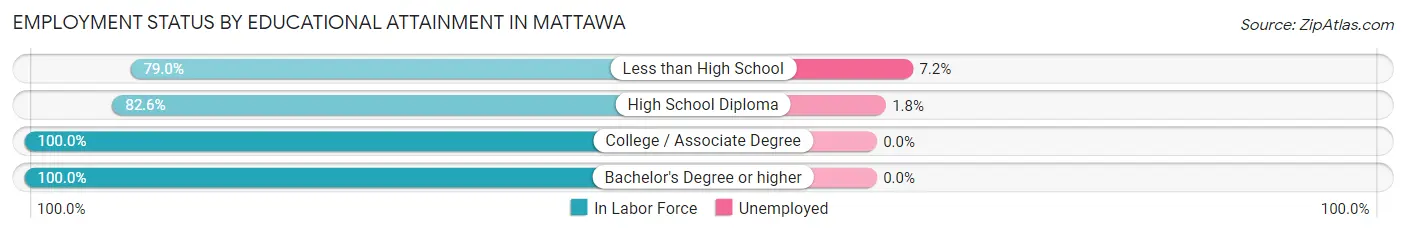
| Educational Attainment | In Labor Force | Unemployed |
| Less than High School | 820 (79.0%) | 75 (7.2%) |
| High School Diploma | 271 (82.6%) | 6 (1.8%) |
| College / Associate Degree | 64 (100.0%) | 0 (0.0%) |
| Bachelor's Degree or higher | 9 (100.0%) | 0 (0.0%) |
| Total | 1,164 (80.9%) | 79 (5.5%) |
Employment Occupations by Sex in Mattawa
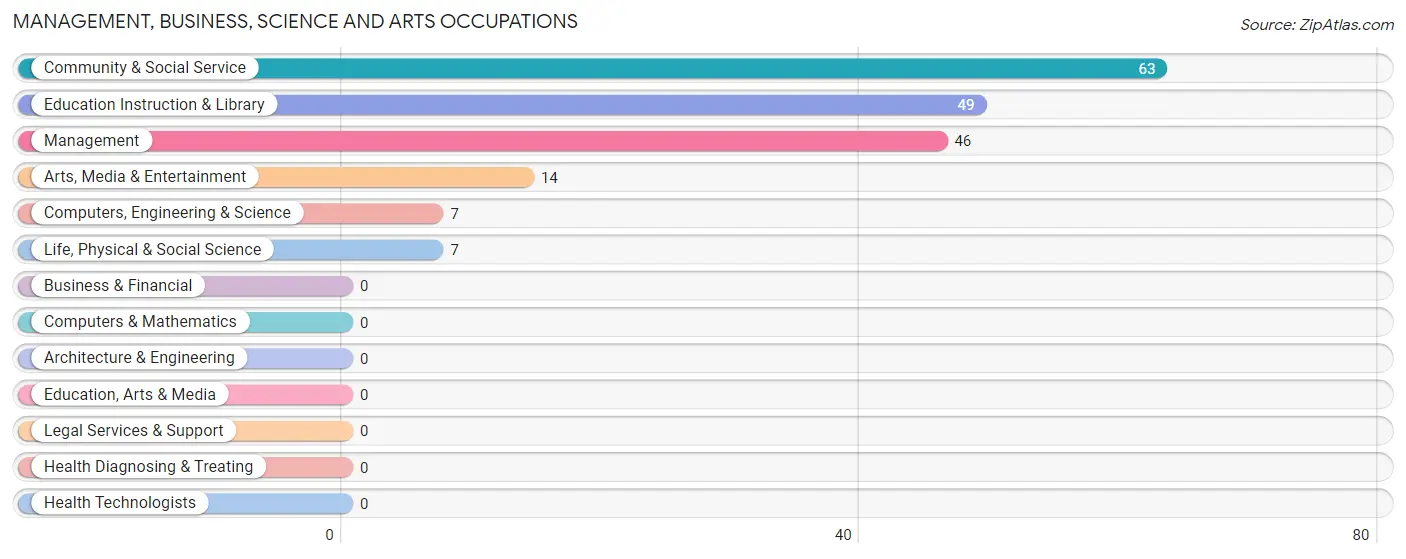
Management, Business, Science and Arts Occupations
The most common Management, Business, Science and Arts occupations in Mattawa are Community & Social Service (63 | 4.1%), Education Instruction & Library (49 | 3.2%), Management (46 | 3.0%), Arts, Media & Entertainment (14 | 0.9%), and Computers, Engineering & Science (7 | 0.4%).
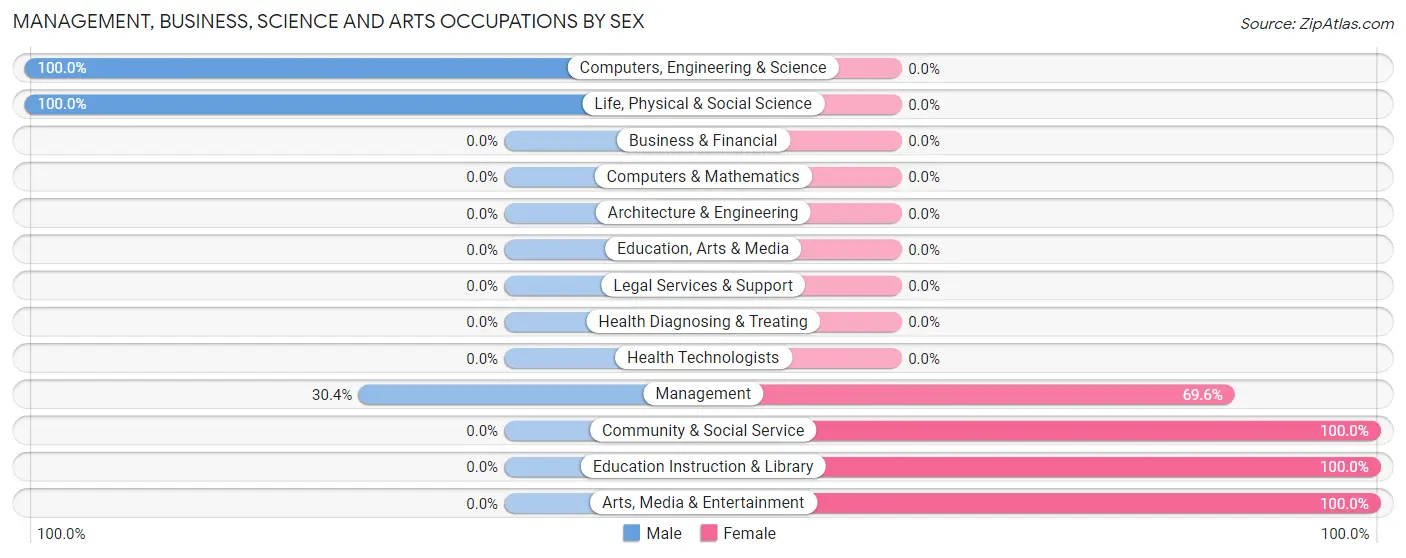
Management, Business, Science and Arts Occupations by Sex
Within the Management, Business, Science and Arts occupations in Mattawa, the most male-oriented occupations are Computers, Engineering & Science (100.0%), Life, Physical & Social Science (100.0%), and Management (30.4%), while the most female-oriented occupations are Community & Social Service (100.0%), Education Instruction & Library (100.0%), and Arts, Media & Entertainment (100.0%).
| Occupation | Male | Female |
| Management | 14 (30.4%) | 32 (69.6%) |
| Business & Financial | 0 (0.0%) | 0 (0.0%) |
| Computers, Engineering & Science | 7 (100.0%) | 0 (0.0%) |
| Computers & Mathematics | 0 (0.0%) | 0 (0.0%) |
| Architecture & Engineering | 0 (0.0%) | 0 (0.0%) |
| Life, Physical & Social Science | 7 (100.0%) | 0 (0.0%) |
| Community & Social Service | 0 (0.0%) | 63 (100.0%) |
| Education, Arts & Media | 0 (0.0%) | 0 (0.0%) |
| Legal Services & Support | 0 (0.0%) | 0 (0.0%) |
| Education Instruction & Library | 0 (0.0%) | 49 (100.0%) |
| Arts, Media & Entertainment | 0 (0.0%) | 14 (100.0%) |
| Health Diagnosing & Treating | 0 (0.0%) | 0 (0.0%) |
| Health Technologists | 0 (0.0%) | 0 (0.0%) |
| Total (Category) | 21 (18.1%) | 95 (81.9%) |
| Total (Overall) | 878 (57.0%) | 663 (43.0%) |
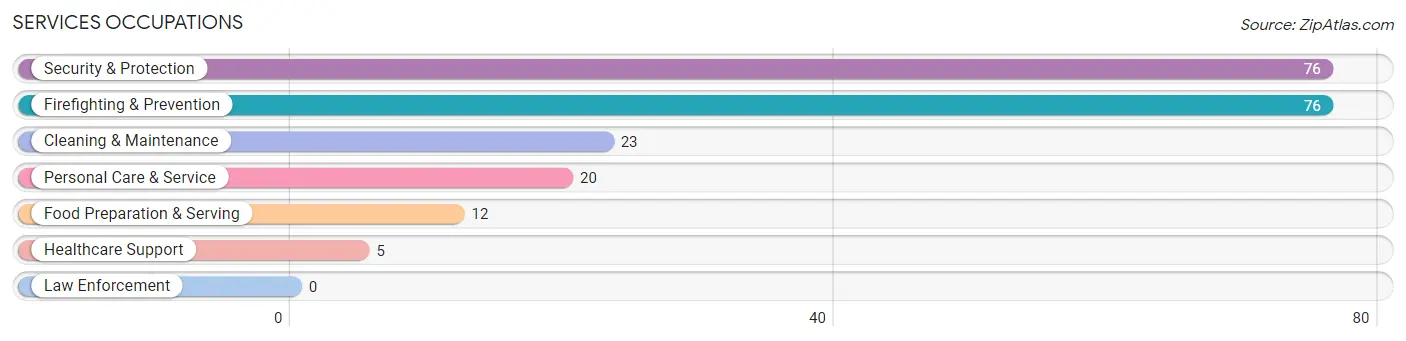
Services Occupations
The most common Services occupations in Mattawa are Security & Protection (76 | 4.9%), Firefighting & Prevention (76 | 4.9%), Cleaning & Maintenance (23 | 1.5%), Personal Care & Service (20 | 1.3%), and Food Preparation & Serving (12 | 0.8%).
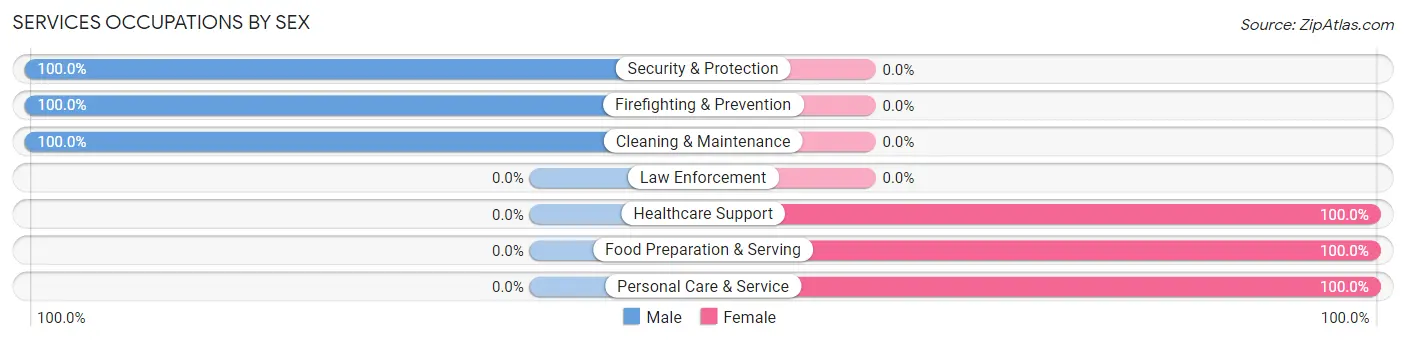
Services Occupations by Sex
Within the Services occupations in Mattawa, the most male-oriented occupations are Security & Protection (100.0%), Firefighting & Prevention (100.0%), and Cleaning & Maintenance (100.0%), while the most female-oriented occupations are Healthcare Support (100.0%), Food Preparation & Serving (100.0%), and Personal Care & Service (100.0%).
| Occupation | Male | Female |
| Healthcare Support | 0 (0.0%) | 5 (100.0%) |
| Security & Protection | 76 (100.0%) | 0 (0.0%) |
| Firefighting & Prevention | 76 (100.0%) | 0 (0.0%) |
| Law Enforcement | 0 (0.0%) | 0 (0.0%) |
| Food Preparation & Serving | 0 (0.0%) | 12 (100.0%) |
| Cleaning & Maintenance | 23 (100.0%) | 0 (0.0%) |
| Personal Care & Service | 0 (0.0%) | 20 (100.0%) |
| Total (Category) | 99 (72.8%) | 37 (27.2%) |
| Total (Overall) | 878 (57.0%) | 663 (43.0%) |
Sales and Office Occupations
The most common Sales and Office occupations in Mattawa are Sales & Related (49 | 3.2%), and Office & Administration (2 | 0.1%).
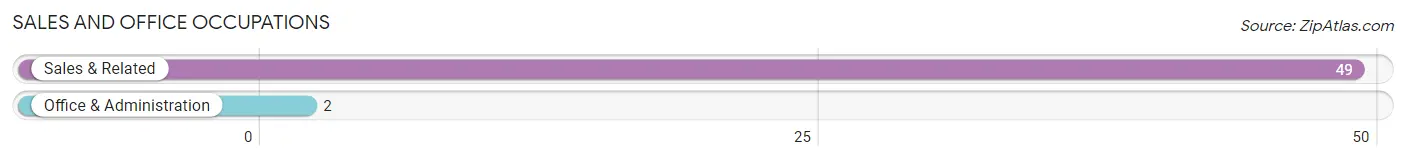
Sales and Office Occupations by Sex
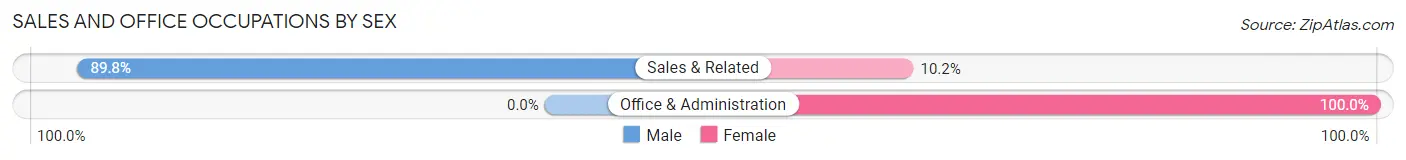
| Occupation | Male | Female |
| Sales & Related | 44 (89.8%) | 5 (10.2%) |
| Office & Administration | 0 (0.0%) | 2 (100.0%) |
| Total (Category) | 44 (86.3%) | 7 (13.7%) |
| Total (Overall) | 878 (57.0%) | 663 (43.0%) |
Natural Resources, Construction and Maintenance Occupations
The most common Natural Resources, Construction and Maintenance occupations in Mattawa are Farming, Fishing & Forestry (1,032 | 67.0%), Construction & Extraction (48 | 3.1%), and Installation, Maintenance & Repair (11 | 0.7%).
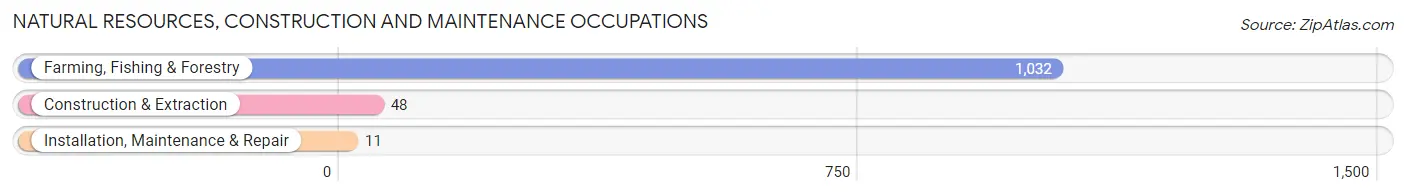
Natural Resources, Construction and Maintenance Occupations by Sex
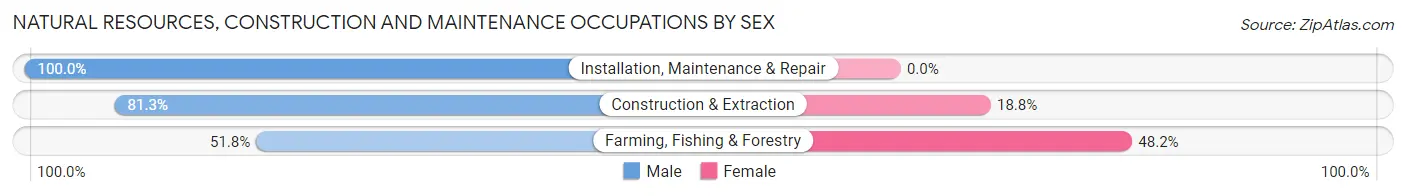
| Occupation | Male | Female |
| Farming, Fishing & Forestry | 535 (51.8%) | 497 (48.2%) |
| Construction & Extraction | 39 (81.2%) | 9 (18.8%) |
| Installation, Maintenance & Repair | 11 (100.0%) | 0 (0.0%) |
| Total (Category) | 585 (53.6%) | 506 (46.4%) |
| Total (Overall) | 878 (57.0%) | 663 (43.0%) |
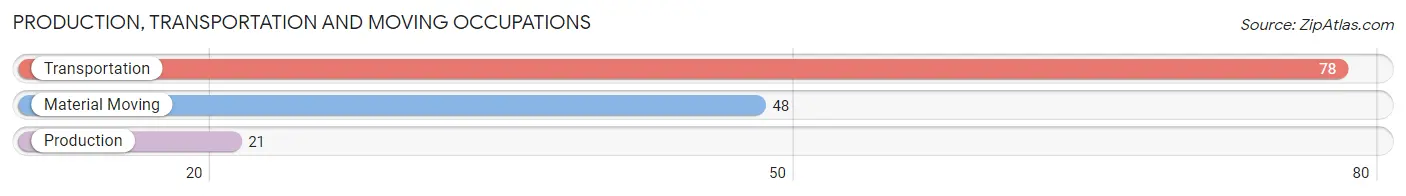
Production, Transportation and Moving Occupations
The most common Production, Transportation and Moving occupations in Mattawa are Transportation (78 | 5.1%), Material Moving (48 | 3.1%), and Production (21 | 1.4%).
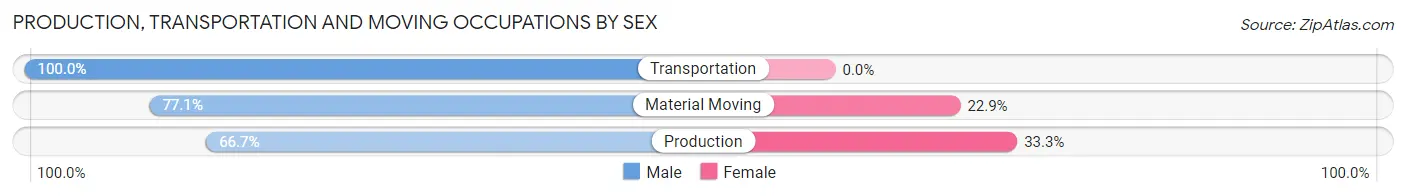
Production, Transportation and Moving Occupations by Sex
| Occupation | Male | Female |
| Production | 14 (66.7%) | 7 (33.3%) |
| Transportation | 78 (100.0%) | 0 (0.0%) |
| Material Moving | 37 (77.1%) | 11 (22.9%) |
| Total (Category) | 129 (87.8%) | 18 (12.2%) |
| Total (Overall) | 878 (57.0%) | 663 (43.0%) |
Employment Industries by Sex in Mattawa
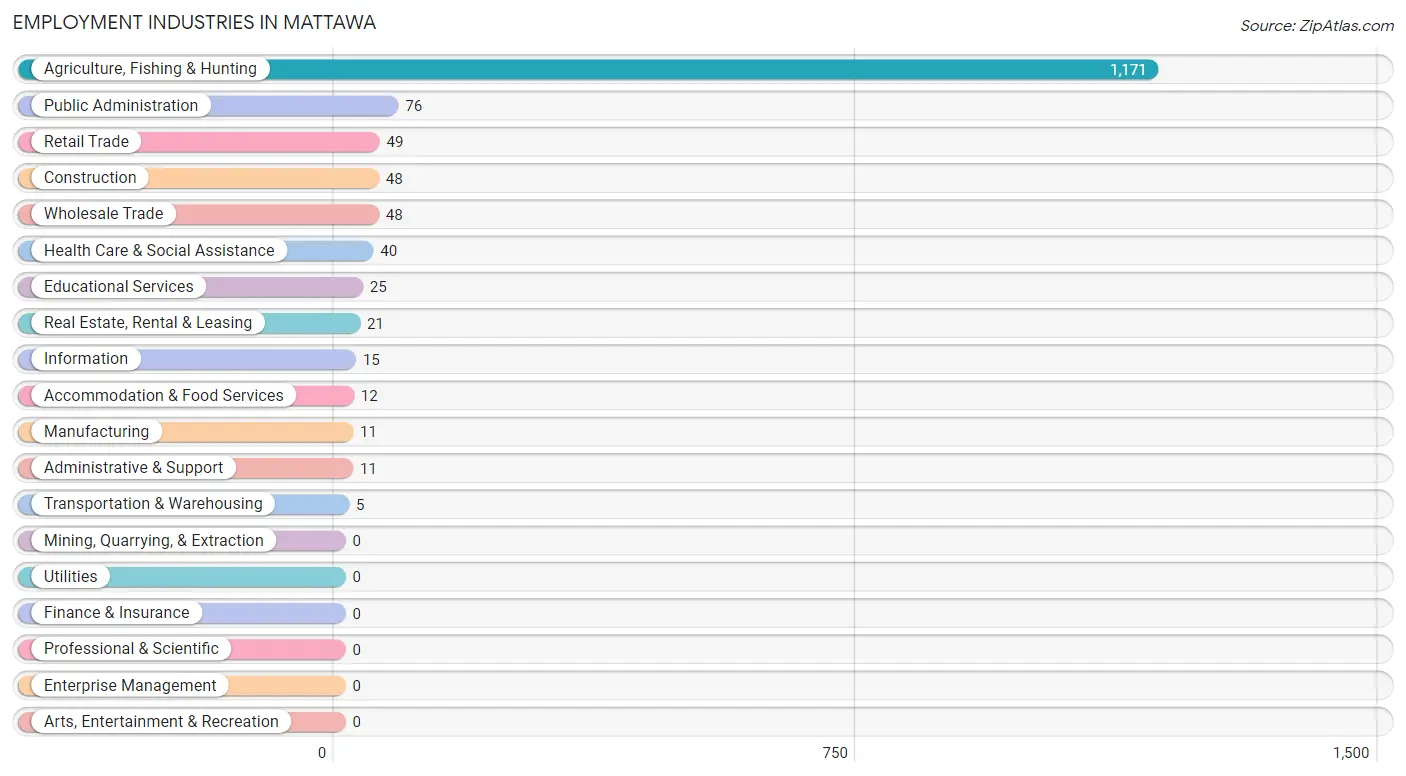
Employment Industries in Mattawa
The major employment industries in Mattawa include Agriculture, Fishing & Hunting (1,171 | 76.0%), Public Administration (76 | 4.9%), Retail Trade (49 | 3.2%), Construction (48 | 3.1%), and Wholesale Trade (48 | 3.1%).
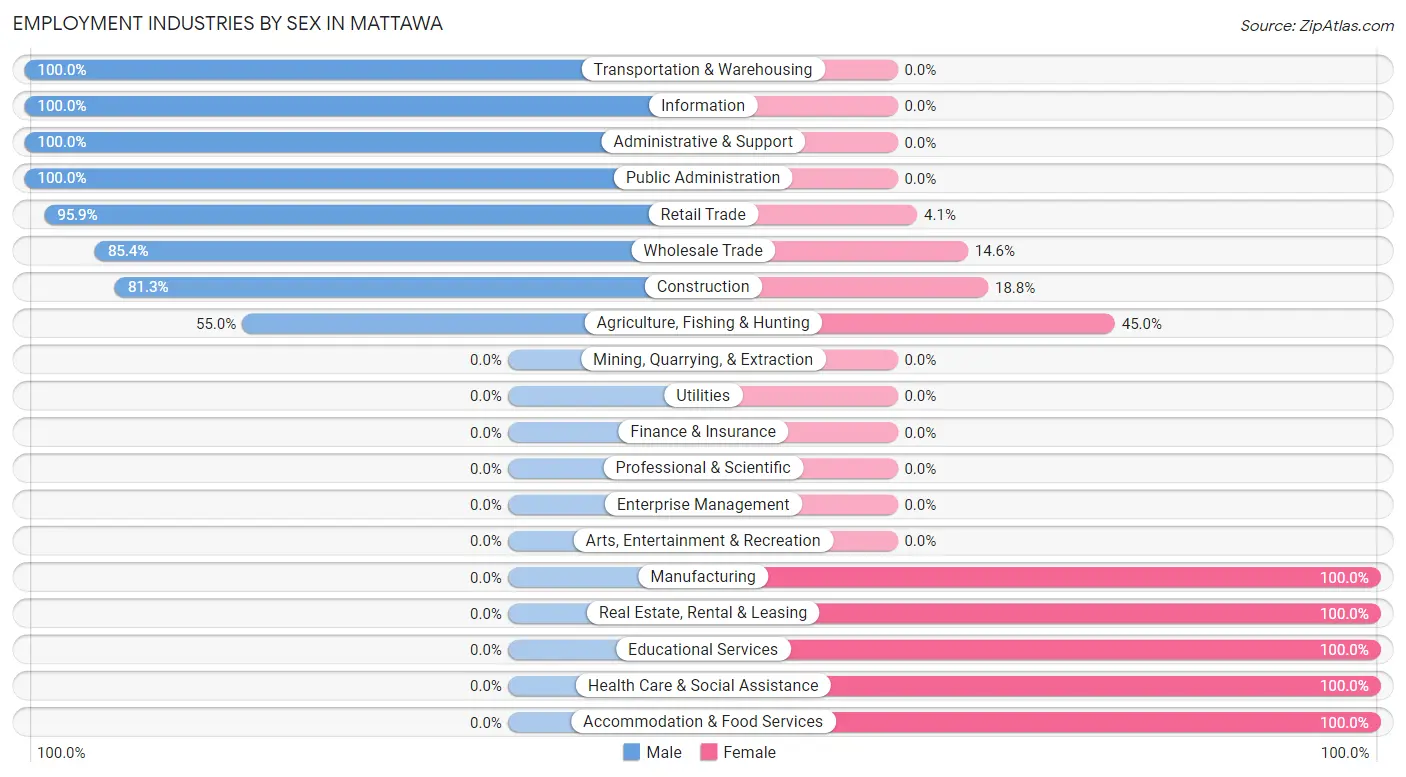
Employment Industries by Sex in Mattawa
The Mattawa industries that see more men than women are Transportation & Warehousing (100.0%), Information (100.0%), and Administrative & Support (100.0%), whereas the industries that tend to have a higher number of women are Manufacturing (100.0%), Real Estate, Rental & Leasing (100.0%), and Educational Services (100.0%).
| Industry | Male | Female |
| Agriculture, Fishing & Hunting | 644 (55.0%) | 527 (45.0%) |
| Mining, Quarrying, & Extraction | 0 (0.0%) | 0 (0.0%) |
| Construction | 39 (81.2%) | 9 (18.8%) |
| Manufacturing | 0 (0.0%) | 11 (100.0%) |
| Wholesale Trade | 41 (85.4%) | 7 (14.6%) |
| Retail Trade | 47 (95.9%) | 2 (4.1%) |
| Transportation & Warehousing | 5 (100.0%) | 0 (0.0%) |
| Utilities | 0 (0.0%) | 0 (0.0%) |
| Information | 15 (100.0%) | 0 (0.0%) |
| Finance & Insurance | 0 (0.0%) | 0 (0.0%) |
| Real Estate, Rental & Leasing | 0 (0.0%) | 21 (100.0%) |
| Professional & Scientific | 0 (0.0%) | 0 (0.0%) |
| Enterprise Management | 0 (0.0%) | 0 (0.0%) |
| Administrative & Support | 11 (100.0%) | 0 (0.0%) |
| Educational Services | 0 (0.0%) | 25 (100.0%) |
| Health Care & Social Assistance | 0 (0.0%) | 40 (100.0%) |
| Arts, Entertainment & Recreation | 0 (0.0%) | 0 (0.0%) |
| Accommodation & Food Services | 0 (0.0%) | 12 (100.0%) |
| Public Administration | 76 (100.0%) | 0 (0.0%) |
| Total | 878 (57.0%) | 663 (43.0%) |
Education in Mattawa
School Enrollment in Mattawa
The most common levels of schooling among the 1,138 students in Mattawa are elementary school (334 | 29.3%), high school (324 | 28.5%), and middle school (221 | 19.4%).
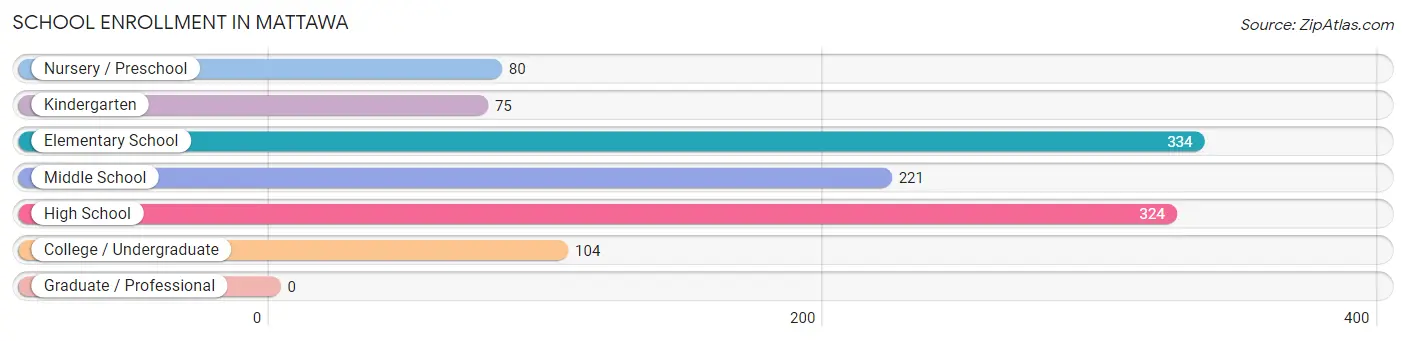
| School Level | # Students | % Students |
| Nursery / Preschool | 80 | 7.0% |
| Kindergarten | 75 | 6.6% |
| Elementary School | 334 | 29.3% |
| Middle School | 221 | 19.4% |
| High School | 324 | 28.5% |
| College / Undergraduate | 104 | 9.1% |
| Graduate / Professional | 0 | 0.0% |
| Total | 1,138 | 100.0% |
School Enrollment by Age by Funding Source in Mattawa
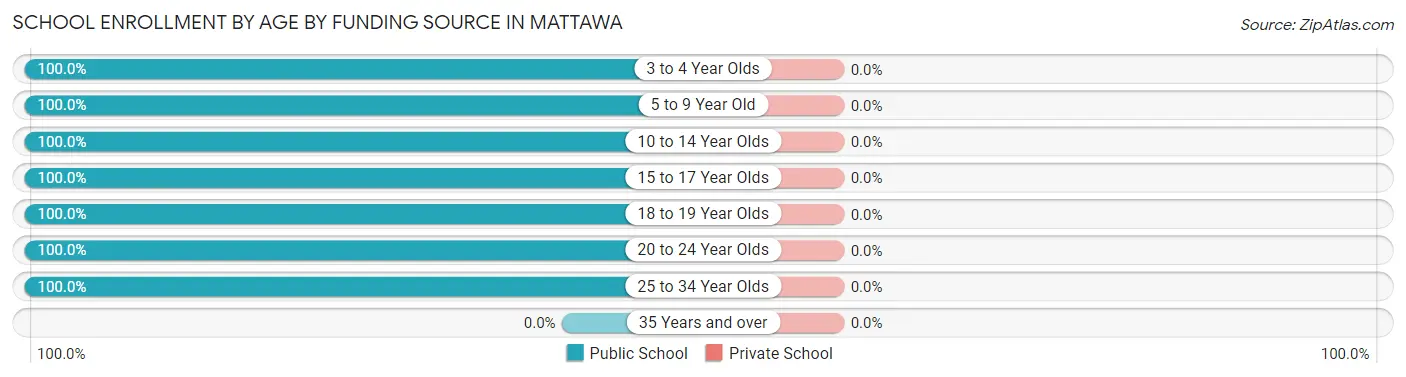
| Age Bracket | Public School | Private School |
| 3 to 4 Year Olds | 62 (100.0%) | 0 (0.0%) |
| 5 to 9 Year Old | 373 (100.0%) | 0 (0.0%) |
| 10 to 14 Year Olds | 324 (100.0%) | 0 (0.0%) |
| 15 to 17 Year Olds | 194 (100.0%) | 0 (0.0%) |
| 18 to 19 Year Olds | 144 (100.0%) | 0 (0.0%) |
| 20 to 24 Year Olds | 29 (100.0%) | 0 (0.0%) |
| 25 to 34 Year Olds | 12 (100.0%) | 0 (0.0%) |
| 35 Years and over | 0 (0.0%) | 0 (0.0%) |
| Total | 1,138 (100.0%) | 0 (0.0%) |
Educational Attainment by Field of Study in Mattawa
Liberal arts & history (10 | 52.6%), and business (9 | 47.4%) are the most common fields of study among 19 individuals in Mattawa who have obtained a bachelor's degree or higher.
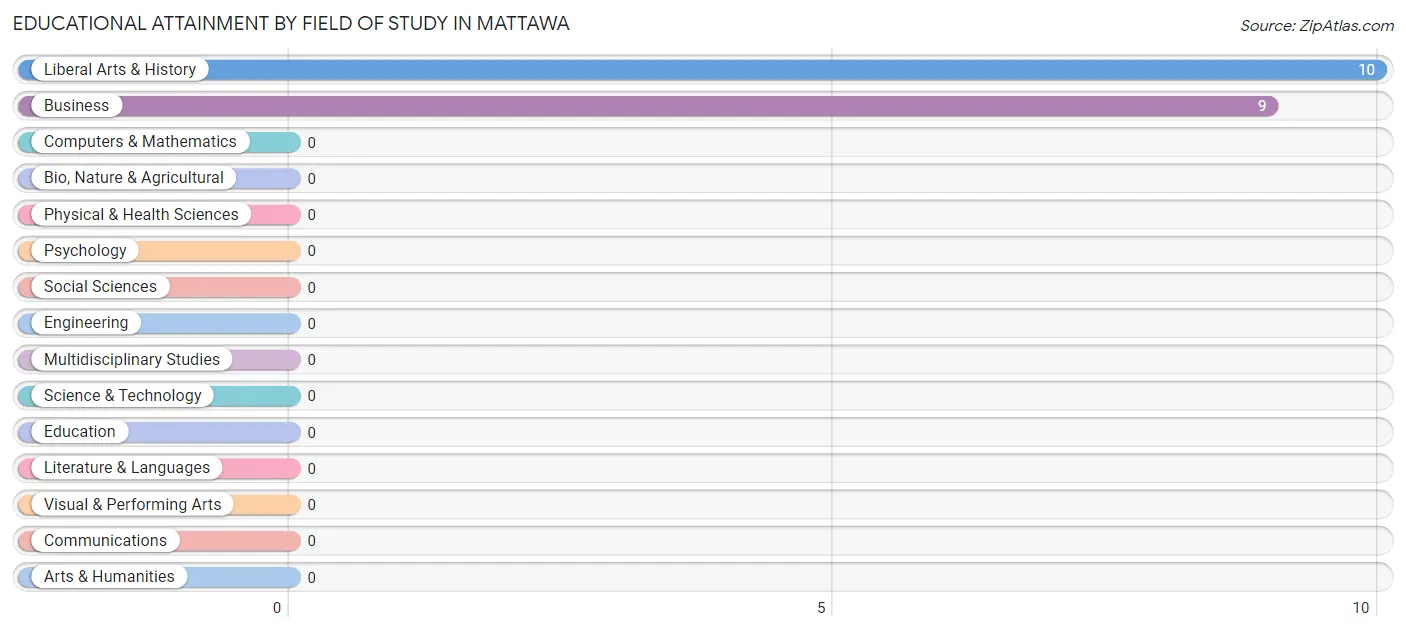
| Field of Study | # Graduates | % Graduates |
| Computers & Mathematics | 0 | 0.0% |
| Bio, Nature & Agricultural | 0 | 0.0% |
| Physical & Health Sciences | 0 | 0.0% |
| Psychology | 0 | 0.0% |
| Social Sciences | 0 | 0.0% |
| Engineering | 0 | 0.0% |
| Multidisciplinary Studies | 0 | 0.0% |
| Science & Technology | 0 | 0.0% |
| Business | 9 | 47.4% |
| Education | 0 | 0.0% |
| Literature & Languages | 0 | 0.0% |
| Liberal Arts & History | 10 | 52.6% |
| Visual & Performing Arts | 0 | 0.0% |
| Communications | 0 | 0.0% |
| Arts & Humanities | 0 | 0.0% |
| Total | 19 | 100.0% |
Transportation & Commute in Mattawa
Vehicle Availability by Sex in Mattawa
The most prevalent vehicle ownership categories in Mattawa are males with 5 or more vehicles (285, accounting for 33.8%) and females with 5 or more vehicles (47, making up 51.2%).
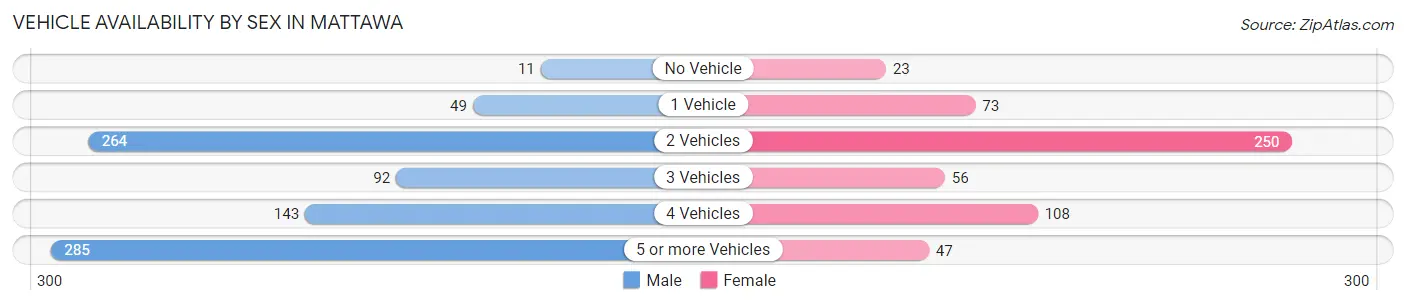
| Vehicles Available | Male | Female |
| No Vehicle | 11 (1.3%) | 23 (4.1%) |
| 1 Vehicle | 49 (5.8%) | 73 (13.1%) |
| 2 Vehicles | 264 (31.3%) | 250 (44.9%) |
| 3 Vehicles | 92 (10.9%) | 56 (10.1%) |
| 4 Vehicles | 143 (16.9%) | 108 (19.4%) |
| 5 or more Vehicles | 285 (33.8%) | 47 (8.4%) |
| Total | 844 (100.0%) | 557 (100.0%) |
Commute Time in Mattawa
The most frequently occuring commute durations in Mattawa are 30 to 34 minutes (291 commuters, 22.2%), 15 to 19 minutes (229 commuters, 17.5%), and 10 to 14 minutes (196 commuters, 15.0%).
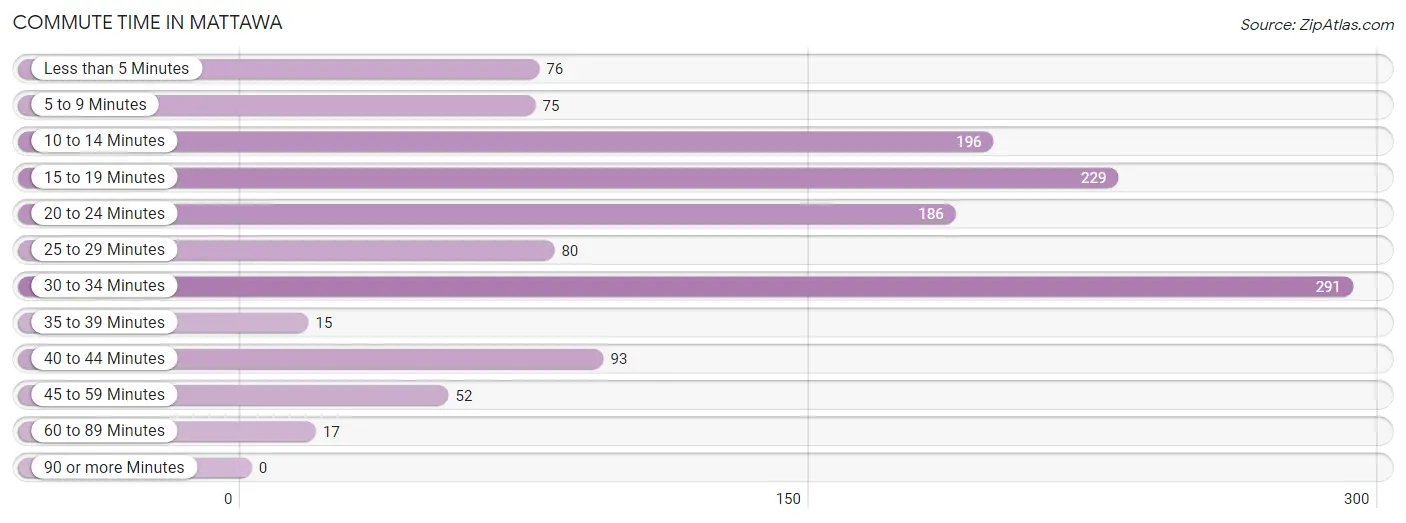
| Commute Time | # Commuters | % Commuters |
| Less than 5 Minutes | 76 | 5.8% |
| 5 to 9 Minutes | 75 | 5.7% |
| 10 to 14 Minutes | 196 | 15.0% |
| 15 to 19 Minutes | 229 | 17.5% |
| 20 to 24 Minutes | 186 | 14.2% |
| 25 to 29 Minutes | 80 | 6.1% |
| 30 to 34 Minutes | 291 | 22.2% |
| 35 to 39 Minutes | 15 | 1.1% |
| 40 to 44 Minutes | 93 | 7.1% |
| 45 to 59 Minutes | 52 | 4.0% |
| 60 to 89 Minutes | 17 | 1.3% |
| 90 or more Minutes | 0 | 0.0% |
Commute Time by Sex in Mattawa
The most common commute times in Mattawa are 15 to 19 minutes (178 commuters, 23.7%) for males and 30 to 34 minutes (145 commuters, 26.0%) for females.
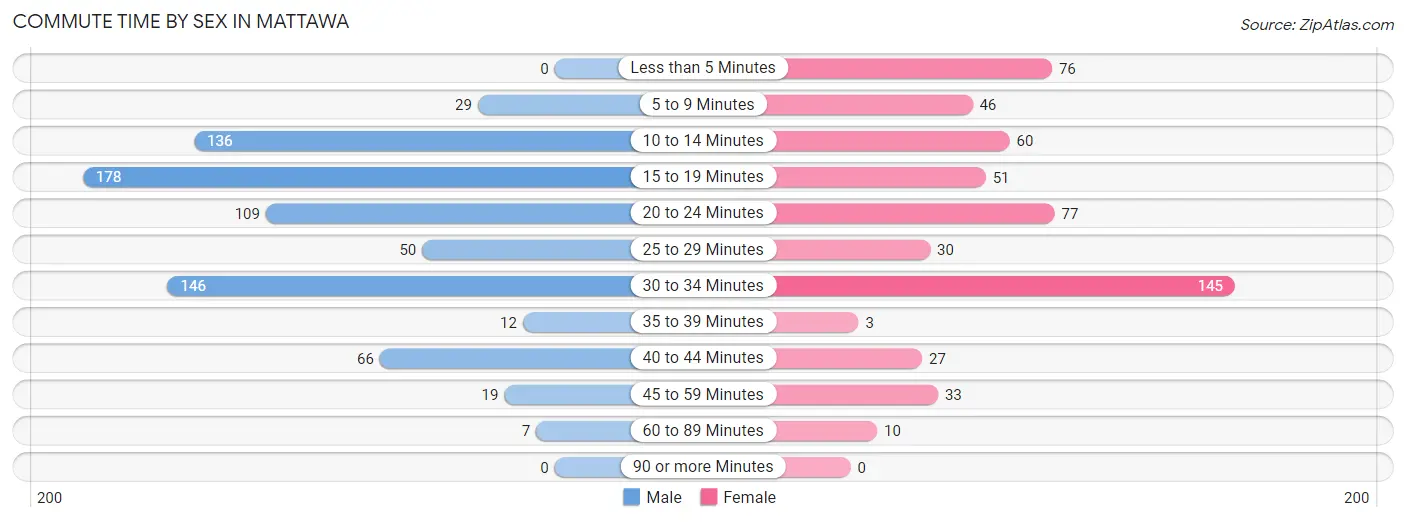
| Commute Time | Male | Female |
| Less than 5 Minutes | 0 (0.0%) | 76 (13.6%) |
| 5 to 9 Minutes | 29 (3.9%) | 46 (8.2%) |
| 10 to 14 Minutes | 136 (18.1%) | 60 (10.7%) |
| 15 to 19 Minutes | 178 (23.7%) | 51 (9.1%) |
| 20 to 24 Minutes | 109 (14.5%) | 77 (13.8%) |
| 25 to 29 Minutes | 50 (6.7%) | 30 (5.4%) |
| 30 to 34 Minutes | 146 (19.4%) | 145 (26.0%) |
| 35 to 39 Minutes | 12 (1.6%) | 3 (0.5%) |
| 40 to 44 Minutes | 66 (8.8%) | 27 (4.8%) |
| 45 to 59 Minutes | 19 (2.5%) | 33 (5.9%) |
| 60 to 89 Minutes | 7 (0.9%) | 10 (1.8%) |
| 90 or more Minutes | 0 (0.0%) | 0 (0.0%) |
Time of Departure to Work by Sex in Mattawa
The most frequent times of departure to work in Mattawa are 6:30 AM to 6:59 AM (194, 25.8%) for males and 6:00 AM to 6:29 AM (125, 22.4%) for females.
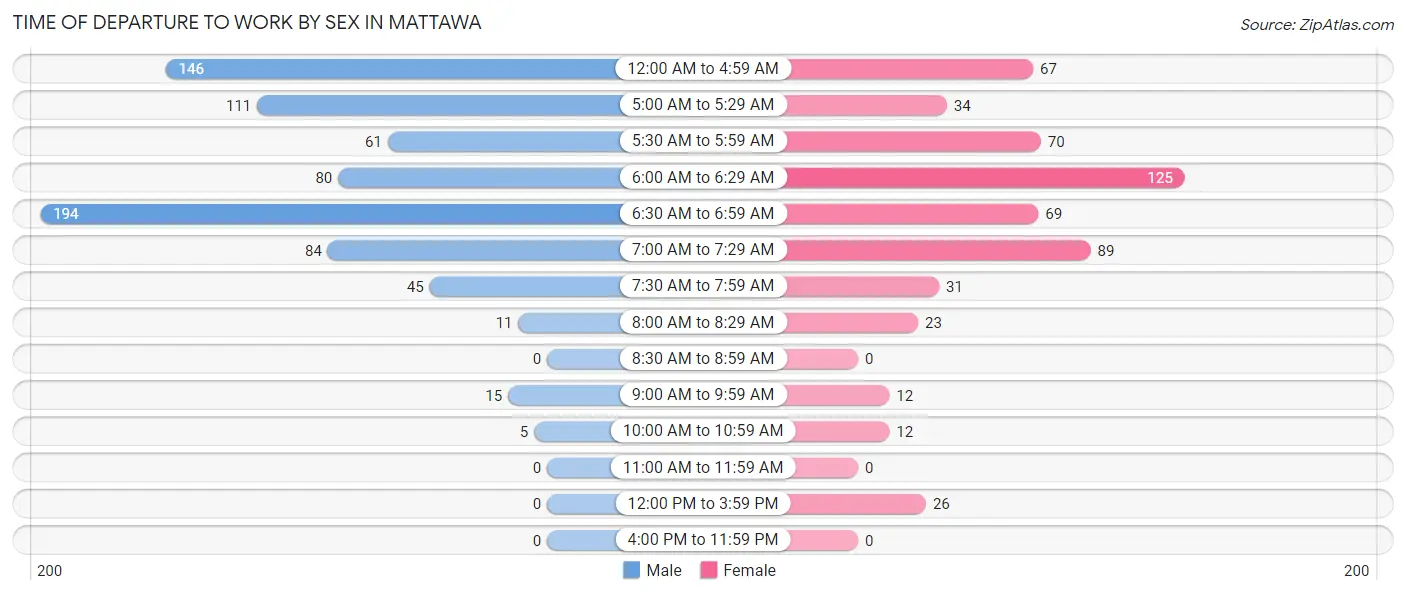
| Time of Departure | Male | Female |
| 12:00 AM to 4:59 AM | 146 (19.4%) | 67 (12.0%) |
| 5:00 AM to 5:29 AM | 111 (14.8%) | 34 (6.1%) |
| 5:30 AM to 5:59 AM | 61 (8.1%) | 70 (12.5%) |
| 6:00 AM to 6:29 AM | 80 (10.6%) | 125 (22.4%) |
| 6:30 AM to 6:59 AM | 194 (25.8%) | 69 (12.4%) |
| 7:00 AM to 7:29 AM | 84 (11.2%) | 89 (16.0%) |
| 7:30 AM to 7:59 AM | 45 (6.0%) | 31 (5.6%) |
| 8:00 AM to 8:29 AM | 11 (1.5%) | 23 (4.1%) |
| 8:30 AM to 8:59 AM | 0 (0.0%) | 0 (0.0%) |
| 9:00 AM to 9:59 AM | 15 (2.0%) | 12 (2.1%) |
| 10:00 AM to 10:59 AM | 5 (0.7%) | 12 (2.1%) |
| 11:00 AM to 11:59 AM | 0 (0.0%) | 0 (0.0%) |
| 12:00 PM to 3:59 PM | 0 (0.0%) | 26 (4.7%) |
| 4:00 PM to 11:59 PM | 0 (0.0%) | 0 (0.0%) |
| Total | 752 (100.0%) | 558 (100.0%) |
Housing Occupancy in Mattawa
Occupancy by Ownership in Mattawa
Of the total 892 dwellings in Mattawa, owner-occupied units account for 276 (30.9%), while renter-occupied units make up 616 (69.1%).
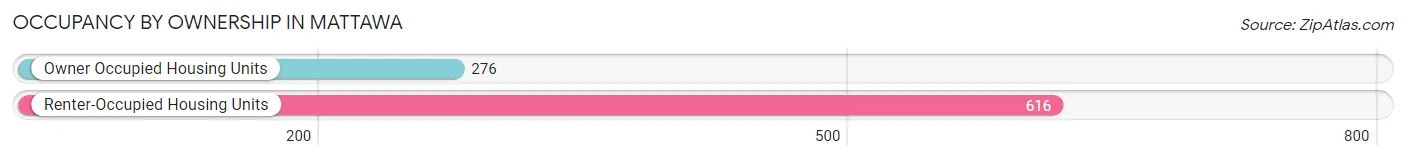
| Occupancy | # Housing Units | % Housing Units |
| Owner Occupied Housing Units | 276 | 30.9% |
| Renter-Occupied Housing Units | 616 | 69.1% |
| Total Occupied Housing Units | 892 | 100.0% |
Occupancy by Household Size in Mattawa
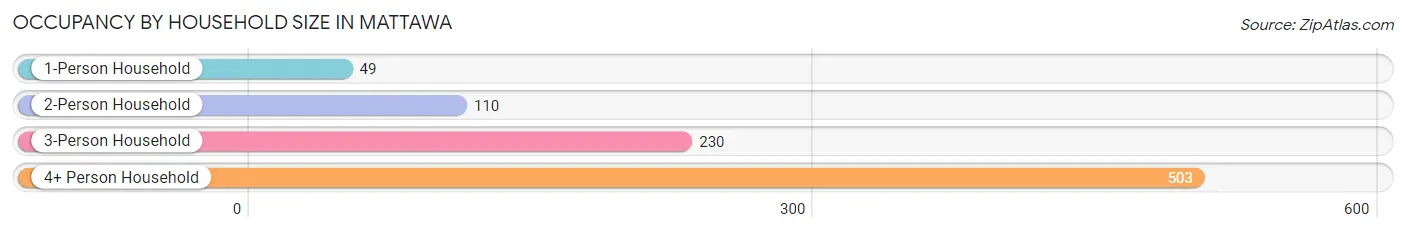
| Household Size | # Housing Units | % Housing Units |
| 1-Person Household | 49 | 5.5% |
| 2-Person Household | 110 | 12.3% |
| 3-Person Household | 230 | 25.8% |
| 4+ Person Household | 503 | 56.4% |
| Total Housing Units | 892 | 100.0% |
Occupancy by Ownership by Household Size in Mattawa
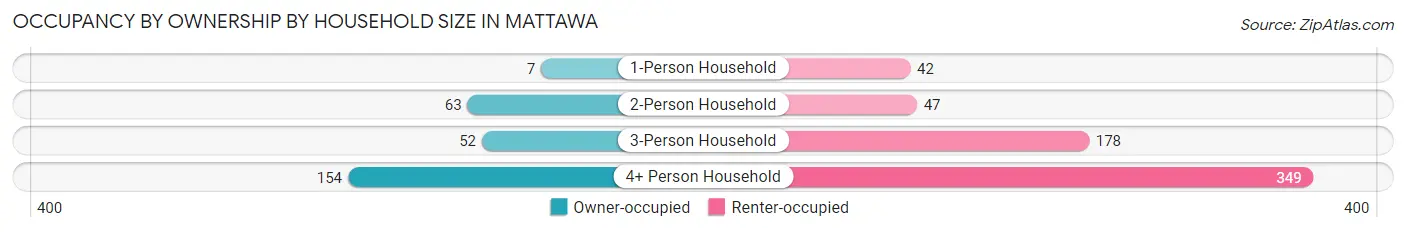
| Household Size | Owner-occupied | Renter-occupied |
| 1-Person Household | 7 (14.3%) | 42 (85.7%) |
| 2-Person Household | 63 (57.3%) | 47 (42.7%) |
| 3-Person Household | 52 (22.6%) | 178 (77.4%) |
| 4+ Person Household | 154 (30.6%) | 349 (69.4%) |
| Total Housing Units | 276 (30.9%) | 616 (69.1%) |
Occupancy by Educational Attainment in Mattawa
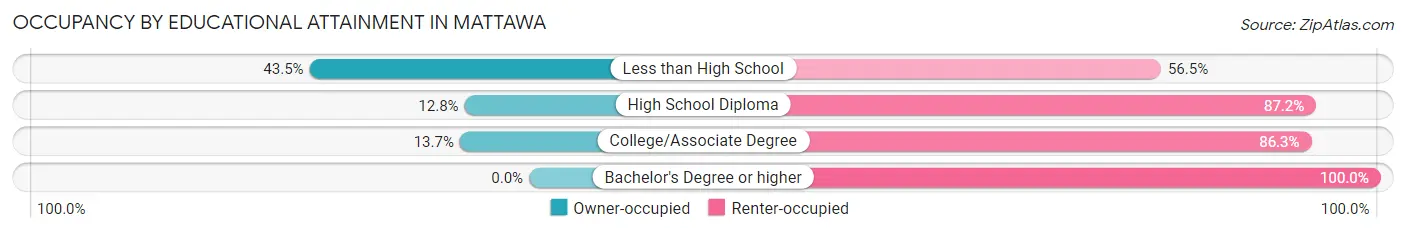
| Household Size | Owner-occupied | Renter-occupied |
| Less than High School | 232 (43.5%) | 301 (56.5%) |
| High School Diploma | 37 (12.8%) | 252 (87.2%) |
| College/Associate Degree | 7 (13.7%) | 44 (86.3%) |
| Bachelor's Degree or higher | 0 (0.0%) | 19 (100.0%) |
Occupancy by Age of Householder in Mattawa
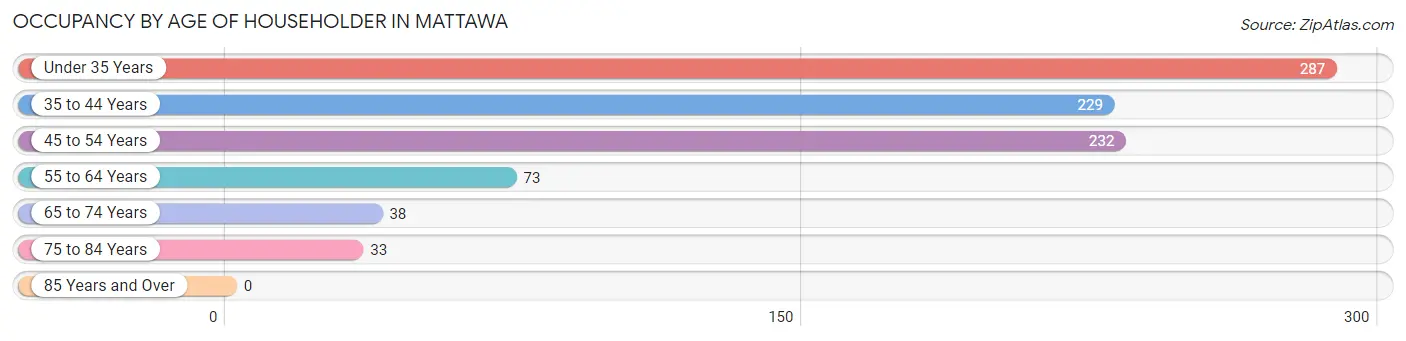
| Age Bracket | # Households | % Households |
| Under 35 Years | 287 | 32.2% |
| 35 to 44 Years | 229 | 25.7% |
| 45 to 54 Years | 232 | 26.0% |
| 55 to 64 Years | 73 | 8.2% |
| 65 to 74 Years | 38 | 4.3% |
| 75 to 84 Years | 33 | 3.7% |
| 85 Years and Over | 0 | 0.0% |
| Total | 892 | 100.0% |
Housing Finances in Mattawa
Median Income by Occupancy in Mattawa
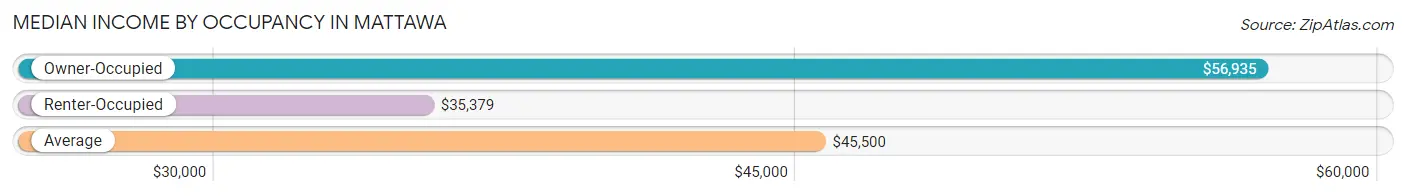
| Occupancy Type | # Households | Median Income |
| Owner-Occupied | 276 (30.9%) | $56,935 |
| Renter-Occupied | 616 (69.1%) | $35,379 |
| Average | 892 (100.0%) | $45,500 |
Occupancy by Householder Income Bracket in Mattawa
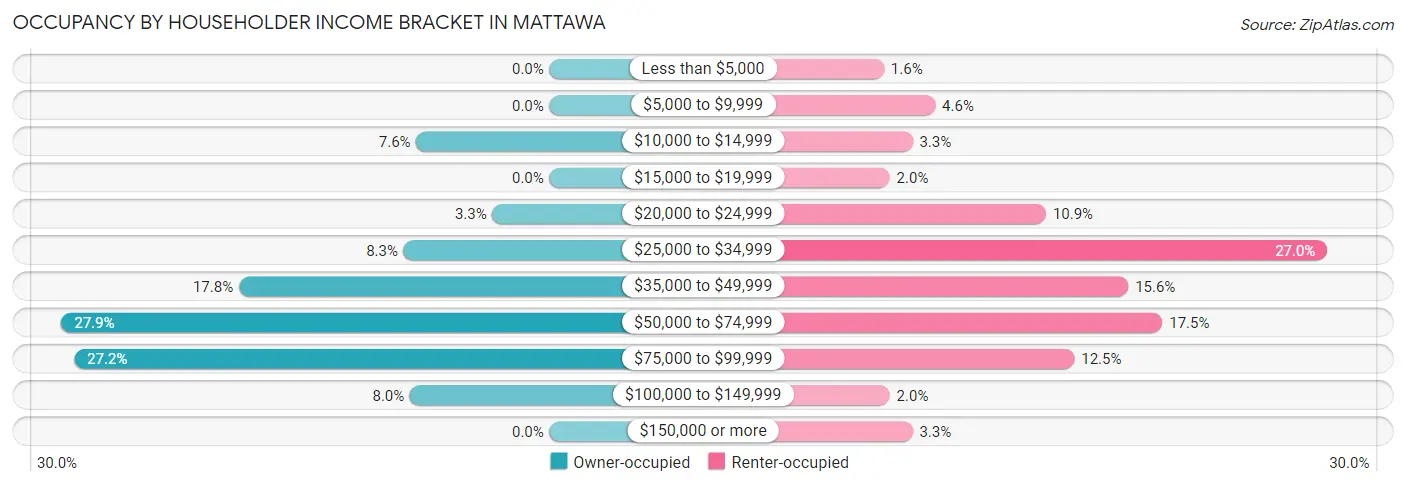
| Income Bracket | Owner-occupied | Renter-occupied |
| Less than $5,000 | 0 (0.0%) | 10 (1.6%) |
| $5,000 to $9,999 | 0 (0.0%) | 28 (4.5%) |
| $10,000 to $14,999 | 21 (7.6%) | 20 (3.3%) |
| $15,000 to $19,999 | 0 (0.0%) | 12 (1.9%) |
| $20,000 to $24,999 | 9 (3.3%) | 67 (10.9%) |
| $25,000 to $34,999 | 23 (8.3%) | 166 (27.0%) |
| $35,000 to $49,999 | 49 (17.7%) | 96 (15.6%) |
| $50,000 to $74,999 | 77 (27.9%) | 108 (17.5%) |
| $75,000 to $99,999 | 75 (27.2%) | 77 (12.5%) |
| $100,000 to $149,999 | 22 (8.0%) | 12 (1.9%) |
| $150,000 or more | 0 (0.0%) | 20 (3.3%) |
| Total | 276 (100.0%) | 616 (100.0%) |
Monthly Housing Cost Tiers in Mattawa
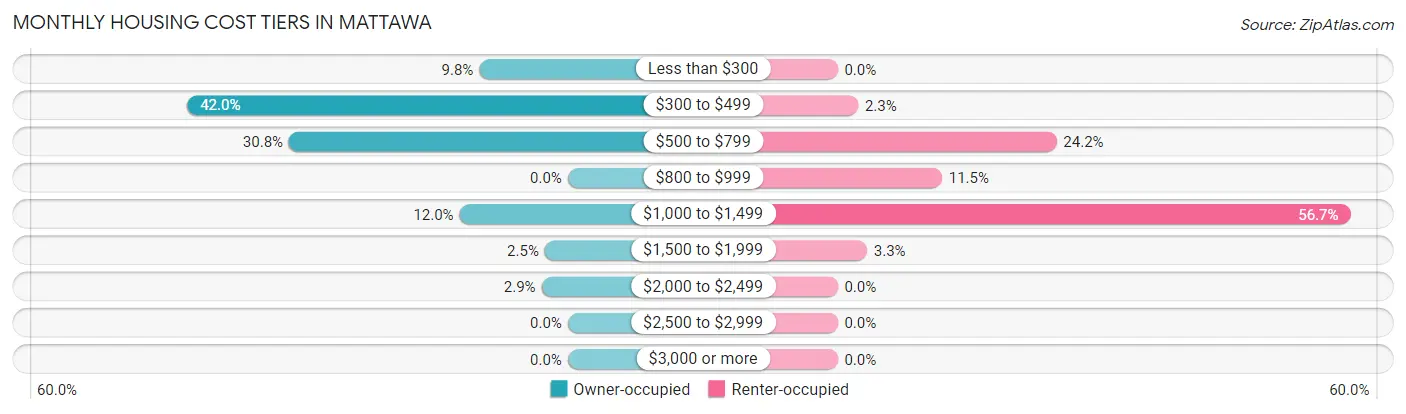
| Monthly Cost | Owner-occupied | Renter-occupied |
| Less than $300 | 27 (9.8%) | 0 (0.0%) |
| $300 to $499 | 116 (42.0%) | 14 (2.3%) |
| $500 to $799 | 85 (30.8%) | 149 (24.2%) |
| $800 to $999 | 0 (0.0%) | 71 (11.5%) |
| $1,000 to $1,499 | 33 (12.0%) | 349 (56.7%) |
| $1,500 to $1,999 | 7 (2.5%) | 20 (3.3%) |
| $2,000 to $2,499 | 8 (2.9%) | 0 (0.0%) |
| $2,500 to $2,999 | 0 (0.0%) | 0 (0.0%) |
| $3,000 or more | 0 (0.0%) | 0 (0.0%) |
| Total | 276 (100.0%) | 616 (100.0%) |
Physical Housing Characteristics in Mattawa
Housing Structures in Mattawa
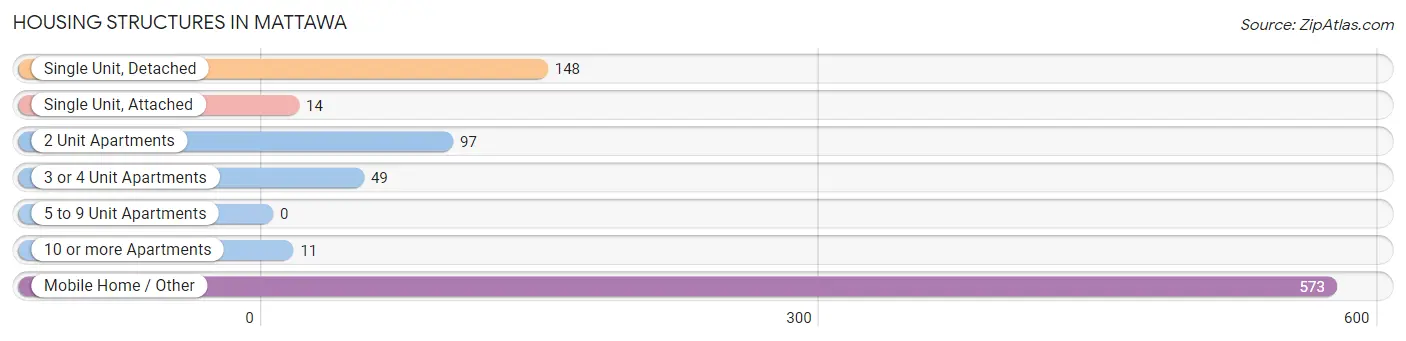
| Structure Type | # Housing Units | % Housing Units |
| Single Unit, Detached | 148 | 16.6% |
| Single Unit, Attached | 14 | 1.6% |
| 2 Unit Apartments | 97 | 10.9% |
| 3 or 4 Unit Apartments | 49 | 5.5% |
| 5 to 9 Unit Apartments | 0 | 0.0% |
| 10 or more Apartments | 11 | 1.2% |
| Mobile Home / Other | 573 | 64.2% |
| Total | 892 | 100.0% |
Housing Structures by Occupancy in Mattawa
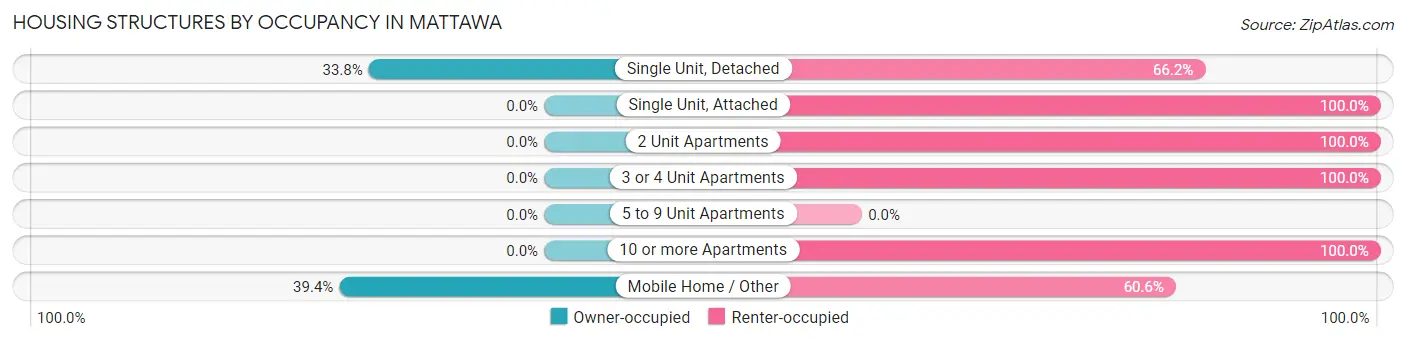
| Structure Type | Owner-occupied | Renter-occupied |
| Single Unit, Detached | 50 (33.8%) | 98 (66.2%) |
| Single Unit, Attached | 0 (0.0%) | 14 (100.0%) |
| 2 Unit Apartments | 0 (0.0%) | 97 (100.0%) |
| 3 or 4 Unit Apartments | 0 (0.0%) | 49 (100.0%) |
| 5 to 9 Unit Apartments | 0 (0.0%) | 0 (0.0%) |
| 10 or more Apartments | 0 (0.0%) | 11 (100.0%) |
| Mobile Home / Other | 226 (39.4%) | 347 (60.6%) |
| Total | 276 (30.9%) | 616 (69.1%) |
Housing Structures by Number of Rooms in Mattawa
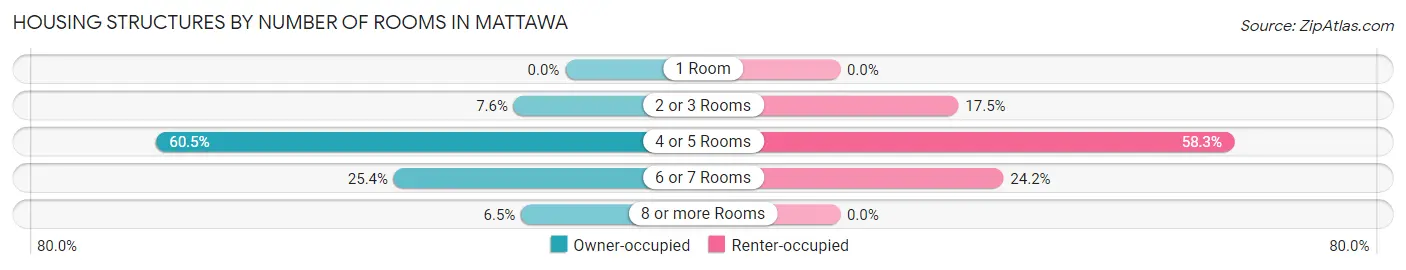
| Number of Rooms | Owner-occupied | Renter-occupied |
| 1 Room | 0 (0.0%) | 0 (0.0%) |
| 2 or 3 Rooms | 21 (7.6%) | 108 (17.5%) |
| 4 or 5 Rooms | 167 (60.5%) | 359 (58.3%) |
| 6 or 7 Rooms | 70 (25.4%) | 149 (24.2%) |
| 8 or more Rooms | 18 (6.5%) | 0 (0.0%) |
| Total | 276 (100.0%) | 616 (100.0%) |
Housing Structure by Heating Type in Mattawa
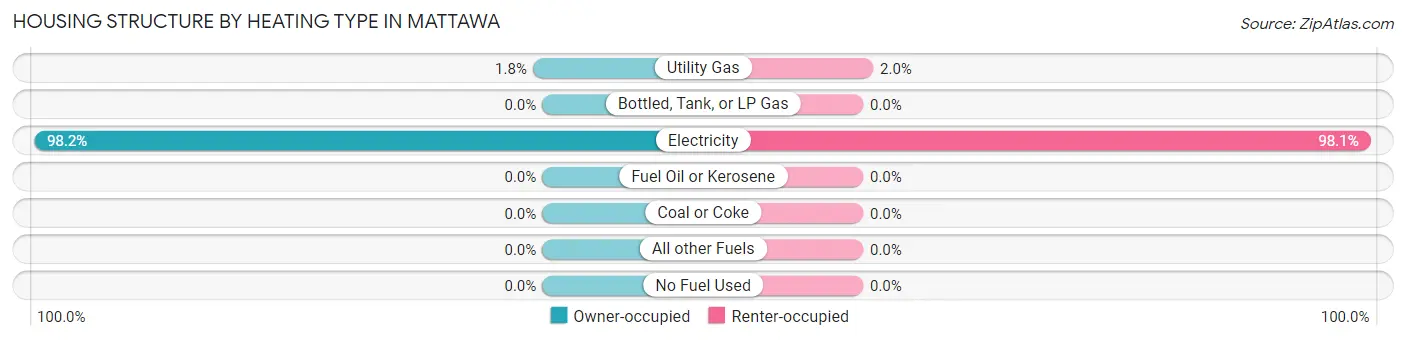
| Heating Type | Owner-occupied | Renter-occupied |
| Utility Gas | 5 (1.8%) | 12 (1.9%) |
| Bottled, Tank, or LP Gas | 0 (0.0%) | 0 (0.0%) |
| Electricity | 271 (98.2%) | 604 (98.1%) |
| Fuel Oil or Kerosene | 0 (0.0%) | 0 (0.0%) |
| Coal or Coke | 0 (0.0%) | 0 (0.0%) |
| All other Fuels | 0 (0.0%) | 0 (0.0%) |
| No Fuel Used | 0 (0.0%) | 0 (0.0%) |
| Total | 276 (100.0%) | 616 (100.0%) |
Household Vehicle Usage in Mattawa
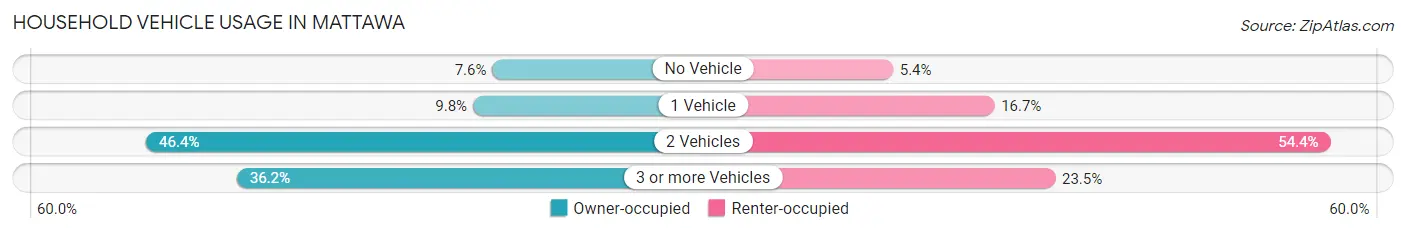
| Vehicles per Household | Owner-occupied | Renter-occupied |
| No Vehicle | 21 (7.6%) | 33 (5.4%) |
| 1 Vehicle | 27 (9.8%) | 103 (16.7%) |
| 2 Vehicles | 128 (46.4%) | 335 (54.4%) |
| 3 or more Vehicles | 100 (36.2%) | 145 (23.5%) |
| Total | 276 (100.0%) | 616 (100.0%) |
Real Estate & Mortgages in Mattawa
Real Estate and Mortgage Overview in Mattawa
| Characteristic | Without Mortgage | With Mortgage |
| Housing Units | 228 | 48 |
| Median Property Value | $24,400 | $0 |
| Median Household Income | $55,484 | $0 |
| Monthly Housing Costs | $452 | $0 |
| Real Estate Taxes | - | - |
Property Value by Mortgage Status in Mattawa
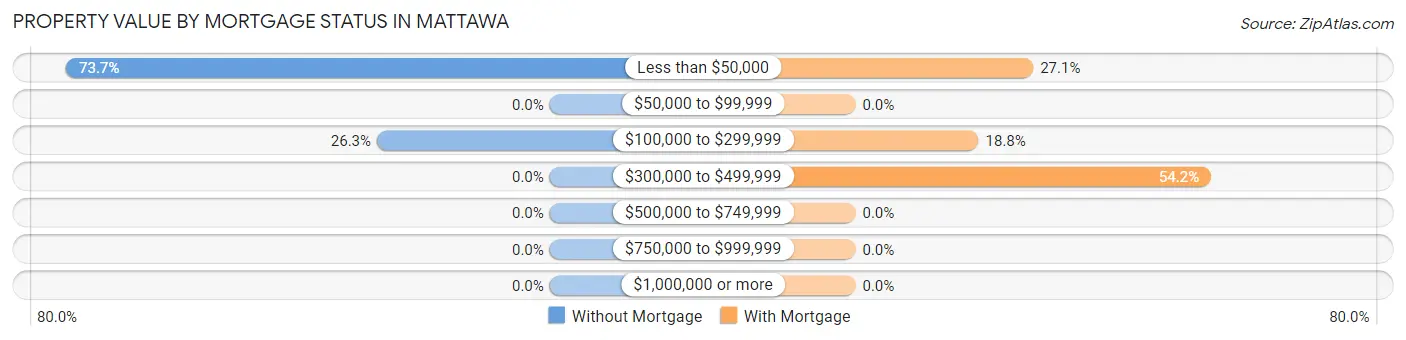
| Property Value | Without Mortgage | With Mortgage |
| Less than $50,000 | 168 (73.7%) | 13 (27.1%) |
| $50,000 to $99,999 | 0 (0.0%) | 0 (0.0%) |
| $100,000 to $299,999 | 60 (26.3%) | 9 (18.8%) |
| $300,000 to $499,999 | 0 (0.0%) | 26 (54.2%) |
| $500,000 to $749,999 | 0 (0.0%) | 0 (0.0%) |
| $750,000 to $999,999 | 0 (0.0%) | 0 (0.0%) |
| $1,000,000 or more | 0 (0.0%) | 0 (0.0%) |
| Total | 228 (100.0%) | 48 (100.0%) |
Household Income by Mortgage Status in Mattawa
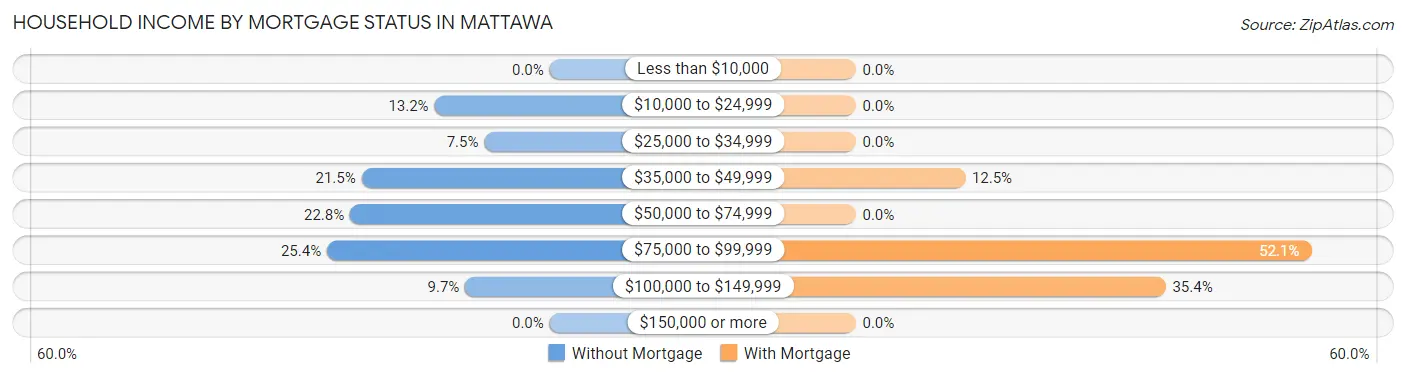
| Household Income | Without Mortgage | With Mortgage |
| Less than $10,000 | 0 (0.0%) | 0 (0.0%) |
| $10,000 to $24,999 | 30 (13.2%) | 0 (0.0%) |
| $25,000 to $34,999 | 17 (7.5%) | 0 (0.0%) |
| $35,000 to $49,999 | 49 (21.5%) | 6 (12.5%) |
| $50,000 to $74,999 | 52 (22.8%) | 0 (0.0%) |
| $75,000 to $99,999 | 58 (25.4%) | 25 (52.1%) |
| $100,000 to $149,999 | 22 (9.7%) | 17 (35.4%) |
| $150,000 or more | 0 (0.0%) | 0 (0.0%) |
| Total | 228 (100.0%) | 48 (100.0%) |
Property Value to Household Income Ratio in Mattawa
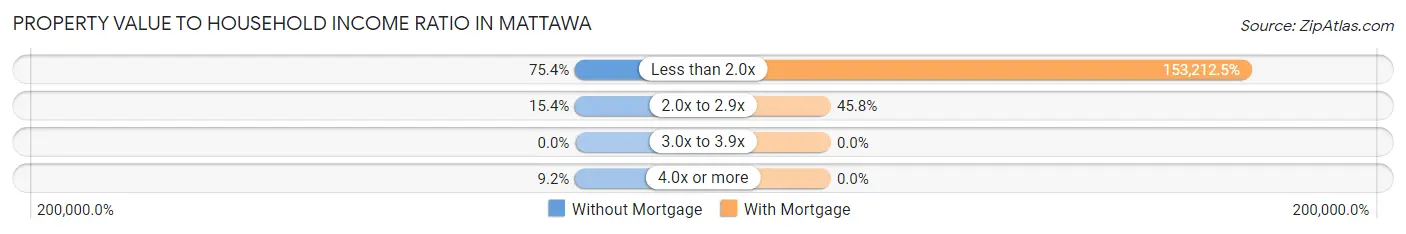
| Value-to-Income Ratio | Without Mortgage | With Mortgage |
| Less than 2.0x | 172 (75.4%) | 73,542 (153,212.5%) |
| 2.0x to 2.9x | 35 (15.3%) | 22 (45.8%) |
| 3.0x to 3.9x | 0 (0.0%) | 0 (0.0%) |
| 4.0x or more | 21 (9.2%) | 0 (0.0%) |
| Total | 228 (100.0%) | 48 (100.0%) |
Real Estate Taxes by Mortgage Status in Mattawa
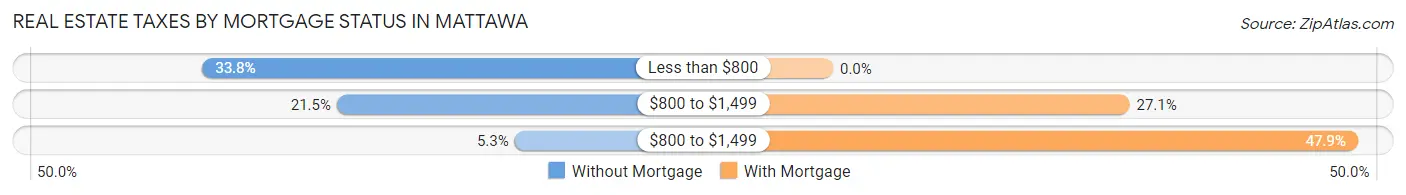
| Property Taxes | Without Mortgage | With Mortgage |
| Less than $800 | 77 (33.8%) | 0 (0.0%) |
| $800 to $1,499 | 49 (21.5%) | 13 (27.1%) |
| $800 to $1,499 | 12 (5.3%) | 23 (47.9%) |
| Total | 228 (100.0%) | 48 (100.0%) |
Health & Disability in Mattawa
Health Insurance Coverage by Age in Mattawa
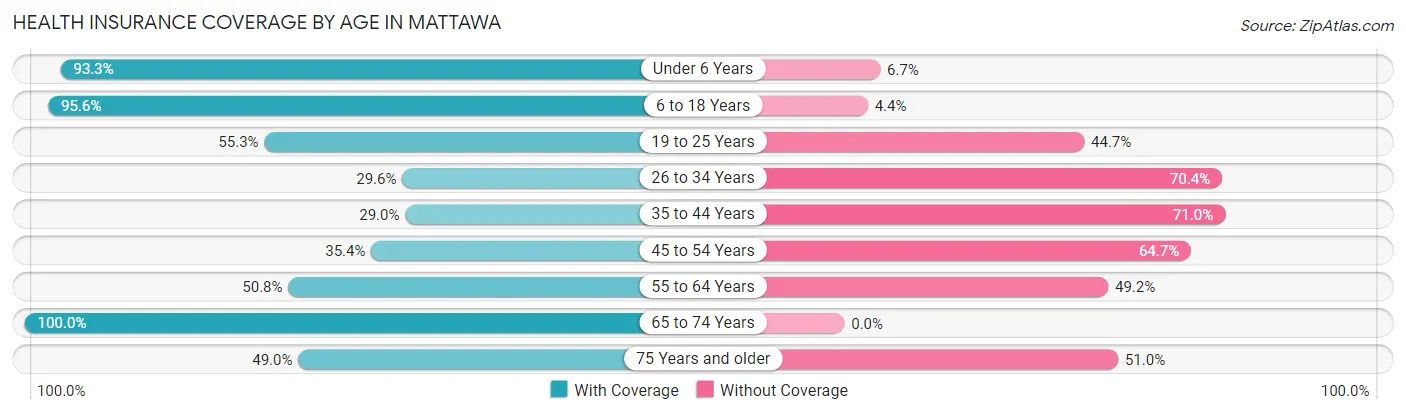
| Age Bracket | With Coverage | Without Coverage |
| Under 6 Years | 322 (93.3%) | 23 (6.7%) |
| 6 to 18 Years | 940 (95.6%) | 43 (4.4%) |
| 19 to 25 Years | 356 (55.3%) | 288 (44.7%) |
| 26 to 34 Years | 110 (29.6%) | 262 (70.4%) |
| 35 to 44 Years | 107 (29.0%) | 262 (71.0%) |
| 45 to 54 Years | 140 (35.3%) | 256 (64.6%) |
| 55 to 64 Years | 126 (50.8%) | 122 (49.2%) |
| 65 to 74 Years | 53 (100.0%) | 0 (0.0%) |
| 75 Years and older | 47 (49.0%) | 49 (51.0%) |
| Total | 2,201 (62.8%) | 1,305 (37.2%) |
Health Insurance Coverage by Citizenship Status in Mattawa
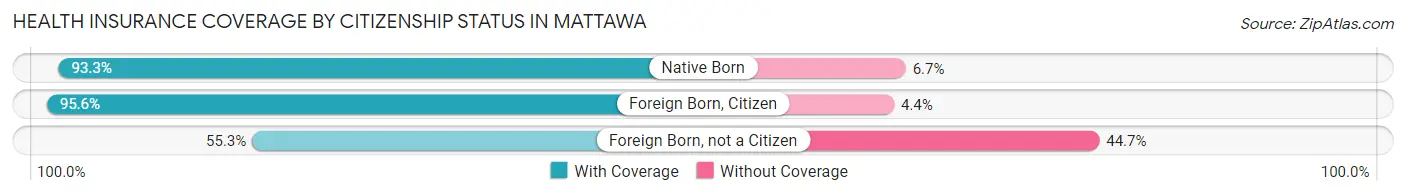
| Citizenship Status | With Coverage | Without Coverage |
| Native Born | 322 (93.3%) | 23 (6.7%) |
| Foreign Born, Citizen | 940 (95.6%) | 43 (4.4%) |
| Foreign Born, not a Citizen | 356 (55.3%) | 288 (44.7%) |
Health Insurance Coverage by Household Income in Mattawa
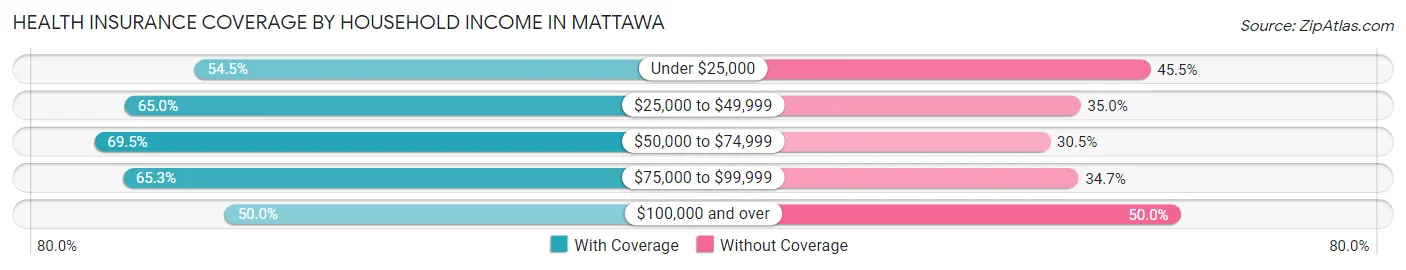
| Household Income | With Coverage | Without Coverage |
| Under $25,000 | 260 (54.5%) | 217 (45.5%) |
| $25,000 to $49,999 | 716 (65.0%) | 386 (35.0%) |
| $50,000 to $74,999 | 559 (69.5%) | 245 (30.5%) |
| $75,000 to $99,999 | 466 (65.3%) | 248 (34.7%) |
| $100,000 and over | 197 (50.0%) | 197 (50.0%) |
Public vs Private Health Insurance Coverage by Age in Mattawa
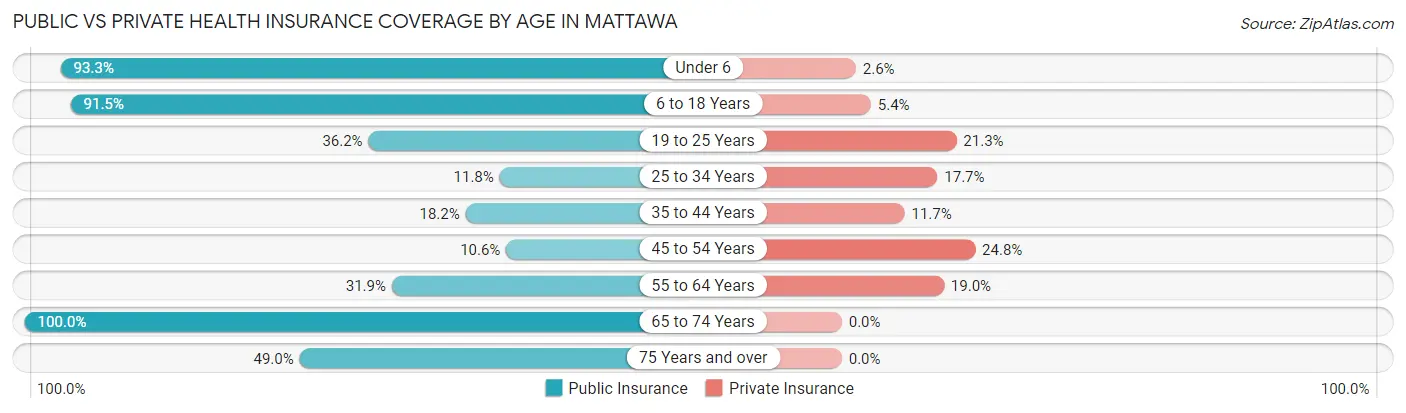
| Age Bracket | Public Insurance | Private Insurance |
| Under 6 | 322 (93.3%) | 9 (2.6%) |
| 6 to 18 Years | 899 (91.4%) | 53 (5.4%) |
| 19 to 25 Years | 233 (36.2%) | 137 (21.3%) |
| 25 to 34 Years | 44 (11.8%) | 66 (17.7%) |
| 35 to 44 Years | 67 (18.2%) | 43 (11.7%) |
| 45 to 54 Years | 42 (10.6%) | 98 (24.7%) |
| 55 to 64 Years | 79 (31.9%) | 47 (19.0%) |
| 65 to 74 Years | 53 (100.0%) | 0 (0.0%) |
| 75 Years and over | 47 (49.0%) | 0 (0.0%) |
| Total | 1,786 (50.9%) | 453 (12.9%) |
Disability Status by Sex by Age in Mattawa
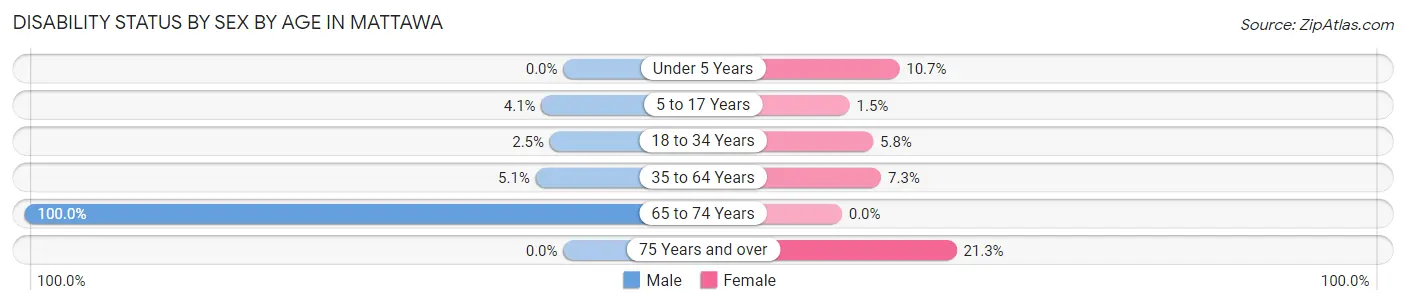
| Age Bracket | Male | Female |
| Under 5 Years | 0 (0.0%) | 11 (10.7%) |
| 5 to 17 Years | 21 (4.1%) | 6 (1.5%) |
| 18 to 34 Years | 14 (2.5%) | 34 (5.8%) |
| 35 to 64 Years | 26 (5.1%) | 37 (7.3%) |
| 65 to 74 Years | 43 (100.0%) | 0 (0.0%) |
| 75 Years and over | 0 (0.0%) | 10 (21.3%) |
Disability Class by Sex by Age in Mattawa
Disability Class: Hearing Difficulty
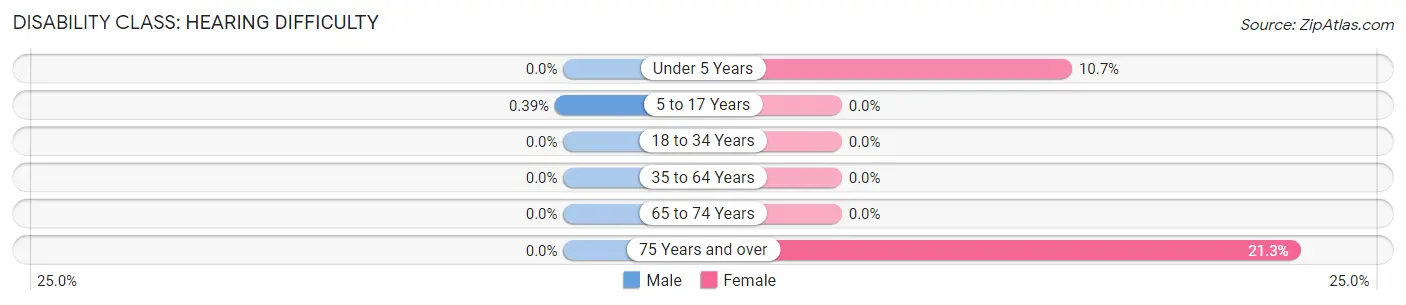
| Age Bracket | Male | Female |
| Under 5 Years | 0 (0.0%) | 11 (10.7%) |
| 5 to 17 Years | 2 (0.4%) | 0 (0.0%) |
| 18 to 34 Years | 0 (0.0%) | 0 (0.0%) |
| 35 to 64 Years | 0 (0.0%) | 0 (0.0%) |
| 65 to 74 Years | 0 (0.0%) | 0 (0.0%) |
| 75 Years and over | 0 (0.0%) | 10 (21.3%) |
Disability Class: Vision Difficulty
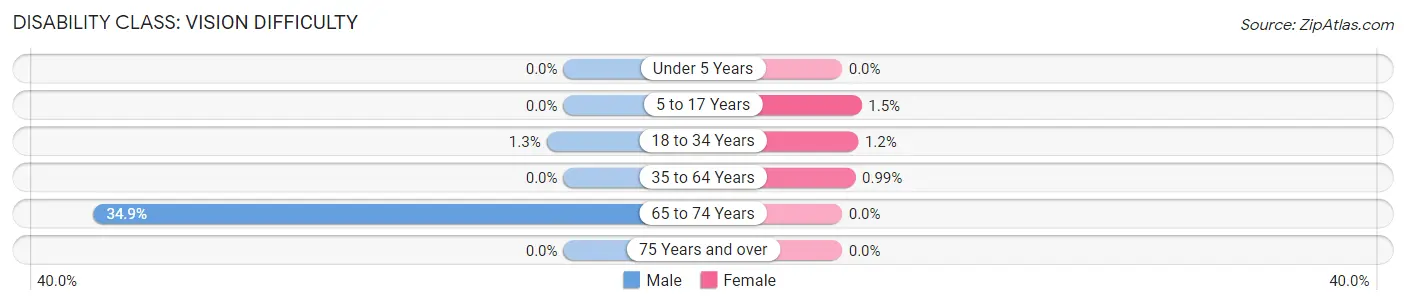
| Age Bracket | Male | Female |
| Under 5 Years | 0 (0.0%) | 0 (0.0%) |
| 5 to 17 Years | 0 (0.0%) | 6 (1.5%) |
| 18 to 34 Years | 7 (1.3%) | 7 (1.2%) |
| 35 to 64 Years | 0 (0.0%) | 5 (1.0%) |
| 65 to 74 Years | 15 (34.9%) | 0 (0.0%) |
| 75 Years and over | 0 (0.0%) | 0 (0.0%) |
Disability Class: Cognitive Difficulty
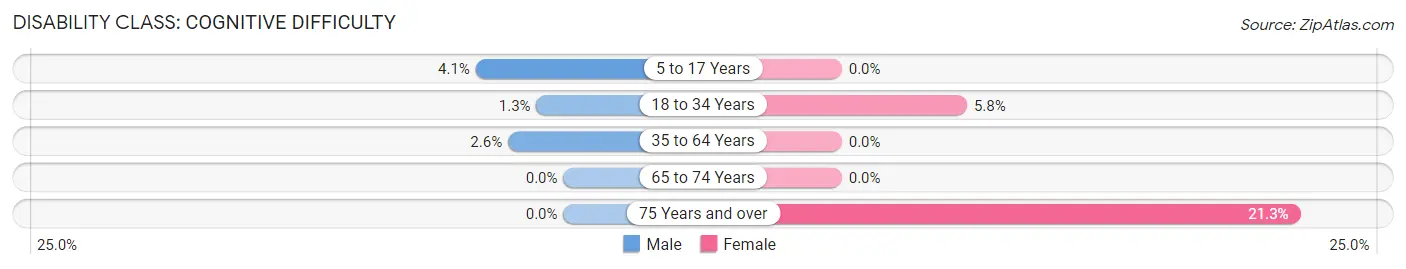
| Age Bracket | Male | Female |
| 5 to 17 Years | 21 (4.1%) | 0 (0.0%) |
| 18 to 34 Years | 7 (1.3%) | 34 (5.8%) |
| 35 to 64 Years | 13 (2.6%) | 0 (0.0%) |
| 65 to 74 Years | 0 (0.0%) | 0 (0.0%) |
| 75 Years and over | 0 (0.0%) | 10 (21.3%) |
Disability Class: Ambulatory Difficulty
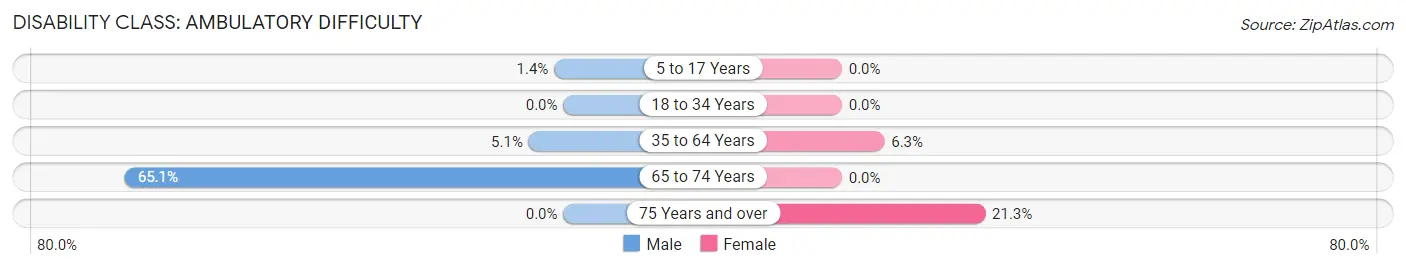
| Age Bracket | Male | Female |
| 5 to 17 Years | 7 (1.4%) | 0 (0.0%) |
| 18 to 34 Years | 0 (0.0%) | 0 (0.0%) |
| 35 to 64 Years | 26 (5.1%) | 32 (6.3%) |
| 65 to 74 Years | 28 (65.1%) | 0 (0.0%) |
| 75 Years and over | 0 (0.0%) | 10 (21.3%) |
Disability Class: Self-Care Difficulty
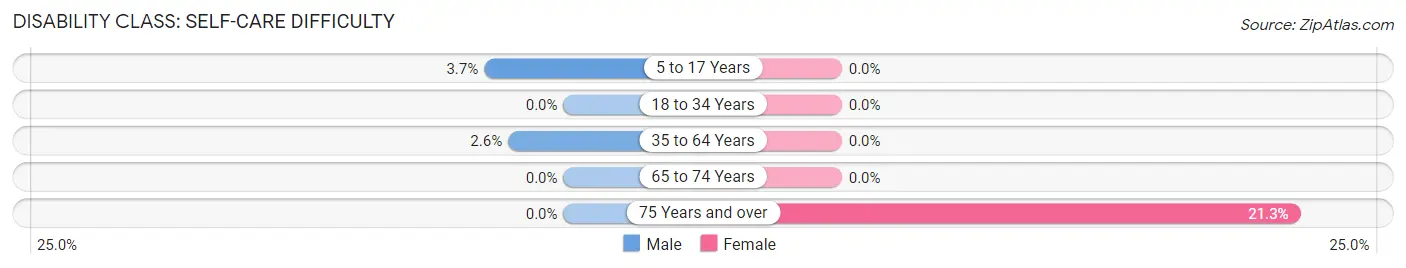
| Age Bracket | Male | Female |
| 5 to 17 Years | 19 (3.7%) | 0 (0.0%) |
| 18 to 34 Years | 0 (0.0%) | 0 (0.0%) |
| 35 to 64 Years | 13 (2.6%) | 0 (0.0%) |
| 65 to 74 Years | 0 (0.0%) | 0 (0.0%) |
| 75 Years and over | 0 (0.0%) | 10 (21.3%) |
Technology Access in Mattawa
Computing Device Access in Mattawa
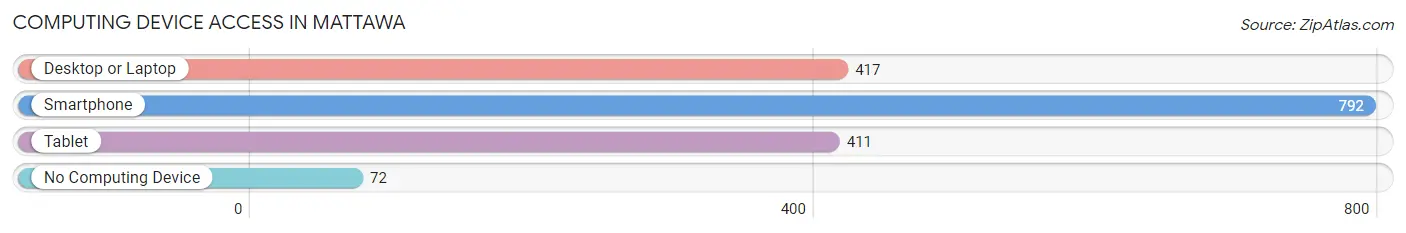
| Device Type | # Households | % Households |
| Desktop or Laptop | 417 | 46.8% |
| Smartphone | 792 | 88.8% |
| Tablet | 411 | 46.1% |
| No Computing Device | 72 | 8.1% |
| Total | 892 | 100.0% |
Internet Access in Mattawa
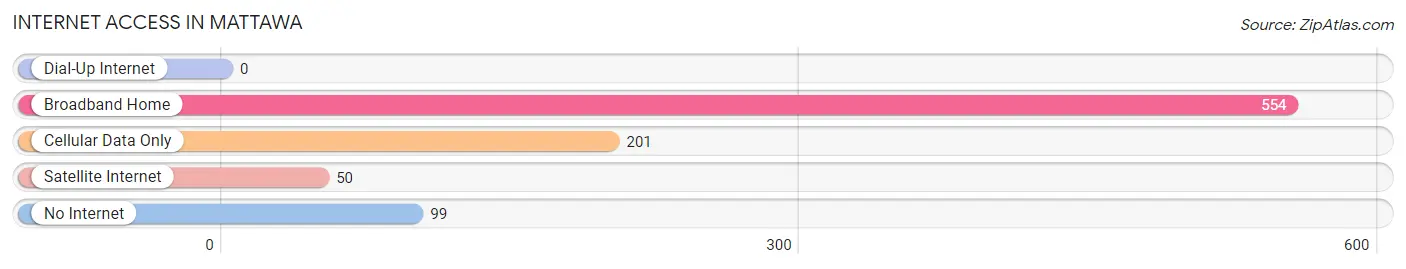
| Internet Type | # Households | % Households |
| Dial-Up Internet | 0 | 0.0% |
| Broadband Home | 554 | 62.1% |
| Cellular Data Only | 201 | 22.5% |
| Satellite Internet | 50 | 5.6% |
| No Internet | 99 | 11.1% |
| Total | 892 | 100.0% |
Mattawa Summary
Mattawa is a small town located in the Columbia Basin of Washington State, United States. It is situated in Grant County, approximately 20 miles south of the city of Moses Lake. The town is located on the banks of the Columbia River, and is home to a population of approximately 2,000 people.
History
The area around Mattawa was first inhabited by Native American tribes, including the Wanapum, Yakama, and Palouse. The first European settlers arrived in the area in the late 1800s, and the town of Mattawa was officially established in 1909. The town was named after the nearby Mattawa River, which was named by French-Canadian fur traders in the early 1800s.
The town of Mattawa was originally a farming community, and the main crops grown were wheat, barley, and potatoes. In the early 1900s, the town was also home to a number of small businesses, including a general store, a hotel, and a blacksmith shop.
In the 1950s, the town began to experience a period of growth and development. The construction of the Priest Rapids Dam in the 1960s brought new jobs and economic opportunities to the area, and the town began to expand. In the 1970s, the town was incorporated, and the population began to grow.
Geography
Mattawa is located in the Columbia Basin of Washington State, approximately 20 miles south of the city of Moses Lake. The town is situated on the banks of the Columbia River, and is surrounded by rolling hills and farmland. The nearby Mattawa River flows through the town, and is a popular spot for fishing and boating.
The climate in Mattawa is semi-arid, with hot summers and cold winters. The average annual temperature is around 50 degrees Fahrenheit, and the average annual precipitation is around 8 inches.
Economy
The economy of Mattawa is largely based on agriculture and tourism. The town is home to a number of farms, which produce a variety of crops, including wheat, barley, and potatoes. The nearby Priest Rapids Dam provides hydroelectric power to the area, and is a major employer in the town.
The town is also home to a number of small businesses, including restaurants, shops, and hotels. Tourism is also an important part of the local economy, and the town is a popular destination for outdoor activities, such as fishing, boating, and camping.
Demographics
As of the 2010 census, the population of Mattawa was 2,037. The racial makeup of the town was 75.3% White, 0.7% African American, 0.9% Native American, 0.3% Asian, 0.1% Pacific Islander, and 21.7% from other races. The median household income was $35,938, and the median family income was $41,250.
The town is served by the Mattawa School District, which includes one elementary school, one middle school, and one high school. The town is also home to a number of churches, including the Mattawa United Methodist Church and the Mattawa Assembly of God.
Common Questions
What is Per Capita Income in Mattawa?
Per Capita income in Mattawa is $15,025.
What is the Median Family Income in Mattawa?
Median Family Income in Mattawa is $41,250.
What is the Median Household income in Mattawa?
Median Household Income in Mattawa is $45,500.
What is Income or Wage Gap in Mattawa?
Income or Wage Gap in Mattawa is 25.4%.
Women in Mattawa earn 74.6 cents for every dollar earned by a man.
What is Family Income Deficit in Mattawa?
Family Income Deficit in Mattawa is $12,636.
Families that are below poverty line in Mattawa earn $12,636 less on average than the poverty threshold level.
What is Inequality or Gini Index in Mattawa?
Inequality or Gini Index in Mattawa is 0.36.
What is the Total Population of Mattawa?
Total Population of Mattawa is 3,506.
What is the Total Male Population of Mattawa?
Total Male Population of Mattawa is 1,840.
What is the Total Female Population of Mattawa?
Total Female Population of Mattawa is 1,666.
What is the Ratio of Males per 100 Females in Mattawa?
There are 110.44 Males per 100 Females in Mattawa.
What is the Ratio of Females per 100 Males in Mattawa?
There are 90.54 Females per 100 Males in Mattawa.
What is the Median Population Age in Mattawa?
Median Population Age in Mattawa is 23.7 Years.
What is the Average Family Size in Mattawa
Average Family Size in Mattawa is 3.9 People.
What is the Average Household Size in Mattawa
Average Household Size in Mattawa is 3.9 People.
How Large is the Labor Force in Mattawa?
There are 1,731 People in the Labor Forcein in Mattawa.
What is the Percentage of People in the Labor Force in Mattawa?
70.7% of People are in the Labor Force in Mattawa.
What is the Unemployment Rate in Mattawa?
Unemployment Rate in Mattawa is 10.9%.