Presidio, TX Map & Demographics
Presidio Map
Presidio Overview
$12,252
PER CAPITA INCOME
$33,934
AVG FAMILY INCOME
$22,917
AVG HOUSEHOLD INCOME
63.6%
WAGE / INCOME GAP [ % ]
36.4¢/ $1
WAGE / INCOME GAP [ $ ]
$7,209
FAMILY INCOME DEFICIT
0.48
INEQUALITY / GINI INDEX
3,299
TOTAL POPULATION
1,536
MALE POPULATION
1,763
FEMALE POPULATION
87.12
MALES / 100 FEMALES
114.78
FEMALES / 100 MALES
22.9
MEDIAN AGE
6.3
AVG FAMILY SIZE
4.2
AVG HOUSEHOLD SIZE
1,150
LABOR FORCE [ PEOPLE ]
53.4%
PERCENT IN LABOR FORCE
30.0%
UNEMPLOYMENT RATE
Presidio Zip Codes
Presidio Area Codes
Income in Presidio
Income Overview in Presidio
Per Capita Income in Presidio is $12,252, while median incomes of families and households are $33,934 and $22,917 respectively.
| Characteristic | Number | Measure |
| Per Capita Income | 3,299 | $12,252 |
| Median Family Income | 470 | $33,934 |
| Mean Family Income | 470 | $45,223 |
| Median Household Income | 794 | $22,917 |
| Mean Household Income | 794 | $34,756 |
| Income Deficit | 470 | $7,209 |
| Wage / Income Gap (%) | 3,299 | 63.61% |
| Wage / Income Gap ($) | 3,299 | 36.39¢ per $1 |
| Gini / Inequality Index | 3,299 | 0.48 |
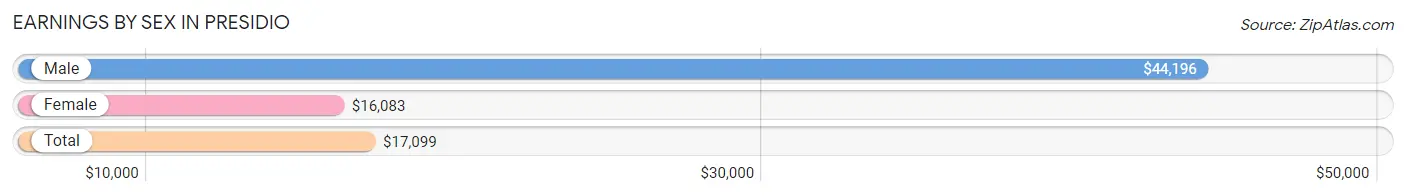
Earnings by Sex in Presidio
Average Earnings in Presidio are $17,099, $44,196 for men and $16,083 for women, a difference of 63.6%.
| Sex | Number | Average Earnings |
| Male | 567 (44.4%) | $44,196 |
| Female | 710 (55.6%) | $16,083 |
| Total | 1,277 (100.0%) | $17,099 |
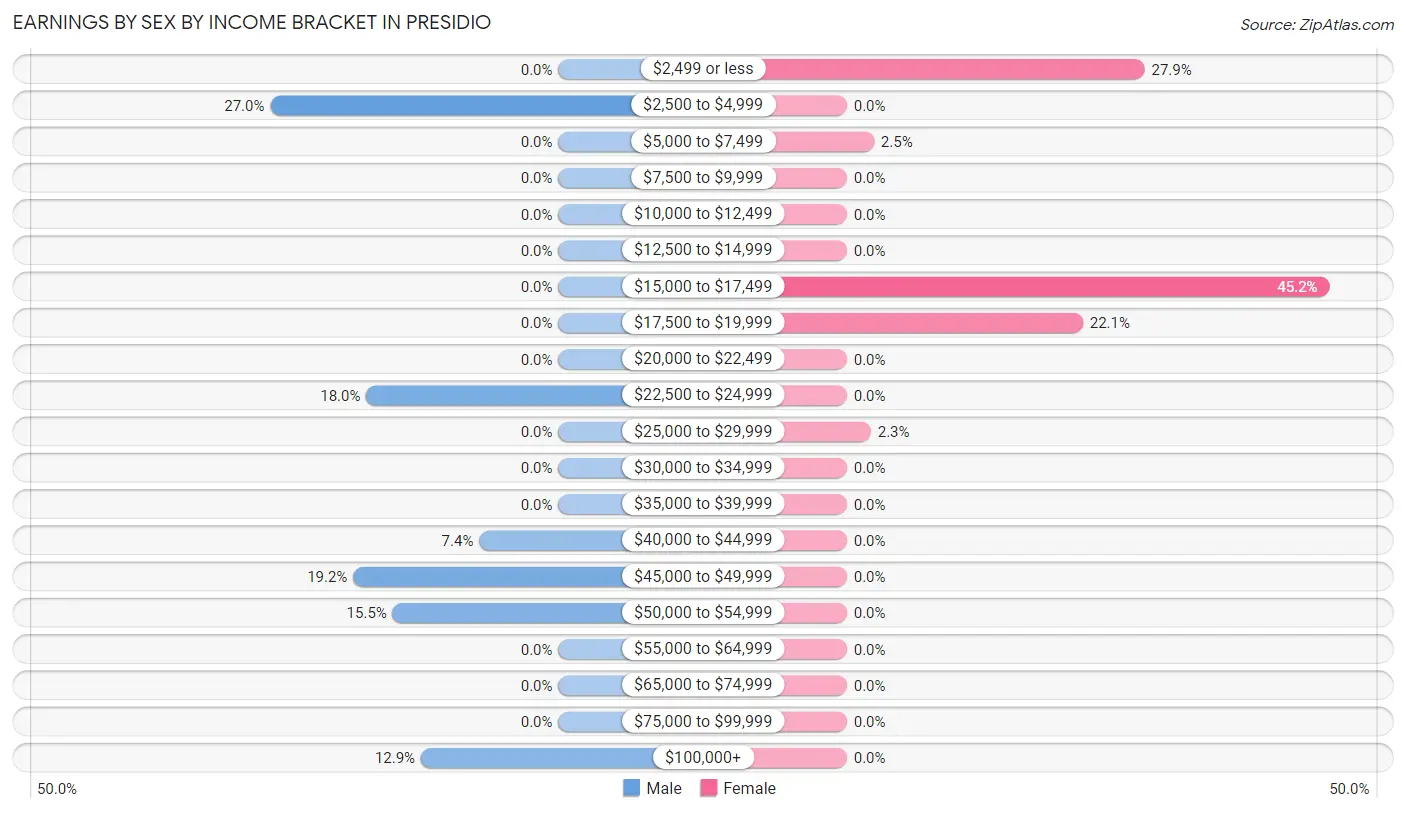
Earnings by Sex by Income Bracket in Presidio
The most common earnings brackets in Presidio are $2,500 to $4,999 for men (153 | 27.0%) and $15,000 to $17,499 for women (321 | 45.2%).
| Income | Male | Female |
| $2,499 or less | 0 (0.0%) | 198 (27.9%) |
| $2,500 to $4,999 | 153 (27.0%) | 0 (0.0%) |
| $5,000 to $7,499 | 0 (0.0%) | 18 (2.5%) |
| $7,500 to $9,999 | 0 (0.0%) | 0 (0.0%) |
| $10,000 to $12,499 | 0 (0.0%) | 0 (0.0%) |
| $12,500 to $14,999 | 0 (0.0%) | 0 (0.0%) |
| $15,000 to $17,499 | 0 (0.0%) | 321 (45.2%) |
| $17,500 to $19,999 | 0 (0.0%) | 157 (22.1%) |
| $20,000 to $22,499 | 0 (0.0%) | 0 (0.0%) |
| $22,500 to $24,999 | 102 (18.0%) | 0 (0.0%) |
| $25,000 to $29,999 | 0 (0.0%) | 16 (2.2%) |
| $30,000 to $34,999 | 0 (0.0%) | 0 (0.0%) |
| $35,000 to $39,999 | 0 (0.0%) | 0 (0.0%) |
| $40,000 to $44,999 | 42 (7.4%) | 0 (0.0%) |
| $45,000 to $49,999 | 109 (19.2%) | 0 (0.0%) |
| $50,000 to $54,999 | 88 (15.5%) | 0 (0.0%) |
| $55,000 to $64,999 | 0 (0.0%) | 0 (0.0%) |
| $65,000 to $74,999 | 0 (0.0%) | 0 (0.0%) |
| $75,000 to $99,999 | 0 (0.0%) | 0 (0.0%) |
| $100,000+ | 73 (12.9%) | 0 (0.0%) |
| Total | 567 (100.0%) | 710 (100.0%) |
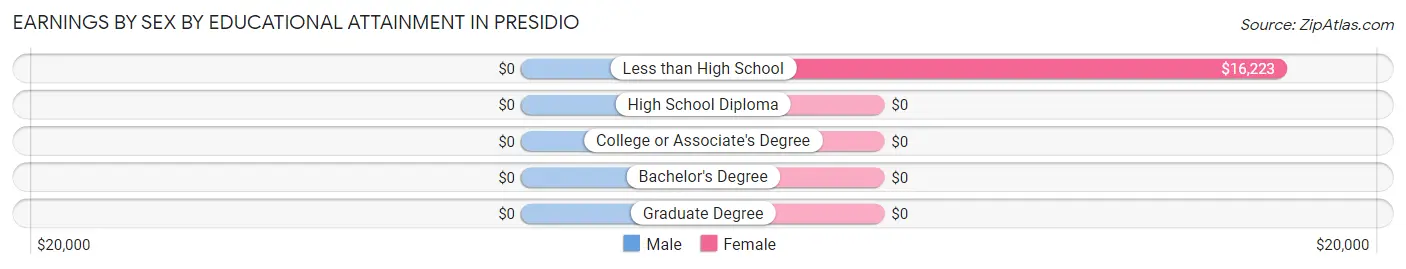
Earnings by Sex by Educational Attainment in Presidio
| Educational Attainment | Male Income | Female Income |
| Less than High School | - | - |
| High School Diploma | - | - |
| College or Associate's Degree | - | - |
| Bachelor's Degree | - | - |
| Graduate Degree | - | - |
| Total | $46,927 | $16,264 |
Family Income in Presidio
Family Income Brackets in Presidio
According to the Presidio family income data, there are 79 families falling into the less than $10,000 income range, which is the most common income bracket and makes up 16.8% of all families.
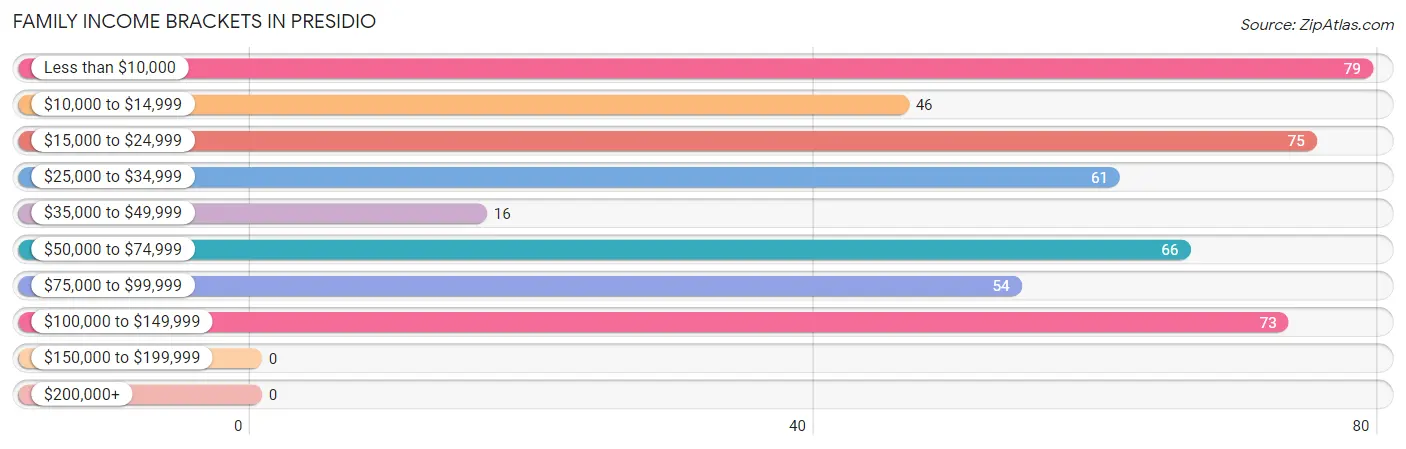
| Income Bracket | # Families | % Families |
| Less than $10,000 | 79 | 16.8% |
| $10,000 to $14,999 | 46 | 9.8% |
| $15,000 to $24,999 | 75 | 16.0% |
| $25,000 to $34,999 | 61 | 13.0% |
| $35,000 to $49,999 | 16 | 3.4% |
| $50,000 to $74,999 | 66 | 14.0% |
| $75,000 to $99,999 | 54 | 11.5% |
| $100,000 to $149,999 | 73 | 15.5% |
| $150,000 to $199,999 | 0 | 0.0% |
| $200,000+ | 0 | 0.0% |
Family Income by Famaliy Size in Presidio
3-person families (114 | 24.3%) account for the highest median family income in Presidio with $50,409 per family, while 3-person families (114 | 24.3%) have the highest median income of $16,803 per family member.
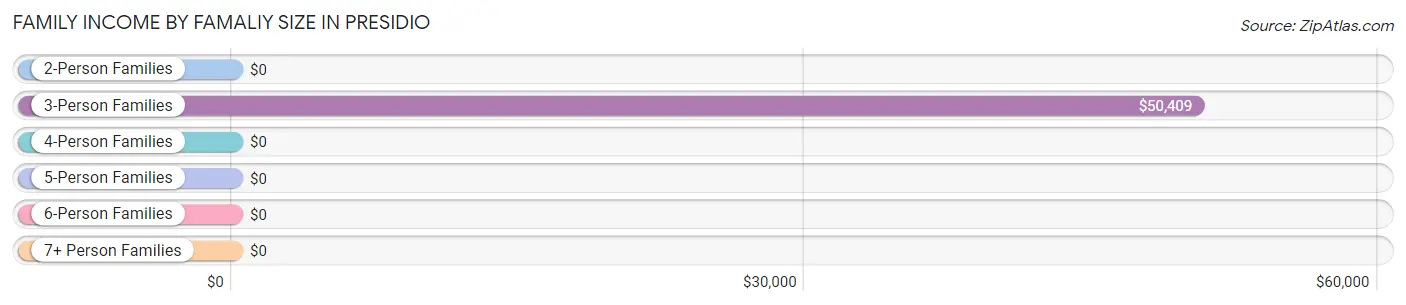
| Income Bracket | # Families | Median Income |
| 2-Person Families | 237 (50.4%) | $0 |
| 3-Person Families | 114 (24.3%) | $50,409 |
| 4-Person Families | 18 (3.8%) | $0 |
| 5-Person Families | 31 (6.6%) | $0 |
| 6-Person Families | 0 (0.0%) | $0 |
| 7+ Person Families | 70 (14.9%) | $0 |
| Total | 470 (100.0%) | $33,934 |
Family Income by Number of Earners in Presidio
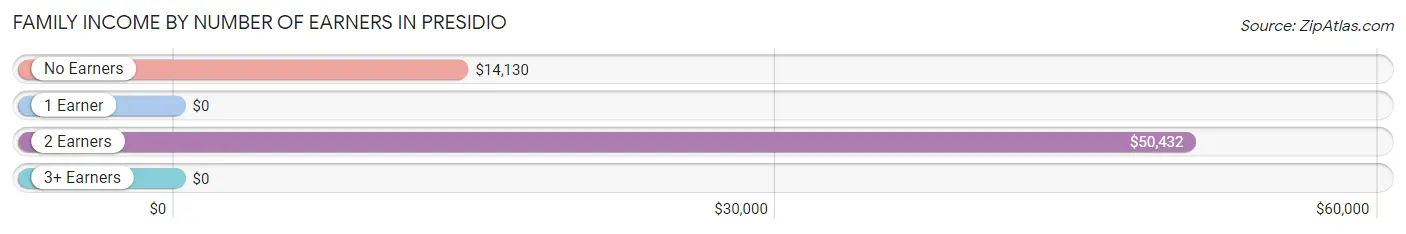
| Number of Earners | # Families | Median Income |
| No Earners | 182 (38.7%) | $14,130 |
| 1 Earner | 121 (25.7%) | $0 |
| 2 Earners | 113 (24.0%) | $50,432 |
| 3+ Earners | 54 (11.5%) | $0 |
| Total | 470 (100.0%) | $33,934 |
Household Income in Presidio
Household Income Brackets in Presidio
With 177 households falling in the category, the $15,000 to $24,999 income range is the most frequent in Presidio, accounting for 22.3% of all households.
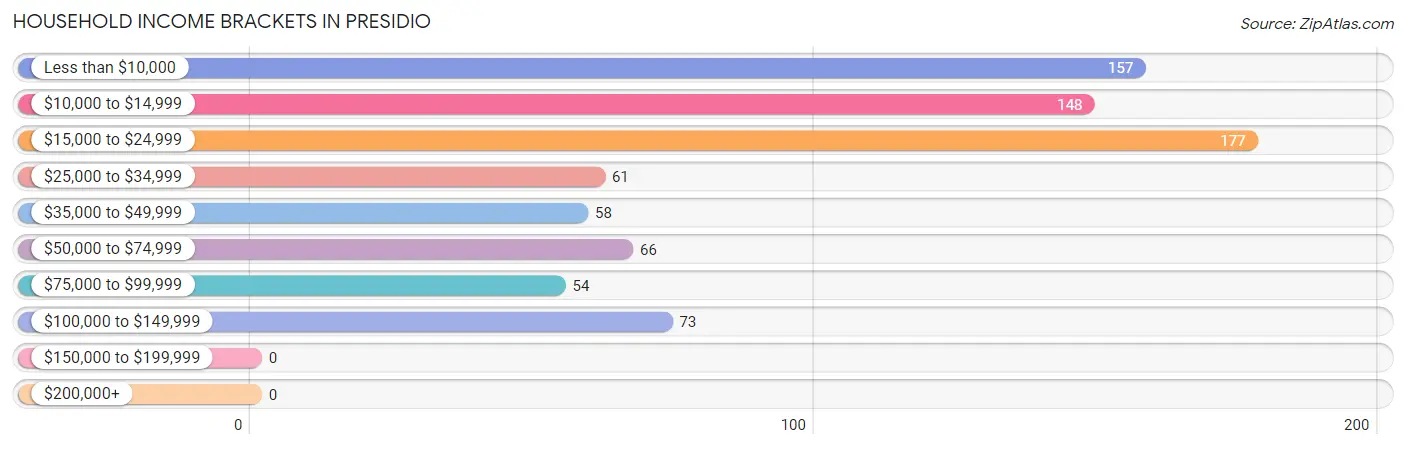
| Income Bracket | # Households | % Households |
| Less than $10,000 | 157 | 19.8% |
| $10,000 to $14,999 | 148 | 18.6% |
| $15,000 to $24,999 | 177 | 22.3% |
| $25,000 to $34,999 | 61 | 7.7% |
| $35,000 to $49,999 | 58 | 7.3% |
| $50,000 to $74,999 | 66 | 8.3% |
| $75,000 to $99,999 | 54 | 6.8% |
| $100,000 to $149,999 | 73 | 9.2% |
| $150,000 to $199,999 | 0 | 0.0% |
| $200,000+ | 0 | 0.0% |
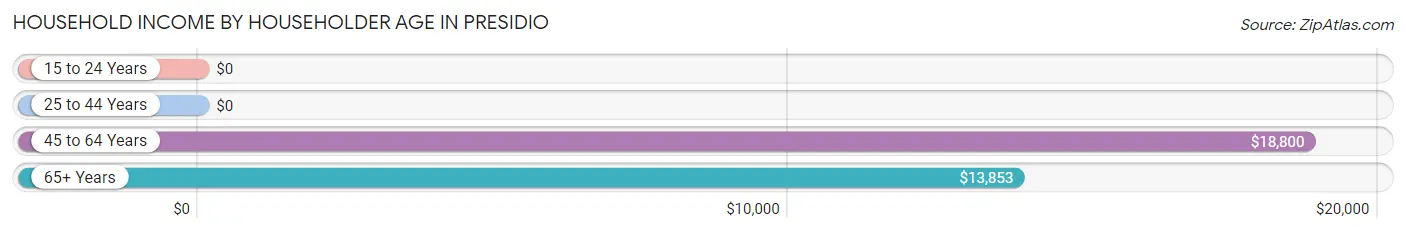
Household Income by Householder Age in Presidio
The median household income in Presidio is $22,917, with the highest median household income of $18,800 found in the 45 to 64 years age bracket for the primary householder. A total of 186 households (23.4%) fall into this category. Meanwhile, the 15 to 24 years age bracket for the primary householder has the lowest median household income of $0, with 42 households (5.3%) in this group.
| Income Bracket | # Households | Median Income |
| 15 to 24 Years | 42 (5.3%) | $0 |
| 25 to 44 Years | 247 (31.1%) | $0 |
| 45 to 64 Years | 186 (23.4%) | $18,800 |
| 65+ Years | 319 (40.2%) | $13,853 |
| Total | 794 (100.0%) | $22,917 |
Poverty in Presidio
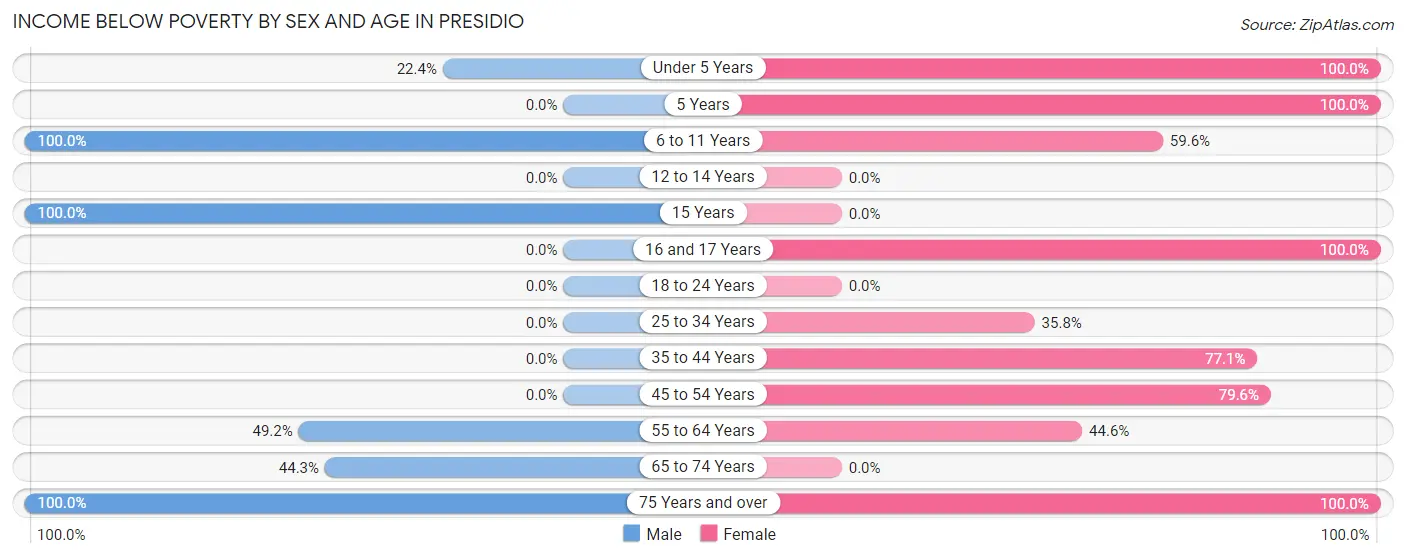
Income Below Poverty by Sex and Age in Presidio
With 44.7% poverty level for males and 53.5% for females among the residents of Presidio, 6 to 11 year old males and under 5 year old females are the most vulnerable to poverty, with 310 males (100.0%) and 74 females (100.0%) in their respective age groups living below the poverty level.
| Age Bracket | Male | Female |
| Under 5 Years | 73 (22.4%) | 74 (100.0%) |
| 5 Years | 0 (0.0%) | 55 (100.0%) |
| 6 to 11 Years | 310 (100.0%) | 118 (59.6%) |
| 12 to 14 Years | 0 (0.0%) | 0 (0.0%) |
| 15 Years | 103 (100.0%) | 0 (0.0%) |
| 16 and 17 Years | 0 (0.0%) | 130 (100.0%) |
| 18 to 24 Years | 0 (0.0%) | 0 (0.0%) |
| 25 to 34 Years | 0 (0.0%) | 92 (35.8%) |
| 35 to 44 Years | 0 (0.0%) | 182 (77.1%) |
| 45 to 54 Years | 0 (0.0%) | 43 (79.6%) |
| 55 to 64 Years | 29 (49.1%) | 91 (44.6%) |
| 65 to 74 Years | 58 (44.3%) | 0 (0.0%) |
| 75 Years and over | 113 (100.0%) | 158 (100.0%) |
| Total | 686 (44.7%) | 943 (53.5%) |
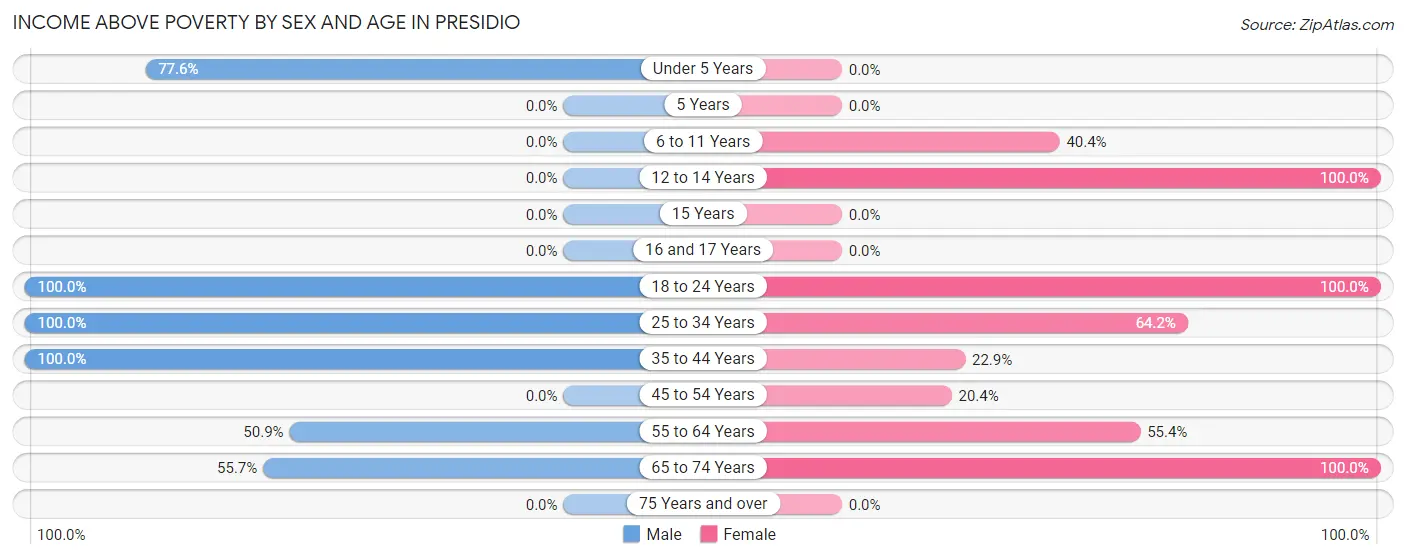
Income Above Poverty by Sex and Age in Presidio
According to the poverty statistics in Presidio, males aged 18 to 24 years and females aged 12 to 14 years are the age groups that are most secure financially, with 100.0% of males and 100.0% of females in these age groups living above the poverty line.
| Age Bracket | Male | Female |
| Under 5 Years | 253 (77.6%) | 0 (0.0%) |
| 5 Years | 0 (0.0%) | 0 (0.0%) |
| 6 to 11 Years | 0 (0.0%) | 80 (40.4%) |
| 12 to 14 Years | 0 (0.0%) | 80 (100.0%) |
| 15 Years | 0 (0.0%) | 0 (0.0%) |
| 16 and 17 Years | 0 (0.0%) | 0 (0.0%) |
| 18 to 24 Years | 195 (100.0%) | 229 (100.0%) |
| 25 to 34 Years | 55 (100.0%) | 165 (64.2%) |
| 35 to 44 Years | 244 (100.0%) | 54 (22.9%) |
| 45 to 54 Years | 0 (0.0%) | 11 (20.4%) |
| 55 to 64 Years | 30 (50.8%) | 113 (55.4%) |
| 65 to 74 Years | 73 (55.7%) | 88 (100.0%) |
| 75 Years and over | 0 (0.0%) | 0 (0.0%) |
| Total | 850 (55.3%) | 820 (46.5%) |
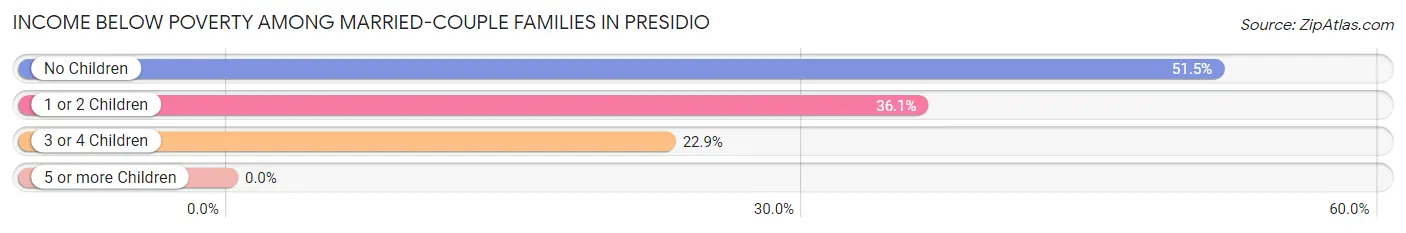
Income Below Poverty Among Married-Couple Families in Presidio
The poverty statistics for married-couple families in Presidio show that 43.0% or 168 of the total 391 families live below the poverty line. Families with no children have the highest poverty rate of 51.5%, comprising of 121 families. On the other hand, families with 3 or 4 children have the lowest poverty rate of 22.9%, which includes 16 families.
| Children | Above Poverty | Below Poverty |
| No Children | 114 (48.5%) | 121 (51.5%) |
| 1 or 2 Children | 55 (63.9%) | 31 (36.0%) |
| 3 or 4 Children | 54 (77.1%) | 16 (22.9%) |
| 5 or more Children | 0 (0.0%) | 0 (0.0%) |
| Total | 223 (57.0%) | 168 (43.0%) |
Income Below Poverty Among Single-Parent Households in Presidio
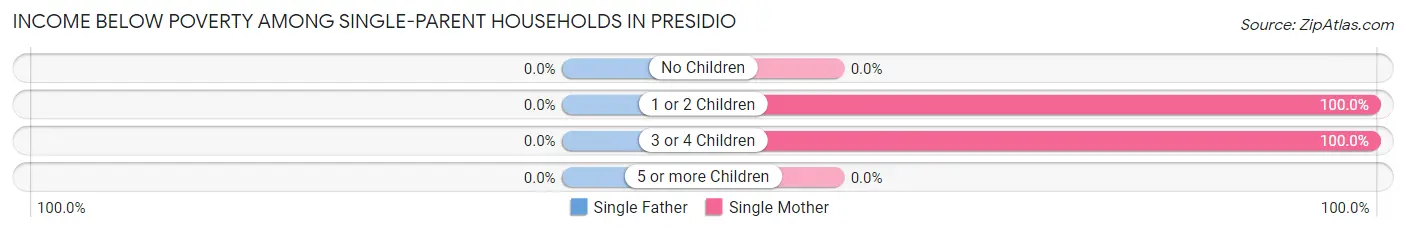
| Children | Single Father | Single Mother |
| No Children | 0 (0.0%) | 0 (0.0%) |
| 1 or 2 Children | 0 (0.0%) | 61 (100.0%) |
| 3 or 4 Children | 0 (0.0%) | 18 (100.0%) |
| 5 or more Children | 0 (0.0%) | 0 (0.0%) |
| Total | 0 (0.0%) | 79 (100.0%) |
Income Below Poverty Among Married-Couple vs Single-Parent Households in Presidio
The poverty data for Presidio shows that 168 of the married-couple family households (43.0%) and 79 of the single-parent households (100.0%) are living below the poverty level. Within the married-couple family households, those with no children have the highest poverty rate, with 121 households (51.5%) falling below the poverty line. Among the single-parent households, those with 1 or 2 children have the highest poverty rate, with 61 household (100.0%) living below poverty.
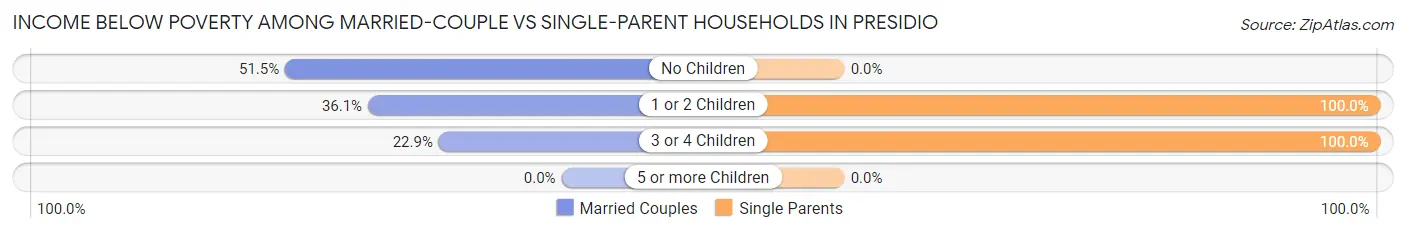
| Children | Married-Couple Families | Single-Parent Households |
| No Children | 121 (51.5%) | 0 (0.0%) |
| 1 or 2 Children | 31 (36.0%) | 61 (100.0%) |
| 3 or 4 Children | 16 (22.9%) | 18 (100.0%) |
| 5 or more Children | 0 (0.0%) | 0 (0.0%) |
| Total | 168 (43.0%) | 79 (100.0%) |
Race in Presidio
The most populous races in Presidio are Hispanic or Latino (3,299 | 100.0%), Two or more Races (1,749 | 53.0%), and White / Caucasian (1,448 | 43.9%).
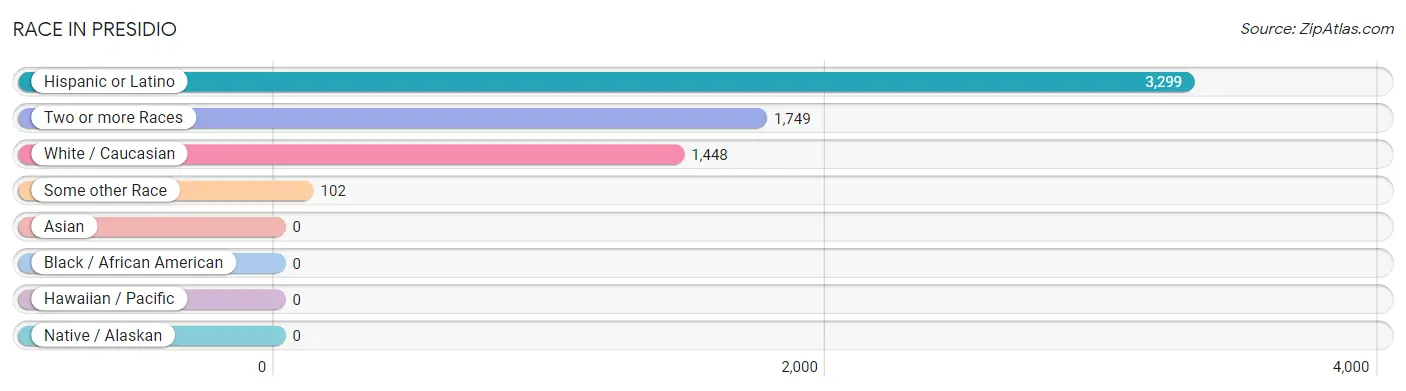
| Race | # Population | % Population |
| Asian | 0 | 0.0% |
| Black / African American | 0 | 0.0% |
| Hawaiian / Pacific | 0 | 0.0% |
| Hispanic or Latino | 3,299 | 100.0% |
| Native / Alaskan | 0 | 0.0% |
| White / Caucasian | 1,448 | 43.9% |
| Two or more Races | 1,749 | 53.0% |
| Some other Race | 102 | 3.1% |
| Total | 3,299 | 100.0% |
Ancestry in Presidio
The most populous ancestries reported in Presidio are , and Mexican (3,299 | 100.0%), together accounting for 100.0% of all Presidio residents.

| Ancestry | # Population | % Population |
| Mexican | 3,299 | 100.0% | View All 1 Rows |
Immigrants in Presidio
The most numerous immigrant groups reported in Presidio came from Central America (1,465 | 44.4%), Latin America (1,465 | 44.4%), and Mexico (1,465 | 44.4%), together accounting for 133.2% of all Presidio residents.
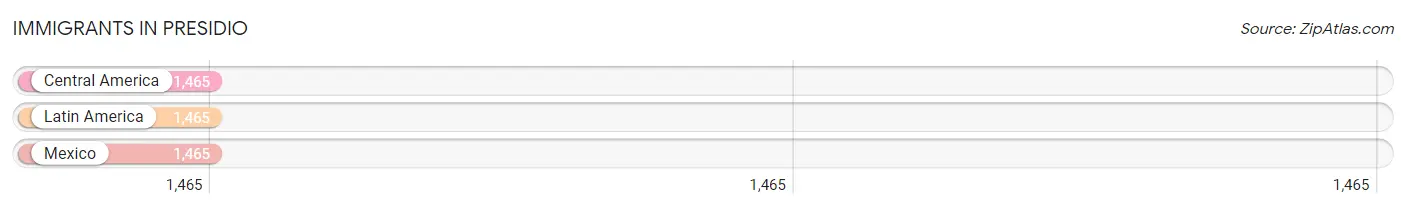
| Immigration Origin | # Population | % Population |
| Central America | 1,465 | 44.4% |
| Latin America | 1,465 | 44.4% |
| Mexico | 1,465 | 44.4% | View All 3 Rows |
Sex and Age in Presidio
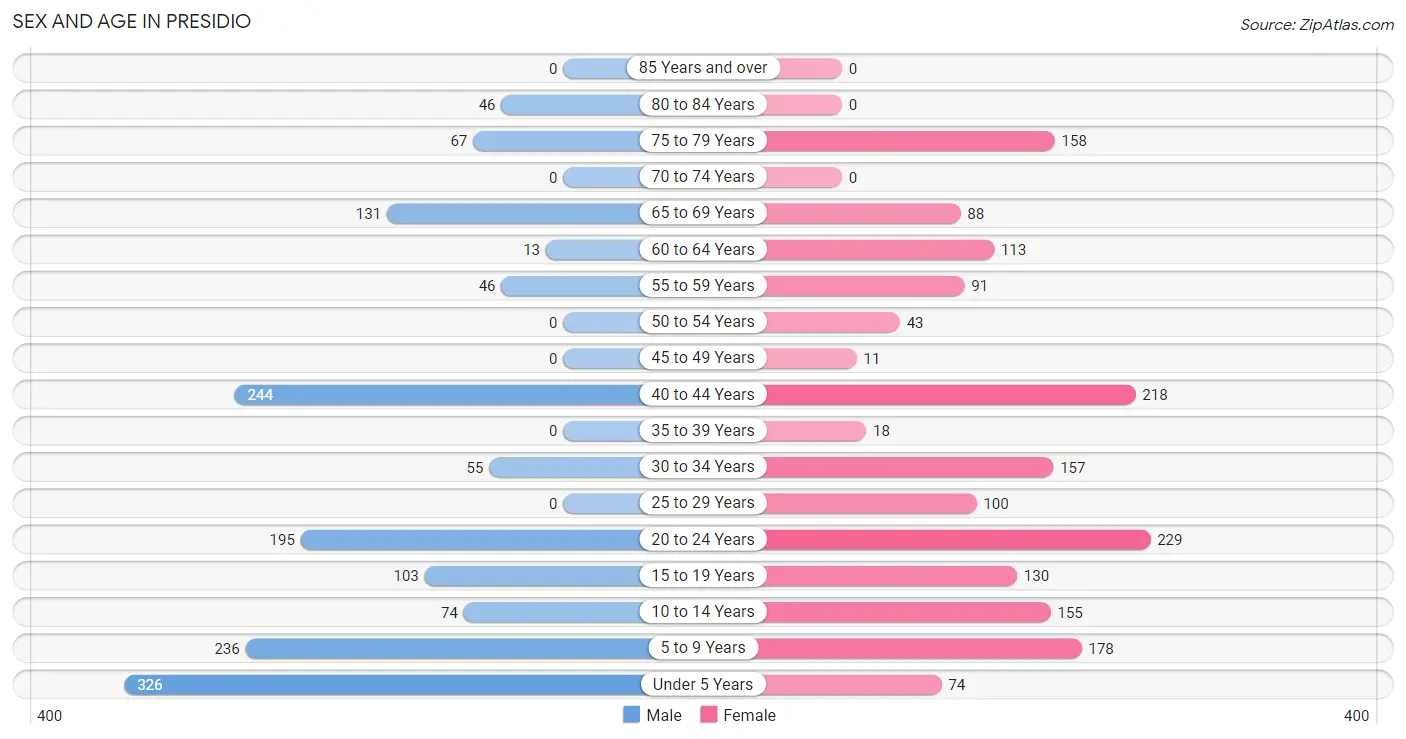
Sex and Age in Presidio
The most populous age groups in Presidio are Under 5 Years (326 | 21.2%) for men and 20 to 24 Years (229 | 13.0%) for women.
| Age Bracket | Male | Female |
| Under 5 Years | 326 (21.2%) | 74 (4.2%) |
| 5 to 9 Years | 236 (15.4%) | 178 (10.1%) |
| 10 to 14 Years | 74 (4.8%) | 155 (8.8%) |
| 15 to 19 Years | 103 (6.7%) | 130 (7.4%) |
| 20 to 24 Years | 195 (12.7%) | 229 (13.0%) |
| 25 to 29 Years | 0 (0.0%) | 100 (5.7%) |
| 30 to 34 Years | 55 (3.6%) | 157 (8.9%) |
| 35 to 39 Years | 0 (0.0%) | 18 (1.0%) |
| 40 to 44 Years | 244 (15.9%) | 218 (12.4%) |
| 45 to 49 Years | 0 (0.0%) | 11 (0.6%) |
| 50 to 54 Years | 0 (0.0%) | 43 (2.4%) |
| 55 to 59 Years | 46 (3.0%) | 91 (5.2%) |
| 60 to 64 Years | 13 (0.9%) | 113 (6.4%) |
| 65 to 69 Years | 131 (8.5%) | 88 (5.0%) |
| 70 to 74 Years | 0 (0.0%) | 0 (0.0%) |
| 75 to 79 Years | 67 (4.4%) | 158 (9.0%) |
| 80 to 84 Years | 46 (3.0%) | 0 (0.0%) |
| 85 Years and over | 0 (0.0%) | 0 (0.0%) |
| Total | 1,536 (100.0%) | 1,763 (100.0%) |
Families and Households in Presidio
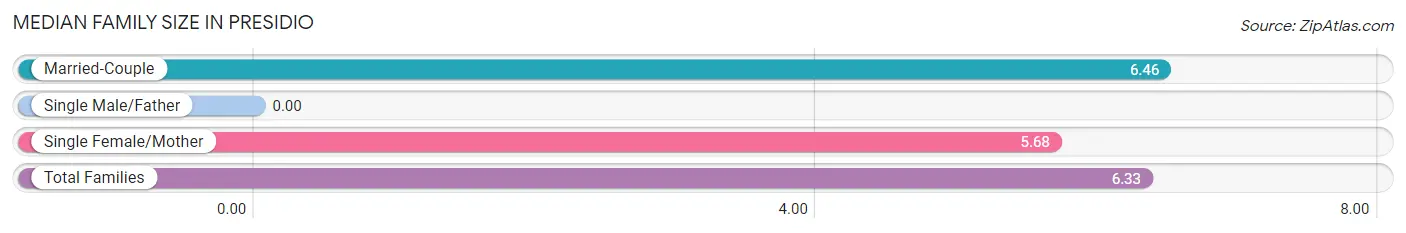
Median Family Size in Presidio
| Family Type | # Families | Family Size |
| Married-Couple | 391 (83.2%) | 6.46 |
| Single Male/Father | 0 (0.0%) | - |
| Single Female/Mother | 79 (16.8%) | 5.68 |
| Total Families | 470 (100.0%) | 6.33 |
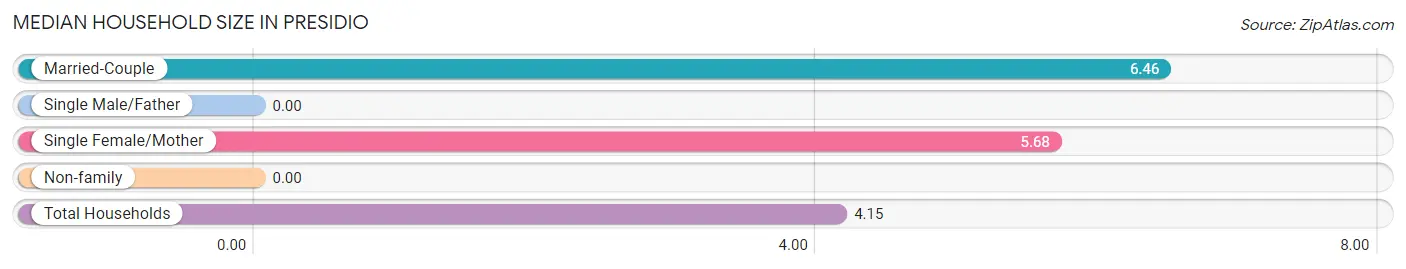
Median Household Size in Presidio
| Household Type | # Households | Household Size |
| Married-Couple | 391 (49.2%) | 6.46 |
| Single Male/Father | 0 (0.0%) | - |
| Single Female/Mother | 79 (10.0%) | 5.68 |
| Non-family | 324 (40.8%) | - |
| Total Households | 794 (100.0%) | 4.15 |
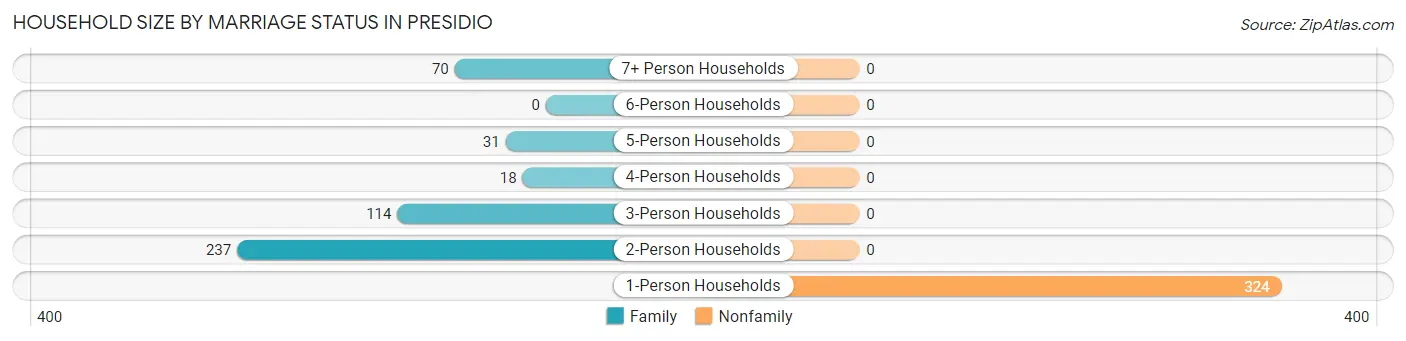
Household Size by Marriage Status in Presidio
Out of a total of 794 households in Presidio, 470 (59.2%) are family households, while 324 (40.8%) are nonfamily households. The most numerous type of family households are 2-person households, comprising 237, and the most common type of nonfamily households are 1-person households, comprising 324.
| Household Size | Family Households | Nonfamily Households |
| 1-Person Households | - | 324 (40.8%) |
| 2-Person Households | 237 (29.8%) | 0 (0.0%) |
| 3-Person Households | 114 (14.4%) | 0 (0.0%) |
| 4-Person Households | 18 (2.3%) | 0 (0.0%) |
| 5-Person Households | 31 (3.9%) | 0 (0.0%) |
| 6-Person Households | 0 (0.0%) | 0 (0.0%) |
| 7+ Person Households | 70 (8.8%) | 0 (0.0%) |
| Total | 470 (59.2%) | 324 (40.8%) |
Female Fertility in Presidio
Fertility by Age in Presidio
Average fertility rate in Presidio is 162.0 births per 1,000 women. Women in the age bracket of 20 to 34 years have the highest fertility rate with 251.0 births per 1,000 women. Women in the age bracket of 20 to 34 years acount for 87.1% of all women with births.
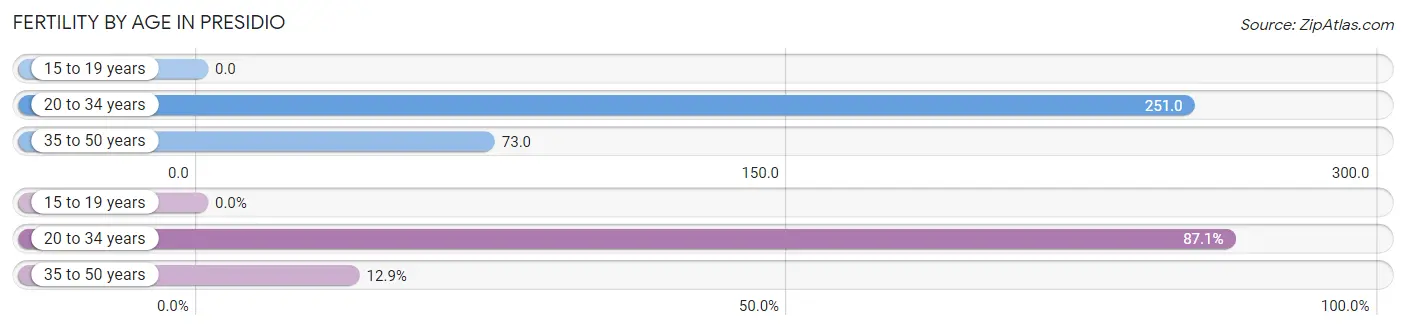
| Age Bracket | Women with Births | Births / 1,000 Women |
| 15 to 19 years | 0 (0.0%) | 0.0 |
| 20 to 34 years | 122 (87.1%) | 251.0 |
| 35 to 50 years | 18 (12.9%) | 73.0 |
| Total | 140 (100.0%) | 162.0 |
Fertility by Age by Marriage Status in Presidio
5.7% of women with births (140) in Presidio are married. The highest percentage of unmarried women with births falls into 35 to 50 years age bracket with 100.0% of them unmarried at the time of birth, while the lowest percentage of unmarried women with births belong to 20 to 34 years age bracket with 93.4% of them unmarried.
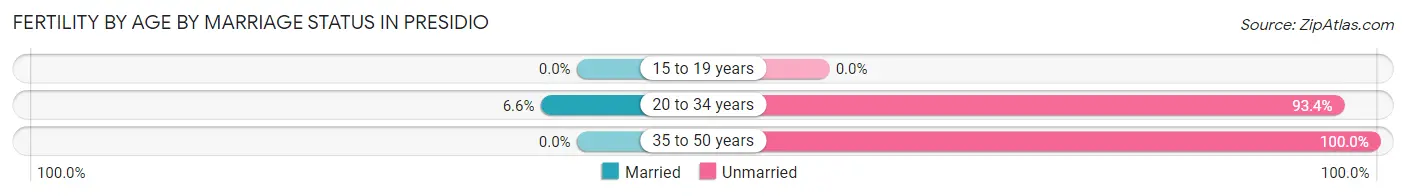
| Age Bracket | Married | Unmarried |
| 15 to 19 years | 0 (0.0%) | 0 (0.0%) |
| 20 to 34 years | 8 (6.6%) | 114 (93.4%) |
| 35 to 50 years | 0 (0.0%) | 18 (100.0%) |
| Total | 8 (5.7%) | 132 (94.3%) |
Fertility by Education in Presidio
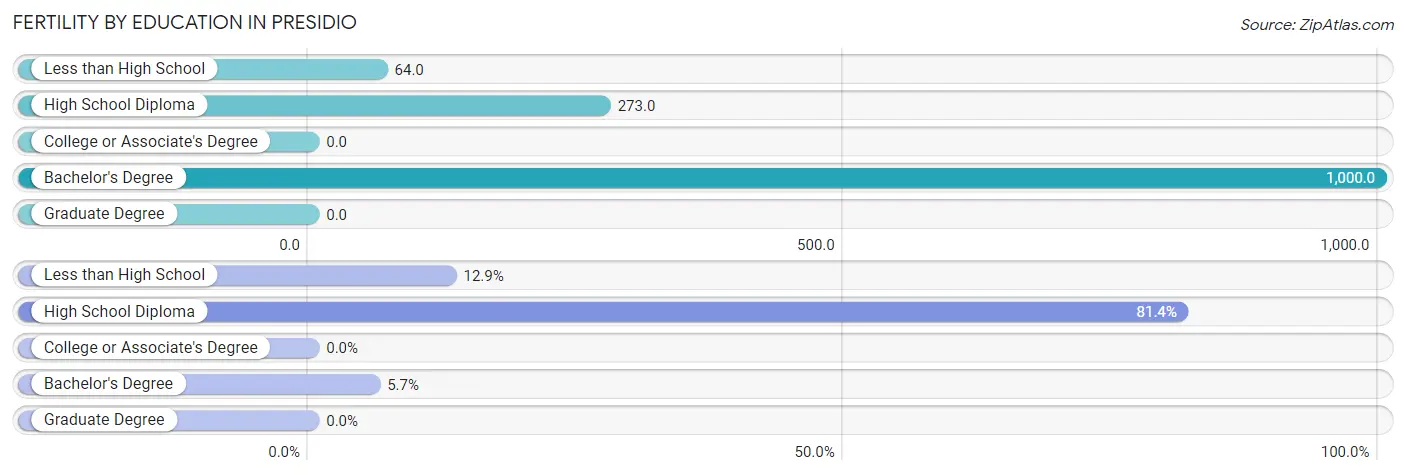
| Educational Attainment | Women with Births | Births / 1,000 Women |
| Less than High School | 18 (12.9%) | 64.0 |
| High School Diploma | 114 (81.4%) | 273.0 |
| College or Associate's Degree | 0 (0.0%) | 0.0 |
| Bachelor's Degree | 8 (5.7%) | 1,000.0 |
| Graduate Degree | 0 (0.0%) | 0.0 |
| Total | 140 (100.0%) | 162.0 |
Fertility by Education by Marriage Status in Presidio
94.3% of women with births in Presidio are unmarried. Women with the educational attainment of bachelor's degree are most likely to be married with 100.0% of them married at childbirth, while women with the educational attainment of less than high school are least likely to be married with 100.0% of them unmarried at childbirth.
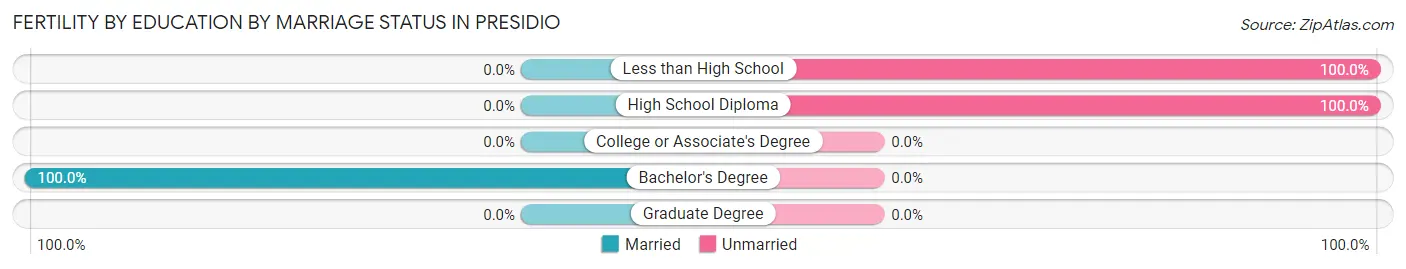
| Educational Attainment | Married | Unmarried |
| Less than High School | 0 (0.0%) | 18 (100.0%) |
| High School Diploma | 0 (0.0%) | 114 (100.0%) |
| College or Associate's Degree | 0 (0.0%) | 0 (0.0%) |
| Bachelor's Degree | 8 (100.0%) | 0 (0.0%) |
| Graduate Degree | 0 (0.0%) | 0 (0.0%) |
| Total | 8 (5.7%) | 132 (94.3%) |
Employment Characteristics in Presidio
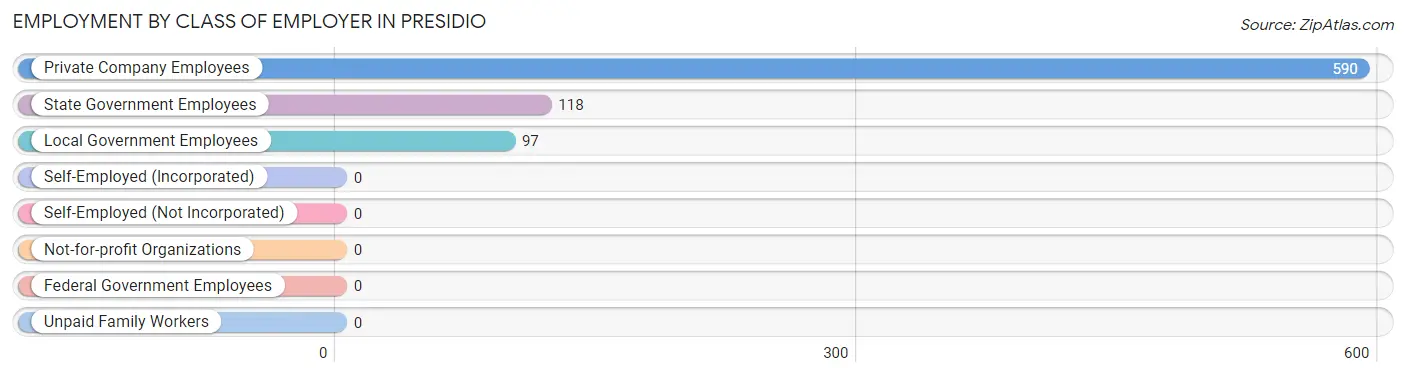
Employment by Class of Employer in Presidio
Among the 805 employed individuals in Presidio, private company employees (590 | 73.3%), state government employees (118 | 14.7%), and local government employees (97 | 12.0%) make up the most common classes of employment.
| Employer Class | # Employees | % Employees |
| Private Company Employees | 590 | 73.3% |
| Self-Employed (Incorporated) | 0 | 0.0% |
| Self-Employed (Not Incorporated) | 0 | 0.0% |
| Not-for-profit Organizations | 0 | 0.0% |
| Local Government Employees | 97 | 12.0% |
| State Government Employees | 118 | 14.7% |
| Federal Government Employees | 0 | 0.0% |
| Unpaid Family Workers | 0 | 0.0% |
| Total | 805 | 100.0% |
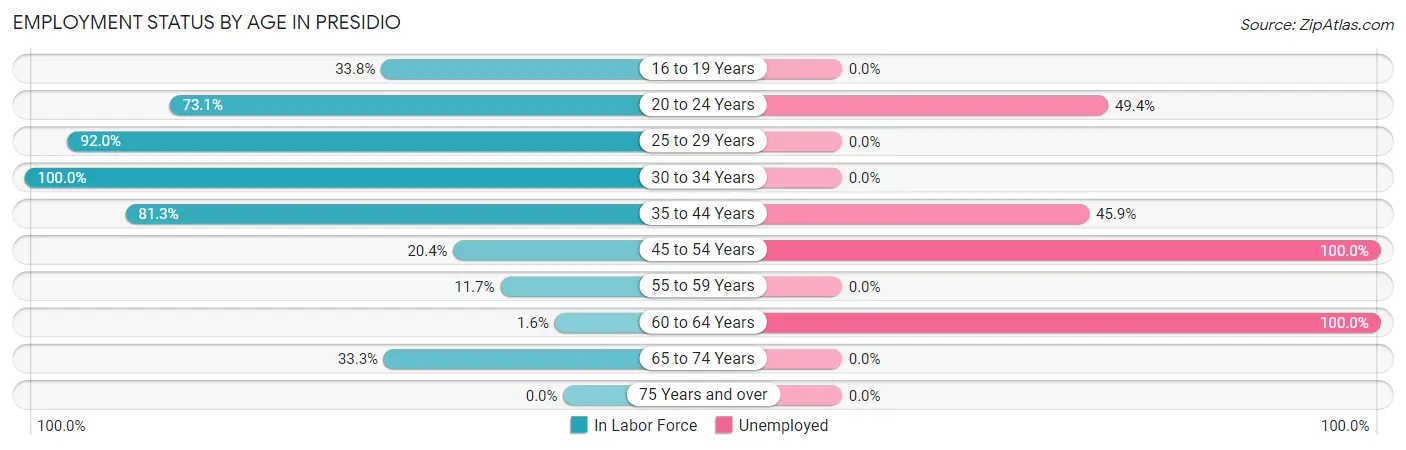
Employment Status by Age in Presidio
According to the labor force statistics for Presidio, out of the total population over 16 years of age (2,153), 53.4% or 1,150 individuals are in the labor force, with 30.0% or 345 of them unemployed. The age group with the highest labor force participation rate is 30 to 34 years, with 100.0% or 212 individuals in the labor force. Within the labor force, the 45 to 54 years age range has the highest percentage of unemployed individuals, with 100.0% or 11 of them being unemployed.
| Age Bracket | In Labor Force | Unemployed |
| 16 to 19 Years | 44 (33.8%) | 0 (0.0%) |
| 20 to 24 Years | 310 (73.1%) | 153 (49.4%) |
| 25 to 29 Years | 92 (92.0%) | 0 (0.0%) |
| 30 to 34 Years | 212 (100.0%) | 0 (0.0%) |
| 35 to 44 Years | 390 (81.3%) | 179 (45.9%) |
| 45 to 54 Years | 11 (20.4%) | 11 (100.0%) |
| 55 to 59 Years | 16 (11.7%) | 0 (0.0%) |
| 60 to 64 Years | 2 (1.6%) | 2 (100.0%) |
| 65 to 74 Years | 73 (33.3%) | 0 (0.0%) |
| 75 Years and over | 0 (0.0%) | 0 (0.0%) |
| Total | 1,150 (53.4%) | 345 (30.0%) |
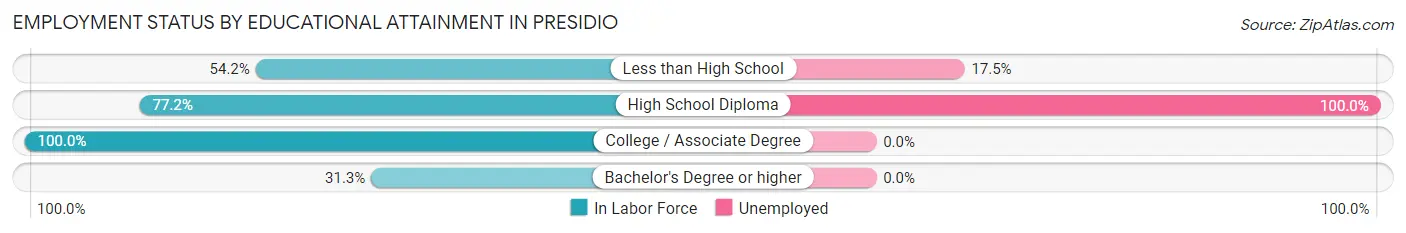
Employment Status by Educational Attainment in Presidio
According to labor force statistics for Presidio, 65.2% of individuals (723) out of the total population between 25 and 64 years of age (1,109) are in the labor force, with 26.6% or 192 of them being unemployed. The group with the highest labor force participation rate are those with the educational attainment of college / associate degree, with 100.0% or 259 individuals in the labor force. Within the labor force, individuals with high school diploma education have the highest percentage of unemployment, with 100.0% or 146 of them being unemployed.
| Educational Attainment | In Labor Force | Unemployed |
| Less than High School | 263 (54.2%) | 85 (17.5%) |
| High School Diploma | 146 (77.2%) | 189 (100.0%) |
| College / Associate Degree | 259 (100.0%) | 0 (0.0%) |
| Bachelor's Degree or higher | 55 (31.3%) | 0 (0.0%) |
| Total | 723 (65.2%) | 295 (26.6%) |
Employment Occupations by Sex in Presidio
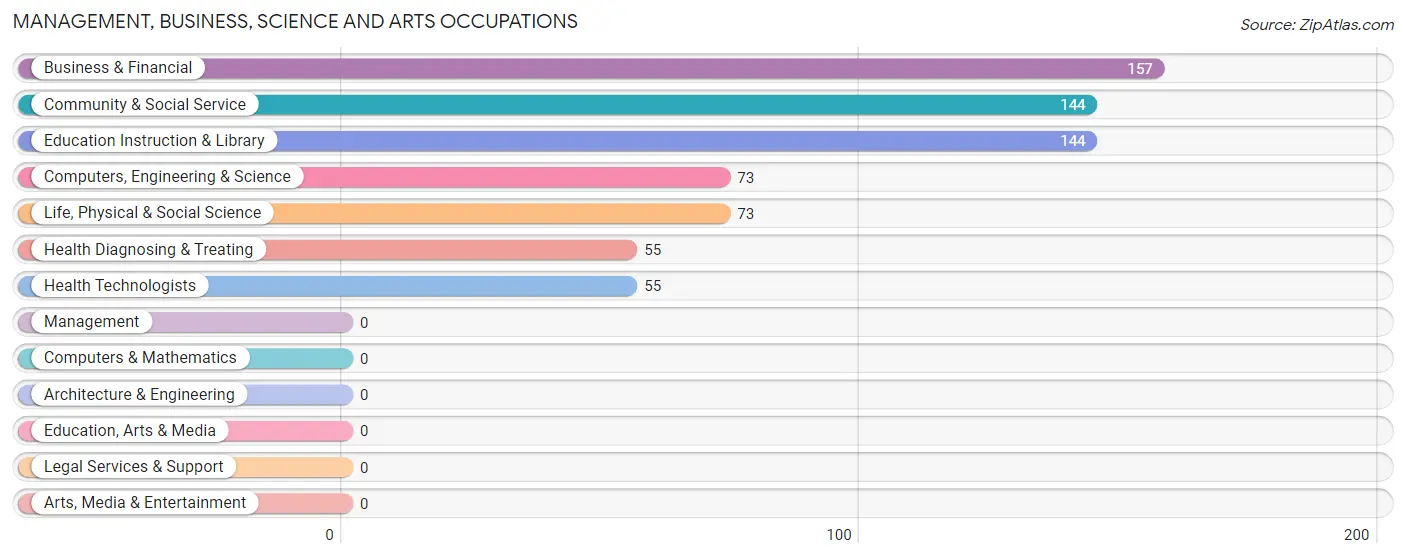
Management, Business, Science and Arts Occupations
The most common Management, Business, Science and Arts occupations in Presidio are Business & Financial (157 | 19.5%), Community & Social Service (144 | 17.9%), Education Instruction & Library (144 | 17.9%), Computers, Engineering & Science (73 | 9.1%), and Life, Physical & Social Science (73 | 9.1%).
Management, Business, Science and Arts Occupations by Sex
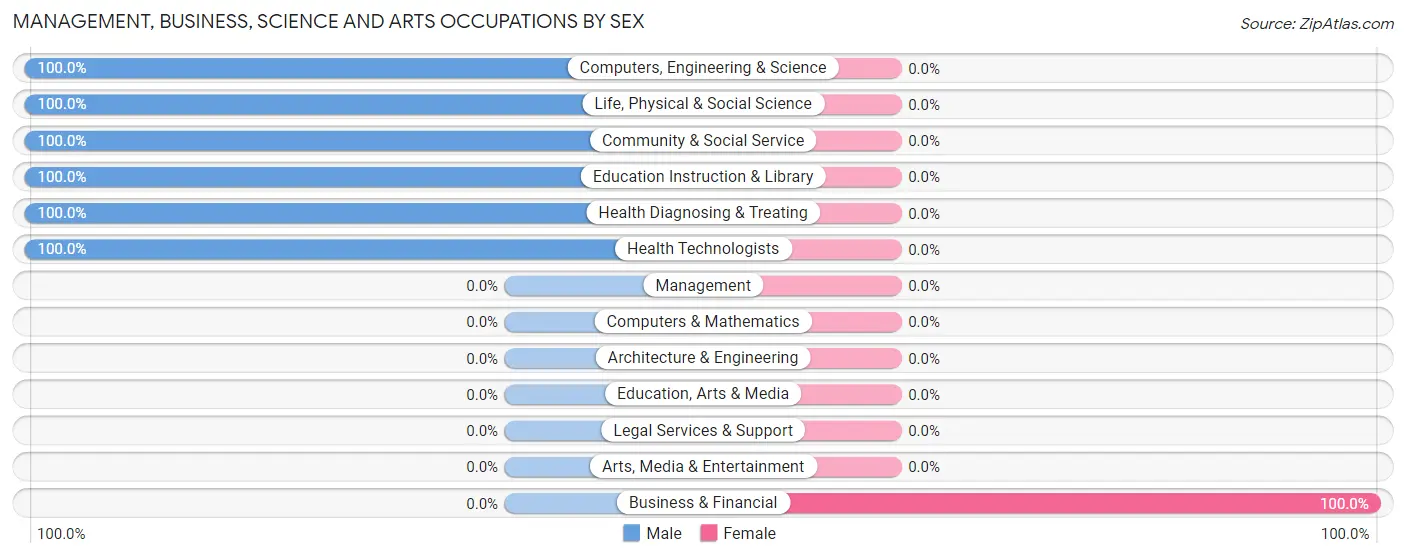
| Occupation | Male | Female |
| Management | 0 (0.0%) | 0 (0.0%) |
| Business & Financial | 0 (0.0%) | 157 (100.0%) |
| Computers, Engineering & Science | 73 (100.0%) | 0 (0.0%) |
| Computers & Mathematics | 0 (0.0%) | 0 (0.0%) |
| Architecture & Engineering | 0 (0.0%) | 0 (0.0%) |
| Life, Physical & Social Science | 73 (100.0%) | 0 (0.0%) |
| Community & Social Service | 144 (100.0%) | 0 (0.0%) |
| Education, Arts & Media | 0 (0.0%) | 0 (0.0%) |
| Legal Services & Support | 0 (0.0%) | 0 (0.0%) |
| Education Instruction & Library | 144 (100.0%) | 0 (0.0%) |
| Arts, Media & Entertainment | 0 (0.0%) | 0 (0.0%) |
| Health Diagnosing & Treating | 55 (100.0%) | 0 (0.0%) |
| Health Technologists | 55 (100.0%) | 0 (0.0%) |
| Total (Category) | 272 (63.4%) | 157 (36.6%) |
| Total (Overall) | 381 (47.3%) | 424 (52.7%) |
Services Occupations
The most common Services occupations in Presidio are , and Cleaning & Maintenance (60 | 7.4%).
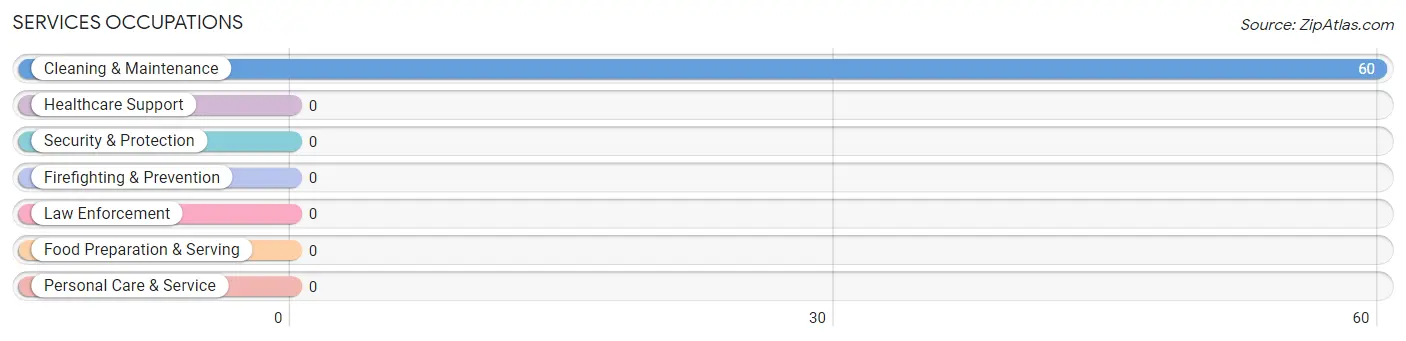
Services Occupations by Sex
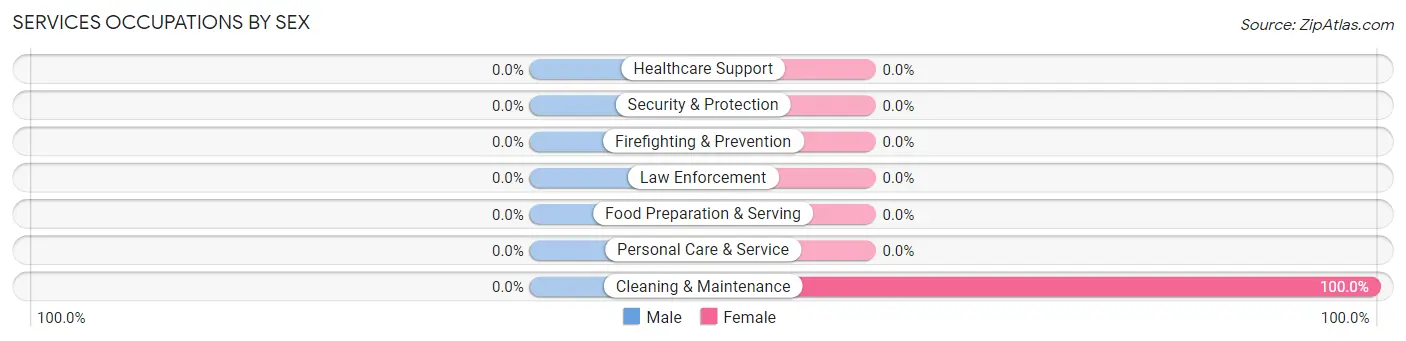
| Occupation | Male | Female |
| Healthcare Support | 0 (0.0%) | 0 (0.0%) |
| Security & Protection | 0 (0.0%) | 0 (0.0%) |
| Firefighting & Prevention | 0 (0.0%) | 0 (0.0%) |
| Law Enforcement | 0 (0.0%) | 0 (0.0%) |
| Food Preparation & Serving | 0 (0.0%) | 0 (0.0%) |
| Cleaning & Maintenance | 0 (0.0%) | 60 (100.0%) |
| Personal Care & Service | 0 (0.0%) | 0 (0.0%) |
| Total (Category) | 0 (0.0%) | 60 (100.0%) |
| Total (Overall) | 381 (47.3%) | 424 (52.7%) |
Sales and Office Occupations
The most common Sales and Office occupations in Presidio are , and Sales & Related (207 | 25.7%).
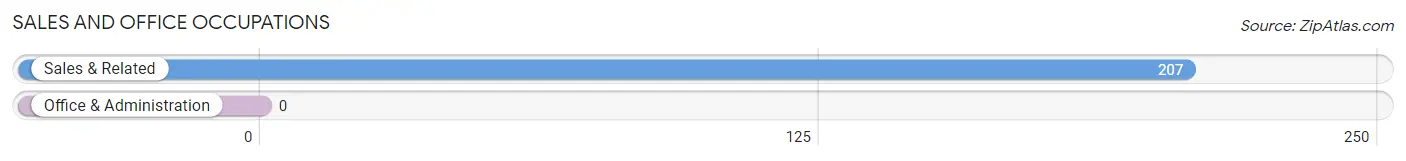
Sales and Office Occupations by Sex
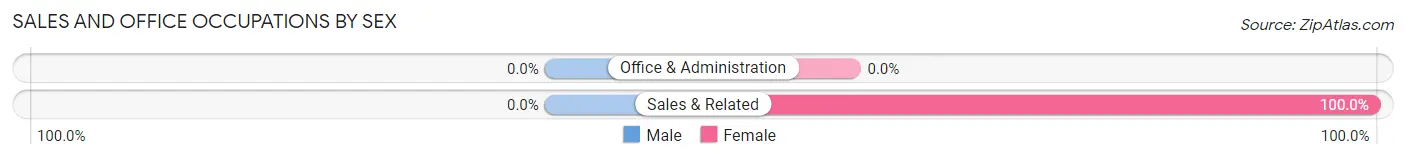
| Occupation | Male | Female |
| Sales & Related | 0 (0.0%) | 207 (100.0%) |
| Office & Administration | 0 (0.0%) | 0 (0.0%) |
| Total (Category) | 0 (0.0%) | 207 (100.0%) |
| Total (Overall) | 381 (47.3%) | 424 (52.7%) |
Natural Resources, Construction and Maintenance Occupations
The most common Natural Resources, Construction and Maintenance occupations in Presidio are , and Farming, Fishing & Forestry (109 | 13.5%).
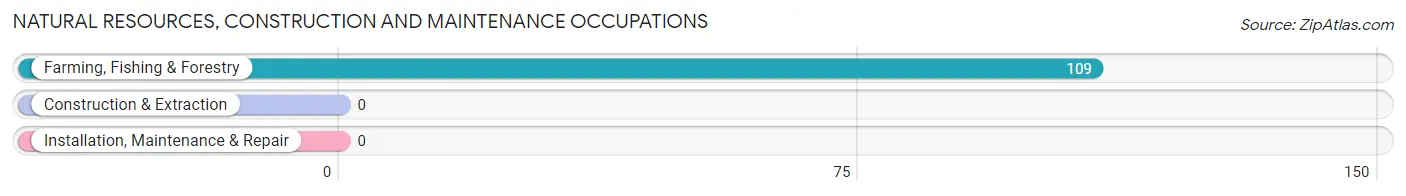
Natural Resources, Construction and Maintenance Occupations by Sex
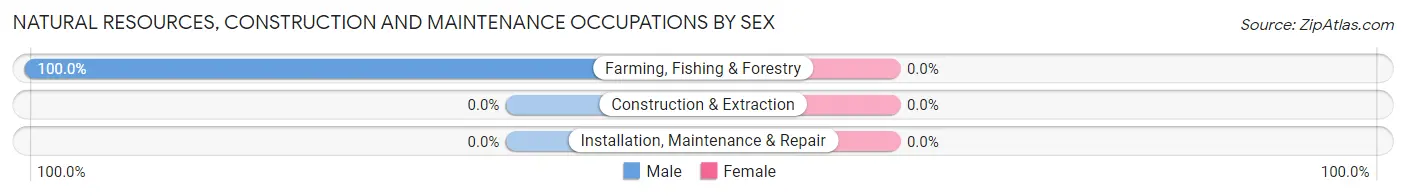
| Occupation | Male | Female |
| Farming, Fishing & Forestry | 109 (100.0%) | 0 (0.0%) |
| Construction & Extraction | 0 (0.0%) | 0 (0.0%) |
| Installation, Maintenance & Repair | 0 (0.0%) | 0 (0.0%) |
| Total (Category) | 109 (100.0%) | 0 (0.0%) |
| Total (Overall) | 381 (47.3%) | 424 (52.7%) |
Production, Transportation and Moving Occupations
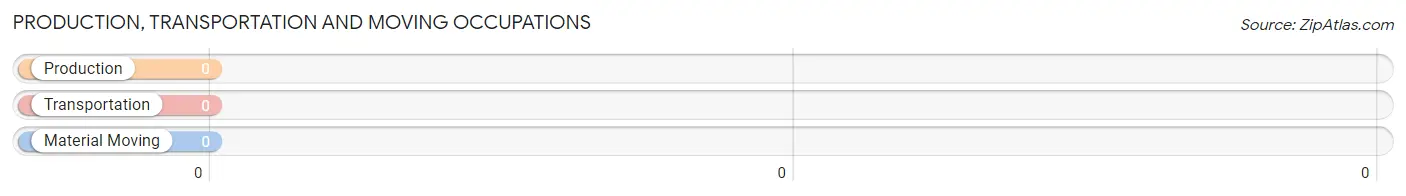
Production, Transportation and Moving Occupations by Sex
| Occupation | Male | Female |
| Production | 0 (0.0%) | 0 (0.0%) |
| Transportation | 0 (0.0%) | 0 (0.0%) |
| Material Moving | 0 (0.0%) | 0 (0.0%) |
| Total (Category) | 0 (0.0%) | 0 (0.0%) |
| Total (Overall) | 381 (47.3%) | 424 (52.7%) |
Employment Industries by Sex in Presidio
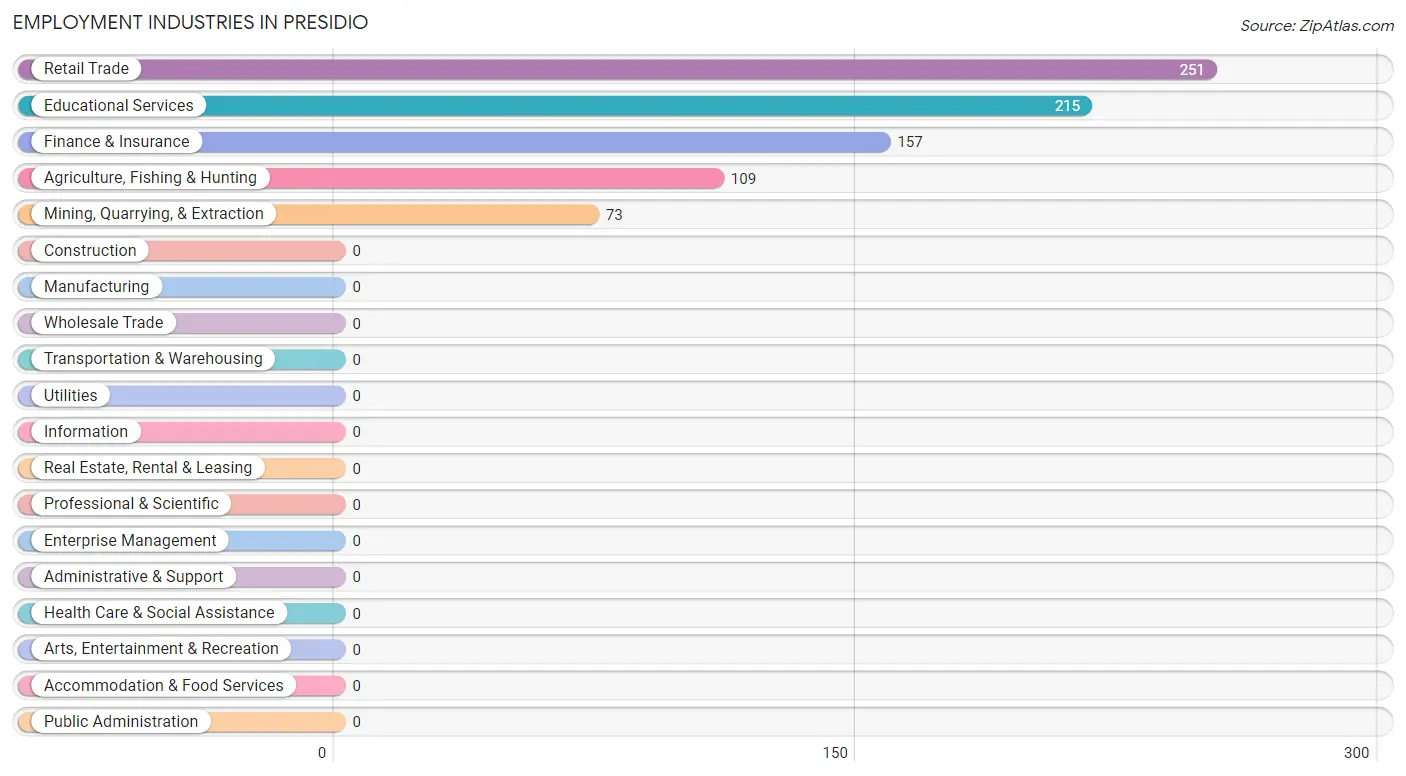
Employment Industries in Presidio
The major employment industries in Presidio include Retail Trade (251 | 31.2%), Educational Services (215 | 26.7%), Finance & Insurance (157 | 19.5%), Agriculture, Fishing & Hunting (109 | 13.5%), and Mining, Quarrying, & Extraction (73 | 9.1%).
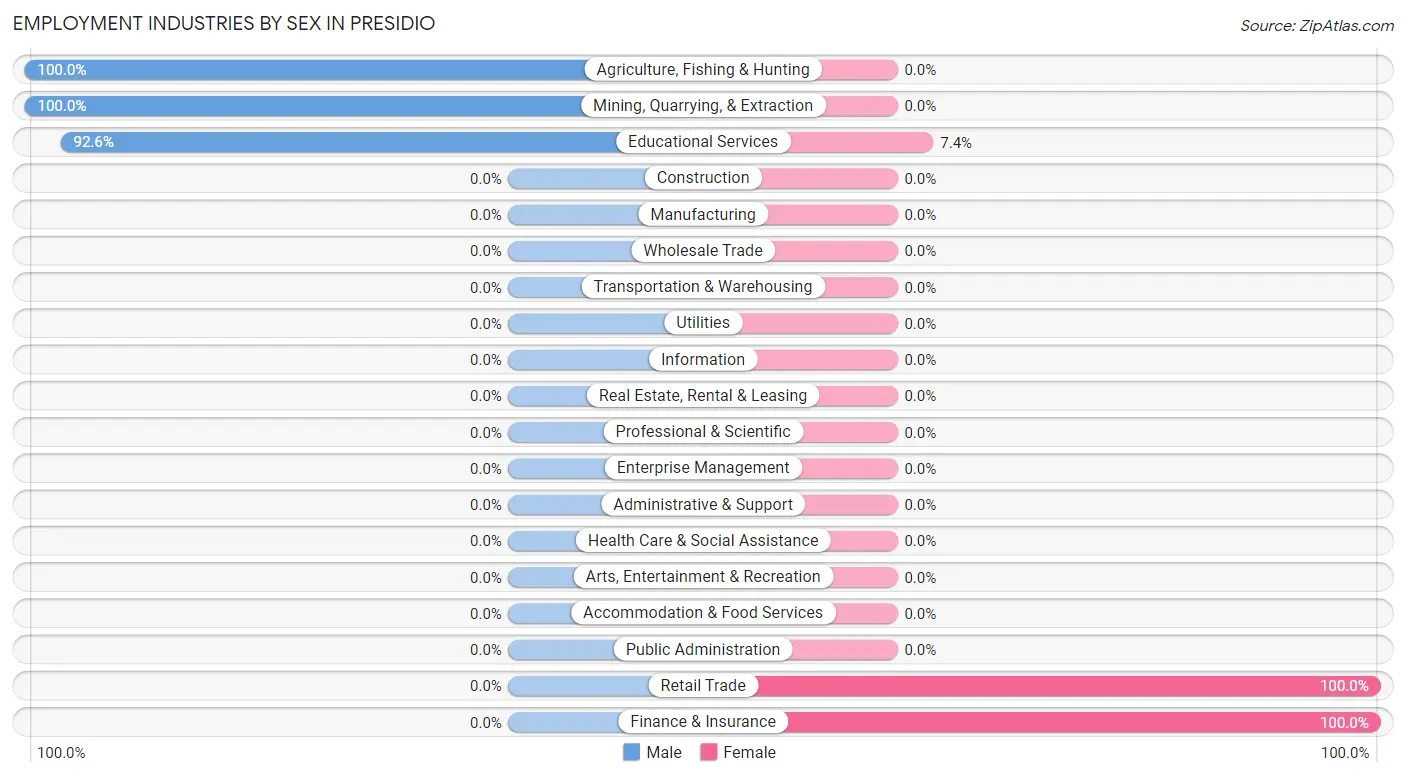
Employment Industries by Sex in Presidio
The Presidio industries that see more men than women are Agriculture, Fishing & Hunting (100.0%), Mining, Quarrying, & Extraction (100.0%), and Educational Services (92.6%), whereas the industries that tend to have a higher number of women are Retail Trade (100.0%), Finance & Insurance (100.0%), and Educational Services (7.4%).
| Industry | Male | Female |
| Agriculture, Fishing & Hunting | 109 (100.0%) | 0 (0.0%) |
| Mining, Quarrying, & Extraction | 73 (100.0%) | 0 (0.0%) |
| Construction | 0 (0.0%) | 0 (0.0%) |
| Manufacturing | 0 (0.0%) | 0 (0.0%) |
| Wholesale Trade | 0 (0.0%) | 0 (0.0%) |
| Retail Trade | 0 (0.0%) | 251 (100.0%) |
| Transportation & Warehousing | 0 (0.0%) | 0 (0.0%) |
| Utilities | 0 (0.0%) | 0 (0.0%) |
| Information | 0 (0.0%) | 0 (0.0%) |
| Finance & Insurance | 0 (0.0%) | 157 (100.0%) |
| Real Estate, Rental & Leasing | 0 (0.0%) | 0 (0.0%) |
| Professional & Scientific | 0 (0.0%) | 0 (0.0%) |
| Enterprise Management | 0 (0.0%) | 0 (0.0%) |
| Administrative & Support | 0 (0.0%) | 0 (0.0%) |
| Educational Services | 199 (92.6%) | 16 (7.4%) |
| Health Care & Social Assistance | 0 (0.0%) | 0 (0.0%) |
| Arts, Entertainment & Recreation | 0 (0.0%) | 0 (0.0%) |
| Accommodation & Food Services | 0 (0.0%) | 0 (0.0%) |
| Public Administration | 0 (0.0%) | 0 (0.0%) |
| Total | 381 (47.3%) | 424 (52.7%) |
Education in Presidio
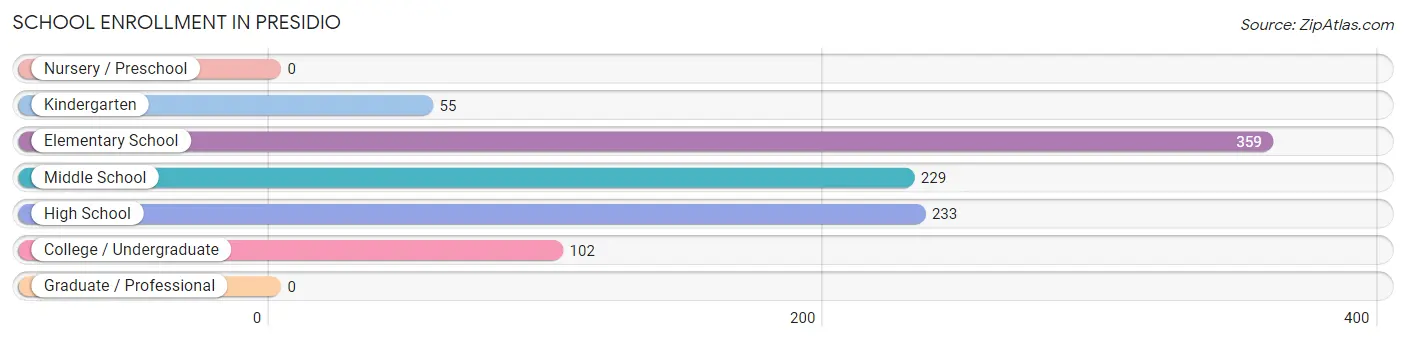
School Enrollment in Presidio
The most common levels of schooling among the 978 students in Presidio are elementary school (359 | 36.7%), high school (233 | 23.8%), and middle school (229 | 23.4%).
| School Level | # Students | % Students |
| Nursery / Preschool | 0 | 0.0% |
| Kindergarten | 55 | 5.6% |
| Elementary School | 359 | 36.7% |
| Middle School | 229 | 23.4% |
| High School | 233 | 23.8% |
| College / Undergraduate | 102 | 10.4% |
| Graduate / Professional | 0 | 0.0% |
| Total | 978 | 100.0% |
School Enrollment by Age by Funding Source in Presidio
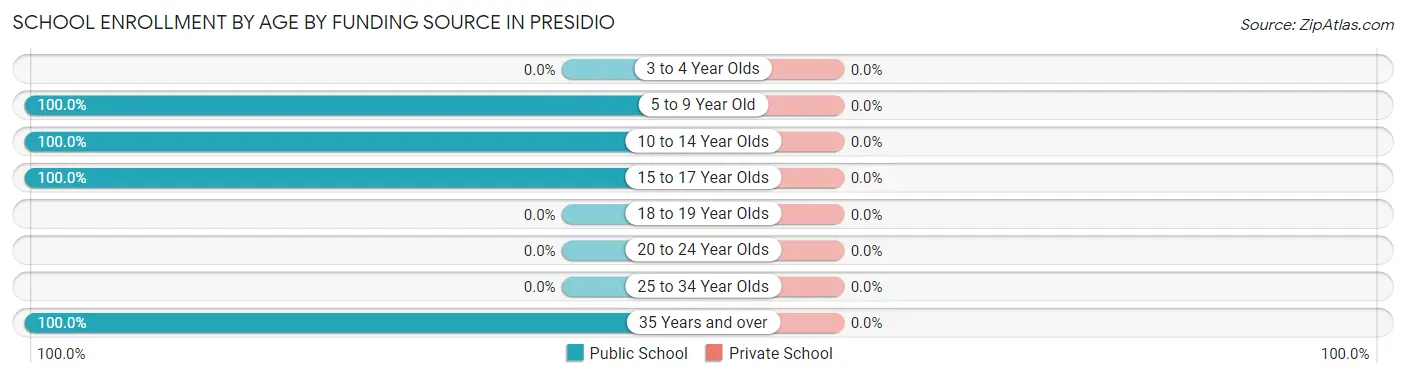
| Age Bracket | Public School | Private School |
| 3 to 4 Year Olds | 0 (0.0%) | 0 (0.0%) |
| 5 to 9 Year Old | 414 (100.0%) | 0 (0.0%) |
| 10 to 14 Year Olds | 229 (100.0%) | 0 (0.0%) |
| 15 to 17 Year Olds | 233 (100.0%) | 0 (0.0%) |
| 18 to 19 Year Olds | 0 (0.0%) | 0 (0.0%) |
| 20 to 24 Year Olds | 0 (0.0%) | 0 (0.0%) |
| 25 to 34 Year Olds | 0 (0.0%) | 0 (0.0%) |
| 35 Years and over | 102 (100.0%) | 0 (0.0%) |
| Total | 978 (100.0%) | 0 (0.0%) |
Educational Attainment by Field of Study in Presidio
Education (113 | 64.2%), arts & humanities (55 | 31.2%), and science & technology (8 | 4.5%) are the most common fields of study among 176 individuals in Presidio who have obtained a bachelor's degree or higher.
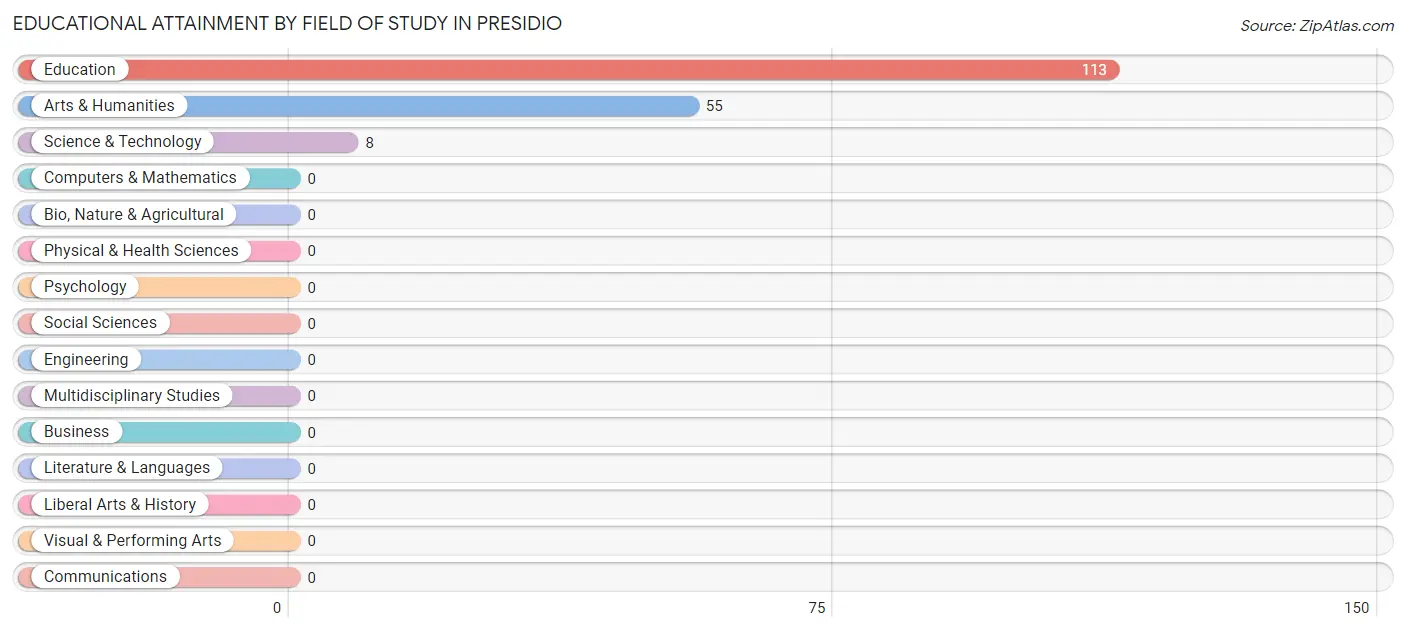
| Field of Study | # Graduates | % Graduates |
| Computers & Mathematics | 0 | 0.0% |
| Bio, Nature & Agricultural | 0 | 0.0% |
| Physical & Health Sciences | 0 | 0.0% |
| Psychology | 0 | 0.0% |
| Social Sciences | 0 | 0.0% |
| Engineering | 0 | 0.0% |
| Multidisciplinary Studies | 0 | 0.0% |
| Science & Technology | 8 | 4.5% |
| Business | 0 | 0.0% |
| Education | 113 | 64.2% |
| Literature & Languages | 0 | 0.0% |
| Liberal Arts & History | 0 | 0.0% |
| Visual & Performing Arts | 0 | 0.0% |
| Communications | 0 | 0.0% |
| Arts & Humanities | 55 | 31.2% |
| Total | 176 | 100.0% |
Transportation & Commute in Presidio
Vehicle Availability by Sex in Presidio
The most prevalent vehicle ownership categories in Presidio are males with 2 vehicles (157, accounting for 41.2%) and females with 2 vehicles (44, making up 37.0%).
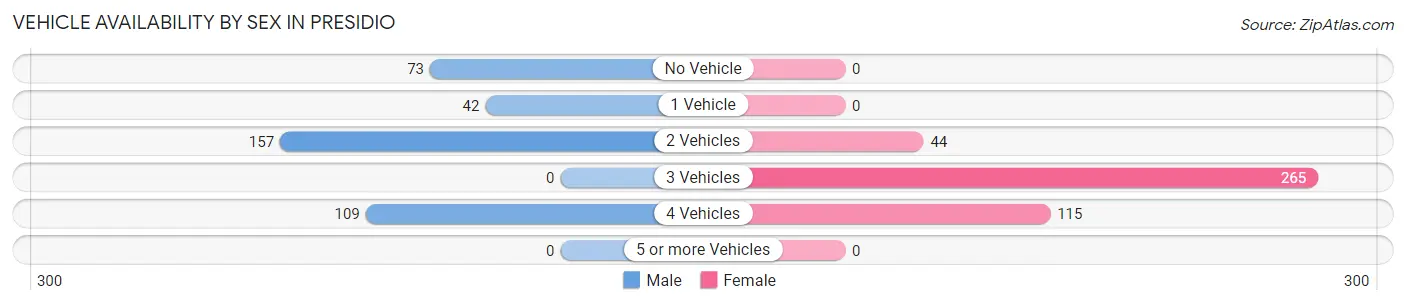
| Vehicles Available | Male | Female |
| No Vehicle | 73 (19.2%) | 0 (0.0%) |
| 1 Vehicle | 42 (11.0%) | 0 (0.0%) |
| 2 Vehicles | 157 (41.2%) | 44 (10.4%) |
| 3 Vehicles | 0 (0.0%) | 265 (62.5%) |
| 4 Vehicles | 109 (28.6%) | 115 (27.1%) |
| 5 or more Vehicles | 0 (0.0%) | 0 (0.0%) |
| Total | 381 (100.0%) | 424 (100.0%) |
Commute Time in Presidio
The most frequently occuring commute durations in Presidio are 5 to 9 minutes (367 commuters, 45.6%), less than 5 minutes (201 commuters, 25.0%), and 10 to 14 minutes (128 commuters, 15.9%).
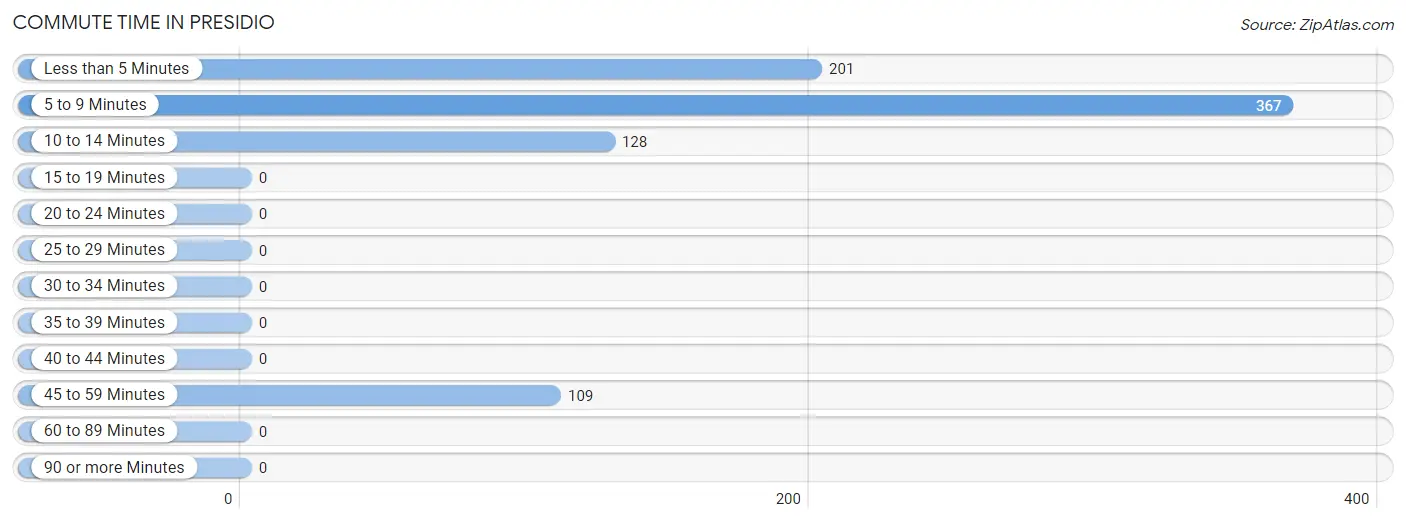
| Commute Time | # Commuters | % Commuters |
| Less than 5 Minutes | 201 | 25.0% |
| 5 to 9 Minutes | 367 | 45.6% |
| 10 to 14 Minutes | 128 | 15.9% |
| 15 to 19 Minutes | 0 | 0.0% |
| 20 to 24 Minutes | 0 | 0.0% |
| 25 to 29 Minutes | 0 | 0.0% |
| 30 to 34 Minutes | 0 | 0.0% |
| 35 to 39 Minutes | 0 | 0.0% |
| 40 to 44 Minutes | 0 | 0.0% |
| 45 to 59 Minutes | 109 | 13.5% |
| 60 to 89 Minutes | 0 | 0.0% |
| 90 or more Minutes | 0 | 0.0% |
Commute Time by Sex in Presidio
The most common commute times in Presidio are 5 to 9 minutes (144 commuters, 37.8%) for males and 5 to 9 minutes (223 commuters, 52.6%) for females.
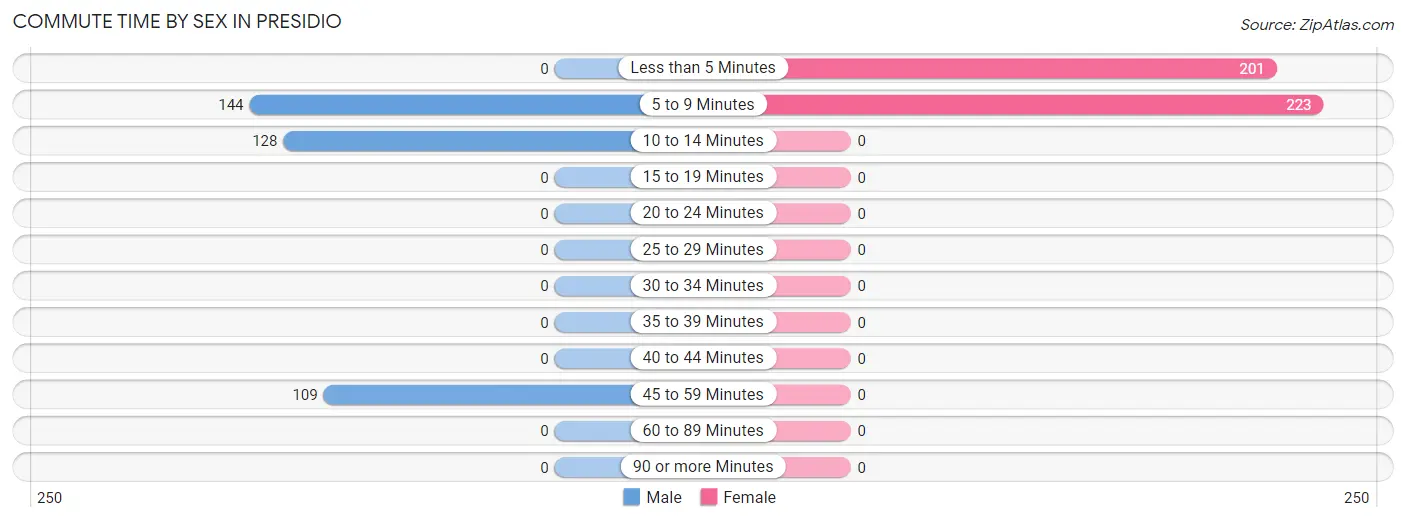
| Commute Time | Male | Female |
| Less than 5 Minutes | 0 (0.0%) | 201 (47.4%) |
| 5 to 9 Minutes | 144 (37.8%) | 223 (52.6%) |
| 10 to 14 Minutes | 128 (33.6%) | 0 (0.0%) |
| 15 to 19 Minutes | 0 (0.0%) | 0 (0.0%) |
| 20 to 24 Minutes | 0 (0.0%) | 0 (0.0%) |
| 25 to 29 Minutes | 0 (0.0%) | 0 (0.0%) |
| 30 to 34 Minutes | 0 (0.0%) | 0 (0.0%) |
| 35 to 39 Minutes | 0 (0.0%) | 0 (0.0%) |
| 40 to 44 Minutes | 0 (0.0%) | 0 (0.0%) |
| 45 to 59 Minutes | 109 (28.6%) | 0 (0.0%) |
| 60 to 89 Minutes | 0 (0.0%) | 0 (0.0%) |
| 90 or more Minutes | 0 (0.0%) | 0 (0.0%) |
Time of Departure to Work by Sex in Presidio
The most frequent times of departure to work in Presidio are 7:30 AM to 7:59 AM (157, 41.2%) for males and 7:30 AM to 7:59 AM (223, 52.6%) for females.
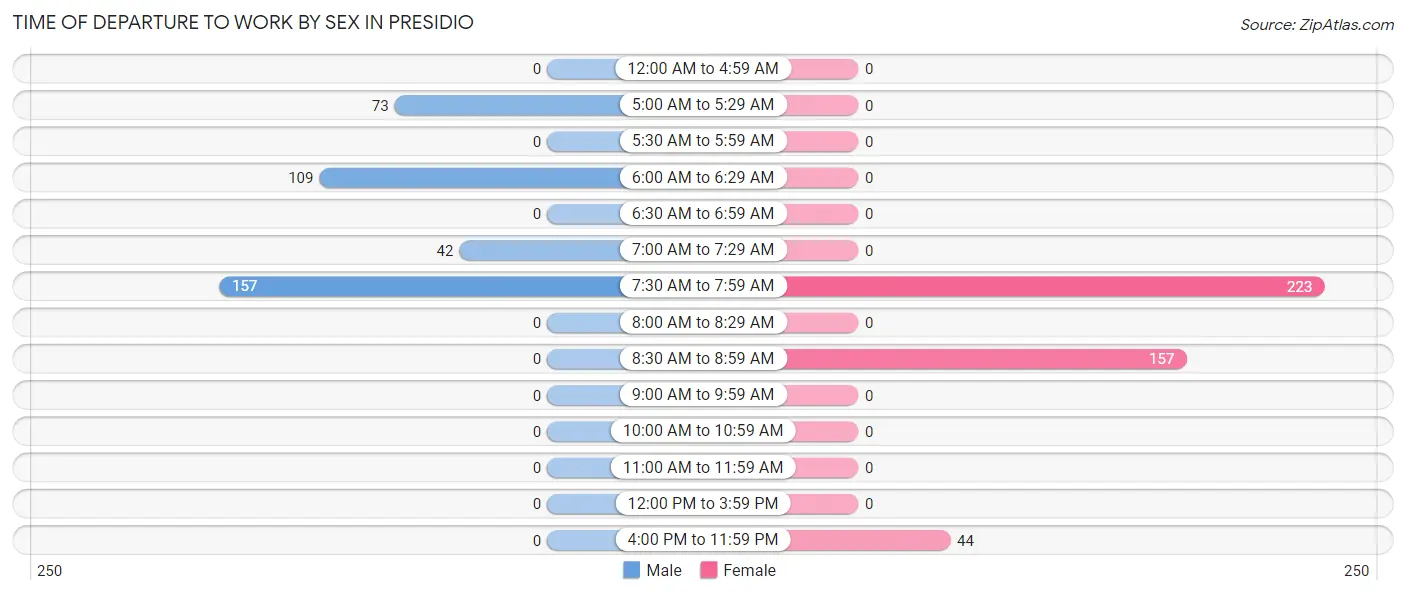
| Time of Departure | Male | Female |
| 12:00 AM to 4:59 AM | 0 (0.0%) | 0 (0.0%) |
| 5:00 AM to 5:29 AM | 73 (19.2%) | 0 (0.0%) |
| 5:30 AM to 5:59 AM | 0 (0.0%) | 0 (0.0%) |
| 6:00 AM to 6:29 AM | 109 (28.6%) | 0 (0.0%) |
| 6:30 AM to 6:59 AM | 0 (0.0%) | 0 (0.0%) |
| 7:00 AM to 7:29 AM | 42 (11.0%) | 0 (0.0%) |
| 7:30 AM to 7:59 AM | 157 (41.2%) | 223 (52.6%) |
| 8:00 AM to 8:29 AM | 0 (0.0%) | 0 (0.0%) |
| 8:30 AM to 8:59 AM | 0 (0.0%) | 157 (37.0%) |
| 9:00 AM to 9:59 AM | 0 (0.0%) | 0 (0.0%) |
| 10:00 AM to 10:59 AM | 0 (0.0%) | 0 (0.0%) |
| 11:00 AM to 11:59 AM | 0 (0.0%) | 0 (0.0%) |
| 12:00 PM to 3:59 PM | 0 (0.0%) | 0 (0.0%) |
| 4:00 PM to 11:59 PM | 0 (0.0%) | 44 (10.4%) |
| Total | 381 (100.0%) | 424 (100.0%) |
Housing Occupancy in Presidio
Occupancy by Ownership in Presidio
Of the total 794 dwellings in Presidio, owner-occupied units account for 556 (70.0%), while renter-occupied units make up 238 (30.0%).
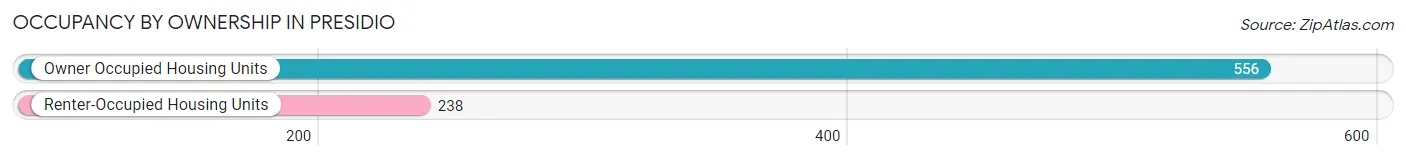
| Occupancy | # Housing Units | % Housing Units |
| Owner Occupied Housing Units | 556 | 70.0% |
| Renter-Occupied Housing Units | 238 | 30.0% |
| Total Occupied Housing Units | 794 | 100.0% |
Occupancy by Household Size in Presidio
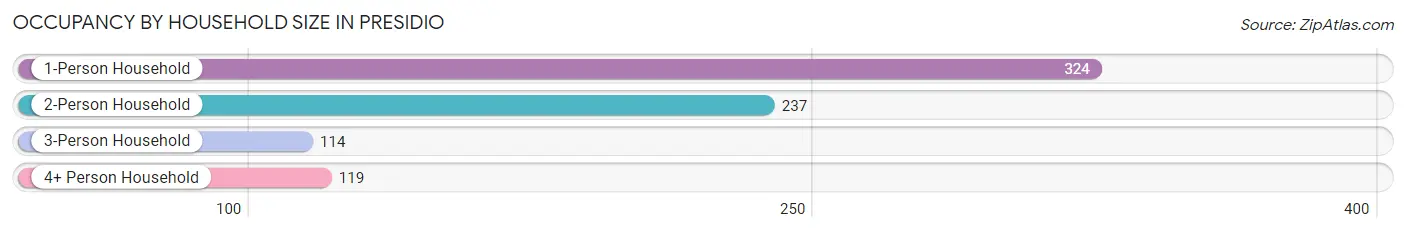
| Household Size | # Housing Units | % Housing Units |
| 1-Person Household | 324 | 40.8% |
| 2-Person Household | 237 | 29.8% |
| 3-Person Household | 114 | 14.4% |
| 4+ Person Household | 119 | 15.0% |
| Total Housing Units | 794 | 100.0% |
Occupancy by Ownership by Household Size in Presidio
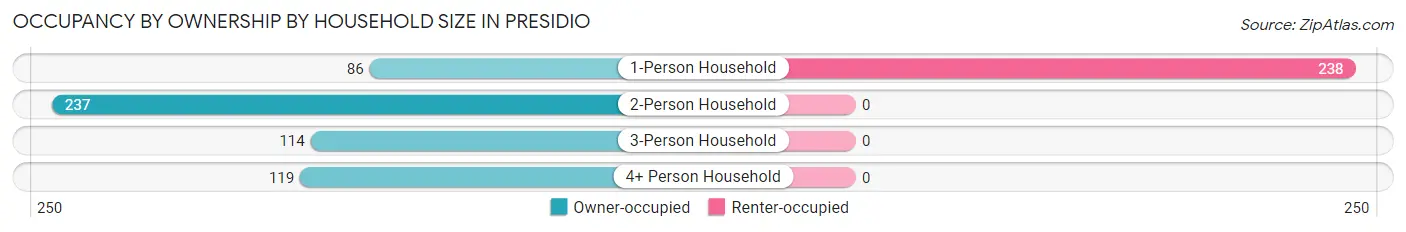
| Household Size | Owner-occupied | Renter-occupied |
| 1-Person Household | 86 (26.5%) | 238 (73.5%) |
| 2-Person Household | 237 (100.0%) | 0 (0.0%) |
| 3-Person Household | 114 (100.0%) | 0 (0.0%) |
| 4+ Person Household | 119 (100.0%) | 0 (0.0%) |
| Total Housing Units | 556 (70.0%) | 238 (30.0%) |
Occupancy by Educational Attainment in Presidio
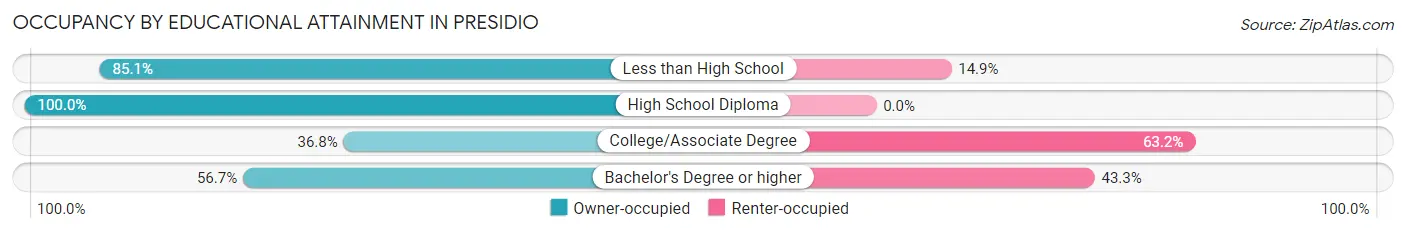
| Household Size | Owner-occupied | Renter-occupied |
| Less than High School | 383 (85.1%) | 67 (14.9%) |
| High School Diploma | 43 (100.0%) | 0 (0.0%) |
| College/Associate Degree | 75 (36.8%) | 129 (63.2%) |
| Bachelor's Degree or higher | 55 (56.7%) | 42 (43.3%) |
Occupancy by Age of Householder in Presidio
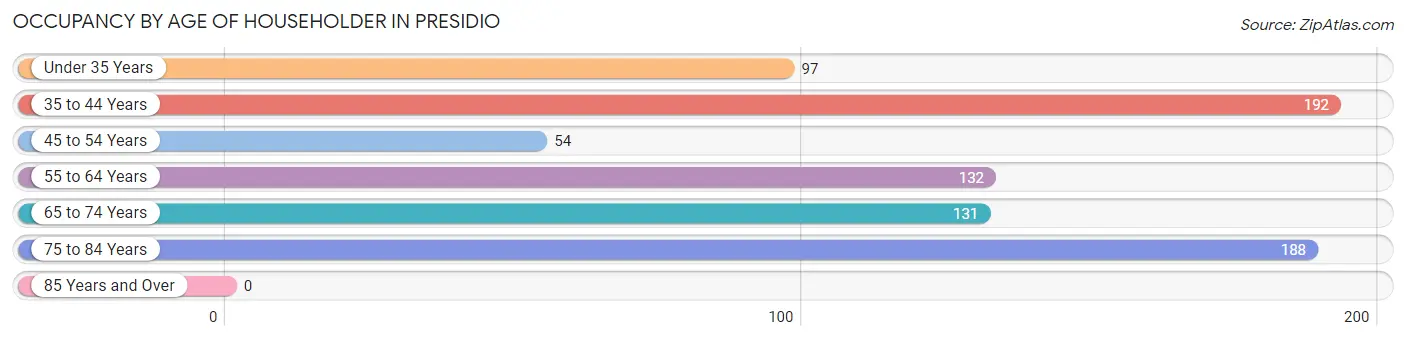
| Age Bracket | # Households | % Households |
| Under 35 Years | 97 | 12.2% |
| 35 to 44 Years | 192 | 24.2% |
| 45 to 54 Years | 54 | 6.8% |
| 55 to 64 Years | 132 | 16.6% |
| 65 to 74 Years | 131 | 16.5% |
| 75 to 84 Years | 188 | 23.7% |
| 85 Years and Over | 0 | 0.0% |
| Total | 794 | 100.0% |
Housing Finances in Presidio
Median Income by Occupancy in Presidio
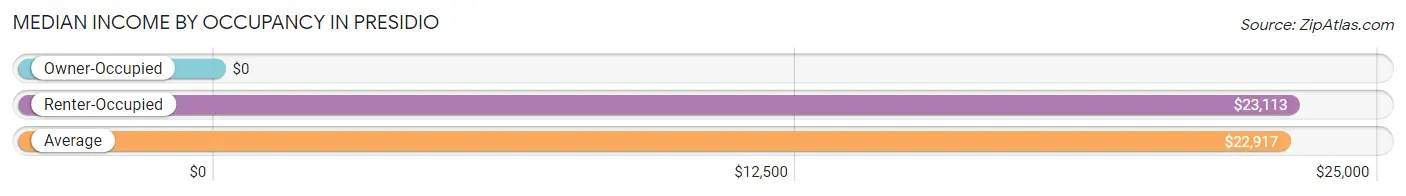
| Occupancy Type | # Households | Median Income |
| Owner-Occupied | 556 (70.0%) | $0 |
| Renter-Occupied | 238 (30.0%) | $23,113 |
| Average | 794 (100.0%) | $22,917 |
Occupancy by Householder Income Bracket in Presidio
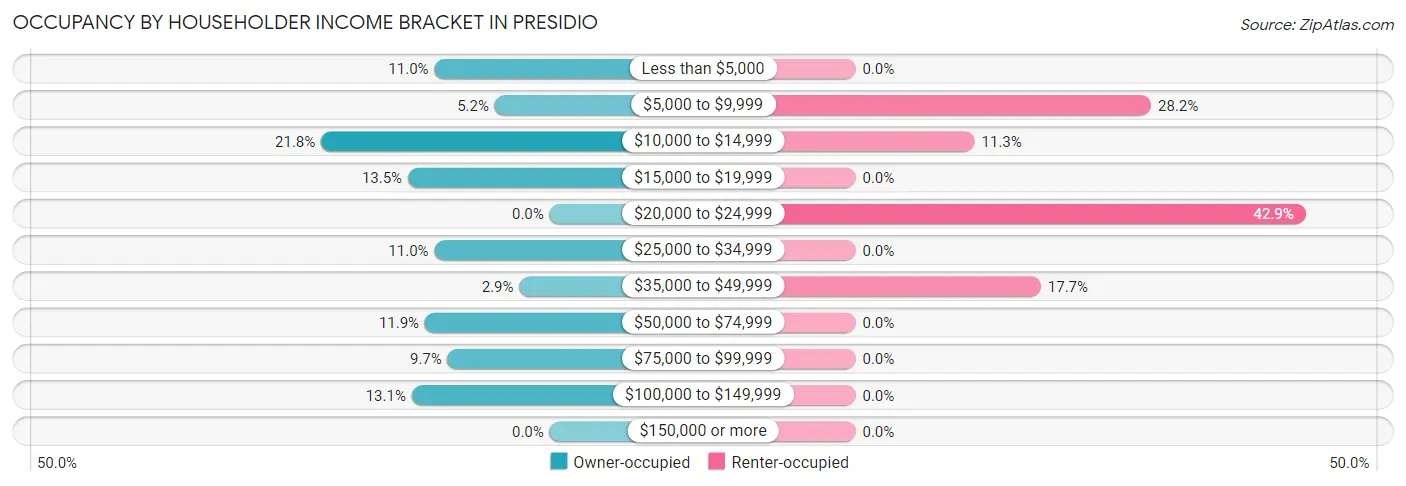
| Income Bracket | Owner-occupied | Renter-occupied |
| Less than $5,000 | 61 (11.0%) | 0 (0.0%) |
| $5,000 to $9,999 | 29 (5.2%) | 67 (28.1%) |
| $10,000 to $14,999 | 121 (21.8%) | 27 (11.3%) |
| $15,000 to $19,999 | 75 (13.5%) | 0 (0.0%) |
| $20,000 to $24,999 | 0 (0.0%) | 102 (42.9%) |
| $25,000 to $34,999 | 61 (11.0%) | 0 (0.0%) |
| $35,000 to $49,999 | 16 (2.9%) | 42 (17.6%) |
| $50,000 to $74,999 | 66 (11.9%) | 0 (0.0%) |
| $75,000 to $99,999 | 54 (9.7%) | 0 (0.0%) |
| $100,000 to $149,999 | 73 (13.1%) | 0 (0.0%) |
| $150,000 or more | 0 (0.0%) | 0 (0.0%) |
| Total | 556 (100.0%) | 238 (100.0%) |
Monthly Housing Cost Tiers in Presidio
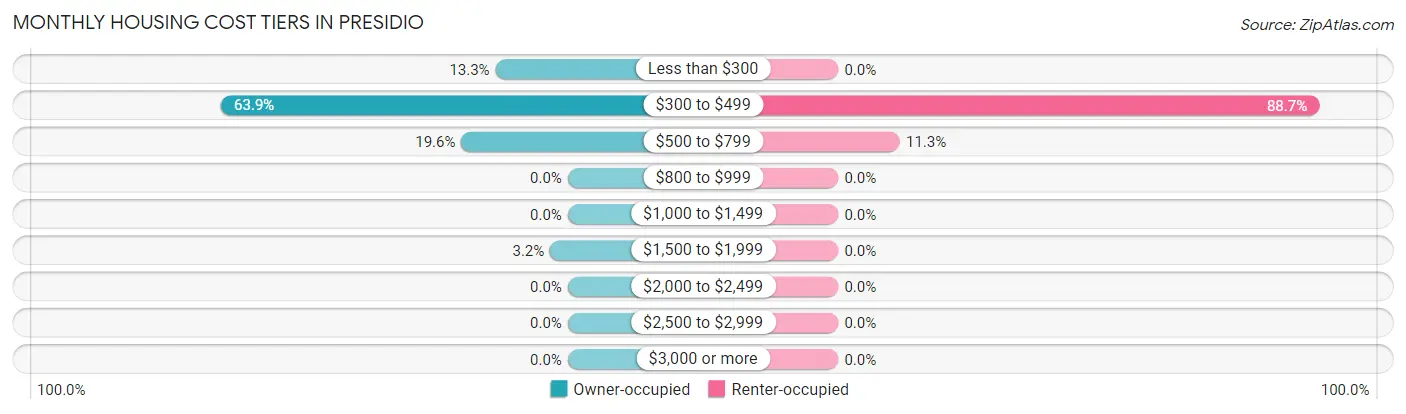
| Monthly Cost | Owner-occupied | Renter-occupied |
| Less than $300 | 74 (13.3%) | 0 (0.0%) |
| $300 to $499 | 355 (63.8%) | 211 (88.7%) |
| $500 to $799 | 109 (19.6%) | 27 (11.3%) |
| $800 to $999 | 0 (0.0%) | 0 (0.0%) |
| $1,000 to $1,499 | 0 (0.0%) | 0 (0.0%) |
| $1,500 to $1,999 | 18 (3.2%) | 0 (0.0%) |
| $2,000 to $2,499 | 0 (0.0%) | 0 (0.0%) |
| $2,500 to $2,999 | 0 (0.0%) | 0 (0.0%) |
| $3,000 or more | 0 (0.0%) | 0 (0.0%) |
| Total | 556 (100.0%) | 238 (100.0%) |
Physical Housing Characteristics in Presidio
Housing Structures in Presidio
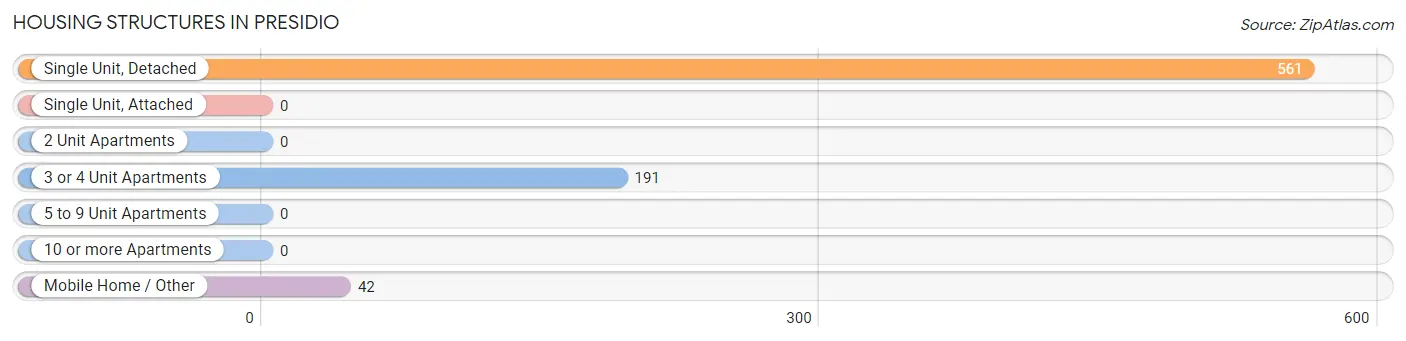
| Structure Type | # Housing Units | % Housing Units |
| Single Unit, Detached | 561 | 70.7% |
| Single Unit, Attached | 0 | 0.0% |
| 2 Unit Apartments | 0 | 0.0% |
| 3 or 4 Unit Apartments | 191 | 24.1% |
| 5 to 9 Unit Apartments | 0 | 0.0% |
| 10 or more Apartments | 0 | 0.0% |
| Mobile Home / Other | 42 | 5.3% |
| Total | 794 | 100.0% |
Housing Structures by Occupancy in Presidio
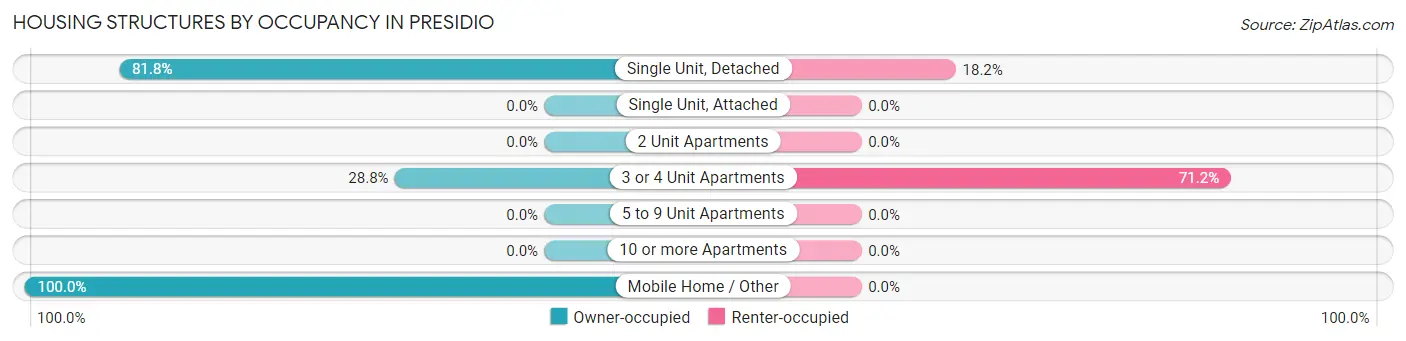
| Structure Type | Owner-occupied | Renter-occupied |
| Single Unit, Detached | 459 (81.8%) | 102 (18.2%) |
| Single Unit, Attached | 0 (0.0%) | 0 (0.0%) |
| 2 Unit Apartments | 0 (0.0%) | 0 (0.0%) |
| 3 or 4 Unit Apartments | 55 (28.8%) | 136 (71.2%) |
| 5 to 9 Unit Apartments | 0 (0.0%) | 0 (0.0%) |
| 10 or more Apartments | 0 (0.0%) | 0 (0.0%) |
| Mobile Home / Other | 42 (100.0%) | 0 (0.0%) |
| Total | 556 (70.0%) | 238 (30.0%) |
Housing Structures by Number of Rooms in Presidio
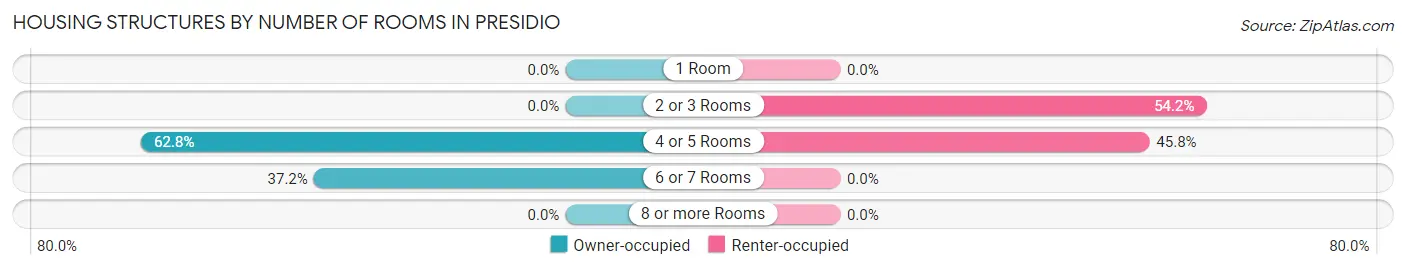
| Number of Rooms | Owner-occupied | Renter-occupied |
| 1 Room | 0 (0.0%) | 0 (0.0%) |
| 2 or 3 Rooms | 0 (0.0%) | 129 (54.2%) |
| 4 or 5 Rooms | 349 (62.8%) | 109 (45.8%) |
| 6 or 7 Rooms | 207 (37.2%) | 0 (0.0%) |
| 8 or more Rooms | 0 (0.0%) | 0 (0.0%) |
| Total | 556 (100.0%) | 238 (100.0%) |
Housing Structure by Heating Type in Presidio
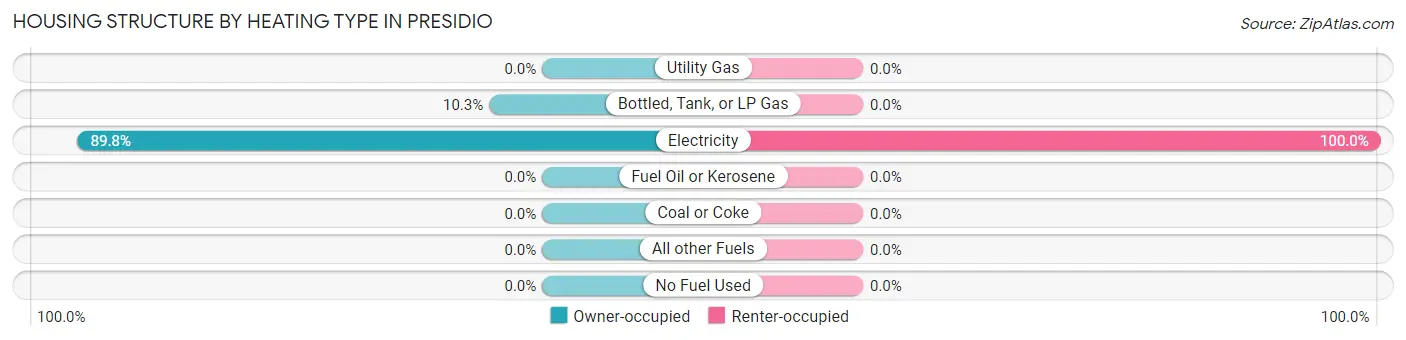
| Heating Type | Owner-occupied | Renter-occupied |
| Utility Gas | 0 (0.0%) | 0 (0.0%) |
| Bottled, Tank, or LP Gas | 57 (10.2%) | 0 (0.0%) |
| Electricity | 499 (89.7%) | 238 (100.0%) |
| Fuel Oil or Kerosene | 0 (0.0%) | 0 (0.0%) |
| Coal or Coke | 0 (0.0%) | 0 (0.0%) |
| All other Fuels | 0 (0.0%) | 0 (0.0%) |
| No Fuel Used | 0 (0.0%) | 0 (0.0%) |
| Total | 556 (100.0%) | 238 (100.0%) |
Household Vehicle Usage in Presidio
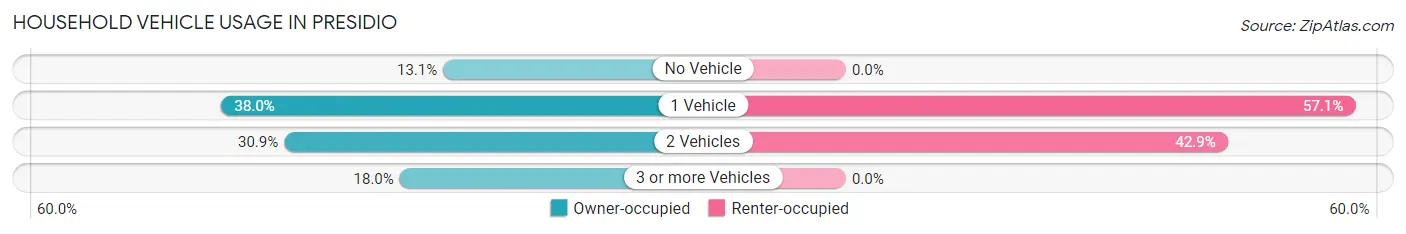
| Vehicles per Household | Owner-occupied | Renter-occupied |
| No Vehicle | 73 (13.1%) | 0 (0.0%) |
| 1 Vehicle | 211 (38.0%) | 136 (57.1%) |
| 2 Vehicles | 172 (30.9%) | 102 (42.9%) |
| 3 or more Vehicles | 100 (18.0%) | 0 (0.0%) |
| Total | 556 (100.0%) | 238 (100.0%) |
Real Estate & Mortgages in Presidio
Real Estate and Mortgage Overview in Presidio
| Characteristic | Without Mortgage | With Mortgage |
| Housing Units | 538 | 18 |
| Median Property Value | $83,600 | $0 |
| Median Household Income | - | - |
| Monthly Housing Costs | $410 | $0 |
| Real Estate Taxes | $1,524 | $0 |
Property Value by Mortgage Status in Presidio
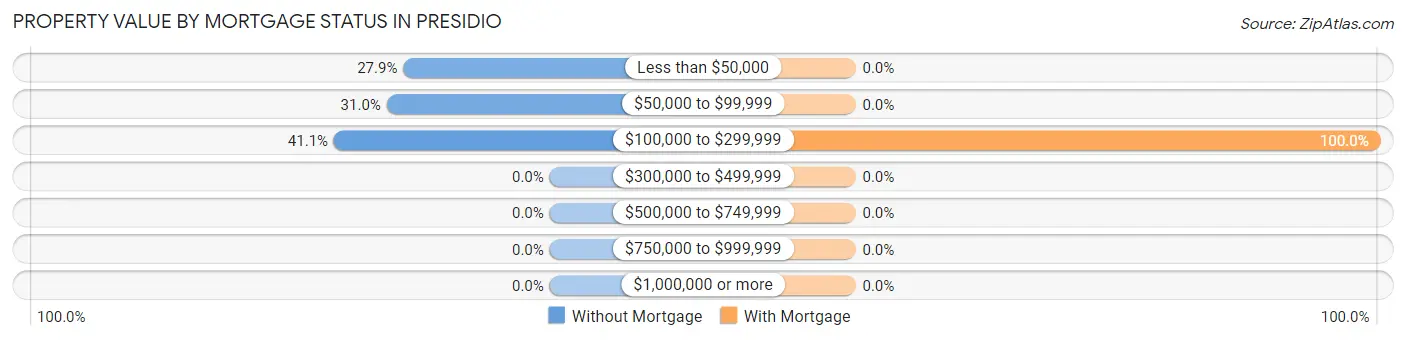
| Property Value | Without Mortgage | With Mortgage |
| Less than $50,000 | 150 (27.9%) | 0 (0.0%) |
| $50,000 to $99,999 | 167 (31.0%) | 0 (0.0%) |
| $100,000 to $299,999 | 221 (41.1%) | 18 (100.0%) |
| $300,000 to $499,999 | 0 (0.0%) | 0 (0.0%) |
| $500,000 to $749,999 | 0 (0.0%) | 0 (0.0%) |
| $750,000 to $999,999 | 0 (0.0%) | 0 (0.0%) |
| $1,000,000 or more | 0 (0.0%) | 0 (0.0%) |
| Total | 538 (100.0%) | 18 (100.0%) |
Household Income by Mortgage Status in Presidio
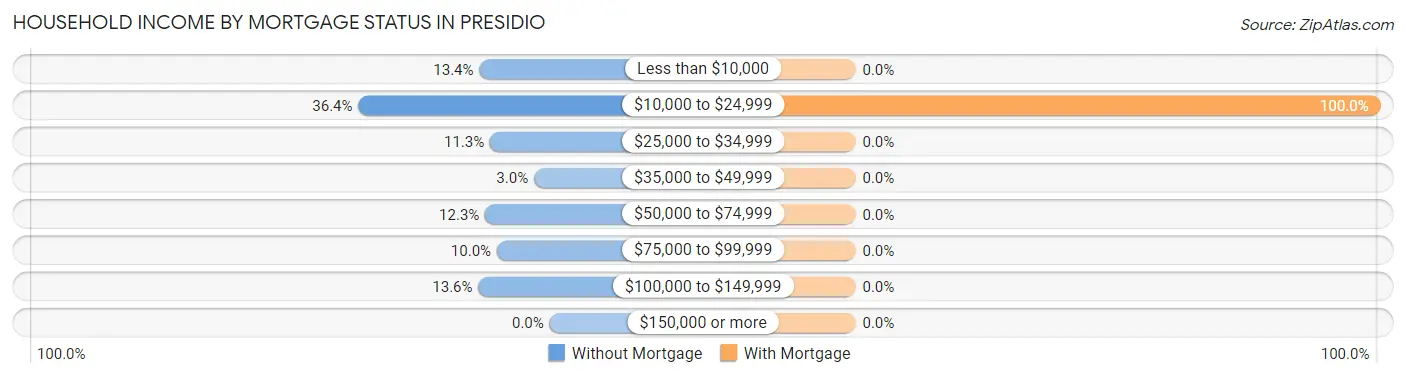
| Household Income | Without Mortgage | With Mortgage |
| Less than $10,000 | 72 (13.4%) | 0 (0.0%) |
| $10,000 to $24,999 | 196 (36.4%) | 18 (100.0%) |
| $25,000 to $34,999 | 61 (11.3%) | 0 (0.0%) |
| $35,000 to $49,999 | 16 (3.0%) | 0 (0.0%) |
| $50,000 to $74,999 | 66 (12.3%) | 0 (0.0%) |
| $75,000 to $99,999 | 54 (10.0%) | 0 (0.0%) |
| $100,000 to $149,999 | 73 (13.6%) | 0 (0.0%) |
| $150,000 or more | 0 (0.0%) | 0 (0.0%) |
| Total | 538 (100.0%) | 18 (100.0%) |
Property Value to Household Income Ratio in Presidio
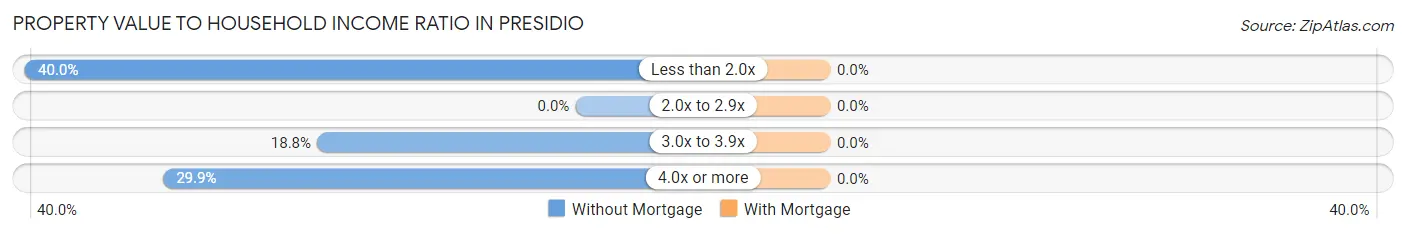
| Value-to-Income Ratio | Without Mortgage | With Mortgage |
| Less than 2.0x | 215 (40.0%) | 0 (0.0%) |
| 2.0x to 2.9x | 0 (0.0%) | 0 (0.0%) |
| 3.0x to 3.9x | 101 (18.8%) | 0 (0.0%) |
| 4.0x or more | 161 (29.9%) | 0 (0.0%) |
| Total | 538 (100.0%) | 18 (100.0%) |
Real Estate Taxes by Mortgage Status in Presidio
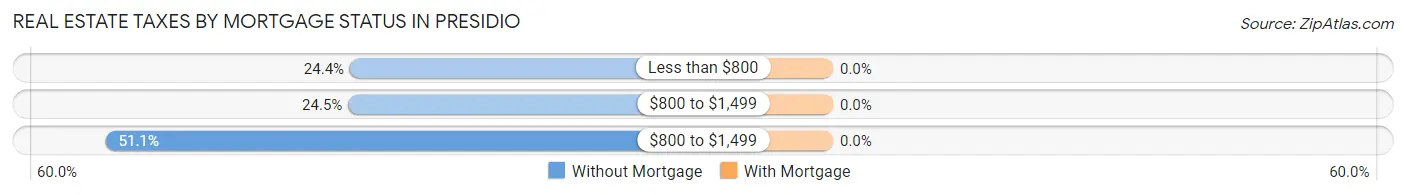
| Property Taxes | Without Mortgage | With Mortgage |
| Less than $800 | 131 (24.3%) | 0 (0.0%) |
| $800 to $1,499 | 132 (24.5%) | 0 (0.0%) |
| $800 to $1,499 | 275 (51.1%) | 0 (0.0%) |
| Total | 538 (100.0%) | 18 (100.0%) |
Health & Disability in Presidio
Health Insurance Coverage by Age in Presidio
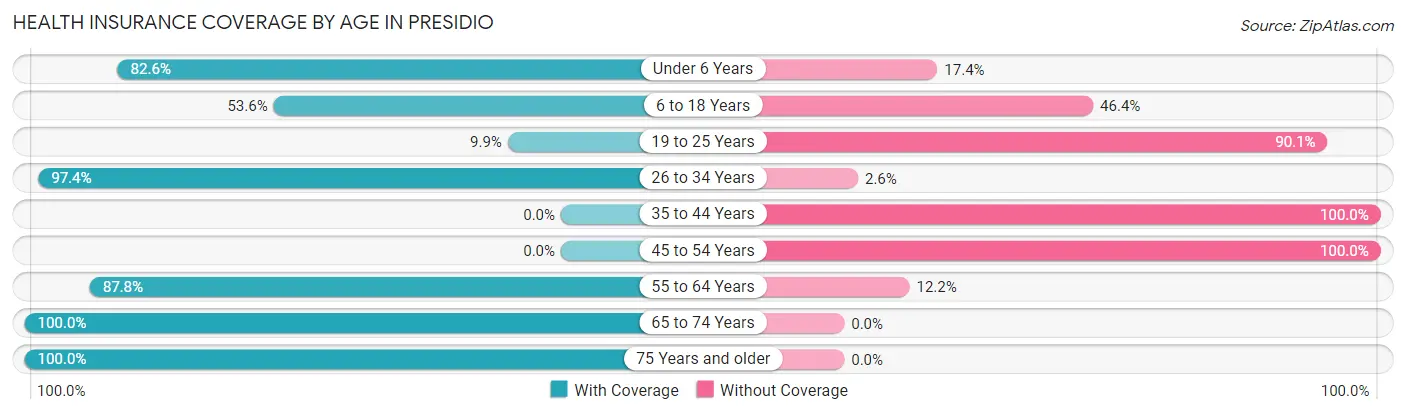
| Age Bracket | With Coverage | Without Coverage |
| Under 6 Years | 376 (82.6%) | 79 (17.4%) |
| 6 to 18 Years | 440 (53.6%) | 381 (46.4%) |
| 19 to 25 Years | 42 (9.9%) | 382 (90.1%) |
| 26 to 34 Years | 304 (97.4%) | 8 (2.6%) |
| 35 to 44 Years | 0 (0.0%) | 480 (100.0%) |
| 45 to 54 Years | 0 (0.0%) | 54 (100.0%) |
| 55 to 64 Years | 231 (87.8%) | 32 (12.2%) |
| 65 to 74 Years | 219 (100.0%) | 0 (0.0%) |
| 75 Years and older | 271 (100.0%) | 0 (0.0%) |
| Total | 1,883 (57.1%) | 1,416 (42.9%) |
Health Insurance Coverage by Citizenship Status in Presidio
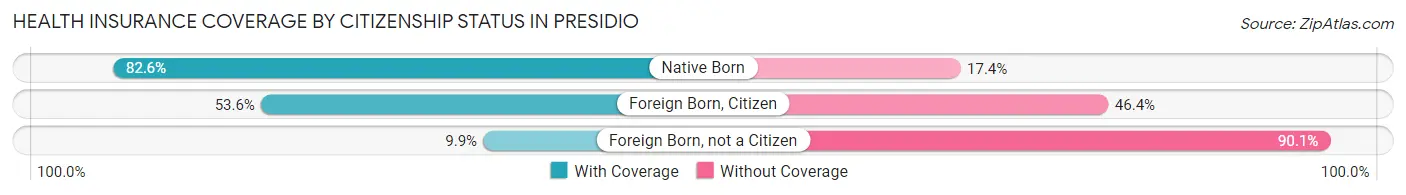
| Citizenship Status | With Coverage | Without Coverage |
| Native Born | 376 (82.6%) | 79 (17.4%) |
| Foreign Born, Citizen | 440 (53.6%) | 381 (46.4%) |
| Foreign Born, not a Citizen | 42 (9.9%) | 382 (90.1%) |
Health Insurance Coverage by Household Income in Presidio
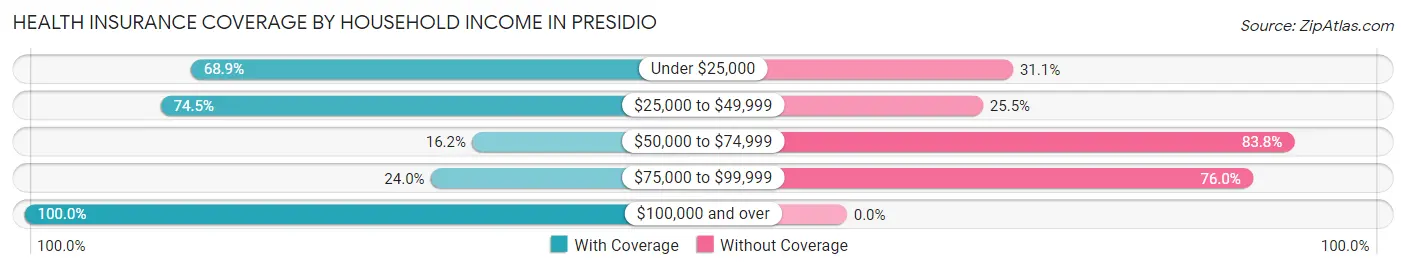
| Household Income | With Coverage | Without Coverage |
| Under $25,000 | 628 (68.9%) | 284 (31.1%) |
| $25,000 to $49,999 | 865 (74.5%) | 296 (25.5%) |
| $50,000 to $74,999 | 55 (16.2%) | 284 (83.8%) |
| $75,000 to $99,999 | 174 (24.0%) | 552 (76.0%) |
| $100,000 and over | 161 (100.0%) | 0 (0.0%) |
Public vs Private Health Insurance Coverage by Age in Presidio
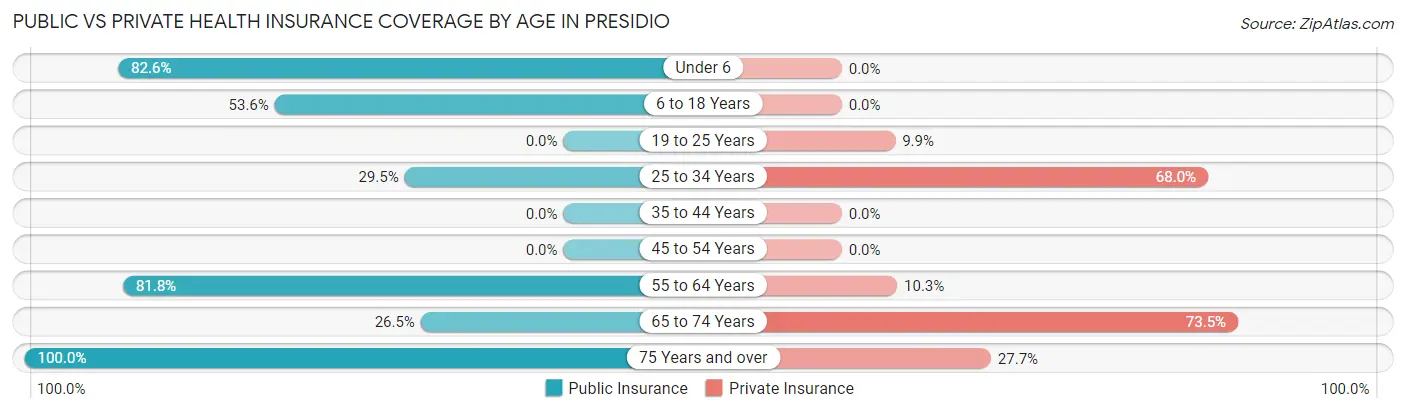
| Age Bracket | Public Insurance | Private Insurance |
| Under 6 | 376 (82.6%) | 0 (0.0%) |
| 6 to 18 Years | 440 (53.6%) | 0 (0.0%) |
| 19 to 25 Years | 0 (0.0%) | 42 (9.9%) |
| 25 to 34 Years | 92 (29.5%) | 212 (67.9%) |
| 35 to 44 Years | 0 (0.0%) | 0 (0.0%) |
| 45 to 54 Years | 0 (0.0%) | 0 (0.0%) |
| 55 to 64 Years | 215 (81.8%) | 27 (10.3%) |
| 65 to 74 Years | 58 (26.5%) | 161 (73.5%) |
| 75 Years and over | 271 (100.0%) | 75 (27.7%) |
| Total | 1,452 (44.0%) | 517 (15.7%) |
Disability Status by Sex by Age in Presidio
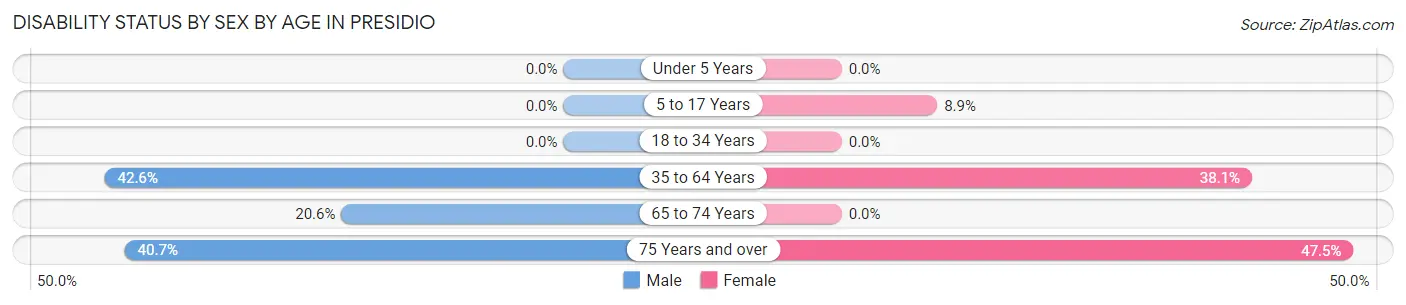
| Age Bracket | Male | Female |
| Under 5 Years | 0 (0.0%) | 0 (0.0%) |
| 5 to 17 Years | 0 (0.0%) | 41 (8.9%) |
| 18 to 34 Years | 0 (0.0%) | 0 (0.0%) |
| 35 to 64 Years | 129 (42.6%) | 188 (38.1%) |
| 65 to 74 Years | 27 (20.6%) | 0 (0.0%) |
| 75 Years and over | 46 (40.7%) | 75 (47.5%) |
Disability Class by Sex by Age in Presidio
Disability Class: Hearing Difficulty
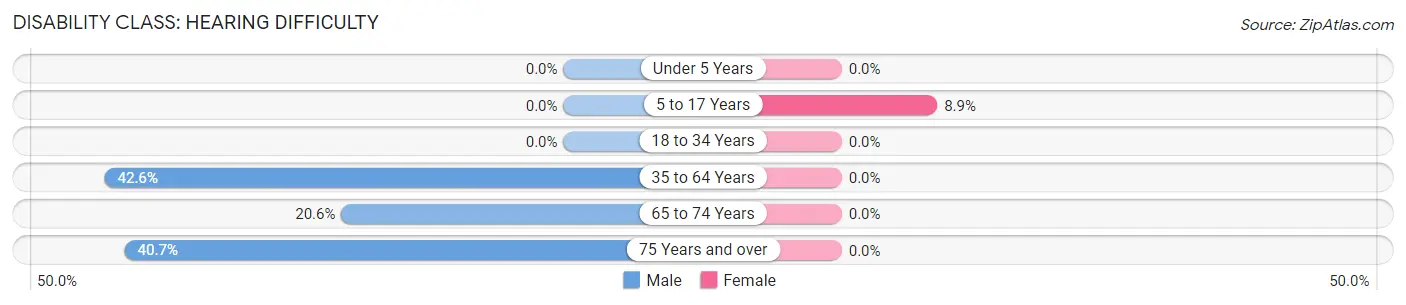
| Age Bracket | Male | Female |
| Under 5 Years | 0 (0.0%) | 0 (0.0%) |
| 5 to 17 Years | 0 (0.0%) | 41 (8.9%) |
| 18 to 34 Years | 0 (0.0%) | 0 (0.0%) |
| 35 to 64 Years | 129 (42.6%) | 0 (0.0%) |
| 65 to 74 Years | 27 (20.6%) | 0 (0.0%) |
| 75 Years and over | 46 (40.7%) | 0 (0.0%) |
Disability Class: Vision Difficulty
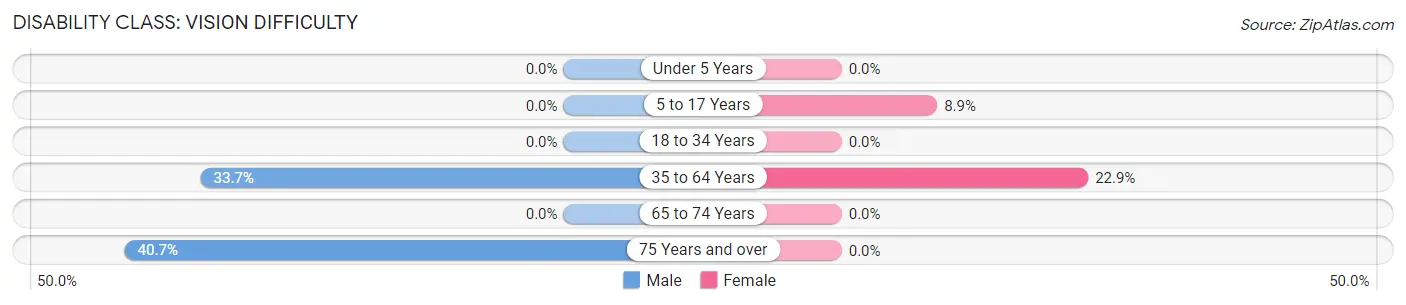
| Age Bracket | Male | Female |
| Under 5 Years | 0 (0.0%) | 0 (0.0%) |
| 5 to 17 Years | 0 (0.0%) | 41 (8.9%) |
| 18 to 34 Years | 0 (0.0%) | 0 (0.0%) |
| 35 to 64 Years | 102 (33.7%) | 113 (22.9%) |
| 65 to 74 Years | 0 (0.0%) | 0 (0.0%) |
| 75 Years and over | 46 (40.7%) | 0 (0.0%) |
Disability Class: Cognitive Difficulty
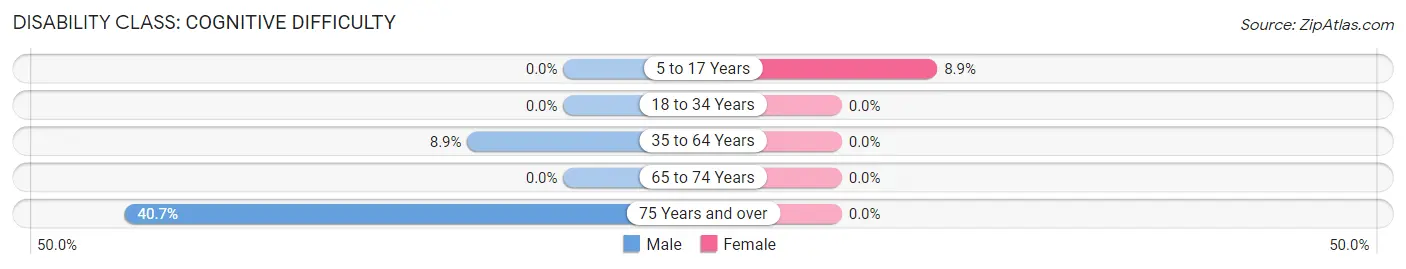
| Age Bracket | Male | Female |
| 5 to 17 Years | 0 (0.0%) | 41 (8.9%) |
| 18 to 34 Years | 0 (0.0%) | 0 (0.0%) |
| 35 to 64 Years | 27 (8.9%) | 0 (0.0%) |
| 65 to 74 Years | 0 (0.0%) | 0 (0.0%) |
| 75 Years and over | 46 (40.7%) | 0 (0.0%) |
Disability Class: Ambulatory Difficulty
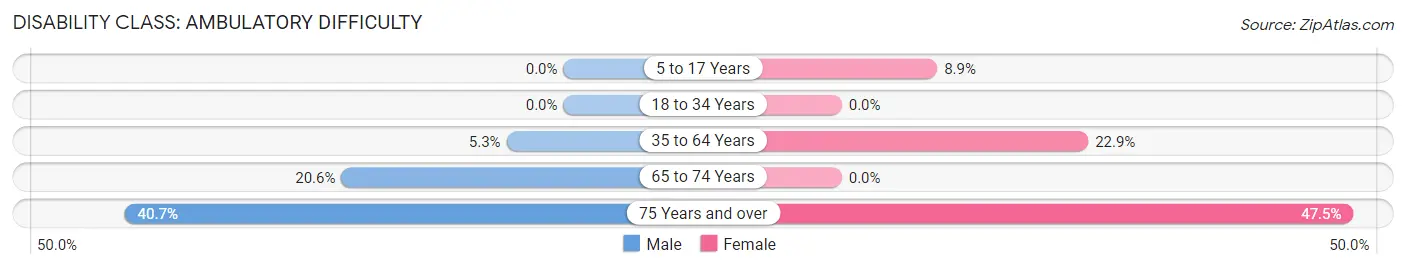
| Age Bracket | Male | Female |
| 5 to 17 Years | 0 (0.0%) | 41 (8.9%) |
| 18 to 34 Years | 0 (0.0%) | 0 (0.0%) |
| 35 to 64 Years | 16 (5.3%) | 113 (22.9%) |
| 65 to 74 Years | 27 (20.6%) | 0 (0.0%) |
| 75 Years and over | 46 (40.7%) | 75 (47.5%) |
Disability Class: Self-Care Difficulty
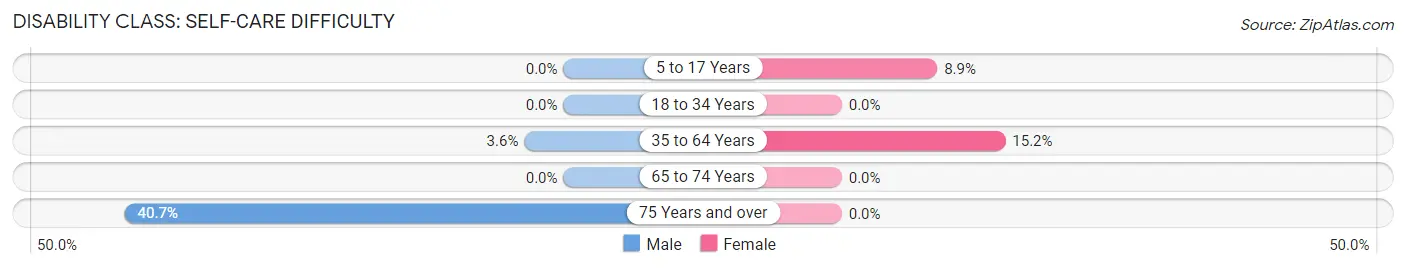
| Age Bracket | Male | Female |
| 5 to 17 Years | 0 (0.0%) | 41 (8.9%) |
| 18 to 34 Years | 0 (0.0%) | 0 (0.0%) |
| 35 to 64 Years | 11 (3.6%) | 75 (15.2%) |
| 65 to 74 Years | 0 (0.0%) | 0 (0.0%) |
| 75 Years and over | 46 (40.7%) | 0 (0.0%) |
Technology Access in Presidio
Computing Device Access in Presidio
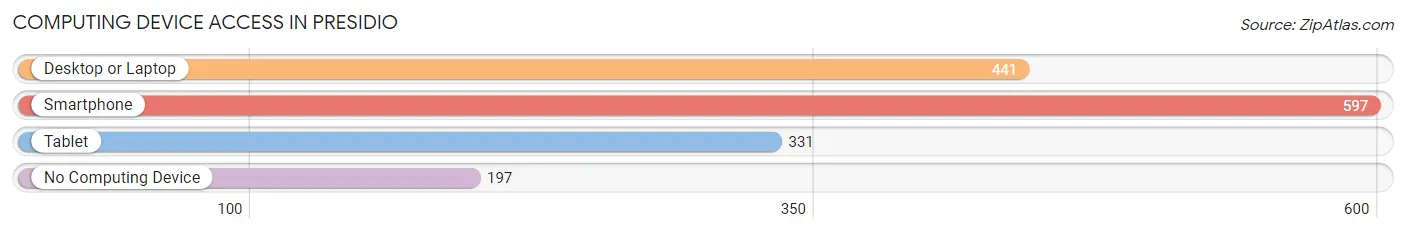
| Device Type | # Households | % Households |
| Desktop or Laptop | 441 | 55.5% |
| Smartphone | 597 | 75.2% |
| Tablet | 331 | 41.7% |
| No Computing Device | 197 | 24.8% |
| Total | 794 | 100.0% |
Internet Access in Presidio
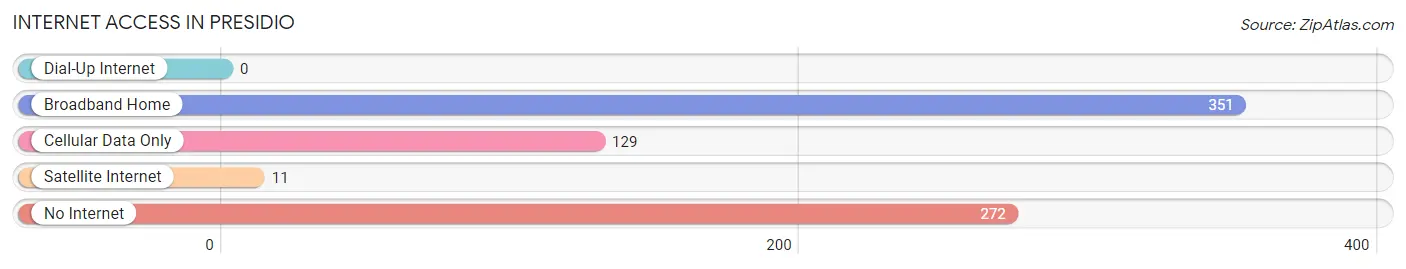
| Internet Type | # Households | % Households |
| Dial-Up Internet | 0 | 0.0% |
| Broadband Home | 351 | 44.2% |
| Cellular Data Only | 129 | 16.3% |
| Satellite Internet | 11 | 1.4% |
| No Internet | 272 | 34.3% |
| Total | 794 | 100.0% |
Presidio Summary
Presidio, Texas is a small town located in the Big Bend region of West Texas. It is situated on the Rio Grande River, which forms the border between the United States and Mexico. The town has a population of 4,167 people, according to the 2010 census.
History
Presidio was founded in 1848 by a group of settlers from Chihuahua, Mexico. The town was originally called La Junta de los Rios, which translates to “the junction of the rivers.” The settlers were attracted to the area due to its fertile soil and abundant water supply.
In 1849, the United States Army established a fort in the area, which was named Fort Leaton. The fort was used to protect settlers from Native American raids. In 1852, the fort was renamed Fort Davis, after Jefferson Davis, the Secretary of War at the time.
In 1882, the town was renamed Presidio, after the Spanish word for “fort.” The town was officially incorporated in 1885.
Geography
Presidio is located in the Big Bend region of West Texas. It is situated on the Rio Grande River, which forms the border between the United States and Mexico. The town is located in Presidio County, which is bordered by Brewster County to the north, Jeff Davis County to the east, and Mexico to the south and west.
The town has a total area of 2.2 square miles, all of which is land. The terrain is mostly flat, with some rolling hills. The climate is semi-arid, with hot summers and mild winters.
Economy
The economy of Presidio is largely based on agriculture and tourism. The town is home to several farms and ranches, which produce a variety of crops, including cotton, corn, and wheat. The town is also home to several tourist attractions, including the Big Bend National Park, the Rio Grande River, and the Fort Davis National Historic Site.
The town is also home to several businesses, including restaurants, hotels, and retail stores. The town is served by the Presidio Independent School District.
Demographics
According to the 2010 census, the population of Presidio was 4,167. The racial makeup of the town was 73.3% White, 0.7% African American, 0.3% Native American, 0.2% Asian, 0.1% Pacific Islander, 22.7% from other races, and 2.7% from two or more races. Hispanic or Latino of any race were 95.3% of the population.
The median household income in Presidio was $20,972, and the median family income was $25,000. The per capita income was $10,945. About 24.3% of the population was below the poverty line.
Conclusion
Presidio, Texas is a small town located in the Big Bend region of West Texas. It is situated on the Rio Grande River, which forms the border between the United States and Mexico. The town has a population of 4,167 people, according to the 2010 census. The economy of Presidio is largely based on agriculture and tourism. The racial makeup of the town was 73.3% White, 0.7% African American, 0.3% Native American, 0.2% Asian, 0.1% Pacific Islander, 22.7% from other races, and 2.7% from two or more races. Hispanic or Latino of any race were 95.3% of the population. The median household income in Presidio was $20,972, and the median family income was $25,000. The per capita income was $10,945. About 24.3% of the population was below the poverty line.
Common Questions
What is Per Capita Income in Presidio?
Per Capita income in Presidio is $12,252.
What is the Median Family Income in Presidio?
Median Family Income in Presidio is $33,934.
What is the Median Household income in Presidio?
Median Household Income in Presidio is $22,917.
What is Income or Wage Gap in Presidio?
Income or Wage Gap in Presidio is 63.6%.
Women in Presidio earn 36.4 cents for every dollar earned by a man.
What is Family Income Deficit in Presidio?
Family Income Deficit in Presidio is $7,209.
Families that are below poverty line in Presidio earn $7,209 less on average than the poverty threshold level.
What is Inequality or Gini Index in Presidio?
Inequality or Gini Index in Presidio is 0.48.
What is the Total Population of Presidio?
Total Population of Presidio is 3,299.
What is the Total Male Population of Presidio?
Total Male Population of Presidio is 1,536.
What is the Total Female Population of Presidio?
Total Female Population of Presidio is 1,763.
What is the Ratio of Males per 100 Females in Presidio?
There are 87.12 Males per 100 Females in Presidio.
What is the Ratio of Females per 100 Males in Presidio?
There are 114.78 Females per 100 Males in Presidio.
What is the Median Population Age in Presidio?
Median Population Age in Presidio is 22.9 Years.
What is the Average Family Size in Presidio
Average Family Size in Presidio is 6.3 People.
What is the Average Household Size in Presidio
Average Household Size in Presidio is 4.2 People.
How Large is the Labor Force in Presidio?
There are 1,150 People in the Labor Forcein in Presidio.
What is the Percentage of People in the Labor Force in Presidio?
53.4% of People are in the Labor Force in Presidio.
What is the Unemployment Rate in Presidio?
Unemployment Rate in Presidio is 30.0%.