Stony Brook, NY Map & Demographics
Stony Brook Map
Stony Brook Overview
$72,008
PER CAPITA INCOME
$171,448
AVG FAMILY INCOME
$145,487
AVG HOUSEHOLD INCOME
38.3%
WAGE / INCOME GAP [ % ]
61.7¢/ $1
WAGE / INCOME GAP [ $ ]
0.42
INEQUALITY / GINI INDEX
12,501
TOTAL POPULATION
6,500
MALE POPULATION
6,001
FEMALE POPULATION
108.32
MALES / 100 FEMALES
92.32
FEMALES / 100 MALES
45.8
MEDIAN AGE
3.1
AVG FAMILY SIZE
2.8
AVG HOUSEHOLD SIZE
6,496
LABOR FORCE [ PEOPLE ]
64.2%
PERCENT IN LABOR FORCE
3.7%
UNEMPLOYMENT RATE
Stony Brook Area Codes
Income in Stony Brook
Income Overview in Stony Brook
Per Capita Income in Stony Brook is $72,008, while median incomes of families and households are $171,448 and $145,487 respectively.
| Characteristic | Number | Measure |
| Per Capita Income | 12,501 | $72,008 |
| Median Family Income | 3,378 | $171,448 |
| Mean Family Income | 3,378 | $225,833 |
| Median Household Income | 4,523 | $145,487 |
| Mean Household Income | 4,523 | $193,136 |
| Income Deficit | 3,378 | $0 |
| Wage / Income Gap (%) | 12,501 | 38.29% |
| Wage / Income Gap ($) | 12,501 | 61.71¢ per $1 |
| Gini / Inequality Index | 12,501 | 0.42 |
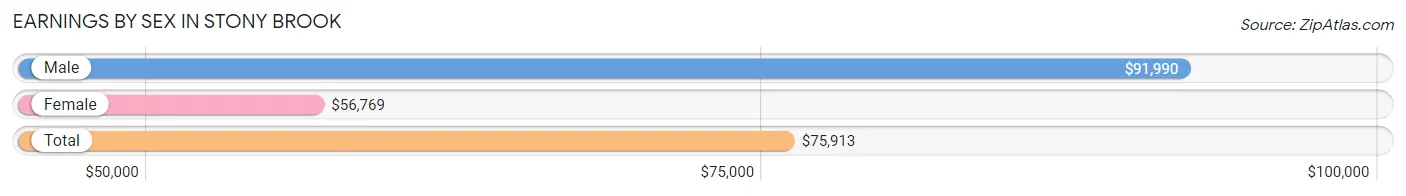
Earnings by Sex in Stony Brook
Average Earnings in Stony Brook are $75,913, $91,990 for men and $56,769 for women, a difference of 38.3%.
| Sex | Number | Average Earnings |
| Male | 3,731 (54.0%) | $91,990 |
| Female | 3,174 (46.0%) | $56,769 |
| Total | 6,905 (100.0%) | $75,913 |
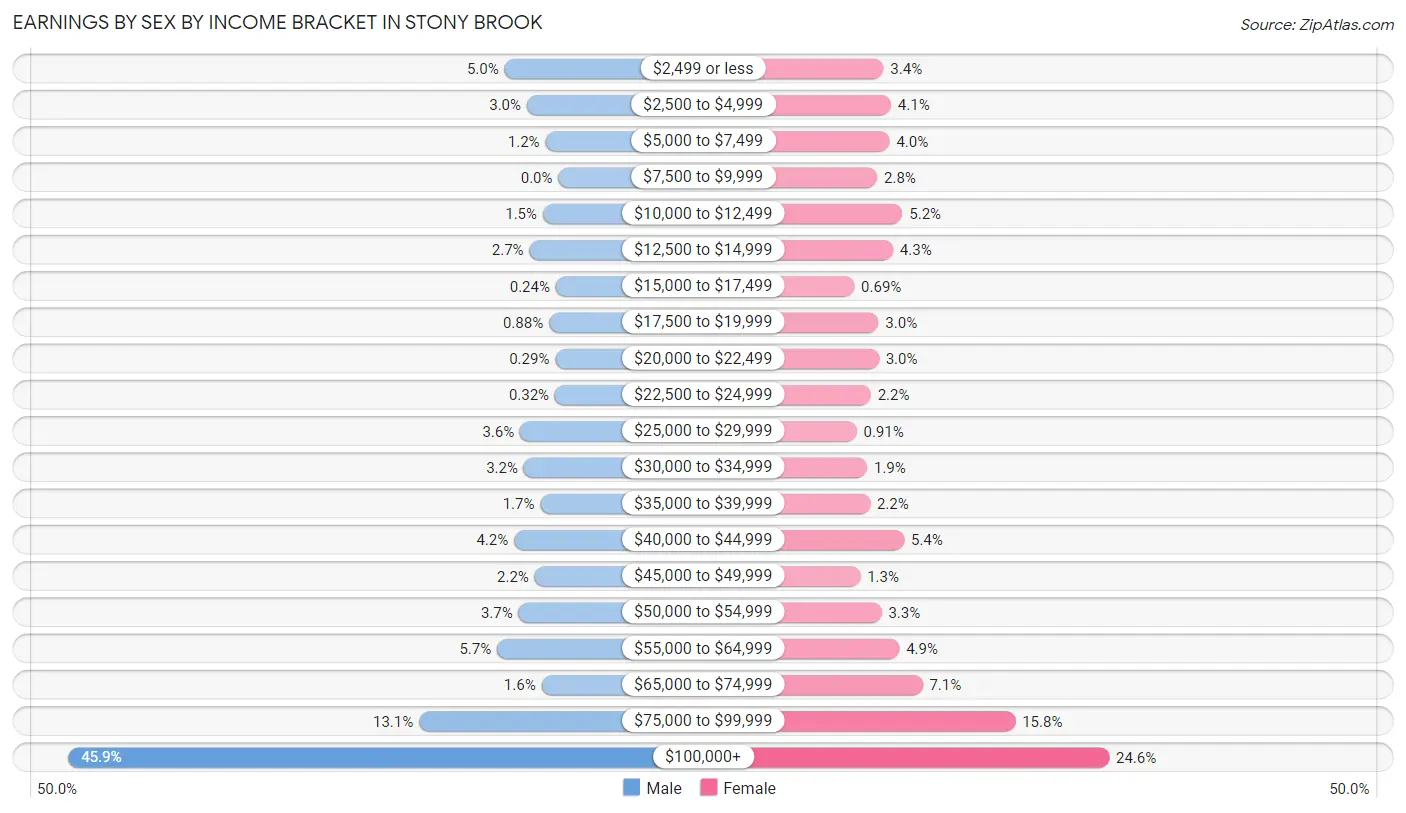
Earnings by Sex by Income Bracket in Stony Brook
The most common earnings brackets in Stony Brook are $100,000+ for men (1,713 | 45.9%) and $100,000+ for women (780 | 24.6%).
| Income | Male | Female |
| $2,499 or less | 188 (5.0%) | 109 (3.4%) |
| $2,500 to $4,999 | 110 (2.9%) | 131 (4.1%) |
| $5,000 to $7,499 | 45 (1.2%) | 127 (4.0%) |
| $7,500 to $9,999 | 0 (0.0%) | 90 (2.8%) |
| $10,000 to $12,499 | 54 (1.5%) | 165 (5.2%) |
| $12,500 to $14,999 | 101 (2.7%) | 137 (4.3%) |
| $15,000 to $17,499 | 9 (0.2%) | 22 (0.7%) |
| $17,500 to $19,999 | 33 (0.9%) | 94 (3.0%) |
| $20,000 to $22,499 | 11 (0.3%) | 95 (3.0%) |
| $22,500 to $24,999 | 12 (0.3%) | 71 (2.2%) |
| $25,000 to $29,999 | 134 (3.6%) | 29 (0.9%) |
| $30,000 to $34,999 | 121 (3.2%) | 60 (1.9%) |
| $35,000 to $39,999 | 63 (1.7%) | 69 (2.2%) |
| $40,000 to $44,999 | 155 (4.2%) | 170 (5.4%) |
| $45,000 to $49,999 | 83 (2.2%) | 40 (1.3%) |
| $50,000 to $54,999 | 139 (3.7%) | 103 (3.3%) |
| $55,000 to $64,999 | 214 (5.7%) | 156 (4.9%) |
| $65,000 to $74,999 | 59 (1.6%) | 225 (7.1%) |
| $75,000 to $99,999 | 487 (13.1%) | 501 (15.8%) |
| $100,000+ | 1,713 (45.9%) | 780 (24.6%) |
| Total | 3,731 (100.0%) | 3,174 (100.0%) |
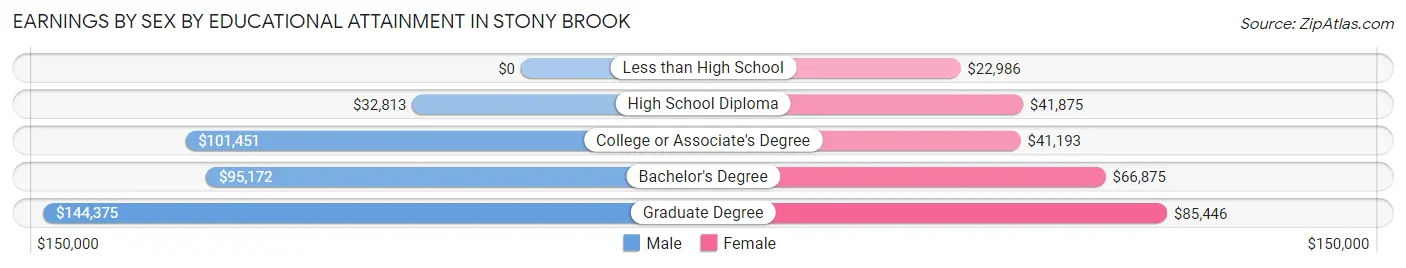
Earnings by Sex by Educational Attainment in Stony Brook
Average earnings in Stony Brook are $101,387 for men and $70,000 for women, a difference of 31.0%. Men with an educational attainment of graduate degree enjoy the highest average annual earnings of $144,375, while those with high school diploma education earn the least with $32,813. Women with an educational attainment of graduate degree earn the most with the average annual earnings of $85,446, while those with less than high school education have the smallest earnings of $22,986.
| Educational Attainment | Male Income | Female Income |
| Less than High School | - | - |
| High School Diploma | $32,813 | $41,875 |
| College or Associate's Degree | $101,451 | $41,193 |
| Bachelor's Degree | $95,172 | $66,875 |
| Graduate Degree | $144,375 | $85,446 |
| Total | $101,387 | $70,000 |
Family Income in Stony Brook
Family Income Brackets in Stony Brook
According to the Stony Brook family income data, there are 1,446 families falling into the $200,000+ income range, which is the most common income bracket and makes up 42.8% of all families. Conversely, the $10,000 to $14,999 income bracket is the least frequent group with only 3 families (0.1%) belonging to this category.
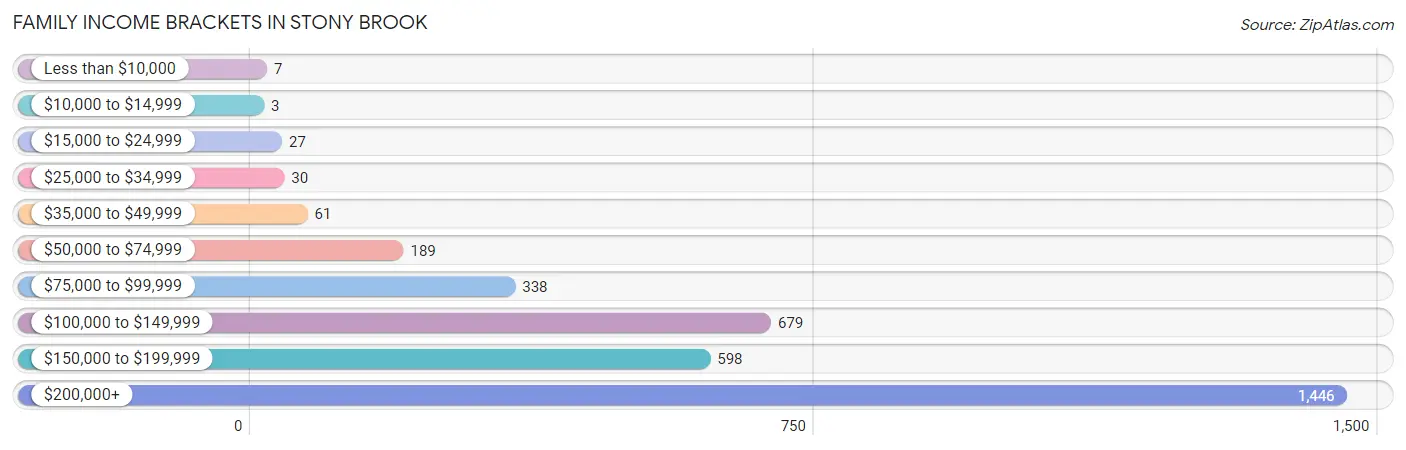
| Income Bracket | # Families | % Families |
| Less than $10,000 | 7 | 0.2% |
| $10,000 to $14,999 | 3 | 0.1% |
| $15,000 to $24,999 | 27 | 0.8% |
| $25,000 to $34,999 | 30 | 0.9% |
| $35,000 to $49,999 | 61 | 1.8% |
| $50,000 to $74,999 | 189 | 5.6% |
| $75,000 to $99,999 | 338 | 10.0% |
| $100,000 to $149,999 | 679 | 20.1% |
| $150,000 to $199,999 | 598 | 17.7% |
| $200,000+ | 1,446 | 42.8% |
Family Income by Famaliy Size in Stony Brook
4-person families (595 | 17.6%) account for the highest median family income in Stony Brook with $250,001 per family, while 2-person families (1,372 | 40.6%) have the highest median income of $76,875 per family member.
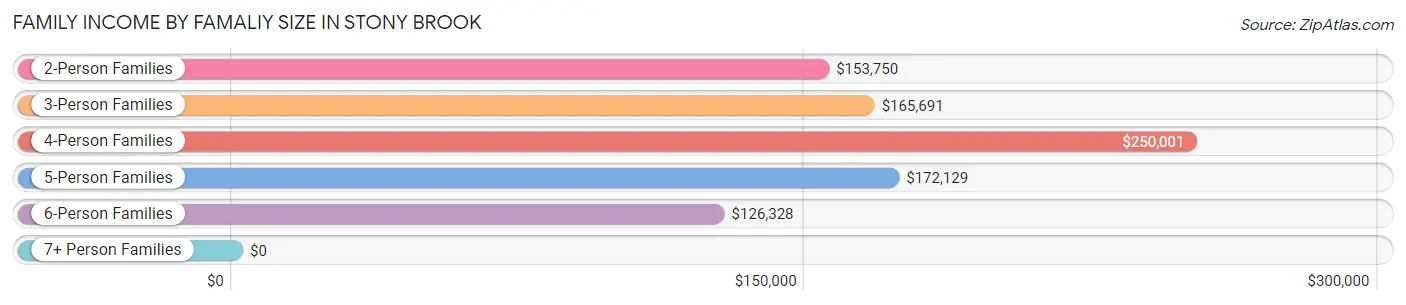
| Income Bracket | # Families | Median Income |
| 2-Person Families | 1,372 (40.6%) | $153,750 |
| 3-Person Families | 1,030 (30.5%) | $165,691 |
| 4-Person Families | 595 (17.6%) | $250,001 |
| 5-Person Families | 310 (9.2%) | $172,129 |
| 6-Person Families | 51 (1.5%) | $126,328 |
| 7+ Person Families | 20 (0.6%) | $0 |
| Total | 3,378 (100.0%) | $171,448 |
Family Income by Number of Earners in Stony Brook
The median family income in Stony Brook is $171,448, with families comprising 2 earners (1,682) having the highest median family income of $222,292, while families with no earners (413) have the lowest median family income of $113,969, accounting for 49.8% and 12.2% of families, respectively.
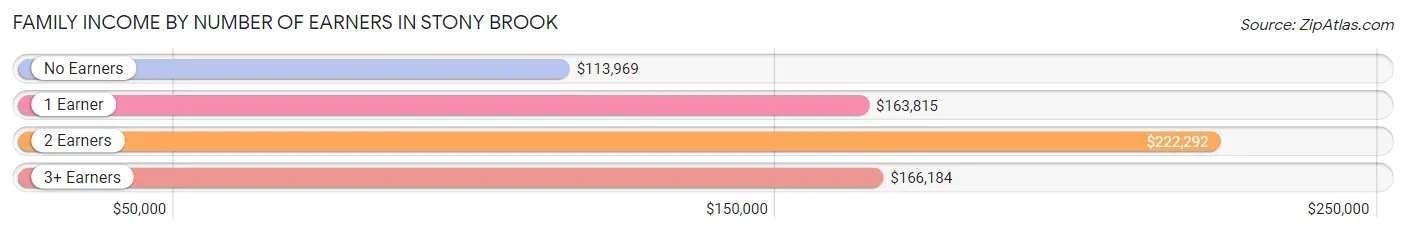
| Number of Earners | # Families | Median Income |
| No Earners | 413 (12.2%) | $113,969 |
| 1 Earner | 803 (23.8%) | $163,815 |
| 2 Earners | 1,682 (49.8%) | $222,292 |
| 3+ Earners | 480 (14.2%) | $166,184 |
| Total | 3,378 (100.0%) | $171,448 |
Household Income in Stony Brook
Household Income Brackets in Stony Brook
With 1,511 households falling in the category, the $200,000+ income range is the most frequent in Stony Brook, accounting for 33.4% of all households. In contrast, only 41 households (0.9%) fall into the less than $10,000 income bracket, making it the least populous group.
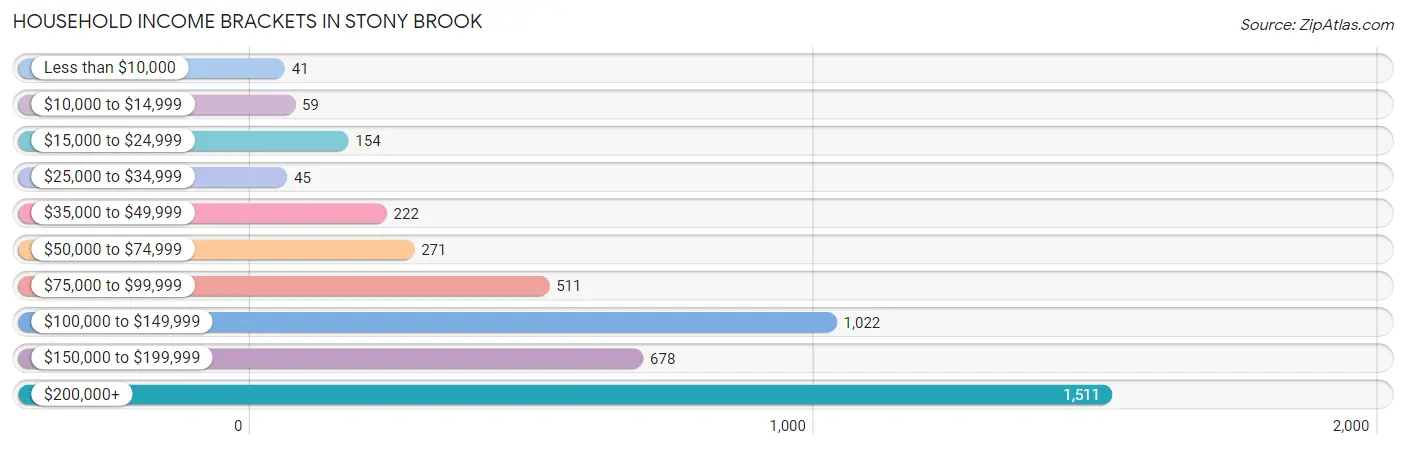
| Income Bracket | # Households | % Households |
| Less than $10,000 | 41 | 0.9% |
| $10,000 to $14,999 | 59 | 1.3% |
| $15,000 to $24,999 | 154 | 3.4% |
| $25,000 to $34,999 | 45 | 1.0% |
| $35,000 to $49,999 | 222 | 4.9% |
| $50,000 to $74,999 | 271 | 6.0% |
| $75,000 to $99,999 | 511 | 11.3% |
| $100,000 to $149,999 | 1,022 | 22.6% |
| $150,000 to $199,999 | 678 | 15.0% |
| $200,000+ | 1,511 | 33.4% |
Household Income by Householder Age in Stony Brook
The median household income in Stony Brook is $145,487, with the highest median household income of $175,750 found in the 45 to 64 years age bracket for the primary householder. A total of 1,765 households (39.0%) fall into this category. Meanwhile, the 65+ years age bracket for the primary householder has the lowest median household income of $114,563, with 1,692 households (37.4%) in this group.
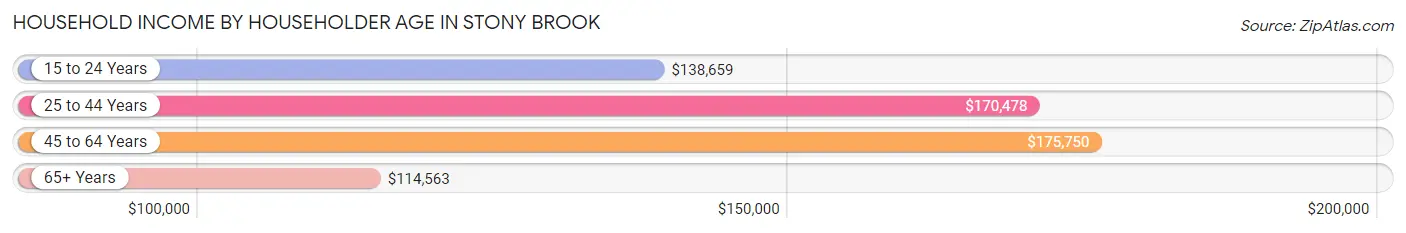
| Income Bracket | # Households | Median Income |
| 15 to 24 Years | 107 (2.4%) | $138,659 |
| 25 to 44 Years | 959 (21.2%) | $170,478 |
| 45 to 64 Years | 1,765 (39.0%) | $175,750 |
| 65+ Years | 1,692 (37.4%) | $114,563 |
| Total | 4,523 (100.0%) | $145,487 |
Poverty in Stony Brook
Income Below Poverty by Sex and Age in Stony Brook
With 6.5% poverty level for males and 4.6% for females among the residents of Stony Brook, 18 to 24 year old males and 18 to 24 year old females are the most vulnerable to poverty, with 238 males (38.8%) and 84 females (16.0%) in their respective age groups living below the poverty level.
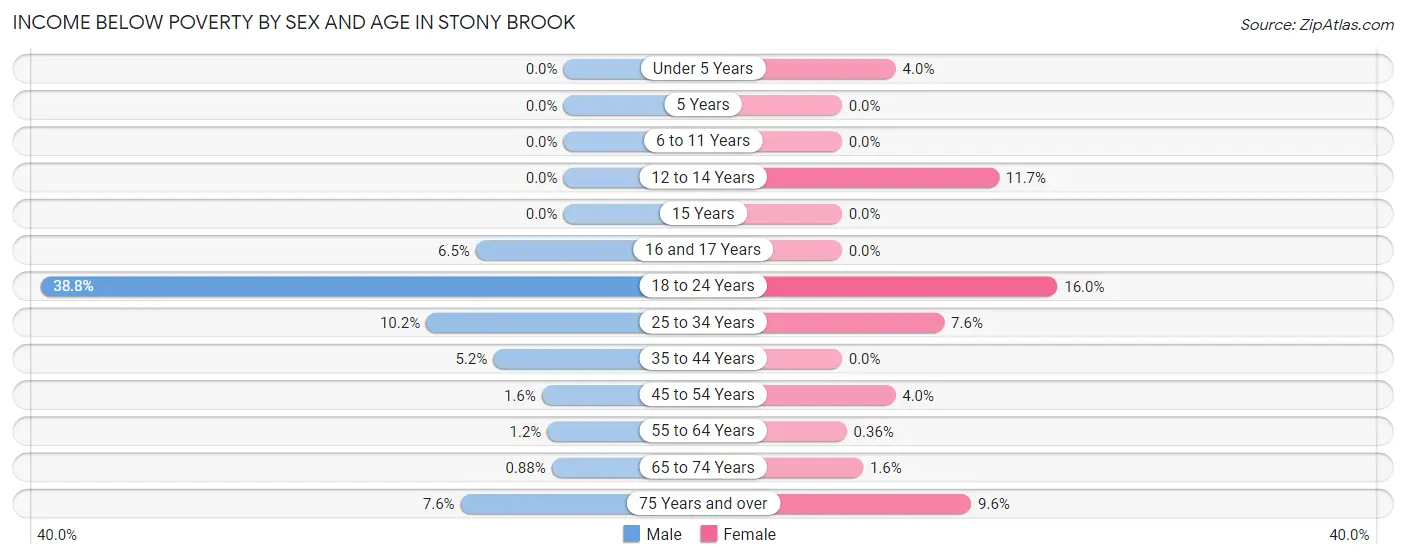
| Age Bracket | Male | Female |
| Under 5 Years | 0 (0.0%) | 11 (4.0%) |
| 5 Years | 0 (0.0%) | 0 (0.0%) |
| 6 to 11 Years | 0 (0.0%) | 0 (0.0%) |
| 12 to 14 Years | 0 (0.0%) | 19 (11.7%) |
| 15 Years | 0 (0.0%) | 0 (0.0%) |
| 16 and 17 Years | 19 (6.5%) | 0 (0.0%) |
| 18 to 24 Years | 238 (38.8%) | 84 (16.0%) |
| 25 to 34 Years | 75 (10.2%) | 39 (7.6%) |
| 35 to 44 Years | 23 (5.2%) | 0 (0.0%) |
| 45 to 54 Years | 17 (1.6%) | 37 (4.0%) |
| 55 to 64 Years | 9 (1.2%) | 3 (0.4%) |
| 65 to 74 Years | 8 (0.9%) | 11 (1.6%) |
| 75 Years and over | 35 (7.6%) | 70 (9.6%) |
| Total | 424 (6.5%) | 274 (4.6%) |
Income Above Poverty by Sex and Age in Stony Brook
According to the poverty statistics in Stony Brook, males aged under 5 years and females aged 5 years are the age groups that are most secure financially, with 100.0% of males and 100.0% of females in these age groups living above the poverty line.
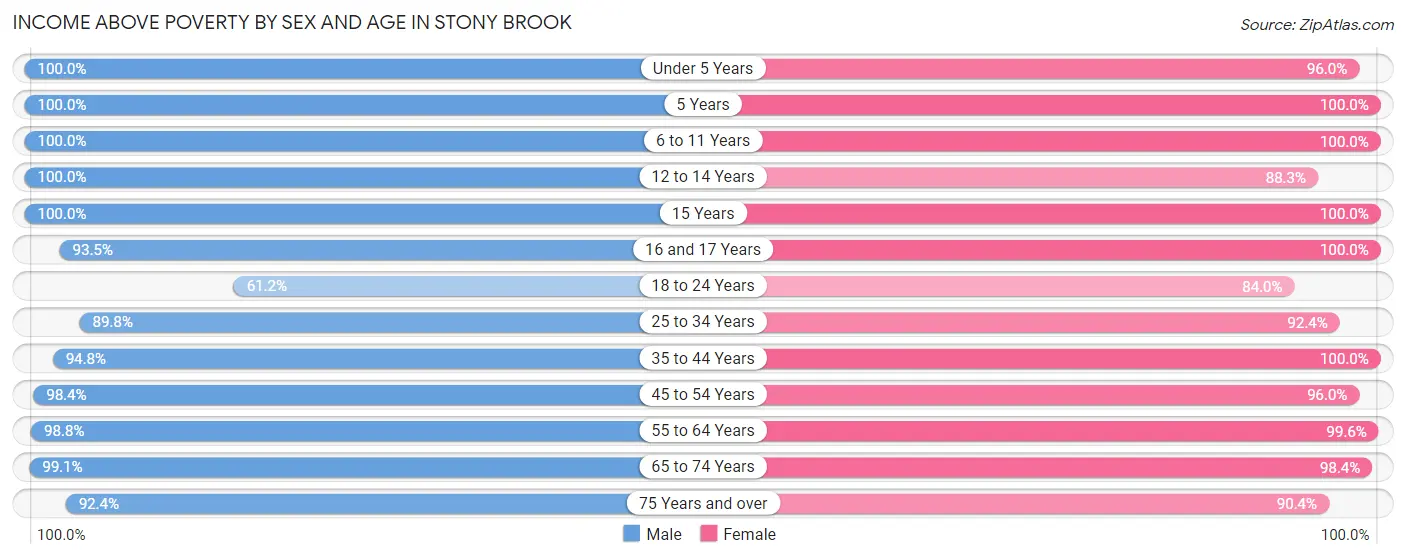
| Age Bracket | Male | Female |
| Under 5 Years | 379 (100.0%) | 264 (96.0%) |
| 5 Years | 68 (100.0%) | 255 (100.0%) |
| 6 to 11 Years | 300 (100.0%) | 340 (100.0%) |
| 12 to 14 Years | 348 (100.0%) | 144 (88.3%) |
| 15 Years | 128 (100.0%) | 98 (100.0%) |
| 16 and 17 Years | 273 (93.5%) | 33 (100.0%) |
| 18 to 24 Years | 375 (61.2%) | 441 (84.0%) |
| 25 to 34 Years | 660 (89.8%) | 474 (92.4%) |
| 35 to 44 Years | 418 (94.8%) | 573 (100.0%) |
| 45 to 54 Years | 1,035 (98.4%) | 896 (96.0%) |
| 55 to 64 Years | 743 (98.8%) | 841 (99.6%) |
| 65 to 74 Years | 906 (99.1%) | 691 (98.4%) |
| 75 Years and over | 423 (92.4%) | 659 (90.4%) |
| Total | 6,056 (93.5%) | 5,709 (95.4%) |
Income Below Poverty Among Married-Couple Families in Stony Brook
The poverty statistics for married-couple families in Stony Brook show that 0.9% or 28 of the total 2,939 families live below the poverty line. Families with 1 or 2 children have the highest poverty rate of 1.8%, comprising of 17 families. On the other hand, families with 3 or 4 children have the lowest poverty rate of 0.0%, which includes 0 families.
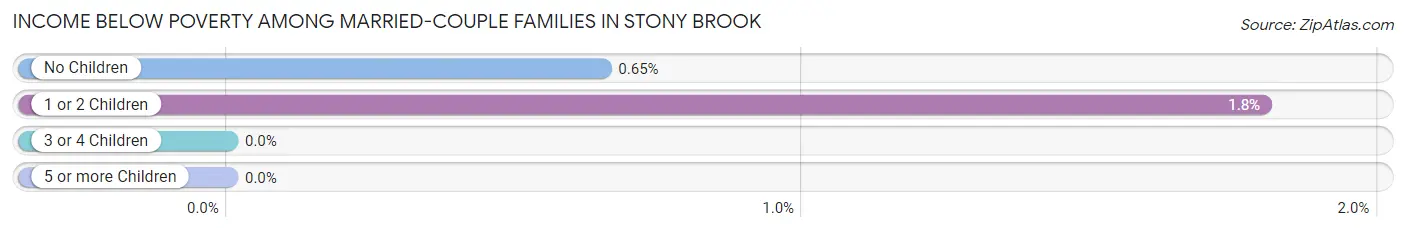
| Children | Above Poverty | Below Poverty |
| No Children | 1,671 (99.4%) | 11 (0.6%) |
| 1 or 2 Children | 928 (98.2%) | 17 (1.8%) |
| 3 or 4 Children | 312 (100.0%) | 0 (0.0%) |
| 5 or more Children | 0 (0.0%) | 0 (0.0%) |
| Total | 2,911 (99.1%) | 28 (0.9%) |
Income Below Poverty Among Single-Parent Households in Stony Brook
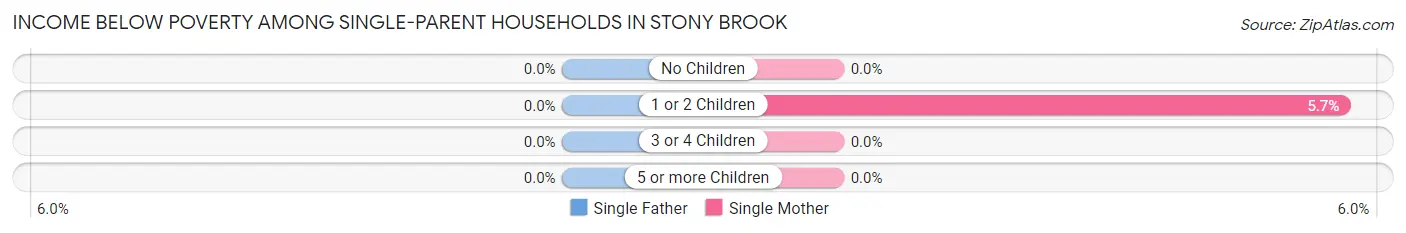
| Children | Single Father | Single Mother |
| No Children | 0 (0.0%) | 0 (0.0%) |
| 1 or 2 Children | 0 (0.0%) | 8 (5.7%) |
| 3 or 4 Children | 0 (0.0%) | 0 (0.0%) |
| 5 or more Children | 0 (0.0%) | 0 (0.0%) |
| Total | 0 (0.0%) | 8 (2.1%) |
Income Below Poverty Among Married-Couple vs Single-Parent Households in Stony Brook
The poverty data for Stony Brook shows that 28 of the married-couple family households (0.9%) and 8 of the single-parent households (1.8%) are living below the poverty level. Within the married-couple family households, those with 1 or 2 children have the highest poverty rate, with 17 households (1.8%) falling below the poverty line. Among the single-parent households, those with 1 or 2 children have the highest poverty rate, with 8 household (5.2%) living below poverty.
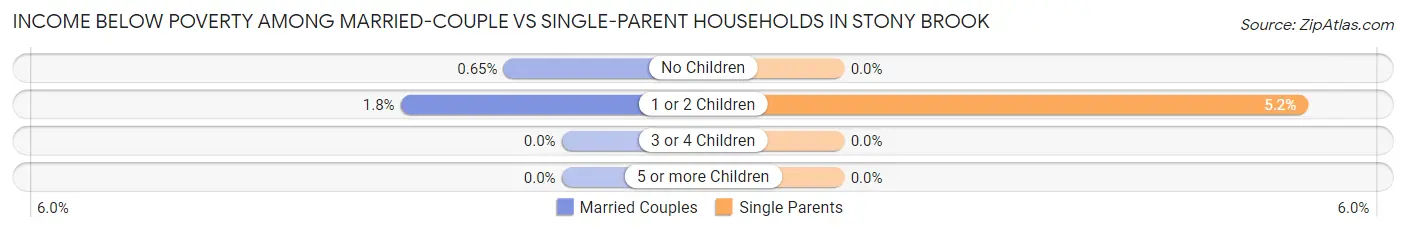
| Children | Married-Couple Families | Single-Parent Households |
| No Children | 11 (0.6%) | 0 (0.0%) |
| 1 or 2 Children | 17 (1.8%) | 8 (5.2%) |
| 3 or 4 Children | 0 (0.0%) | 0 (0.0%) |
| 5 or more Children | 0 (0.0%) | 0 (0.0%) |
| Total | 28 (0.9%) | 8 (1.8%) |
Race in Stony Brook
The most populous races in Stony Brook are White / Caucasian (10,208 | 81.7%), Asian (1,472 | 11.8%), and Hispanic or Latino (1,025 | 8.2%).
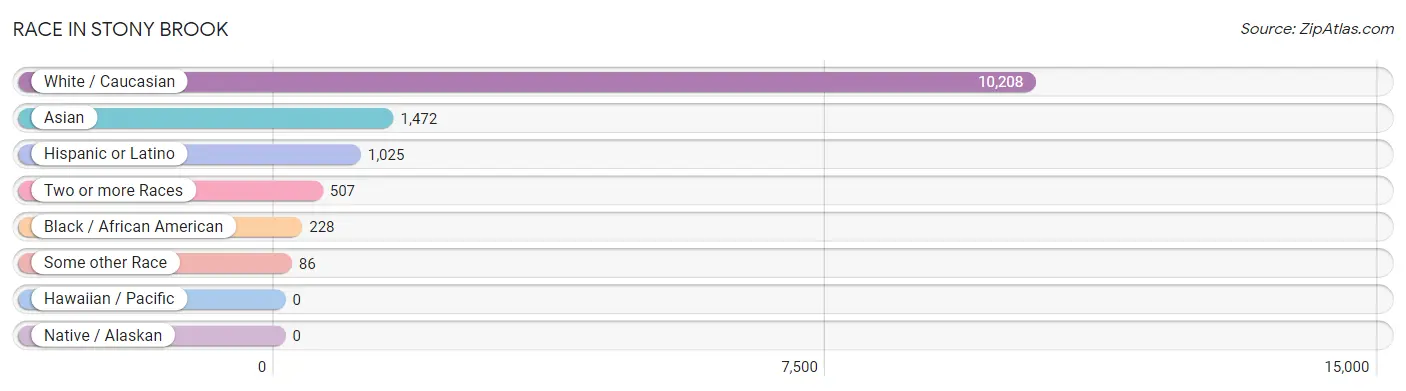
| Race | # Population | % Population |
| Asian | 1,472 | 11.8% |
| Black / African American | 228 | 1.8% |
| Hawaiian / Pacific | 0 | 0.0% |
| Hispanic or Latino | 1,025 | 8.2% |
| Native / Alaskan | 0 | 0.0% |
| White / Caucasian | 10,208 | 81.7% |
| Two or more Races | 507 | 4.1% |
| Some other Race | 86 | 0.7% |
| Total | 12,501 | 100.0% |
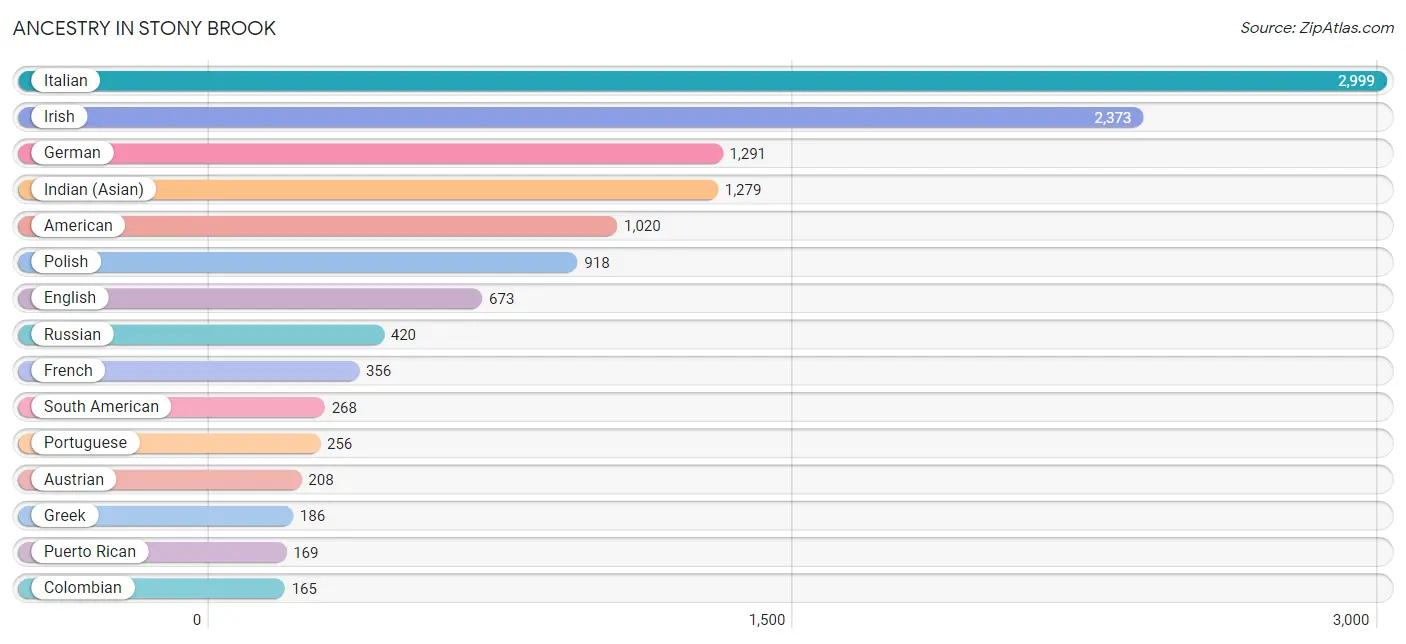
Ancestry in Stony Brook
The most populous ancestries reported in Stony Brook are Italian (2,999 | 24.0%), Irish (2,373 | 19.0%), German (1,291 | 10.3%), Indian (Asian) (1,279 | 10.2%), and American (1,020 | 8.2%), together accounting for 71.7% of all Stony Brook residents.
| Ancestry | # Population | % Population |
| Albanian | 4 | 0.0% |
| American | 1,020 | 8.2% |
| Arab | 65 | 0.5% |
| Argentinean | 40 | 0.3% |
| Australian | 18 | 0.1% |
| Austrian | 208 | 1.7% |
| British | 11 | 0.1% |
| Burmese | 39 | 0.3% |
| Central American | 82 | 0.7% |
| Central American Indian | 34 | 0.3% |
| Colombian | 165 | 1.3% |
| Cuban | 140 | 1.1% |
| Czech | 31 | 0.3% |
| Czechoslovakian | 17 | 0.1% |
| Dominican | 125 | 1.0% |
| Dutch | 35 | 0.3% |
| Eastern European | 88 | 0.7% |
| Egyptian | 7 | 0.1% |
| English | 673 | 5.4% |
| European | 20 | 0.2% |
| Finnish | 9 | 0.1% |
| French | 356 | 2.9% |
| German | 1,291 | 10.3% |
| Greek | 186 | 1.5% |
| Guyanese | 1 | 0.0% |
| Haitian | 35 | 0.3% |
| Hungarian | 108 | 0.9% |
| Indian (Asian) | 1,279 | 10.2% |
| Irish | 2,373 | 19.0% |
| Israeli | 107 | 0.9% |
| Italian | 2,999 | 24.0% |
| Latvian | 12 | 0.1% |
| Lebanese | 5 | 0.0% |
| Lithuanian | 79 | 0.6% |
| Mexican | 31 | 0.3% |
| Nicaraguan | 37 | 0.3% |
| Northern European | 29 | 0.2% |
| Norwegian | 104 | 0.8% |
| Peruvian | 57 | 0.5% |
| Polish | 918 | 7.3% |
| Portuguese | 256 | 2.1% |
| Puerto Rican | 169 | 1.3% |
| Romanian | 67 | 0.5% |
| Russian | 420 | 3.4% |
| Salvadoran | 45 | 0.4% |
| Samoan | 4 | 0.0% |
| Scottish | 92 | 0.7% |
| Slavic | 44 | 0.4% |
| Slovene | 19 | 0.2% |
| South African | 18 | 0.1% |
| South American | 268 | 2.1% |
| Spaniard | 78 | 0.6% |
| Spanish | 130 | 1.0% |
| Subsaharan African | 18 | 0.1% |
| Swedish | 62 | 0.5% |
| Swiss | 21 | 0.2% |
| Syrian | 60 | 0.5% |
| Thai | 134 | 1.1% |
| Turkish | 83 | 0.7% |
| Ukrainian | 89 | 0.7% |
| Vietnamese | 59 | 0.5% |
| Welsh | 53 | 0.4% | View All 62 Rows |
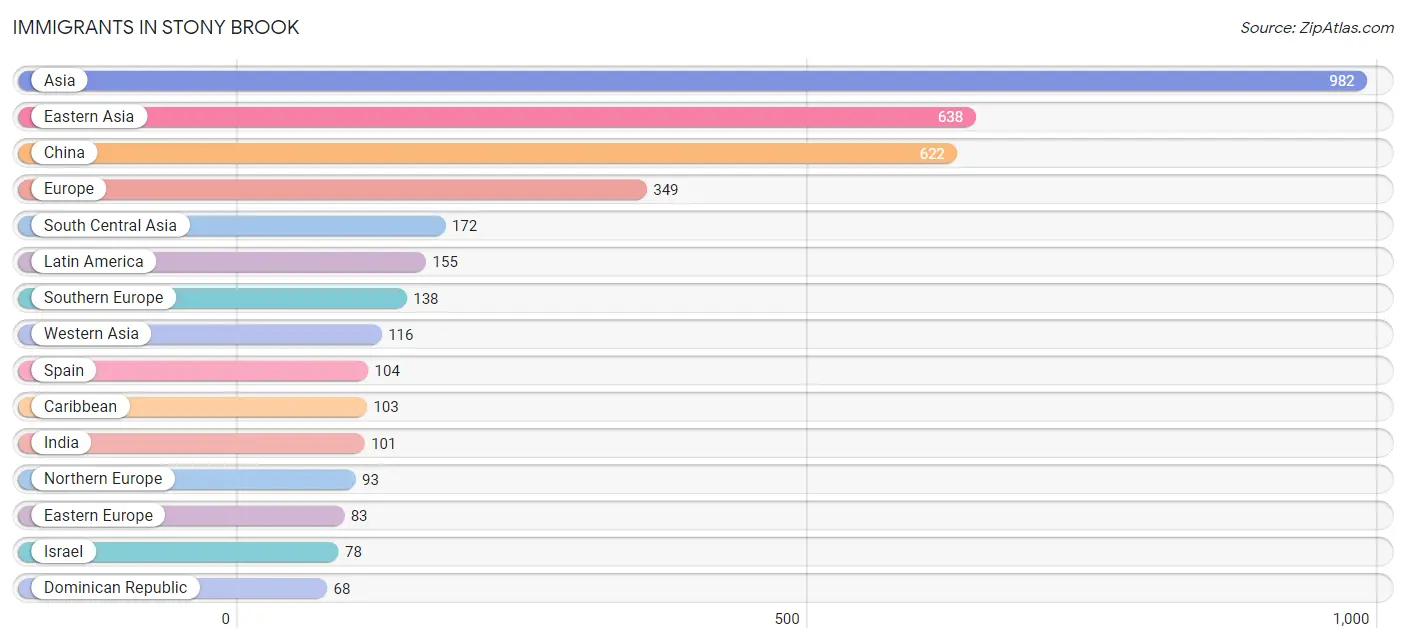
Immigrants in Stony Brook
The most numerous immigrant groups reported in Stony Brook came from Asia (982 | 7.9%), Eastern Asia (638 | 5.1%), China (622 | 5.0%), Europe (349 | 2.8%), and South Central Asia (172 | 1.4%), together accounting for 22.1% of all Stony Brook residents.
| Immigration Origin | # Population | % Population |
| Africa | 18 | 0.1% |
| Asia | 982 | 7.9% |
| Bangladesh | 59 | 0.5% |
| Belize | 2 | 0.0% |
| Canada | 47 | 0.4% |
| Caribbean | 103 | 0.8% |
| Central America | 16 | 0.1% |
| China | 622 | 5.0% |
| Colombia | 35 | 0.3% |
| Cuba | 35 | 0.3% |
| Dominican Republic | 68 | 0.5% |
| Eastern Asia | 638 | 5.1% |
| Eastern Europe | 83 | 0.7% |
| El Salvador | 14 | 0.1% |
| Europe | 349 | 2.8% |
| Germany | 31 | 0.3% |
| Greece | 4 | 0.0% |
| Guyana | 1 | 0.0% |
| Hong Kong | 17 | 0.1% |
| Hungary | 3 | 0.0% |
| India | 101 | 0.8% |
| Israel | 78 | 0.6% |
| Italy | 30 | 0.2% |
| Korea | 16 | 0.1% |
| Latin America | 155 | 1.2% |
| Lithuania | 51 | 0.4% |
| Netherlands | 4 | 0.0% |
| Northern Europe | 93 | 0.7% |
| Pakistan | 12 | 0.1% |
| Poland | 8 | 0.1% |
| Russia | 21 | 0.2% |
| South Africa | 18 | 0.1% |
| South America | 36 | 0.3% |
| South Central Asia | 172 | 1.4% |
| South Eastern Asia | 56 | 0.4% |
| Southern Europe | 138 | 1.1% |
| Spain | 104 | 0.8% |
| Sweden | 6 | 0.1% |
| Syria | 10 | 0.1% |
| Taiwan | 38 | 0.3% |
| Turkey | 28 | 0.2% |
| Western Asia | 116 | 0.9% |
| Western Europe | 35 | 0.3% | View All 43 Rows |
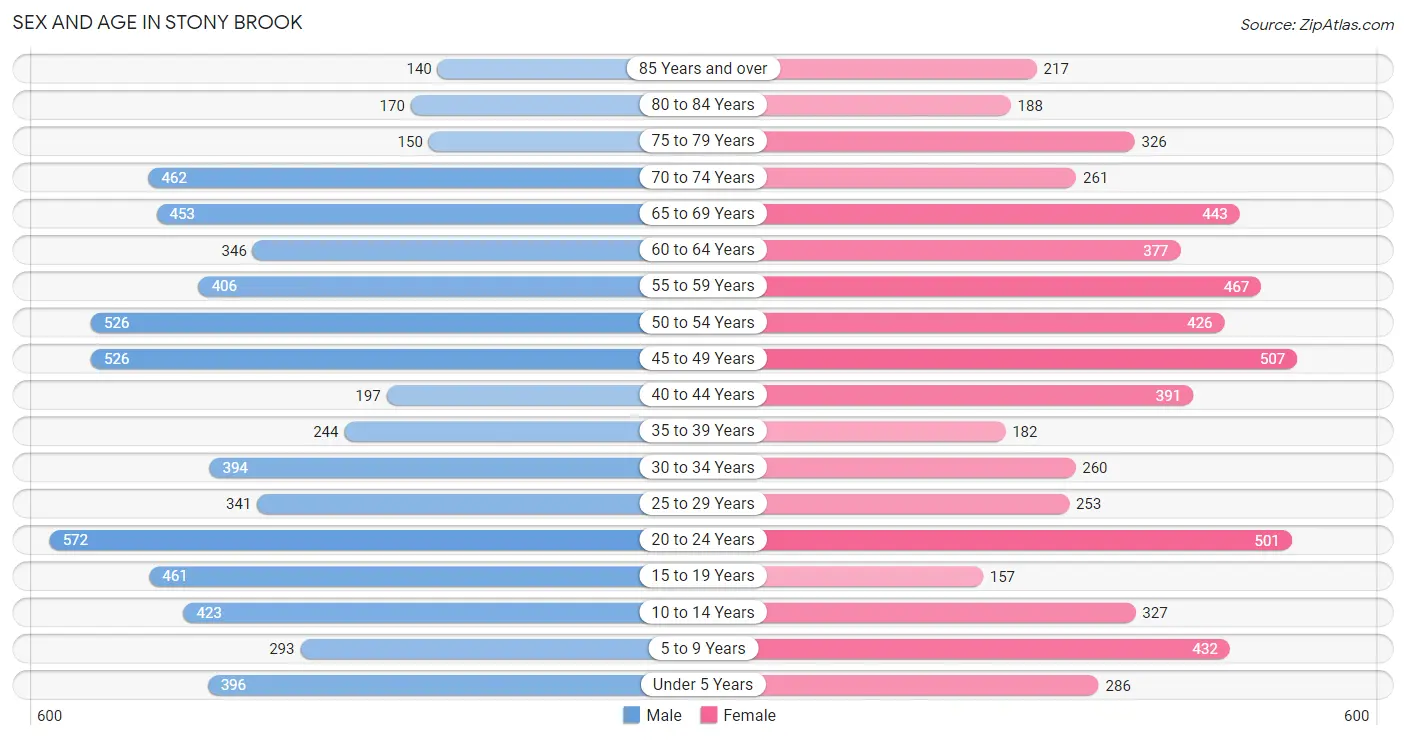
Sex and Age in Stony Brook
Sex and Age in Stony Brook
The most populous age groups in Stony Brook are 20 to 24 Years (572 | 8.8%) for men and 45 to 49 Years (507 | 8.5%) for women.
| Age Bracket | Male | Female |
| Under 5 Years | 396 (6.1%) | 286 (4.8%) |
| 5 to 9 Years | 293 (4.5%) | 432 (7.2%) |
| 10 to 14 Years | 423 (6.5%) | 327 (5.4%) |
| 15 to 19 Years | 461 (7.1%) | 157 (2.6%) |
| 20 to 24 Years | 572 (8.8%) | 501 (8.4%) |
| 25 to 29 Years | 341 (5.2%) | 253 (4.2%) |
| 30 to 34 Years | 394 (6.1%) | 260 (4.3%) |
| 35 to 39 Years | 244 (3.7%) | 182 (3.0%) |
| 40 to 44 Years | 197 (3.0%) | 391 (6.5%) |
| 45 to 49 Years | 526 (8.1%) | 507 (8.5%) |
| 50 to 54 Years | 526 (8.1%) | 426 (7.1%) |
| 55 to 59 Years | 406 (6.2%) | 467 (7.8%) |
| 60 to 64 Years | 346 (5.3%) | 377 (6.3%) |
| 65 to 69 Years | 453 (7.0%) | 443 (7.4%) |
| 70 to 74 Years | 462 (7.1%) | 261 (4.3%) |
| 75 to 79 Years | 150 (2.3%) | 326 (5.4%) |
| 80 to 84 Years | 170 (2.6%) | 188 (3.1%) |
| 85 Years and over | 140 (2.1%) | 217 (3.6%) |
| Total | 6,500 (100.0%) | 6,001 (100.0%) |
Families and Households in Stony Brook
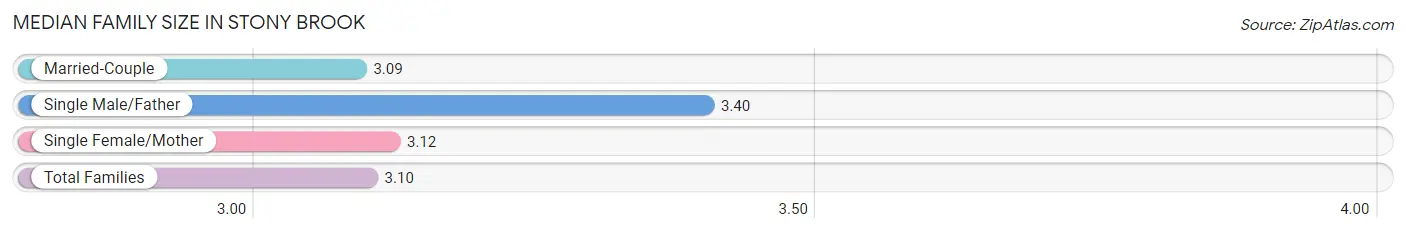
Median Family Size in Stony Brook
The median family size in Stony Brook is 3.10 persons per family, with single male/father families (67 | 2.0%) accounting for the largest median family size of 3.4 persons per family. On the other hand, married-couple families (2,939 | 87.0%) represent the smallest median family size with 3.09 persons per family.
| Family Type | # Families | Family Size |
| Married-Couple | 2,939 (87.0%) | 3.09 |
| Single Male/Father | 67 (2.0%) | 3.40 |
| Single Female/Mother | 372 (11.0%) | 3.12 |
| Total Families | 3,378 (100.0%) | 3.10 |
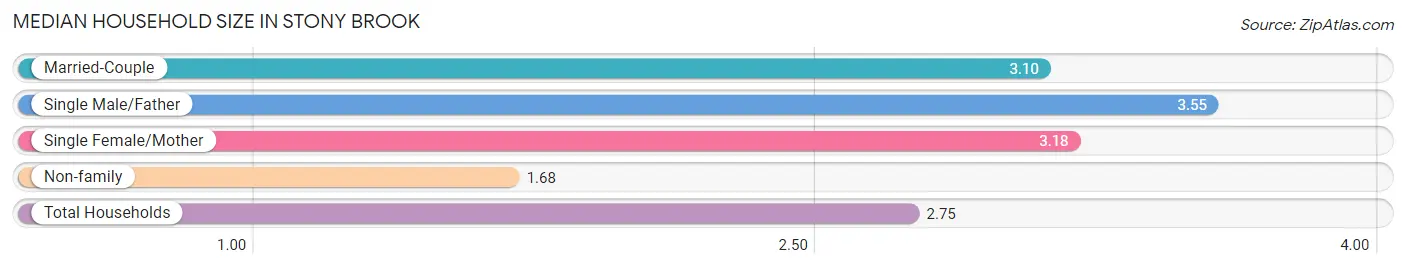
Median Household Size in Stony Brook
The median household size in Stony Brook is 2.75 persons per household, with single male/father households (67 | 1.5%) accounting for the largest median household size of 3.55 persons per household. non-family households (1,145 | 25.3%) represent the smallest median household size with 1.68 persons per household.
| Household Type | # Households | Household Size |
| Married-Couple | 2,939 (65.0%) | 3.10 |
| Single Male/Father | 67 (1.5%) | 3.55 |
| Single Female/Mother | 372 (8.2%) | 3.18 |
| Non-family | 1,145 (25.3%) | 1.68 |
| Total Households | 4,523 (100.0%) | 2.75 |
Household Size by Marriage Status in Stony Brook
Out of a total of 4,523 households in Stony Brook, 3,378 (74.7%) are family households, while 1,145 (25.3%) are nonfamily households. The most numerous type of family households are 2-person households, comprising 1,372, and the most common type of nonfamily households are 1-person households, comprising 864.
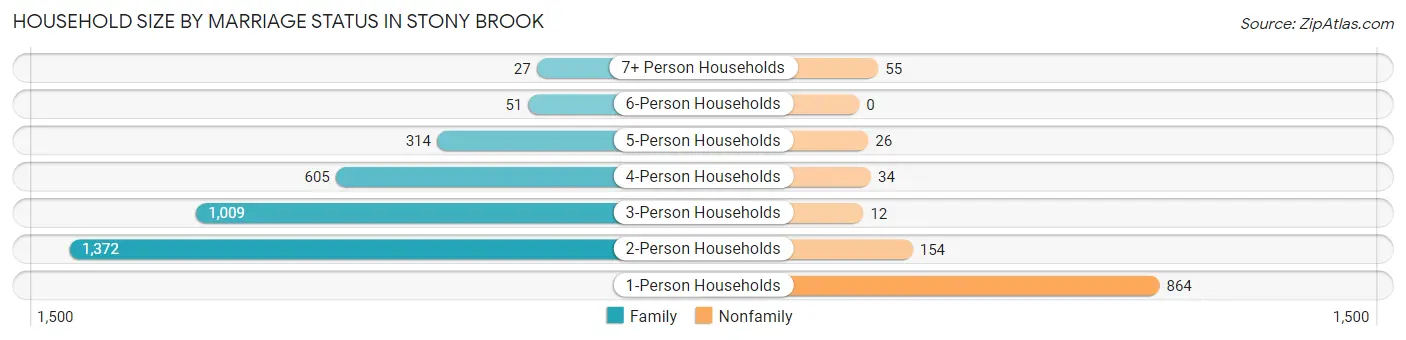
| Household Size | Family Households | Nonfamily Households |
| 1-Person Households | - | 864 (19.1%) |
| 2-Person Households | 1,372 (30.3%) | 154 (3.4%) |
| 3-Person Households | 1,009 (22.3%) | 12 (0.3%) |
| 4-Person Households | 605 (13.4%) | 34 (0.7%) |
| 5-Person Households | 314 (6.9%) | 26 (0.6%) |
| 6-Person Households | 51 (1.1%) | 0 (0.0%) |
| 7+ Person Households | 27 (0.6%) | 55 (1.2%) |
| Total | 3,378 (74.7%) | 1,145 (25.3%) |
Female Fertility in Stony Brook
Fertility by Age in Stony Brook
Average fertility rate in Stony Brook is 53.0 births per 1,000 women. Women in the age bracket of 20 to 34 years have the highest fertility rate with 76.0 births per 1,000 women. Women in the age bracket of 20 to 34 years acount for 60.2% of all women with births.
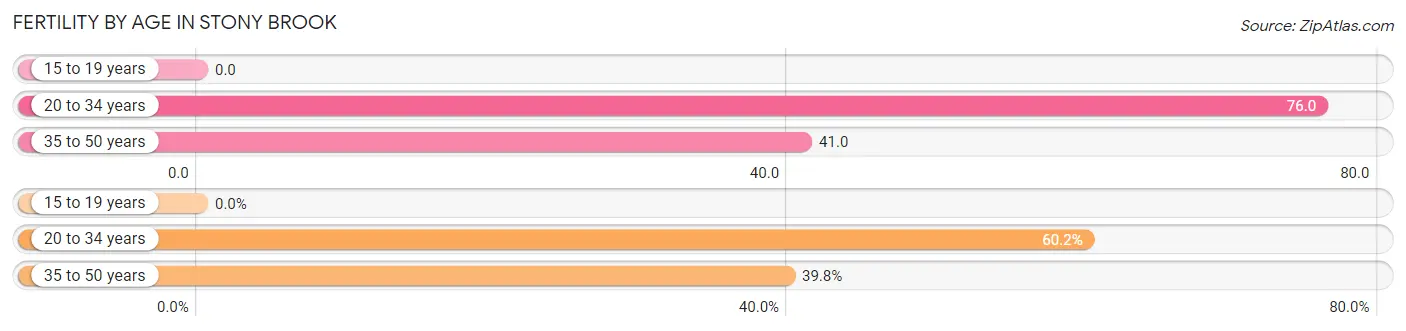
| Age Bracket | Women with Births | Births / 1,000 Women |
| 15 to 19 years | 0 (0.0%) | 0.0 |
| 20 to 34 years | 77 (60.2%) | 76.0 |
| 35 to 50 years | 51 (39.8%) | 41.0 |
| Total | 128 (100.0%) | 53.0 |
Fertility by Age by Marriage Status in Stony Brook
89.8% of women with births (128) in Stony Brook are married. The highest percentage of unmarried women with births falls into 20 to 34 years age bracket with 16.9% of them unmarried at the time of birth, while the lowest percentage of unmarried women with births belong to 35 to 50 years age bracket with 0.0% of them unmarried.
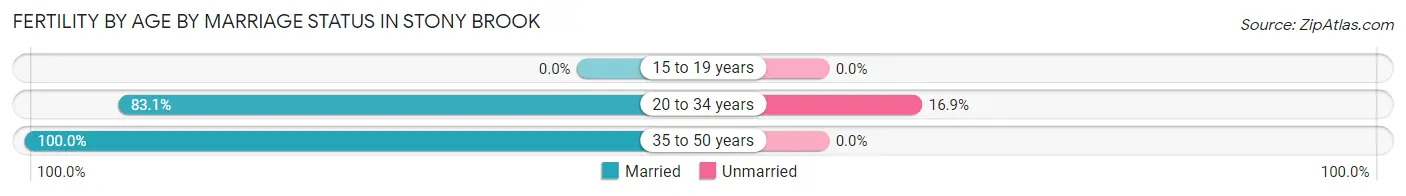
| Age Bracket | Married | Unmarried |
| 15 to 19 years | 0 (0.0%) | 0 (0.0%) |
| 20 to 34 years | 64 (83.1%) | 13 (16.9%) |
| 35 to 50 years | 51 (100.0%) | 0 (0.0%) |
| Total | 115 (89.8%) | 13 (10.2%) |
Fertility by Education in Stony Brook
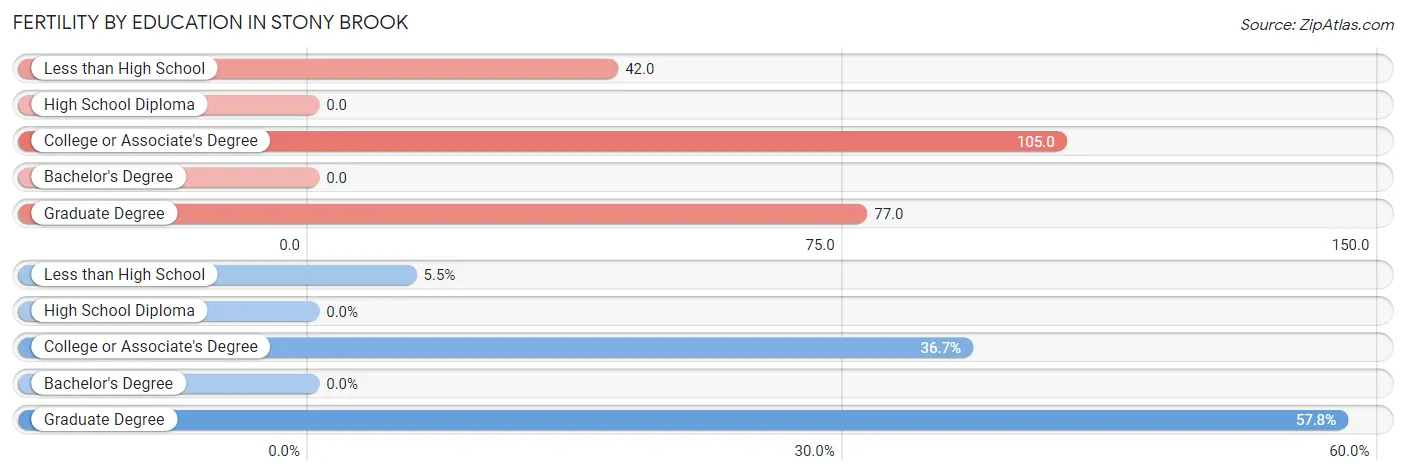
| Educational Attainment | Women with Births | Births / 1,000 Women |
| Less than High School | 7 (5.5%) | 42.0 |
| High School Diploma | 0 (0.0%) | 0.0 |
| College or Associate's Degree | 47 (36.7%) | 105.0 |
| Bachelor's Degree | 0 (0.0%) | 0.0 |
| Graduate Degree | 74 (57.8%) | 77.0 |
| Total | 128 (100.0%) | 53.0 |
Fertility by Education by Marriage Status in Stony Brook
10.2% of women with births in Stony Brook are unmarried. Women with the educational attainment of less than high school are most likely to be married with 100.0% of them married at childbirth, while women with the educational attainment of college or associate's degree are least likely to be married with 27.7% of them unmarried at childbirth.
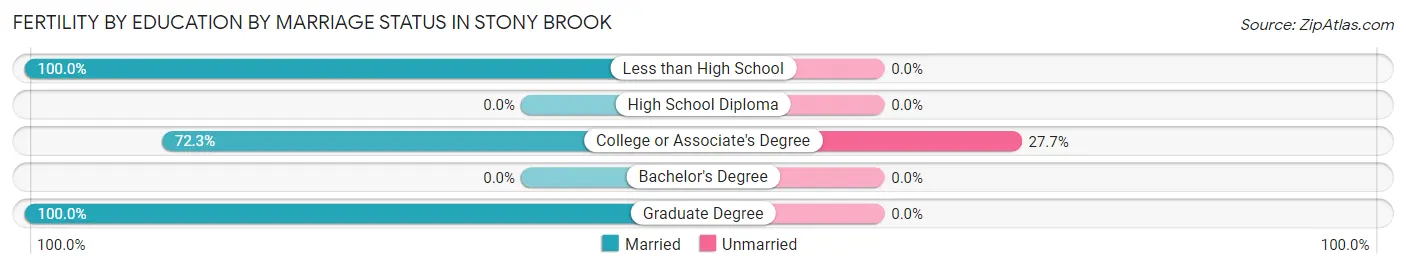
| Educational Attainment | Married | Unmarried |
| Less than High School | 7 (100.0%) | 0 (0.0%) |
| High School Diploma | 0 (0.0%) | 0 (0.0%) |
| College or Associate's Degree | 34 (72.3%) | 13 (27.7%) |
| Bachelor's Degree | 0 (0.0%) | 0 (0.0%) |
| Graduate Degree | 74 (100.0%) | 0 (0.0%) |
| Total | 115 (89.8%) | 13 (10.2%) |
Employment Characteristics in Stony Brook
Employment by Class of Employer in Stony Brook
Among the 6,201 employed individuals in Stony Brook, private company employees (3,109 | 50.1%), local government employees (776 | 12.5%), and not-for-profit organizations (759 | 12.2%) make up the most common classes of employment.
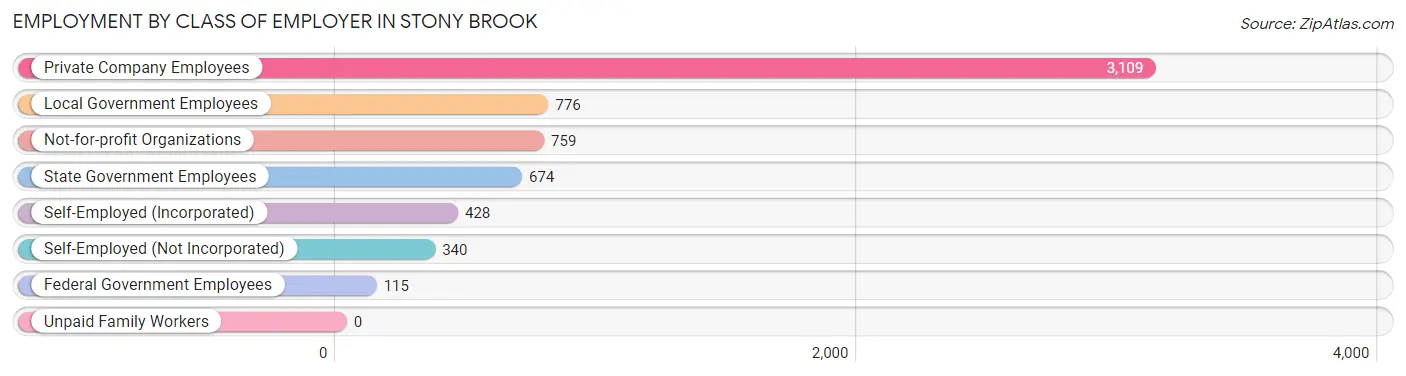
| Employer Class | # Employees | % Employees |
| Private Company Employees | 3,109 | 50.1% |
| Self-Employed (Incorporated) | 428 | 6.9% |
| Self-Employed (Not Incorporated) | 340 | 5.5% |
| Not-for-profit Organizations | 759 | 12.2% |
| Local Government Employees | 776 | 12.5% |
| State Government Employees | 674 | 10.9% |
| Federal Government Employees | 115 | 1.8% |
| Unpaid Family Workers | 0 | 0.0% |
| Total | 6,201 | 100.0% |
Employment Status by Age in Stony Brook
According to the labor force statistics for Stony Brook, out of the total population over 16 years of age (10,118), 64.2% or 6,496 individuals are in the labor force, with 3.7% or 240 of them unemployed. The age group with the highest labor force participation rate is 30 to 34 years, with 94.5% or 618 individuals in the labor force. Within the labor force, the 30 to 34 years age range has the highest percentage of unemployed individuals, with 22.2% or 137 of them being unemployed.
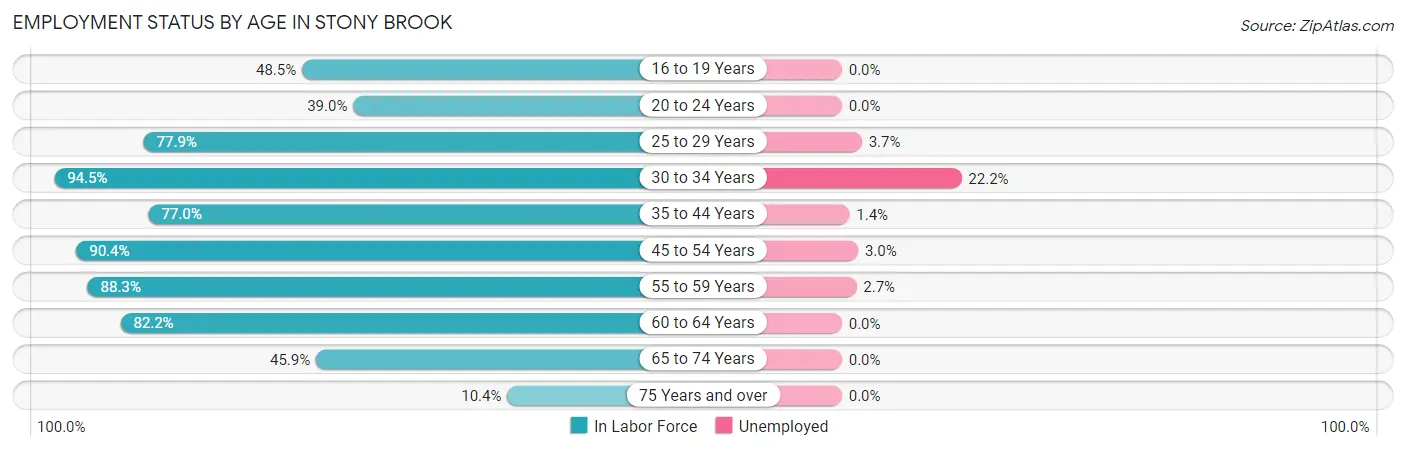
| Age Bracket | In Labor Force | Unemployed |
| 16 to 19 Years | 190 (48.5%) | 0 (0.0%) |
| 20 to 24 Years | 418 (39.0%) | 0 (0.0%) |
| 25 to 29 Years | 463 (77.9%) | 17 (3.7%) |
| 30 to 34 Years | 618 (94.5%) | 137 (22.2%) |
| 35 to 44 Years | 781 (77.0%) | 11 (1.4%) |
| 45 to 54 Years | 1,794 (90.4%) | 54 (3.0%) |
| 55 to 59 Years | 771 (88.3%) | 21 (2.7%) |
| 60 to 64 Years | 594 (82.2%) | 0 (0.0%) |
| 65 to 74 Years | 743 (45.9%) | 0 (0.0%) |
| 75 Years and over | 124 (10.4%) | 0 (0.0%) |
| Total | 6,496 (64.2%) | 240 (3.7%) |
Employment Status by Educational Attainment in Stony Brook
According to labor force statistics for Stony Brook, 85.9% of individuals (5,019) out of the total population between 25 and 64 years of age (5,843) are in the labor force, with 4.8% or 241 of them being unemployed. The group with the highest labor force participation rate are those with the educational attainment of college / associate degree, with 87.4% or 815 individuals in the labor force. Within the labor force, individuals with high school diploma education have the highest percentage of unemployment, with 10.6% or 54 of them being unemployed.
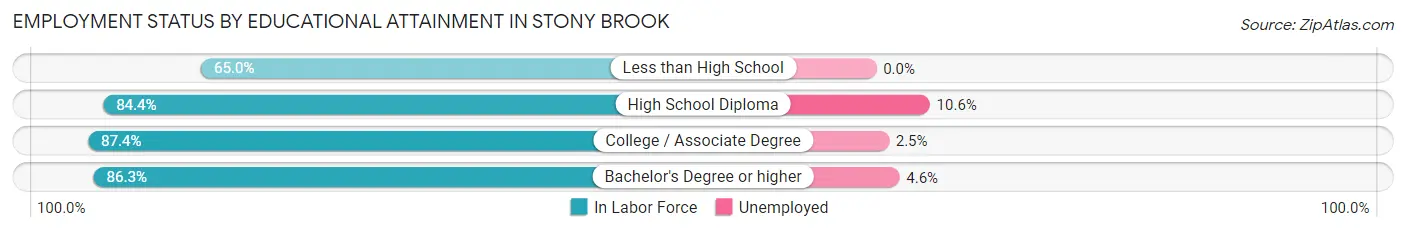
| Educational Attainment | In Labor Force | Unemployed |
| Less than High School | 65 (65.0%) | 0 (0.0%) |
| High School Diploma | 508 (84.4%) | 64 (10.6%) |
| College / Associate Degree | 815 (87.4%) | 23 (2.5%) |
| Bachelor's Degree or higher | 3,632 (86.3%) | 194 (4.6%) |
| Total | 5,019 (85.9%) | 280 (4.8%) |
Employment Occupations by Sex in Stony Brook
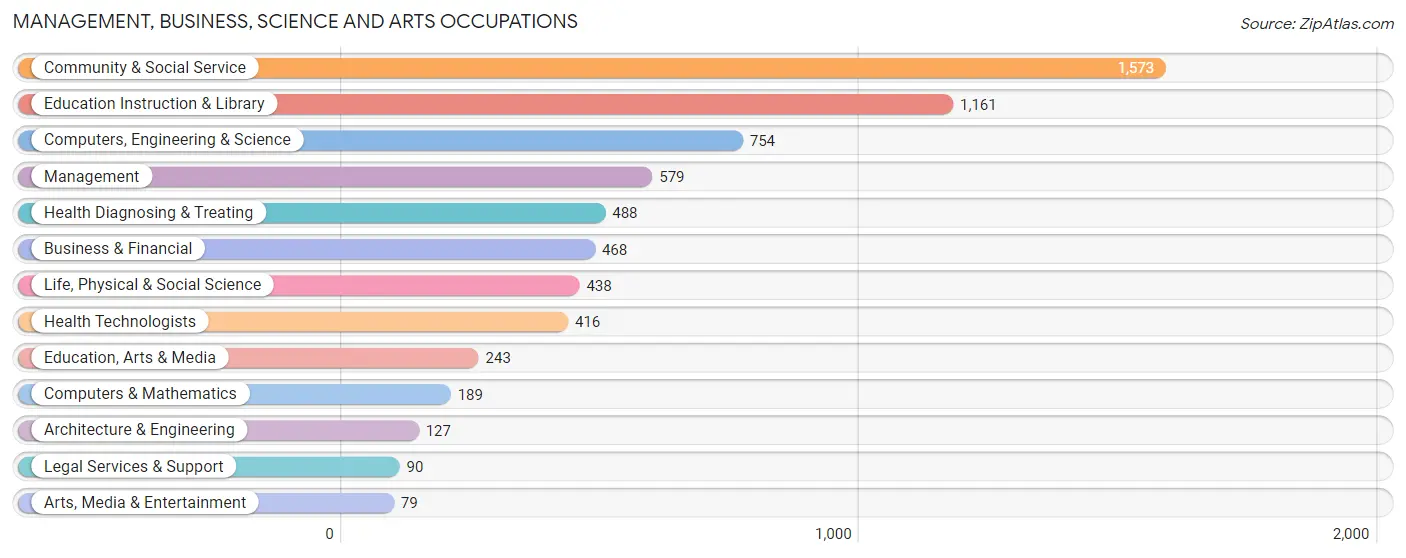
Management, Business, Science and Arts Occupations
The most common Management, Business, Science and Arts occupations in Stony Brook are Community & Social Service (1,573 | 25.3%), Education Instruction & Library (1,161 | 18.6%), Computers, Engineering & Science (754 | 12.1%), Management (579 | 9.3%), and Health Diagnosing & Treating (488 | 7.8%).
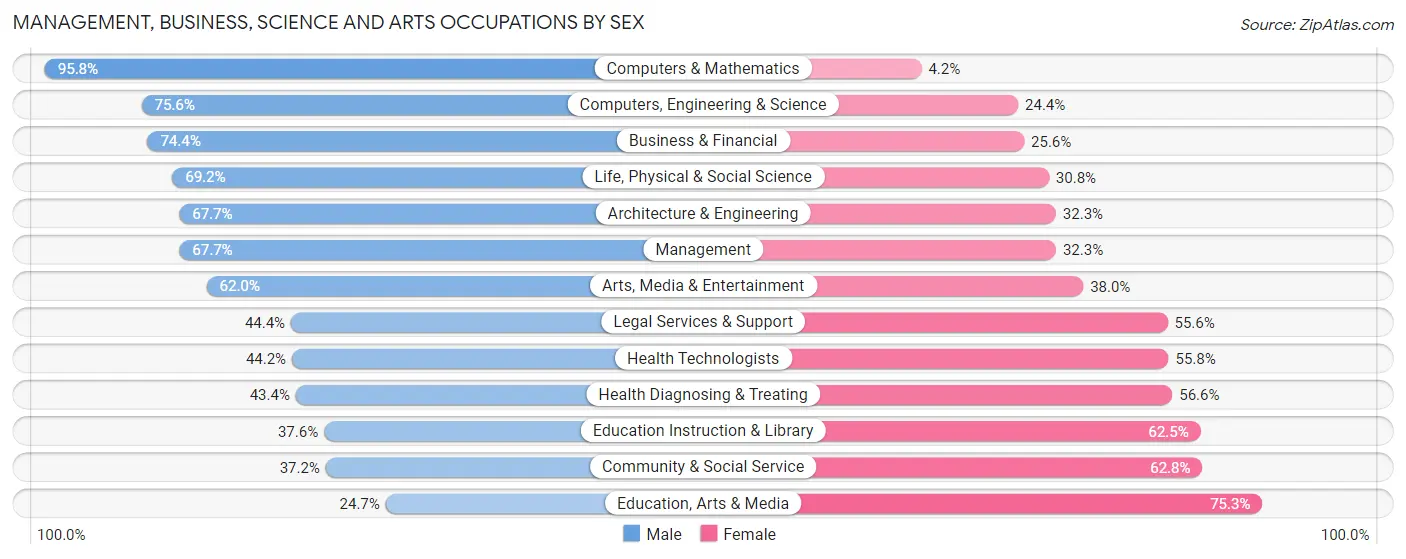
Management, Business, Science and Arts Occupations by Sex
Within the Management, Business, Science and Arts occupations in Stony Brook, the most male-oriented occupations are Computers & Mathematics (95.8%), Computers, Engineering & Science (75.6%), and Business & Financial (74.4%), while the most female-oriented occupations are Education, Arts & Media (75.3%), Community & Social Service (62.8%), and Education Instruction & Library (62.5%).
| Occupation | Male | Female |
| Management | 392 (67.7%) | 187 (32.3%) |
| Business & Financial | 348 (74.4%) | 120 (25.6%) |
| Computers, Engineering & Science | 570 (75.6%) | 184 (24.4%) |
| Computers & Mathematics | 181 (95.8%) | 8 (4.2%) |
| Architecture & Engineering | 86 (67.7%) | 41 (32.3%) |
| Life, Physical & Social Science | 303 (69.2%) | 135 (30.8%) |
| Community & Social Service | 585 (37.2%) | 988 (62.8%) |
| Education, Arts & Media | 60 (24.7%) | 183 (75.3%) |
| Legal Services & Support | 40 (44.4%) | 50 (55.6%) |
| Education Instruction & Library | 436 (37.6%) | 725 (62.5%) |
| Arts, Media & Entertainment | 49 (62.0%) | 30 (38.0%) |
| Health Diagnosing & Treating | 212 (43.4%) | 276 (56.6%) |
| Health Technologists | 184 (44.2%) | 232 (55.8%) |
| Total (Category) | 2,107 (54.6%) | 1,755 (45.4%) |
| Total (Overall) | 3,481 (55.9%) | 2,747 (44.1%) |
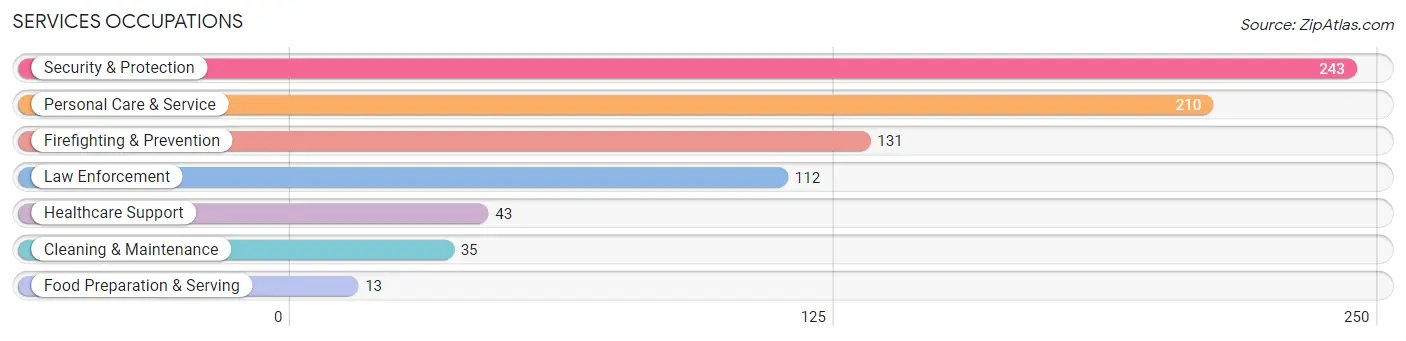
Services Occupations
The most common Services occupations in Stony Brook are Security & Protection (243 | 3.9%), Personal Care & Service (210 | 3.4%), Firefighting & Prevention (131 | 2.1%), Law Enforcement (112 | 1.8%), and Healthcare Support (43 | 0.7%).
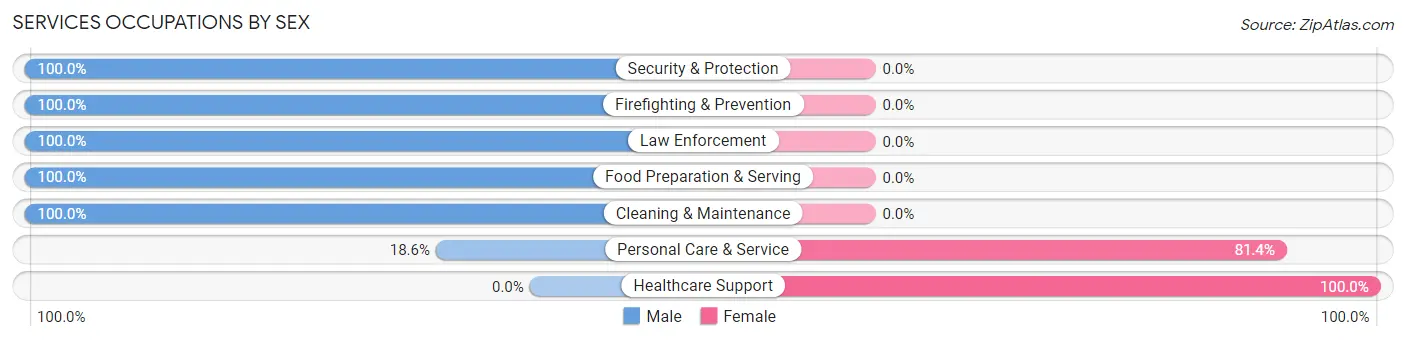
Services Occupations by Sex
Within the Services occupations in Stony Brook, the most male-oriented occupations are Security & Protection (100.0%), Firefighting & Prevention (100.0%), and Law Enforcement (100.0%), while the most female-oriented occupations are Healthcare Support (100.0%), and Personal Care & Service (81.4%).
| Occupation | Male | Female |
| Healthcare Support | 0 (0.0%) | 43 (100.0%) |
| Security & Protection | 243 (100.0%) | 0 (0.0%) |
| Firefighting & Prevention | 131 (100.0%) | 0 (0.0%) |
| Law Enforcement | 112 (100.0%) | 0 (0.0%) |
| Food Preparation & Serving | 13 (100.0%) | 0 (0.0%) |
| Cleaning & Maintenance | 35 (100.0%) | 0 (0.0%) |
| Personal Care & Service | 39 (18.6%) | 171 (81.4%) |
| Total (Category) | 330 (60.7%) | 214 (39.3%) |
| Total (Overall) | 3,481 (55.9%) | 2,747 (44.1%) |
Sales and Office Occupations
The most common Sales and Office occupations in Stony Brook are Sales & Related (634 | 10.2%), and Office & Administration (588 | 9.4%).
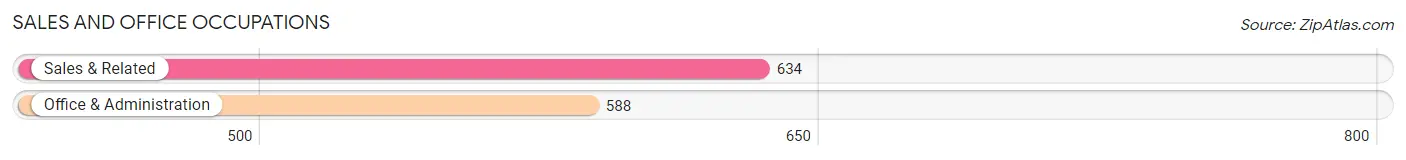
Sales and Office Occupations by Sex
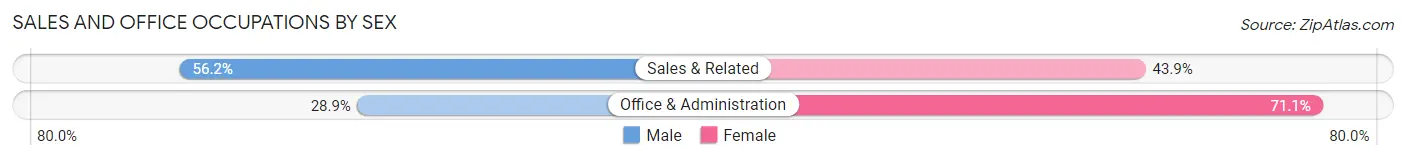
| Occupation | Male | Female |
| Sales & Related | 356 (56.1%) | 278 (43.9%) |
| Office & Administration | 170 (28.9%) | 418 (71.1%) |
| Total (Category) | 526 (43.0%) | 696 (57.0%) |
| Total (Overall) | 3,481 (55.9%) | 2,747 (44.1%) |
Natural Resources, Construction and Maintenance Occupations
The most common Natural Resources, Construction and Maintenance occupations in Stony Brook are Construction & Extraction (324 | 5.2%), and Installation, Maintenance & Repair (91 | 1.5%).
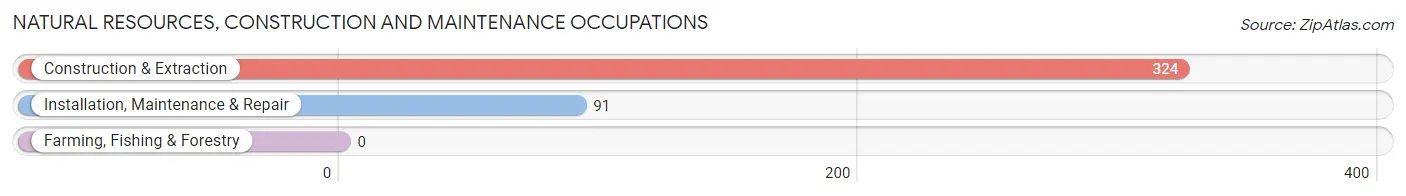
Natural Resources, Construction and Maintenance Occupations by Sex
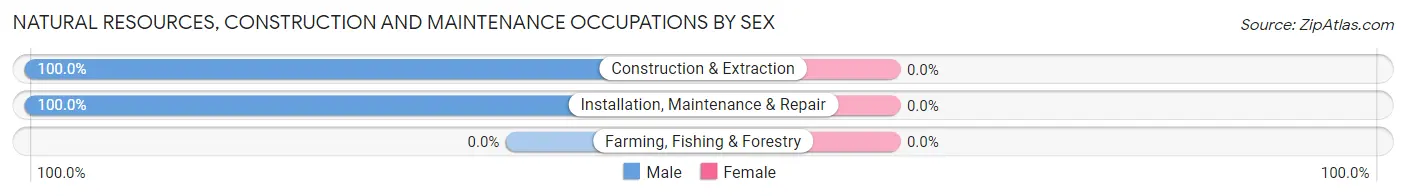
| Occupation | Male | Female |
| Farming, Fishing & Forestry | 0 (0.0%) | 0 (0.0%) |
| Construction & Extraction | 324 (100.0%) | 0 (0.0%) |
| Installation, Maintenance & Repair | 91 (100.0%) | 0 (0.0%) |
| Total (Category) | 415 (100.0%) | 0 (0.0%) |
| Total (Overall) | 3,481 (55.9%) | 2,747 (44.1%) |
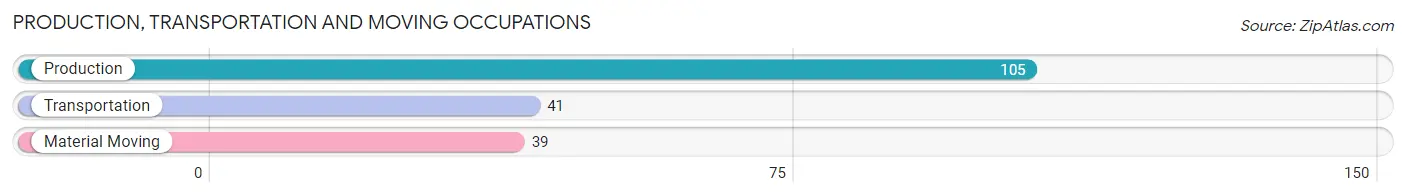
Production, Transportation and Moving Occupations
The most common Production, Transportation and Moving occupations in Stony Brook are Production (105 | 1.7%), Transportation (41 | 0.7%), and Material Moving (39 | 0.6%).
Production, Transportation and Moving Occupations by Sex
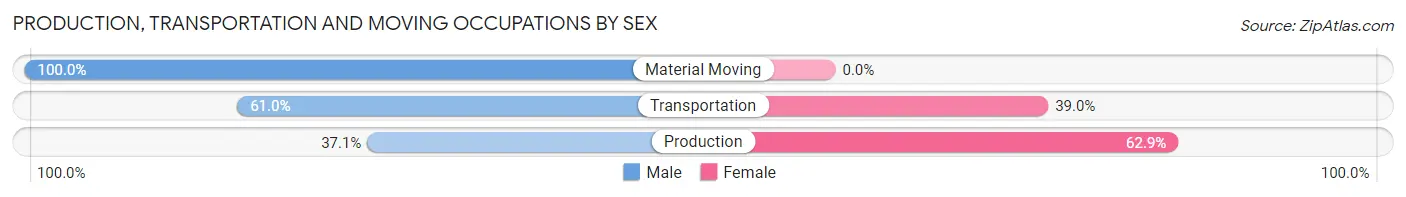
| Occupation | Male | Female |
| Production | 39 (37.1%) | 66 (62.9%) |
| Transportation | 25 (61.0%) | 16 (39.0%) |
| Material Moving | 39 (100.0%) | 0 (0.0%) |
| Total (Category) | 103 (55.7%) | 82 (44.3%) |
| Total (Overall) | 3,481 (55.9%) | 2,747 (44.1%) |
Employment Industries by Sex in Stony Brook
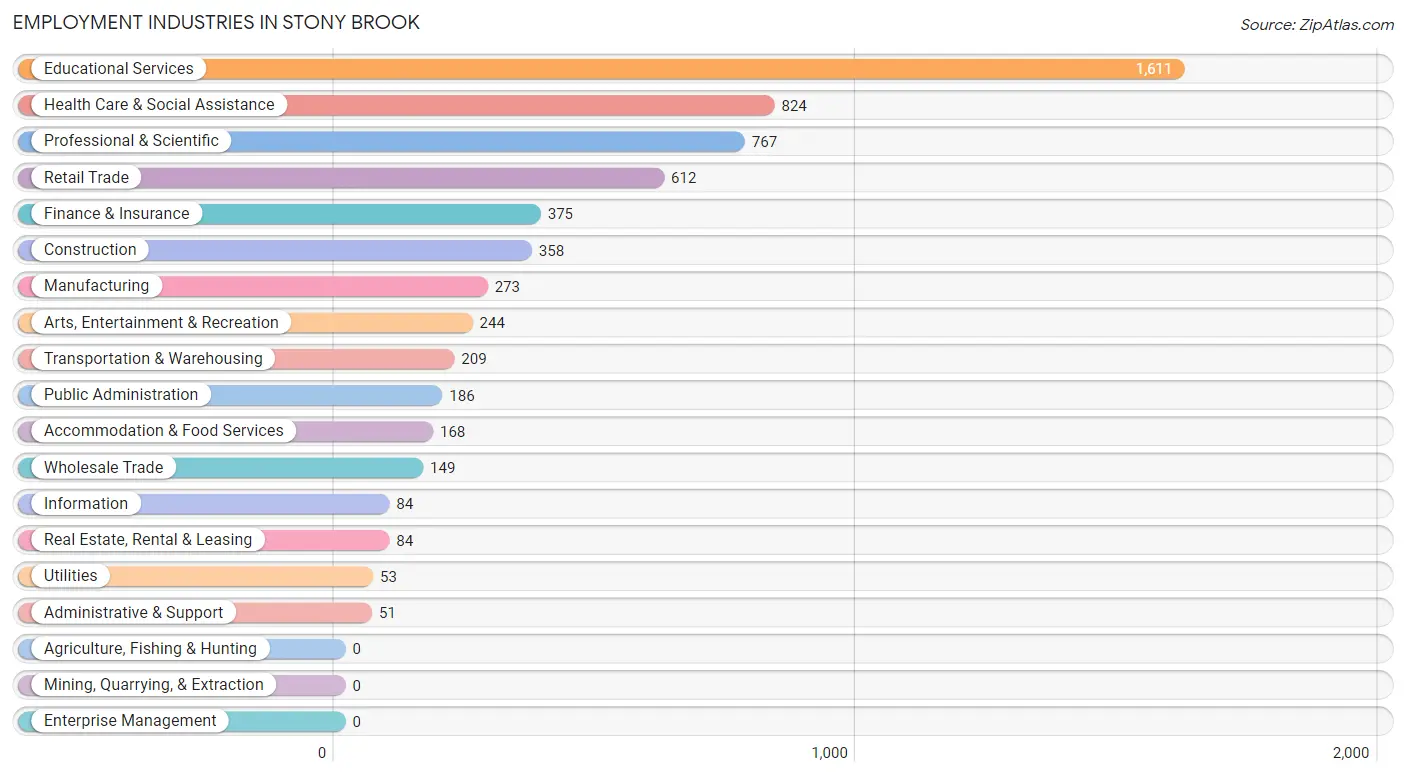
Employment Industries in Stony Brook
The major employment industries in Stony Brook include Educational Services (1,611 | 25.9%), Health Care & Social Assistance (824 | 13.2%), Professional & Scientific (767 | 12.3%), Retail Trade (612 | 9.8%), and Finance & Insurance (375 | 6.0%).
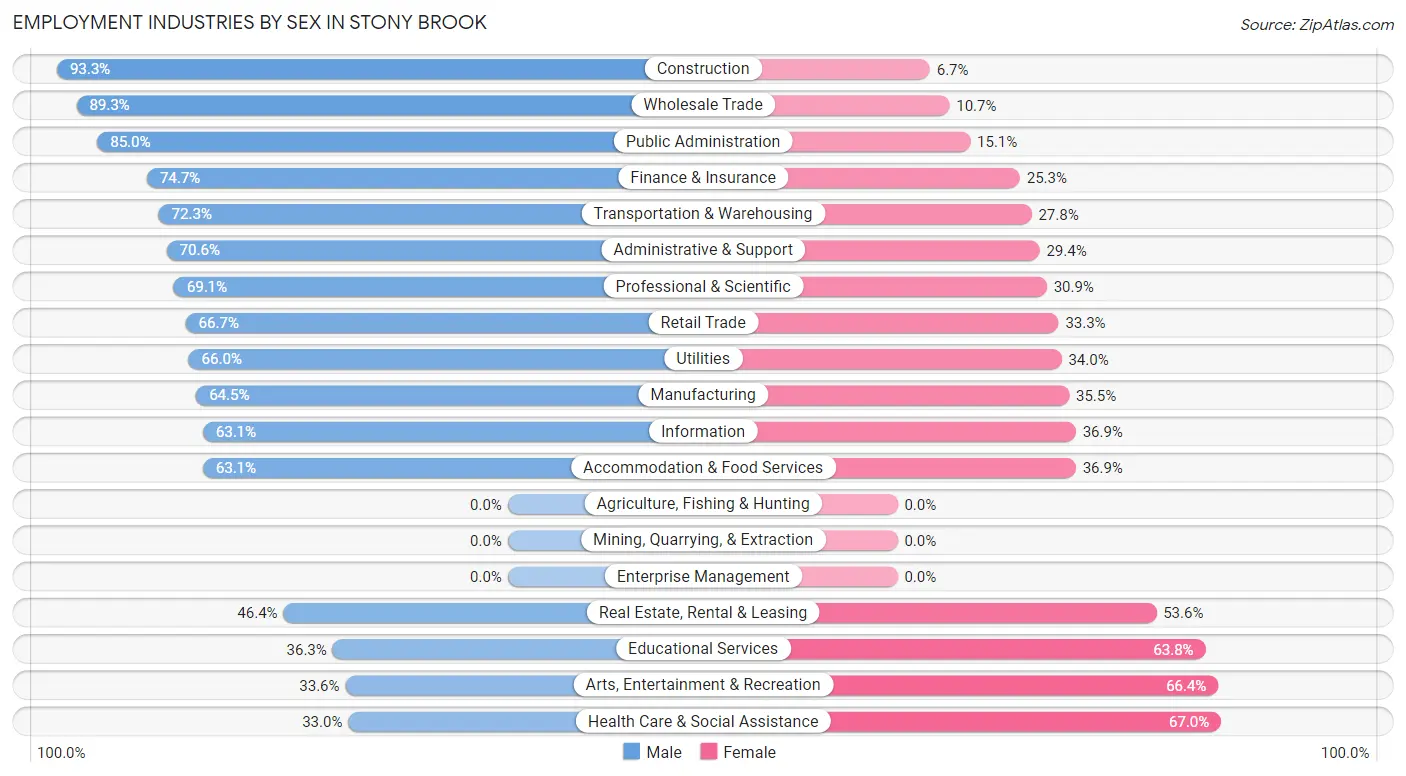
Employment Industries by Sex in Stony Brook
The Stony Brook industries that see more men than women are Construction (93.3%), Wholesale Trade (89.3%), and Public Administration (85.0%), whereas the industries that tend to have a higher number of women are Health Care & Social Assistance (67.0%), Arts, Entertainment & Recreation (66.4%), and Educational Services (63.7%).
| Industry | Male | Female |
| Agriculture, Fishing & Hunting | 0 (0.0%) | 0 (0.0%) |
| Mining, Quarrying, & Extraction | 0 (0.0%) | 0 (0.0%) |
| Construction | 334 (93.3%) | 24 (6.7%) |
| Manufacturing | 176 (64.5%) | 97 (35.5%) |
| Wholesale Trade | 133 (89.3%) | 16 (10.7%) |
| Retail Trade | 408 (66.7%) | 204 (33.3%) |
| Transportation & Warehousing | 151 (72.3%) | 58 (27.8%) |
| Utilities | 35 (66.0%) | 18 (34.0%) |
| Information | 53 (63.1%) | 31 (36.9%) |
| Finance & Insurance | 280 (74.7%) | 95 (25.3%) |
| Real Estate, Rental & Leasing | 39 (46.4%) | 45 (53.6%) |
| Professional & Scientific | 530 (69.1%) | 237 (30.9%) |
| Enterprise Management | 0 (0.0%) | 0 (0.0%) |
| Administrative & Support | 36 (70.6%) | 15 (29.4%) |
| Educational Services | 584 (36.2%) | 1,027 (63.7%) |
| Health Care & Social Assistance | 272 (33.0%) | 552 (67.0%) |
| Arts, Entertainment & Recreation | 82 (33.6%) | 162 (66.4%) |
| Accommodation & Food Services | 106 (63.1%) | 62 (36.9%) |
| Public Administration | 158 (85.0%) | 28 (15.0%) |
| Total | 3,481 (55.9%) | 2,747 (44.1%) |
Education in Stony Brook
School Enrollment in Stony Brook
The most common levels of schooling among the 3,320 students in Stony Brook are college / undergraduate (937 | 28.2%), high school (709 | 21.4%), and middle school (526 | 15.8%).
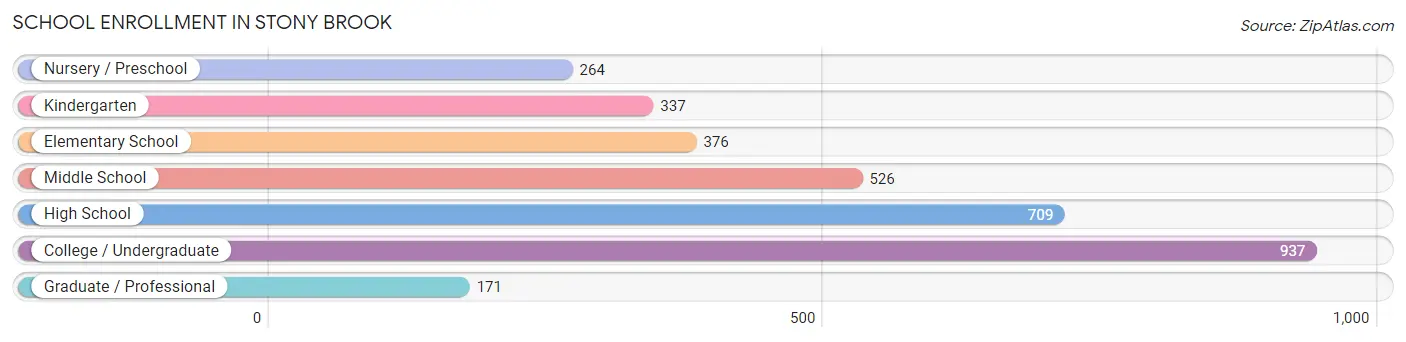
| School Level | # Students | % Students |
| Nursery / Preschool | 264 | 8.0% |
| Kindergarten | 337 | 10.2% |
| Elementary School | 376 | 11.3% |
| Middle School | 526 | 15.8% |
| High School | 709 | 21.4% |
| College / Undergraduate | 937 | 28.2% |
| Graduate / Professional | 171 | 5.1% |
| Total | 3,320 | 100.0% |
School Enrollment by Age by Funding Source in Stony Brook
Out of a total of 3,320 students who are enrolled in schools in Stony Brook, 647 (19.5%) attend a private institution, while the remaining 2,673 (80.5%) are enrolled in public schools. The age group of 3 to 4 year olds has the highest likelihood of being enrolled in private schools, with 210 (90.1% in the age bracket) enrolled. Conversely, the age group of 10 to 14 year olds has the lowest likelihood of being enrolled in a private school, with 679 (97.7% in the age bracket) attending a public institution.
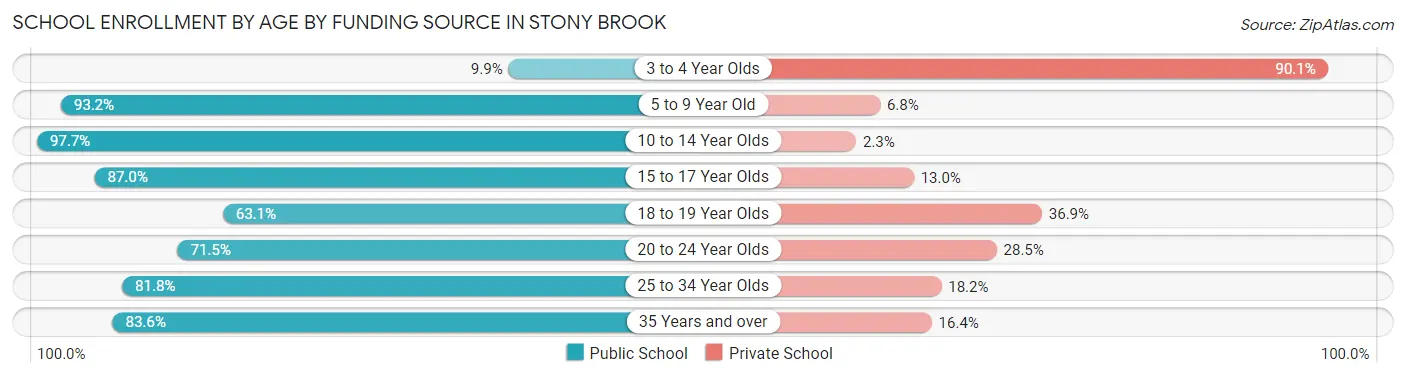
| Age Bracket | Public School | Private School |
| 3 to 4 Year Olds | 23 (9.9%) | 210 (90.1%) |
| 5 to 9 Year Old | 676 (93.2%) | 49 (6.8%) |
| 10 to 14 Year Olds | 679 (97.7%) | 16 (2.3%) |
| 15 to 17 Year Olds | 480 (87.0%) | 72 (13.0%) |
| 18 to 19 Year Olds | 41 (63.1%) | 24 (36.9%) |
| 20 to 24 Year Olds | 605 (71.5%) | 241 (28.5%) |
| 25 to 34 Year Olds | 117 (81.8%) | 26 (18.2%) |
| 35 Years and over | 51 (83.6%) | 10 (16.4%) |
| Total | 2,673 (80.5%) | 647 (19.5%) |
Educational Attainment by Field of Study in Stony Brook
Business (1,139 | 18.5%), education (1,002 | 16.3%), bio, nature & agricultural (568 | 9.2%), engineering (476 | 7.7%), and science & technology (429 | 7.0%) are the most common fields of study among 6,146 individuals in Stony Brook who have obtained a bachelor's degree or higher.
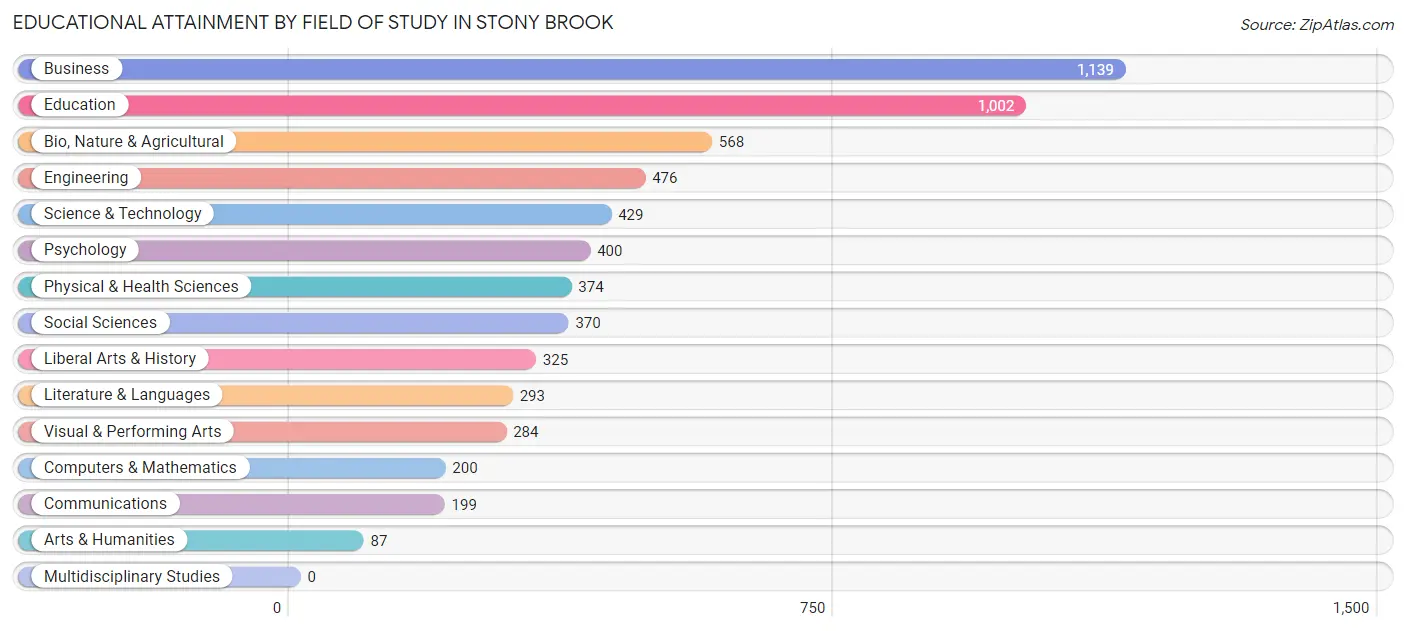
| Field of Study | # Graduates | % Graduates |
| Computers & Mathematics | 200 | 3.3% |
| Bio, Nature & Agricultural | 568 | 9.2% |
| Physical & Health Sciences | 374 | 6.1% |
| Psychology | 400 | 6.5% |
| Social Sciences | 370 | 6.0% |
| Engineering | 476 | 7.7% |
| Multidisciplinary Studies | 0 | 0.0% |
| Science & Technology | 429 | 7.0% |
| Business | 1,139 | 18.5% |
| Education | 1,002 | 16.3% |
| Literature & Languages | 293 | 4.8% |
| Liberal Arts & History | 325 | 5.3% |
| Visual & Performing Arts | 284 | 4.6% |
| Communications | 199 | 3.2% |
| Arts & Humanities | 87 | 1.4% |
| Total | 6,146 | 100.0% |
Transportation & Commute in Stony Brook
Vehicle Availability by Sex in Stony Brook
The most prevalent vehicle ownership categories in Stony Brook are males with 2 vehicles (1,802, accounting for 52.1%) and females with 2 vehicles (1,217, making up 66.2%).
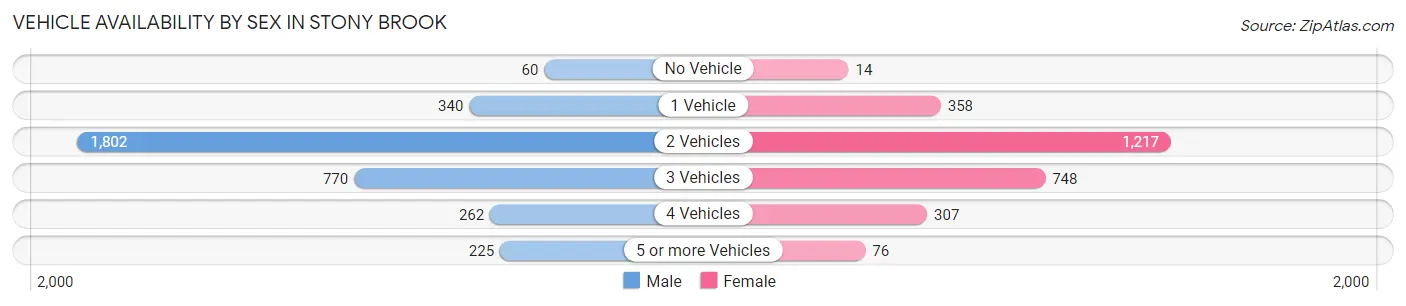
| Vehicles Available | Male | Female |
| No Vehicle | 60 (1.7%) | 14 (0.5%) |
| 1 Vehicle | 340 (9.8%) | 358 (13.2%) |
| 2 Vehicles | 1,802 (52.1%) | 1,217 (44.7%) |
| 3 Vehicles | 770 (22.3%) | 748 (27.5%) |
| 4 Vehicles | 262 (7.6%) | 307 (11.3%) |
| 5 or more Vehicles | 225 (6.5%) | 76 (2.8%) |
| Total | 3,459 (100.0%) | 2,720 (100.0%) |
Commute Time in Stony Brook
The most frequently occuring commute durations in Stony Brook are 15 to 19 minutes (910 commuters, 17.7%), 5 to 9 minutes (665 commuters, 13.0%), and 30 to 34 minutes (643 commuters, 12.5%).
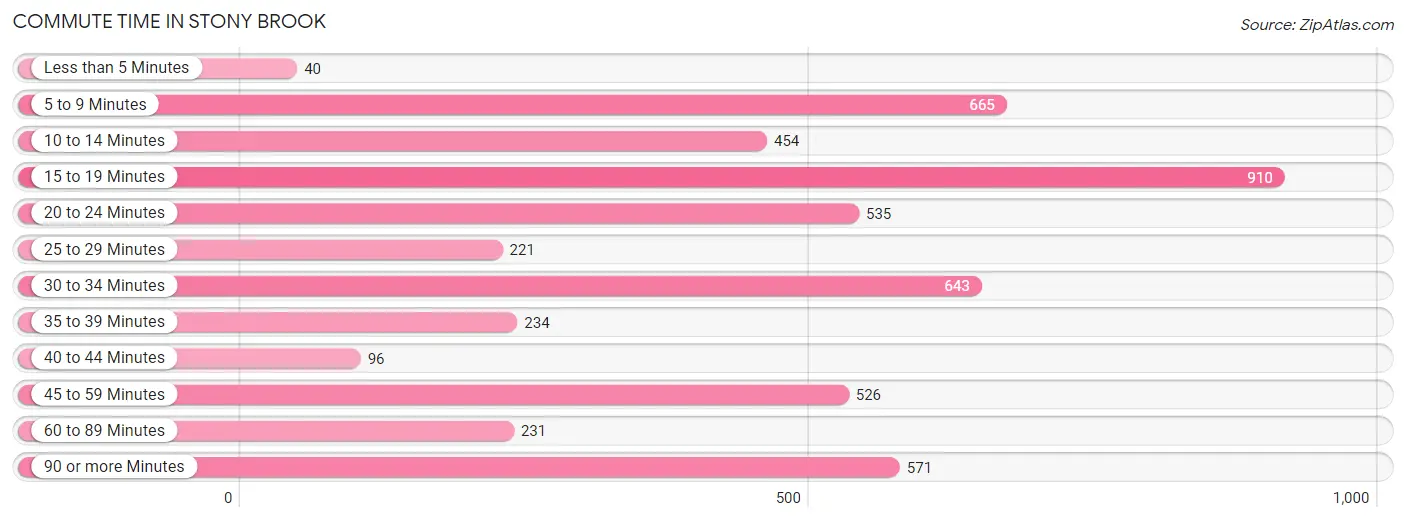
| Commute Time | # Commuters | % Commuters |
| Less than 5 Minutes | 40 | 0.8% |
| 5 to 9 Minutes | 665 | 13.0% |
| 10 to 14 Minutes | 454 | 8.9% |
| 15 to 19 Minutes | 910 | 17.7% |
| 20 to 24 Minutes | 535 | 10.4% |
| 25 to 29 Minutes | 221 | 4.3% |
| 30 to 34 Minutes | 643 | 12.5% |
| 35 to 39 Minutes | 234 | 4.6% |
| 40 to 44 Minutes | 96 | 1.9% |
| 45 to 59 Minutes | 526 | 10.3% |
| 60 to 89 Minutes | 231 | 4.5% |
| 90 or more Minutes | 571 | 11.1% |
Commute Time by Sex in Stony Brook
The most common commute times in Stony Brook are 45 to 59 minutes (411 commuters, 14.7%) for males and 15 to 19 minutes (519 commuters, 22.2%) for females.
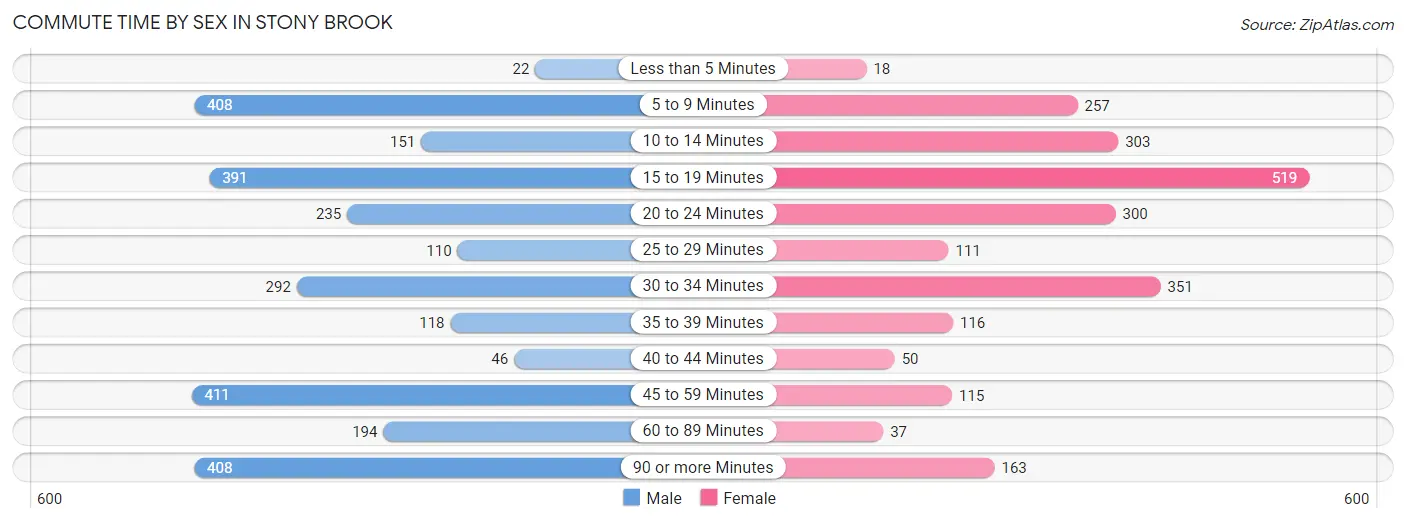
| Commute Time | Male | Female |
| Less than 5 Minutes | 22 (0.8%) | 18 (0.8%) |
| 5 to 9 Minutes | 408 (14.6%) | 257 (11.0%) |
| 10 to 14 Minutes | 151 (5.4%) | 303 (13.0%) |
| 15 to 19 Minutes | 391 (14.0%) | 519 (22.2%) |
| 20 to 24 Minutes | 235 (8.4%) | 300 (12.8%) |
| 25 to 29 Minutes | 110 (4.0%) | 111 (4.7%) |
| 30 to 34 Minutes | 292 (10.5%) | 351 (15.0%) |
| 35 to 39 Minutes | 118 (4.2%) | 116 (5.0%) |
| 40 to 44 Minutes | 46 (1.7%) | 50 (2.1%) |
| 45 to 59 Minutes | 411 (14.7%) | 115 (4.9%) |
| 60 to 89 Minutes | 194 (7.0%) | 37 (1.6%) |
| 90 or more Minutes | 408 (14.6%) | 163 (7.0%) |
Time of Departure to Work by Sex in Stony Brook
The most frequent times of departure to work in Stony Brook are 7:00 AM to 7:29 AM (445, 16.0%) for males and 7:00 AM to 7:29 AM (509, 21.7%) for females.
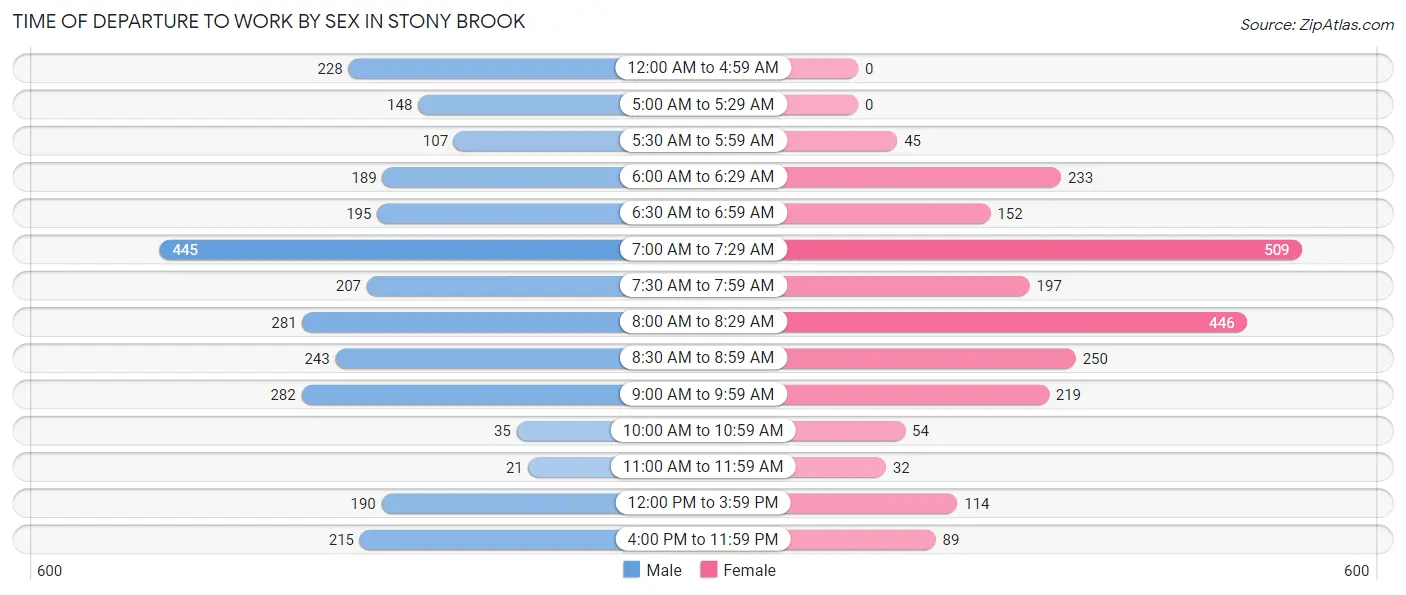
| Time of Departure | Male | Female |
| 12:00 AM to 4:59 AM | 228 (8.2%) | 0 (0.0%) |
| 5:00 AM to 5:29 AM | 148 (5.3%) | 0 (0.0%) |
| 5:30 AM to 5:59 AM | 107 (3.8%) | 45 (1.9%) |
| 6:00 AM to 6:29 AM | 189 (6.8%) | 233 (10.0%) |
| 6:30 AM to 6:59 AM | 195 (7.0%) | 152 (6.5%) |
| 7:00 AM to 7:29 AM | 445 (16.0%) | 509 (21.7%) |
| 7:30 AM to 7:59 AM | 207 (7.4%) | 197 (8.4%) |
| 8:00 AM to 8:29 AM | 281 (10.1%) | 446 (19.1%) |
| 8:30 AM to 8:59 AM | 243 (8.7%) | 250 (10.7%) |
| 9:00 AM to 9:59 AM | 282 (10.1%) | 219 (9.4%) |
| 10:00 AM to 10:59 AM | 35 (1.3%) | 54 (2.3%) |
| 11:00 AM to 11:59 AM | 21 (0.7%) | 32 (1.4%) |
| 12:00 PM to 3:59 PM | 190 (6.8%) | 114 (4.9%) |
| 4:00 PM to 11:59 PM | 215 (7.7%) | 89 (3.8%) |
| Total | 2,786 (100.0%) | 2,340 (100.0%) |
Housing Occupancy in Stony Brook
Occupancy by Ownership in Stony Brook
Of the total 4,523 dwellings in Stony Brook, owner-occupied units account for 4,040 (89.3%), while renter-occupied units make up 483 (10.7%).
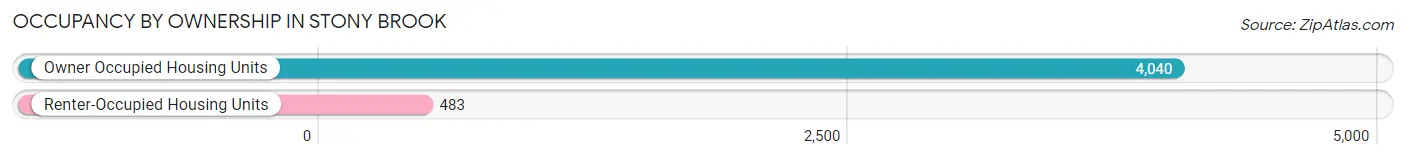
| Occupancy | # Housing Units | % Housing Units |
| Owner Occupied Housing Units | 4,040 | 89.3% |
| Renter-Occupied Housing Units | 483 | 10.7% |
| Total Occupied Housing Units | 4,523 | 100.0% |
Occupancy by Household Size in Stony Brook
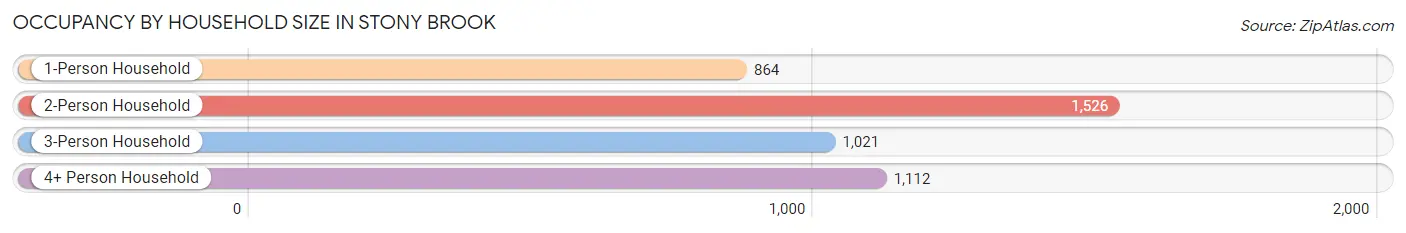
| Household Size | # Housing Units | % Housing Units |
| 1-Person Household | 864 | 19.1% |
| 2-Person Household | 1,526 | 33.7% |
| 3-Person Household | 1,021 | 22.6% |
| 4+ Person Household | 1,112 | 24.6% |
| Total Housing Units | 4,523 | 100.0% |
Occupancy by Ownership by Household Size in Stony Brook
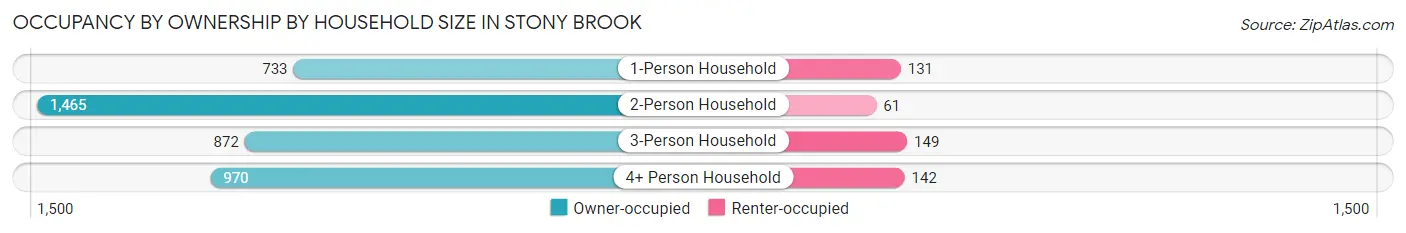
| Household Size | Owner-occupied | Renter-occupied |
| 1-Person Household | 733 (84.8%) | 131 (15.2%) |
| 2-Person Household | 1,465 (96.0%) | 61 (4.0%) |
| 3-Person Household | 872 (85.4%) | 149 (14.6%) |
| 4+ Person Household | 970 (87.2%) | 142 (12.8%) |
| Total Housing Units | 4,040 (89.3%) | 483 (10.7%) |
Occupancy by Educational Attainment in Stony Brook
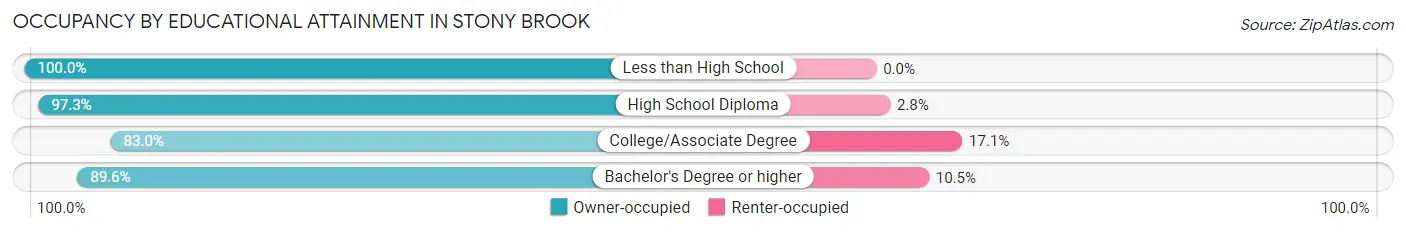
| Household Size | Owner-occupied | Renter-occupied |
| Less than High School | 53 (100.0%) | 0 (0.0%) |
| High School Diploma | 531 (97.3%) | 15 (2.8%) |
| College/Associate Degree | 730 (83.0%) | 150 (17.1%) |
| Bachelor's Degree or higher | 2,726 (89.5%) | 318 (10.4%) |
Occupancy by Age of Householder in Stony Brook
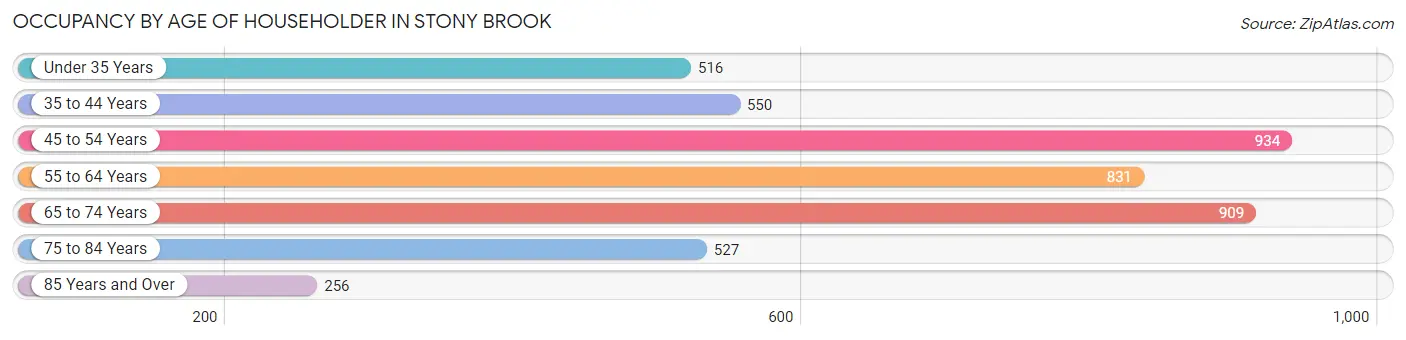
| Age Bracket | # Households | % Households |
| Under 35 Years | 516 | 11.4% |
| 35 to 44 Years | 550 | 12.2% |
| 45 to 54 Years | 934 | 20.6% |
| 55 to 64 Years | 831 | 18.4% |
| 65 to 74 Years | 909 | 20.1% |
| 75 to 84 Years | 527 | 11.7% |
| 85 Years and Over | 256 | 5.7% |
| Total | 4,523 | 100.0% |
Housing Finances in Stony Brook
Median Income by Occupancy in Stony Brook
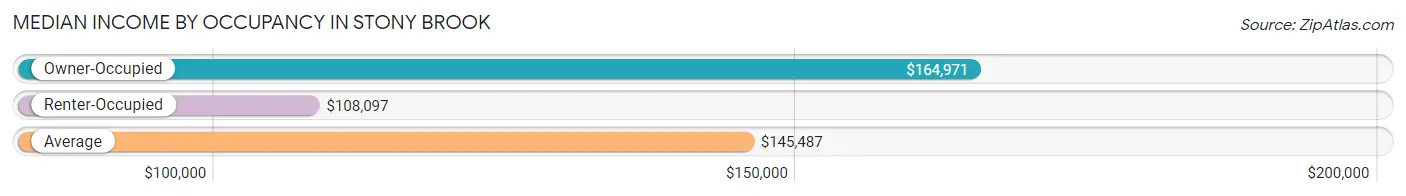
| Occupancy Type | # Households | Median Income |
| Owner-Occupied | 4,040 (89.3%) | $164,971 |
| Renter-Occupied | 483 (10.7%) | $108,097 |
| Average | 4,523 (100.0%) | $145,487 |
Occupancy by Householder Income Bracket in Stony Brook
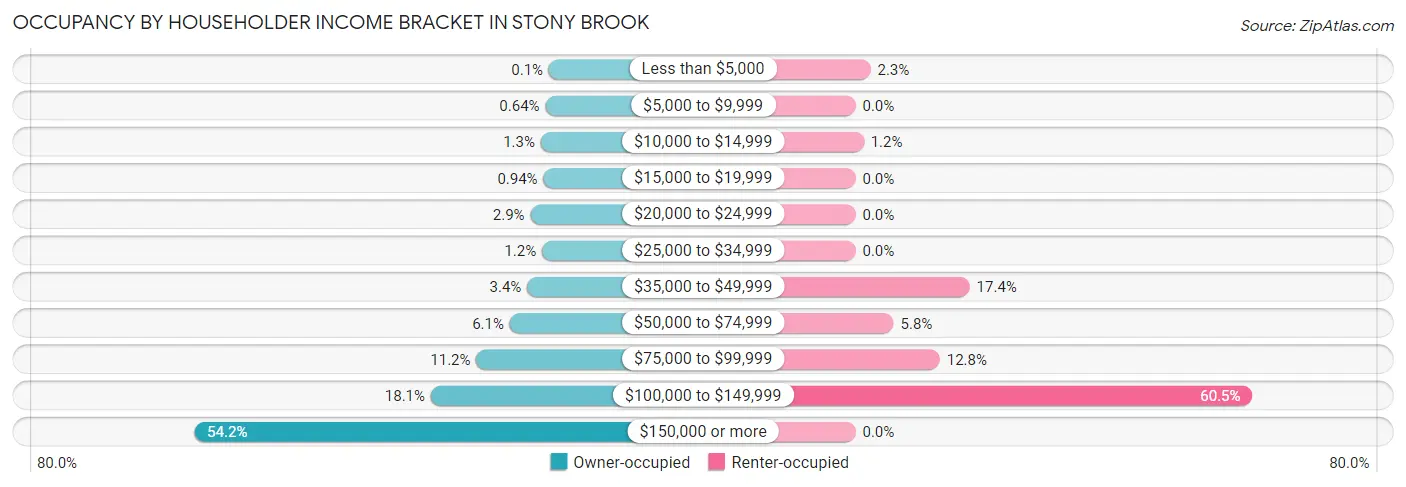
| Income Bracket | Owner-occupied | Renter-occupied |
| Less than $5,000 | 4 (0.1%) | 11 (2.3%) |
| $5,000 to $9,999 | 26 (0.6%) | 0 (0.0%) |
| $10,000 to $14,999 | 54 (1.3%) | 6 (1.2%) |
| $15,000 to $19,999 | 38 (0.9%) | 0 (0.0%) |
| $20,000 to $24,999 | 118 (2.9%) | 0 (0.0%) |
| $25,000 to $34,999 | 47 (1.2%) | 0 (0.0%) |
| $35,000 to $49,999 | 138 (3.4%) | 84 (17.4%) |
| $50,000 to $74,999 | 245 (6.1%) | 28 (5.8%) |
| $75,000 to $99,999 | 451 (11.2%) | 62 (12.8%) |
| $100,000 to $149,999 | 731 (18.1%) | 292 (60.5%) |
| $150,000 or more | 2,188 (54.2%) | 0 (0.0%) |
| Total | 4,040 (100.0%) | 483 (100.0%) |
Monthly Housing Cost Tiers in Stony Brook
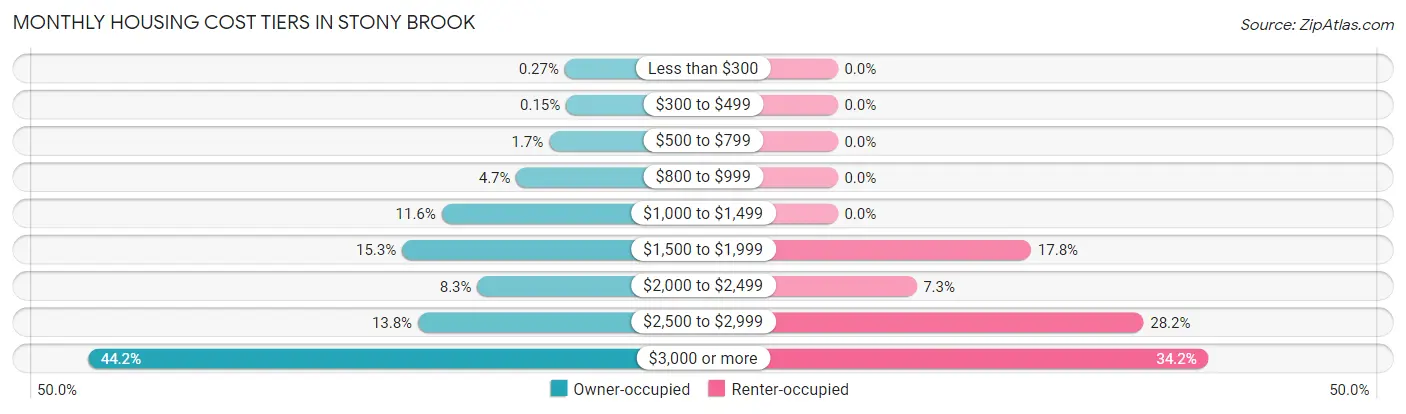
| Monthly Cost | Owner-occupied | Renter-occupied |
| Less than $300 | 11 (0.3%) | 0 (0.0%) |
| $300 to $499 | 6 (0.2%) | 0 (0.0%) |
| $500 to $799 | 69 (1.7%) | 0 (0.0%) |
| $800 to $999 | 191 (4.7%) | 0 (0.0%) |
| $1,000 to $1,499 | 469 (11.6%) | 0 (0.0%) |
| $1,500 to $1,999 | 616 (15.2%) | 86 (17.8%) |
| $2,000 to $2,499 | 336 (8.3%) | 35 (7.2%) |
| $2,500 to $2,999 | 557 (13.8%) | 136 (28.2%) |
| $3,000 or more | 1,785 (44.2%) | 165 (34.2%) |
| Total | 4,040 (100.0%) | 483 (100.0%) |
Physical Housing Characteristics in Stony Brook
Housing Structures in Stony Brook
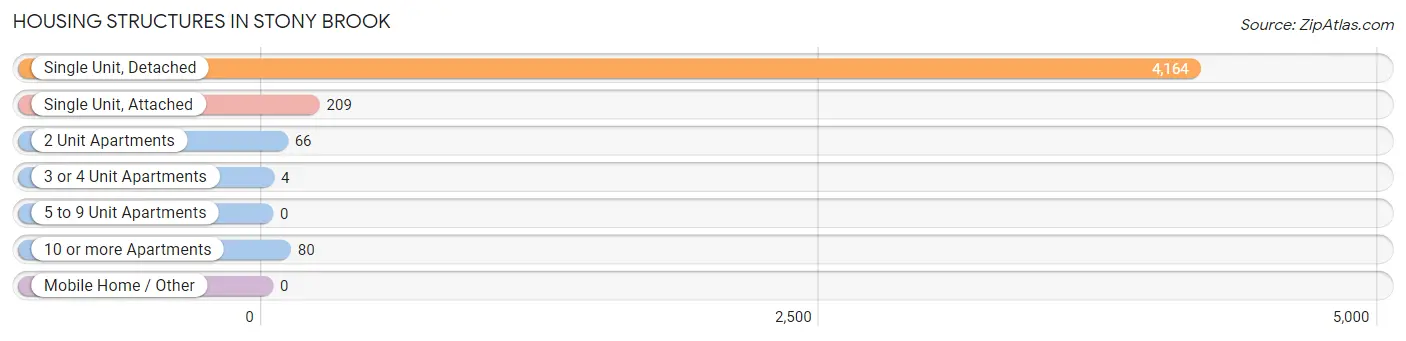
| Structure Type | # Housing Units | % Housing Units |
| Single Unit, Detached | 4,164 | 92.1% |
| Single Unit, Attached | 209 | 4.6% |
| 2 Unit Apartments | 66 | 1.5% |
| 3 or 4 Unit Apartments | 4 | 0.1% |
| 5 to 9 Unit Apartments | 0 | 0.0% |
| 10 or more Apartments | 80 | 1.8% |
| Mobile Home / Other | 0 | 0.0% |
| Total | 4,523 | 100.0% |
Housing Structures by Occupancy in Stony Brook
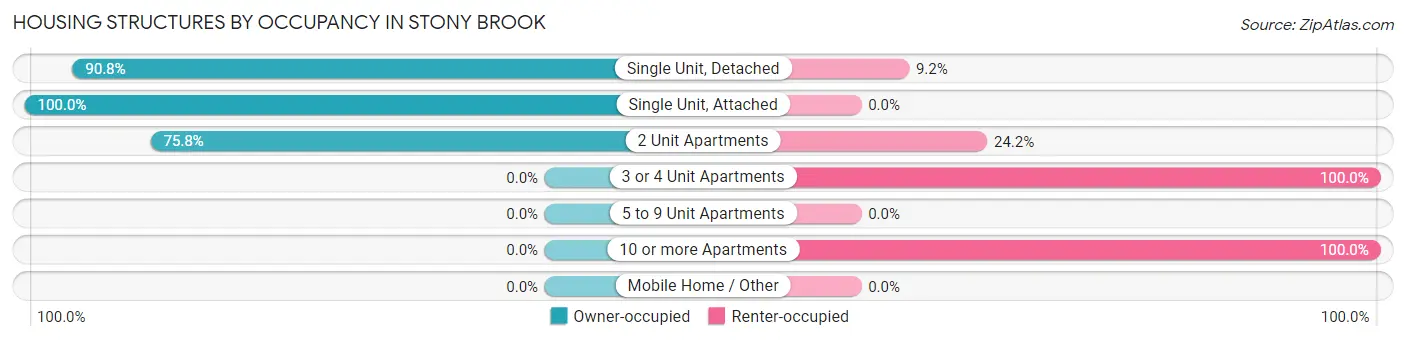
| Structure Type | Owner-occupied | Renter-occupied |
| Single Unit, Detached | 3,781 (90.8%) | 383 (9.2%) |
| Single Unit, Attached | 209 (100.0%) | 0 (0.0%) |
| 2 Unit Apartments | 50 (75.8%) | 16 (24.2%) |
| 3 or 4 Unit Apartments | 0 (0.0%) | 4 (100.0%) |
| 5 to 9 Unit Apartments | 0 (0.0%) | 0 (0.0%) |
| 10 or more Apartments | 0 (0.0%) | 80 (100.0%) |
| Mobile Home / Other | 0 (0.0%) | 0 (0.0%) |
| Total | 4,040 (89.3%) | 483 (10.7%) |
Housing Structures by Number of Rooms in Stony Brook
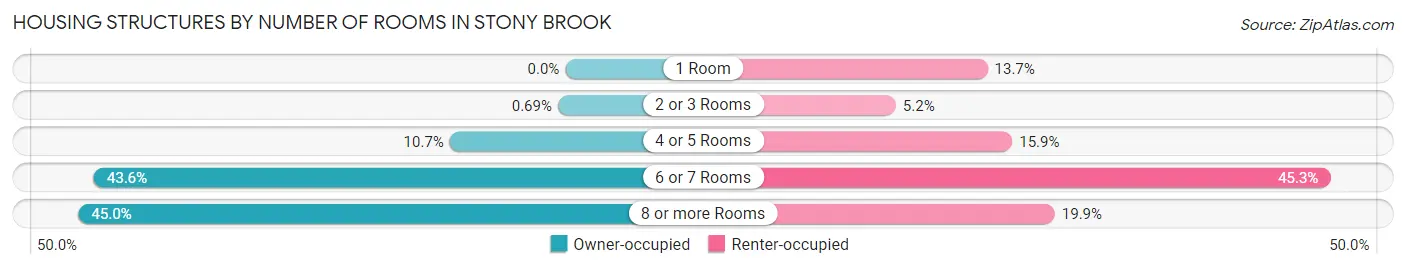
| Number of Rooms | Owner-occupied | Renter-occupied |
| 1 Room | 0 (0.0%) | 66 (13.7%) |
| 2 or 3 Rooms | 28 (0.7%) | 25 (5.2%) |
| 4 or 5 Rooms | 432 (10.7%) | 77 (15.9%) |
| 6 or 7 Rooms | 1,761 (43.6%) | 219 (45.3%) |
| 8 or more Rooms | 1,819 (45.0%) | 96 (19.9%) |
| Total | 4,040 (100.0%) | 483 (100.0%) |
Housing Structure by Heating Type in Stony Brook
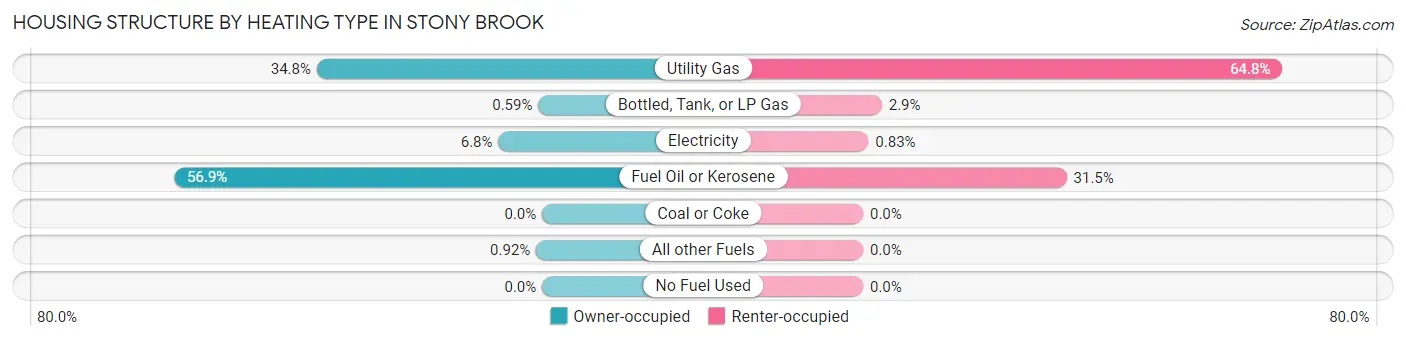
| Heating Type | Owner-occupied | Renter-occupied |
| Utility Gas | 1,407 (34.8%) | 313 (64.8%) |
| Bottled, Tank, or LP Gas | 24 (0.6%) | 14 (2.9%) |
| Electricity | 273 (6.8%) | 4 (0.8%) |
| Fuel Oil or Kerosene | 2,299 (56.9%) | 152 (31.5%) |
| Coal or Coke | 0 (0.0%) | 0 (0.0%) |
| All other Fuels | 37 (0.9%) | 0 (0.0%) |
| No Fuel Used | 0 (0.0%) | 0 (0.0%) |
| Total | 4,040 (100.0%) | 483 (100.0%) |
Household Vehicle Usage in Stony Brook
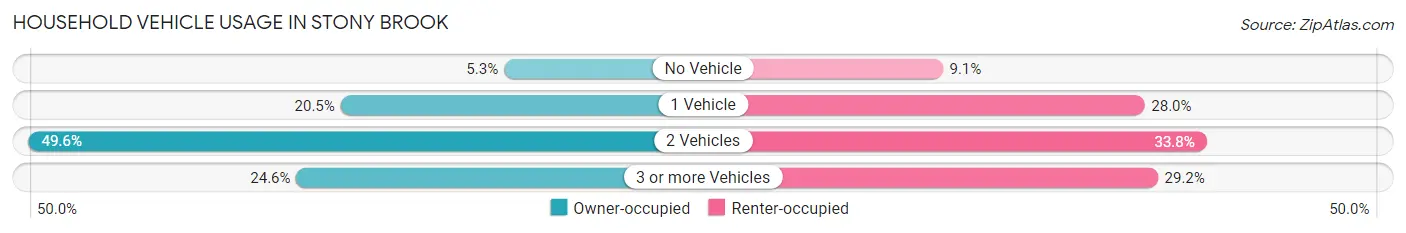
| Vehicles per Household | Owner-occupied | Renter-occupied |
| No Vehicle | 212 (5.2%) | 44 (9.1%) |
| 1 Vehicle | 828 (20.5%) | 135 (28.0%) |
| 2 Vehicles | 2,005 (49.6%) | 163 (33.8%) |
| 3 or more Vehicles | 995 (24.6%) | 141 (29.2%) |
| Total | 4,040 (100.0%) | 483 (100.0%) |
Real Estate & Mortgages in Stony Brook
Real Estate and Mortgage Overview in Stony Brook
| Characteristic | Without Mortgage | With Mortgage |
| Housing Units | 1,651 | 2,389 |
| Median Property Value | $524,900 | $603,400 |
| Median Household Income | $122,375 | $1,523 |
| Monthly Housing Costs | $1,501 | $1,755 |
| Real Estate Taxes | $10,001 | $0 |
Property Value by Mortgage Status in Stony Brook
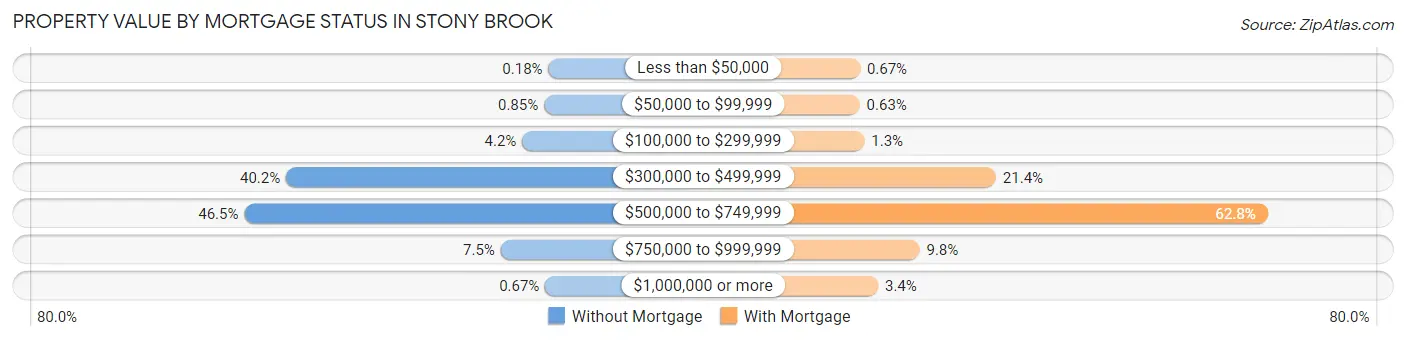
| Property Value | Without Mortgage | With Mortgage |
| Less than $50,000 | 3 (0.2%) | 16 (0.7%) |
| $50,000 to $99,999 | 14 (0.9%) | 15 (0.6%) |
| $100,000 to $299,999 | 69 (4.2%) | 32 (1.3%) |
| $300,000 to $499,999 | 663 (40.2%) | 511 (21.4%) |
| $500,000 to $749,999 | 768 (46.5%) | 1,500 (62.8%) |
| $750,000 to $999,999 | 123 (7.4%) | 233 (9.8%) |
| $1,000,000 or more | 11 (0.7%) | 82 (3.4%) |
| Total | 1,651 (100.0%) | 2,389 (100.0%) |
Household Income by Mortgage Status in Stony Brook
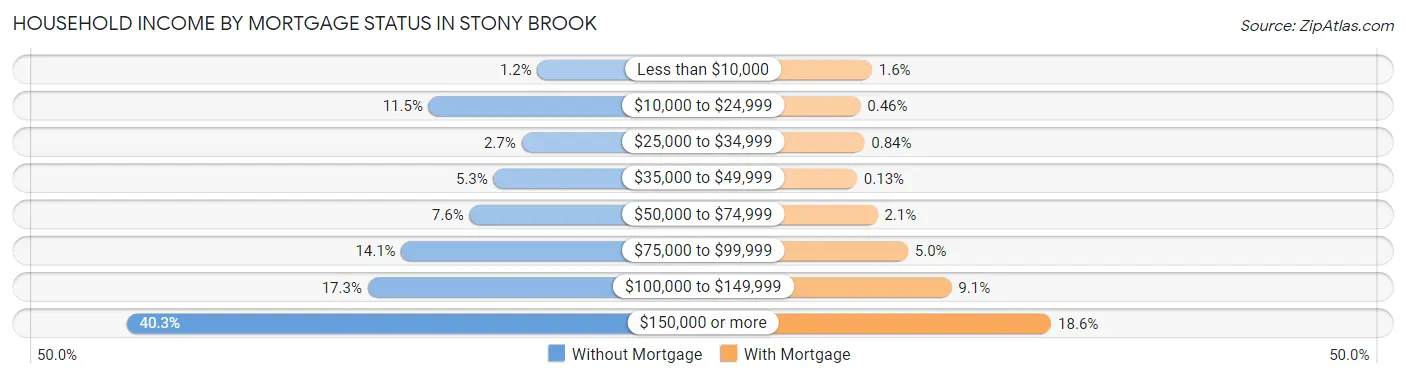
| Household Income | Without Mortgage | With Mortgage |
| Less than $10,000 | 19 (1.1%) | 37 (1.5%) |
| $10,000 to $24,999 | 190 (11.5%) | 11 (0.5%) |
| $25,000 to $34,999 | 44 (2.7%) | 20 (0.8%) |
| $35,000 to $49,999 | 88 (5.3%) | 3 (0.1%) |
| $50,000 to $74,999 | 126 (7.6%) | 50 (2.1%) |
| $75,000 to $99,999 | 233 (14.1%) | 119 (5.0%) |
| $100,000 to $149,999 | 286 (17.3%) | 218 (9.1%) |
| $150,000 or more | 665 (40.3%) | 445 (18.6%) |
| Total | 1,651 (100.0%) | 2,389 (100.0%) |
Property Value to Household Income Ratio in Stony Brook
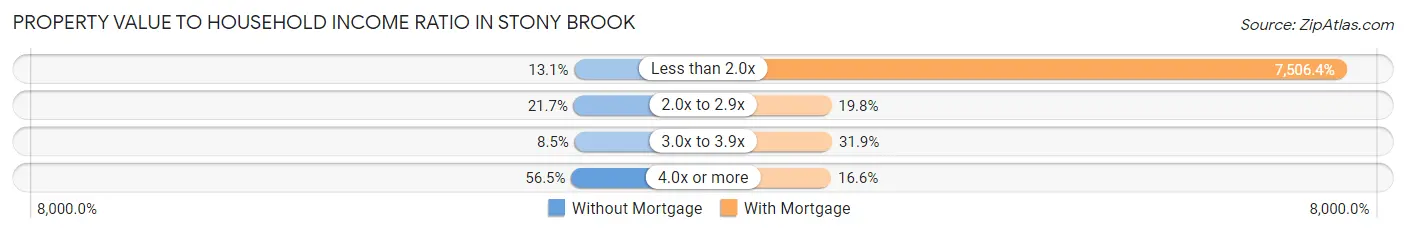
| Value-to-Income Ratio | Without Mortgage | With Mortgage |
| Less than 2.0x | 216 (13.1%) | 179,327 (7,506.4%) |
| 2.0x to 2.9x | 359 (21.7%) | 473 (19.8%) |
| 3.0x to 3.9x | 140 (8.5%) | 761 (31.9%) |
| 4.0x or more | 932 (56.5%) | 396 (16.6%) |
| Total | 1,651 (100.0%) | 2,389 (100.0%) |
Real Estate Taxes by Mortgage Status in Stony Brook
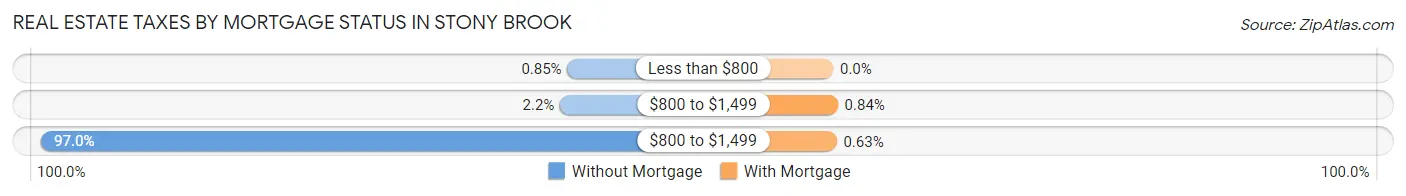
| Property Taxes | Without Mortgage | With Mortgage |
| Less than $800 | 14 (0.9%) | 0 (0.0%) |
| $800 to $1,499 | 36 (2.2%) | 20 (0.8%) |
| $800 to $1,499 | 1,601 (97.0%) | 15 (0.6%) |
| Total | 1,651 (100.0%) | 2,389 (100.0%) |
Health & Disability in Stony Brook
Health Insurance Coverage by Age in Stony Brook
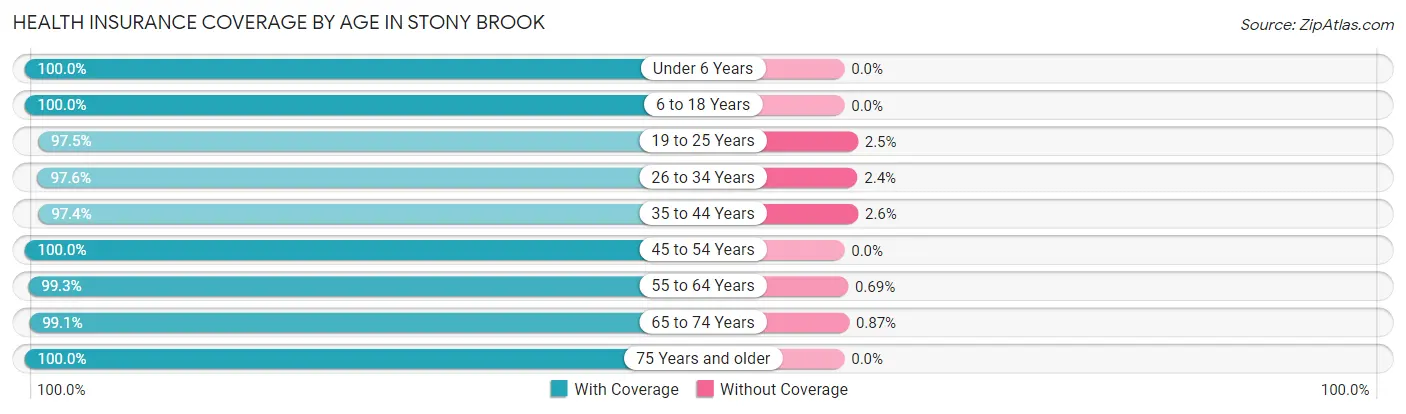
| Age Bracket | With Coverage | Without Coverage |
| Under 6 Years | 1,005 (100.0%) | 0 (0.0%) |
| 6 to 18 Years | 1,715 (100.0%) | 0 (0.0%) |
| 19 to 25 Years | 1,202 (97.5%) | 31 (2.5%) |
| 26 to 34 Years | 1,083 (97.6%) | 27 (2.4%) |
| 35 to 44 Years | 988 (97.4%) | 26 (2.6%) |
| 45 to 54 Years | 1,985 (100.0%) | 0 (0.0%) |
| 55 to 64 Years | 1,585 (99.3%) | 11 (0.7%) |
| 65 to 74 Years | 1,602 (99.1%) | 14 (0.9%) |
| 75 Years and older | 1,187 (100.0%) | 0 (0.0%) |
| Total | 12,352 (99.1%) | 109 (0.9%) |
Health Insurance Coverage by Citizenship Status in Stony Brook
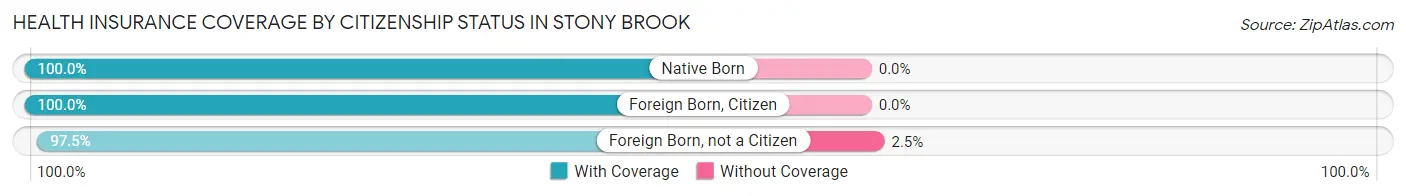
| Citizenship Status | With Coverage | Without Coverage |
| Native Born | 1,005 (100.0%) | 0 (0.0%) |
| Foreign Born, Citizen | 1,715 (100.0%) | 0 (0.0%) |
| Foreign Born, not a Citizen | 1,202 (97.5%) | 31 (2.5%) |
Health Insurance Coverage by Household Income in Stony Brook
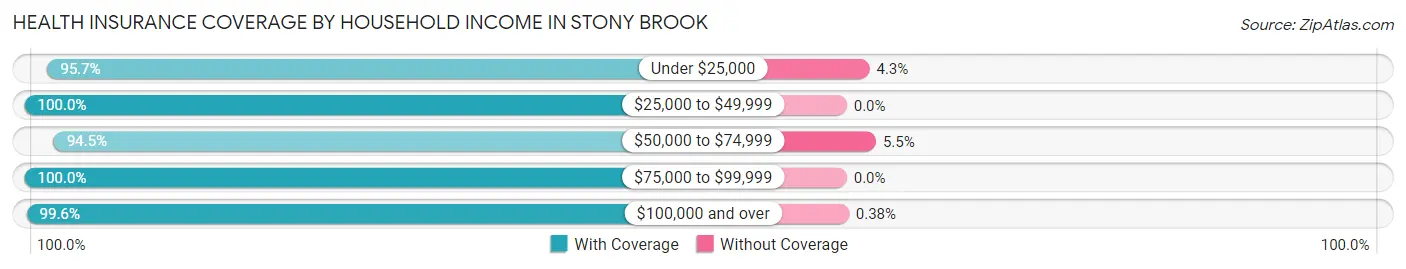
| Household Income | With Coverage | Without Coverage |
| Under $25,000 | 315 (95.7%) | 14 (4.3%) |
| $25,000 to $49,999 | 486 (100.0%) | 0 (0.0%) |
| $50,000 to $74,999 | 693 (94.5%) | 40 (5.5%) |
| $75,000 to $99,999 | 1,171 (100.0%) | 0 (0.0%) |
| $100,000 and over | 9,658 (99.6%) | 37 (0.4%) |
Public vs Private Health Insurance Coverage by Age in Stony Brook
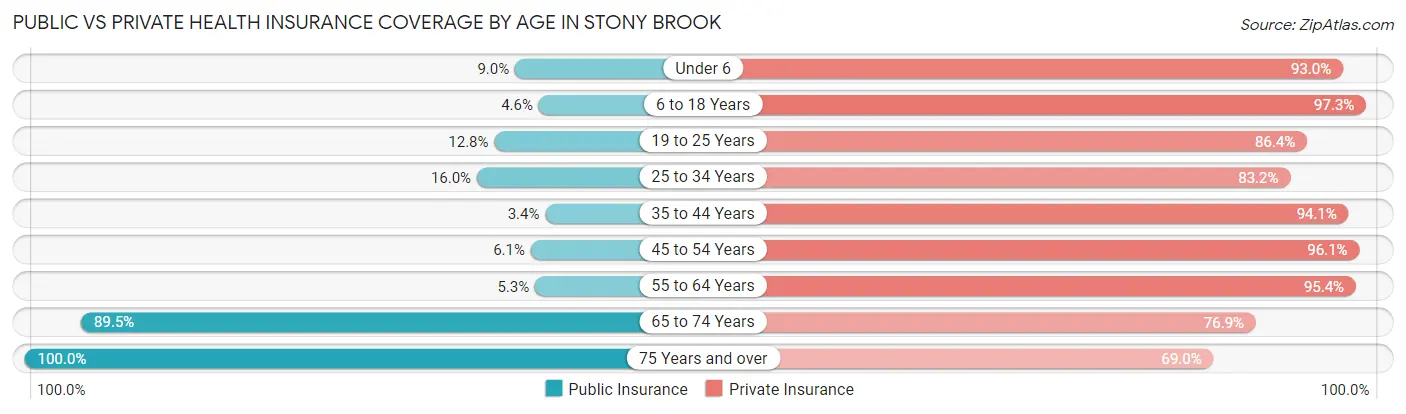
| Age Bracket | Public Insurance | Private Insurance |
| Under 6 | 90 (9.0%) | 935 (93.0%) |
| 6 to 18 Years | 78 (4.5%) | 1,669 (97.3%) |
| 19 to 25 Years | 158 (12.8%) | 1,065 (86.4%) |
| 25 to 34 Years | 178 (16.0%) | 924 (83.2%) |
| 35 to 44 Years | 34 (3.4%) | 954 (94.1%) |
| 45 to 54 Years | 120 (6.0%) | 1,907 (96.1%) |
| 55 to 64 Years | 84 (5.3%) | 1,523 (95.4%) |
| 65 to 74 Years | 1,447 (89.5%) | 1,242 (76.9%) |
| 75 Years and over | 1,187 (100.0%) | 819 (69.0%) |
| Total | 3,376 (27.1%) | 11,038 (88.6%) |
Disability Status by Sex by Age in Stony Brook
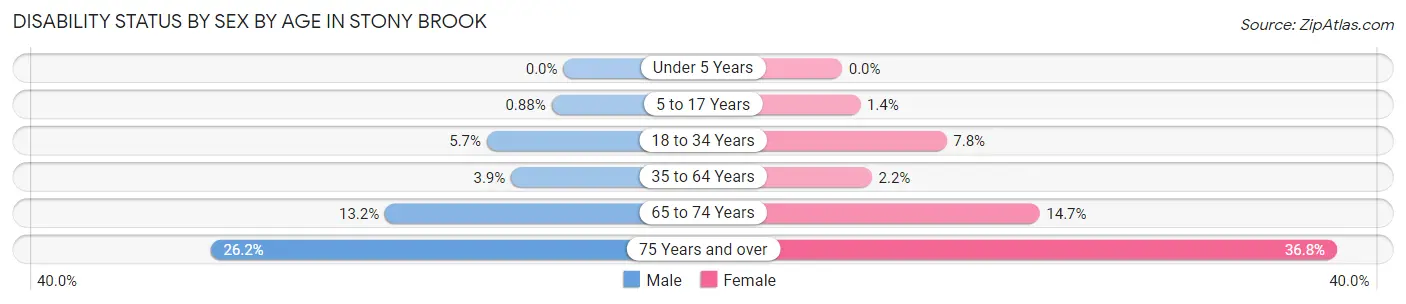
| Age Bracket | Male | Female |
| Under 5 Years | 0 (0.0%) | 0 (0.0%) |
| 5 to 17 Years | 10 (0.9%) | 12 (1.3%) |
| 18 to 34 Years | 76 (5.7%) | 79 (7.8%) |
| 35 to 64 Years | 87 (3.9%) | 52 (2.2%) |
| 65 to 74 Years | 121 (13.2%) | 103 (14.7%) |
| 75 Years and over | 120 (26.2%) | 268 (36.8%) |
Disability Class by Sex by Age in Stony Brook
Disability Class: Hearing Difficulty
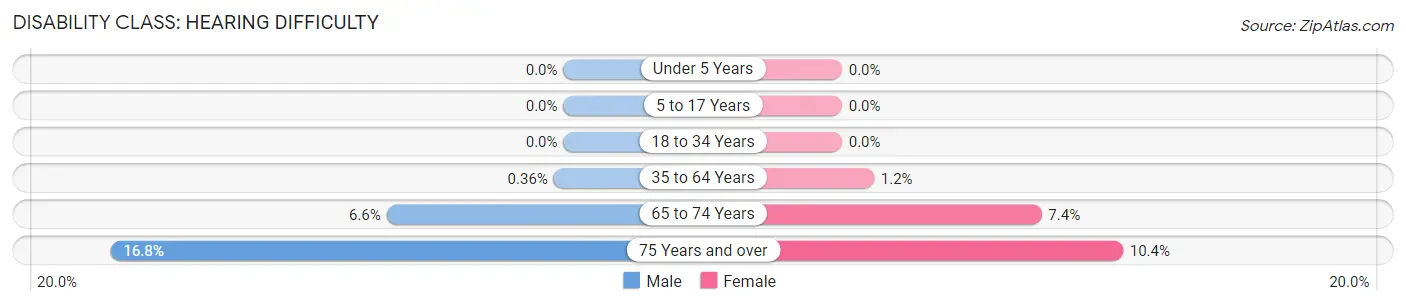
| Age Bracket | Male | Female |
| Under 5 Years | 0 (0.0%) | 0 (0.0%) |
| 5 to 17 Years | 0 (0.0%) | 0 (0.0%) |
| 18 to 34 Years | 0 (0.0%) | 0 (0.0%) |
| 35 to 64 Years | 8 (0.4%) | 28 (1.2%) |
| 65 to 74 Years | 60 (6.6%) | 52 (7.4%) |
| 75 Years and over | 77 (16.8%) | 76 (10.4%) |
Disability Class: Vision Difficulty
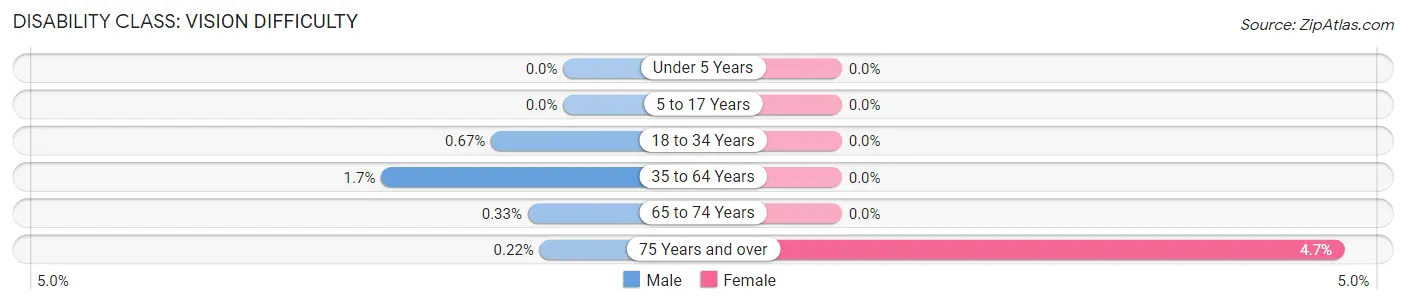
| Age Bracket | Male | Female |
| Under 5 Years | 0 (0.0%) | 0 (0.0%) |
| 5 to 17 Years | 0 (0.0%) | 0 (0.0%) |
| 18 to 34 Years | 9 (0.7%) | 0 (0.0%) |
| 35 to 64 Years | 38 (1.7%) | 0 (0.0%) |
| 65 to 74 Years | 3 (0.3%) | 0 (0.0%) |
| 75 Years and over | 1 (0.2%) | 34 (4.7%) |
Disability Class: Cognitive Difficulty
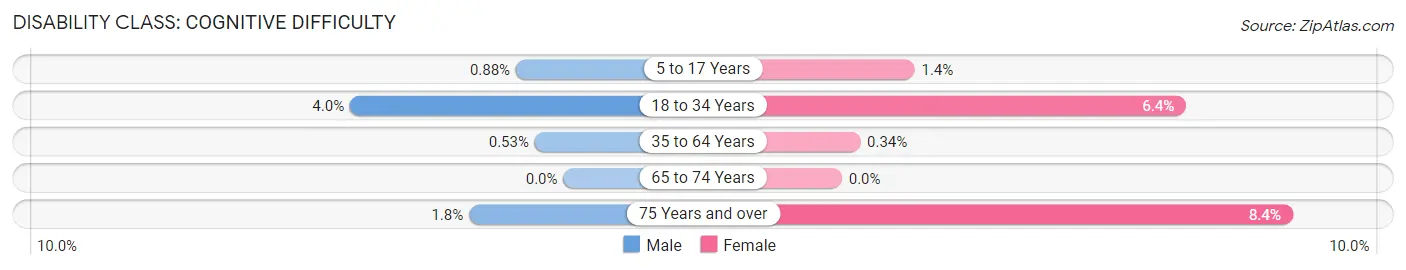
| Age Bracket | Male | Female |
| 5 to 17 Years | 10 (0.9%) | 12 (1.3%) |
| 18 to 34 Years | 53 (4.0%) | 65 (6.4%) |
| 35 to 64 Years | 12 (0.5%) | 8 (0.3%) |
| 65 to 74 Years | 0 (0.0%) | 0 (0.0%) |
| 75 Years and over | 8 (1.8%) | 61 (8.4%) |
Disability Class: Ambulatory Difficulty
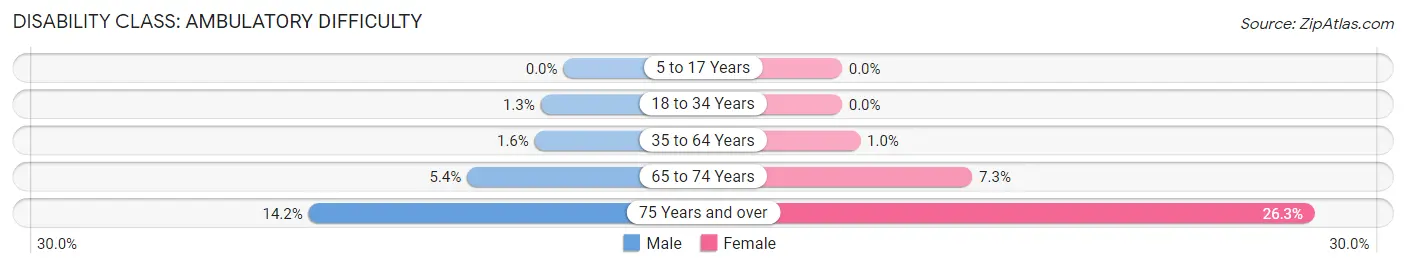
| Age Bracket | Male | Female |
| 5 to 17 Years | 0 (0.0%) | 0 (0.0%) |
| 18 to 34 Years | 17 (1.3%) | 0 (0.0%) |
| 35 to 64 Years | 36 (1.6%) | 24 (1.0%) |
| 65 to 74 Years | 49 (5.4%) | 51 (7.3%) |
| 75 Years and over | 65 (14.2%) | 192 (26.3%) |
Disability Class: Self-Care Difficulty
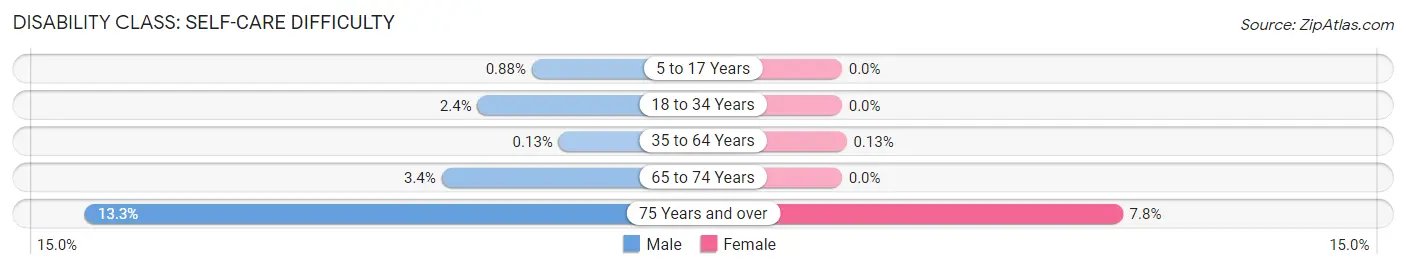
| Age Bracket | Male | Female |
| 5 to 17 Years | 10 (0.9%) | 0 (0.0%) |
| 18 to 34 Years | 32 (2.4%) | 0 (0.0%) |
| 35 to 64 Years | 3 (0.1%) | 3 (0.1%) |
| 65 to 74 Years | 31 (3.4%) | 0 (0.0%) |
| 75 Years and over | 61 (13.3%) | 57 (7.8%) |
Technology Access in Stony Brook
Computing Device Access in Stony Brook
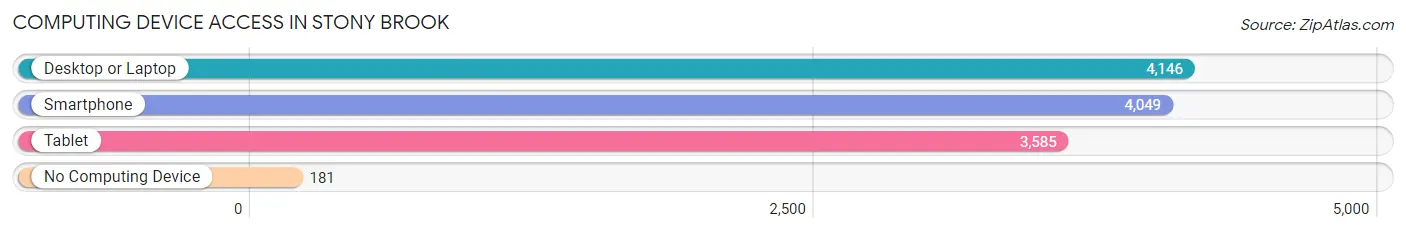
| Device Type | # Households | % Households |
| Desktop or Laptop | 4,146 | 91.7% |
| Smartphone | 4,049 | 89.5% |
| Tablet | 3,585 | 79.3% |
| No Computing Device | 181 | 4.0% |
| Total | 4,523 | 100.0% |
Internet Access in Stony Brook
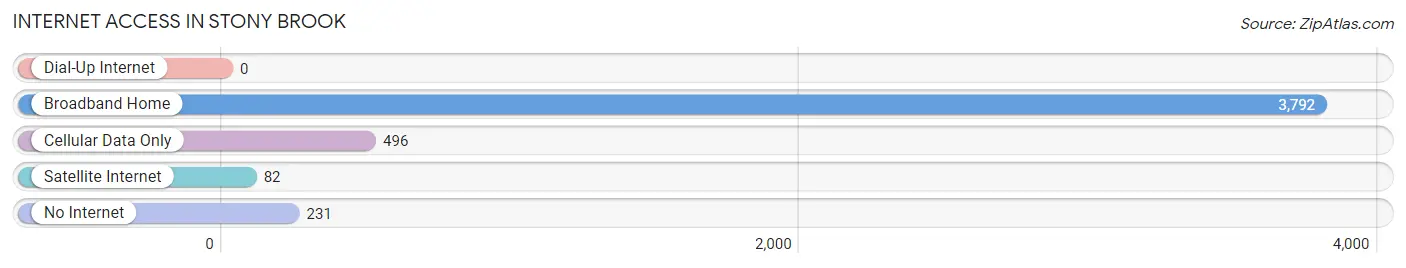
| Internet Type | # Households | % Households |
| Dial-Up Internet | 0 | 0.0% |
| Broadband Home | 3,792 | 83.8% |
| Cellular Data Only | 496 | 11.0% |
| Satellite Internet | 82 | 1.8% |
| No Internet | 231 | 5.1% |
| Total | 4,523 | 100.0% |
Stony Brook Summary
Stony Brook is a hamlet located in the Town of Brookhaven in Suffolk County, New York. It is situated on the north shore of Long Island, approximately 60 miles east of New York City. Stony Brook is home to Stony Brook University, a major research university, and the Stony Brook Village Center, a historic shopping district.
History
The area now known as Stony Brook was originally inhabited by the Setalcott Native American tribe. The first European settlers arrived in the area in the 1660s, and the hamlet was officially established in 1699. The hamlet was named after the Stony Brook, a small stream that runs through the area.
In the late 19th century, Stony Brook became a popular summer resort destination for wealthy New Yorkers. The Stony Brook Village Center was established in the early 20th century, and the area became a popular shopping destination.
In the 1950s, Stony Brook University was established in the area. The university has since grown to become one of the largest research universities in the country.
Geography
Stony Brook is located on the north shore of Long Island, approximately 60 miles east of New York City. The hamlet is situated on the north side of the Stony Brook Harbor, which is part of the Long Island Sound. The hamlet is bordered by the hamlets of Setauket to the east, Port Jefferson to the west, and St. James to the south.
The area is characterized by rolling hills, wooded areas, and wetlands. The Stony Brook Harbor is a popular destination for recreational activities such as fishing, boating, and swimming.
Economy
Stony Brook is home to a variety of businesses, including retail stores, restaurants, and professional services. The Stony Brook Village Center is a popular shopping destination, and the area is also home to a number of corporate offices.
Stony Brook University is the largest employer in the area, and the university is a major contributor to the local economy. The university is home to a number of research centers and institutes, and it is a major source of jobs and economic activity in the area.
Demographics
As of the 2010 census, the population of Stony Brook was 13,740. The population is predominantly white (86.3%), with smaller percentages of African Americans (4.7%), Asians (4.3%), and Hispanics (3.7%). The median household income is $90,945, and the median home value is $400,000.
The majority of residents (77.3%) are college-educated, and the majority of households (63.2%) are married couples. The unemployment rate is 3.2%, and the poverty rate is 4.3%.
Conclusion
Stony Brook is a hamlet located on the north shore of Long Island, approximately 60 miles east of New York City. The area is home to Stony Brook University, a major research university, and the Stony Brook Village Center, a historic shopping district. The population of Stony Brook is predominantly white, and the median household income is $90,945. The area is home to a variety of businesses, and Stony Brook University is the largest employer in the area.
Common Questions
What is Per Capita Income in Stony Brook?
Per Capita income in Stony Brook is $72,008.
What is the Median Family Income in Stony Brook?
Median Family Income in Stony Brook is $171,448.
What is the Median Household income in Stony Brook?
Median Household Income in Stony Brook is $145,487.
What is Income or Wage Gap in Stony Brook?
Income or Wage Gap in Stony Brook is 38.3%.
Women in Stony Brook earn 61.7 cents for every dollar earned by a man.
What is Inequality or Gini Index in Stony Brook?
Inequality or Gini Index in Stony Brook is 0.42.
What is the Total Population of Stony Brook?
Total Population of Stony Brook is 12,501.
What is the Total Male Population of Stony Brook?
Total Male Population of Stony Brook is 6,500.
What is the Total Female Population of Stony Brook?
Total Female Population of Stony Brook is 6,001.
What is the Ratio of Males per 100 Females in Stony Brook?
There are 108.32 Males per 100 Females in Stony Brook.
What is the Ratio of Females per 100 Males in Stony Brook?
There are 92.32 Females per 100 Males in Stony Brook.
What is the Median Population Age in Stony Brook?
Median Population Age in Stony Brook is 45.8 Years.
What is the Average Family Size in Stony Brook
Average Family Size in Stony Brook is 3.1 People.
What is the Average Household Size in Stony Brook
Average Household Size in Stony Brook is 2.8 People.
How Large is the Labor Force in Stony Brook?
There are 6,496 People in the Labor Forcein in Stony Brook.
What is the Percentage of People in the Labor Force in Stony Brook?
64.2% of People are in the Labor Force in Stony Brook.
What is the Unemployment Rate in Stony Brook?
Unemployment Rate in Stony Brook is 3.7%.