Brookhaven, NY Map & Demographics
Brookhaven Map
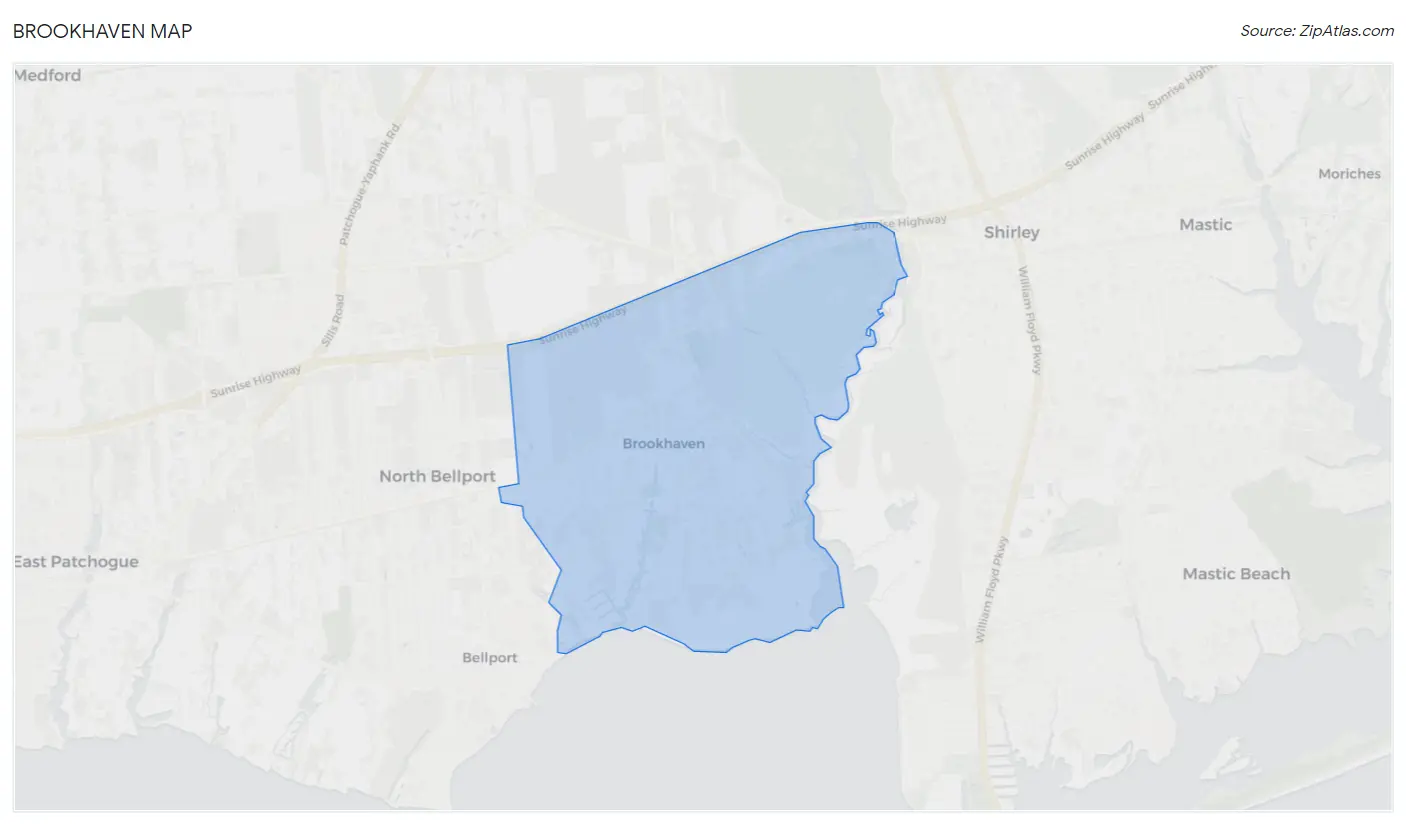
Brookhaven Overview
$46,584
PER CAPITA INCOME
$147,700
AVG FAMILY INCOME
$105,481
AVG HOUSEHOLD INCOME
2.6%
WAGE / INCOME GAP [ % ]
97.4¢/ $1
WAGE / INCOME GAP [ $ ]
0.48
INEQUALITY / GINI INDEX
3,408
TOTAL POPULATION
1,697
MALE POPULATION
1,711
FEMALE POPULATION
99.18
MALES / 100 FEMALES
100.82
FEMALES / 100 MALES
47.5
MEDIAN AGE
3.2
AVG FAMILY SIZE
2.6
AVG HOUSEHOLD SIZE
1,668
LABOR FORCE [ PEOPLE ]
59.6%
PERCENT IN LABOR FORCE
10.7%
UNEMPLOYMENT RATE
Brookhaven Zip Codes
Brookhaven Area Codes
Income in Brookhaven
Income Overview in Brookhaven
Per Capita Income in Brookhaven is $46,584, while median incomes of families and households are $147,700 and $105,481 respectively.
| Characteristic | Number | Measure |
| Per Capita Income | 3,408 | $46,584 |
| Median Family Income | 696 | $147,700 |
| Mean Family Income | 696 | $177,975 |
| Median Household Income | 1,098 | $105,481 |
| Mean Household Income | 1,098 | $137,788 |
| Income Deficit | 696 | $0 |
| Wage / Income Gap (%) | 3,408 | 2.57% |
| Wage / Income Gap ($) | 3,408 | 97.43¢ per $1 |
| Gini / Inequality Index | 3,408 | 0.48 |
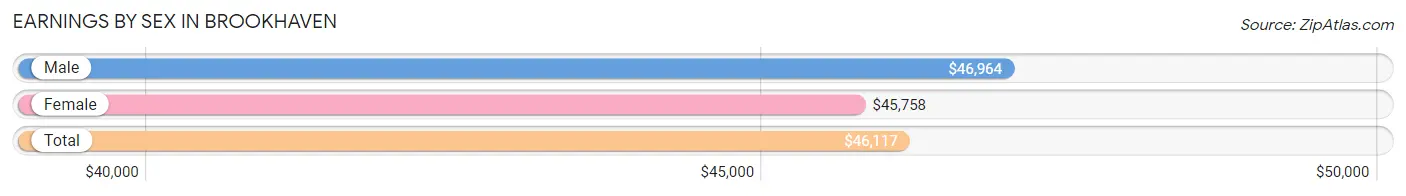
Earnings by Sex in Brookhaven
Average Earnings in Brookhaven are $46,117, $46,964 for men and $45,758 for women, a difference of 2.6%.
| Sex | Number | Average Earnings |
| Male | 924 (53.5%) | $46,964 |
| Female | 804 (46.5%) | $45,758 |
| Total | 1,728 (100.0%) | $46,117 |
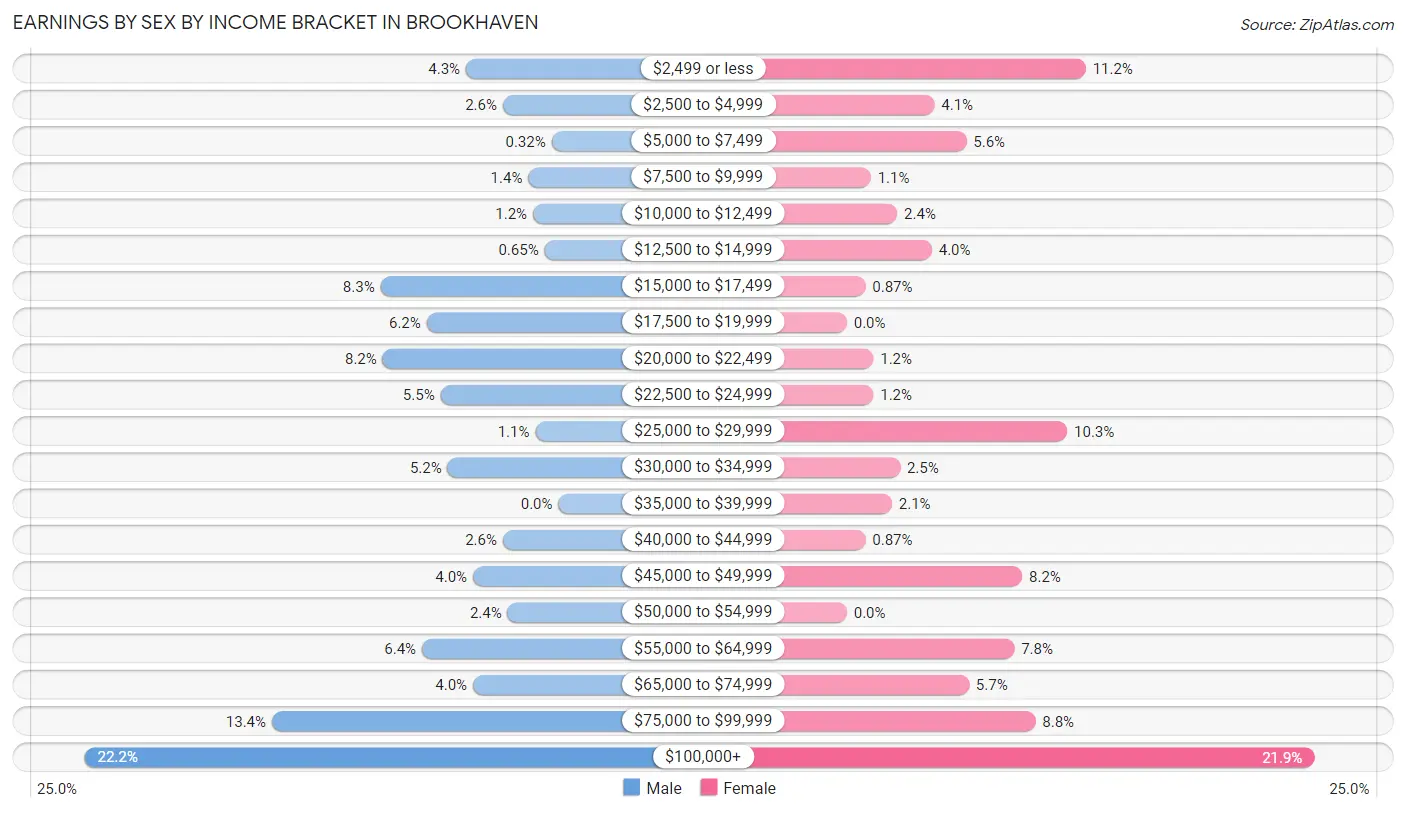
Earnings by Sex by Income Bracket in Brookhaven
The most common earnings brackets in Brookhaven are $100,000+ for men (205 | 22.2%) and $100,000+ for women (176 | 21.9%).
| Income | Male | Female |
| $2,499 or less | 40 (4.3%) | 90 (11.2%) |
| $2,500 to $4,999 | 24 (2.6%) | 33 (4.1%) |
| $5,000 to $7,499 | 3 (0.3%) | 45 (5.6%) |
| $7,500 to $9,999 | 13 (1.4%) | 9 (1.1%) |
| $10,000 to $12,499 | 11 (1.2%) | 19 (2.4%) |
| $12,500 to $14,999 | 6 (0.6%) | 32 (4.0%) |
| $15,000 to $17,499 | 77 (8.3%) | 7 (0.9%) |
| $17,500 to $19,999 | 57 (6.2%) | 0 (0.0%) |
| $20,000 to $22,499 | 76 (8.2%) | 10 (1.2%) |
| $22,500 to $24,999 | 51 (5.5%) | 10 (1.2%) |
| $25,000 to $29,999 | 10 (1.1%) | 83 (10.3%) |
| $30,000 to $34,999 | 48 (5.2%) | 20 (2.5%) |
| $35,000 to $39,999 | 0 (0.0%) | 17 (2.1%) |
| $40,000 to $44,999 | 24 (2.6%) | 7 (0.9%) |
| $45,000 to $49,999 | 37 (4.0%) | 66 (8.2%) |
| $50,000 to $54,999 | 22 (2.4%) | 0 (0.0%) |
| $55,000 to $64,999 | 59 (6.4%) | 63 (7.8%) |
| $65,000 to $74,999 | 37 (4.0%) | 46 (5.7%) |
| $75,000 to $99,999 | 124 (13.4%) | 71 (8.8%) |
| $100,000+ | 205 (22.2%) | 176 (21.9%) |
| Total | 924 (100.0%) | 804 (100.0%) |
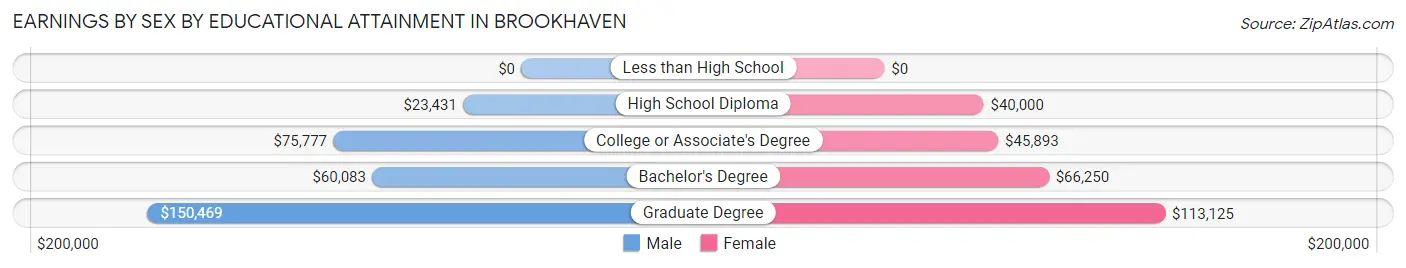
Earnings by Sex by Educational Attainment in Brookhaven
Average earnings in Brookhaven are $60,458 for men and $56,136 for women, a difference of 7.1%. Men with an educational attainment of graduate degree enjoy the highest average annual earnings of $150,469, while those with high school diploma education earn the least with $23,431. Women with an educational attainment of graduate degree earn the most with the average annual earnings of $113,125, while those with high school diploma education have the smallest earnings of $40,000.
| Educational Attainment | Male Income | Female Income |
| Less than High School | - | - |
| High School Diploma | $23,431 | $40,000 |
| College or Associate's Degree | $75,777 | $45,893 |
| Bachelor's Degree | $60,083 | $66,250 |
| Graduate Degree | $150,469 | $113,125 |
| Total | $60,458 | $56,136 |
Family Income in Brookhaven
Family Income Brackets in Brookhaven
According to the Brookhaven family income data, there are 221 families falling into the $100,000 to $149,999 income range, which is the most common income bracket and makes up 31.8% of all families.
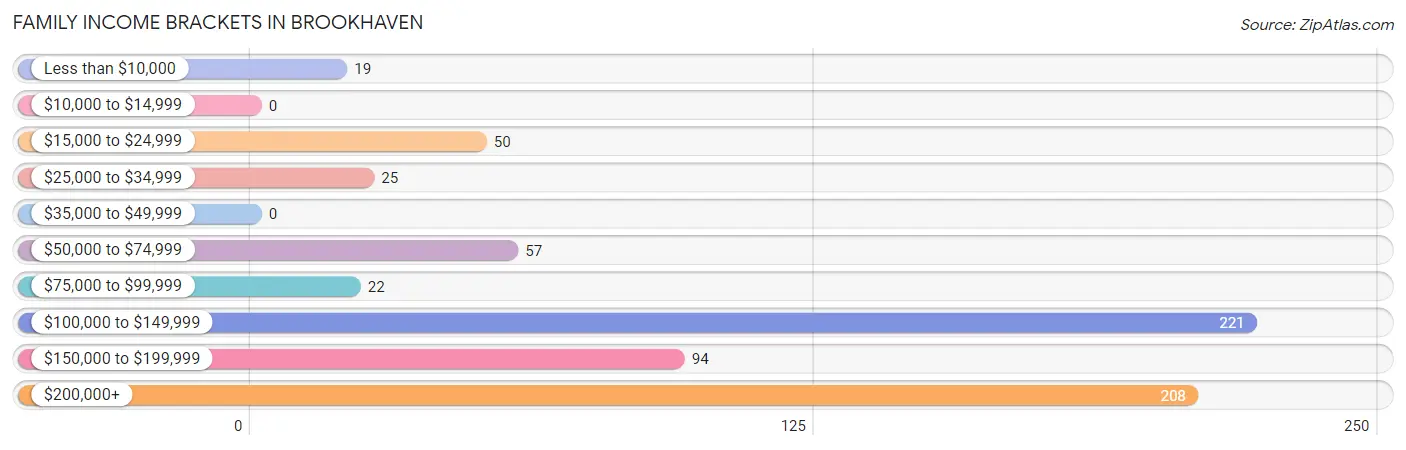
| Income Bracket | # Families | % Families |
| Less than $10,000 | 19 | 2.7% |
| $10,000 to $14,999 | 0 | 0.0% |
| $15,000 to $24,999 | 50 | 7.2% |
| $25,000 to $34,999 | 25 | 3.6% |
| $35,000 to $49,999 | 0 | 0.0% |
| $50,000 to $74,999 | 57 | 8.2% |
| $75,000 to $99,999 | 22 | 3.2% |
| $100,000 to $149,999 | 221 | 31.8% |
| $150,000 to $199,999 | 94 | 13.5% |
| $200,000+ | 208 | 29.9% |
Family Income by Famaliy Size in Brookhaven
4-person families (94 | 13.5%) account for the highest median family income in Brookhaven with $172,273 per family, while 2-person families (432 | 62.1%) have the highest median income of $58,906 per family member.
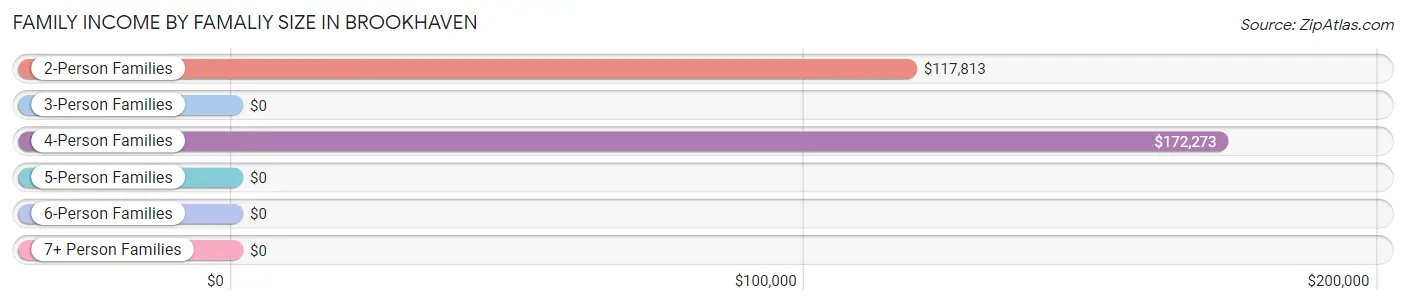
| Income Bracket | # Families | Median Income |
| 2-Person Families | 432 (62.1%) | $117,813 |
| 3-Person Families | 44 (6.3%) | $0 |
| 4-Person Families | 94 (13.5%) | $172,273 |
| 5-Person Families | 55 (7.9%) | $0 |
| 6-Person Families | 23 (3.3%) | $0 |
| 7+ Person Families | 48 (6.9%) | $0 |
| Total | 696 (100.0%) | $147,700 |
Family Income by Number of Earners in Brookhaven
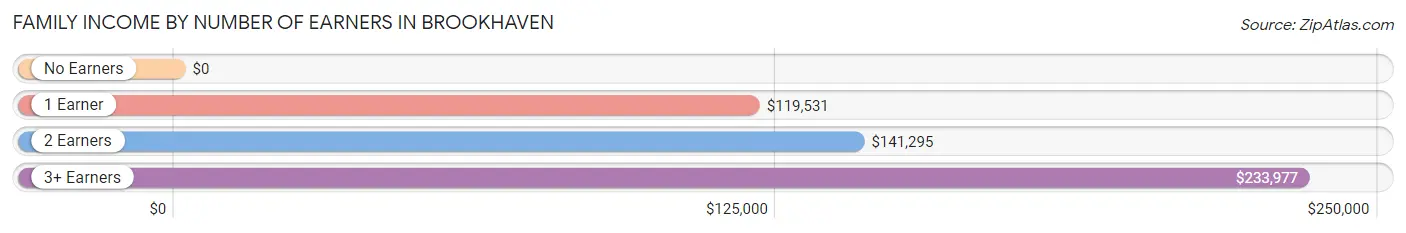
| Number of Earners | # Families | Median Income |
| No Earners | 99 (14.2%) | $0 |
| 1 Earner | 201 (28.9%) | $119,531 |
| 2 Earners | 303 (43.5%) | $141,295 |
| 3+ Earners | 93 (13.4%) | $233,977 |
| Total | 696 (100.0%) | $147,700 |
Household Income in Brookhaven
Household Income Brackets in Brookhaven
With 255 households falling in the category, the $100,000 to $149,999 income range is the most frequent in Brookhaven, accounting for 23.2% of all households. In contrast, only 8 households (0.7%) fall into the $10,000 to $14,999 income bracket, making it the least populous group.
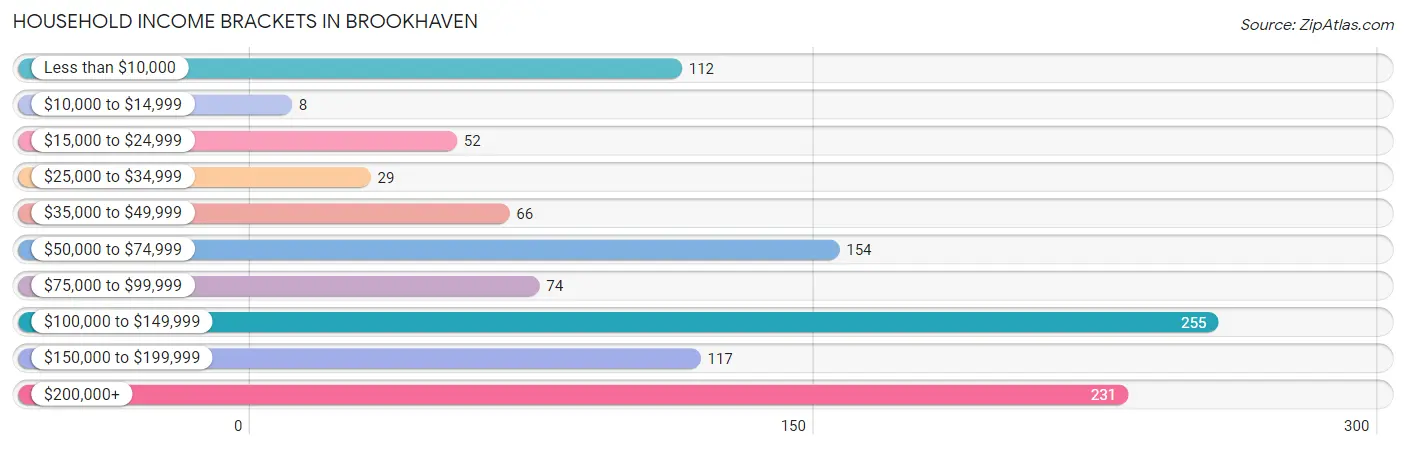
| Income Bracket | # Households | % Households |
| Less than $10,000 | 112 | 10.2% |
| $10,000 to $14,999 | 8 | 0.7% |
| $15,000 to $24,999 | 52 | 4.7% |
| $25,000 to $34,999 | 29 | 2.6% |
| $35,000 to $49,999 | 66 | 6.0% |
| $50,000 to $74,999 | 154 | 14.0% |
| $75,000 to $99,999 | 74 | 6.7% |
| $100,000 to $149,999 | 255 | 23.2% |
| $150,000 to $199,999 | 117 | 10.7% |
| $200,000+ | 231 | 21.0% |
Household Income by Householder Age in Brookhaven
The median household income in Brookhaven is $105,481, with the highest median household income of $133,750 found in the 25 to 44 years age bracket for the primary householder. A total of 242 households (22.0%) fall into this category.
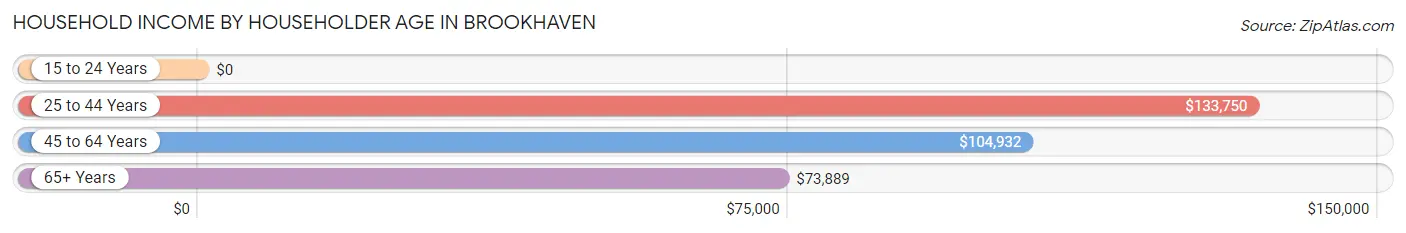
| Income Bracket | # Households | Median Income |
| 15 to 24 Years | 0 (0.0%) | $0 |
| 25 to 44 Years | 242 (22.0%) | $133,750 |
| 45 to 64 Years | 538 (49.0%) | $104,932 |
| 65+ Years | 318 (29.0%) | $73,889 |
| Total | 1,098 (100.0%) | $105,481 |
Poverty in Brookhaven
Income Below Poverty by Sex and Age in Brookhaven
With 12.2% poverty level for males and 15.8% for females among the residents of Brookhaven, 16 and 17 year old males and 25 to 34 year old females are the most vulnerable to poverty, with 10 males (41.7%) and 55 females (40.4%) in their respective age groups living below the poverty level.
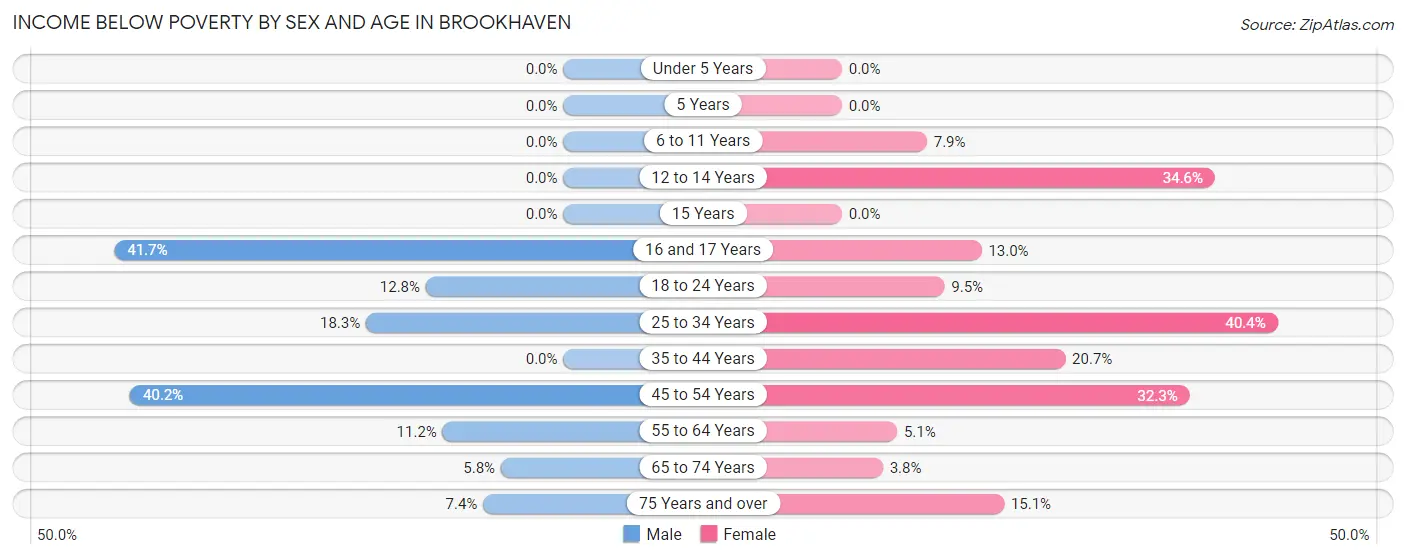
| Age Bracket | Male | Female |
| Under 5 Years | 0 (0.0%) | 0 (0.0%) |
| 5 Years | 0 (0.0%) | 0 (0.0%) |
| 6 to 11 Years | 0 (0.0%) | 9 (7.9%) |
| 12 to 14 Years | 0 (0.0%) | 9 (34.6%) |
| 15 Years | 0 (0.0%) | 0 (0.0%) |
| 16 and 17 Years | 10 (41.7%) | 7 (13.0%) |
| 18 to 24 Years | 25 (12.8%) | 14 (9.5%) |
| 25 to 34 Years | 26 (18.3%) | 55 (40.4%) |
| 35 to 44 Years | 0 (0.0%) | 40 (20.7%) |
| 45 to 54 Years | 74 (40.2%) | 61 (32.3%) |
| 55 to 64 Years | 40 (11.2%) | 13 (5.1%) |
| 65 to 74 Years | 11 (5.8%) | 6 (3.8%) |
| 75 Years and over | 9 (7.4%) | 14 (15.0%) |
| Total | 195 (12.2%) | 228 (15.8%) |
Income Above Poverty by Sex and Age in Brookhaven
According to the poverty statistics in Brookhaven, males aged under 5 years and females aged under 5 years are the age groups that are most secure financially, with 100.0% of males and 100.0% of females in these age groups living above the poverty line.
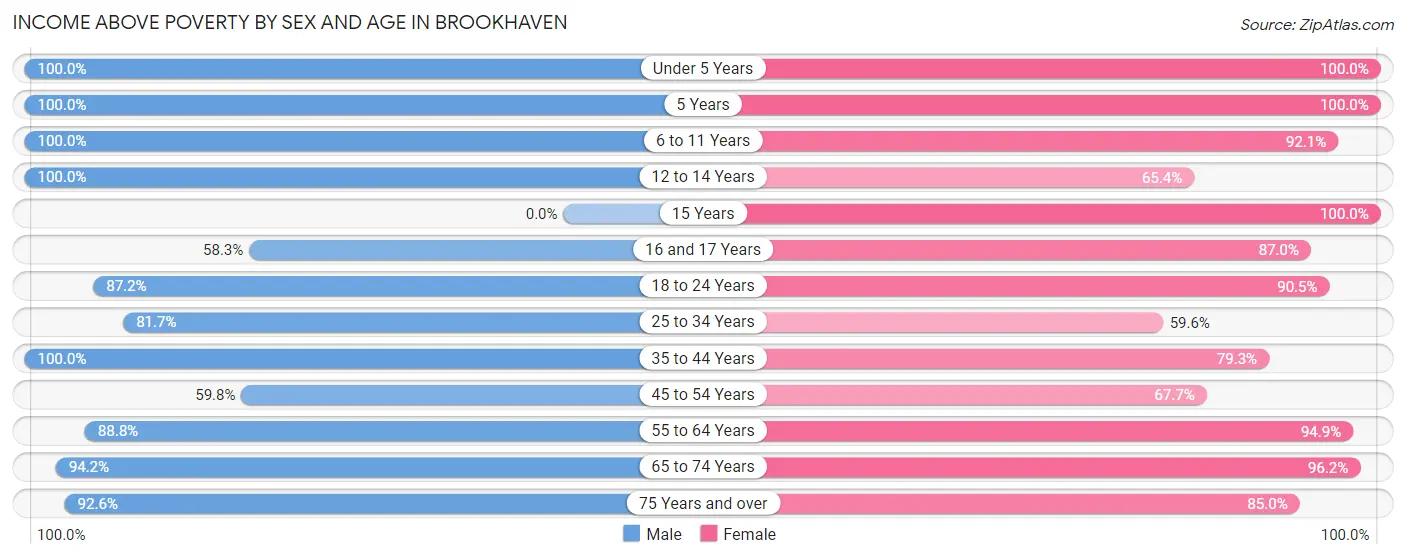
| Age Bracket | Male | Female |
| Under 5 Years | 56 (100.0%) | 47 (100.0%) |
| 5 Years | 15 (100.0%) | 14 (100.0%) |
| 6 to 11 Years | 133 (100.0%) | 105 (92.1%) |
| 12 to 14 Years | 16 (100.0%) | 17 (65.4%) |
| 15 Years | 0 (0.0%) | 16 (100.0%) |
| 16 and 17 Years | 14 (58.3%) | 47 (87.0%) |
| 18 to 24 Years | 171 (87.2%) | 133 (90.5%) |
| 25 to 34 Years | 116 (81.7%) | 81 (59.6%) |
| 35 to 44 Years | 169 (100.0%) | 153 (79.3%) |
| 45 to 54 Years | 110 (59.8%) | 128 (67.7%) |
| 55 to 64 Years | 317 (88.8%) | 241 (94.9%) |
| 65 to 74 Years | 179 (94.2%) | 152 (96.2%) |
| 75 Years and over | 112 (92.6%) | 79 (85.0%) |
| Total | 1,408 (87.8%) | 1,213 (84.2%) |
Income Below Poverty Among Married-Couple Families in Brookhaven
The poverty statistics for married-couple families in Brookhaven show that 3.5% or 21 of the total 600 families live below the poverty line. Families with no children have the highest poverty rate of 5.0%, comprising of 21 families. On the other hand, families with 1 or 2 children have the lowest poverty rate of 0.0%, which includes 0 families.
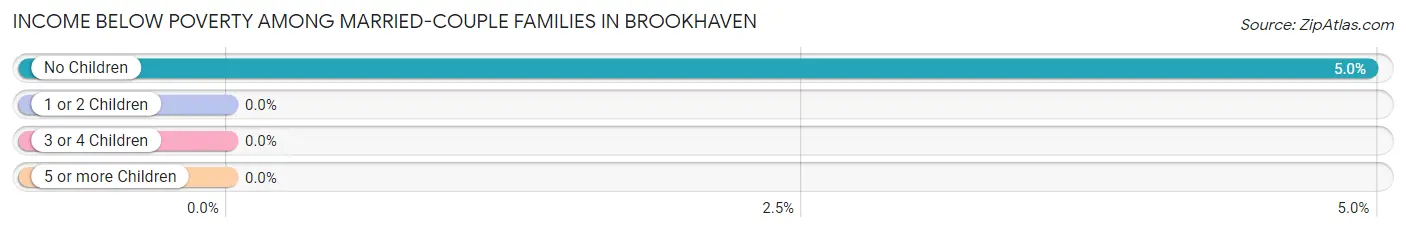
| Children | Above Poverty | Below Poverty |
| No Children | 402 (95.0%) | 21 (5.0%) |
| 1 or 2 Children | 114 (100.0%) | 0 (0.0%) |
| 3 or 4 Children | 63 (100.0%) | 0 (0.0%) |
| 5 or more Children | 0 (0.0%) | 0 (0.0%) |
| Total | 579 (96.5%) | 21 (3.5%) |
Income Below Poverty Among Single-Parent Households in Brookhaven
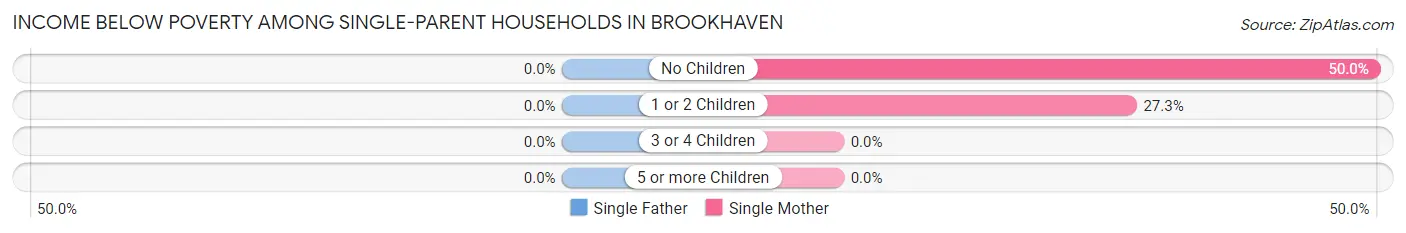
| Children | Single Father | Single Mother |
| No Children | 0 (0.0%) | 10 (50.0%) |
| 1 or 2 Children | 0 (0.0%) | 9 (27.3%) |
| 3 or 4 Children | 0 (0.0%) | 0 (0.0%) |
| 5 or more Children | 0 (0.0%) | 0 (0.0%) |
| Total | 0 (0.0%) | 19 (28.4%) |
Income Below Poverty Among Married-Couple vs Single-Parent Households in Brookhaven
The poverty data for Brookhaven shows that 21 of the married-couple family households (3.5%) and 19 of the single-parent households (19.8%) are living below the poverty level. Within the married-couple family households, those with no children have the highest poverty rate, with 21 households (5.0%) falling below the poverty line. Among the single-parent households, those with 1 or 2 children have the highest poverty rate, with 9 household (27.3%) living below poverty.
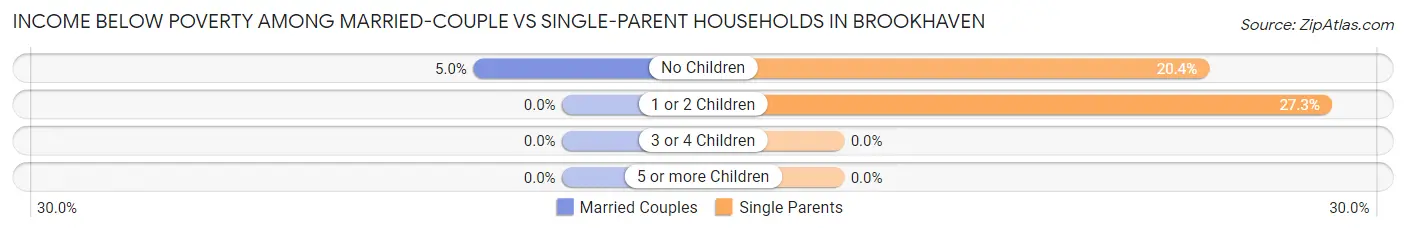
| Children | Married-Couple Families | Single-Parent Households |
| No Children | 21 (5.0%) | 10 (20.4%) |
| 1 or 2 Children | 0 (0.0%) | 9 (27.3%) |
| 3 or 4 Children | 0 (0.0%) | 0 (0.0%) |
| 5 or more Children | 0 (0.0%) | 0 (0.0%) |
| Total | 21 (3.5%) | 19 (19.8%) |
Race in Brookhaven
The most populous races in Brookhaven are White / Caucasian (2,944 | 86.4%), Hispanic or Latino (277 | 8.1%), and Black / African American (234 | 6.9%).
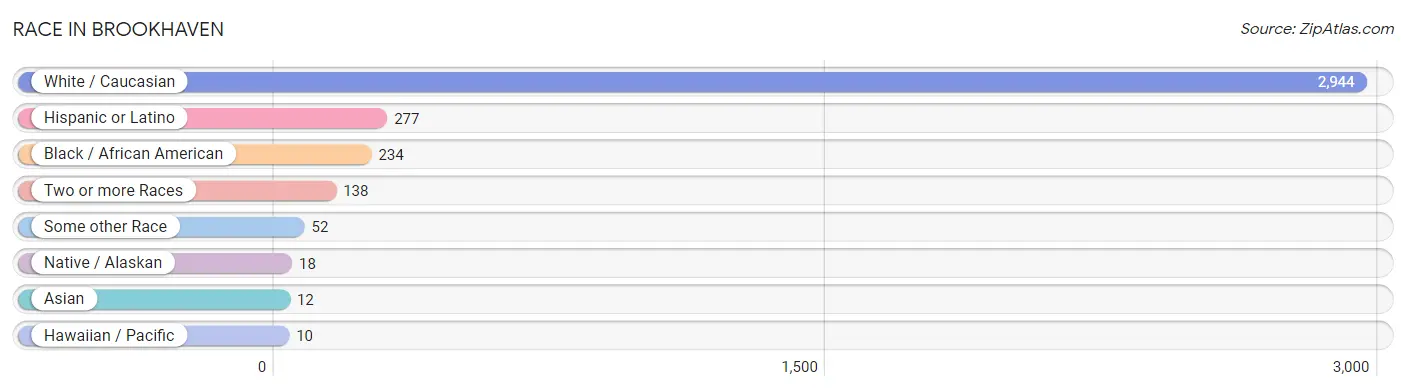
| Race | # Population | % Population |
| Asian | 12 | 0.4% |
| Black / African American | 234 | 6.9% |
| Hawaiian / Pacific | 10 | 0.3% |
| Hispanic or Latino | 277 | 8.1% |
| Native / Alaskan | 18 | 0.5% |
| White / Caucasian | 2,944 | 86.4% |
| Two or more Races | 138 | 4.1% |
| Some other Race | 52 | 1.5% |
| Total | 3,408 | 100.0% |
Ancestry in Brookhaven
The most populous ancestries reported in Brookhaven are Irish (887 | 26.0%), Italian (831 | 24.4%), German (476 | 14.0%), English (213 | 6.2%), and Polish (152 | 4.5%), together accounting for 75.1% of all Brookhaven residents.
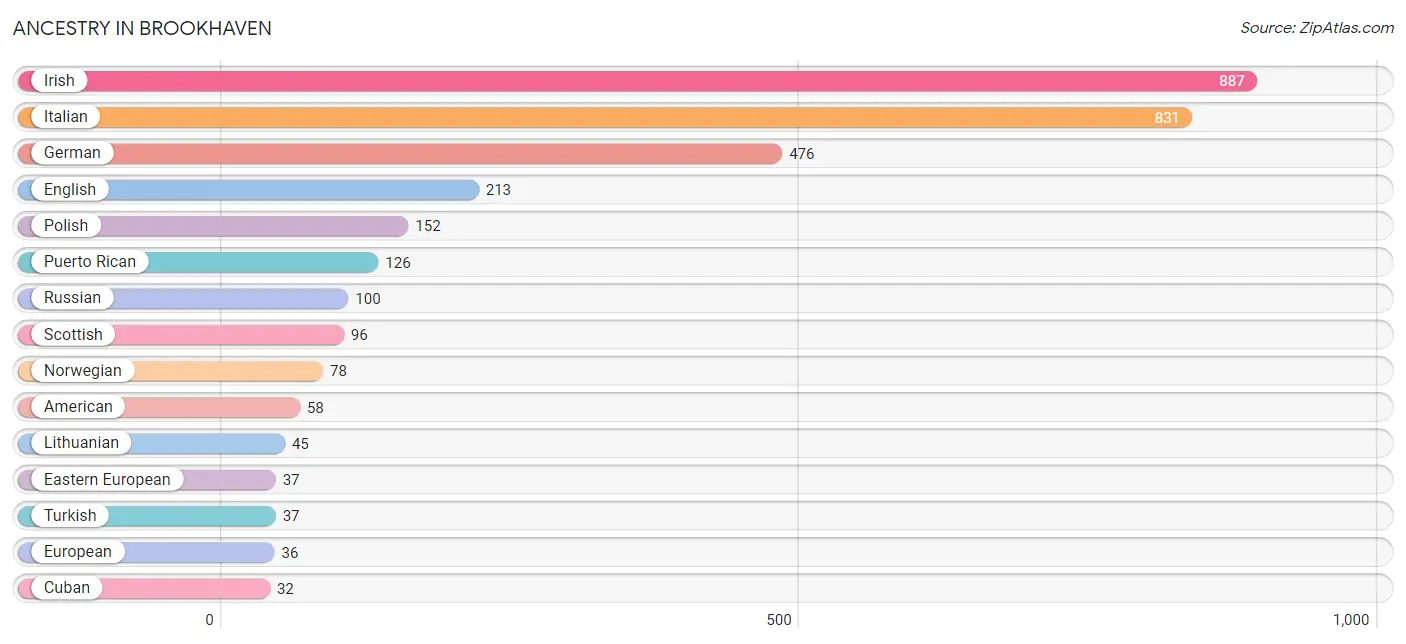
| Ancestry | # Population | % Population |
| African | 22 | 0.6% |
| American | 58 | 1.7% |
| British | 6 | 0.2% |
| Central American | 22 | 0.6% |
| Chilean | 22 | 0.6% |
| Croatian | 10 | 0.3% |
| Cuban | 32 | 0.9% |
| Czech | 20 | 0.6% |
| Danish | 26 | 0.8% |
| Dominican | 15 | 0.4% |
| Eastern European | 37 | 1.1% |
| English | 213 | 6.2% |
| European | 36 | 1.1% |
| French | 10 | 0.3% |
| French Canadian | 10 | 0.3% |
| German | 476 | 14.0% |
| Greek | 20 | 0.6% |
| Haitian | 13 | 0.4% |
| Indian (Asian) | 12 | 0.4% |
| Irish | 887 | 26.0% |
| Italian | 831 | 24.4% |
| Lithuanian | 45 | 1.3% |
| Norwegian | 78 | 2.3% |
| Polish | 152 | 4.5% |
| Portuguese | 15 | 0.4% |
| Puerto Rican | 126 | 3.7% |
| Russian | 100 | 2.9% |
| Salvadoran | 22 | 0.6% |
| Scotch-Irish | 31 | 0.9% |
| Scottish | 96 | 2.8% |
| South American | 22 | 0.6% |
| Spanish | 32 | 0.9% |
| Subsaharan African | 22 | 0.6% |
| Swedish | 10 | 0.3% |
| Swiss | 10 | 0.3% |
| Turkish | 37 | 1.1% | View All 36 Rows |
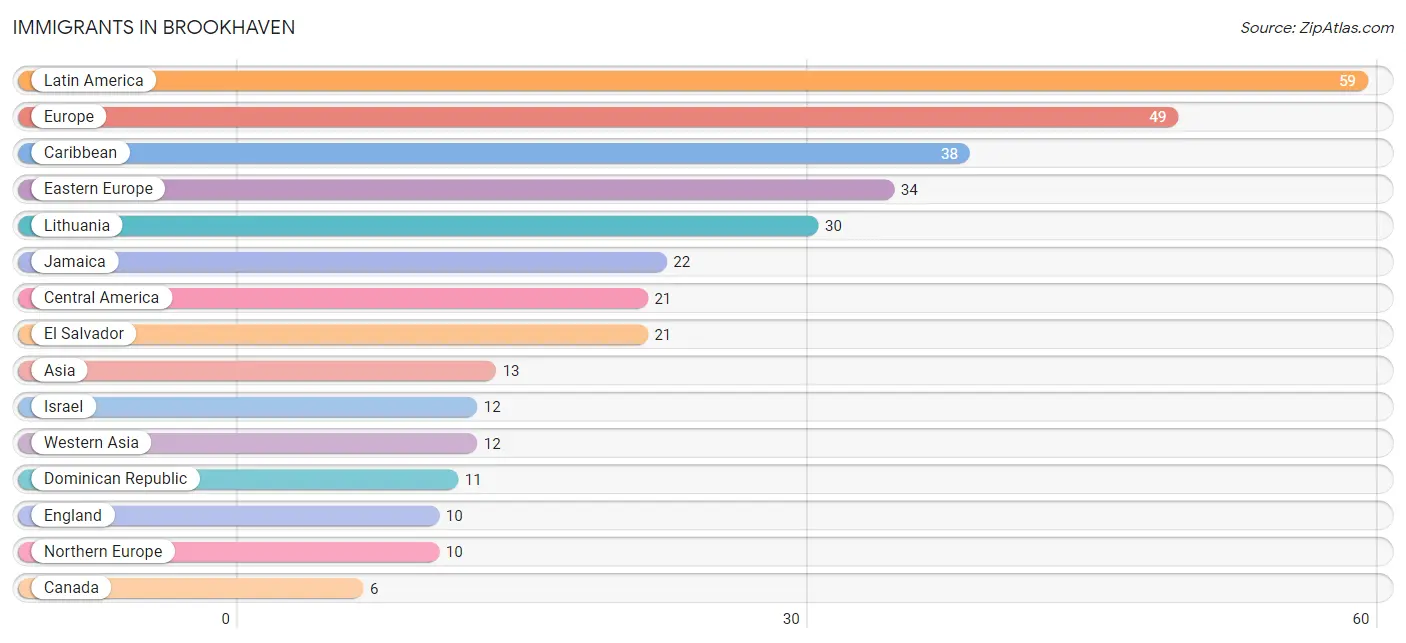
Immigrants in Brookhaven
The most numerous immigrant groups reported in Brookhaven came from Latin America (59 | 1.7%), Europe (49 | 1.4%), Caribbean (38 | 1.1%), Eastern Europe (34 | 1.0%), and Lithuania (30 | 0.9%), together accounting for 6.2% of all Brookhaven residents.
| Immigration Origin | # Population | % Population |
| Asia | 13 | 0.4% |
| Canada | 6 | 0.2% |
| Caribbean | 38 | 1.1% |
| Central America | 21 | 0.6% |
| China | 1 | 0.0% |
| Dominican Republic | 11 | 0.3% |
| Eastern Asia | 1 | 0.0% |
| Eastern Europe | 34 | 1.0% |
| El Salvador | 21 | 0.6% |
| England | 10 | 0.3% |
| Europe | 49 | 1.4% |
| Germany | 5 | 0.2% |
| Haiti | 5 | 0.2% |
| Israel | 12 | 0.4% |
| Jamaica | 22 | 0.6% |
| Latin America | 59 | 1.7% |
| Lithuania | 30 | 0.9% |
| Northern Europe | 10 | 0.3% |
| Poland | 4 | 0.1% |
| Western Asia | 12 | 0.4% |
| Western Europe | 5 | 0.2% | View All 21 Rows |
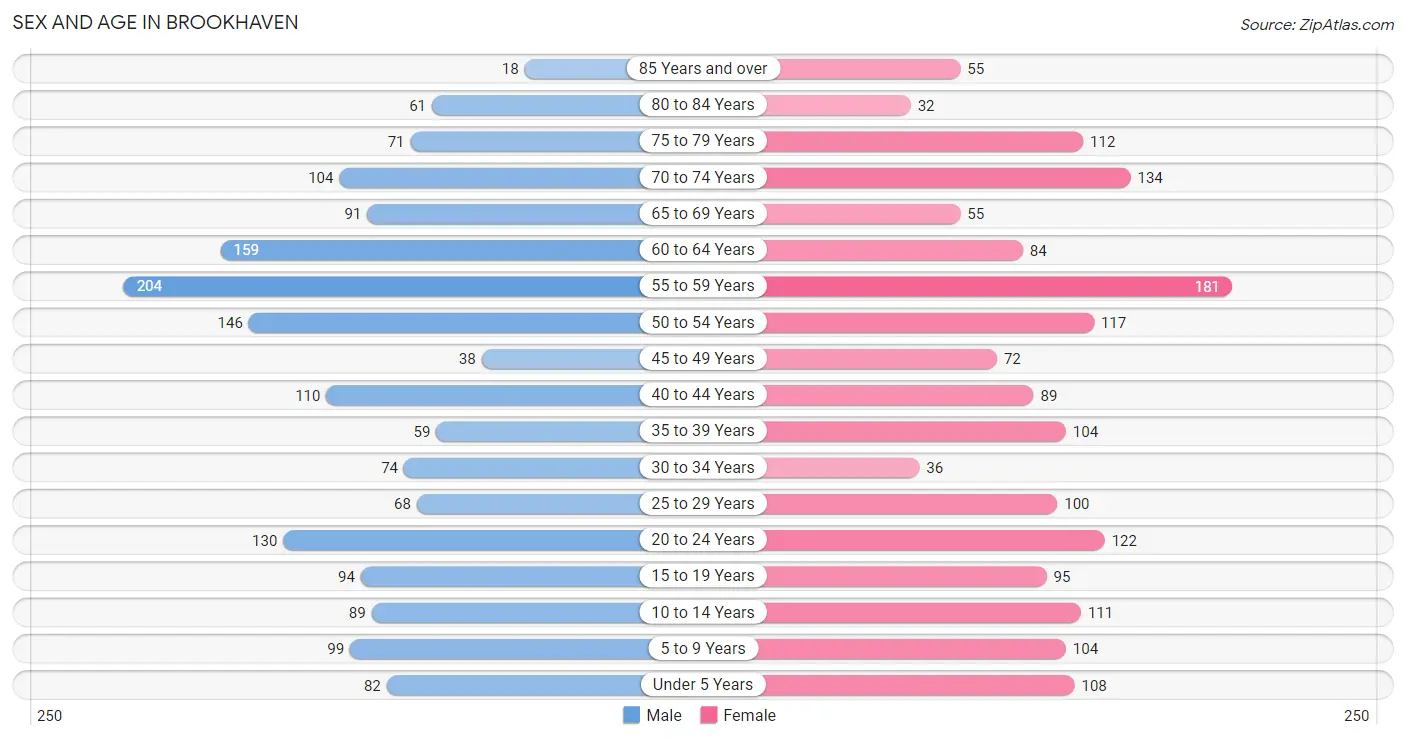
Sex and Age in Brookhaven
Sex and Age in Brookhaven
The most populous age groups in Brookhaven are 55 to 59 Years (204 | 12.0%) for men and 55 to 59 Years (181 | 10.6%) for women.
| Age Bracket | Male | Female |
| Under 5 Years | 82 (4.8%) | 108 (6.3%) |
| 5 to 9 Years | 99 (5.8%) | 104 (6.1%) |
| 10 to 14 Years | 89 (5.2%) | 111 (6.5%) |
| 15 to 19 Years | 94 (5.5%) | 95 (5.6%) |
| 20 to 24 Years | 130 (7.7%) | 122 (7.1%) |
| 25 to 29 Years | 68 (4.0%) | 100 (5.8%) |
| 30 to 34 Years | 74 (4.4%) | 36 (2.1%) |
| 35 to 39 Years | 59 (3.5%) | 104 (6.1%) |
| 40 to 44 Years | 110 (6.5%) | 89 (5.2%) |
| 45 to 49 Years | 38 (2.2%) | 72 (4.2%) |
| 50 to 54 Years | 146 (8.6%) | 117 (6.8%) |
| 55 to 59 Years | 204 (12.0%) | 181 (10.6%) |
| 60 to 64 Years | 159 (9.4%) | 84 (4.9%) |
| 65 to 69 Years | 91 (5.4%) | 55 (3.2%) |
| 70 to 74 Years | 104 (6.1%) | 134 (7.8%) |
| 75 to 79 Years | 71 (4.2%) | 112 (6.6%) |
| 80 to 84 Years | 61 (3.6%) | 32 (1.9%) |
| 85 Years and over | 18 (1.1%) | 55 (3.2%) |
| Total | 1,697 (100.0%) | 1,711 (100.0%) |
Families and Households in Brookhaven
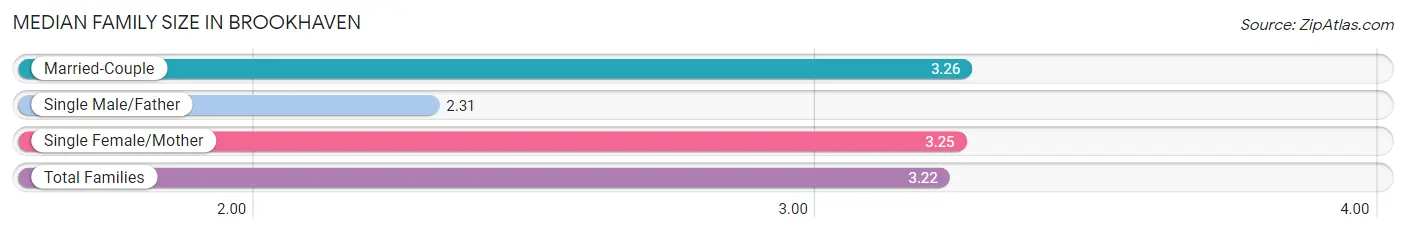
Median Family Size in Brookhaven
The median family size in Brookhaven is 3.22 persons per family, with married-couple families (600 | 86.2%) accounting for the largest median family size of 3.26 persons per family. On the other hand, single male/father families (29 | 4.2%) represent the smallest median family size with 2.31 persons per family.
| Family Type | # Families | Family Size |
| Married-Couple | 600 (86.2%) | 3.26 |
| Single Male/Father | 29 (4.2%) | 2.31 |
| Single Female/Mother | 67 (9.6%) | 3.25 |
| Total Families | 696 (100.0%) | 3.22 |
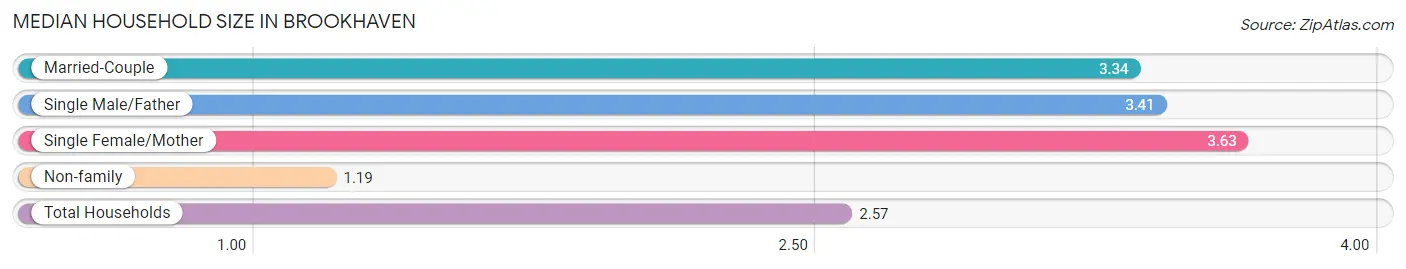
Median Household Size in Brookhaven
The median household size in Brookhaven is 2.57 persons per household, with single female/mother households (67 | 6.1%) accounting for the largest median household size of 3.63 persons per household. non-family households (402 | 36.6%) represent the smallest median household size with 1.19 persons per household.
| Household Type | # Households | Household Size |
| Married-Couple | 600 (54.6%) | 3.34 |
| Single Male/Father | 29 (2.6%) | 3.41 |
| Single Female/Mother | 67 (6.1%) | 3.63 |
| Non-family | 402 (36.6%) | 1.19 |
| Total Households | 1,098 (100.0%) | 2.57 |
Household Size by Marriage Status in Brookhaven
Out of a total of 1,098 households in Brookhaven, 696 (63.4%) are family households, while 402 (36.6%) are nonfamily households. The most numerous type of family households are 2-person households, comprising 379, and the most common type of nonfamily households are 1-person households, comprising 336.
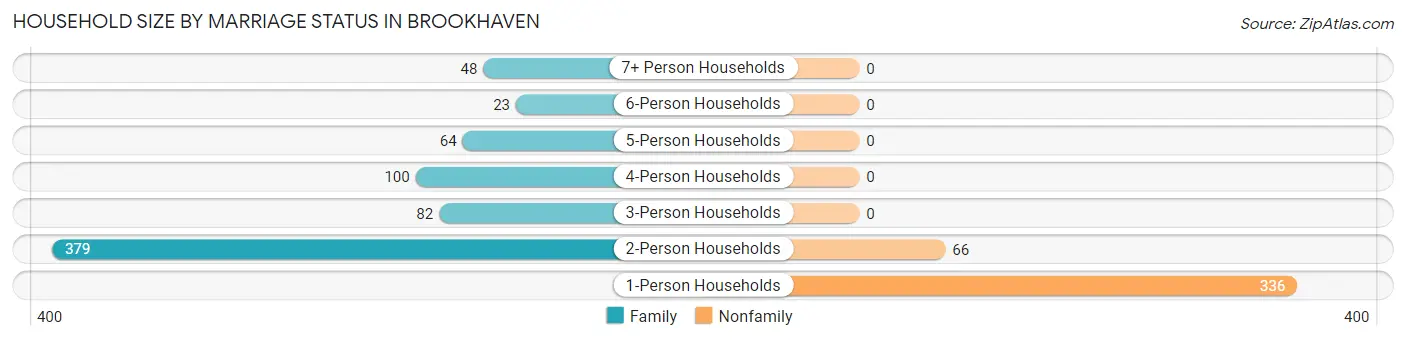
| Household Size | Family Households | Nonfamily Households |
| 1-Person Households | - | 336 (30.6%) |
| 2-Person Households | 379 (34.5%) | 66 (6.0%) |
| 3-Person Households | 82 (7.5%) | 0 (0.0%) |
| 4-Person Households | 100 (9.1%) | 0 (0.0%) |
| 5-Person Households | 64 (5.8%) | 0 (0.0%) |
| 6-Person Households | 23 (2.1%) | 0 (0.0%) |
| 7+ Person Households | 48 (4.4%) | 0 (0.0%) |
| Total | 696 (63.4%) | 402 (36.6%) |
Female Fertility in Brookhaven
Fertility by Age in Brookhaven
Average fertility rate in Brookhaven is 22.0 births per 1,000 women. Women in the age bracket of 20 to 34 years have the highest fertility rate with 54.0 births per 1,000 women. Women in the age bracket of 20 to 34 years acount for 100.0% of all women with births.
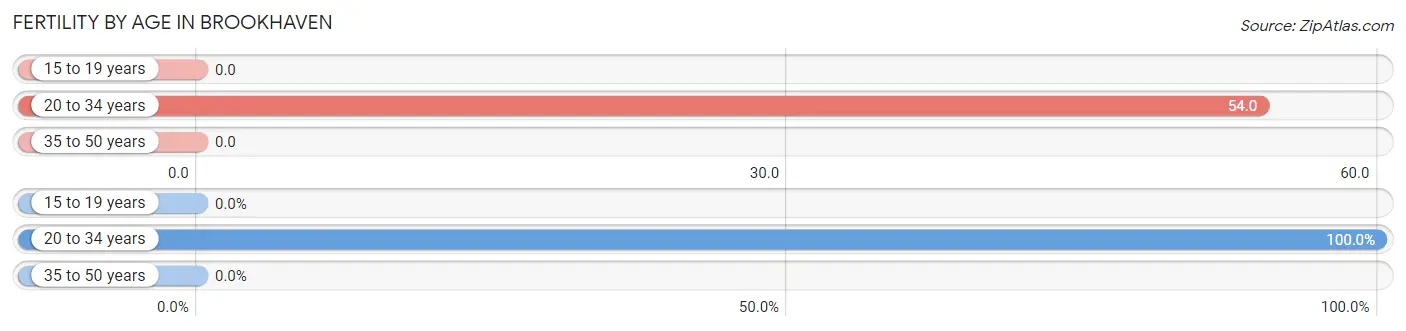
| Age Bracket | Women with Births | Births / 1,000 Women |
| 15 to 19 years | 0 (0.0%) | 0.0 |
| 20 to 34 years | 14 (100.0%) | 54.0 |
| 35 to 50 years | 0 (0.0%) | 0.0 |
| Total | 14 (100.0%) | 22.0 |
Fertility by Age by Marriage Status in Brookhaven
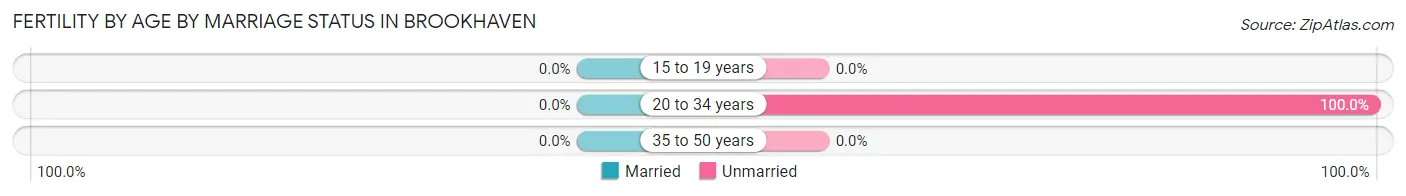
| Age Bracket | Married | Unmarried |
| 15 to 19 years | 0 (0.0%) | 0 (0.0%) |
| 20 to 34 years | 0 (0.0%) | 14 (100.0%) |
| 35 to 50 years | 0 (0.0%) | 0 (0.0%) |
| Total | 0 (0.0%) | 14 (100.0%) |
Fertility by Education in Brookhaven
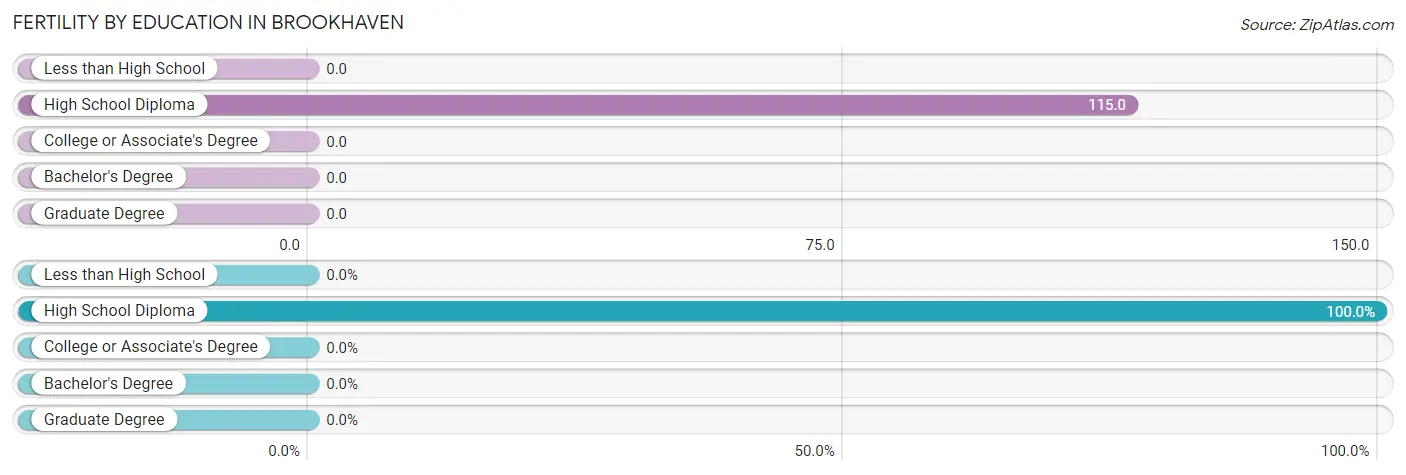
| Educational Attainment | Women with Births | Births / 1,000 Women |
| Less than High School | 0 (0.0%) | 0.0 |
| High School Diploma | 14 (100.0%) | 115.0 |
| College or Associate's Degree | 0 (0.0%) | 0.0 |
| Bachelor's Degree | 0 (0.0%) | 0.0 |
| Graduate Degree | 0 (0.0%) | 0.0 |
| Total | 14 (100.0%) | 22.0 |
Fertility by Education by Marriage Status in Brookhaven
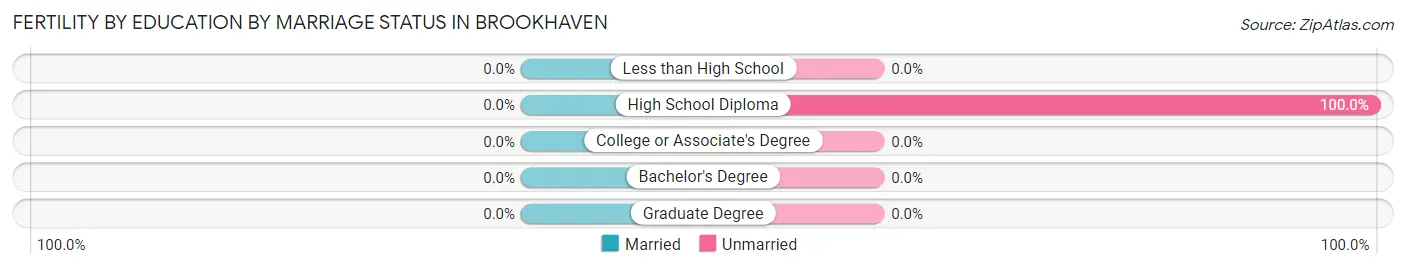
| Educational Attainment | Married | Unmarried |
| Less than High School | 0 (0.0%) | 0 (0.0%) |
| High School Diploma | 0 (0.0%) | 14 (100.0%) |
| College or Associate's Degree | 0 (0.0%) | 0 (0.0%) |
| Bachelor's Degree | 0 (0.0%) | 0 (0.0%) |
| Graduate Degree | 0 (0.0%) | 0 (0.0%) |
| Total | 0 (0.0%) | 14 (100.0%) |
Employment Characteristics in Brookhaven
Employment by Class of Employer in Brookhaven
Among the 1,456 employed individuals in Brookhaven, private company employees (782 | 53.7%), local government employees (329 | 22.6%), and not-for-profit organizations (100 | 6.9%) make up the most common classes of employment.
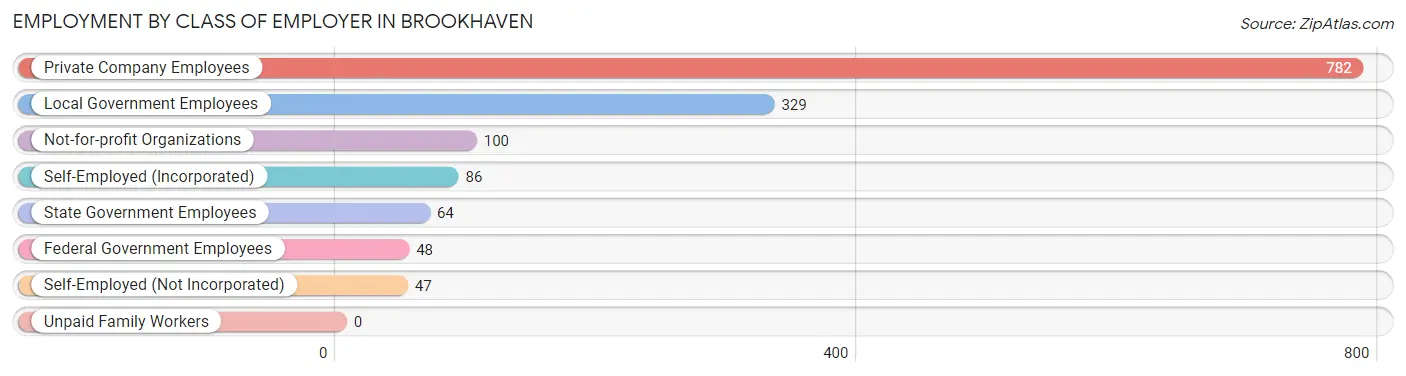
| Employer Class | # Employees | % Employees |
| Private Company Employees | 782 | 53.7% |
| Self-Employed (Incorporated) | 86 | 5.9% |
| Self-Employed (Not Incorporated) | 47 | 3.2% |
| Not-for-profit Organizations | 100 | 6.9% |
| Local Government Employees | 329 | 22.6% |
| State Government Employees | 64 | 4.4% |
| Federal Government Employees | 48 | 3.3% |
| Unpaid Family Workers | 0 | 0.0% |
| Total | 1,456 | 100.0% |
Employment Status by Age in Brookhaven
According to the labor force statistics for Brookhaven, out of the total population over 16 years of age (2,799), 59.6% or 1,668 individuals are in the labor force, with 10.7% or 178 of them unemployed. The age group with the highest labor force participation rate is 30 to 34 years, with 92.7% or 102 individuals in the labor force. Within the labor force, the 25 to 29 years age range has the highest percentage of unemployed individuals, with 28.5% or 41 of them being unemployed.
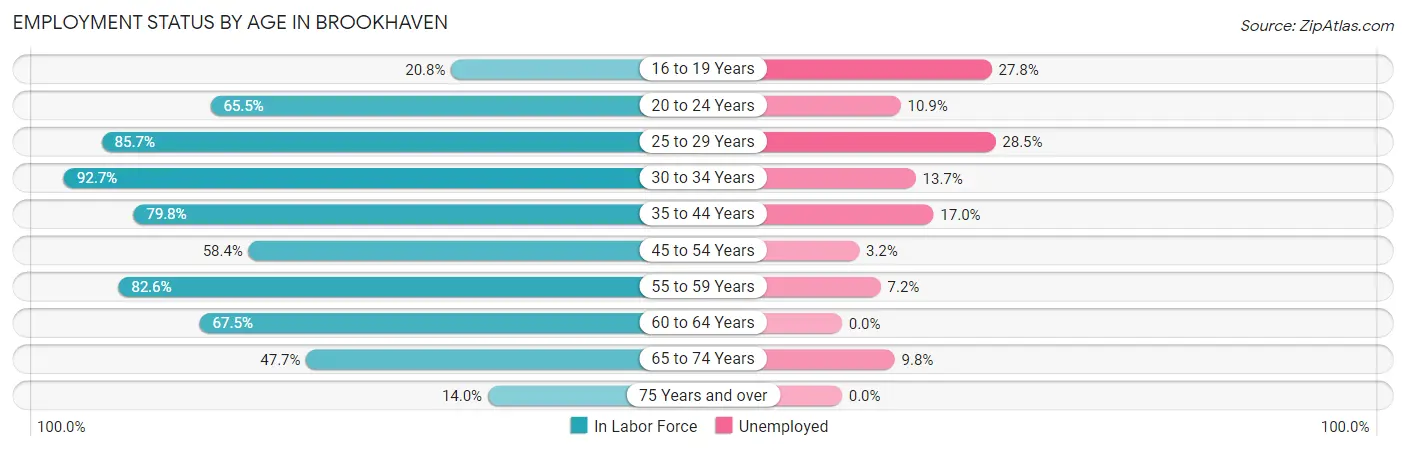
| Age Bracket | In Labor Force | Unemployed |
| 16 to 19 Years | 36 (20.8%) | 10 (27.8%) |
| 20 to 24 Years | 165 (65.5%) | 18 (10.9%) |
| 25 to 29 Years | 144 (85.7%) | 41 (28.5%) |
| 30 to 34 Years | 102 (92.7%) | 14 (13.7%) |
| 35 to 44 Years | 289 (79.8%) | 49 (17.0%) |
| 45 to 54 Years | 218 (58.4%) | 7 (3.2%) |
| 55 to 59 Years | 318 (82.6%) | 23 (7.2%) |
| 60 to 64 Years | 164 (67.5%) | 0 (0.0%) |
| 65 to 74 Years | 183 (47.7%) | 18 (9.8%) |
| 75 Years and over | 49 (14.0%) | 0 (0.0%) |
| Total | 1,668 (59.6%) | 178 (10.7%) |
Employment Status by Educational Attainment in Brookhaven
According to labor force statistics for Brookhaven, 75.3% of individuals (1,236) out of the total population between 25 and 64 years of age (1,641) are in the labor force, with 10.7% or 132 of them being unemployed. The group with the highest labor force participation rate are those with the educational attainment of bachelor's degree or higher, with 86.3% or 503 individuals in the labor force. Within the labor force, individuals with less than high school education have the highest percentage of unemployment, with 50.0% or 20 of them being unemployed.
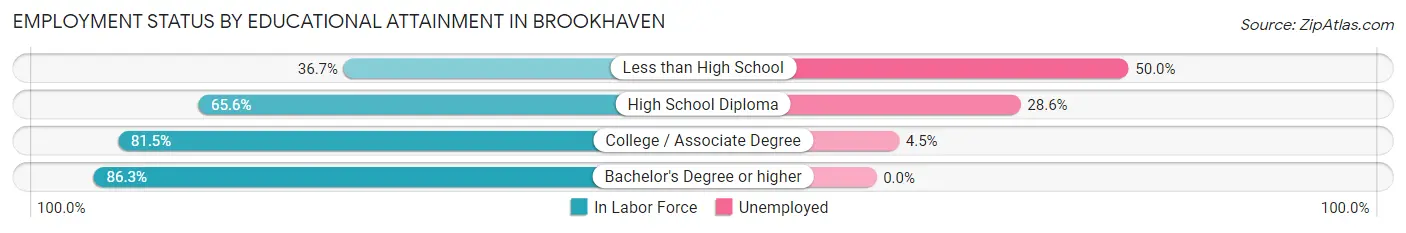
| Educational Attainment | In Labor Force | Unemployed |
| Less than High School | 40 (36.7%) | 54 (50.0%) |
| High School Diploma | 336 (65.6%) | 146 (28.6%) |
| College / Associate Degree | 356 (81.5%) | 20 (4.5%) |
| Bachelor's Degree or higher | 503 (86.3%) | 0 (0.0%) |
| Total | 1,236 (75.3%) | 176 (10.7%) |
Employment Occupations by Sex in Brookhaven
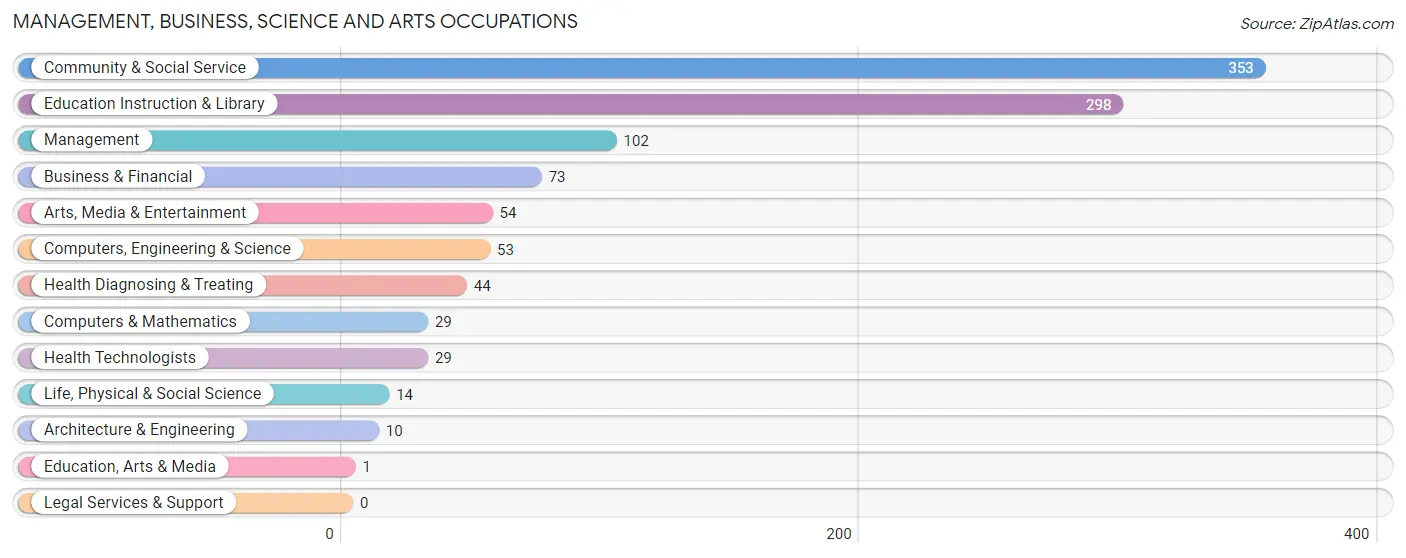
Management, Business, Science and Arts Occupations
The most common Management, Business, Science and Arts occupations in Brookhaven are Community & Social Service (353 | 23.8%), Education Instruction & Library (298 | 20.1%), Management (102 | 6.9%), Business & Financial (73 | 4.9%), and Arts, Media & Entertainment (54 | 3.6%).
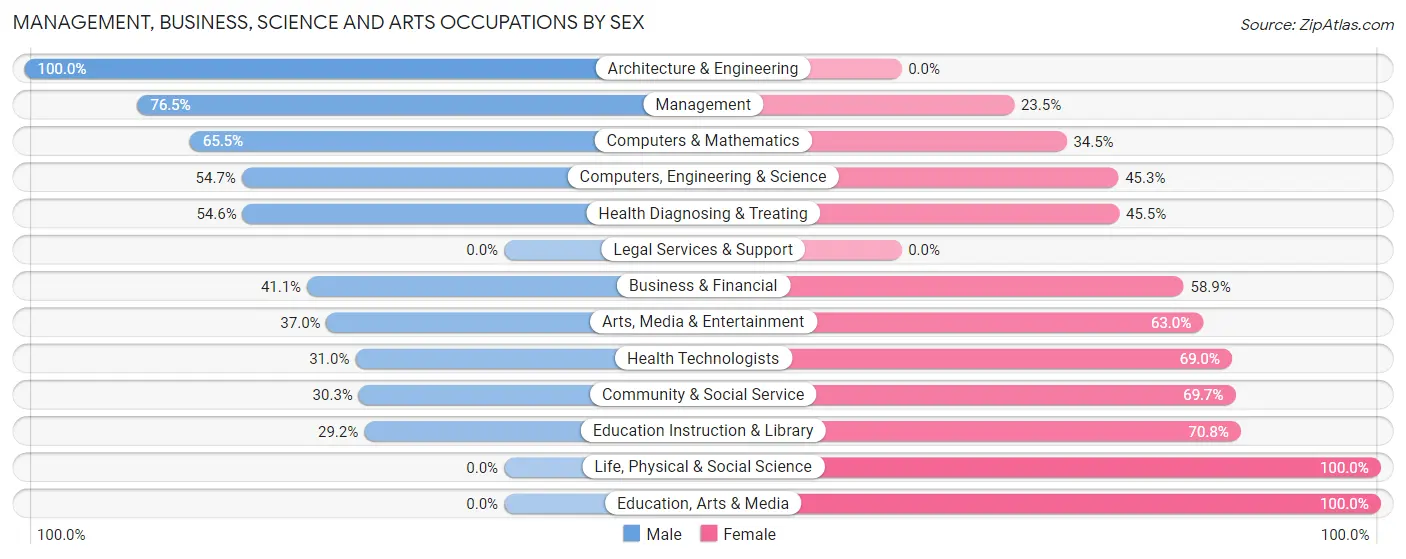
Management, Business, Science and Arts Occupations by Sex
Within the Management, Business, Science and Arts occupations in Brookhaven, the most male-oriented occupations are Architecture & Engineering (100.0%), Management (76.5%), and Computers & Mathematics (65.5%), while the most female-oriented occupations are Life, Physical & Social Science (100.0%), Education, Arts & Media (100.0%), and Education Instruction & Library (70.8%).
| Occupation | Male | Female |
| Management | 78 (76.5%) | 24 (23.5%) |
| Business & Financial | 30 (41.1%) | 43 (58.9%) |
| Computers, Engineering & Science | 29 (54.7%) | 24 (45.3%) |
| Computers & Mathematics | 19 (65.5%) | 10 (34.5%) |
| Architecture & Engineering | 10 (100.0%) | 0 (0.0%) |
| Life, Physical & Social Science | 0 (0.0%) | 14 (100.0%) |
| Community & Social Service | 107 (30.3%) | 246 (69.7%) |
| Education, Arts & Media | 0 (0.0%) | 1 (100.0%) |
| Legal Services & Support | 0 (0.0%) | 0 (0.0%) |
| Education Instruction & Library | 87 (29.2%) | 211 (70.8%) |
| Arts, Media & Entertainment | 20 (37.0%) | 34 (63.0%) |
| Health Diagnosing & Treating | 24 (54.5%) | 20 (45.5%) |
| Health Technologists | 9 (31.0%) | 20 (69.0%) |
| Total (Category) | 268 (42.9%) | 357 (57.1%) |
| Total (Overall) | 824 (55.6%) | 659 (44.4%) |
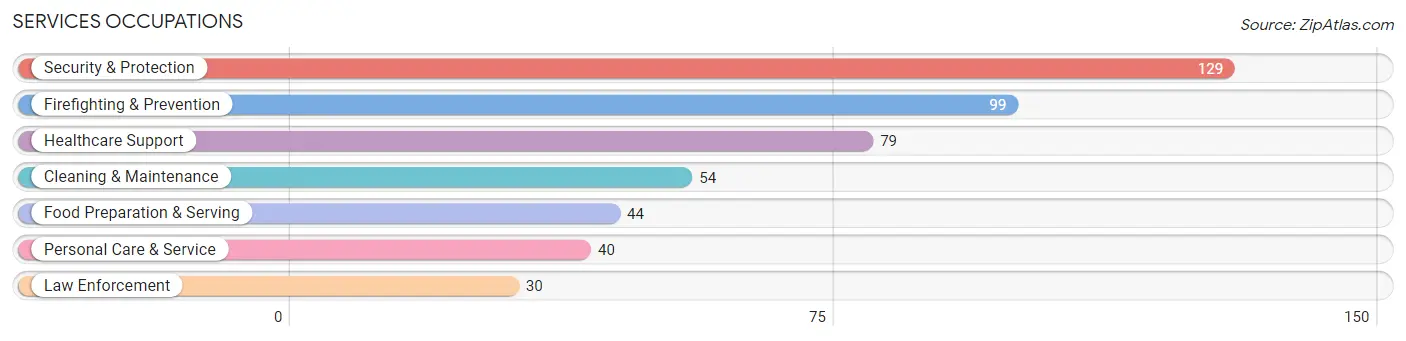
Services Occupations
The most common Services occupations in Brookhaven are Security & Protection (129 | 8.7%), Firefighting & Prevention (99 | 6.7%), Healthcare Support (79 | 5.3%), Cleaning & Maintenance (54 | 3.6%), and Food Preparation & Serving (44 | 3.0%).
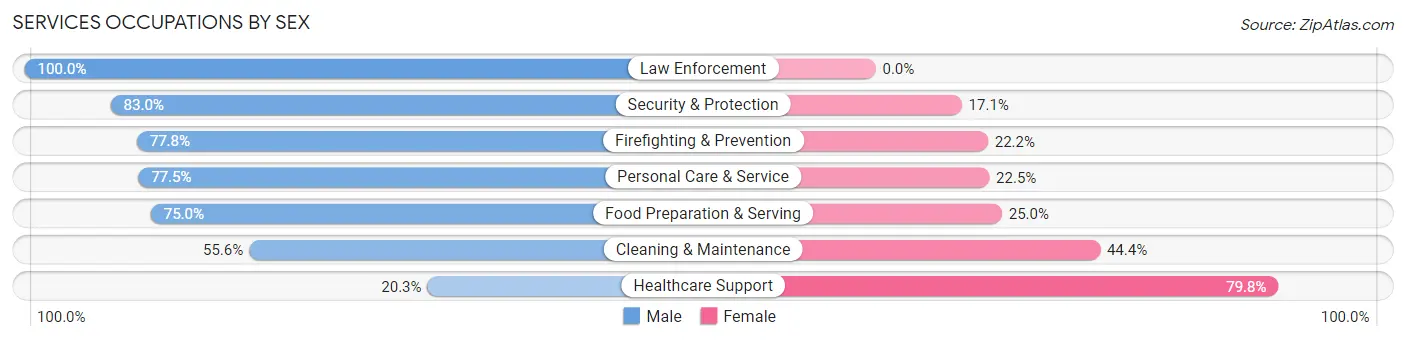
Services Occupations by Sex
Within the Services occupations in Brookhaven, the most male-oriented occupations are Law Enforcement (100.0%), Security & Protection (83.0%), and Firefighting & Prevention (77.8%), while the most female-oriented occupations are Healthcare Support (79.7%), Cleaning & Maintenance (44.4%), and Food Preparation & Serving (25.0%).
| Occupation | Male | Female |
| Healthcare Support | 16 (20.3%) | 63 (79.7%) |
| Security & Protection | 107 (83.0%) | 22 (17.1%) |
| Firefighting & Prevention | 77 (77.8%) | 22 (22.2%) |
| Law Enforcement | 30 (100.0%) | 0 (0.0%) |
| Food Preparation & Serving | 33 (75.0%) | 11 (25.0%) |
| Cleaning & Maintenance | 30 (55.6%) | 24 (44.4%) |
| Personal Care & Service | 31 (77.5%) | 9 (22.5%) |
| Total (Category) | 217 (62.7%) | 129 (37.3%) |
| Total (Overall) | 824 (55.6%) | 659 (44.4%) |
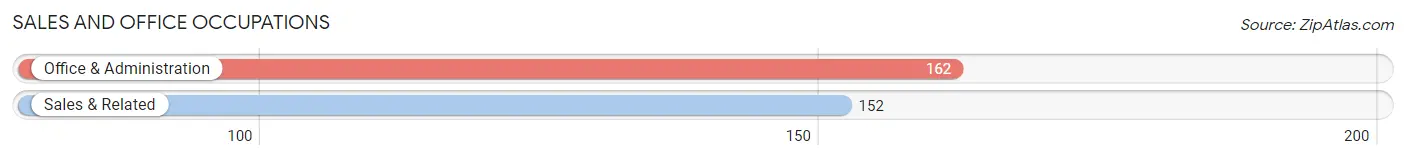
Sales and Office Occupations
The most common Sales and Office occupations in Brookhaven are Office & Administration (162 | 10.9%), and Sales & Related (152 | 10.2%).
Sales and Office Occupations by Sex
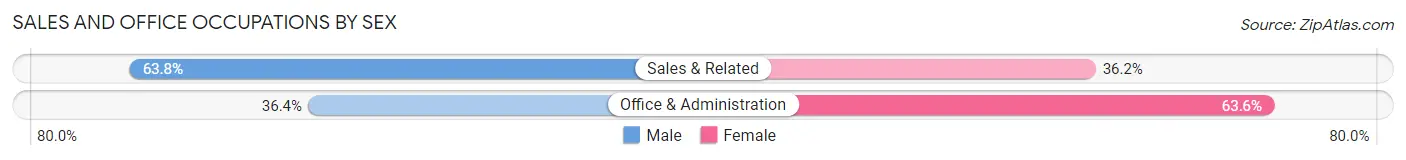
| Occupation | Male | Female |
| Sales & Related | 97 (63.8%) | 55 (36.2%) |
| Office & Administration | 59 (36.4%) | 103 (63.6%) |
| Total (Category) | 156 (49.7%) | 158 (50.3%) |
| Total (Overall) | 824 (55.6%) | 659 (44.4%) |
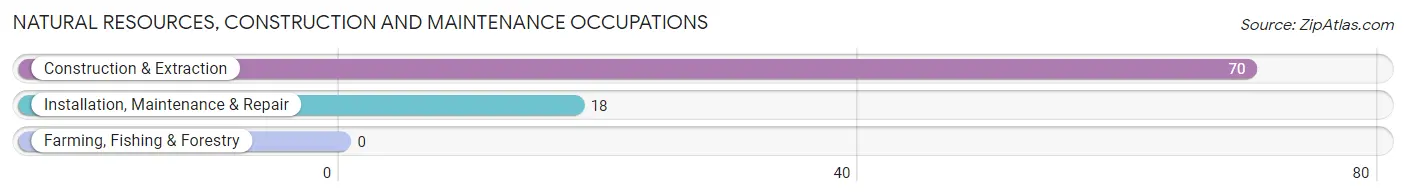
Natural Resources, Construction and Maintenance Occupations
The most common Natural Resources, Construction and Maintenance occupations in Brookhaven are Construction & Extraction (70 | 4.7%), and Installation, Maintenance & Repair (18 | 1.2%).
Natural Resources, Construction and Maintenance Occupations by Sex
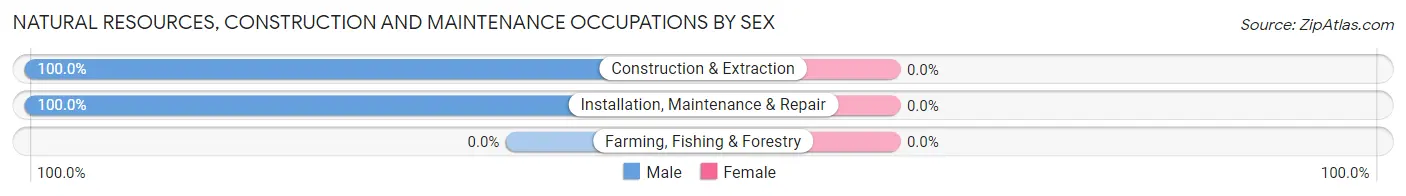
| Occupation | Male | Female |
| Farming, Fishing & Forestry | 0 (0.0%) | 0 (0.0%) |
| Construction & Extraction | 70 (100.0%) | 0 (0.0%) |
| Installation, Maintenance & Repair | 18 (100.0%) | 0 (0.0%) |
| Total (Category) | 88 (100.0%) | 0 (0.0%) |
| Total (Overall) | 824 (55.6%) | 659 (44.4%) |
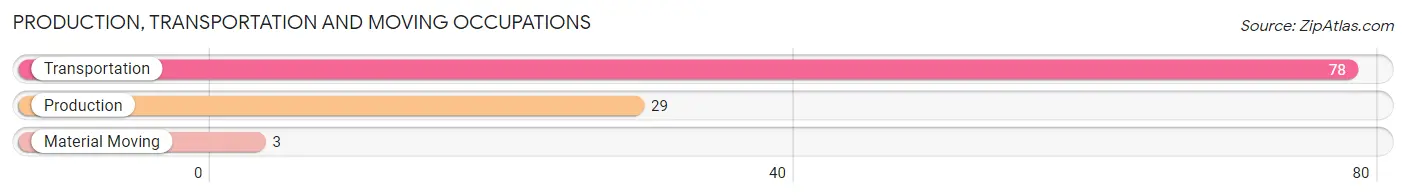
Production, Transportation and Moving Occupations
The most common Production, Transportation and Moving occupations in Brookhaven are Transportation (78 | 5.3%), Production (29 | 2.0%), and Material Moving (3 | 0.2%).
Production, Transportation and Moving Occupations by Sex
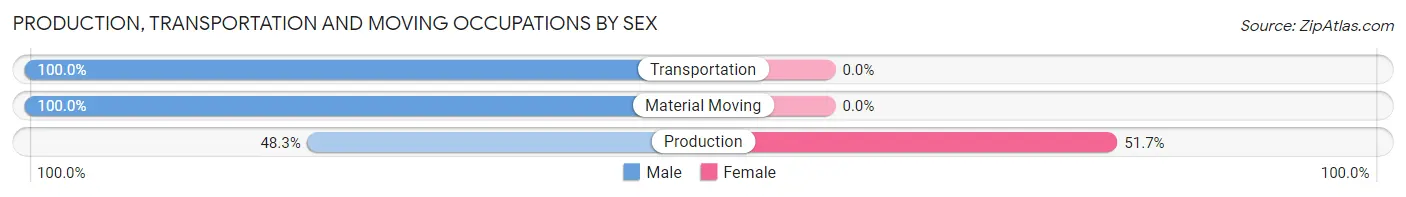
| Occupation | Male | Female |
| Production | 14 (48.3%) | 15 (51.7%) |
| Transportation | 78 (100.0%) | 0 (0.0%) |
| Material Moving | 3 (100.0%) | 0 (0.0%) |
| Total (Category) | 95 (86.4%) | 15 (13.6%) |
| Total (Overall) | 824 (55.6%) | 659 (44.4%) |
Employment Industries by Sex in Brookhaven
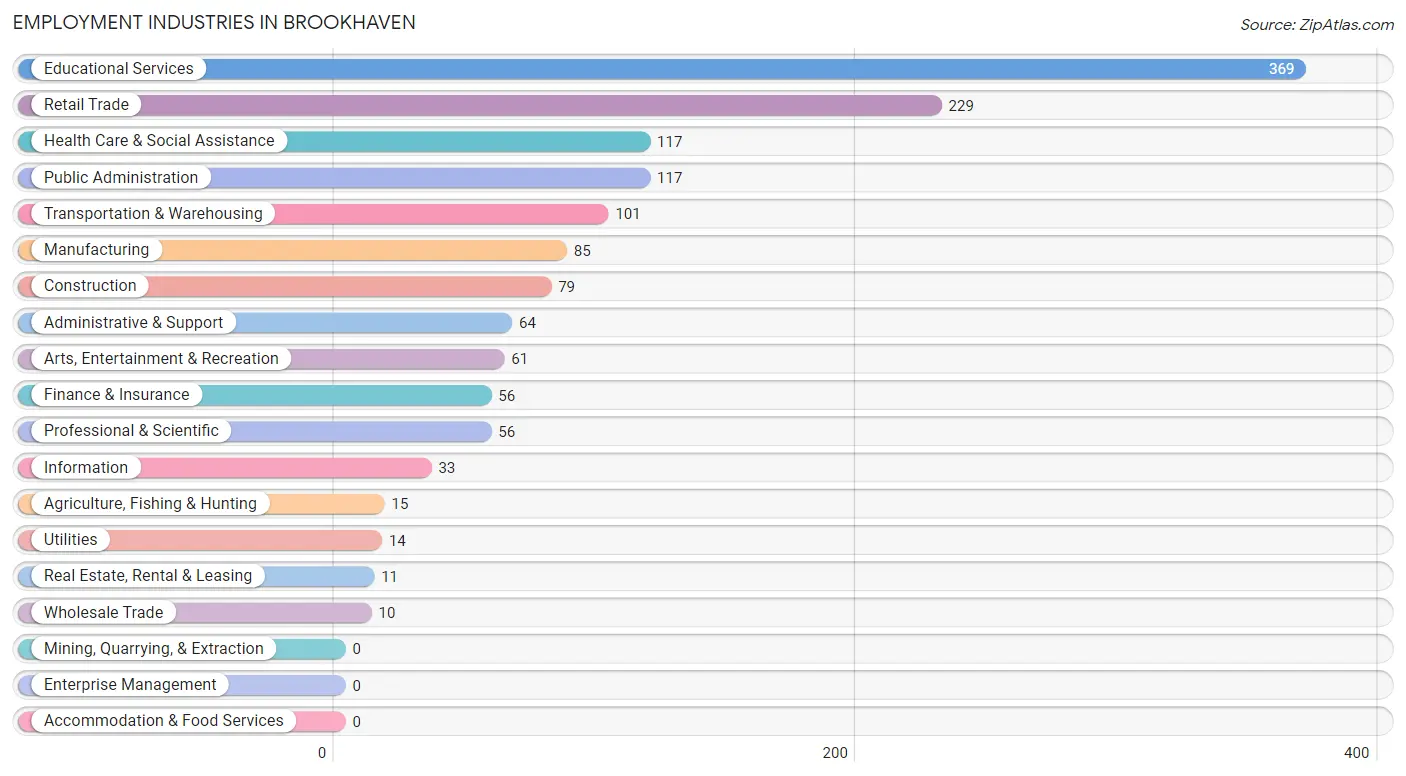
Employment Industries in Brookhaven
The major employment industries in Brookhaven include Educational Services (369 | 24.9%), Retail Trade (229 | 15.4%), Health Care & Social Assistance (117 | 7.9%), Public Administration (117 | 7.9%), and Transportation & Warehousing (101 | 6.8%).
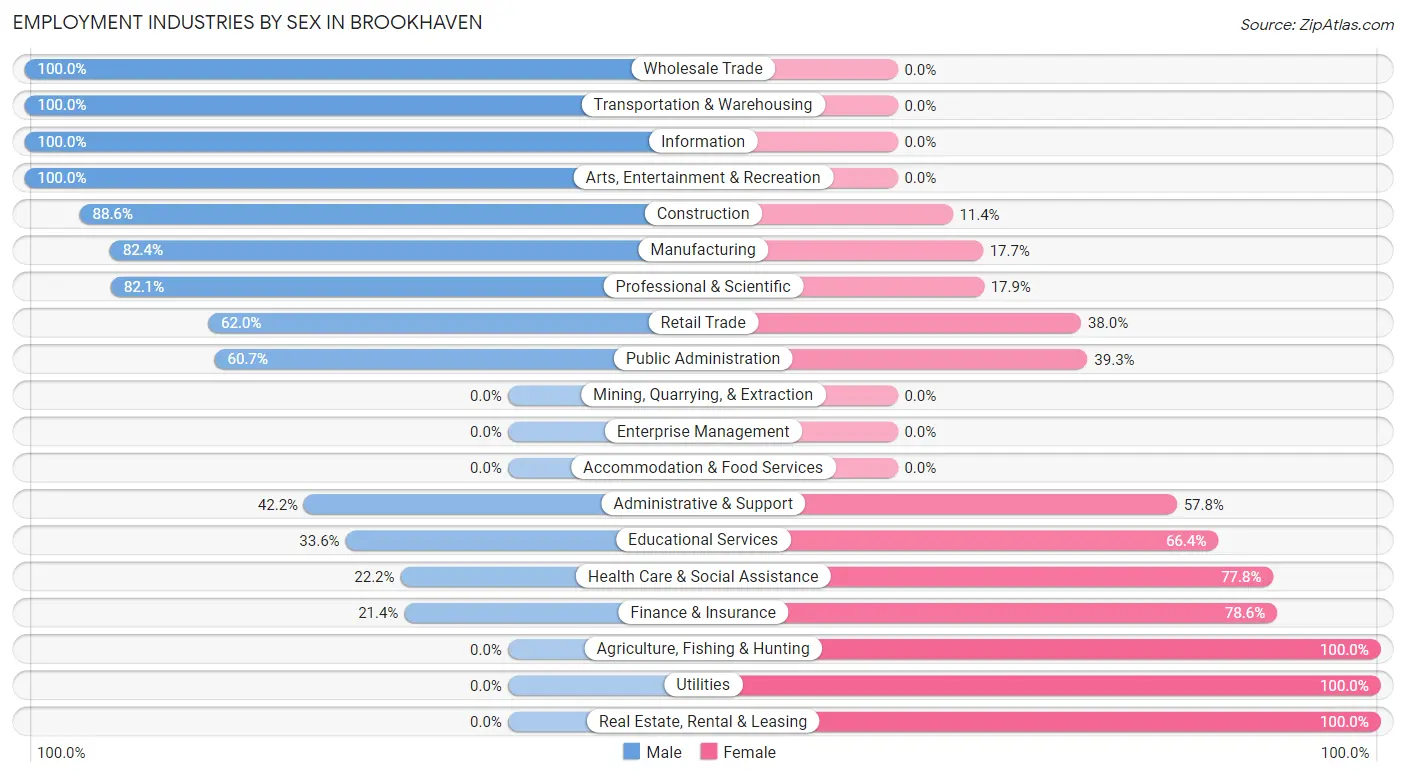
Employment Industries by Sex in Brookhaven
The Brookhaven industries that see more men than women are Wholesale Trade (100.0%), Transportation & Warehousing (100.0%), and Information (100.0%), whereas the industries that tend to have a higher number of women are Agriculture, Fishing & Hunting (100.0%), Utilities (100.0%), and Real Estate, Rental & Leasing (100.0%).
| Industry | Male | Female |
| Agriculture, Fishing & Hunting | 0 (0.0%) | 15 (100.0%) |
| Mining, Quarrying, & Extraction | 0 (0.0%) | 0 (0.0%) |
| Construction | 70 (88.6%) | 9 (11.4%) |
| Manufacturing | 70 (82.4%) | 15 (17.6%) |
| Wholesale Trade | 10 (100.0%) | 0 (0.0%) |
| Retail Trade | 142 (62.0%) | 87 (38.0%) |
| Transportation & Warehousing | 101 (100.0%) | 0 (0.0%) |
| Utilities | 0 (0.0%) | 14 (100.0%) |
| Information | 33 (100.0%) | 0 (0.0%) |
| Finance & Insurance | 12 (21.4%) | 44 (78.6%) |
| Real Estate, Rental & Leasing | 0 (0.0%) | 11 (100.0%) |
| Professional & Scientific | 46 (82.1%) | 10 (17.9%) |
| Enterprise Management | 0 (0.0%) | 0 (0.0%) |
| Administrative & Support | 27 (42.2%) | 37 (57.8%) |
| Educational Services | 124 (33.6%) | 245 (66.4%) |
| Health Care & Social Assistance | 26 (22.2%) | 91 (77.8%) |
| Arts, Entertainment & Recreation | 61 (100.0%) | 0 (0.0%) |
| Accommodation & Food Services | 0 (0.0%) | 0 (0.0%) |
| Public Administration | 71 (60.7%) | 46 (39.3%) |
| Total | 824 (55.6%) | 659 (44.4%) |
Education in Brookhaven
School Enrollment in Brookhaven
The most common levels of schooling among the 827 students in Brookhaven are middle school (194 | 23.5%), elementary school (168 | 20.3%), and college / undergraduate (164 | 19.8%).
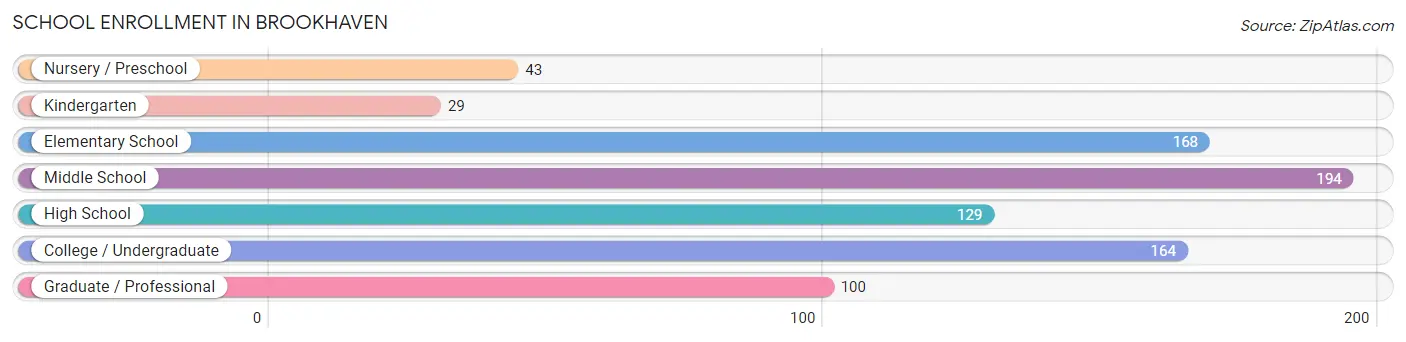
| School Level | # Students | % Students |
| Nursery / Preschool | 43 | 5.2% |
| Kindergarten | 29 | 3.5% |
| Elementary School | 168 | 20.3% |
| Middle School | 194 | 23.5% |
| High School | 129 | 15.6% |
| College / Undergraduate | 164 | 19.8% |
| Graduate / Professional | 100 | 12.1% |
| Total | 827 | 100.0% |
School Enrollment by Age by Funding Source in Brookhaven
Out of a total of 827 students who are enrolled in schools in Brookhaven, 189 (22.9%) attend a private institution, while the remaining 638 (77.1%) are enrolled in public schools. The age group of 20 to 24 year olds has the highest likelihood of being enrolled in private schools, with 141 (84.4% in the age bracket) enrolled. Conversely, the age group of 10 to 14 year olds has the lowest likelihood of being enrolled in a private school, with 200 (100.0% in the age bracket) attending a public institution.
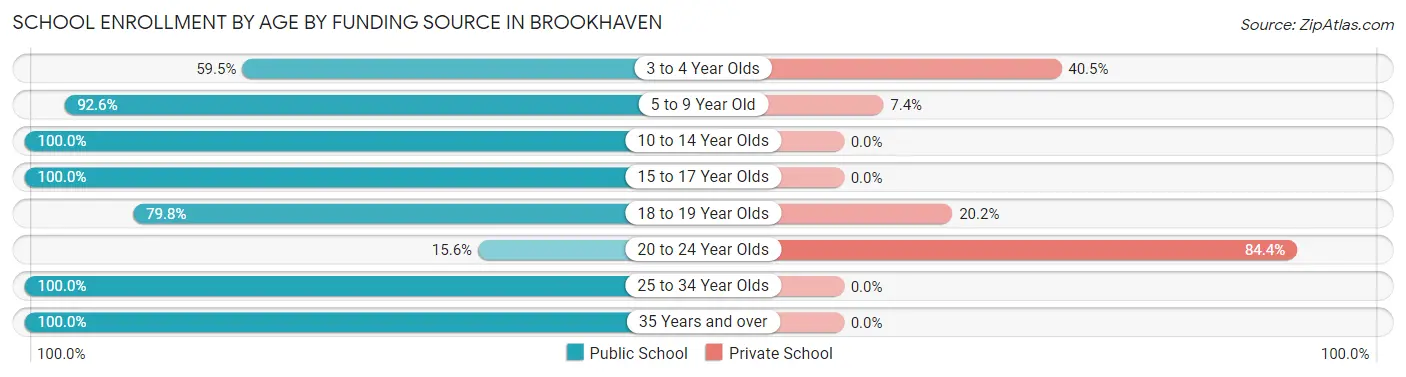
| Age Bracket | Public School | Private School |
| 3 to 4 Year Olds | 22 (59.5%) | 15 (40.5%) |
| 5 to 9 Year Old | 188 (92.6%) | 15 (7.4%) |
| 10 to 14 Year Olds | 200 (100.0%) | 0 (0.0%) |
| 15 to 17 Year Olds | 94 (100.0%) | 0 (0.0%) |
| 18 to 19 Year Olds | 71 (79.8%) | 18 (20.2%) |
| 20 to 24 Year Olds | 26 (15.6%) | 141 (84.4%) |
| 25 to 34 Year Olds | 31 (100.0%) | 0 (0.0%) |
| 35 Years and over | 6 (100.0%) | 0 (0.0%) |
| Total | 638 (77.1%) | 189 (22.9%) |
Educational Attainment by Field of Study in Brookhaven
Education (148 | 16.4%), business (133 | 14.7%), science & technology (118 | 13.1%), visual & performing arts (105 | 11.6%), and bio, nature & agricultural (68 | 7.5%) are the most common fields of study among 903 individuals in Brookhaven who have obtained a bachelor's degree or higher.
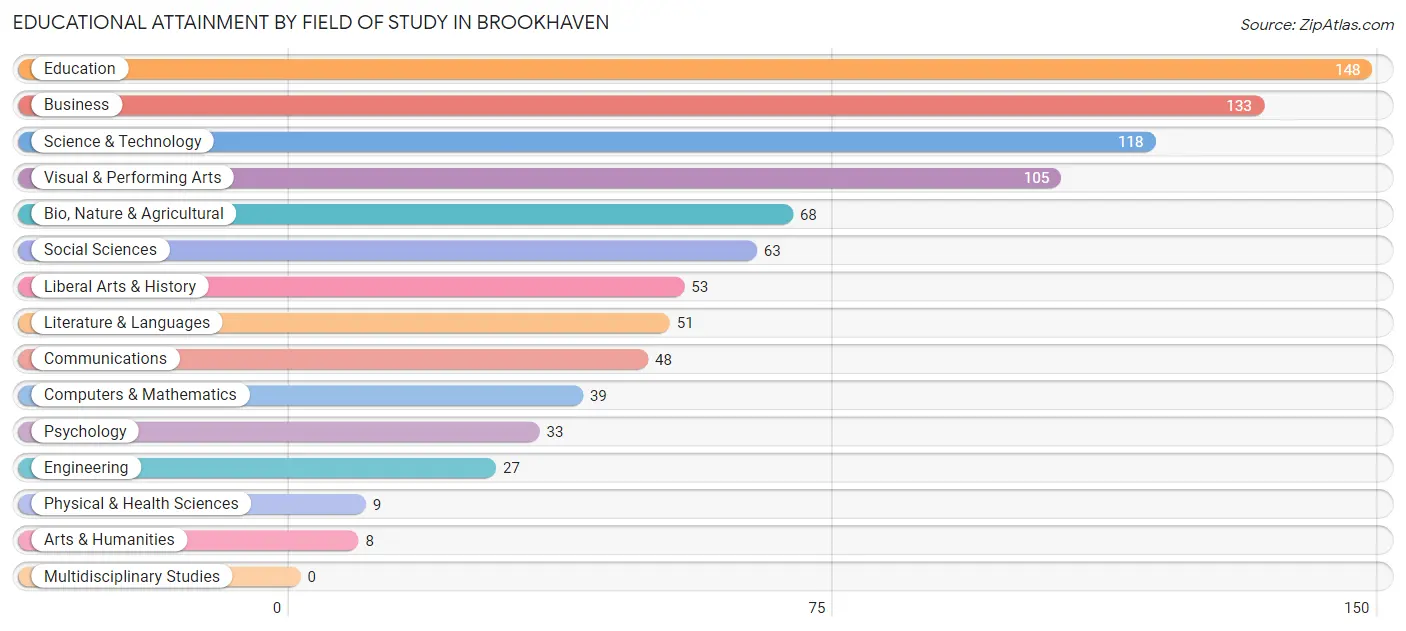
| Field of Study | # Graduates | % Graduates |
| Computers & Mathematics | 39 | 4.3% |
| Bio, Nature & Agricultural | 68 | 7.5% |
| Physical & Health Sciences | 9 | 1.0% |
| Psychology | 33 | 3.6% |
| Social Sciences | 63 | 7.0% |
| Engineering | 27 | 3.0% |
| Multidisciplinary Studies | 0 | 0.0% |
| Science & Technology | 118 | 13.1% |
| Business | 133 | 14.7% |
| Education | 148 | 16.4% |
| Literature & Languages | 51 | 5.7% |
| Liberal Arts & History | 53 | 5.9% |
| Visual & Performing Arts | 105 | 11.6% |
| Communications | 48 | 5.3% |
| Arts & Humanities | 8 | 0.9% |
| Total | 903 | 100.0% |
Transportation & Commute in Brookhaven
Vehicle Availability by Sex in Brookhaven
The most prevalent vehicle ownership categories in Brookhaven are males with 2 vehicles (238, accounting for 29.9%) and females with 2 vehicles (174, making up 37.7%).
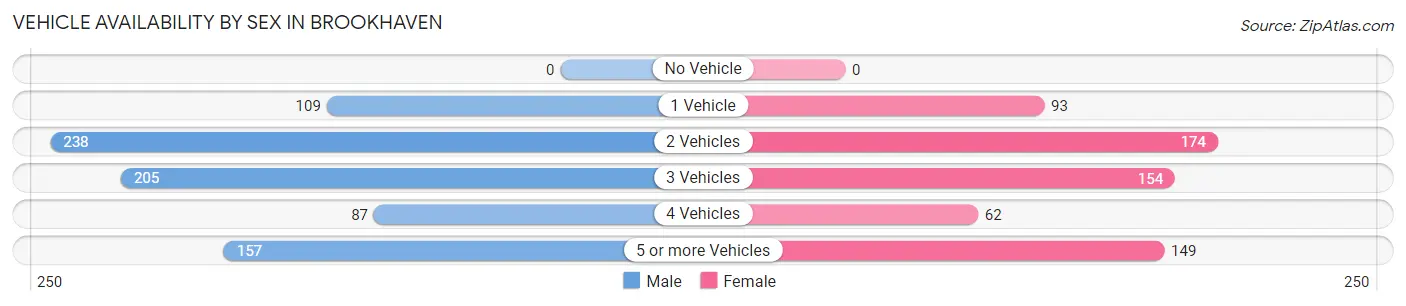
| Vehicles Available | Male | Female |
| No Vehicle | 0 (0.0%) | 0 (0.0%) |
| 1 Vehicle | 109 (13.7%) | 93 (14.7%) |
| 2 Vehicles | 238 (29.9%) | 174 (27.5%) |
| 3 Vehicles | 205 (25.8%) | 154 (24.4%) |
| 4 Vehicles | 87 (10.9%) | 62 (9.8%) |
| 5 or more Vehicles | 157 (19.7%) | 149 (23.6%) |
| Total | 796 (100.0%) | 632 (100.0%) |
Commute Time in Brookhaven
The most frequently occuring commute durations in Brookhaven are 10 to 14 minutes (255 commuters, 19.9%), 5 to 9 minutes (183 commuters, 14.3%), and 20 to 24 minutes (155 commuters, 12.1%).
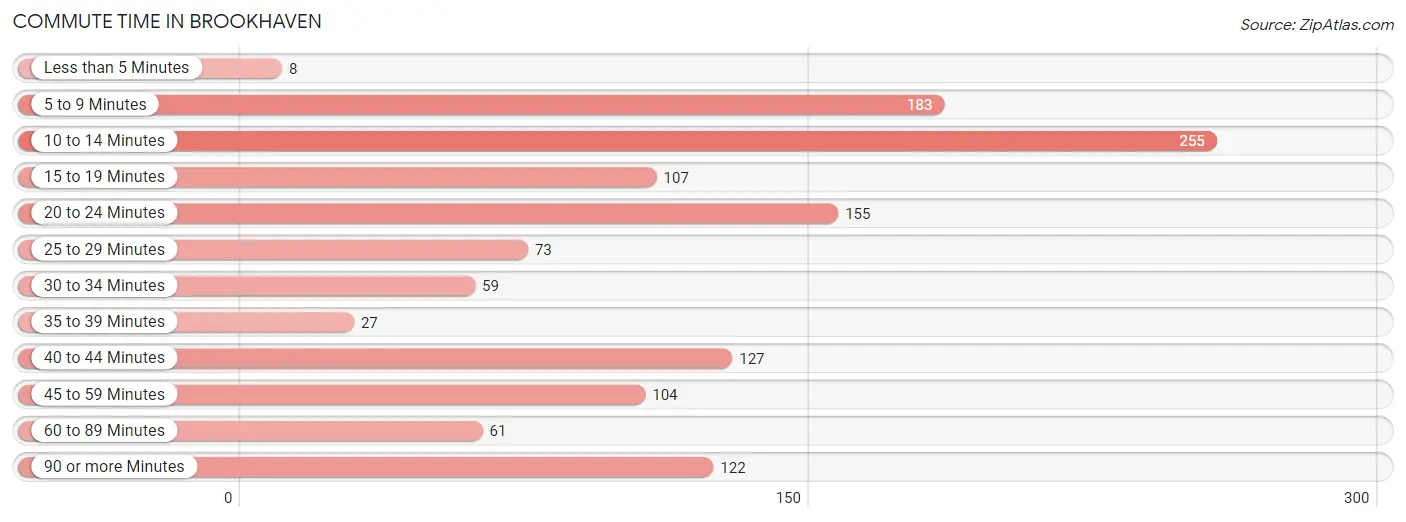
| Commute Time | # Commuters | % Commuters |
| Less than 5 Minutes | 8 | 0.6% |
| 5 to 9 Minutes | 183 | 14.3% |
| 10 to 14 Minutes | 255 | 19.9% |
| 15 to 19 Minutes | 107 | 8.4% |
| 20 to 24 Minutes | 155 | 12.1% |
| 25 to 29 Minutes | 73 | 5.7% |
| 30 to 34 Minutes | 59 | 4.6% |
| 35 to 39 Minutes | 27 | 2.1% |
| 40 to 44 Minutes | 127 | 9.9% |
| 45 to 59 Minutes | 104 | 8.1% |
| 60 to 89 Minutes | 61 | 4.8% |
| 90 or more Minutes | 122 | 9.5% |
Commute Time by Sex in Brookhaven
The most common commute times in Brookhaven are 10 to 14 minutes (153 commuters, 21.3%) for males and 5 to 9 minutes (127 commuters, 22.5%) for females.
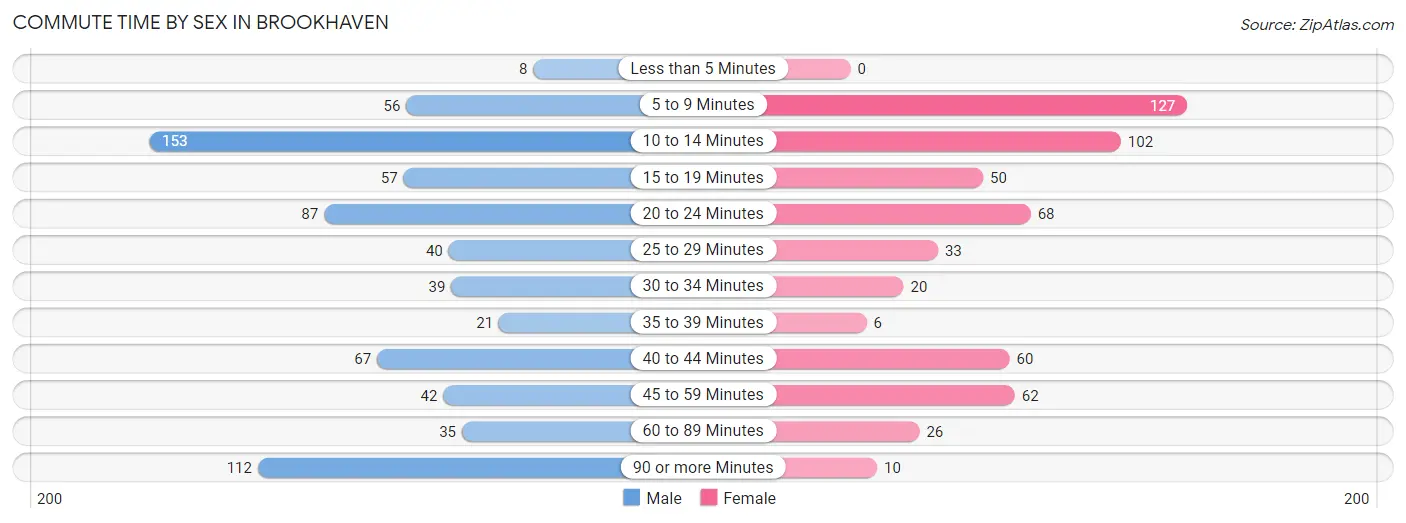
| Commute Time | Male | Female |
| Less than 5 Minutes | 8 (1.1%) | 0 (0.0%) |
| 5 to 9 Minutes | 56 (7.8%) | 127 (22.5%) |
| 10 to 14 Minutes | 153 (21.3%) | 102 (18.1%) |
| 15 to 19 Minutes | 57 (8.0%) | 50 (8.9%) |
| 20 to 24 Minutes | 87 (12.1%) | 68 (12.1%) |
| 25 to 29 Minutes | 40 (5.6%) | 33 (5.9%) |
| 30 to 34 Minutes | 39 (5.4%) | 20 (3.5%) |
| 35 to 39 Minutes | 21 (2.9%) | 6 (1.1%) |
| 40 to 44 Minutes | 67 (9.3%) | 60 (10.6%) |
| 45 to 59 Minutes | 42 (5.9%) | 62 (11.0%) |
| 60 to 89 Minutes | 35 (4.9%) | 26 (4.6%) |
| 90 or more Minutes | 112 (15.6%) | 10 (1.8%) |
Time of Departure to Work by Sex in Brookhaven
The most frequent times of departure to work in Brookhaven are 7:00 AM to 7:29 AM (115, 16.0%) for males and 7:00 AM to 7:29 AM (121, 21.4%) for females.
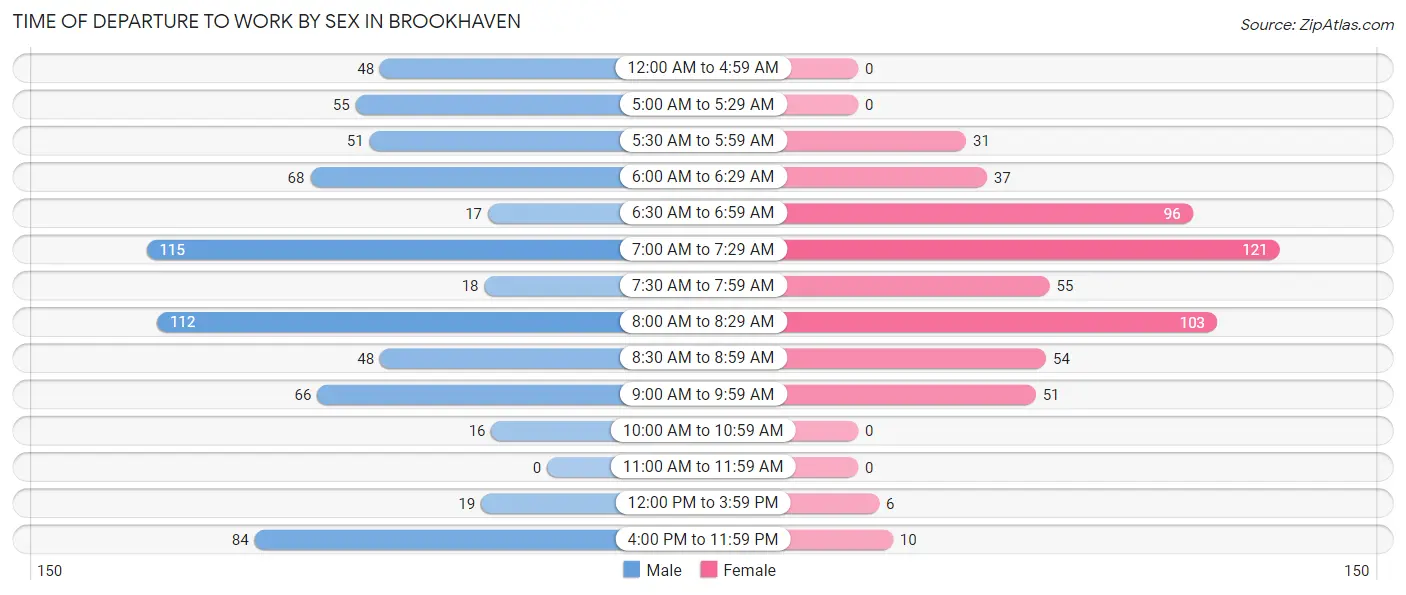
| Time of Departure | Male | Female |
| 12:00 AM to 4:59 AM | 48 (6.7%) | 0 (0.0%) |
| 5:00 AM to 5:29 AM | 55 (7.7%) | 0 (0.0%) |
| 5:30 AM to 5:59 AM | 51 (7.1%) | 31 (5.5%) |
| 6:00 AM to 6:29 AM | 68 (9.5%) | 37 (6.6%) |
| 6:30 AM to 6:59 AM | 17 (2.4%) | 96 (17.0%) |
| 7:00 AM to 7:29 AM | 115 (16.0%) | 121 (21.4%) |
| 7:30 AM to 7:59 AM | 18 (2.5%) | 55 (9.8%) |
| 8:00 AM to 8:29 AM | 112 (15.6%) | 103 (18.3%) |
| 8:30 AM to 8:59 AM | 48 (6.7%) | 54 (9.6%) |
| 9:00 AM to 9:59 AM | 66 (9.2%) | 51 (9.0%) |
| 10:00 AM to 10:59 AM | 16 (2.2%) | 0 (0.0%) |
| 11:00 AM to 11:59 AM | 0 (0.0%) | 0 (0.0%) |
| 12:00 PM to 3:59 PM | 19 (2.6%) | 6 (1.1%) |
| 4:00 PM to 11:59 PM | 84 (11.7%) | 10 (1.8%) |
| Total | 717 (100.0%) | 564 (100.0%) |
Housing Occupancy in Brookhaven
Occupancy by Ownership in Brookhaven
Of the total 1,098 dwellings in Brookhaven, owner-occupied units account for 845 (77.0%), while renter-occupied units make up 253 (23.0%).
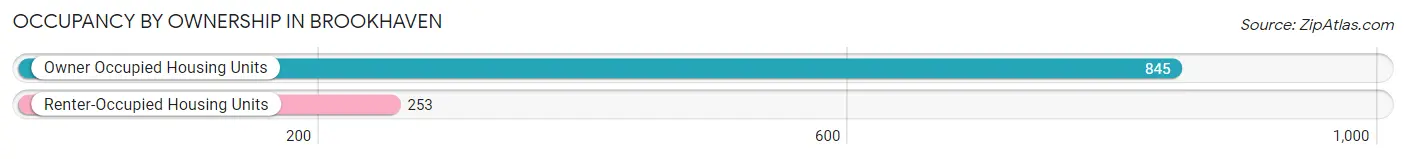
| Occupancy | # Housing Units | % Housing Units |
| Owner Occupied Housing Units | 845 | 77.0% |
| Renter-Occupied Housing Units | 253 | 23.0% |
| Total Occupied Housing Units | 1,098 | 100.0% |
Occupancy by Household Size in Brookhaven
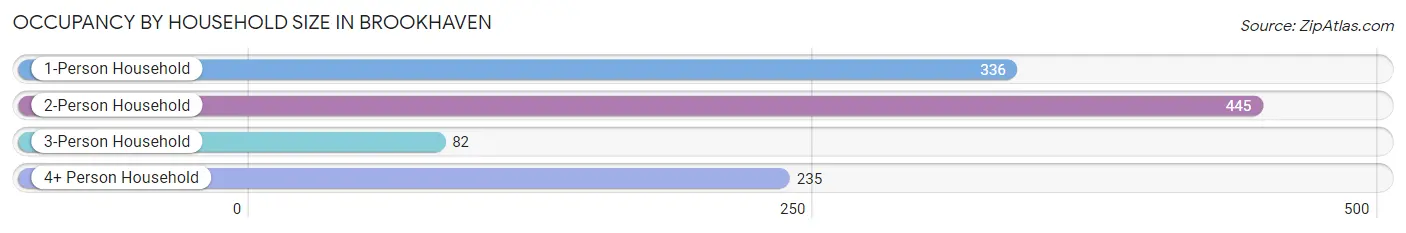
| Household Size | # Housing Units | % Housing Units |
| 1-Person Household | 336 | 30.6% |
| 2-Person Household | 445 | 40.5% |
| 3-Person Household | 82 | 7.5% |
| 4+ Person Household | 235 | 21.4% |
| Total Housing Units | 1,098 | 100.0% |
Occupancy by Ownership by Household Size in Brookhaven
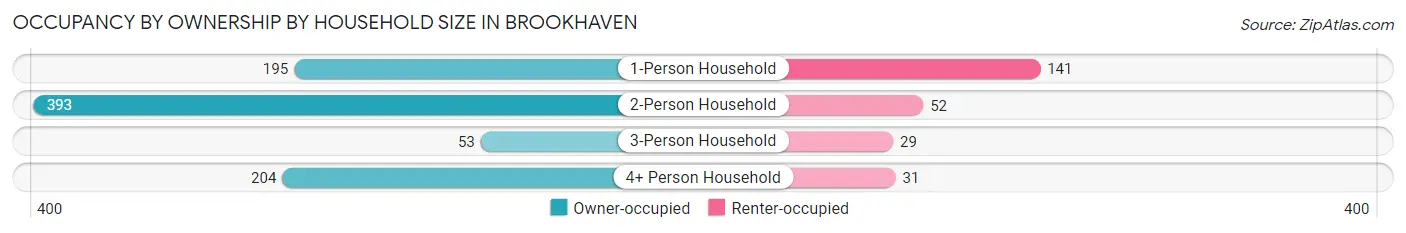
| Household Size | Owner-occupied | Renter-occupied |
| 1-Person Household | 195 (58.0%) | 141 (42.0%) |
| 2-Person Household | 393 (88.3%) | 52 (11.7%) |
| 3-Person Household | 53 (64.6%) | 29 (35.4%) |
| 4+ Person Household | 204 (86.8%) | 31 (13.2%) |
| Total Housing Units | 845 (77.0%) | 253 (23.0%) |
Occupancy by Educational Attainment in Brookhaven
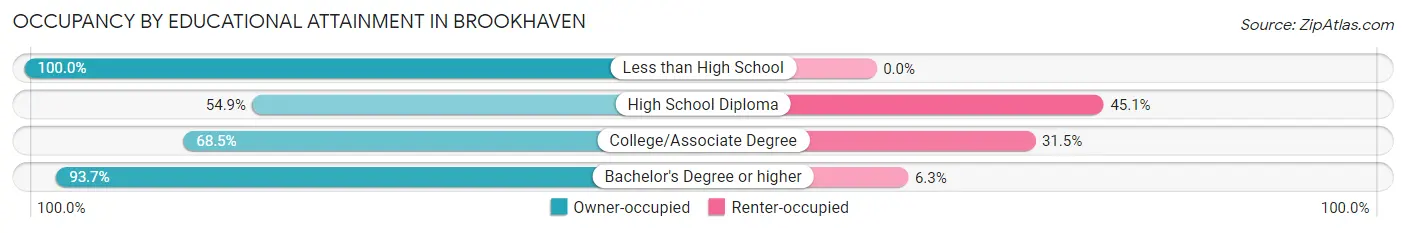
| Household Size | Owner-occupied | Renter-occupied |
| Less than High School | 10 (100.0%) | 0 (0.0%) |
| High School Diploma | 139 (54.9%) | 114 (45.1%) |
| College/Associate Degree | 235 (68.5%) | 108 (31.5%) |
| Bachelor's Degree or higher | 461 (93.7%) | 31 (6.3%) |
Occupancy by Age of Householder in Brookhaven
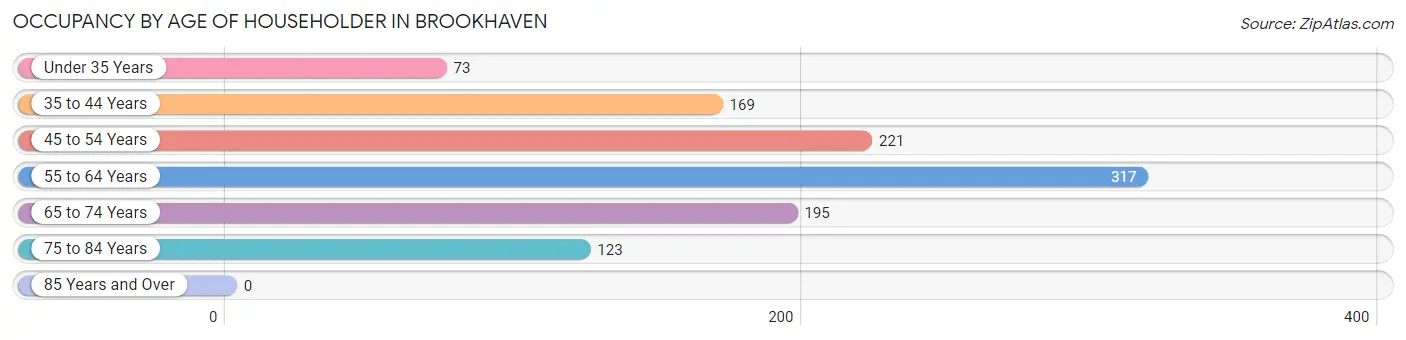
| Age Bracket | # Households | % Households |
| Under 35 Years | 73 | 6.7% |
| 35 to 44 Years | 169 | 15.4% |
| 45 to 54 Years | 221 | 20.1% |
| 55 to 64 Years | 317 | 28.9% |
| 65 to 74 Years | 195 | 17.8% |
| 75 to 84 Years | 123 | 11.2% |
| 85 Years and Over | 0 | 0.0% |
| Total | 1,098 | 100.0% |
Housing Finances in Brookhaven
Median Income by Occupancy in Brookhaven
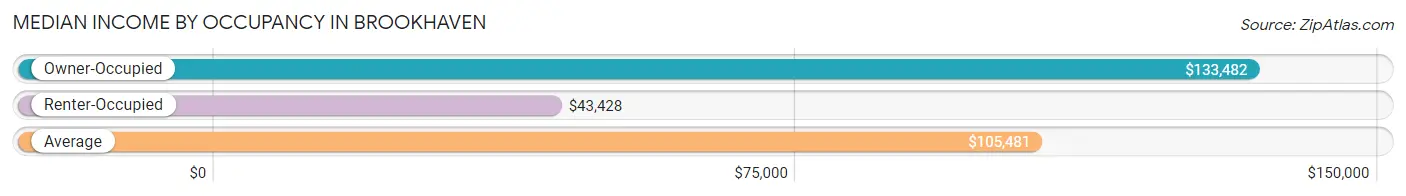
| Occupancy Type | # Households | Median Income |
| Owner-Occupied | 845 (77.0%) | $133,482 |
| Renter-Occupied | 253 (23.0%) | $43,428 |
| Average | 1,098 (100.0%) | $105,481 |
Occupancy by Householder Income Bracket in Brookhaven
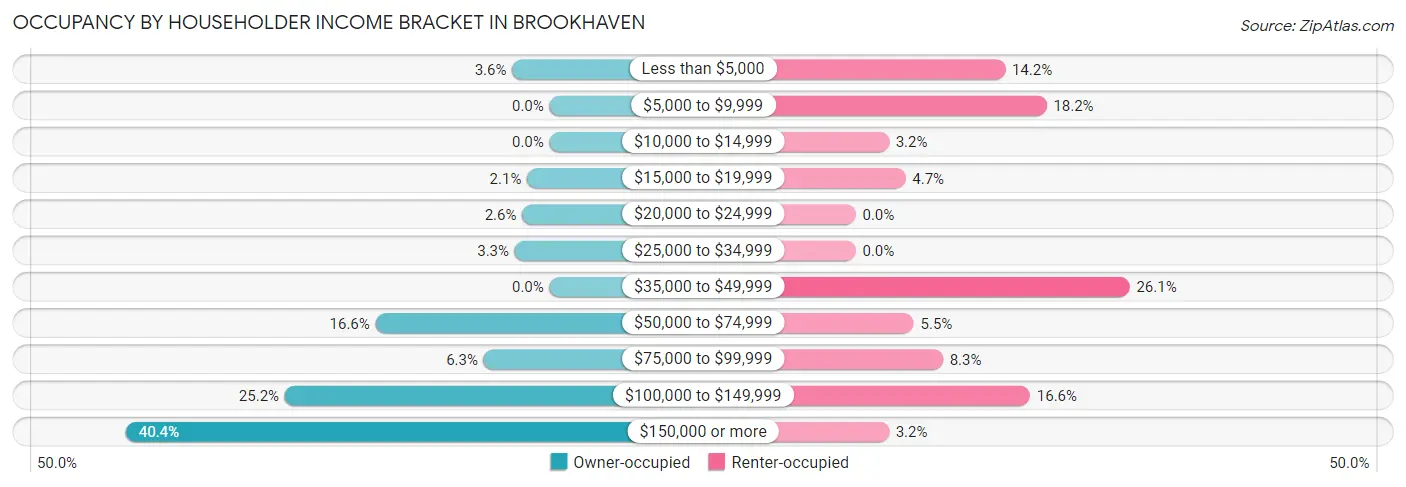
| Income Bracket | Owner-occupied | Renter-occupied |
| Less than $5,000 | 30 (3.5%) | 36 (14.2%) |
| $5,000 to $9,999 | 0 (0.0%) | 46 (18.2%) |
| $10,000 to $14,999 | 0 (0.0%) | 8 (3.2%) |
| $15,000 to $19,999 | 18 (2.1%) | 12 (4.7%) |
| $20,000 to $24,999 | 22 (2.6%) | 0 (0.0%) |
| $25,000 to $34,999 | 28 (3.3%) | 0 (0.0%) |
| $35,000 to $49,999 | 0 (0.0%) | 66 (26.1%) |
| $50,000 to $74,999 | 140 (16.6%) | 14 (5.5%) |
| $75,000 to $99,999 | 53 (6.3%) | 21 (8.3%) |
| $100,000 to $149,999 | 213 (25.2%) | 42 (16.6%) |
| $150,000 or more | 341 (40.4%) | 8 (3.2%) |
| Total | 845 (100.0%) | 253 (100.0%) |
Monthly Housing Cost Tiers in Brookhaven
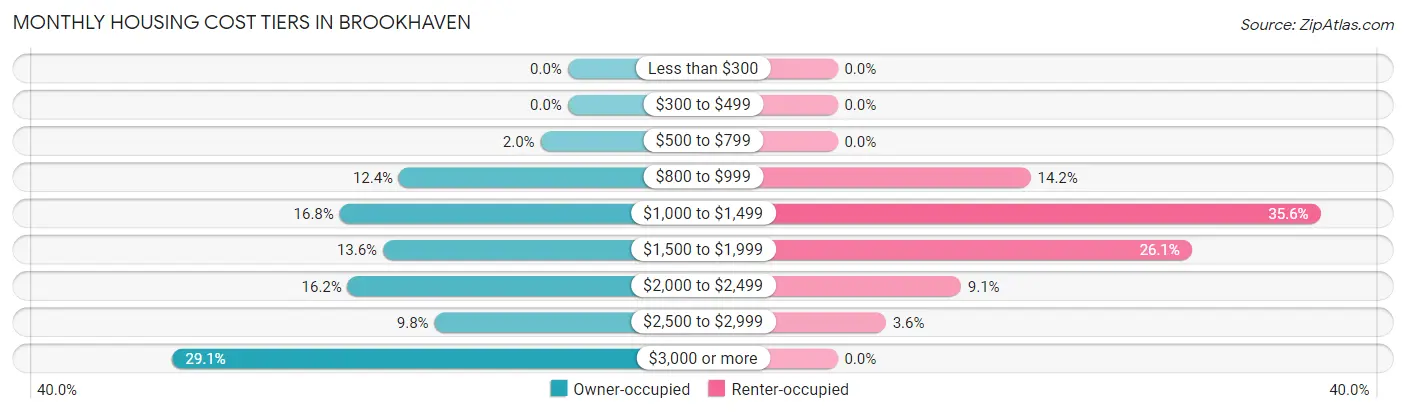
| Monthly Cost | Owner-occupied | Renter-occupied |
| Less than $300 | 0 (0.0%) | 0 (0.0%) |
| $300 to $499 | 0 (0.0%) | 0 (0.0%) |
| $500 to $799 | 17 (2.0%) | 0 (0.0%) |
| $800 to $999 | 105 (12.4%) | 36 (14.2%) |
| $1,000 to $1,499 | 142 (16.8%) | 90 (35.6%) |
| $1,500 to $1,999 | 115 (13.6%) | 66 (26.1%) |
| $2,000 to $2,499 | 137 (16.2%) | 23 (9.1%) |
| $2,500 to $2,999 | 83 (9.8%) | 9 (3.6%) |
| $3,000 or more | 246 (29.1%) | 0 (0.0%) |
| Total | 845 (100.0%) | 253 (100.0%) |
Physical Housing Characteristics in Brookhaven
Housing Structures in Brookhaven
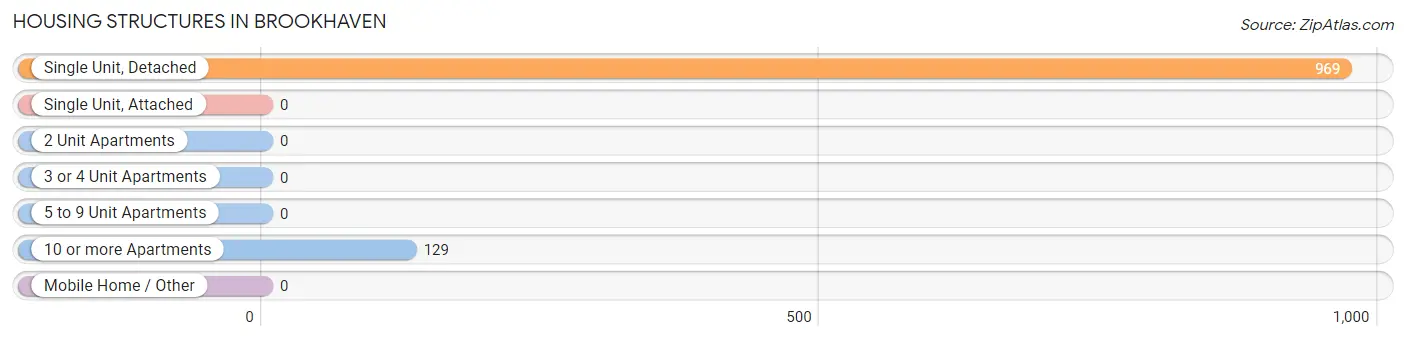
| Structure Type | # Housing Units | % Housing Units |
| Single Unit, Detached | 969 | 88.2% |
| Single Unit, Attached | 0 | 0.0% |
| 2 Unit Apartments | 0 | 0.0% |
| 3 or 4 Unit Apartments | 0 | 0.0% |
| 5 to 9 Unit Apartments | 0 | 0.0% |
| 10 or more Apartments | 129 | 11.7% |
| Mobile Home / Other | 0 | 0.0% |
| Total | 1,098 | 100.0% |
Housing Structures by Occupancy in Brookhaven
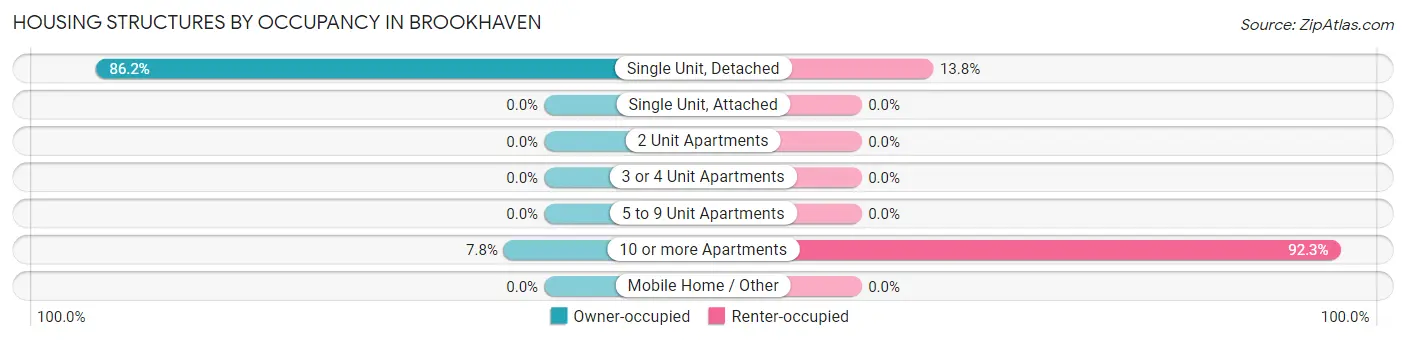
| Structure Type | Owner-occupied | Renter-occupied |
| Single Unit, Detached | 835 (86.2%) | 134 (13.8%) |
| Single Unit, Attached | 0 (0.0%) | 0 (0.0%) |
| 2 Unit Apartments | 0 (0.0%) | 0 (0.0%) |
| 3 or 4 Unit Apartments | 0 (0.0%) | 0 (0.0%) |
| 5 to 9 Unit Apartments | 0 (0.0%) | 0 (0.0%) |
| 10 or more Apartments | 10 (7.7%) | 119 (92.2%) |
| Mobile Home / Other | 0 (0.0%) | 0 (0.0%) |
| Total | 845 (77.0%) | 253 (23.0%) |
Housing Structures by Number of Rooms in Brookhaven
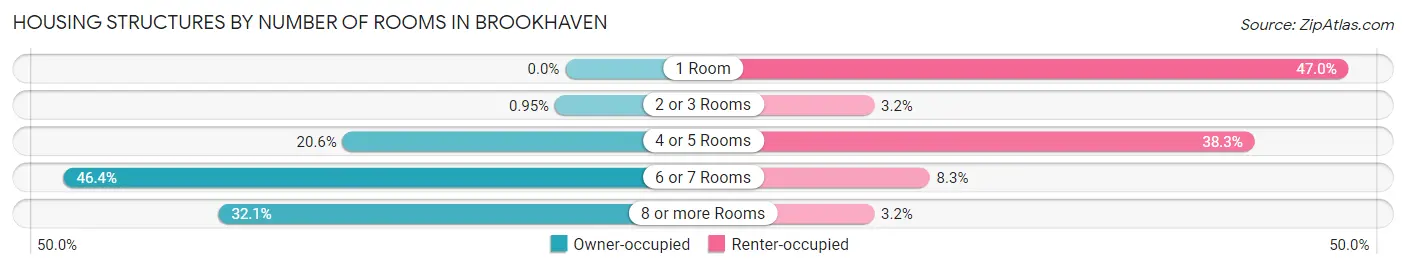
| Number of Rooms | Owner-occupied | Renter-occupied |
| 1 Room | 0 (0.0%) | 119 (47.0%) |
| 2 or 3 Rooms | 8 (0.9%) | 8 (3.2%) |
| 4 or 5 Rooms | 174 (20.6%) | 97 (38.3%) |
| 6 or 7 Rooms | 392 (46.4%) | 21 (8.3%) |
| 8 or more Rooms | 271 (32.1%) | 8 (3.2%) |
| Total | 845 (100.0%) | 253 (100.0%) |
Housing Structure by Heating Type in Brookhaven
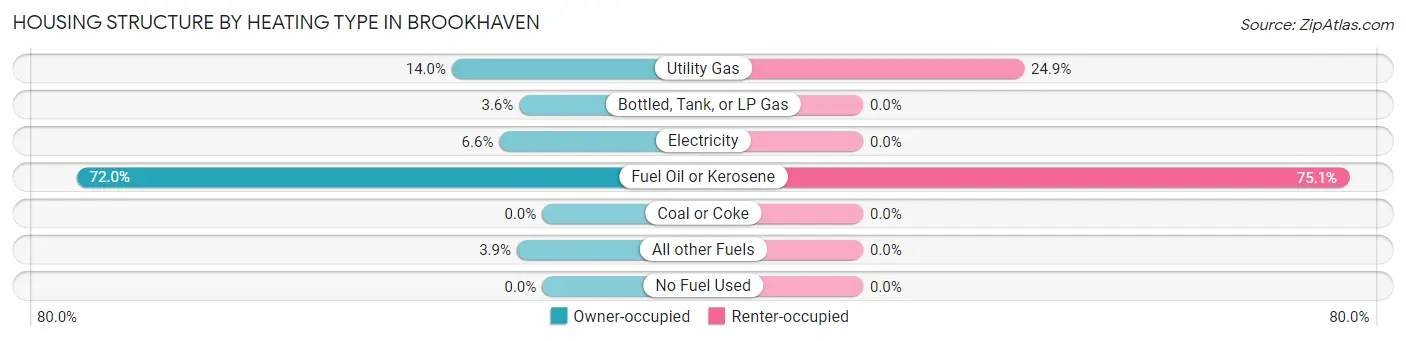
| Heating Type | Owner-occupied | Renter-occupied |
| Utility Gas | 118 (14.0%) | 63 (24.9%) |
| Bottled, Tank, or LP Gas | 30 (3.5%) | 0 (0.0%) |
| Electricity | 56 (6.6%) | 0 (0.0%) |
| Fuel Oil or Kerosene | 608 (72.0%) | 190 (75.1%) |
| Coal or Coke | 0 (0.0%) | 0 (0.0%) |
| All other Fuels | 33 (3.9%) | 0 (0.0%) |
| No Fuel Used | 0 (0.0%) | 0 (0.0%) |
| Total | 845 (100.0%) | 253 (100.0%) |
Household Vehicle Usage in Brookhaven
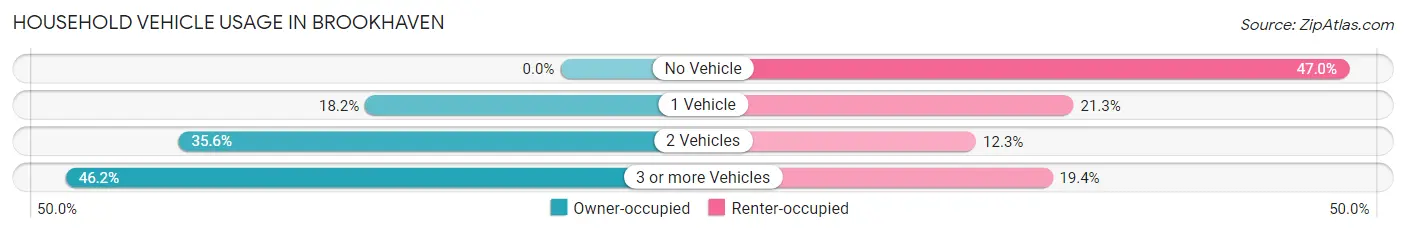
| Vehicles per Household | Owner-occupied | Renter-occupied |
| No Vehicle | 0 (0.0%) | 119 (47.0%) |
| 1 Vehicle | 154 (18.2%) | 54 (21.3%) |
| 2 Vehicles | 301 (35.6%) | 31 (12.2%) |
| 3 or more Vehicles | 390 (46.2%) | 49 (19.4%) |
| Total | 845 (100.0%) | 253 (100.0%) |
Real Estate & Mortgages in Brookhaven
Real Estate and Mortgage Overview in Brookhaven
| Characteristic | Without Mortgage | With Mortgage |
| Housing Units | 388 | 457 |
| Median Property Value | $528,900 | $529,500 |
| Median Household Income | $92,955 | $216 |
| Monthly Housing Costs | $1,255 | $246 |
| Real Estate Taxes | $9,471 | $0 |
Property Value by Mortgage Status in Brookhaven
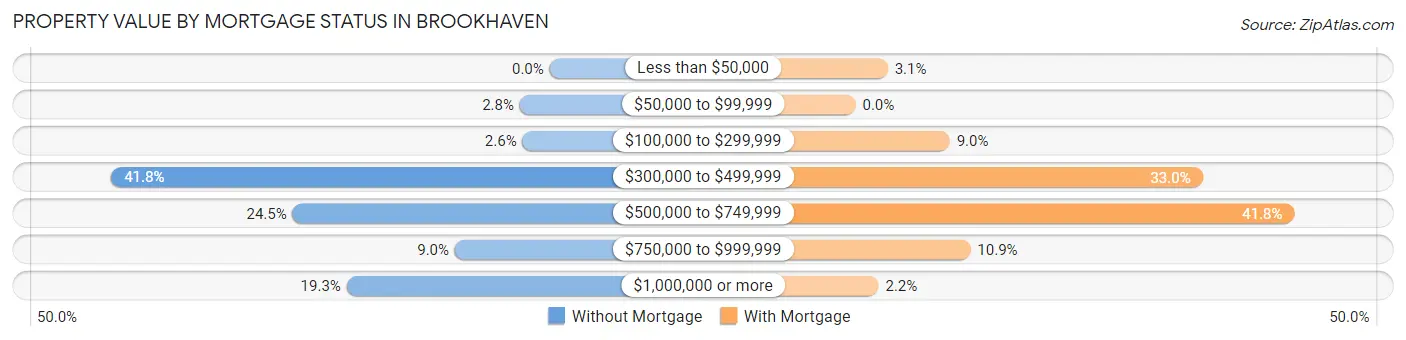
| Property Value | Without Mortgage | With Mortgage |
| Less than $50,000 | 0 (0.0%) | 14 (3.1%) |
| $50,000 to $99,999 | 11 (2.8%) | 0 (0.0%) |
| $100,000 to $299,999 | 10 (2.6%) | 41 (9.0%) |
| $300,000 to $499,999 | 162 (41.7%) | 151 (33.0%) |
| $500,000 to $749,999 | 95 (24.5%) | 191 (41.8%) |
| $750,000 to $999,999 | 35 (9.0%) | 50 (10.9%) |
| $1,000,000 or more | 75 (19.3%) | 10 (2.2%) |
| Total | 388 (100.0%) | 457 (100.0%) |
Household Income by Mortgage Status in Brookhaven
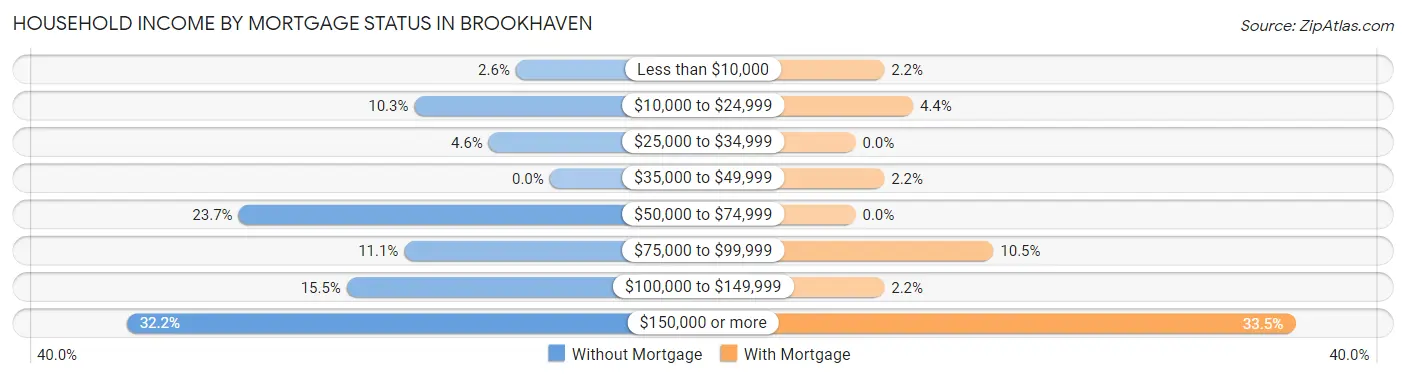
| Household Income | Without Mortgage | With Mortgage |
| Less than $10,000 | 10 (2.6%) | 10 (2.2%) |
| $10,000 to $24,999 | 40 (10.3%) | 20 (4.4%) |
| $25,000 to $34,999 | 18 (4.6%) | 0 (0.0%) |
| $35,000 to $49,999 | 0 (0.0%) | 10 (2.2%) |
| $50,000 to $74,999 | 92 (23.7%) | 0 (0.0%) |
| $75,000 to $99,999 | 43 (11.1%) | 48 (10.5%) |
| $100,000 to $149,999 | 60 (15.5%) | 10 (2.2%) |
| $150,000 or more | 125 (32.2%) | 153 (33.5%) |
| Total | 388 (100.0%) | 457 (100.0%) |
Property Value to Household Income Ratio in Brookhaven
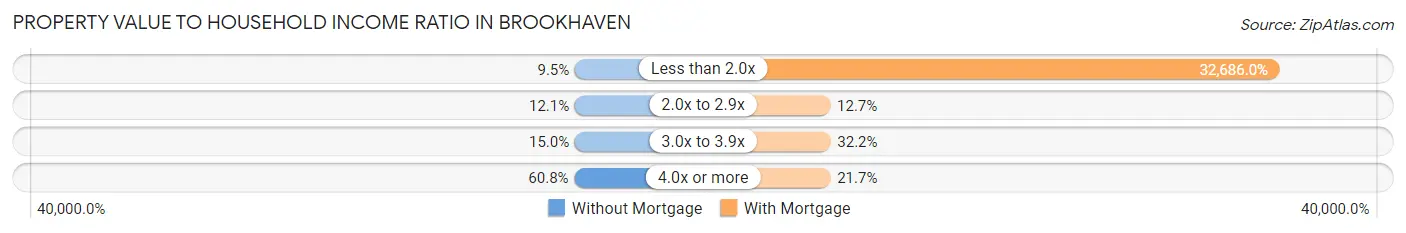
| Value-to-Income Ratio | Without Mortgage | With Mortgage |
| Less than 2.0x | 37 (9.5%) | 149,375 (32,686.0%) |
| 2.0x to 2.9x | 47 (12.1%) | 58 (12.7%) |
| 3.0x to 3.9x | 58 (14.9%) | 147 (32.2%) |
| 4.0x or more | 236 (60.8%) | 99 (21.7%) |
| Total | 388 (100.0%) | 457 (100.0%) |
Real Estate Taxes by Mortgage Status in Brookhaven
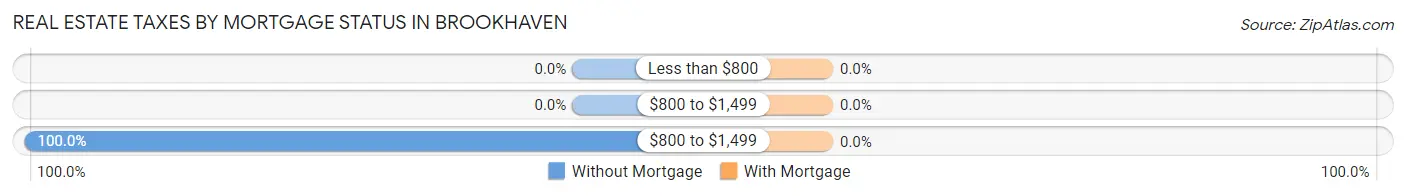
| Property Taxes | Without Mortgage | With Mortgage |
| Less than $800 | 0 (0.0%) | 0 (0.0%) |
| $800 to $1,499 | 0 (0.0%) | 0 (0.0%) |
| $800 to $1,499 | 388 (100.0%) | 0 (0.0%) |
| Total | 388 (100.0%) | 457 (100.0%) |
Health & Disability in Brookhaven
Health Insurance Coverage by Age in Brookhaven
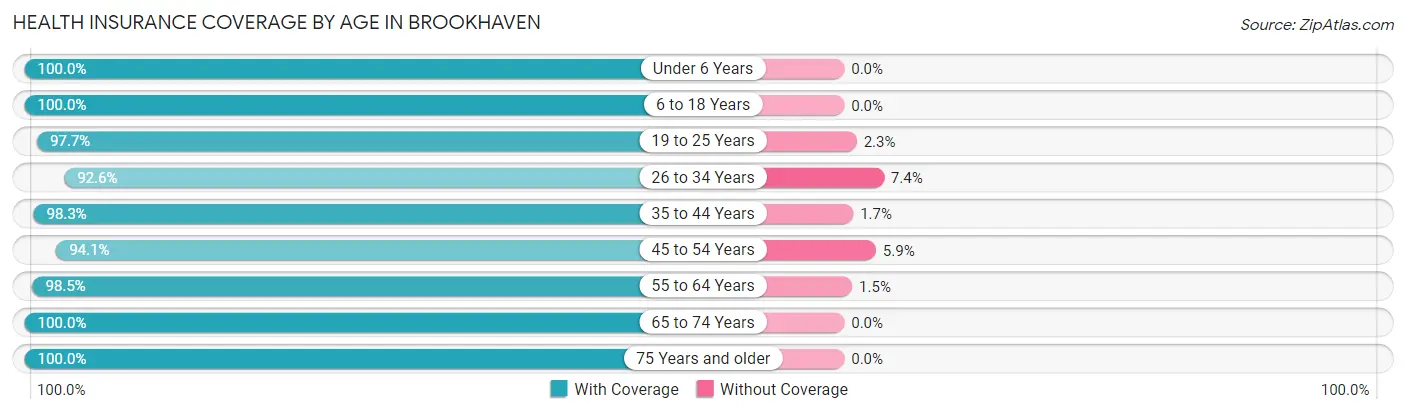
| Age Bracket | With Coverage | Without Coverage |
| Under 6 Years | 225 (100.0%) | 0 (0.0%) |
| 6 to 18 Years | 527 (100.0%) | 0 (0.0%) |
| 19 to 25 Years | 338 (97.7%) | 8 (2.3%) |
| 26 to 34 Years | 188 (92.6%) | 15 (7.4%) |
| 35 to 44 Years | 356 (98.3%) | 6 (1.7%) |
| 45 to 54 Years | 351 (94.1%) | 22 (5.9%) |
| 55 to 64 Years | 602 (98.5%) | 9 (1.5%) |
| 65 to 74 Years | 348 (100.0%) | 0 (0.0%) |
| 75 Years and older | 214 (100.0%) | 0 (0.0%) |
| Total | 3,149 (98.1%) | 60 (1.9%) |
Health Insurance Coverage by Citizenship Status in Brookhaven
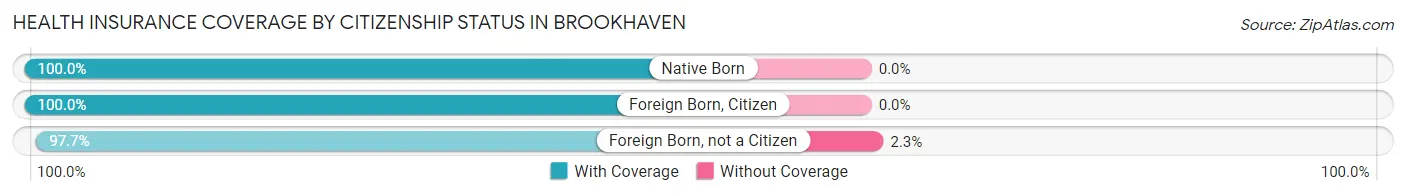
| Citizenship Status | With Coverage | Without Coverage |
| Native Born | 225 (100.0%) | 0 (0.0%) |
| Foreign Born, Citizen | 527 (100.0%) | 0 (0.0%) |
| Foreign Born, not a Citizen | 338 (97.7%) | 8 (2.3%) |
Health Insurance Coverage by Household Income in Brookhaven
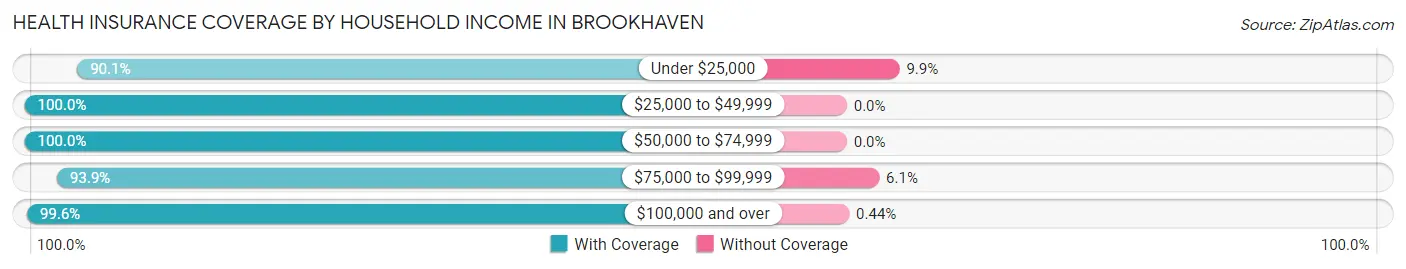
| Household Income | With Coverage | Without Coverage |
| Under $25,000 | 201 (90.1%) | 22 (9.9%) |
| $25,000 to $49,999 | 178 (100.0%) | 0 (0.0%) |
| $50,000 to $74,999 | 248 (100.0%) | 0 (0.0%) |
| $75,000 to $99,999 | 124 (93.9%) | 8 (6.1%) |
| $100,000 and over | 2,026 (99.6%) | 9 (0.4%) |
Public vs Private Health Insurance Coverage by Age in Brookhaven
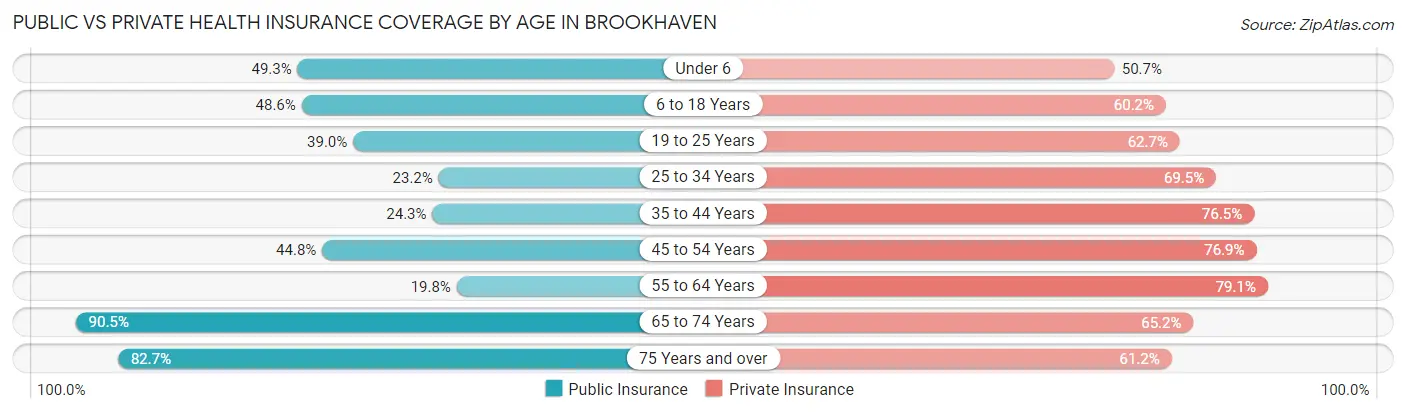
| Age Bracket | Public Insurance | Private Insurance |
| Under 6 | 111 (49.3%) | 114 (50.7%) |
| 6 to 18 Years | 256 (48.6%) | 317 (60.2%) |
| 19 to 25 Years | 135 (39.0%) | 217 (62.7%) |
| 25 to 34 Years | 47 (23.2%) | 141 (69.5%) |
| 35 to 44 Years | 88 (24.3%) | 277 (76.5%) |
| 45 to 54 Years | 167 (44.8%) | 287 (76.9%) |
| 55 to 64 Years | 121 (19.8%) | 483 (79.0%) |
| 65 to 74 Years | 315 (90.5%) | 227 (65.2%) |
| 75 Years and over | 177 (82.7%) | 131 (61.2%) |
| Total | 1,417 (44.2%) | 2,194 (68.4%) |
Disability Status by Sex by Age in Brookhaven
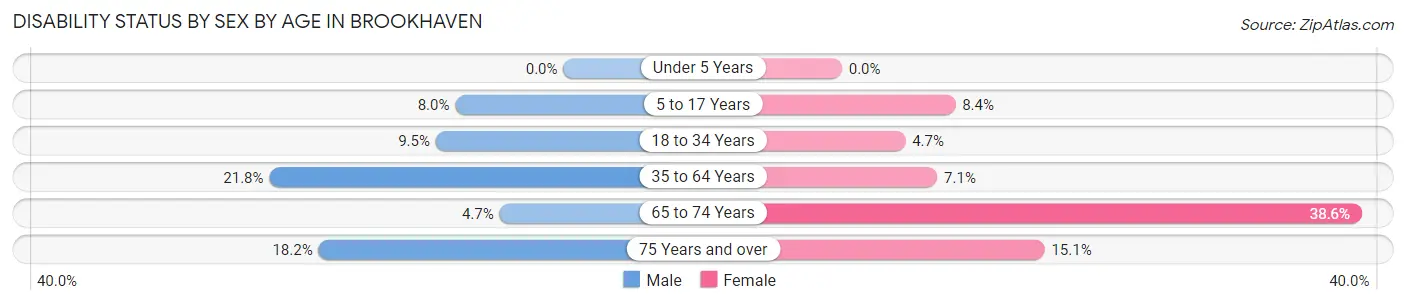
| Age Bracket | Male | Female |
| Under 5 Years | 0 (0.0%) | 0 (0.0%) |
| 5 to 17 Years | 17 (8.0%) | 24 (8.4%) |
| 18 to 34 Years | 32 (9.5%) | 13 (4.7%) |
| 35 to 64 Years | 155 (21.8%) | 45 (7.1%) |
| 65 to 74 Years | 9 (4.7%) | 61 (38.6%) |
| 75 Years and over | 22 (18.2%) | 14 (15.0%) |
Disability Class by Sex by Age in Brookhaven
Disability Class: Hearing Difficulty
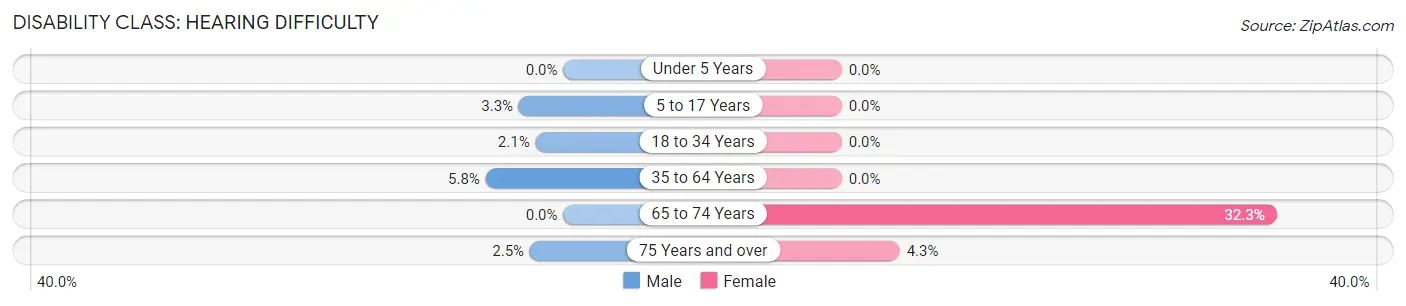
| Age Bracket | Male | Female |
| Under 5 Years | 0 (0.0%) | 0 (0.0%) |
| 5 to 17 Years | 7 (3.3%) | 0 (0.0%) |
| 18 to 34 Years | 7 (2.1%) | 0 (0.0%) |
| 35 to 64 Years | 41 (5.8%) | 0 (0.0%) |
| 65 to 74 Years | 0 (0.0%) | 51 (32.3%) |
| 75 Years and over | 3 (2.5%) | 4 (4.3%) |
Disability Class: Vision Difficulty
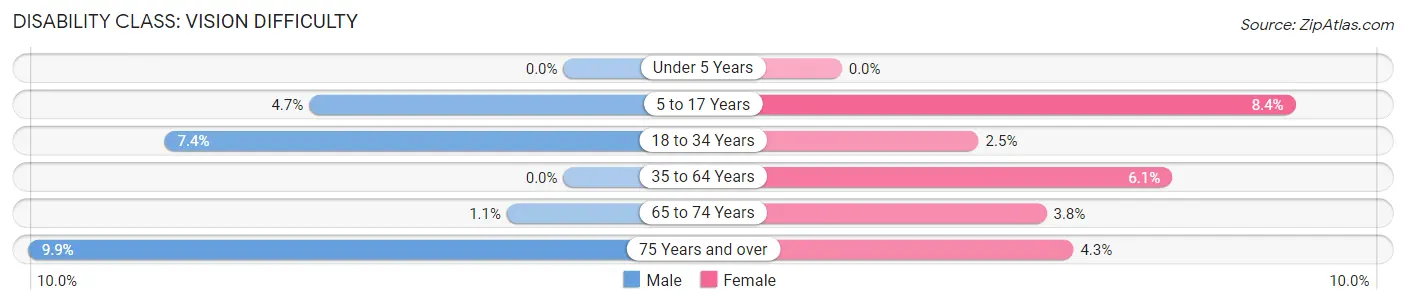
| Age Bracket | Male | Female |
| Under 5 Years | 0 (0.0%) | 0 (0.0%) |
| 5 to 17 Years | 10 (4.7%) | 24 (8.4%) |
| 18 to 34 Years | 25 (7.4%) | 7 (2.5%) |
| 35 to 64 Years | 0 (0.0%) | 39 (6.1%) |
| 65 to 74 Years | 2 (1.1%) | 6 (3.8%) |
| 75 Years and over | 12 (9.9%) | 4 (4.3%) |
Disability Class: Cognitive Difficulty
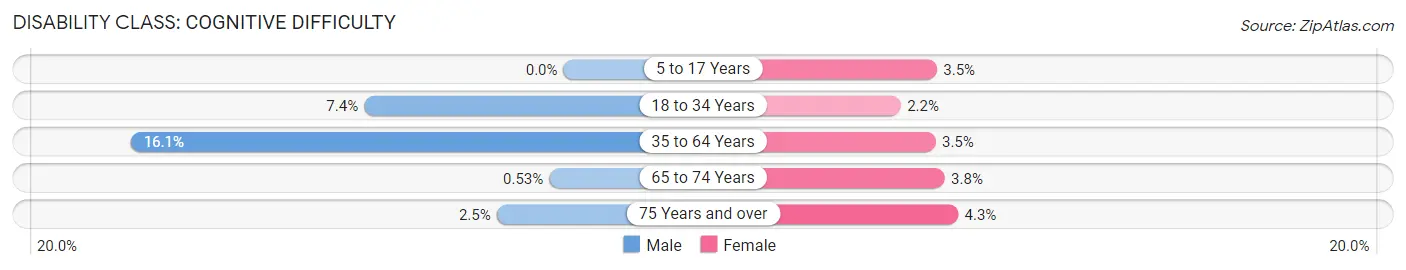
| Age Bracket | Male | Female |
| 5 to 17 Years | 0 (0.0%) | 10 (3.5%) |
| 18 to 34 Years | 25 (7.4%) | 6 (2.2%) |
| 35 to 64 Years | 114 (16.1%) | 22 (3.5%) |
| 65 to 74 Years | 1 (0.5%) | 6 (3.8%) |
| 75 Years and over | 3 (2.5%) | 4 (4.3%) |
Disability Class: Ambulatory Difficulty
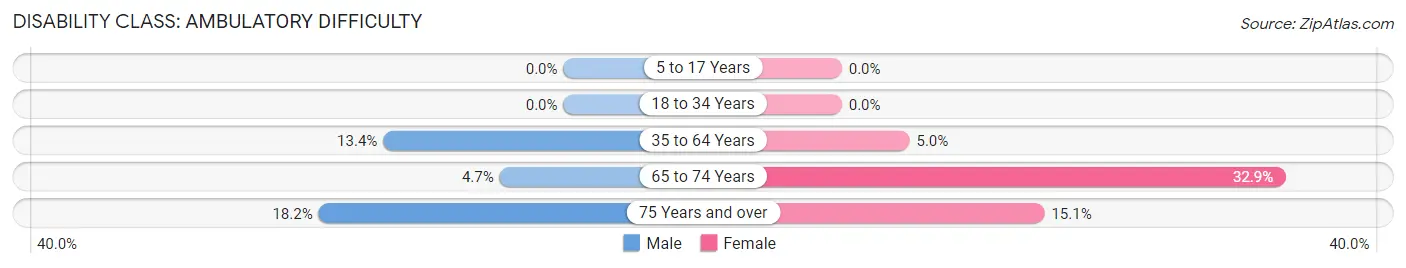
| Age Bracket | Male | Female |
| 5 to 17 Years | 0 (0.0%) | 0 (0.0%) |
| 18 to 34 Years | 0 (0.0%) | 0 (0.0%) |
| 35 to 64 Years | 95 (13.4%) | 32 (5.0%) |
| 65 to 74 Years | 9 (4.7%) | 52 (32.9%) |
| 75 Years and over | 22 (18.2%) | 14 (15.0%) |
Disability Class: Self-Care Difficulty
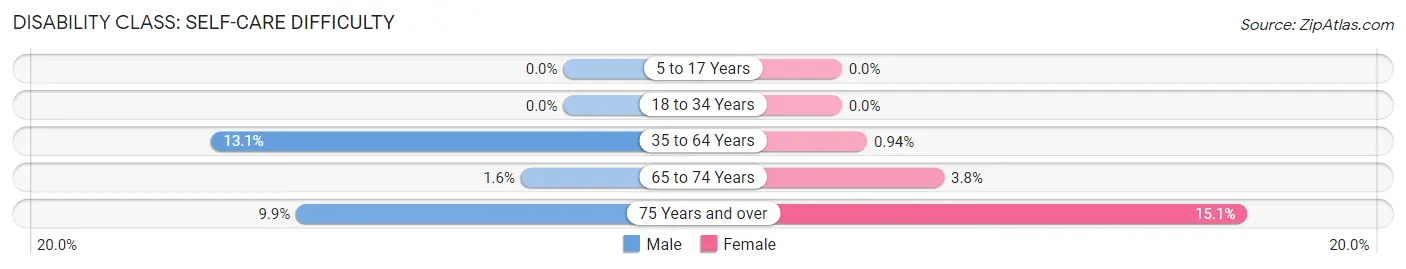
| Age Bracket | Male | Female |
| 5 to 17 Years | 0 (0.0%) | 0 (0.0%) |
| 18 to 34 Years | 0 (0.0%) | 0 (0.0%) |
| 35 to 64 Years | 93 (13.1%) | 6 (0.9%) |
| 65 to 74 Years | 3 (1.6%) | 6 (3.8%) |
| 75 Years and over | 12 (9.9%) | 14 (15.0%) |
Technology Access in Brookhaven
Computing Device Access in Brookhaven
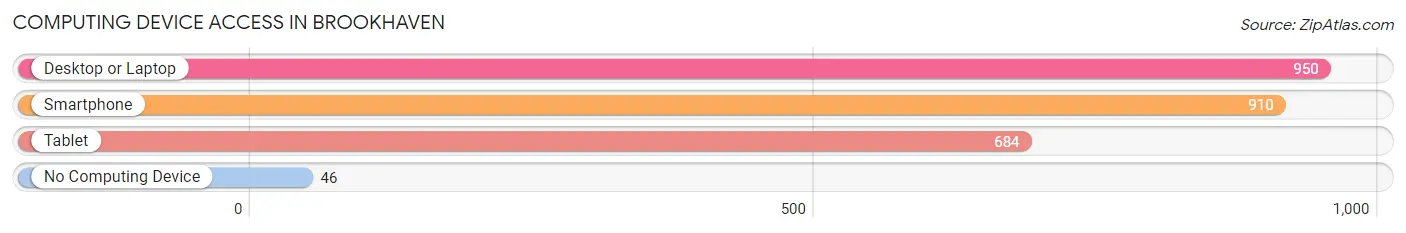
| Device Type | # Households | % Households |
| Desktop or Laptop | 950 | 86.5% |
| Smartphone | 910 | 82.9% |
| Tablet | 684 | 62.3% |
| No Computing Device | 46 | 4.2% |
| Total | 1,098 | 100.0% |
Internet Access in Brookhaven
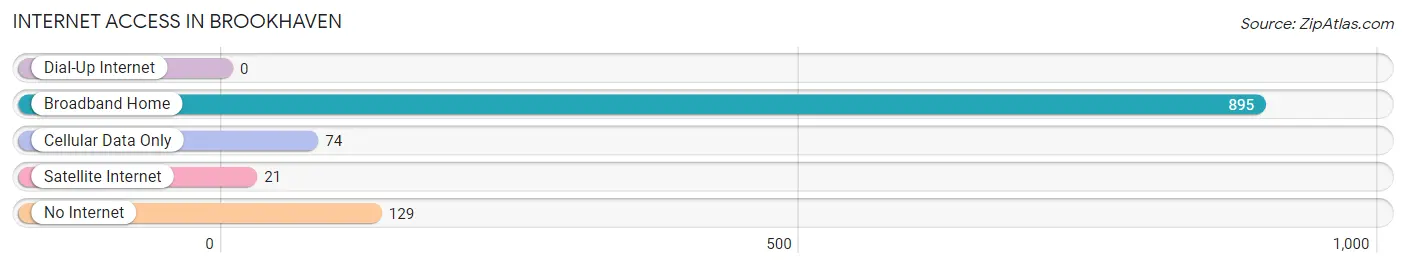
| Internet Type | # Households | % Households |
| Dial-Up Internet | 0 | 0.0% |
| Broadband Home | 895 | 81.5% |
| Cellular Data Only | 74 | 6.7% |
| Satellite Internet | 21 | 1.9% |
| No Internet | 129 | 11.7% |
| Total | 1,098 | 100.0% |
Brookhaven Summary
Brookhaven is a town located in Suffolk County, New York, United States. It is the largest town in the county, with a population of 486,040 as of the 2010 census. The town is situated on the south shore of Long Island, and is bordered by the towns of Smithtown, Islip, and Southampton.
History
The area that is now Brookhaven was originally inhabited by the Algonquian-speaking Setauket tribe of Native Americans. The first European settlers arrived in the area in 1655, when the English purchased land from the Setauket tribe. The town was officially established in 1666, and was named after the town of Brookhaven in England.
In the late 19th century, Brookhaven became a popular summer resort for wealthy New Yorkers. The town was also home to several large estates, including the William K. Vanderbilt estate, which is now a museum.
Geography
Brookhaven is located on the south shore of Long Island, and is bordered by the towns of Smithtown, Islip, and Southampton. The town covers an area of 201.3 square miles, and has a population density of 2,420 people per square mile.
The town is home to several bodies of water, including the Long Island Sound, the Great South Bay, and the Carmans River. The town is also home to several parks, including the Brookhaven State Park, the William Floyd Estate, and the Fire Island National Seashore.
Economy
The economy of Brookhaven is largely based on tourism, with many visitors coming to the town to enjoy its beaches, parks, and other attractions. The town is also home to several large businesses, including Brookhaven National Laboratory, Stony Brook University, and the Brookhaven Memorial Hospital.
Demographics
As of the 2010 census, the population of Brookhaven was 486,040. The racial makeup of the town was 79.2% White, 11.3% African American, 0.3% Native American, 3.2% Asian, 0.1% Pacific Islander, and 5.9% from other races. The median household income was $87,837, and the median family income was $103,837.
The town is home to a large number of immigrants, with the largest groups being from Mexico, India, and the Dominican Republic. The town is also home to a large number of religious institutions, including churches, synagogues, and mosques.
Conclusion
Brookhaven is a town located in Suffolk County, New York, United States. It is the largest town in the county, with a population of 486,040 as of the 2010 census. The town is situated on the south shore of Long Island, and is bordered by the towns of Smithtown, Islip, and Southampton. The economy of Brookhaven is largely based on tourism, with many visitors coming to the town to enjoy its beaches, parks, and other attractions. The town is also home to several large businesses, including Brookhaven National Laboratory, Stony Brook University, and the Brookhaven Memorial Hospital. The population of Brookhaven is diverse, with the largest racial groups being White, African American, Asian, and Hispanic. The town is also home to a large number of religious institutions, including churches, synagogues, and mosques.
Common Questions
What is Per Capita Income in Brookhaven?
Per Capita income in Brookhaven is $46,584.
What is the Median Family Income in Brookhaven?
Median Family Income in Brookhaven is $147,700.
What is the Median Household income in Brookhaven?
Median Household Income in Brookhaven is $105,481.
What is Income or Wage Gap in Brookhaven?
Income or Wage Gap in Brookhaven is 2.6%.
Women in Brookhaven earn 97.4 cents for every dollar earned by a man.
What is Inequality or Gini Index in Brookhaven?
Inequality or Gini Index in Brookhaven is 0.48.
What is the Total Population of Brookhaven?
Total Population of Brookhaven is 3,408.
What is the Total Male Population of Brookhaven?
Total Male Population of Brookhaven is 1,697.
What is the Total Female Population of Brookhaven?
Total Female Population of Brookhaven is 1,711.
What is the Ratio of Males per 100 Females in Brookhaven?
There are 99.18 Males per 100 Females in Brookhaven.
What is the Ratio of Females per 100 Males in Brookhaven?
There are 100.82 Females per 100 Males in Brookhaven.
What is the Median Population Age in Brookhaven?
Median Population Age in Brookhaven is 47.5 Years.
What is the Average Family Size in Brookhaven
Average Family Size in Brookhaven is 3.2 People.
What is the Average Household Size in Brookhaven
Average Household Size in Brookhaven is 2.6 People.
How Large is the Labor Force in Brookhaven?
There are 1,668 People in the Labor Forcein in Brookhaven.
What is the Percentage of People in the Labor Force in Brookhaven?
59.6% of People are in the Labor Force in Brookhaven.
What is the Unemployment Rate in Brookhaven?
Unemployment Rate in Brookhaven is 10.7%.