Wells, NY Map & Demographics
Wells Map
Wells Overview
$26,113
PER CAPITA INCOME
$72,500
AVG FAMILY INCOME
$75,583
AVG HOUSEHOLD INCOME
1.8%
WAGE / INCOME GAP [ % ]
98.2¢/ $1
WAGE / INCOME GAP [ $ ]
0.41
INEQUALITY / GINI INDEX
571
TOTAL POPULATION
294
MALE POPULATION
277
FEMALE POPULATION
106.14
MALES / 100 FEMALES
94.22
FEMALES / 100 MALES
47.8
MEDIAN AGE
3.6
AVG FAMILY SIZE
3.2
AVG HOUSEHOLD SIZE
200
LABOR FORCE [ PEOPLE ]
42.3%
PERCENT IN LABOR FORCE
8.5%
UNEMPLOYMENT RATE
Wells Zip Codes
Wells Area Codes
Income in Wells
Income Overview in Wells
Per Capita Income in Wells is $26,113, while median incomes of families and households are $72,500 and $75,583 respectively.
| Characteristic | Number | Measure |
| Per Capita Income | 571 | $26,113 |
| Median Family Income | 142 | $72,500 |
| Mean Family Income | 142 | $88,499 |
| Median Household Income | 165 | $75,583 |
| Mean Household Income | 165 | $86,632 |
| Income Deficit | 142 | $0 |
| Wage / Income Gap (%) | 571 | 1.83% |
| Wage / Income Gap ($) | 571 | 98.17¢ per $1 |
| Gini / Inequality Index | 571 | 0.41 |
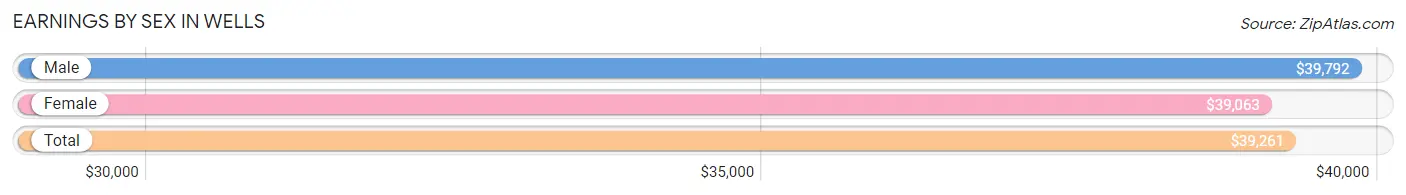
Earnings by Sex in Wells
Average Earnings in Wells are $39,261, $39,792 for men and $39,063 for women, a difference of 1.8%.
| Sex | Number | Average Earnings |
| Male | 131 (59.3%) | $39,792 |
| Female | 90 (40.7%) | $39,063 |
| Total | 221 (100.0%) | $39,261 |
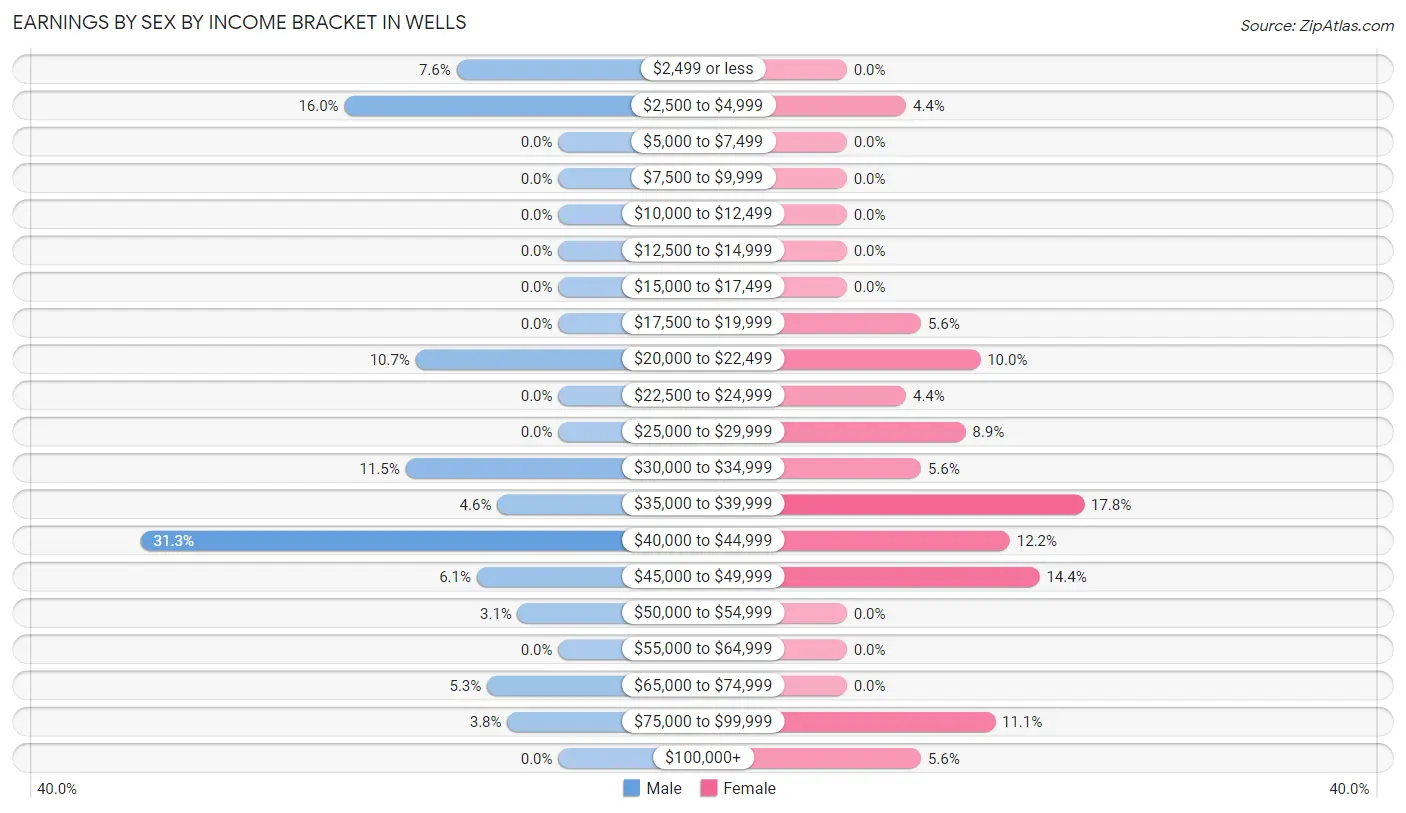
Earnings by Sex by Income Bracket in Wells
The most common earnings brackets in Wells are $40,000 to $44,999 for men (41 | 31.3%) and $35,000 to $39,999 for women (16 | 17.8%).
| Income | Male | Female |
| $2,499 or less | 10 (7.6%) | 0 (0.0%) |
| $2,500 to $4,999 | 21 (16.0%) | 4 (4.4%) |
| $5,000 to $7,499 | 0 (0.0%) | 0 (0.0%) |
| $7,500 to $9,999 | 0 (0.0%) | 0 (0.0%) |
| $10,000 to $12,499 | 0 (0.0%) | 0 (0.0%) |
| $12,500 to $14,999 | 0 (0.0%) | 0 (0.0%) |
| $15,000 to $17,499 | 0 (0.0%) | 0 (0.0%) |
| $17,500 to $19,999 | 0 (0.0%) | 5 (5.6%) |
| $20,000 to $22,499 | 14 (10.7%) | 9 (10.0%) |
| $22,500 to $24,999 | 0 (0.0%) | 4 (4.4%) |
| $25,000 to $29,999 | 0 (0.0%) | 8 (8.9%) |
| $30,000 to $34,999 | 15 (11.5%) | 5 (5.6%) |
| $35,000 to $39,999 | 6 (4.6%) | 16 (17.8%) |
| $40,000 to $44,999 | 41 (31.3%) | 11 (12.2%) |
| $45,000 to $49,999 | 8 (6.1%) | 13 (14.4%) |
| $50,000 to $54,999 | 4 (3.0%) | 0 (0.0%) |
| $55,000 to $64,999 | 0 (0.0%) | 0 (0.0%) |
| $65,000 to $74,999 | 7 (5.3%) | 0 (0.0%) |
| $75,000 to $99,999 | 5 (3.8%) | 10 (11.1%) |
| $100,000+ | 0 (0.0%) | 5 (5.6%) |
| Total | 131 (100.0%) | 90 (100.0%) |
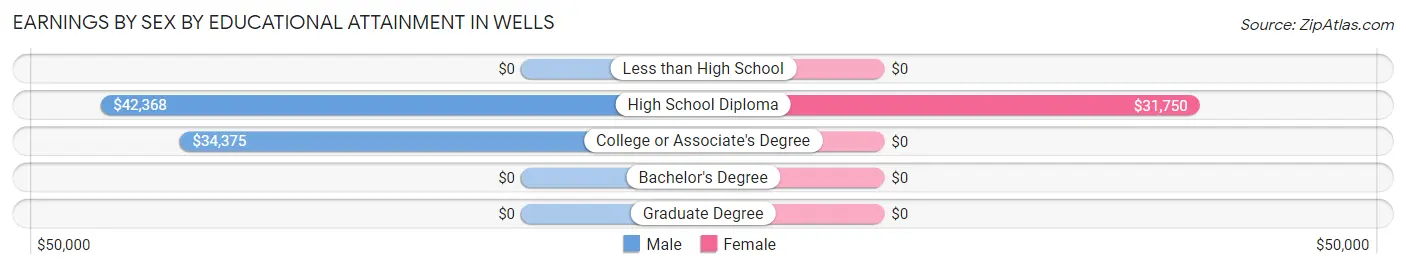
Earnings by Sex by Educational Attainment in Wells
Average earnings in Wells are $41,250 for men and $39,766 for women, a difference of 3.6%. Men with an educational attainment of high school diploma enjoy the highest average annual earnings of $42,368, while those with college or associate's degree education earn the least with $34,375. Women with an educational attainment of high school diploma earn the most with the average annual earnings of $31,750, while those with high school diploma education have the smallest earnings of $31,750.
| Educational Attainment | Male Income | Female Income |
| Less than High School | - | - |
| High School Diploma | $42,368 | $31,750 |
| College or Associate's Degree | $34,375 | $0 |
| Bachelor's Degree | - | - |
| Graduate Degree | - | - |
| Total | $41,250 | $39,766 |
Family Income in Wells
Family Income Brackets in Wells
According to the Wells family income data, there are 39 families falling into the $35,000 to $49,999 income range, which is the most common income bracket and makes up 27.5% of all families.
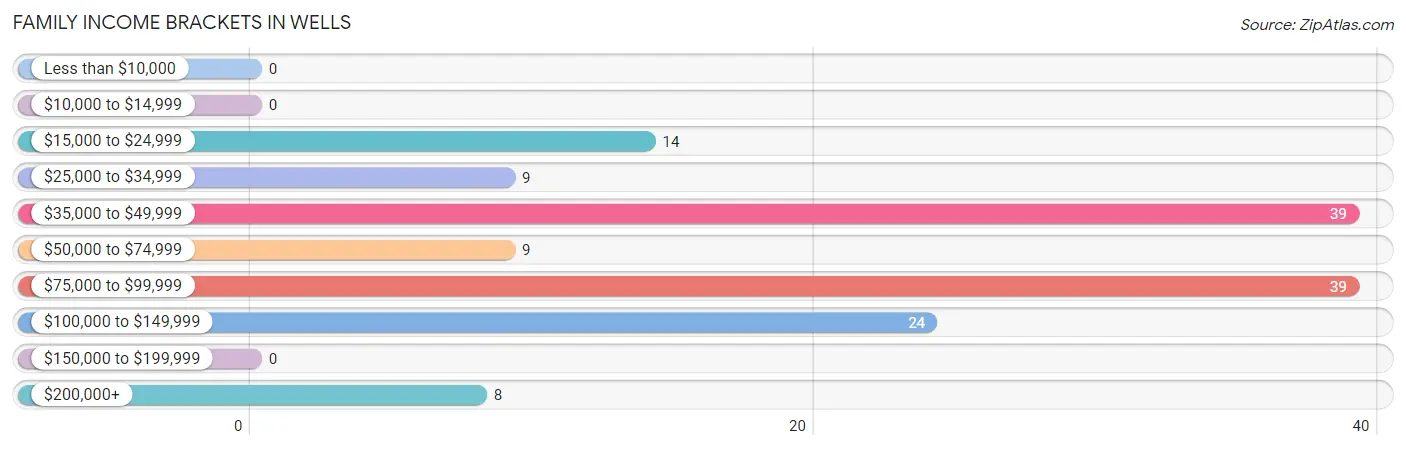
| Income Bracket | # Families | % Families |
| Less than $10,000 | 0 | 0.0% |
| $10,000 to $14,999 | 0 | 0.0% |
| $15,000 to $24,999 | 14 | 9.9% |
| $25,000 to $34,999 | 9 | 6.3% |
| $35,000 to $49,999 | 39 | 27.5% |
| $50,000 to $74,999 | 9 | 6.3% |
| $75,000 to $99,999 | 39 | 27.5% |
| $100,000 to $149,999 | 24 | 16.9% |
| $150,000 to $199,999 | 0 | 0.0% |
| $200,000+ | 8 | 5.6% |
Family Income by Famaliy Size in Wells
3-person families (23 | 16.2%) account for the highest median family income in Wells with $92,750 per family, while 3-person families (23 | 16.2%) have the highest median income of $30,917 per family member.
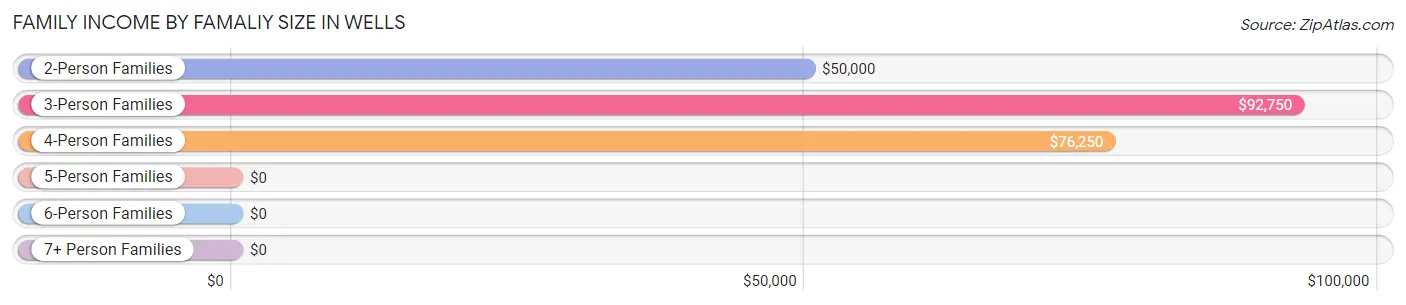
| Income Bracket | # Families | Median Income |
| 2-Person Families | 74 (52.1%) | $50,000 |
| 3-Person Families | 23 (16.2%) | $92,750 |
| 4-Person Families | 33 (23.2%) | $76,250 |
| 5-Person Families | 0 (0.0%) | $0 |
| 6-Person Families | 12 (8.5%) | $0 |
| 7+ Person Families | 0 (0.0%) | $0 |
| Total | 142 (100.0%) | $72,500 |
Family Income by Number of Earners in Wells
The median family income in Wells is $72,500, with families comprising 3+ earners (18) having the highest median family income of $93,000, while families with 1 earner (57) have the lowest median family income of $41,563, accounting for 12.7% and 40.1% of families, respectively.
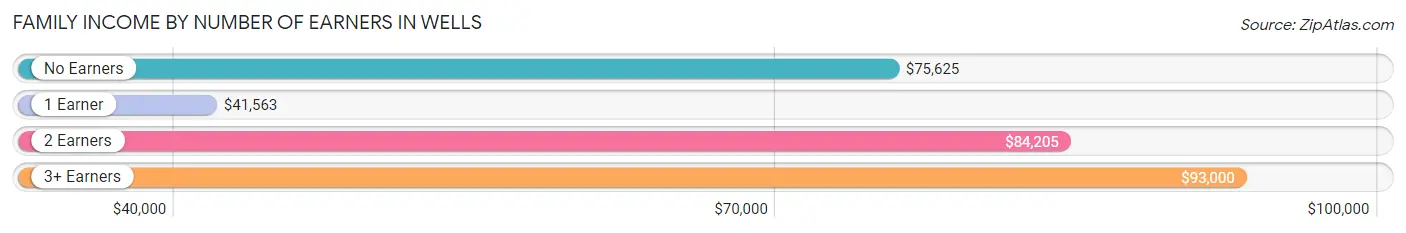
| Number of Earners | # Families | Median Income |
| No Earners | 34 (23.9%) | $75,625 |
| 1 Earner | 57 (40.1%) | $41,563 |
| 2 Earners | 33 (23.2%) | $84,205 |
| 3+ Earners | 18 (12.7%) | $93,000 |
| Total | 142 (100.0%) | $72,500 |
Household Income in Wells
Household Income Brackets in Wells
With 54 households falling in the category, the $75,000 to $99,999 income range is the most frequent in Wells, accounting for 32.7% of all households.
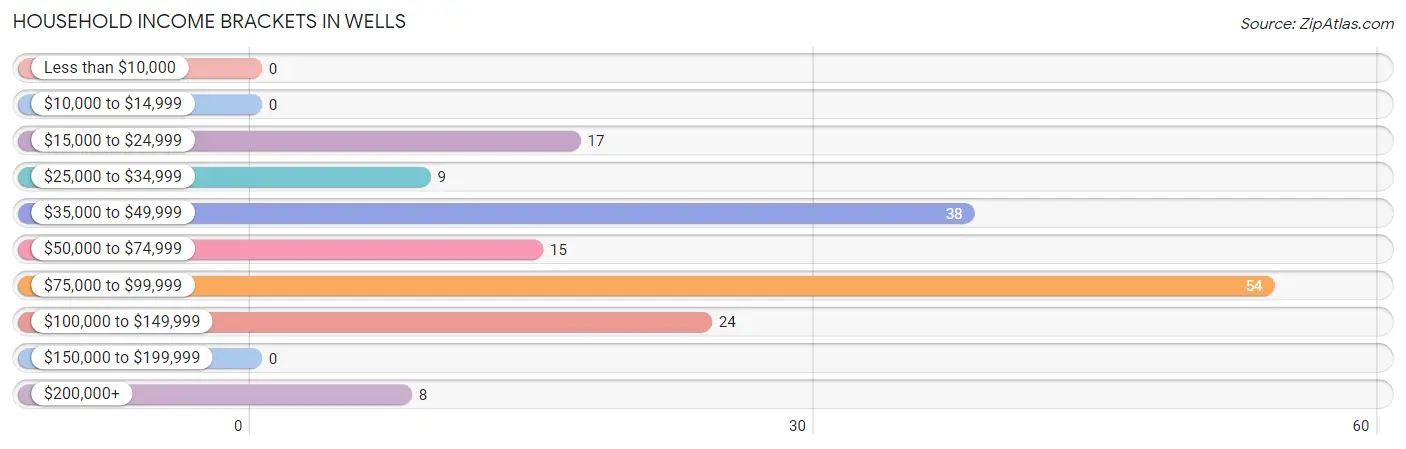
| Income Bracket | # Households | % Households |
| Less than $10,000 | 0 | 0.0% |
| $10,000 to $14,999 | 0 | 0.0% |
| $15,000 to $24,999 | 17 | 10.3% |
| $25,000 to $34,999 | 9 | 5.5% |
| $35,000 to $49,999 | 38 | 23.0% |
| $50,000 to $74,999 | 15 | 9.1% |
| $75,000 to $99,999 | 54 | 32.7% |
| $100,000 to $149,999 | 24 | 14.5% |
| $150,000 to $199,999 | 0 | 0.0% |
| $200,000+ | 8 | 4.8% |
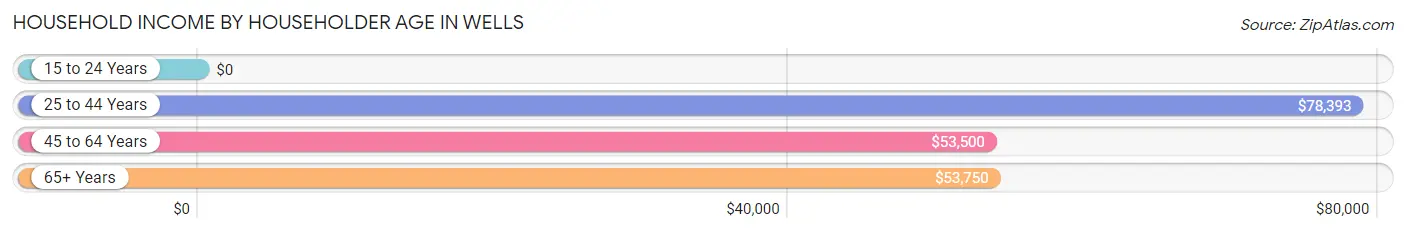
Household Income by Householder Age in Wells
The median household income in Wells is $75,583, with the highest median household income of $78,393 found in the 25 to 44 years age bracket for the primary householder. A total of 27 households (16.4%) fall into this category.
| Income Bracket | # Households | Median Income |
| 15 to 24 Years | 0 (0.0%) | $0 |
| 25 to 44 Years | 27 (16.4%) | $78,393 |
| 45 to 64 Years | 94 (57.0%) | $53,500 |
| 65+ Years | 44 (26.7%) | $53,750 |
| Total | 165 (100.0%) | $75,583 |
Poverty in Wells
Income Below Poverty by Sex and Age in Wells
With 6.5% poverty level for males and 3.3% for females among the residents of Wells, 65 to 74 year old males and 18 to 24 year old females are the most vulnerable to poverty, with 7 males (21.2%) and 3 females (25.0%) in their respective age groups living below the poverty level.
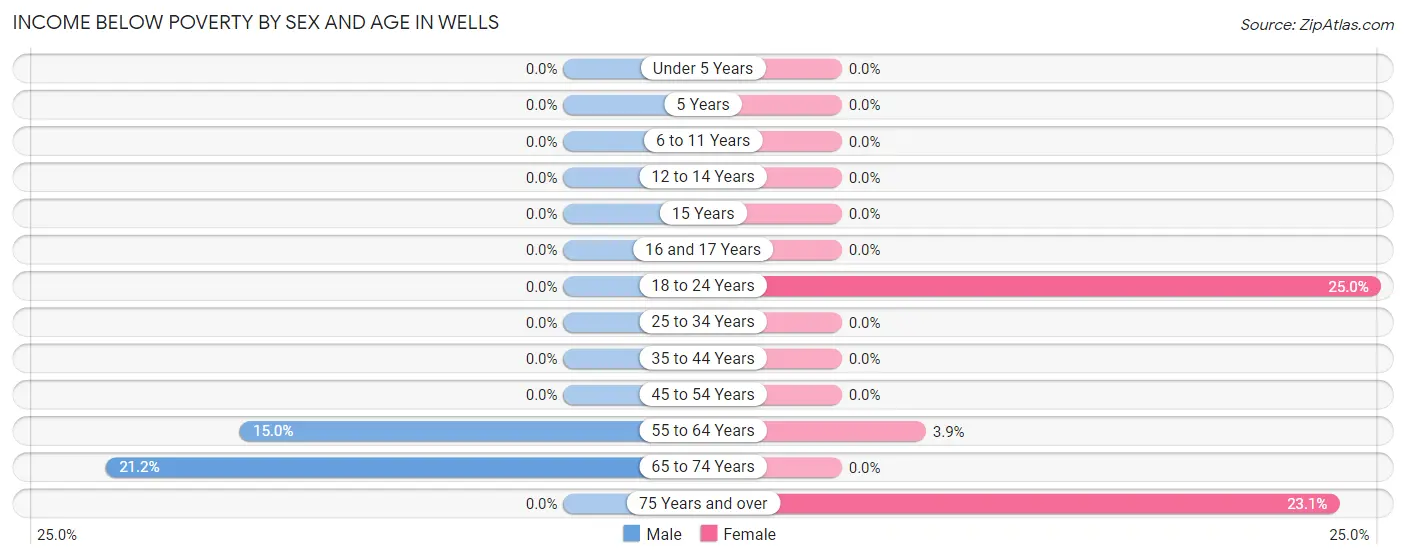
| Age Bracket | Male | Female |
| Under 5 Years | 0 (0.0%) | 0 (0.0%) |
| 5 Years | 0 (0.0%) | 0 (0.0%) |
| 6 to 11 Years | 0 (0.0%) | 0 (0.0%) |
| 12 to 14 Years | 0 (0.0%) | 0 (0.0%) |
| 15 Years | 0 (0.0%) | 0 (0.0%) |
| 16 and 17 Years | 0 (0.0%) | 0 (0.0%) |
| 18 to 24 Years | 0 (0.0%) | 3 (25.0%) |
| 25 to 34 Years | 0 (0.0%) | 0 (0.0%) |
| 35 to 44 Years | 0 (0.0%) | 0 (0.0%) |
| 45 to 54 Years | 0 (0.0%) | 0 (0.0%) |
| 55 to 64 Years | 12 (15.0%) | 3 (3.9%) |
| 65 to 74 Years | 7 (21.2%) | 0 (0.0%) |
| 75 Years and over | 0 (0.0%) | 3 (23.1%) |
| Total | 19 (6.5%) | 9 (3.3%) |
Income Above Poverty by Sex and Age in Wells
According to the poverty statistics in Wells, males aged under 5 years and females aged under 5 years are the age groups that are most secure financially, with 100.0% of males and 100.0% of females in these age groups living above the poverty line.
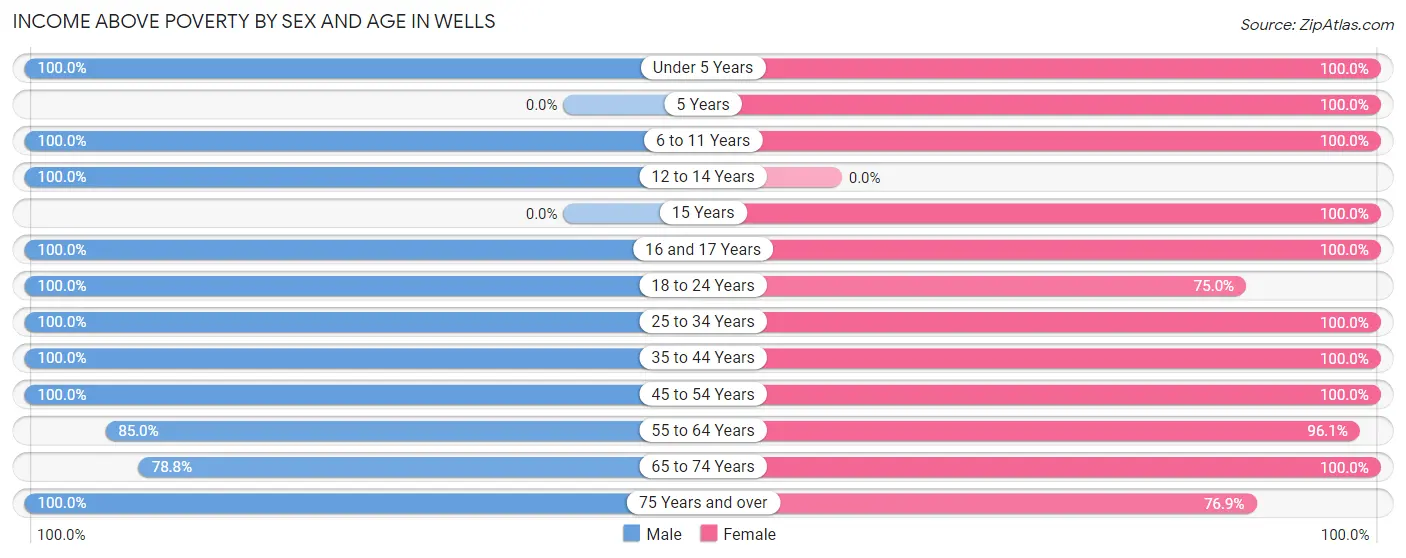
| Age Bracket | Male | Female |
| Under 5 Years | 24 (100.0%) | 8 (100.0%) |
| 5 Years | 0 (0.0%) | 11 (100.0%) |
| 6 to 11 Years | 8 (100.0%) | 21 (100.0%) |
| 12 to 14 Years | 13 (100.0%) | 0 (0.0%) |
| 15 Years | 0 (0.0%) | 13 (100.0%) |
| 16 and 17 Years | 37 (100.0%) | 9 (100.0%) |
| 18 to 24 Years | 22 (100.0%) | 9 (75.0%) |
| 25 to 34 Years | 31 (100.0%) | 9 (100.0%) |
| 35 to 44 Years | 7 (100.0%) | 42 (100.0%) |
| 45 to 54 Years | 29 (100.0%) | 45 (100.0%) |
| 55 to 64 Years | 68 (85.0%) | 74 (96.1%) |
| 65 to 74 Years | 26 (78.8%) | 17 (100.0%) |
| 75 Years and over | 10 (100.0%) | 10 (76.9%) |
| Total | 275 (93.5%) | 268 (96.8%) |
Income Below Poverty Among Married-Couple Families in Wells
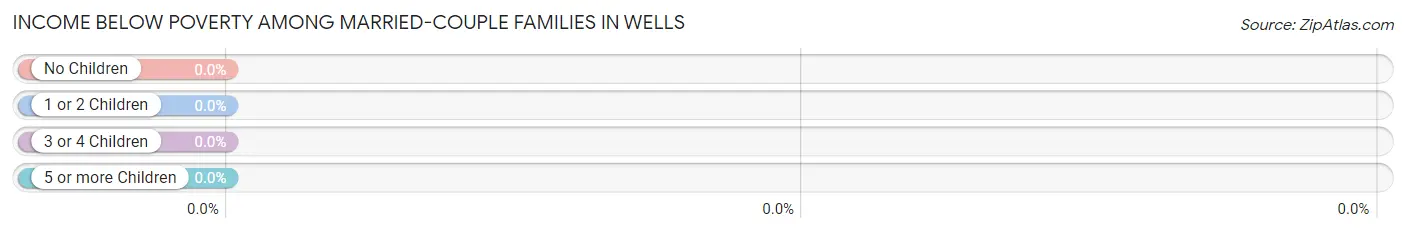
| Children | Above Poverty | Below Poverty |
| No Children | 61 (100.0%) | 0 (0.0%) |
| 1 or 2 Children | 35 (100.0%) | 0 (0.0%) |
| 3 or 4 Children | 12 (100.0%) | 0 (0.0%) |
| 5 or more Children | 0 (0.0%) | 0 (0.0%) |
| Total | 108 (100.0%) | 0 (0.0%) |
Income Below Poverty Among Single-Parent Households in Wells
| Children | Single Father | Single Mother |
| No Children | 0 (0.0%) | 0 (0.0%) |
| 1 or 2 Children | 0 (0.0%) | 0 (0.0%) |
| 3 or 4 Children | 0 (0.0%) | 0 (0.0%) |
| 5 or more Children | 0 (0.0%) | 0 (0.0%) |
| Total | 0 (0.0%) | 0 (0.0%) |
Income Below Poverty Among Married-Couple vs Single-Parent Households in Wells
| Children | Married-Couple Families | Single-Parent Households |
| No Children | 0 (0.0%) | 0 (0.0%) |
| 1 or 2 Children | 0 (0.0%) | 0 (0.0%) |
| 3 or 4 Children | 0 (0.0%) | 0 (0.0%) |
| 5 or more Children | 0 (0.0%) | 0 (0.0%) |
| Total | 0 (0.0%) | 0 (0.0%) |
Race in Wells
The most populous races in Wells are White / Caucasian (562 | 98.4%), Black / African American (6 | 1.1%), and Hispanic or Latino (3 | 0.5%).
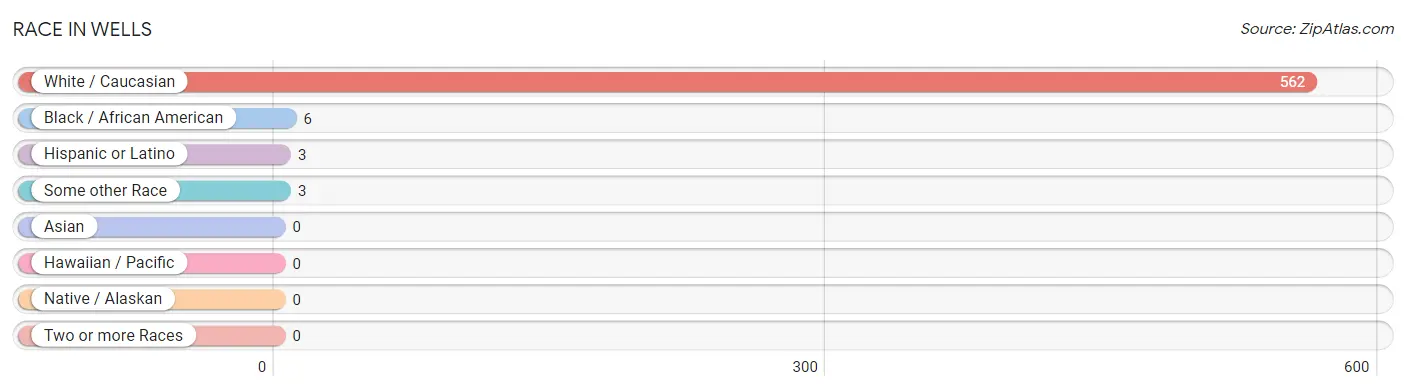
| Race | # Population | % Population |
| Asian | 0 | 0.0% |
| Black / African American | 6 | 1.1% |
| Hawaiian / Pacific | 0 | 0.0% |
| Hispanic or Latino | 3 | 0.5% |
| Native / Alaskan | 0 | 0.0% |
| White / Caucasian | 562 | 98.4% |
| Two or more Races | 0 | 0.0% |
| Some other Race | 3 | 0.5% |
| Total | 571 | 100.0% |
Ancestry in Wells
The most populous ancestries reported in Wells are American (256 | 44.8%), Italian (62 | 10.9%), English (54 | 9.5%), German (50 | 8.8%), and Irish (35 | 6.1%), together accounting for 80.0% of all Wells residents.
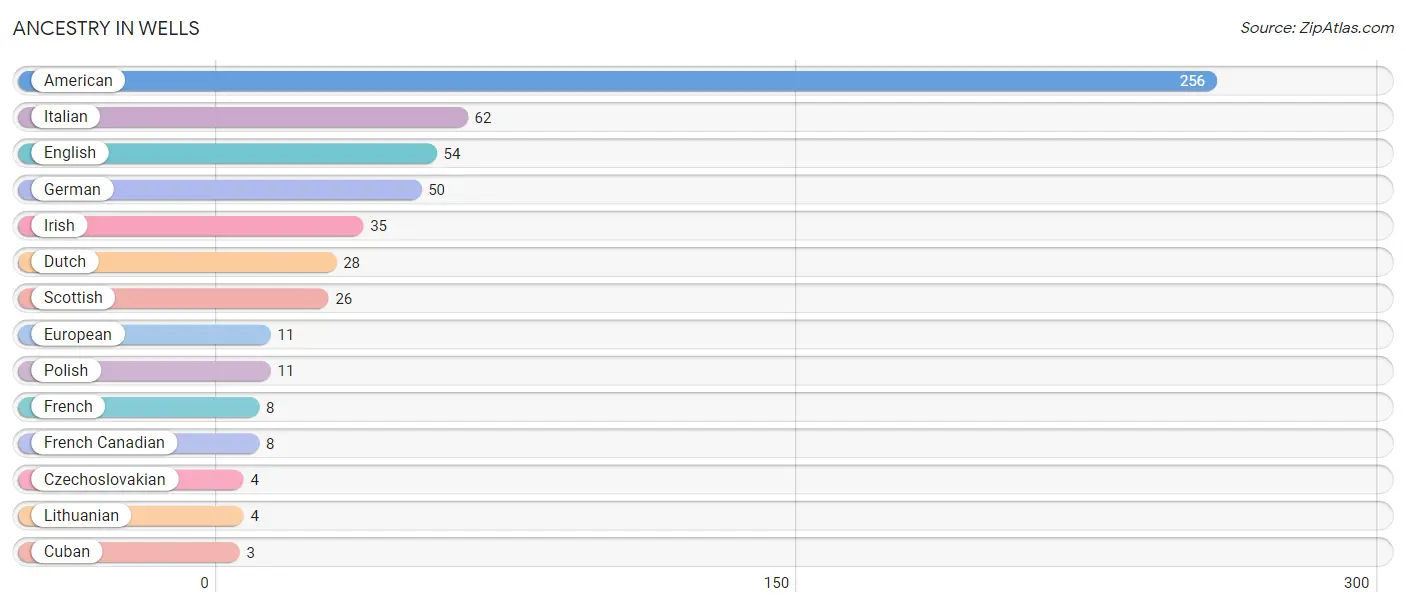
| Ancestry | # Population | % Population |
| American | 256 | 44.8% |
| Cuban | 3 | 0.5% |
| Czechoslovakian | 4 | 0.7% |
| Dutch | 28 | 4.9% |
| English | 54 | 9.5% |
| European | 11 | 1.9% |
| French | 8 | 1.4% |
| French Canadian | 8 | 1.4% |
| German | 50 | 8.8% |
| Irish | 35 | 6.1% |
| Italian | 62 | 10.9% |
| Lithuanian | 4 | 0.7% |
| Polish | 11 | 1.9% |
| Scottish | 26 | 4.5% | View All 14 Rows |
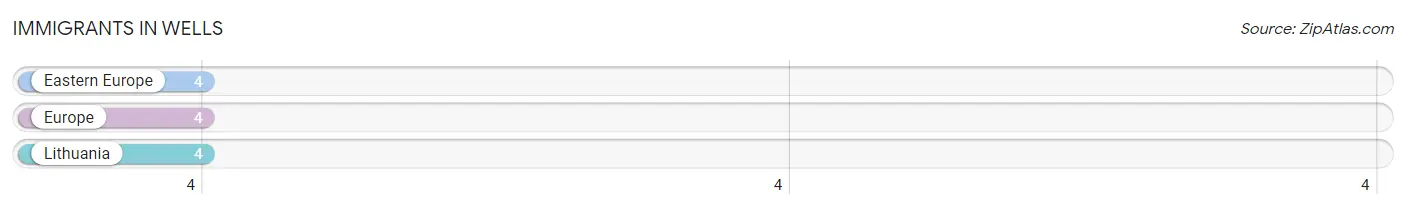
Immigrants in Wells
The most numerous immigrant groups reported in Wells came from Eastern Europe (4 | 0.7%), Europe (4 | 0.7%), and Lithuania (4 | 0.7%), together accounting for 2.1% of all Wells residents.
| Immigration Origin | # Population | % Population |
| Eastern Europe | 4 | 0.7% |
| Europe | 4 | 0.7% |
| Lithuania | 4 | 0.7% | View All 3 Rows |
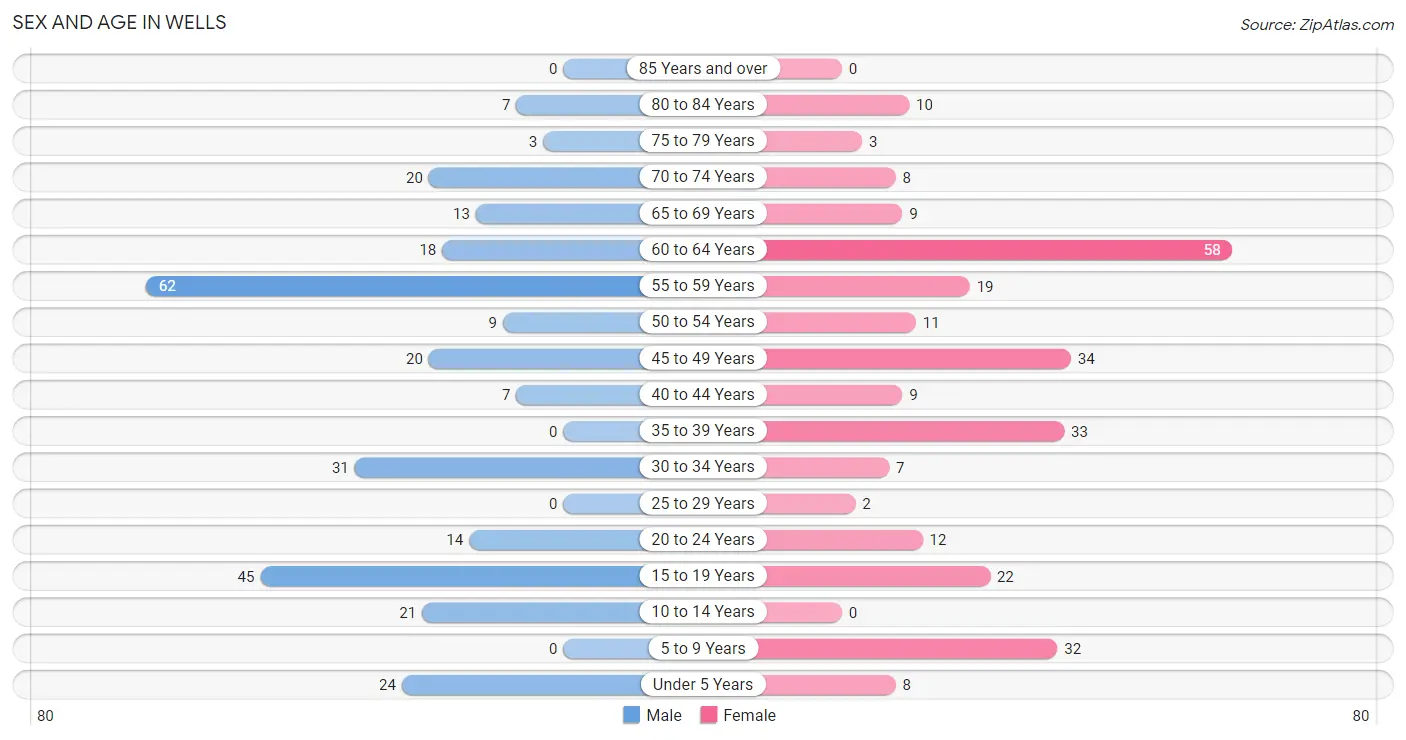
Sex and Age in Wells
Sex and Age in Wells
The most populous age groups in Wells are 55 to 59 Years (62 | 21.1%) for men and 60 to 64 Years (58 | 20.9%) for women.
| Age Bracket | Male | Female |
| Under 5 Years | 24 (8.2%) | 8 (2.9%) |
| 5 to 9 Years | 0 (0.0%) | 32 (11.6%) |
| 10 to 14 Years | 21 (7.1%) | 0 (0.0%) |
| 15 to 19 Years | 45 (15.3%) | 22 (7.9%) |
| 20 to 24 Years | 14 (4.8%) | 12 (4.3%) |
| 25 to 29 Years | 0 (0.0%) | 2 (0.7%) |
| 30 to 34 Years | 31 (10.5%) | 7 (2.5%) |
| 35 to 39 Years | 0 (0.0%) | 33 (11.9%) |
| 40 to 44 Years | 7 (2.4%) | 9 (3.3%) |
| 45 to 49 Years | 20 (6.8%) | 34 (12.3%) |
| 50 to 54 Years | 9 (3.1%) | 11 (4.0%) |
| 55 to 59 Years | 62 (21.1%) | 19 (6.9%) |
| 60 to 64 Years | 18 (6.1%) | 58 (20.9%) |
| 65 to 69 Years | 13 (4.4%) | 9 (3.3%) |
| 70 to 74 Years | 20 (6.8%) | 8 (2.9%) |
| 75 to 79 Years | 3 (1.0%) | 3 (1.1%) |
| 80 to 84 Years | 7 (2.4%) | 10 (3.6%) |
| 85 Years and over | 0 (0.0%) | 0 (0.0%) |
| Total | 294 (100.0%) | 277 (100.0%) |
Families and Households in Wells
Median Family Size in Wells
The median family size in Wells is 3.56 persons per family, with single female/mother families (20 | 14.1%) accounting for the largest median family size of 5.55 persons per family. On the other hand, single male/father families (14 | 9.9%) represent the smallest median family size with 1.93 persons per family.
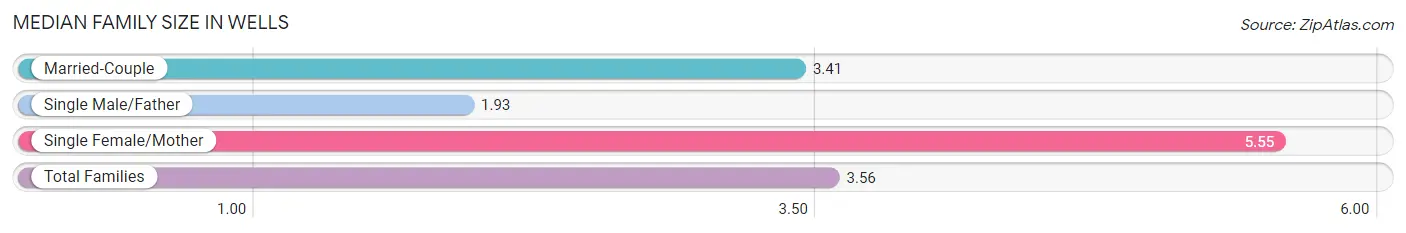
| Family Type | # Families | Family Size |
| Married-Couple | 108 (76.1%) | 3.41 |
| Single Male/Father | 14 (9.9%) | 1.93 |
| Single Female/Mother | 20 (14.1%) | 5.55 |
| Total Families | 142 (100.0%) | 3.56 |
Median Household Size in Wells
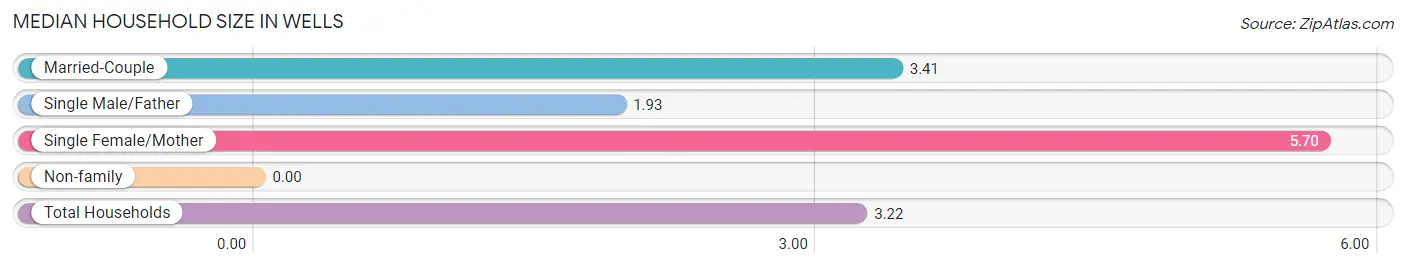
| Household Type | # Households | Household Size |
| Married-Couple | 108 (65.4%) | 3.41 |
| Single Male/Father | 14 (8.5%) | 1.93 |
| Single Female/Mother | 20 (12.1%) | 5.70 |
| Non-family | 23 (13.9%) | - |
| Total Households | 165 (100.0%) | 3.22 |
Household Size by Marriage Status in Wells
Out of a total of 165 households in Wells, 142 (86.1%) are family households, while 23 (13.9%) are nonfamily households. The most numerous type of family households are 2-person households, comprising 74, and the most common type of nonfamily households are 1-person households, comprising 23.
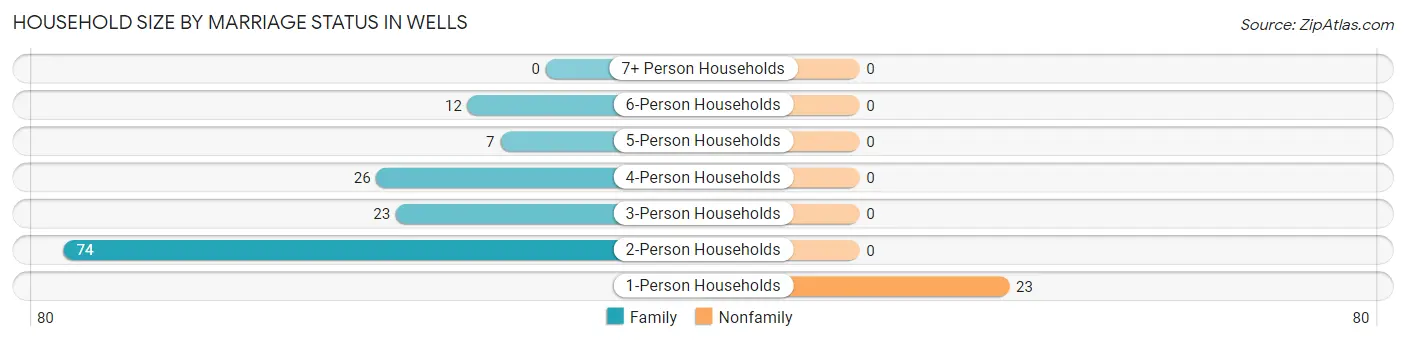
| Household Size | Family Households | Nonfamily Households |
| 1-Person Households | - | 23 (13.9%) |
| 2-Person Households | 74 (44.9%) | 0 (0.0%) |
| 3-Person Households | 23 (13.9%) | 0 (0.0%) |
| 4-Person Households | 26 (15.8%) | 0 (0.0%) |
| 5-Person Households | 7 (4.2%) | 0 (0.0%) |
| 6-Person Households | 12 (7.3%) | 0 (0.0%) |
| 7+ Person Households | 0 (0.0%) | 0 (0.0%) |
| Total | 142 (86.1%) | 23 (13.9%) |
Female Fertility in Wells
Fertility by Age in Wells
Average fertility rate in Wells is 311.0 births per 1,000 women. Women in the age bracket of 35 to 50 years have the highest fertility rate with 461.0 births per 1,000 women. Women in the age bracket of 35 to 50 years acount for 94.6% of all women with births.
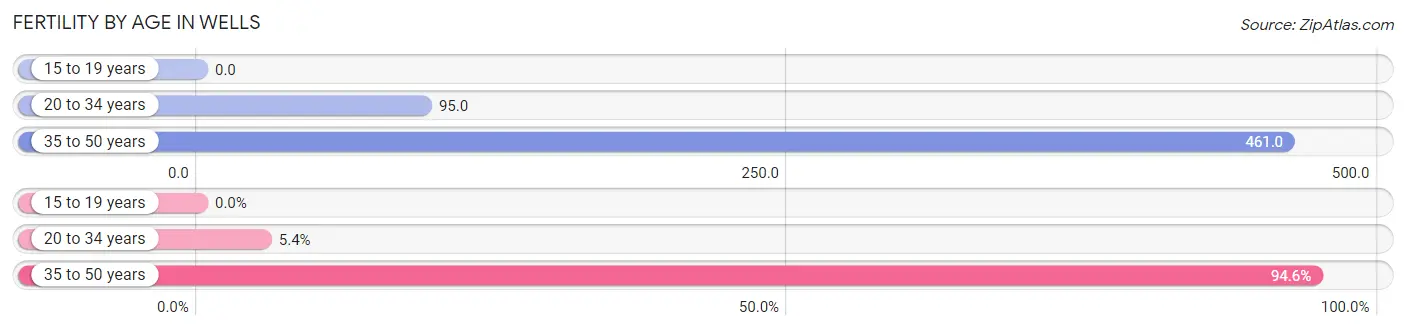
| Age Bracket | Women with Births | Births / 1,000 Women |
| 15 to 19 years | 0 (0.0%) | 0.0 |
| 20 to 34 years | 2 (5.4%) | 95.0 |
| 35 to 50 years | 35 (94.6%) | 461.0 |
| Total | 37 (100.0%) | 311.0 |
Fertility by Age by Marriage Status in Wells
27.0% of women with births (37) in Wells are married. The highest percentage of unmarried women with births falls into 35 to 50 years age bracket with 77.1% of them unmarried at the time of birth, while the lowest percentage of unmarried women with births belong to 20 to 34 years age bracket with 0.0% of them unmarried.
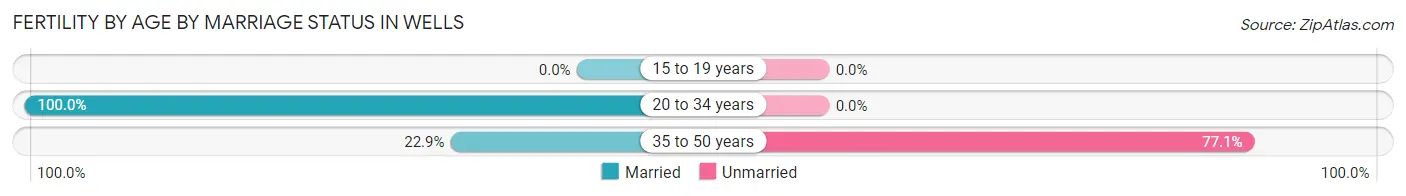
| Age Bracket | Married | Unmarried |
| 15 to 19 years | 0 (0.0%) | 0 (0.0%) |
| 20 to 34 years | 2 (100.0%) | 0 (0.0%) |
| 35 to 50 years | 8 (22.9%) | 27 (77.1%) |
| Total | 10 (27.0%) | 27 (73.0%) |
Fertility by Education in Wells
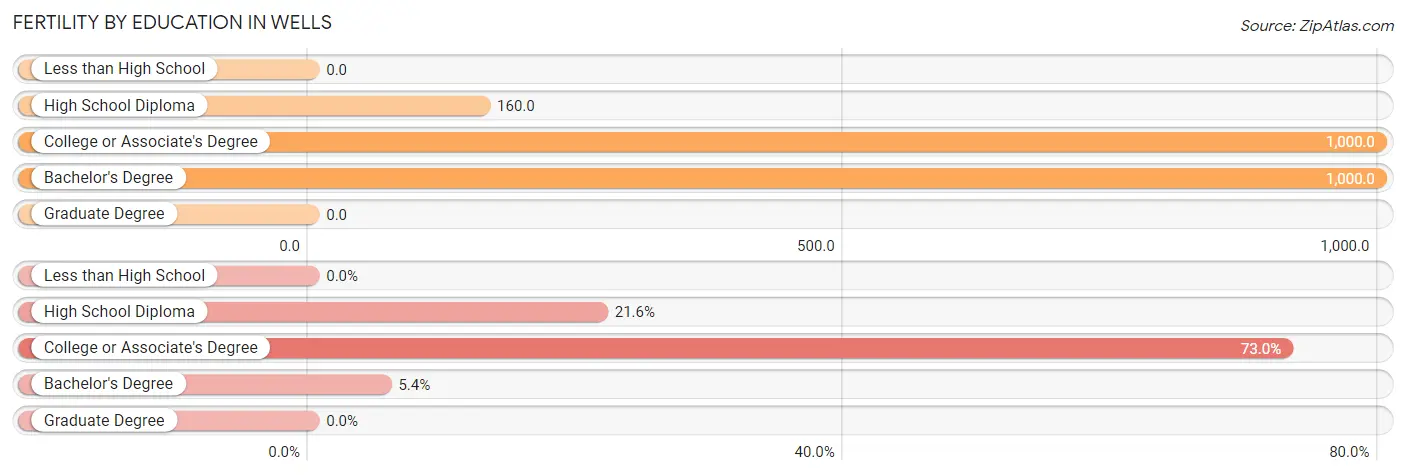
| Educational Attainment | Women with Births | Births / 1,000 Women |
| Less than High School | 0 (0.0%) | 0.0 |
| High School Diploma | 8 (21.6%) | 160.0 |
| College or Associate's Degree | 27 (73.0%) | 1,000.0 |
| Bachelor's Degree | 2 (5.4%) | 1,000.0 |
| Graduate Degree | 0 (0.0%) | 0.0 |
| Total | 37 (100.0%) | 311.0 |
Fertility by Education by Marriage Status in Wells
73.0% of women with births in Wells are unmarried. Women with the educational attainment of high school diploma are most likely to be married with 100.0% of them married at childbirth, while women with the educational attainment of college or associate's degree are least likely to be married with 100.0% of them unmarried at childbirth.
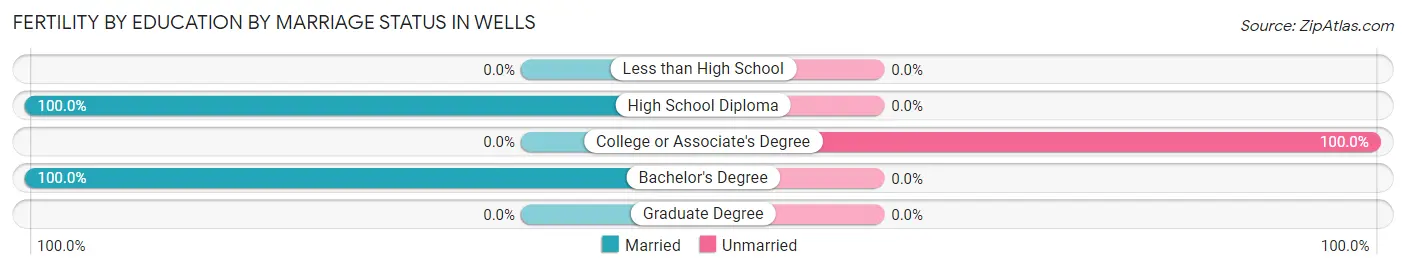
| Educational Attainment | Married | Unmarried |
| Less than High School | 0 (0.0%) | 0 (0.0%) |
| High School Diploma | 8 (100.0%) | 0 (0.0%) |
| College or Associate's Degree | 0 (0.0%) | 27 (100.0%) |
| Bachelor's Degree | 2 (100.0%) | 0 (0.0%) |
| Graduate Degree | 0 (0.0%) | 0 (0.0%) |
| Total | 10 (27.0%) | 27 (73.0%) |
Employment Characteristics in Wells
Employment by Class of Employer in Wells
Among the 183 employed individuals in Wells, local government employees (65 | 35.5%), private company employees (55 | 30.0%), and not-for-profit organizations (35 | 19.1%) make up the most common classes of employment.
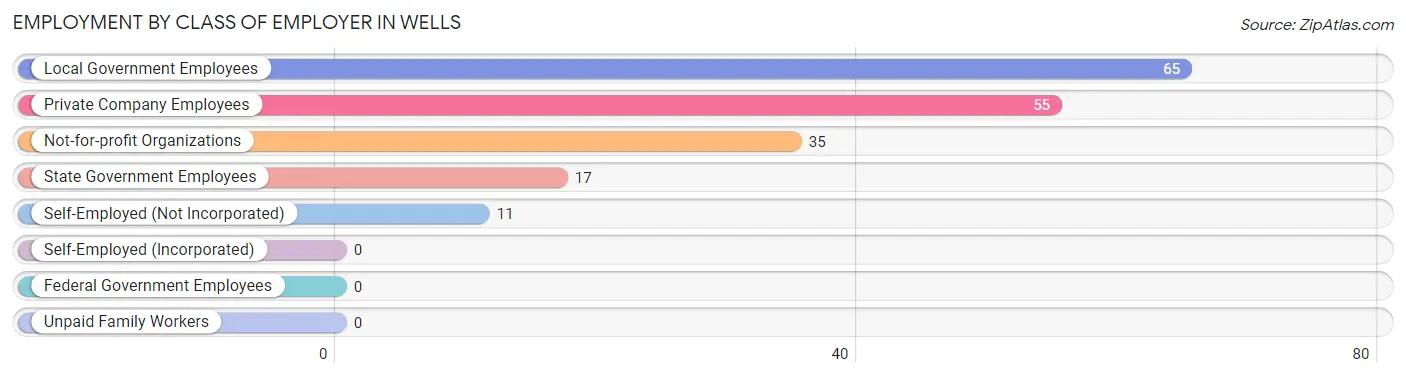
| Employer Class | # Employees | % Employees |
| Private Company Employees | 55 | 30.0% |
| Self-Employed (Incorporated) | 0 | 0.0% |
| Self-Employed (Not Incorporated) | 11 | 6.0% |
| Not-for-profit Organizations | 35 | 19.1% |
| Local Government Employees | 65 | 35.5% |
| State Government Employees | 17 | 9.3% |
| Federal Government Employees | 0 | 0.0% |
| Unpaid Family Workers | 0 | 0.0% |
| Total | 183 | 100.0% |
Employment Status by Age in Wells
According to the labor force statistics for Wells, out of the total population over 16 years of age (473), 42.3% or 200 individuals are in the labor force, with 8.5% or 17 of them unemployed. The age group with the highest labor force participation rate is 25 to 29 years, with 100.0% or 2 individuals in the labor force. Within the labor force, the 55 to 59 years age range has the highest percentage of unemployed individuals, with 23.0% or 14 of them being unemployed.
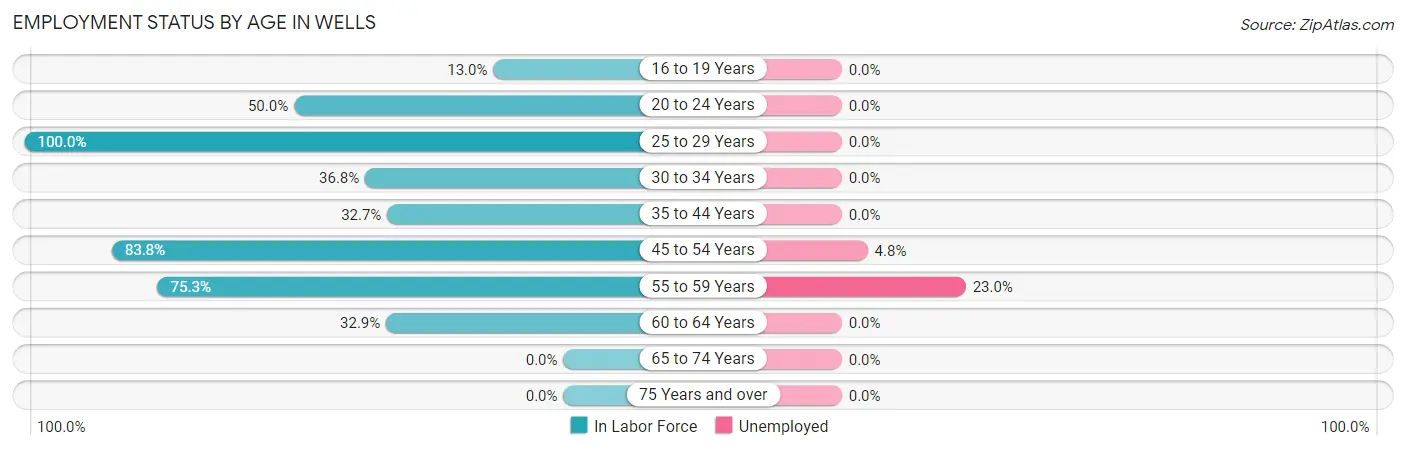
| Age Bracket | In Labor Force | Unemployed |
| 16 to 19 Years | 7 (13.0%) | 0 (0.0%) |
| 20 to 24 Years | 13 (50.0%) | 0 (0.0%) |
| 25 to 29 Years | 2 (100.0%) | 0 (0.0%) |
| 30 to 34 Years | 14 (36.8%) | 0 (0.0%) |
| 35 to 44 Years | 16 (32.7%) | 0 (0.0%) |
| 45 to 54 Years | 62 (83.8%) | 3 (4.8%) |
| 55 to 59 Years | 61 (75.3%) | 14 (23.0%) |
| 60 to 64 Years | 25 (32.9%) | 0 (0.0%) |
| 65 to 74 Years | 0 (0.0%) | 0 (0.0%) |
| 75 Years and over | 0 (0.0%) | 0 (0.0%) |
| Total | 200 (42.3%) | 17 (8.5%) |
Employment Status by Educational Attainment in Wells
According to labor force statistics for Wells, 56.3% of individuals (180) out of the total population between 25 and 64 years of age (320) are in the labor force, with 9.4% or 17 of them being unemployed. The group with the highest labor force participation rate are those with the educational attainment of high school diploma, with 88.3% or 91 individuals in the labor force. Within the labor force, individuals with less than high school education have the highest percentage of unemployment, with 33.3% or 3 of them being unemployed.
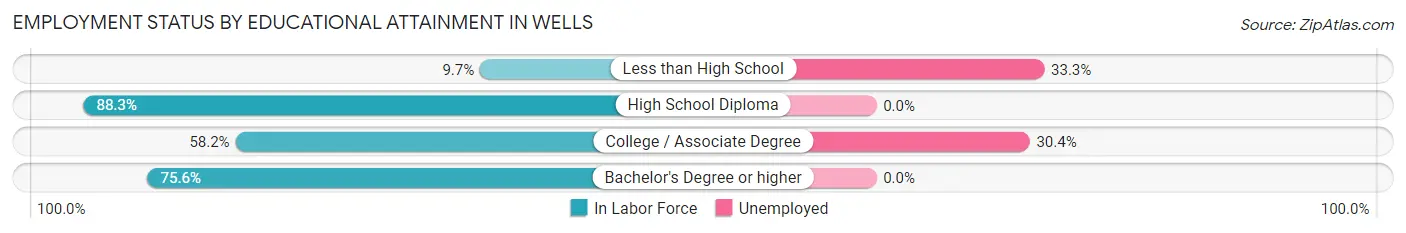
| Educational Attainment | In Labor Force | Unemployed |
| Less than High School | 9 (9.7%) | 31 (33.3%) |
| High School Diploma | 91 (88.3%) | 0 (0.0%) |
| College / Associate Degree | 46 (58.2%) | 24 (30.4%) |
| Bachelor's Degree or higher | 34 (75.6%) | 0 (0.0%) |
| Total | 180 (56.3%) | 30 (9.4%) |
Employment Occupations by Sex in Wells
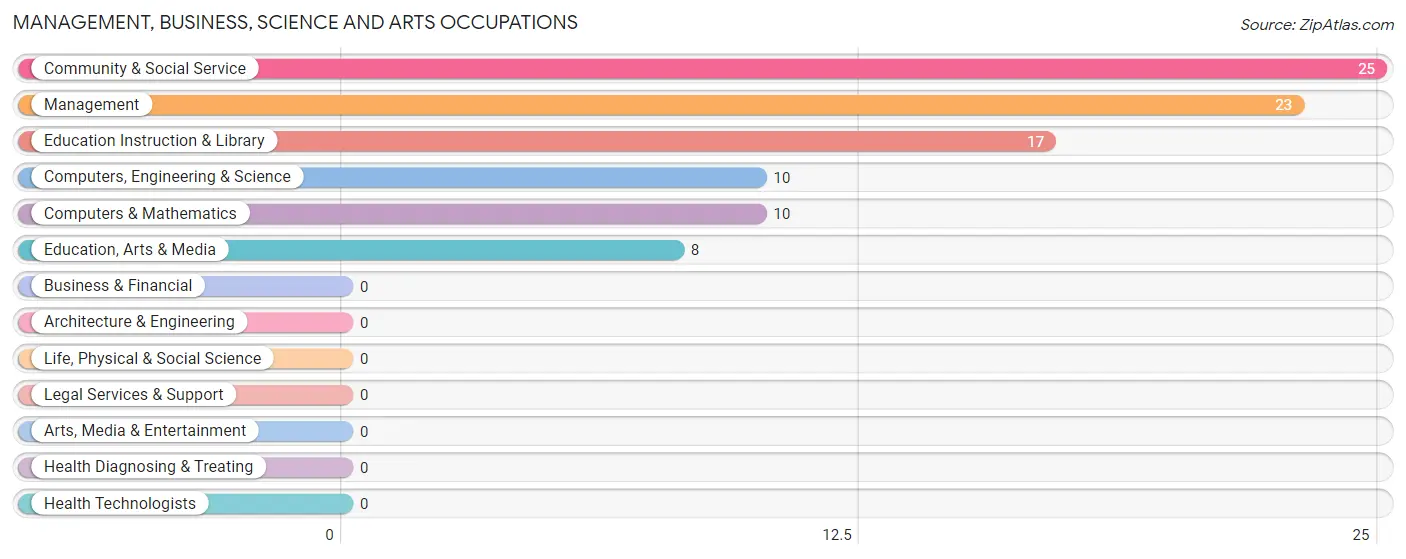
Management, Business, Science and Arts Occupations
The most common Management, Business, Science and Arts occupations in Wells are Community & Social Service (25 | 13.7%), Management (23 | 12.6%), Education Instruction & Library (17 | 9.3%), Computers, Engineering & Science (10 | 5.5%), and Computers & Mathematics (10 | 5.5%).
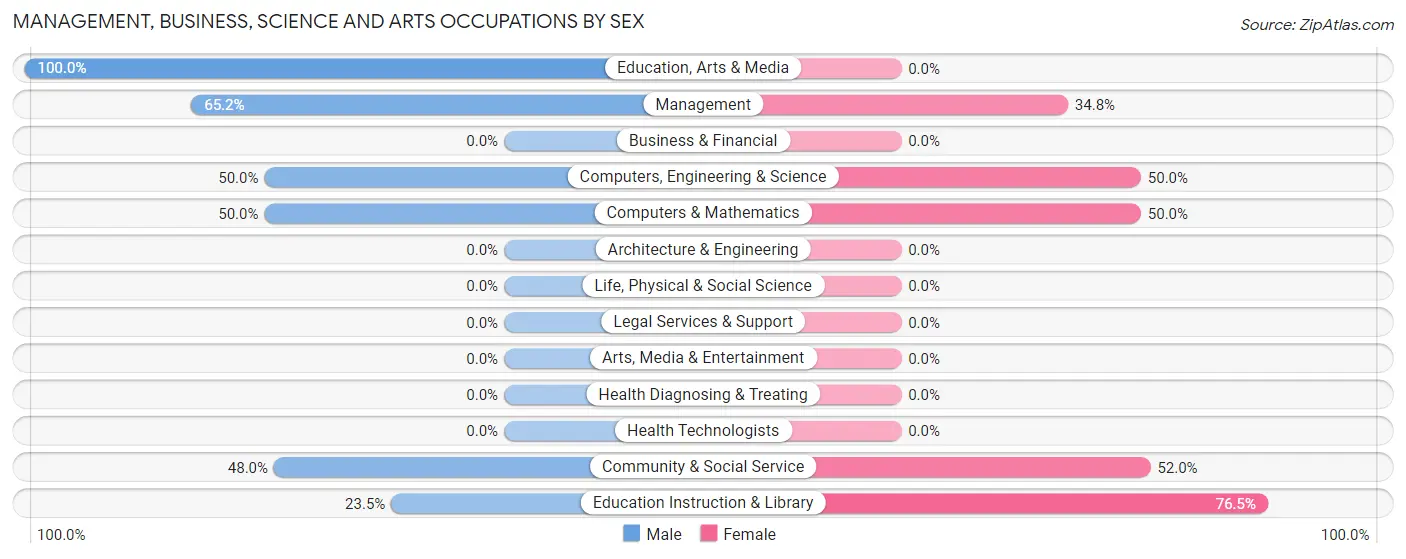
Management, Business, Science and Arts Occupations by Sex
Within the Management, Business, Science and Arts occupations in Wells, the most male-oriented occupations are Education, Arts & Media (100.0%), Management (65.2%), and Computers, Engineering & Science (50.0%), while the most female-oriented occupations are Education Instruction & Library (76.5%), Community & Social Service (52.0%), and Computers, Engineering & Science (50.0%).
| Occupation | Male | Female |
| Management | 15 (65.2%) | 8 (34.8%) |
| Business & Financial | 0 (0.0%) | 0 (0.0%) |
| Computers, Engineering & Science | 5 (50.0%) | 5 (50.0%) |
| Computers & Mathematics | 5 (50.0%) | 5 (50.0%) |
| Architecture & Engineering | 0 (0.0%) | 0 (0.0%) |
| Life, Physical & Social Science | 0 (0.0%) | 0 (0.0%) |
| Community & Social Service | 12 (48.0%) | 13 (52.0%) |
| Education, Arts & Media | 8 (100.0%) | 0 (0.0%) |
| Legal Services & Support | 0 (0.0%) | 0 (0.0%) |
| Education Instruction & Library | 4 (23.5%) | 13 (76.5%) |
| Arts, Media & Entertainment | 0 (0.0%) | 0 (0.0%) |
| Health Diagnosing & Treating | 0 (0.0%) | 0 (0.0%) |
| Health Technologists | 0 (0.0%) | 0 (0.0%) |
| Total (Category) | 32 (55.2%) | 26 (44.8%) |
| Total (Overall) | 97 (53.0%) | 86 (47.0%) |
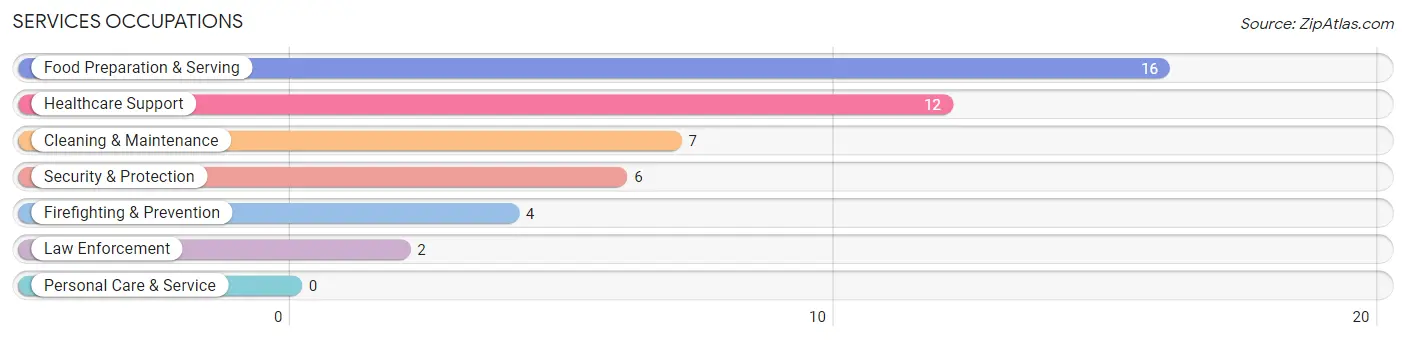
Services Occupations
The most common Services occupations in Wells are Food Preparation & Serving (16 | 8.7%), Healthcare Support (12 | 6.6%), Cleaning & Maintenance (7 | 3.8%), Security & Protection (6 | 3.3%), and Firefighting & Prevention (4 | 2.2%).
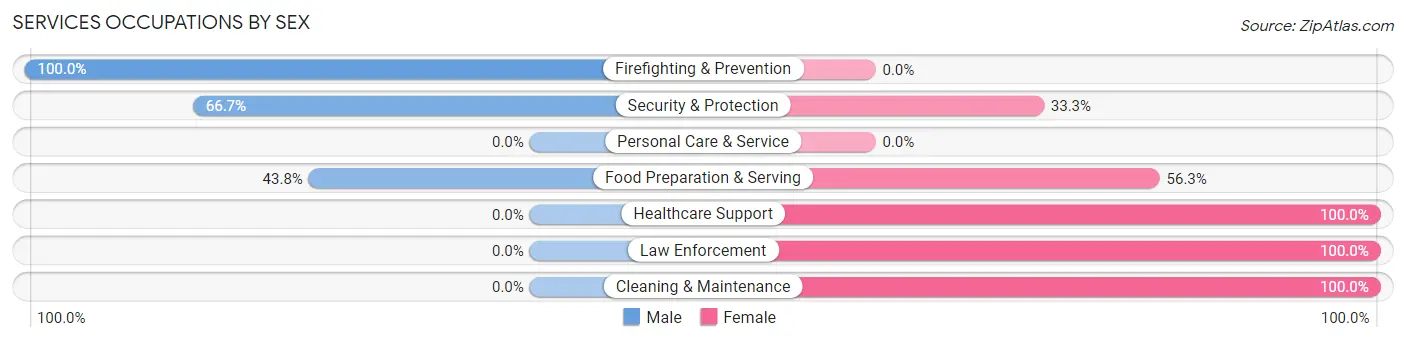
Services Occupations by Sex
Within the Services occupations in Wells, the most male-oriented occupations are Firefighting & Prevention (100.0%), Security & Protection (66.7%), and Food Preparation & Serving (43.8%), while the most female-oriented occupations are Healthcare Support (100.0%), Law Enforcement (100.0%), and Cleaning & Maintenance (100.0%).
| Occupation | Male | Female |
| Healthcare Support | 0 (0.0%) | 12 (100.0%) |
| Security & Protection | 4 (66.7%) | 2 (33.3%) |
| Firefighting & Prevention | 4 (100.0%) | 0 (0.0%) |
| Law Enforcement | 0 (0.0%) | 2 (100.0%) |
| Food Preparation & Serving | 7 (43.8%) | 9 (56.2%) |
| Cleaning & Maintenance | 0 (0.0%) | 7 (100.0%) |
| Personal Care & Service | 0 (0.0%) | 0 (0.0%) |
| Total (Category) | 11 (26.8%) | 30 (73.2%) |
| Total (Overall) | 97 (53.0%) | 86 (47.0%) |
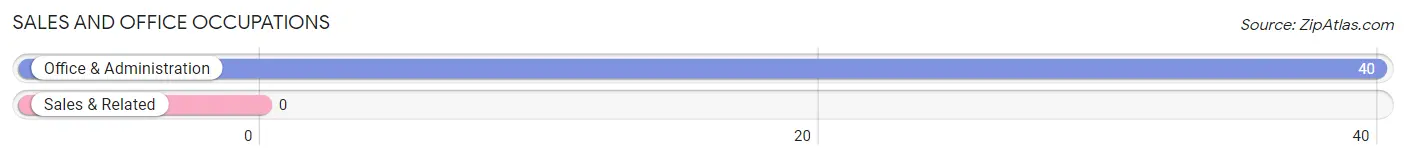
Sales and Office Occupations
The most common Sales and Office occupations in Wells are , and Office & Administration (40 | 21.9%).
Sales and Office Occupations by Sex
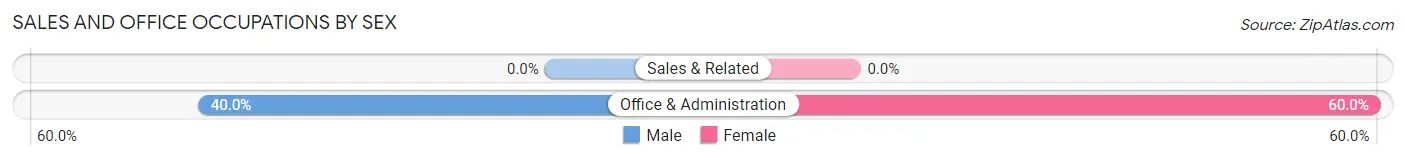
| Occupation | Male | Female |
| Sales & Related | 0 (0.0%) | 0 (0.0%) |
| Office & Administration | 16 (40.0%) | 24 (60.0%) |
| Total (Category) | 16 (40.0%) | 24 (60.0%) |
| Total (Overall) | 97 (53.0%) | 86 (47.0%) |
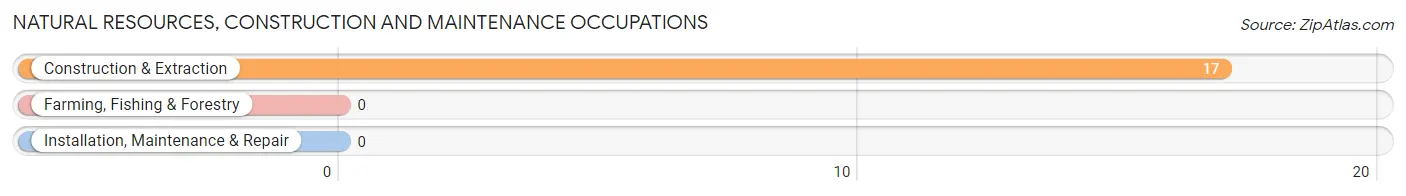
Natural Resources, Construction and Maintenance Occupations
The most common Natural Resources, Construction and Maintenance occupations in Wells are , and Construction & Extraction (17 | 9.3%).
Natural Resources, Construction and Maintenance Occupations by Sex
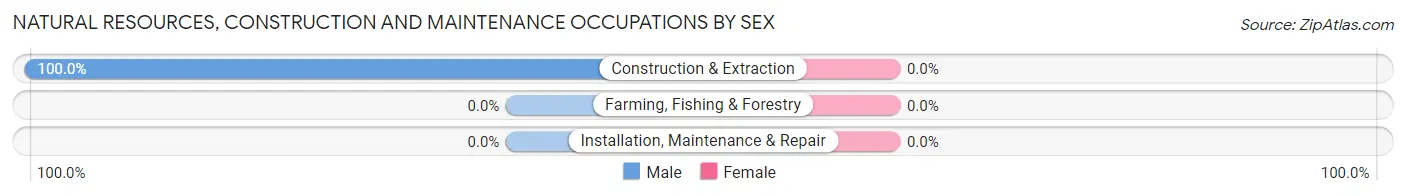
| Occupation | Male | Female |
| Farming, Fishing & Forestry | 0 (0.0%) | 0 (0.0%) |
| Construction & Extraction | 17 (100.0%) | 0 (0.0%) |
| Installation, Maintenance & Repair | 0 (0.0%) | 0 (0.0%) |
| Total (Category) | 17 (100.0%) | 0 (0.0%) |
| Total (Overall) | 97 (53.0%) | 86 (47.0%) |
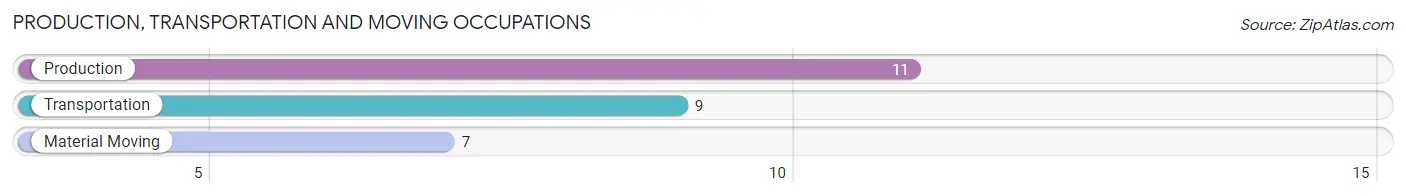
Production, Transportation and Moving Occupations
The most common Production, Transportation and Moving occupations in Wells are Production (11 | 6.0%), Transportation (9 | 4.9%), and Material Moving (7 | 3.8%).
Production, Transportation and Moving Occupations by Sex
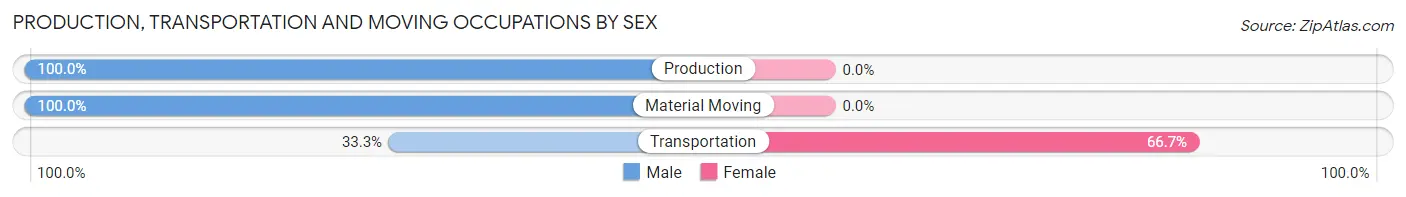
| Occupation | Male | Female |
| Production | 11 (100.0%) | 0 (0.0%) |
| Transportation | 3 (33.3%) | 6 (66.7%) |
| Material Moving | 7 (100.0%) | 0 (0.0%) |
| Total (Category) | 21 (77.8%) | 6 (22.2%) |
| Total (Overall) | 97 (53.0%) | 86 (47.0%) |
Employment Industries by Sex in Wells
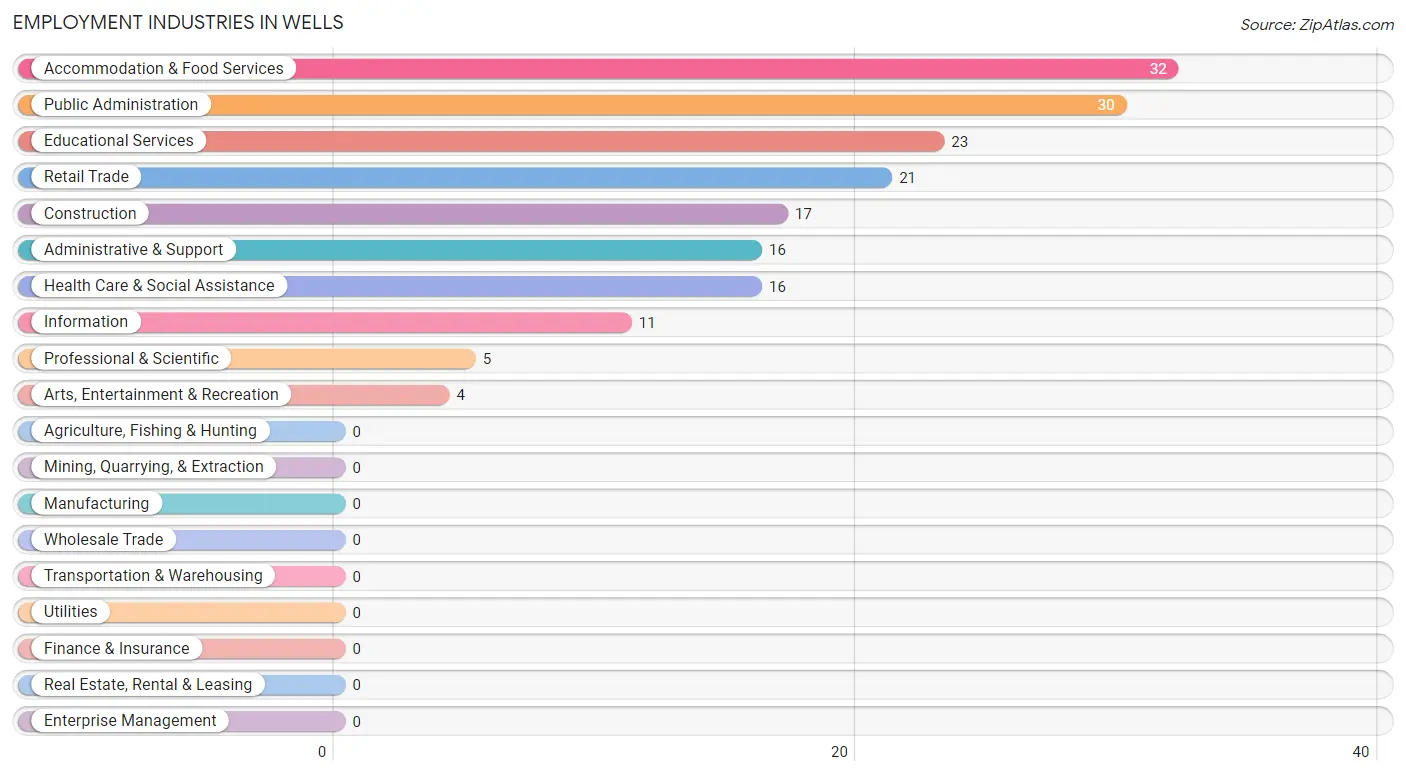
Employment Industries in Wells
The major employment industries in Wells include Accommodation & Food Services (32 | 17.5%), Public Administration (30 | 16.4%), Educational Services (23 | 12.6%), Retail Trade (21 | 11.5%), and Construction (17 | 9.3%).
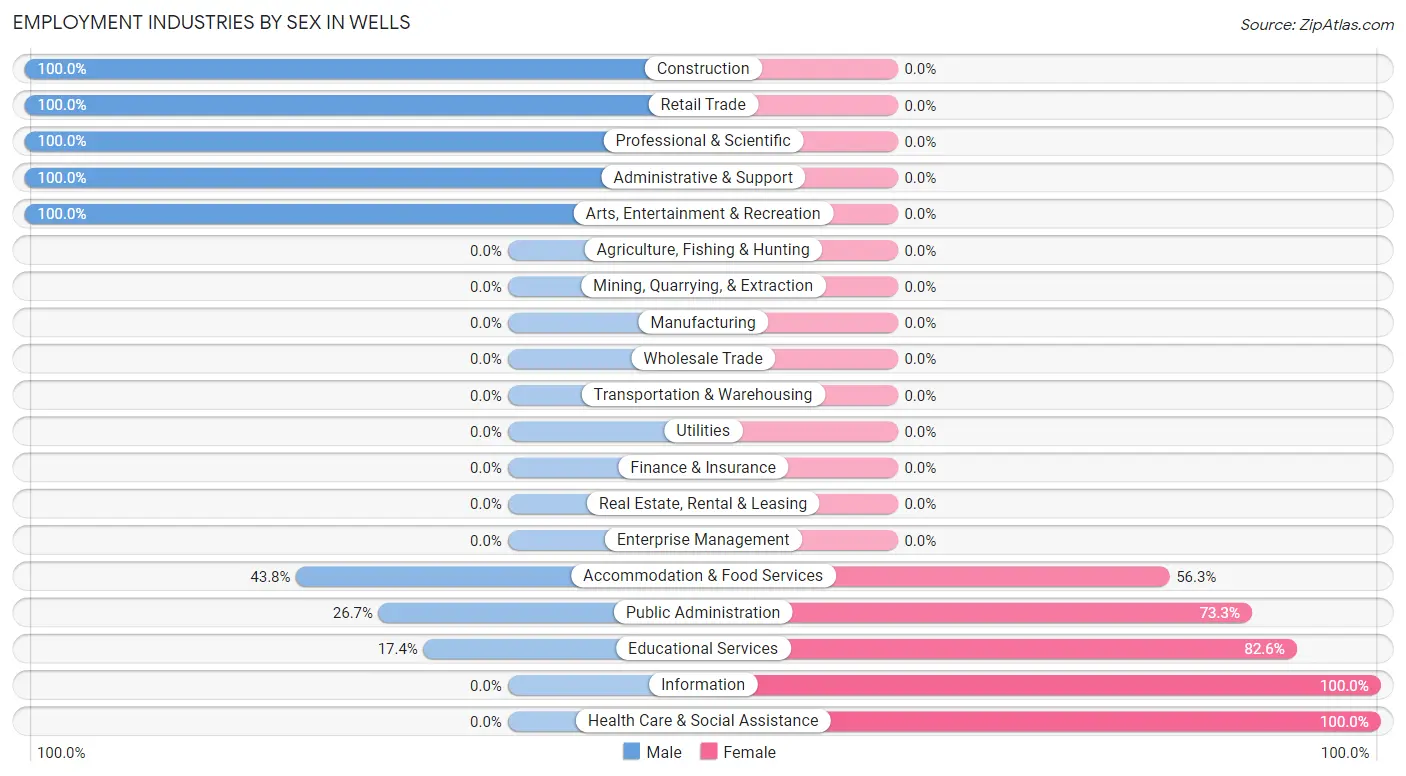
Employment Industries by Sex in Wells
The Wells industries that see more men than women are Construction (100.0%), Retail Trade (100.0%), and Professional & Scientific (100.0%), whereas the industries that tend to have a higher number of women are Information (100.0%), Health Care & Social Assistance (100.0%), and Educational Services (82.6%).
| Industry | Male | Female |
| Agriculture, Fishing & Hunting | 0 (0.0%) | 0 (0.0%) |
| Mining, Quarrying, & Extraction | 0 (0.0%) | 0 (0.0%) |
| Construction | 17 (100.0%) | 0 (0.0%) |
| Manufacturing | 0 (0.0%) | 0 (0.0%) |
| Wholesale Trade | 0 (0.0%) | 0 (0.0%) |
| Retail Trade | 21 (100.0%) | 0 (0.0%) |
| Transportation & Warehousing | 0 (0.0%) | 0 (0.0%) |
| Utilities | 0 (0.0%) | 0 (0.0%) |
| Information | 0 (0.0%) | 11 (100.0%) |
| Finance & Insurance | 0 (0.0%) | 0 (0.0%) |
| Real Estate, Rental & Leasing | 0 (0.0%) | 0 (0.0%) |
| Professional & Scientific | 5 (100.0%) | 0 (0.0%) |
| Enterprise Management | 0 (0.0%) | 0 (0.0%) |
| Administrative & Support | 16 (100.0%) | 0 (0.0%) |
| Educational Services | 4 (17.4%) | 19 (82.6%) |
| Health Care & Social Assistance | 0 (0.0%) | 16 (100.0%) |
| Arts, Entertainment & Recreation | 4 (100.0%) | 0 (0.0%) |
| Accommodation & Food Services | 14 (43.8%) | 18 (56.2%) |
| Public Administration | 8 (26.7%) | 22 (73.3%) |
| Total | 97 (53.0%) | 86 (47.0%) |
Education in Wells
School Enrollment in Wells
The most common levels of schooling among the 129 students in Wells are high school (72 | 55.8%), elementary school (21 | 16.3%), and college / undergraduate (14 | 10.8%).
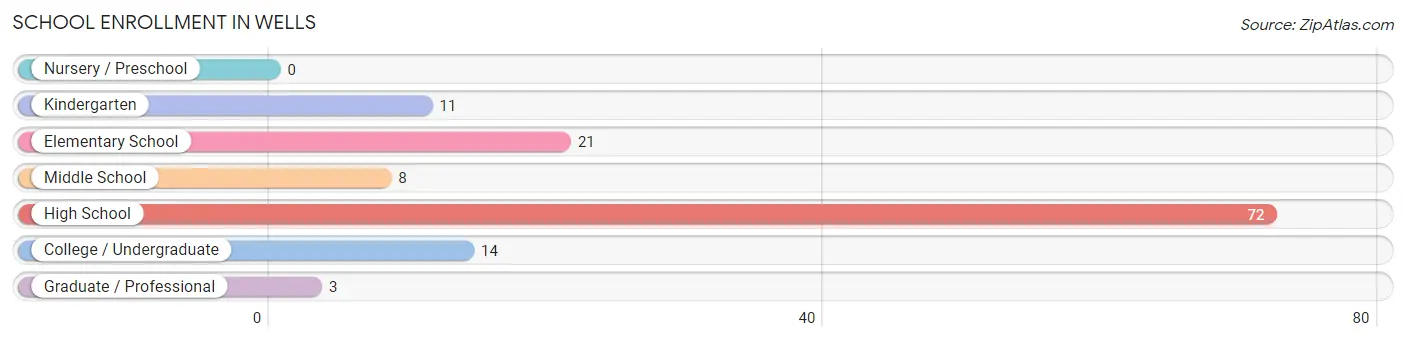
| School Level | # Students | % Students |
| Nursery / Preschool | 0 | 0.0% |
| Kindergarten | 11 | 8.5% |
| Elementary School | 21 | 16.3% |
| Middle School | 8 | 6.2% |
| High School | 72 | 55.8% |
| College / Undergraduate | 14 | 10.8% |
| Graduate / Professional | 3 | 2.3% |
| Total | 129 | 100.0% |
School Enrollment by Age by Funding Source in Wells
Out of a total of 129 students who are enrolled in schools in Wells, 3 (2.3%) attend a private institution, while the remaining 126 (97.7%) are enrolled in public schools. The age group of 35 years and over has the highest likelihood of being enrolled in private schools, with 3 (100.0% in the age bracket) enrolled. Conversely, the age group of 5 to 9 year old has the lowest likelihood of being enrolled in a private school, with 32 (100.0% in the age bracket) attending a public institution.
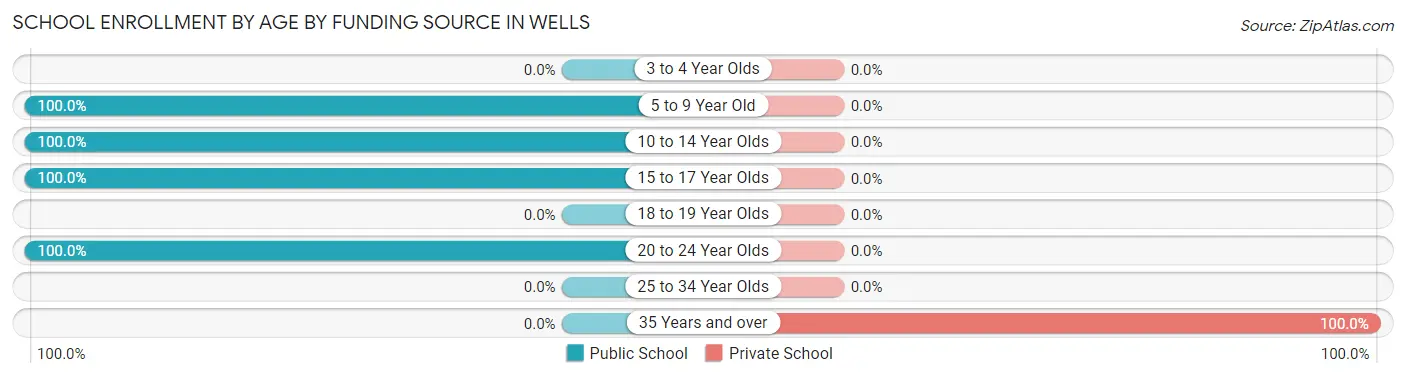
| Age Bracket | Public School | Private School |
| 3 to 4 Year Olds | 0 (0.0%) | 0 (0.0%) |
| 5 to 9 Year Old | 32 (100.0%) | 0 (0.0%) |
| 10 to 14 Year Olds | 21 (100.0%) | 0 (0.0%) |
| 15 to 17 Year Olds | 59 (100.0%) | 0 (0.0%) |
| 18 to 19 Year Olds | 0 (0.0%) | 0 (0.0%) |
| 20 to 24 Year Olds | 14 (100.0%) | 0 (0.0%) |
| 25 to 34 Year Olds | 0 (0.0%) | 0 (0.0%) |
| 35 Years and over | 0 (0.0%) | 3 (100.0%) |
| Total | 126 (97.7%) | 3 (2.3%) |
Educational Attainment by Field of Study in Wells
Science & technology (14 | 25.0%), education (13 | 23.2%), psychology (11 | 19.6%), business (8 | 14.3%), and computers & mathematics (4 | 7.1%) are the most common fields of study among 56 individuals in Wells who have obtained a bachelor's degree or higher.
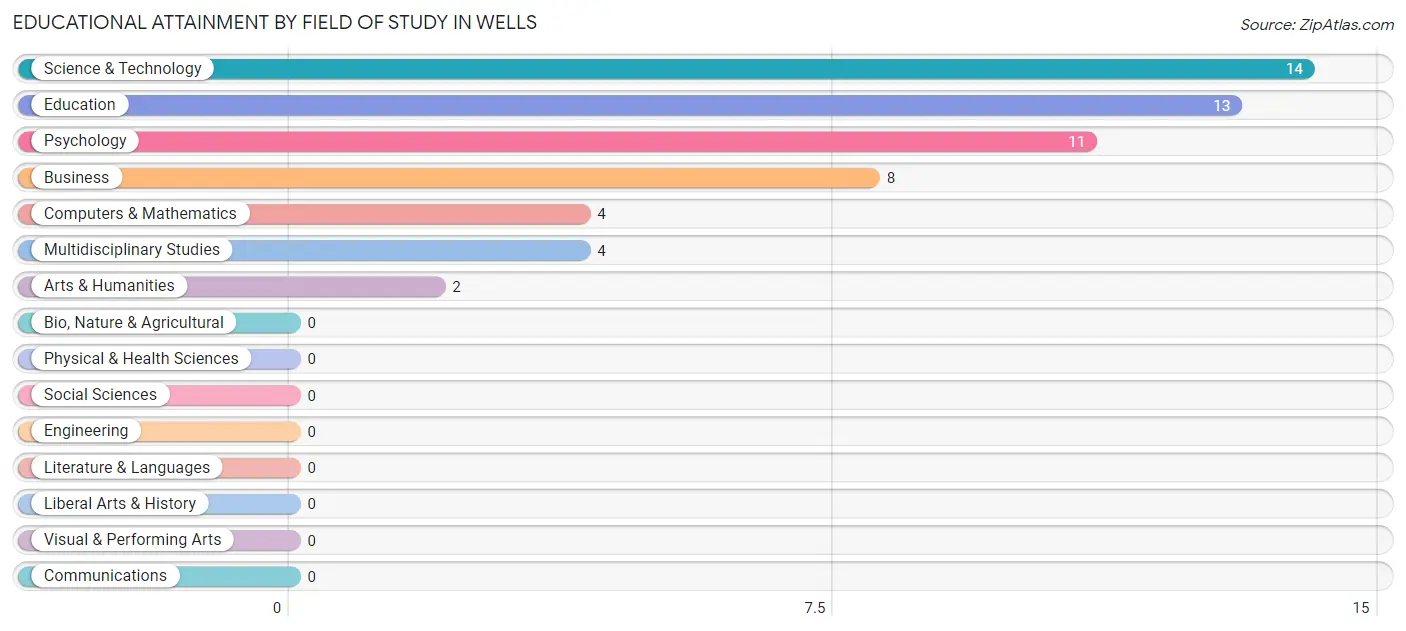
| Field of Study | # Graduates | % Graduates |
| Computers & Mathematics | 4 | 7.1% |
| Bio, Nature & Agricultural | 0 | 0.0% |
| Physical & Health Sciences | 0 | 0.0% |
| Psychology | 11 | 19.6% |
| Social Sciences | 0 | 0.0% |
| Engineering | 0 | 0.0% |
| Multidisciplinary Studies | 4 | 7.1% |
| Science & Technology | 14 | 25.0% |
| Business | 8 | 14.3% |
| Education | 13 | 23.2% |
| Literature & Languages | 0 | 0.0% |
| Liberal Arts & History | 0 | 0.0% |
| Visual & Performing Arts | 0 | 0.0% |
| Communications | 0 | 0.0% |
| Arts & Humanities | 2 | 3.6% |
| Total | 56 | 100.0% |
Transportation & Commute in Wells
Vehicle Availability by Sex in Wells
The most prevalent vehicle ownership categories in Wells are males with 2 vehicles (67, accounting for 69.1%) and females with 2 vehicles (41, making up 77.9%).
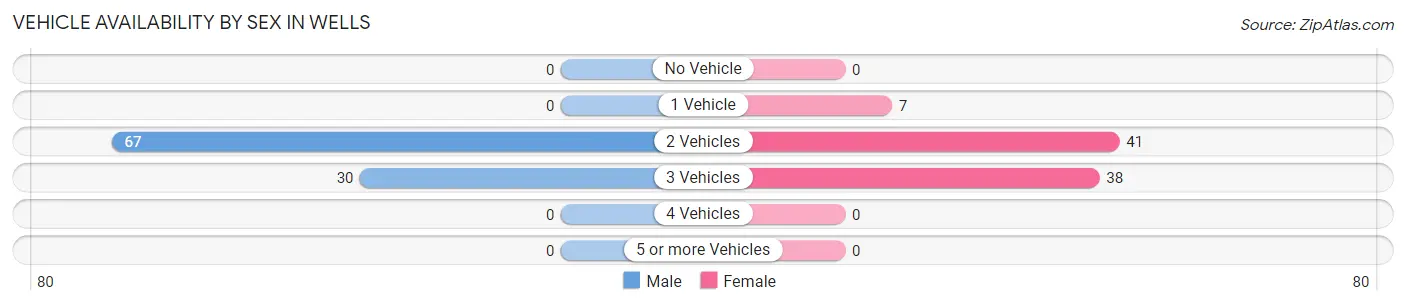
| Vehicles Available | Male | Female |
| No Vehicle | 0 (0.0%) | 0 (0.0%) |
| 1 Vehicle | 0 (0.0%) | 7 (8.1%) |
| 2 Vehicles | 67 (69.1%) | 41 (47.7%) |
| 3 Vehicles | 30 (30.9%) | 38 (44.2%) |
| 4 Vehicles | 0 (0.0%) | 0 (0.0%) |
| 5 or more Vehicles | 0 (0.0%) | 0 (0.0%) |
| Total | 97 (100.0%) | 86 (100.0%) |
Commute Time in Wells
The most frequently occuring commute durations in Wells are 20 to 24 minutes (46 commuters, 26.4%), 30 to 34 minutes (38 commuters, 21.8%), and 90 or more minutes (29 commuters, 16.7%).
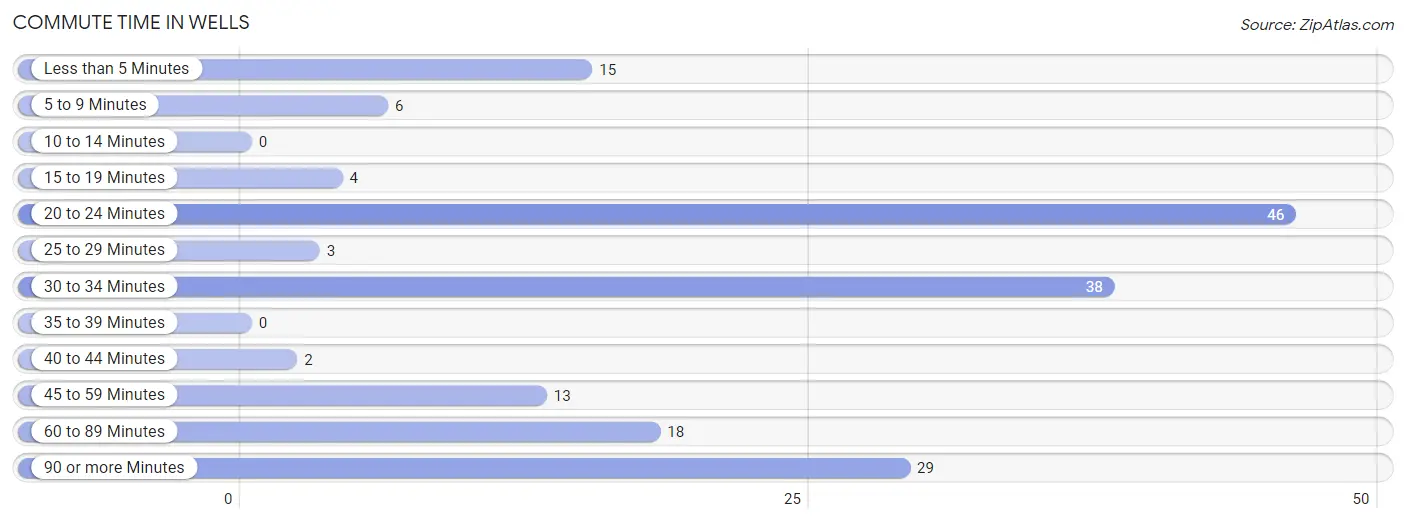
| Commute Time | # Commuters | % Commuters |
| Less than 5 Minutes | 15 | 8.6% |
| 5 to 9 Minutes | 6 | 3.5% |
| 10 to 14 Minutes | 0 | 0.0% |
| 15 to 19 Minutes | 4 | 2.3% |
| 20 to 24 Minutes | 46 | 26.4% |
| 25 to 29 Minutes | 3 | 1.7% |
| 30 to 34 Minutes | 38 | 21.8% |
| 35 to 39 Minutes | 0 | 0.0% |
| 40 to 44 Minutes | 2 | 1.1% |
| 45 to 59 Minutes | 13 | 7.5% |
| 60 to 89 Minutes | 18 | 10.3% |
| 90 or more Minutes | 29 | 16.7% |
Commute Time by Sex in Wells
The most common commute times in Wells are 20 to 24 minutes (34 commuters, 35.0%) for males and 90 or more minutes (24 commuters, 31.2%) for females.
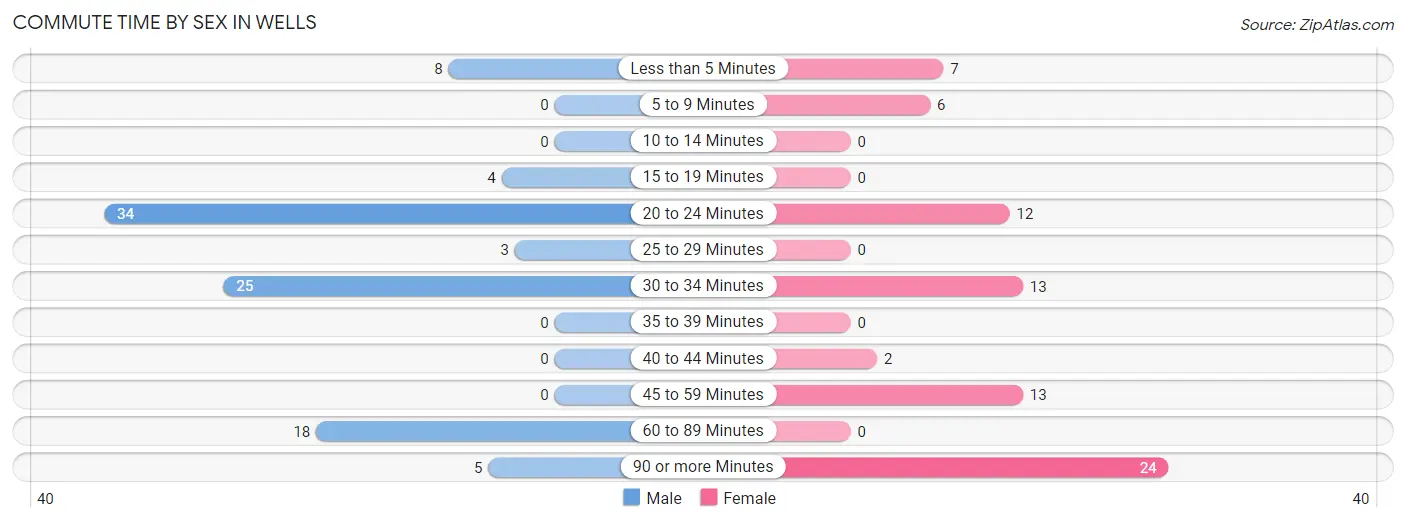
| Commute Time | Male | Female |
| Less than 5 Minutes | 8 (8.3%) | 7 (9.1%) |
| 5 to 9 Minutes | 0 (0.0%) | 6 (7.8%) |
| 10 to 14 Minutes | 0 (0.0%) | 0 (0.0%) |
| 15 to 19 Minutes | 4 (4.1%) | 0 (0.0%) |
| 20 to 24 Minutes | 34 (35.0%) | 12 (15.6%) |
| 25 to 29 Minutes | 3 (3.1%) | 0 (0.0%) |
| 30 to 34 Minutes | 25 (25.8%) | 13 (16.9%) |
| 35 to 39 Minutes | 0 (0.0%) | 0 (0.0%) |
| 40 to 44 Minutes | 0 (0.0%) | 2 (2.6%) |
| 45 to 59 Minutes | 0 (0.0%) | 13 (16.9%) |
| 60 to 89 Minutes | 18 (18.6%) | 0 (0.0%) |
| 90 or more Minutes | 5 (5.1%) | 24 (31.2%) |
Time of Departure to Work by Sex in Wells
The most frequent times of departure to work in Wells are 6:30 AM to 6:59 AM (36, 37.1%) for males and 6:30 AM to 6:59 AM (44, 57.1%) for females.
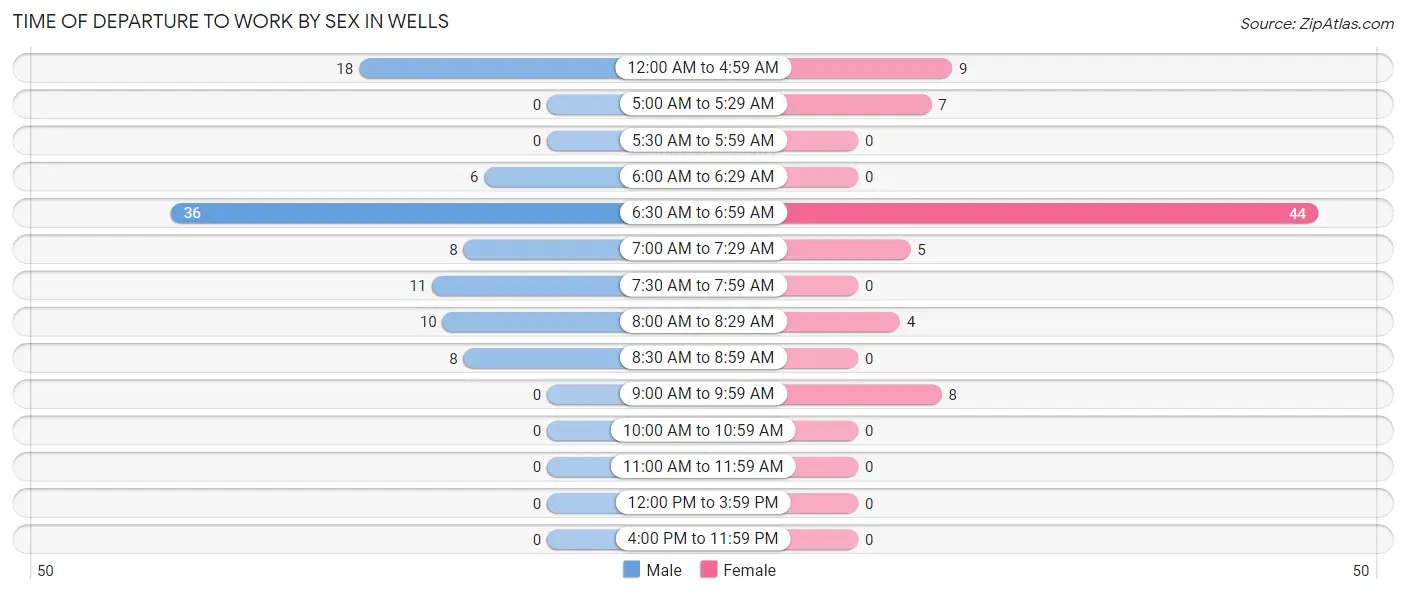
| Time of Departure | Male | Female |
| 12:00 AM to 4:59 AM | 18 (18.6%) | 9 (11.7%) |
| 5:00 AM to 5:29 AM | 0 (0.0%) | 7 (9.1%) |
| 5:30 AM to 5:59 AM | 0 (0.0%) | 0 (0.0%) |
| 6:00 AM to 6:29 AM | 6 (6.2%) | 0 (0.0%) |
| 6:30 AM to 6:59 AM | 36 (37.1%) | 44 (57.1%) |
| 7:00 AM to 7:29 AM | 8 (8.3%) | 5 (6.5%) |
| 7:30 AM to 7:59 AM | 11 (11.3%) | 0 (0.0%) |
| 8:00 AM to 8:29 AM | 10 (10.3%) | 4 (5.2%) |
| 8:30 AM to 8:59 AM | 8 (8.3%) | 0 (0.0%) |
| 9:00 AM to 9:59 AM | 0 (0.0%) | 8 (10.4%) |
| 10:00 AM to 10:59 AM | 0 (0.0%) | 0 (0.0%) |
| 11:00 AM to 11:59 AM | 0 (0.0%) | 0 (0.0%) |
| 12:00 PM to 3:59 PM | 0 (0.0%) | 0 (0.0%) |
| 4:00 PM to 11:59 PM | 0 (0.0%) | 0 (0.0%) |
| Total | 97 (100.0%) | 77 (100.0%) |
Housing Occupancy in Wells
Occupancy by Ownership in Wells
Of the total 165 dwellings in Wells, owner-occupied units account for 141 (85.5%), while renter-occupied units make up 24 (14.5%).
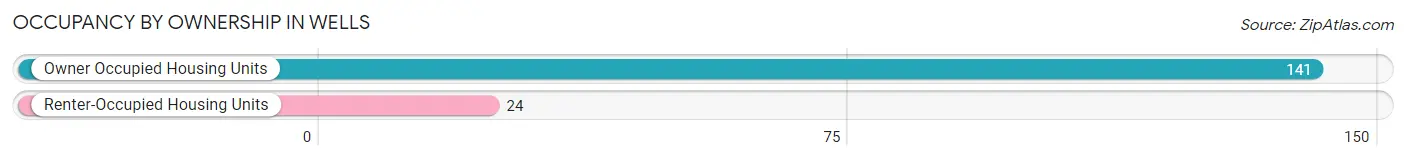
| Occupancy | # Housing Units | % Housing Units |
| Owner Occupied Housing Units | 141 | 85.5% |
| Renter-Occupied Housing Units | 24 | 14.5% |
| Total Occupied Housing Units | 165 | 100.0% |
Occupancy by Household Size in Wells
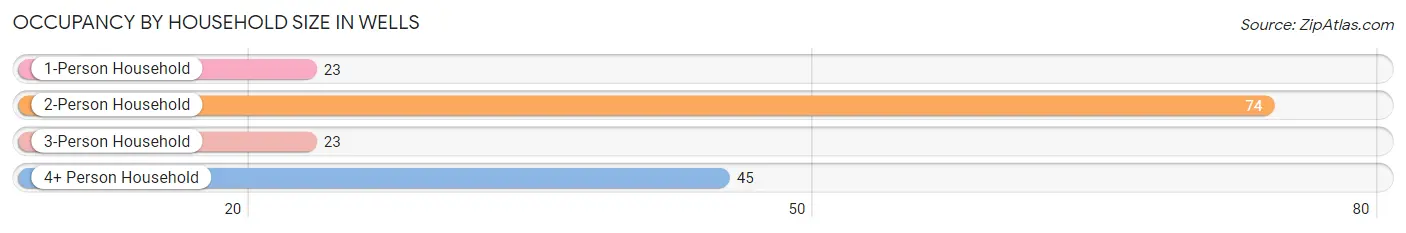
| Household Size | # Housing Units | % Housing Units |
| 1-Person Household | 23 | 13.9% |
| 2-Person Household | 74 | 44.9% |
| 3-Person Household | 23 | 13.9% |
| 4+ Person Household | 45 | 27.3% |
| Total Housing Units | 165 | 100.0% |
Occupancy by Ownership by Household Size in Wells
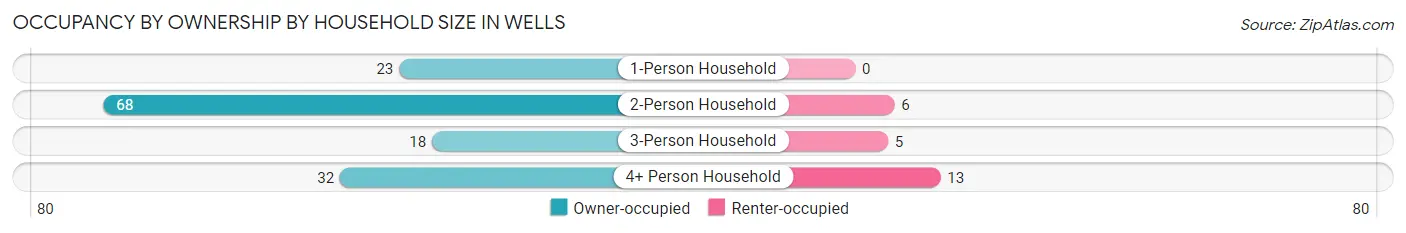
| Household Size | Owner-occupied | Renter-occupied |
| 1-Person Household | 23 (100.0%) | 0 (0.0%) |
| 2-Person Household | 68 (91.9%) | 6 (8.1%) |
| 3-Person Household | 18 (78.3%) | 5 (21.7%) |
| 4+ Person Household | 32 (71.1%) | 13 (28.9%) |
| Total Housing Units | 141 (85.5%) | 24 (14.5%) |
Occupancy by Educational Attainment in Wells
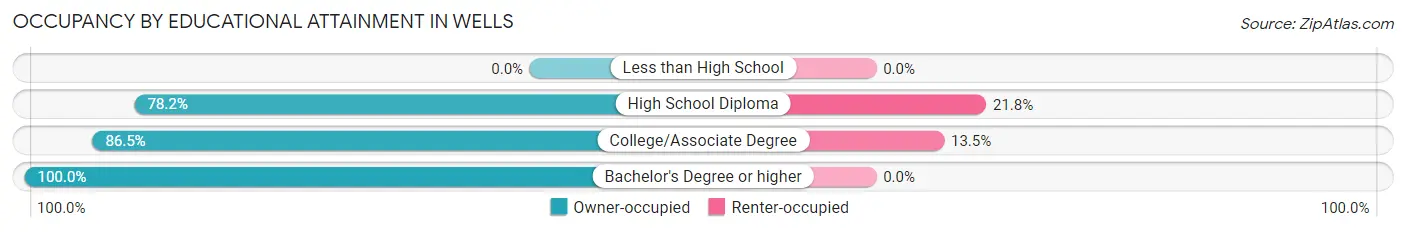
| Household Size | Owner-occupied | Renter-occupied |
| Less than High School | 0 (0.0%) | 0 (0.0%) |
| High School Diploma | 61 (78.2%) | 17 (21.8%) |
| College/Associate Degree | 45 (86.5%) | 7 (13.5%) |
| Bachelor's Degree or higher | 35 (100.0%) | 0 (0.0%) |
Occupancy by Age of Householder in Wells
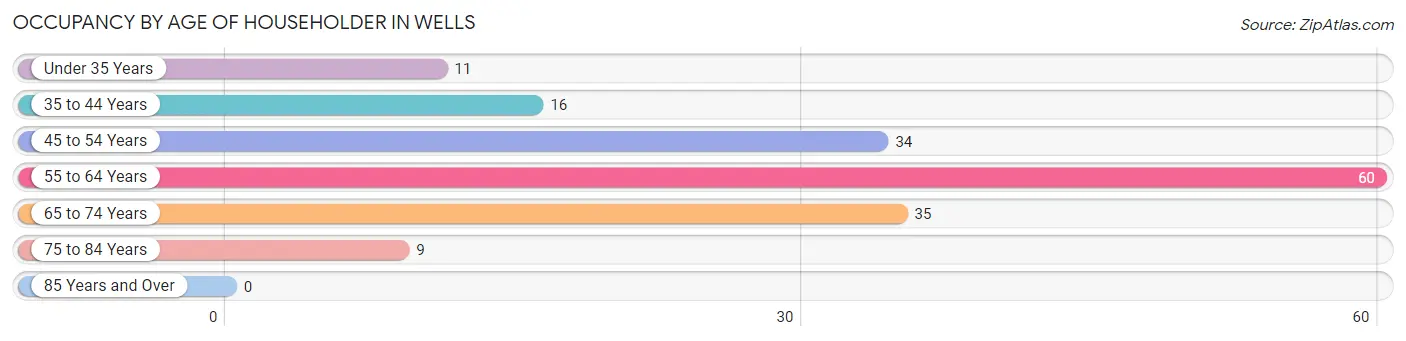
| Age Bracket | # Households | % Households |
| Under 35 Years | 11 | 6.7% |
| 35 to 44 Years | 16 | 9.7% |
| 45 to 54 Years | 34 | 20.6% |
| 55 to 64 Years | 60 | 36.4% |
| 65 to 74 Years | 35 | 21.2% |
| 75 to 84 Years | 9 | 5.4% |
| 85 Years and Over | 0 | 0.0% |
| Total | 165 | 100.0% |
Housing Finances in Wells
Median Income by Occupancy in Wells
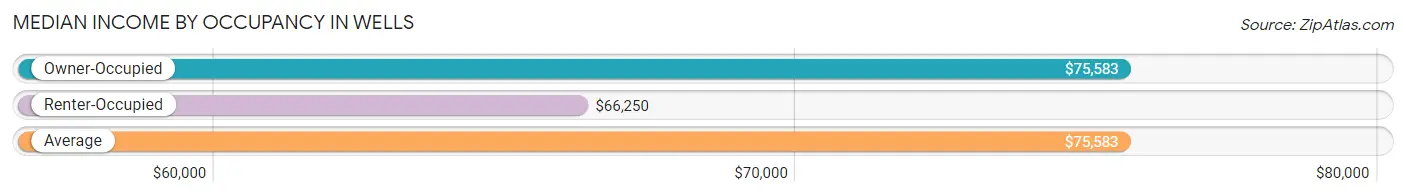
| Occupancy Type | # Households | Median Income |
| Owner-Occupied | 141 (85.5%) | $75,583 |
| Renter-Occupied | 24 (14.5%) | $66,250 |
| Average | 165 (100.0%) | $75,583 |
Occupancy by Householder Income Bracket in Wells
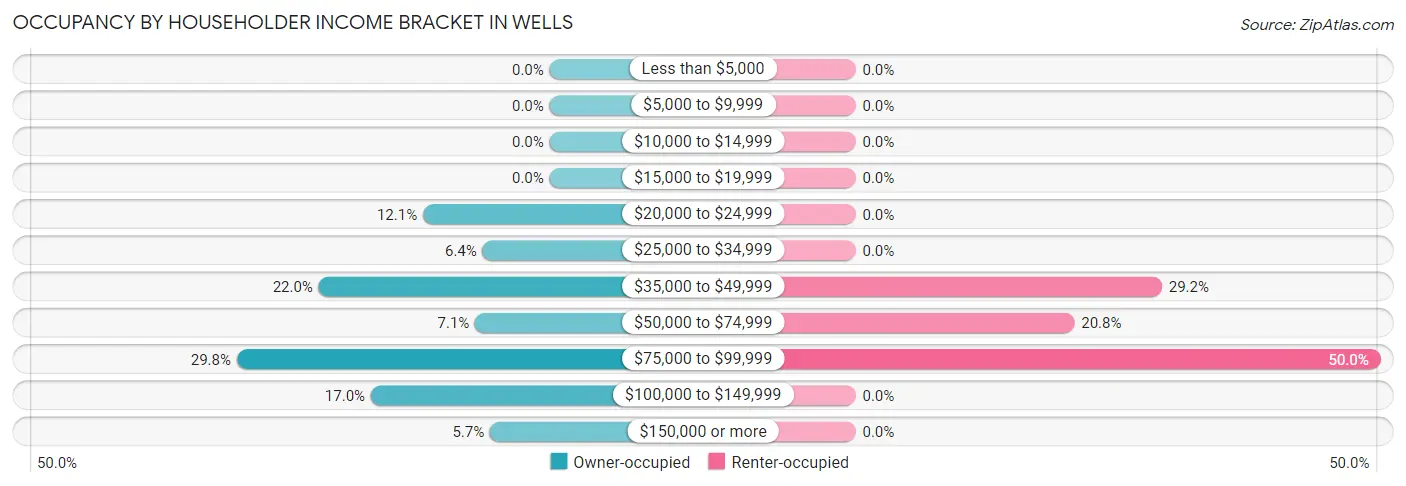
| Income Bracket | Owner-occupied | Renter-occupied |
| Less than $5,000 | 0 (0.0%) | 0 (0.0%) |
| $5,000 to $9,999 | 0 (0.0%) | 0 (0.0%) |
| $10,000 to $14,999 | 0 (0.0%) | 0 (0.0%) |
| $15,000 to $19,999 | 0 (0.0%) | 0 (0.0%) |
| $20,000 to $24,999 | 17 (12.1%) | 0 (0.0%) |
| $25,000 to $34,999 | 9 (6.4%) | 0 (0.0%) |
| $35,000 to $49,999 | 31 (22.0%) | 7 (29.2%) |
| $50,000 to $74,999 | 10 (7.1%) | 5 (20.8%) |
| $75,000 to $99,999 | 42 (29.8%) | 12 (50.0%) |
| $100,000 to $149,999 | 24 (17.0%) | 0 (0.0%) |
| $150,000 or more | 8 (5.7%) | 0 (0.0%) |
| Total | 141 (100.0%) | 24 (100.0%) |
Monthly Housing Cost Tiers in Wells
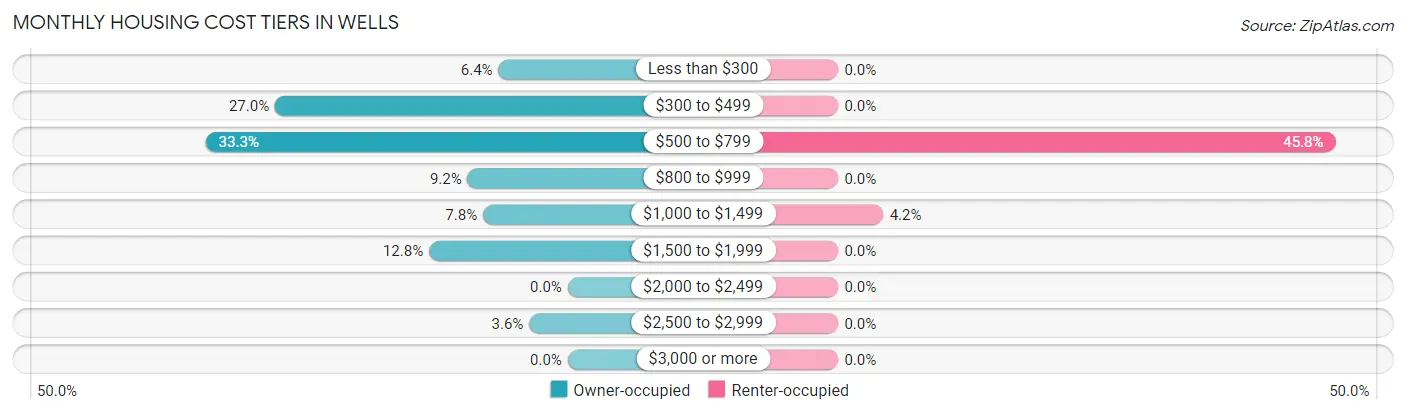
| Monthly Cost | Owner-occupied | Renter-occupied |
| Less than $300 | 9 (6.4%) | 0 (0.0%) |
| $300 to $499 | 38 (27.0%) | 0 (0.0%) |
| $500 to $799 | 47 (33.3%) | 11 (45.8%) |
| $800 to $999 | 13 (9.2%) | 0 (0.0%) |
| $1,000 to $1,499 | 11 (7.8%) | 1 (4.2%) |
| $1,500 to $1,999 | 18 (12.8%) | 0 (0.0%) |
| $2,000 to $2,499 | 0 (0.0%) | 0 (0.0%) |
| $2,500 to $2,999 | 5 (3.5%) | 0 (0.0%) |
| $3,000 or more | 0 (0.0%) | 0 (0.0%) |
| Total | 141 (100.0%) | 24 (100.0%) |
Physical Housing Characteristics in Wells
Housing Structures in Wells
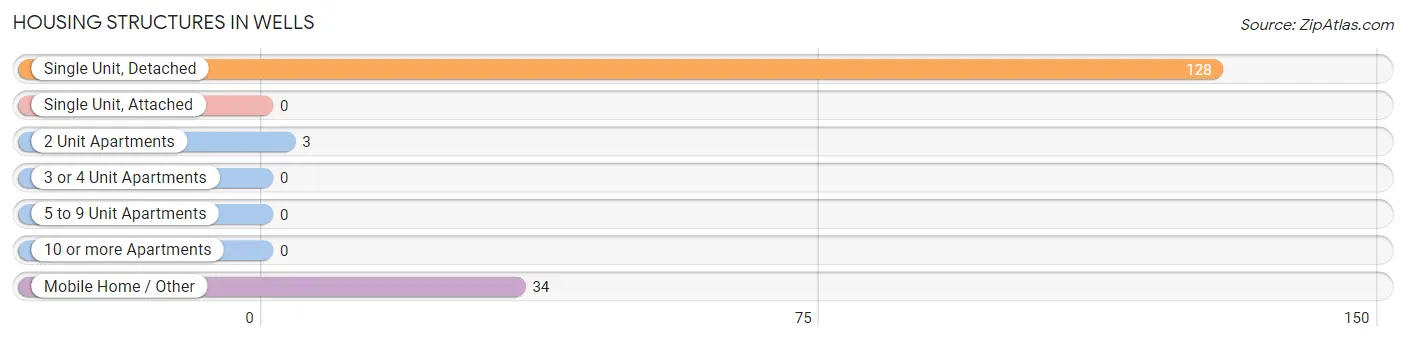
| Structure Type | # Housing Units | % Housing Units |
| Single Unit, Detached | 128 | 77.6% |
| Single Unit, Attached | 0 | 0.0% |
| 2 Unit Apartments | 3 | 1.8% |
| 3 or 4 Unit Apartments | 0 | 0.0% |
| 5 to 9 Unit Apartments | 0 | 0.0% |
| 10 or more Apartments | 0 | 0.0% |
| Mobile Home / Other | 34 | 20.6% |
| Total | 165 | 100.0% |
Housing Structures by Occupancy in Wells
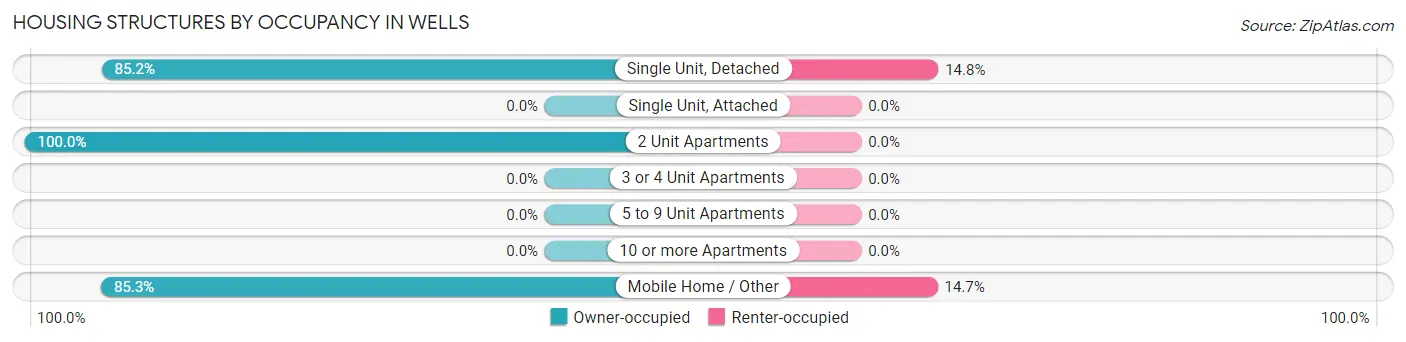
| Structure Type | Owner-occupied | Renter-occupied |
| Single Unit, Detached | 109 (85.2%) | 19 (14.8%) |
| Single Unit, Attached | 0 (0.0%) | 0 (0.0%) |
| 2 Unit Apartments | 3 (100.0%) | 0 (0.0%) |
| 3 or 4 Unit Apartments | 0 (0.0%) | 0 (0.0%) |
| 5 to 9 Unit Apartments | 0 (0.0%) | 0 (0.0%) |
| 10 or more Apartments | 0 (0.0%) | 0 (0.0%) |
| Mobile Home / Other | 29 (85.3%) | 5 (14.7%) |
| Total | 141 (85.5%) | 24 (14.5%) |
Housing Structures by Number of Rooms in Wells
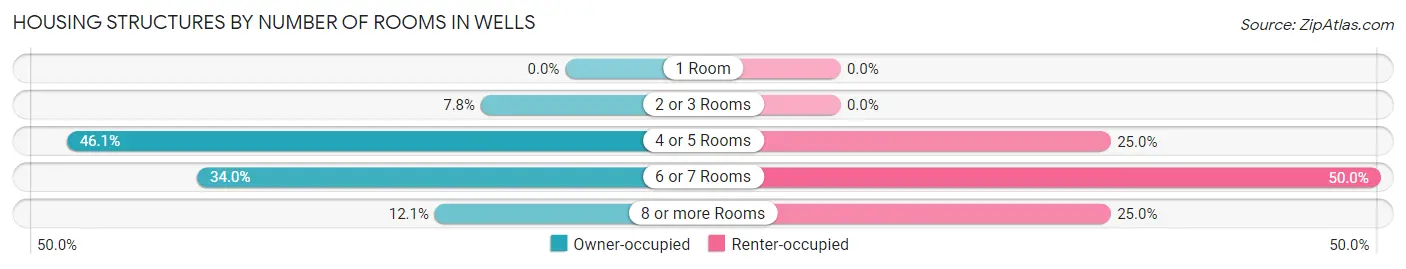
| Number of Rooms | Owner-occupied | Renter-occupied |
| 1 Room | 0 (0.0%) | 0 (0.0%) |
| 2 or 3 Rooms | 11 (7.8%) | 0 (0.0%) |
| 4 or 5 Rooms | 65 (46.1%) | 6 (25.0%) |
| 6 or 7 Rooms | 48 (34.0%) | 12 (50.0%) |
| 8 or more Rooms | 17 (12.1%) | 6 (25.0%) |
| Total | 141 (100.0%) | 24 (100.0%) |
Housing Structure by Heating Type in Wells
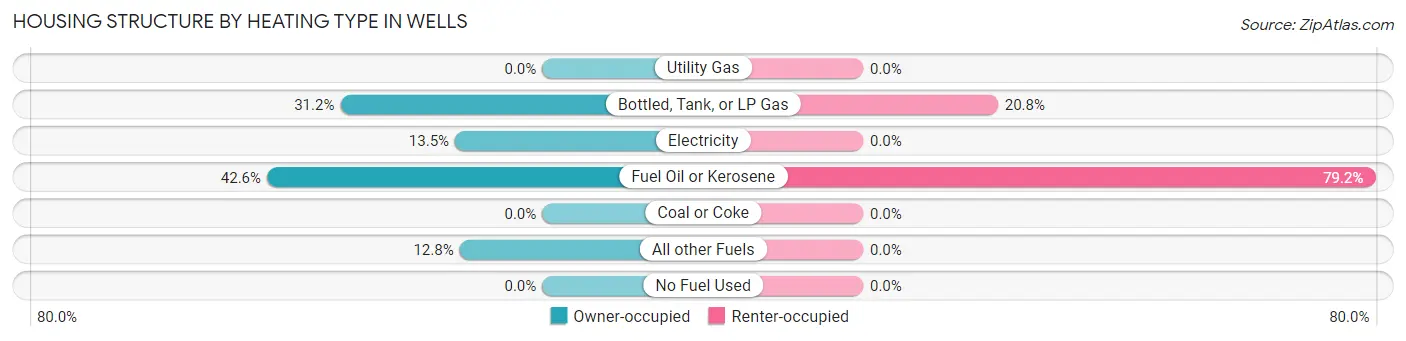
| Heating Type | Owner-occupied | Renter-occupied |
| Utility Gas | 0 (0.0%) | 0 (0.0%) |
| Bottled, Tank, or LP Gas | 44 (31.2%) | 5 (20.8%) |
| Electricity | 19 (13.5%) | 0 (0.0%) |
| Fuel Oil or Kerosene | 60 (42.5%) | 19 (79.2%) |
| Coal or Coke | 0 (0.0%) | 0 (0.0%) |
| All other Fuels | 18 (12.8%) | 0 (0.0%) |
| No Fuel Used | 0 (0.0%) | 0 (0.0%) |
| Total | 141 (100.0%) | 24 (100.0%) |
Household Vehicle Usage in Wells
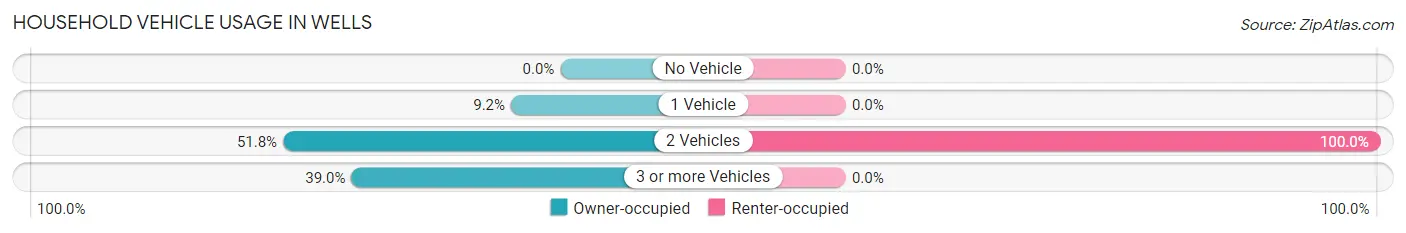
| Vehicles per Household | Owner-occupied | Renter-occupied |
| No Vehicle | 0 (0.0%) | 0 (0.0%) |
| 1 Vehicle | 13 (9.2%) | 0 (0.0%) |
| 2 Vehicles | 73 (51.8%) | 24 (100.0%) |
| 3 or more Vehicles | 55 (39.0%) | 0 (0.0%) |
| Total | 141 (100.0%) | 24 (100.0%) |
Real Estate & Mortgages in Wells
Real Estate and Mortgage Overview in Wells
| Characteristic | Without Mortgage | With Mortgage |
| Housing Units | 80 | 61 |
| Median Property Value | $265,400 | $176,600 |
| Median Household Income | $53,750 | $5 |
| Monthly Housing Costs | $534 | $0 |
| Real Estate Taxes | $3,000 | $0 |
Property Value by Mortgage Status in Wells
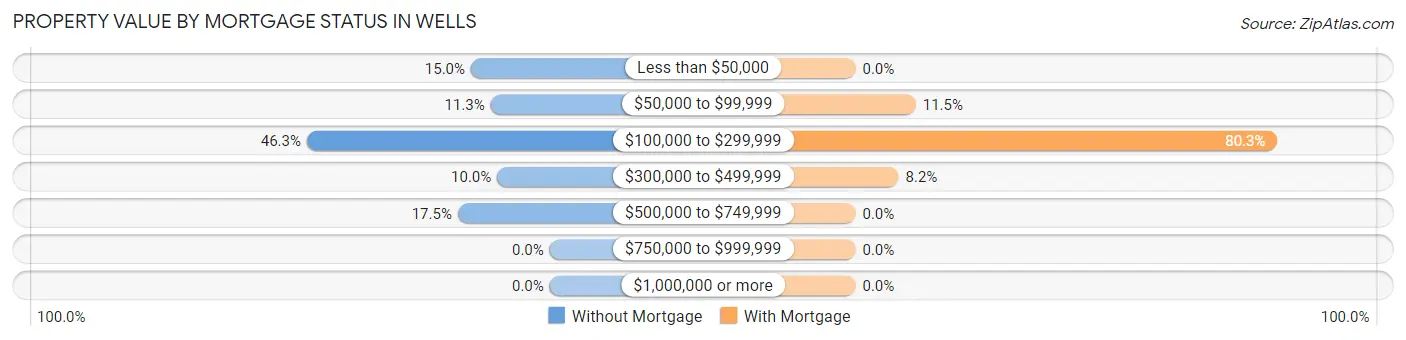
| Property Value | Without Mortgage | With Mortgage |
| Less than $50,000 | 12 (15.0%) | 0 (0.0%) |
| $50,000 to $99,999 | 9 (11.3%) | 7 (11.5%) |
| $100,000 to $299,999 | 37 (46.3%) | 49 (80.3%) |
| $300,000 to $499,999 | 8 (10.0%) | 5 (8.2%) |
| $500,000 to $749,999 | 14 (17.5%) | 0 (0.0%) |
| $750,000 to $999,999 | 0 (0.0%) | 0 (0.0%) |
| $1,000,000 or more | 0 (0.0%) | 0 (0.0%) |
| Total | 80 (100.0%) | 61 (100.0%) |
Household Income by Mortgage Status in Wells
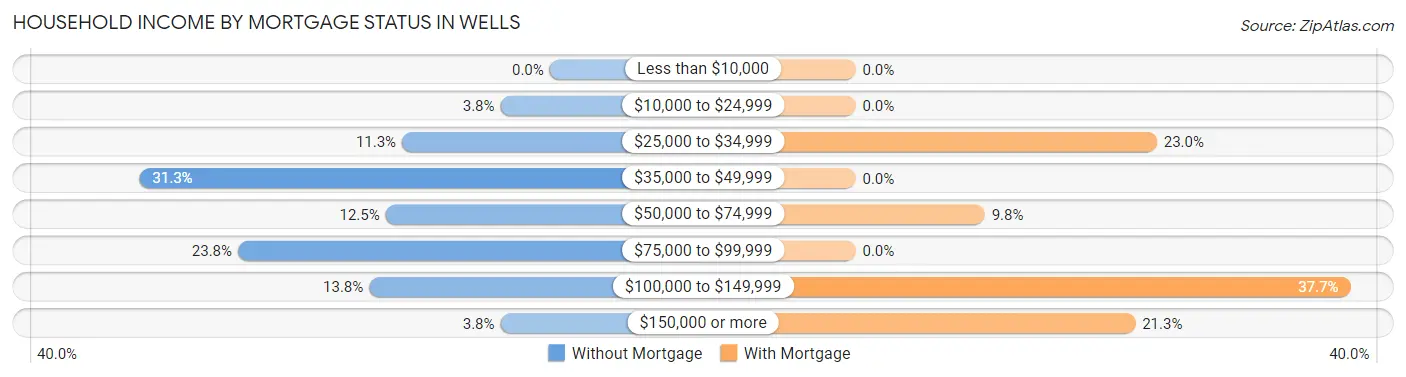
| Household Income | Without Mortgage | With Mortgage |
| Less than $10,000 | 0 (0.0%) | 0 (0.0%) |
| $10,000 to $24,999 | 3 (3.7%) | 0 (0.0%) |
| $25,000 to $34,999 | 9 (11.3%) | 14 (23.0%) |
| $35,000 to $49,999 | 25 (31.2%) | 0 (0.0%) |
| $50,000 to $74,999 | 10 (12.5%) | 6 (9.8%) |
| $75,000 to $99,999 | 19 (23.7%) | 0 (0.0%) |
| $100,000 to $149,999 | 11 (13.8%) | 23 (37.7%) |
| $150,000 or more | 3 (3.7%) | 13 (21.3%) |
| Total | 80 (100.0%) | 61 (100.0%) |
Property Value to Household Income Ratio in Wells
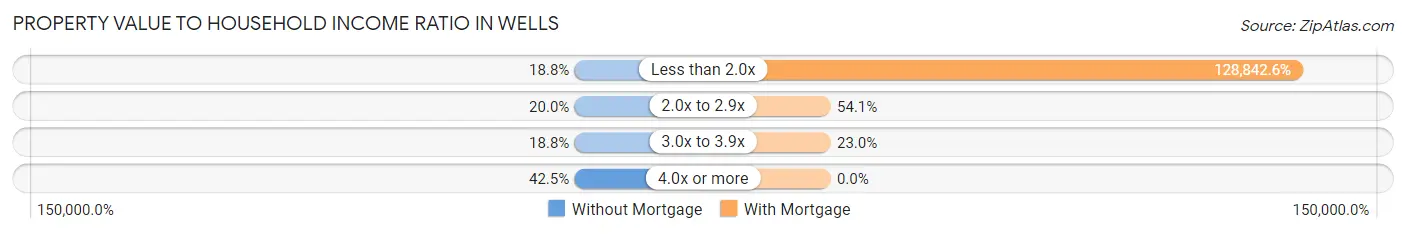
| Value-to-Income Ratio | Without Mortgage | With Mortgage |
| Less than 2.0x | 15 (18.8%) | 78,594 (128,842.6%) |
| 2.0x to 2.9x | 16 (20.0%) | 33 (54.1%) |
| 3.0x to 3.9x | 15 (18.8%) | 14 (23.0%) |
| 4.0x or more | 34 (42.5%) | 0 (0.0%) |
| Total | 80 (100.0%) | 61 (100.0%) |
Real Estate Taxes by Mortgage Status in Wells
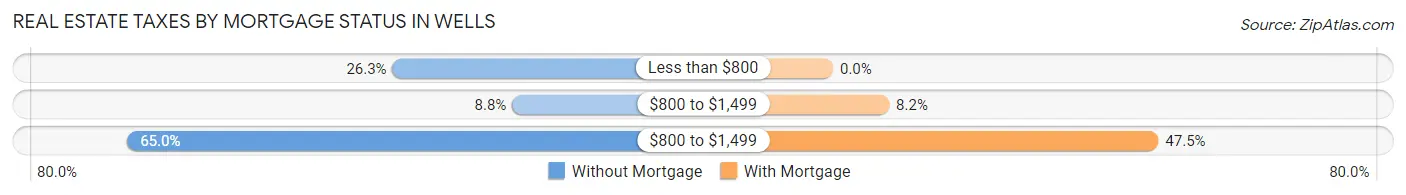
| Property Taxes | Without Mortgage | With Mortgage |
| Less than $800 | 21 (26.3%) | 0 (0.0%) |
| $800 to $1,499 | 7 (8.7%) | 5 (8.2%) |
| $800 to $1,499 | 52 (65.0%) | 29 (47.5%) |
| Total | 80 (100.0%) | 61 (100.0%) |
Health & Disability in Wells
Health Insurance Coverage by Age in Wells
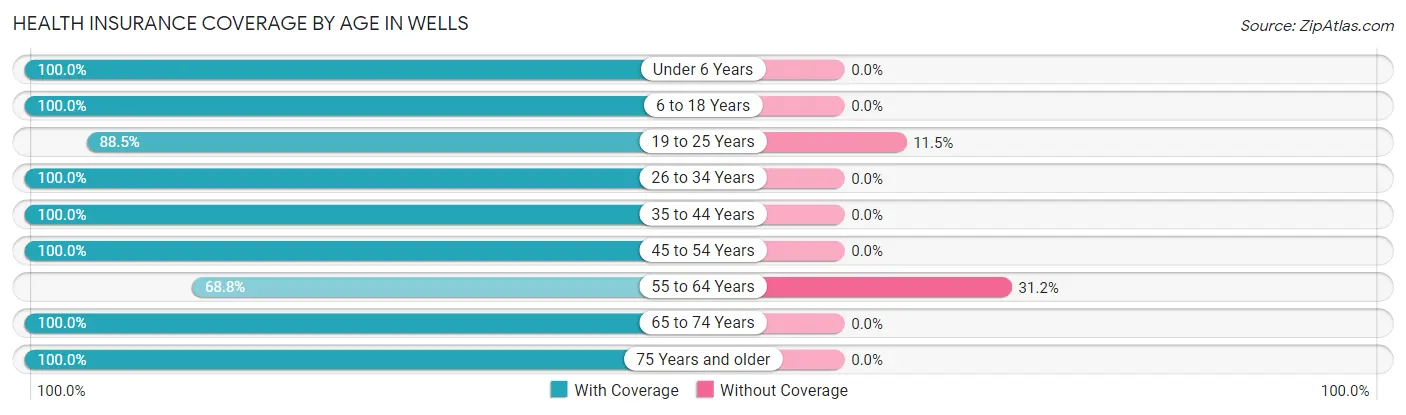
| Age Bracket | With Coverage | Without Coverage |
| Under 6 Years | 43 (100.0%) | 0 (0.0%) |
| 6 to 18 Years | 109 (100.0%) | 0 (0.0%) |
| 19 to 25 Years | 23 (88.5%) | 3 (11.5%) |
| 26 to 34 Years | 40 (100.0%) | 0 (0.0%) |
| 35 to 44 Years | 49 (100.0%) | 0 (0.0%) |
| 45 to 54 Years | 74 (100.0%) | 0 (0.0%) |
| 55 to 64 Years | 108 (68.8%) | 49 (31.2%) |
| 65 to 74 Years | 50 (100.0%) | 0 (0.0%) |
| 75 Years and older | 23 (100.0%) | 0 (0.0%) |
| Total | 519 (90.9%) | 52 (9.1%) |
Health Insurance Coverage by Citizenship Status in Wells
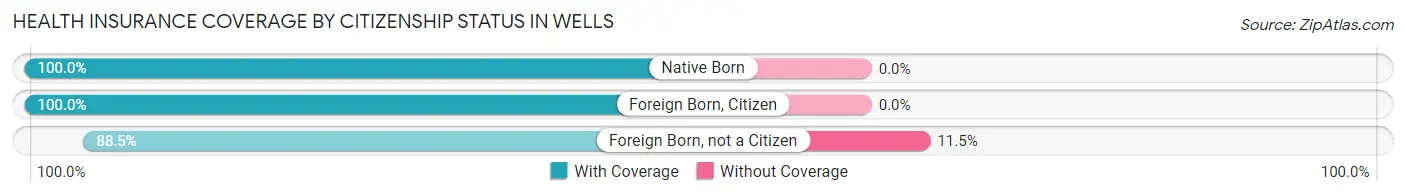
| Citizenship Status | With Coverage | Without Coverage |
| Native Born | 43 (100.0%) | 0 (0.0%) |
| Foreign Born, Citizen | 109 (100.0%) | 0 (0.0%) |
| Foreign Born, not a Citizen | 23 (88.5%) | 3 (11.5%) |
Health Insurance Coverage by Household Income in Wells
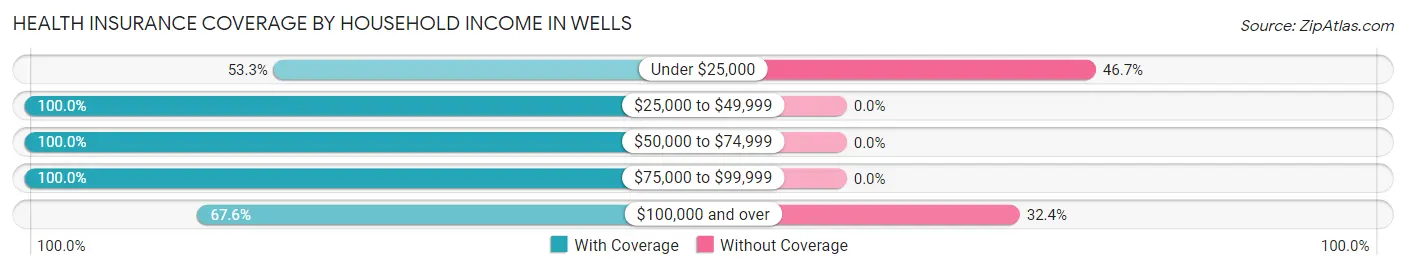
| Household Income | With Coverage | Without Coverage |
| Under $25,000 | 16 (53.3%) | 14 (46.7%) |
| $25,000 to $49,999 | 180 (100.0%) | 0 (0.0%) |
| $50,000 to $74,999 | 34 (100.0%) | 0 (0.0%) |
| $75,000 to $99,999 | 180 (100.0%) | 0 (0.0%) |
| $100,000 and over | 73 (67.6%) | 35 (32.4%) |
Public vs Private Health Insurance Coverage by Age in Wells
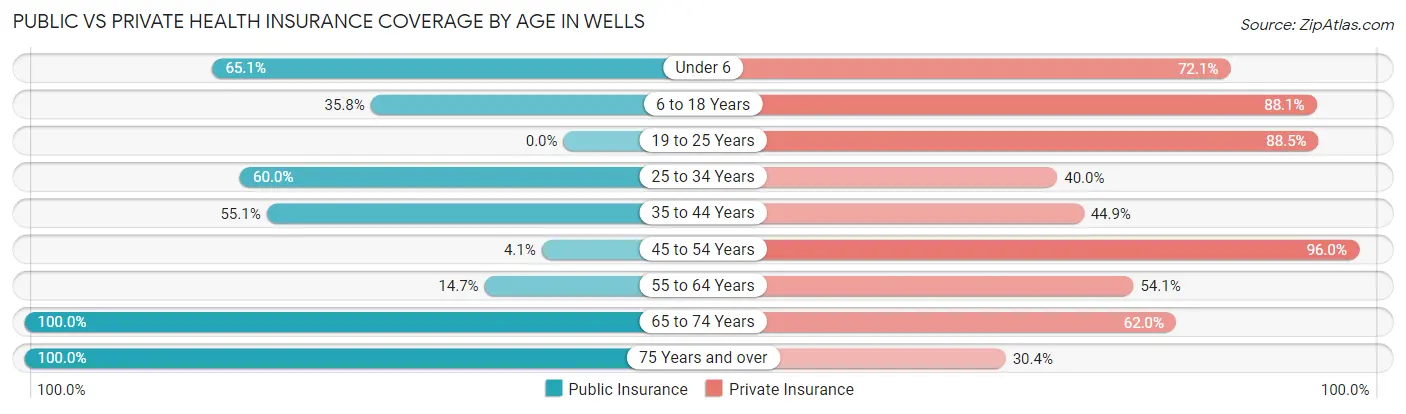
| Age Bracket | Public Insurance | Private Insurance |
| Under 6 | 28 (65.1%) | 31 (72.1%) |
| 6 to 18 Years | 39 (35.8%) | 96 (88.1%) |
| 19 to 25 Years | 0 (0.0%) | 23 (88.5%) |
| 25 to 34 Years | 24 (60.0%) | 16 (40.0%) |
| 35 to 44 Years | 27 (55.1%) | 22 (44.9%) |
| 45 to 54 Years | 3 (4.1%) | 71 (96.0%) |
| 55 to 64 Years | 23 (14.6%) | 85 (54.1%) |
| 65 to 74 Years | 50 (100.0%) | 31 (62.0%) |
| 75 Years and over | 23 (100.0%) | 7 (30.4%) |
| Total | 217 (38.0%) | 382 (66.9%) |
Disability Status by Sex by Age in Wells
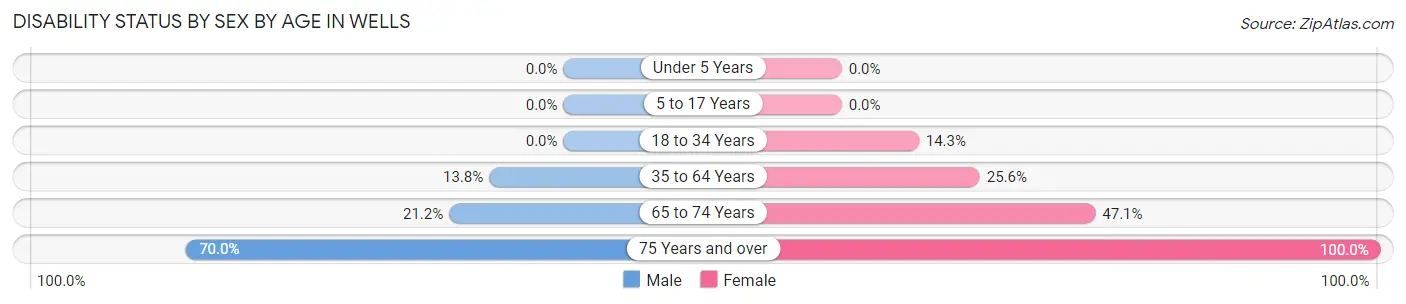
| Age Bracket | Male | Female |
| Under 5 Years | 0 (0.0%) | 0 (0.0%) |
| 5 to 17 Years | 0 (0.0%) | 0 (0.0%) |
| 18 to 34 Years | 0 (0.0%) | 3 (14.3%) |
| 35 to 64 Years | 16 (13.8%) | 42 (25.6%) |
| 65 to 74 Years | 7 (21.2%) | 8 (47.1%) |
| 75 Years and over | 7 (70.0%) | 13 (100.0%) |
Disability Class by Sex by Age in Wells
Disability Class: Hearing Difficulty
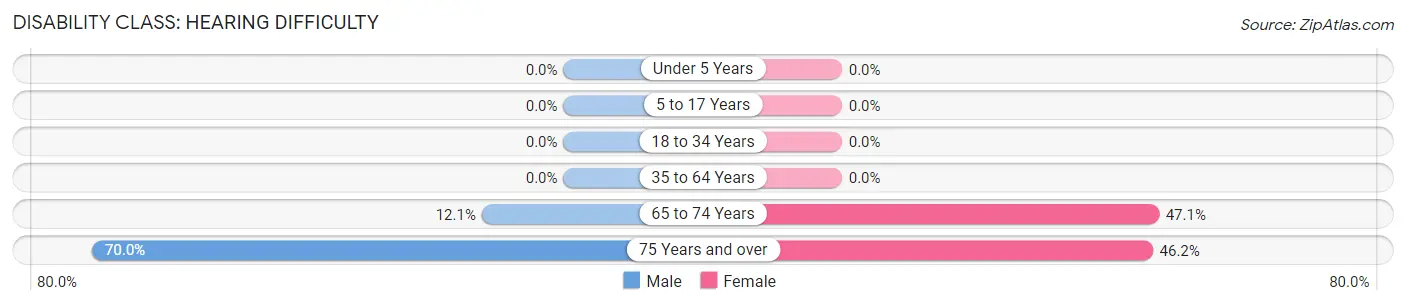
| Age Bracket | Male | Female |
| Under 5 Years | 0 (0.0%) | 0 (0.0%) |
| 5 to 17 Years | 0 (0.0%) | 0 (0.0%) |
| 18 to 34 Years | 0 (0.0%) | 0 (0.0%) |
| 35 to 64 Years | 0 (0.0%) | 0 (0.0%) |
| 65 to 74 Years | 4 (12.1%) | 8 (47.1%) |
| 75 Years and over | 7 (70.0%) | 6 (46.2%) |
Disability Class: Vision Difficulty
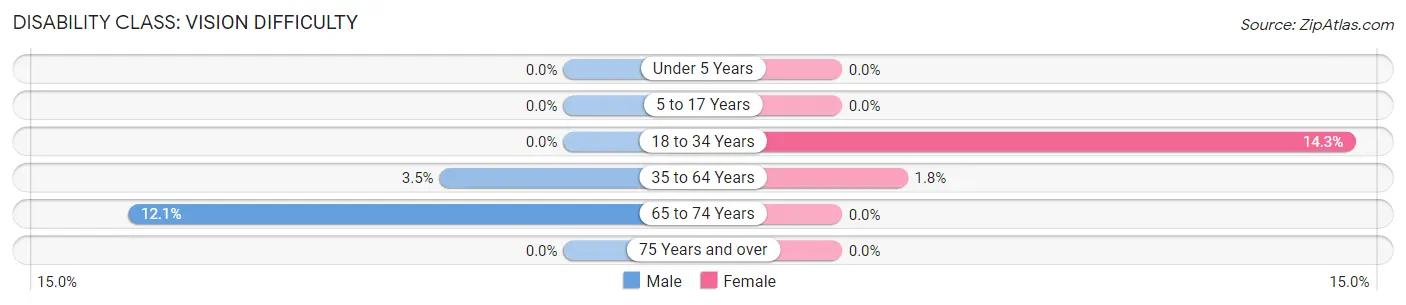
| Age Bracket | Male | Female |
| Under 5 Years | 0 (0.0%) | 0 (0.0%) |
| 5 to 17 Years | 0 (0.0%) | 0 (0.0%) |
| 18 to 34 Years | 0 (0.0%) | 3 (14.3%) |
| 35 to 64 Years | 4 (3.5%) | 3 (1.8%) |
| 65 to 74 Years | 4 (12.1%) | 0 (0.0%) |
| 75 Years and over | 0 (0.0%) | 0 (0.0%) |
Disability Class: Cognitive Difficulty
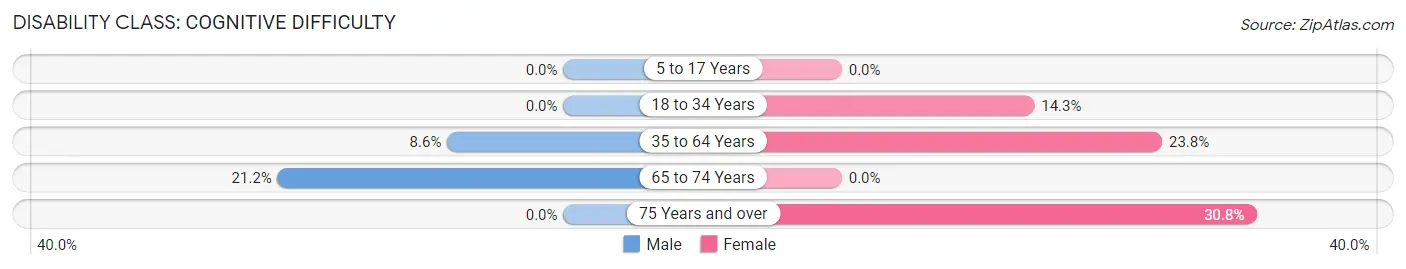
| Age Bracket | Male | Female |
| 5 to 17 Years | 0 (0.0%) | 0 (0.0%) |
| 18 to 34 Years | 0 (0.0%) | 3 (14.3%) |
| 35 to 64 Years | 10 (8.6%) | 39 (23.8%) |
| 65 to 74 Years | 7 (21.2%) | 0 (0.0%) |
| 75 Years and over | 0 (0.0%) | 4 (30.8%) |
Disability Class: Ambulatory Difficulty
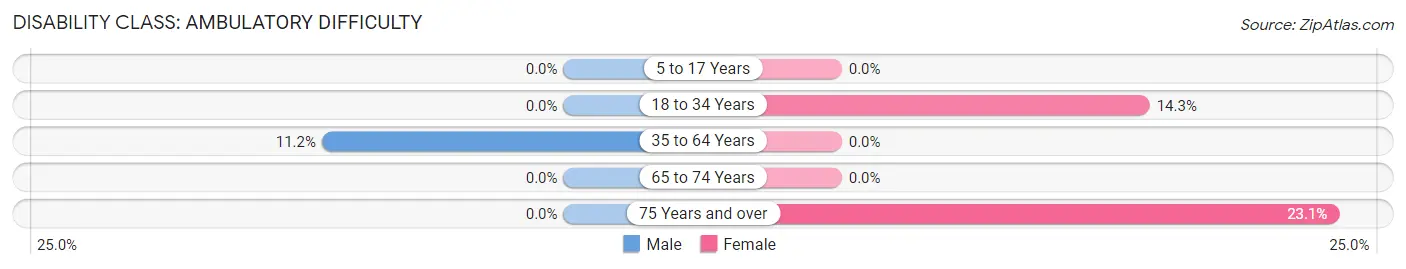
| Age Bracket | Male | Female |
| 5 to 17 Years | 0 (0.0%) | 0 (0.0%) |
| 18 to 34 Years | 0 (0.0%) | 3 (14.3%) |
| 35 to 64 Years | 13 (11.2%) | 0 (0.0%) |
| 65 to 74 Years | 0 (0.0%) | 0 (0.0%) |
| 75 Years and over | 0 (0.0%) | 3 (23.1%) |
Disability Class: Self-Care Difficulty
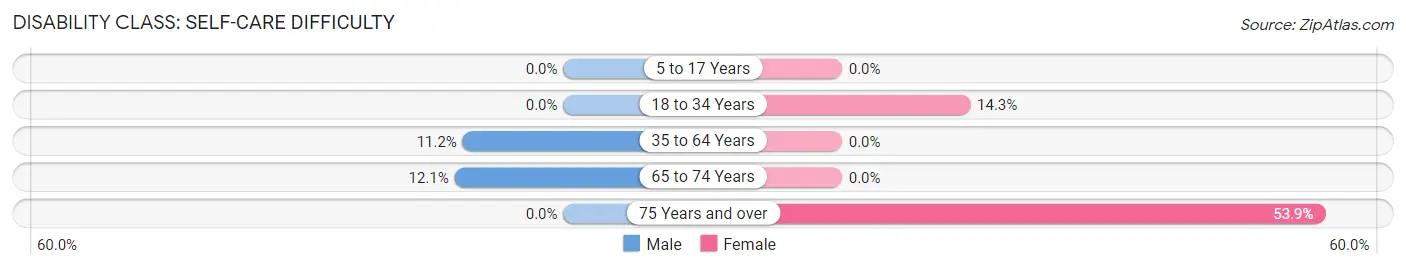
| Age Bracket | Male | Female |
| 5 to 17 Years | 0 (0.0%) | 0 (0.0%) |
| 18 to 34 Years | 0 (0.0%) | 3 (14.3%) |
| 35 to 64 Years | 13 (11.2%) | 0 (0.0%) |
| 65 to 74 Years | 4 (12.1%) | 0 (0.0%) |
| 75 Years and over | 0 (0.0%) | 7 (53.8%) |
Technology Access in Wells
Computing Device Access in Wells
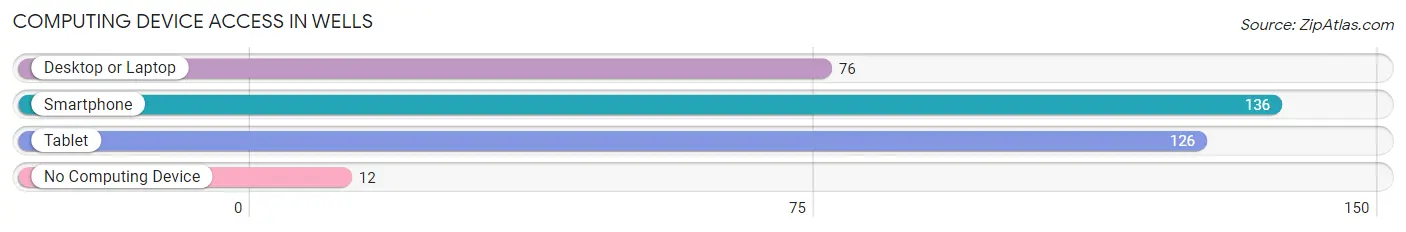
| Device Type | # Households | % Households |
| Desktop or Laptop | 76 | 46.1% |
| Smartphone | 136 | 82.4% |
| Tablet | 126 | 76.4% |
| No Computing Device | 12 | 7.3% |
| Total | 165 | 100.0% |
Internet Access in Wells
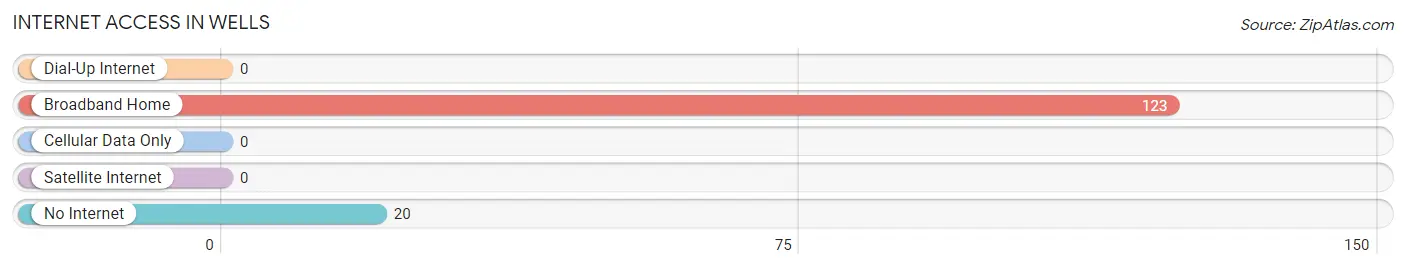
| Internet Type | # Households | % Households |
| Dial-Up Internet | 0 | 0.0% |
| Broadband Home | 123 | 74.6% |
| Cellular Data Only | 0 | 0.0% |
| Satellite Internet | 0 | 0.0% |
| No Internet | 20 | 12.1% |
| Total | 165 | 100.0% |
Wells Summary
Wells is a small town located in Hamilton County, New York, United States. The town is situated in the Adirondack Mountains and is part of the Adirondack Park. The town is bordered by the towns of Hope, Morehouse, and Arietta. The population of Wells was 1,093 at the 2010 census.
History
The town of Wells was first settled in 1794 by a group of settlers from Massachusetts. The town was named after the Wells family, who were among the first settlers. The town was officially established in 1817.
In the early 19th century, the town was a center of the lumber industry. The town was also home to several sawmills, gristmills, and tanneries. The town was also home to several iron ore mines.
In the late 19th century, the town was a popular tourist destination. The town was home to several hotels and resorts, as well as a number of summer camps.
Geography
Wells is located in the Adirondack Mountains in Hamilton County, New York. The town is bordered by the towns of Hope, Morehouse, and Arietta. The town is located approximately 30 miles north of Utica and 40 miles south of Lake Placid.
The terrain of the town is mostly mountainous, with several peaks reaching over 2,000 feet in elevation. The highest point in the town is Mount Adams, which has an elevation of 2,890 feet.
The town is home to several lakes, including Lake Wells, Lake Morehouse, and Lake Arietta. The town is also home to several streams, including the Wells Creek, the Morehouse Creek, and the Arietta Creek.
Economy
The economy of Wells is largely based on tourism. The town is home to several resorts and hotels, as well as a number of summer camps. The town is also home to several restaurants and shops.
The town is also home to several small businesses, including a sawmill, a gristmill, and a tannery. The town is also home to several farms, which produce a variety of crops, including apples, potatoes, and hay.
Demographics
As of the 2010 census, the population of Wells was 1,093. The racial makeup of the town was 97.3% White, 0.7% African American, 0.2% Native American, 0.2% Asian, 0.1% Pacific Islander, 0.2% from other races, and 1.3% from two or more races. Hispanic or Latino of any race were 1.3% of the population.
The median income for a household in the town was $37,500, and the median income for a family was $45,000. The per capita income for the town was $19,845. About 10.3% of families and 14.2% of the population were below the poverty line, including 18.2% of those under age 18 and 8.3% of those age 65 or over.
Common Questions
What is Per Capita Income in Wells?
Per Capita income in Wells is $26,113.
What is the Median Family Income in Wells?
Median Family Income in Wells is $72,500.
What is the Median Household income in Wells?
Median Household Income in Wells is $75,583.
What is Income or Wage Gap in Wells?
Income or Wage Gap in Wells is 1.8%.
Women in Wells earn 98.2 cents for every dollar earned by a man.
What is Inequality or Gini Index in Wells?
Inequality or Gini Index in Wells is 0.41.
What is the Total Population of Wells?
Total Population of Wells is 571.
What is the Total Male Population of Wells?
Total Male Population of Wells is 294.
What is the Total Female Population of Wells?
Total Female Population of Wells is 277.
What is the Ratio of Males per 100 Females in Wells?
There are 106.14 Males per 100 Females in Wells.
What is the Ratio of Females per 100 Males in Wells?
There are 94.22 Females per 100 Males in Wells.
What is the Median Population Age in Wells?
Median Population Age in Wells is 47.8 Years.
What is the Average Family Size in Wells
Average Family Size in Wells is 3.6 People.
What is the Average Household Size in Wells
Average Household Size in Wells is 3.2 People.
How Large is the Labor Force in Wells?
There are 200 People in the Labor Forcein in Wells.
What is the Percentage of People in the Labor Force in Wells?
42.3% of People are in the Labor Force in Wells.
What is the Unemployment Rate in Wells?
Unemployment Rate in Wells is 8.5%.