Jonesville, SC
Jonesville Map
Jonesville Overview
925
TOTAL POPULATION
489
MALE POPULATION
436
FEMALE POPULATION
112.16
MALES / 100 FEMALES
89.16
FEMALES / 100 MALES
56.6
MEDIAN AGE
2.7
AVG FAMILY SIZE
2.2
AVG HOUSEHOLD SIZE
$22,786
PER CAPITA INCOME
$54,167
AVG FAMILY INCOME
$36,023
AVG HOUSEHOLD INCOME
37.3%
WAGE / INCOME GAP [ % ]
62.7¢/ $1
WAGE / INCOME GAP [ $ ]
0.40
INEQUALITY / GINI INDEX
461
LABOR FORCE [ PEOPLE ]
56.5%
PERCENT IN LABOR FORCE
6.2%
UNEMPLOYMENT RATE
Jonesville Zip Codes
Jonesville Area Codes
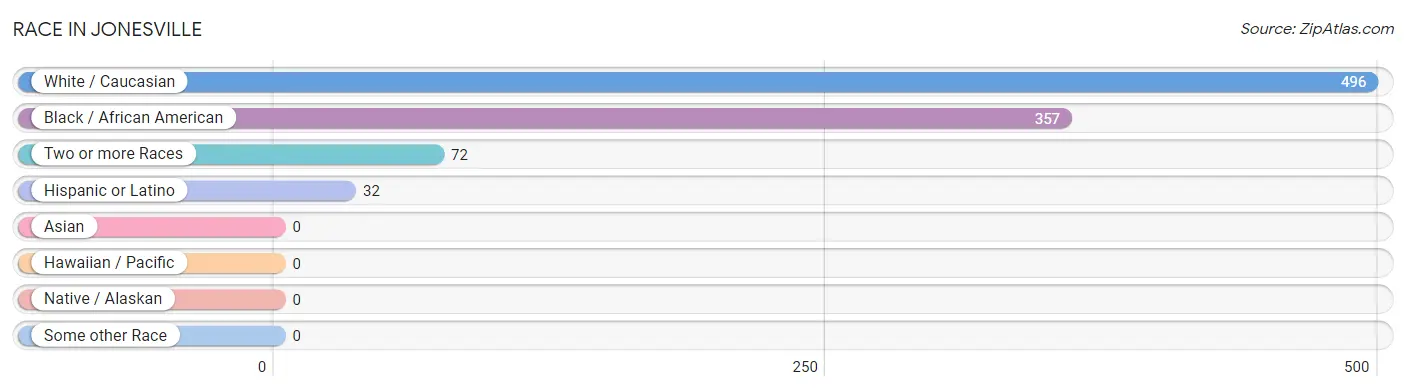
Race in Jonesville
The most populous races in Jonesville are White / Caucasian (496 | 53.6%), Black / African American (357 | 38.6%), and Two or more Races (72 | 7.8%).
| Race | # Population | % Population |
| Asian | 0 | 0.0% |
| Black / African American | 357 | 38.6% |
| Hawaiian / Pacific | 0 | 0.0% |
| Hispanic or Latino | 32 | 3.5% |
| Native / Alaskan | 0 | 0.0% |
| White / Caucasian | 496 | 53.6% |
| Two or more Races | 72 | 7.8% |
| Some other Race | 0 | 0.0% |
| Total | 925 | 100.0% |
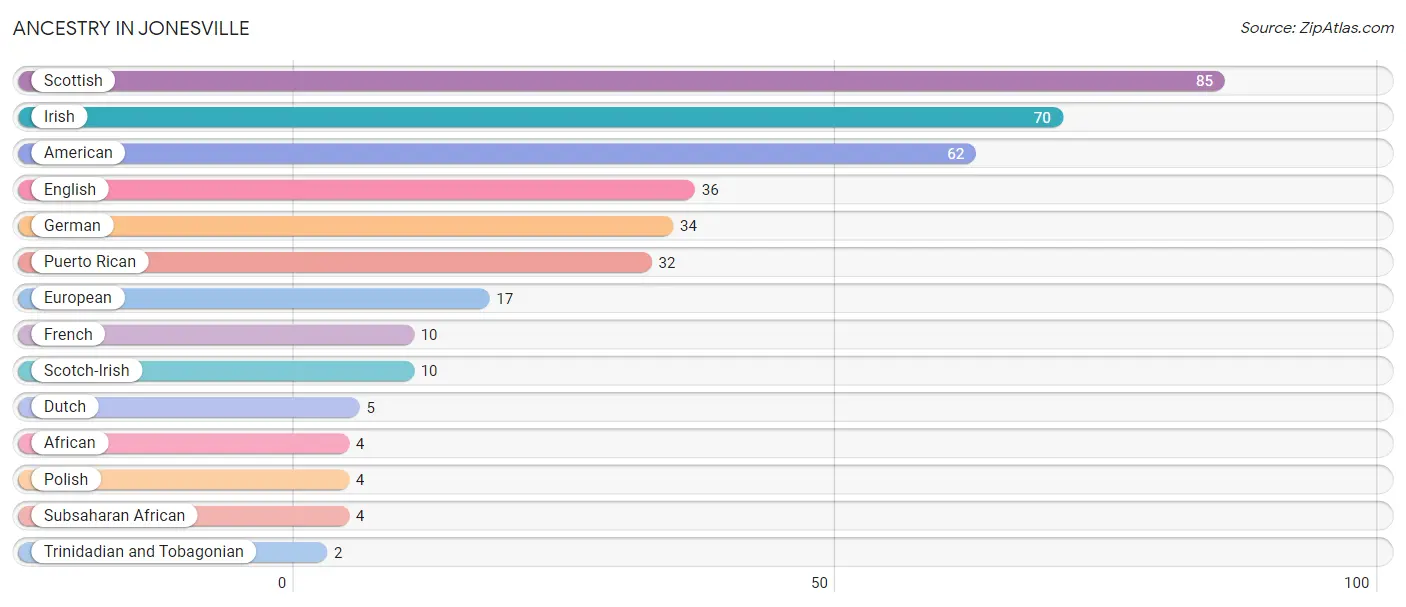
Ancestry in Jonesville
The most populous ancestries reported in Jonesville are Scottish (85 | 9.2%), Irish (70 | 7.6%), American (62 | 6.7%), English (36 | 3.9%), and German (34 | 3.7%), together accounting for 31.0% of all Jonesville residents.
| Ancestry | # Population | % Population |
| African | 4 | 0.4% |
| American | 62 | 6.7% |
| Dutch | 5 | 0.5% |
| English | 36 | 3.9% |
| European | 17 | 1.8% |
| French | 10 | 1.1% |
| German | 34 | 3.7% |
| Irish | 70 | 7.6% |
| Polish | 4 | 0.4% |
| Puerto Rican | 32 | 3.5% |
| Scotch-Irish | 10 | 1.1% |
| Scottish | 85 | 9.2% |
| Subsaharan African | 4 | 0.4% |
| Trinidadian and Tobagonian | 2 | 0.2% | View All 14 Rows |
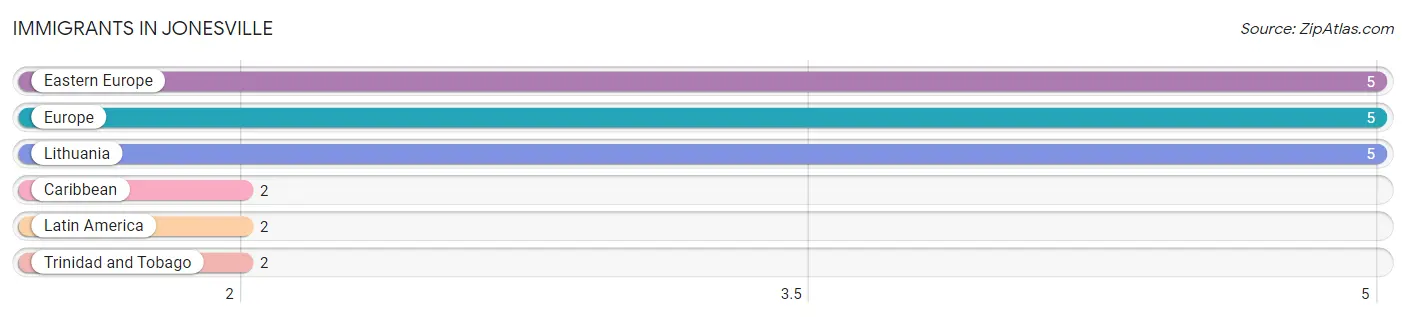
Immigrants in Jonesville
The most numerous immigrant groups reported in Jonesville came from Eastern Europe (5 | 0.5%), Europe (5 | 0.5%), Lithuania (5 | 0.5%), Caribbean (2 | 0.2%), and Latin America (2 | 0.2%), together accounting for 2.1% of all Jonesville residents.
| Immigration Origin | # Population | % Population |
| Caribbean | 2 | 0.2% |
| Eastern Europe | 5 | 0.5% |
| Europe | 5 | 0.5% |
| Latin America | 2 | 0.2% |
| Lithuania | 5 | 0.5% |
| Trinidad and Tobago | 2 | 0.2% | View All 6 Rows |
Sex and Age in Jonesville
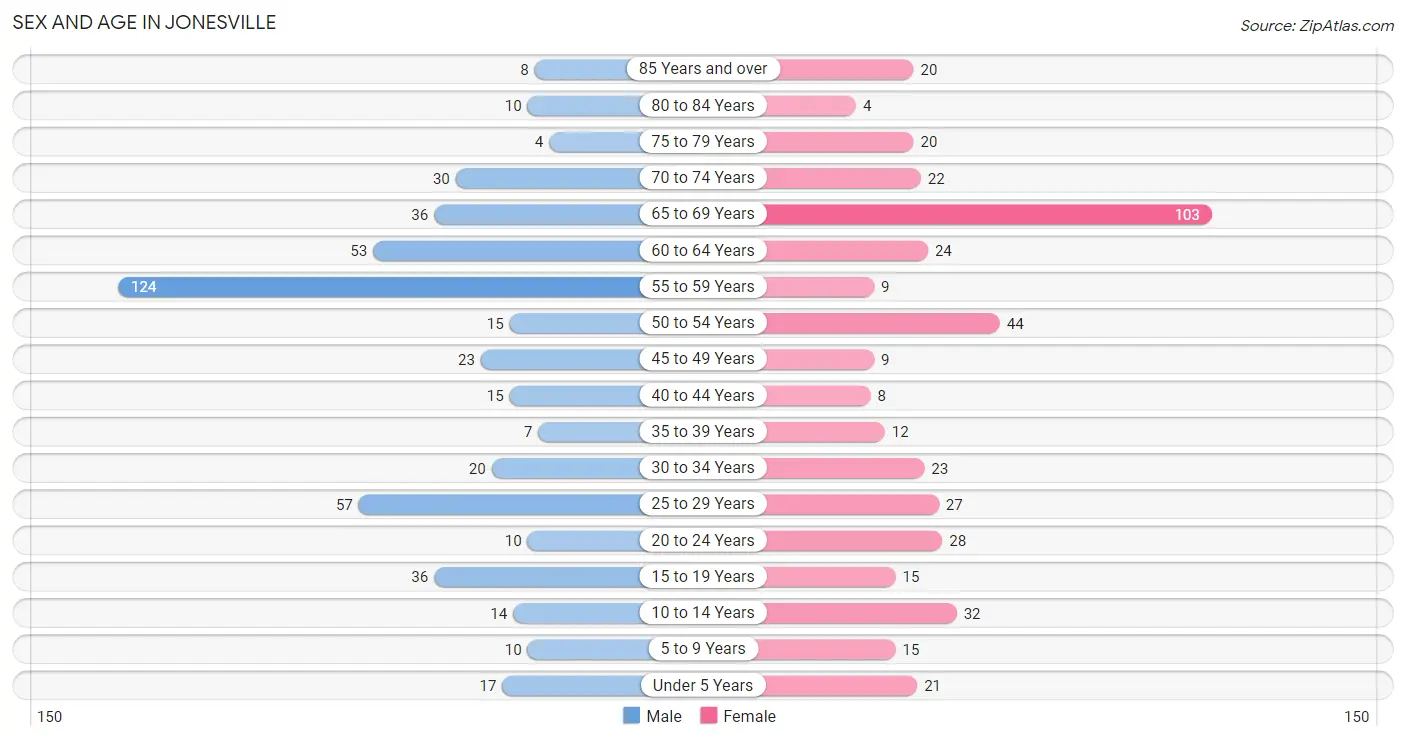
Sex and Age in Jonesville
The most populous age groups in Jonesville are 55 to 59 Years (124 | 25.4%) for men and 65 to 69 Years (103 | 23.6%) for women.
| Age Bracket | Male | Female |
| Under 5 Years | 17 (3.5%) | 21 (4.8%) |
| 5 to 9 Years | 10 (2.0%) | 15 (3.4%) |
| 10 to 14 Years | 14 (2.9%) | 32 (7.3%) |
| 15 to 19 Years | 36 (7.4%) | 15 (3.4%) |
| 20 to 24 Years | 10 (2.0%) | 28 (6.4%) |
| 25 to 29 Years | 57 (11.7%) | 27 (6.2%) |
| 30 to 34 Years | 20 (4.1%) | 23 (5.3%) |
| 35 to 39 Years | 7 (1.4%) | 12 (2.8%) |
| 40 to 44 Years | 15 (3.1%) | 8 (1.8%) |
| 45 to 49 Years | 23 (4.7%) | 9 (2.1%) |
| 50 to 54 Years | 15 (3.1%) | 44 (10.1%) |
| 55 to 59 Years | 124 (25.4%) | 9 (2.1%) |
| 60 to 64 Years | 53 (10.8%) | 24 (5.5%) |
| 65 to 69 Years | 36 (7.4%) | 103 (23.6%) |
| 70 to 74 Years | 30 (6.1%) | 22 (5.1%) |
| 75 to 79 Years | 4 (0.8%) | 20 (4.6%) |
| 80 to 84 Years | 10 (2.0%) | 4 (0.9%) |
| 85 Years and over | 8 (1.6%) | 20 (4.6%) |
| Total | 489 (100.0%) | 436 (100.0%) |
Families and Households in Jonesville
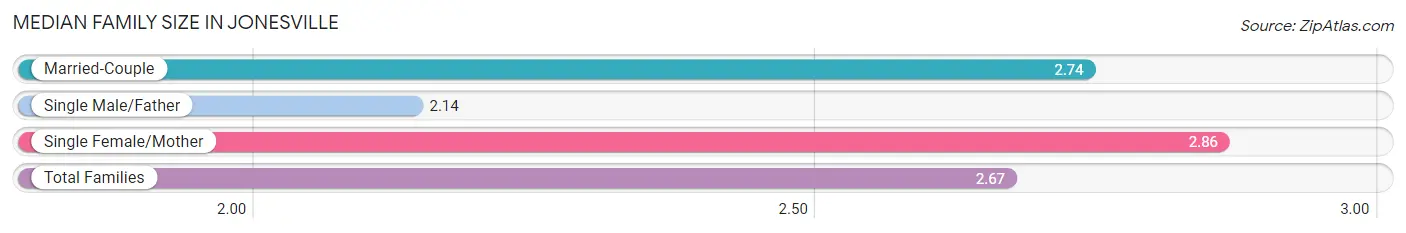
Median Family Size in Jonesville
The median family size in Jonesville is 2.67 persons per family, with single female/mother families (57 | 21.1%) accounting for the largest median family size of 2.86 persons per family. On the other hand, single male/father families (43 | 15.9%) represent the smallest median family size with 2.14 persons per family.
| Family Type | # Families | Family Size |
| Married-Couple | 170 (63.0%) | 2.74 |
| Single Male/Father | 43 (15.9%) | 2.14 |
| Single Female/Mother | 57 (21.1%) | 2.86 |
| Total Families | 270 (100.0%) | 2.67 |
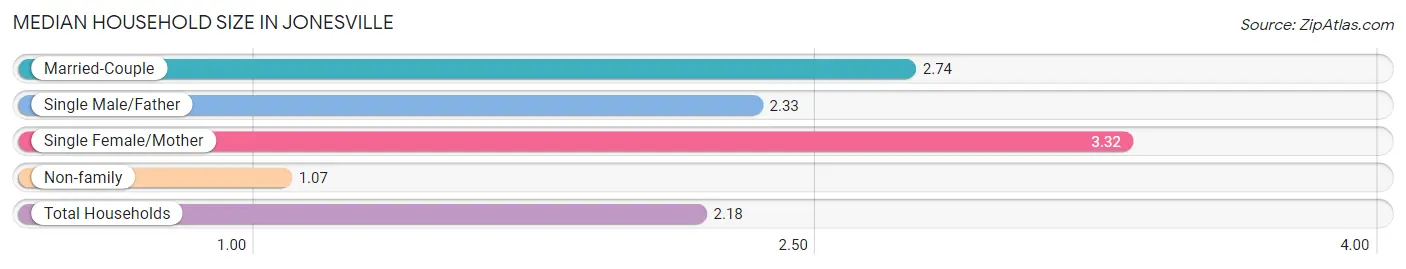
Median Household Size in Jonesville
The median household size in Jonesville is 2.18 persons per household, with single female/mother households (57 | 13.5%) accounting for the largest median household size of 3.32 persons per household. non-family households (151 | 35.9%) represent the smallest median household size with 1.07 persons per household.
| Household Type | # Households | Household Size |
| Married-Couple | 170 (40.4%) | 2.74 |
| Single Male/Father | 43 (10.2%) | 2.33 |
| Single Female/Mother | 57 (13.5%) | 3.32 |
| Non-family | 151 (35.9%) | 1.07 |
| Total Households | 421 (100.0%) | 2.18 |
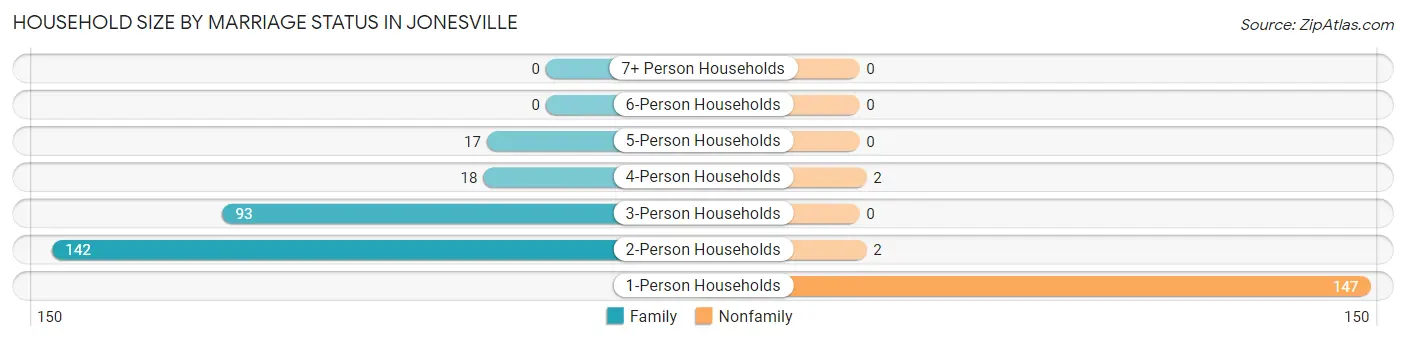
Household Size by Marriage Status in Jonesville
Out of a total of 421 households in Jonesville, 270 (64.1%) are family households, while 151 (35.9%) are nonfamily households. The most numerous type of family households are 2-person households, comprising 142, and the most common type of nonfamily households are 1-person households, comprising 147.
| Household Size | Family Households | Nonfamily Households |
| 1-Person Households | - | 147 (34.9%) |
| 2-Person Households | 142 (33.7%) | 2 (0.5%) |
| 3-Person Households | 93 (22.1%) | 0 (0.0%) |
| 4-Person Households | 18 (4.3%) | 2 (0.5%) |
| 5-Person Households | 17 (4.0%) | 0 (0.0%) |
| 6-Person Households | 0 (0.0%) | 0 (0.0%) |
| 7+ Person Households | 0 (0.0%) | 0 (0.0%) |
| Total | 270 (64.1%) | 151 (35.9%) |
Female Fertility in Jonesville
Fertility by Age in Jonesville
Average fertility rate in Jonesville is 52.0 births per 1,000 women. Women in the age bracket of 20 to 34 years have the highest fertility rate with 90.0 births per 1,000 women. Women in the age bracket of 20 to 34 years acount for 100.0% of all women with births.
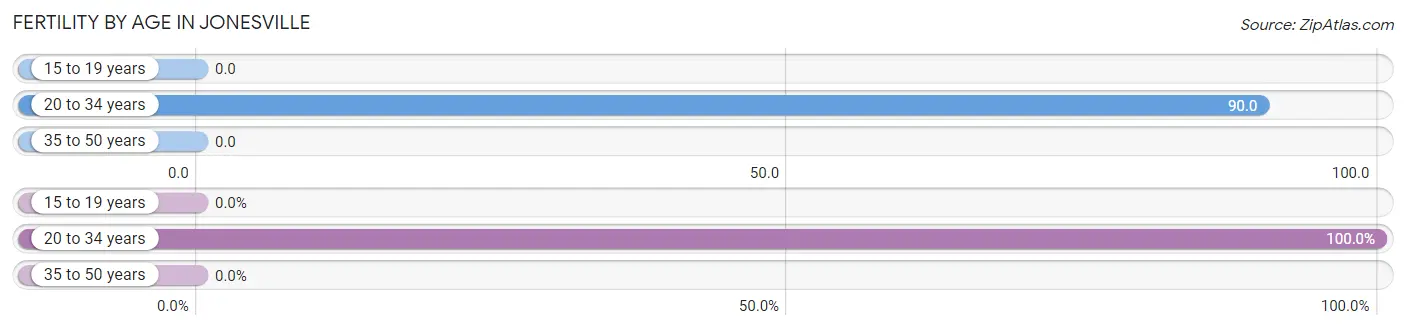
| Age Bracket | Women with Births | Births / 1,000 Women |
| 15 to 19 years | 0 (0.0%) | 0.0 |
| 20 to 34 years | 7 (100.0%) | 90.0 |
| 35 to 50 years | 0 (0.0%) | 0.0 |
| Total | 7 (100.0%) | 52.0 |
Fertility by Age by Marriage Status in Jonesville
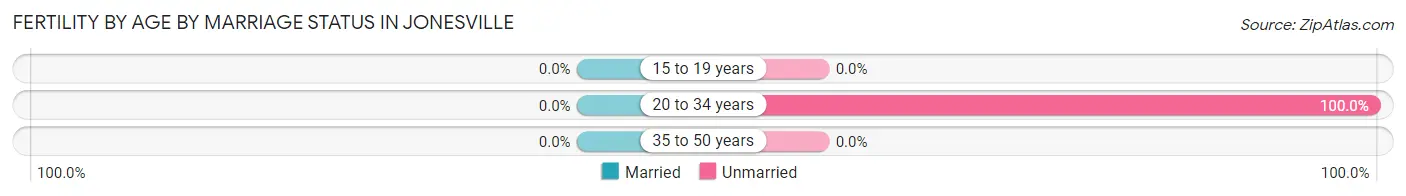
| Age Bracket | Married | Unmarried |
| 15 to 19 years | 0 (0.0%) | 0 (0.0%) |
| 20 to 34 years | 0 (0.0%) | 7 (100.0%) |
| 35 to 50 years | 0 (0.0%) | 0 (0.0%) |
| Total | 0 (0.0%) | 7 (100.0%) |
Fertility by Education in Jonesville
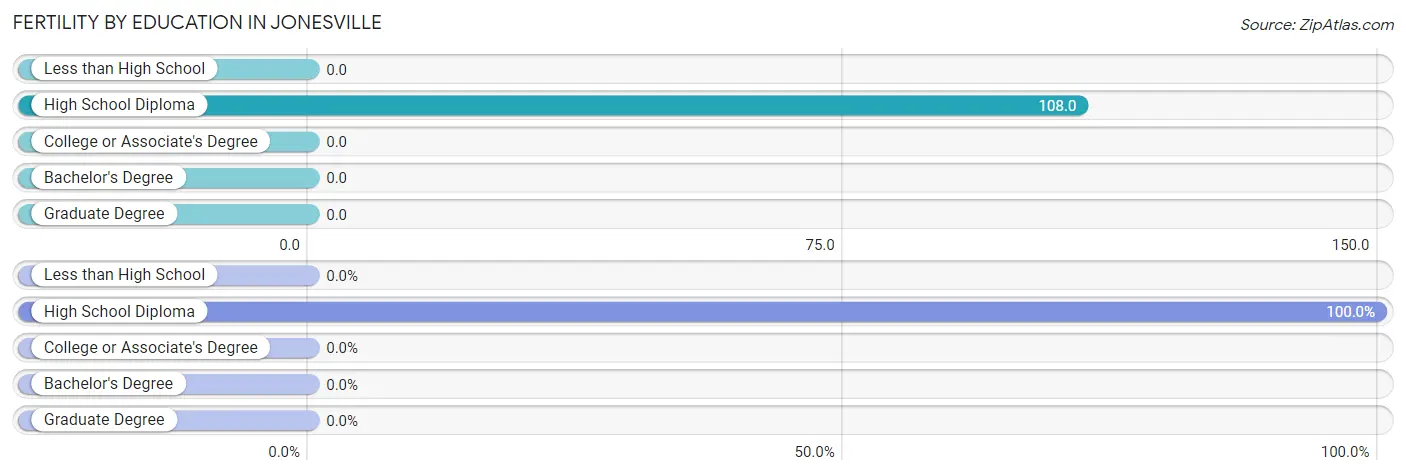
| Educational Attainment | Women with Births | Births / 1,000 Women |
| Less than High School | 0 (0.0%) | 0.0 |
| High School Diploma | 7 (100.0%) | 108.0 |
| College or Associate's Degree | 0 (0.0%) | 0.0 |
| Bachelor's Degree | 0 (0.0%) | 0.0 |
| Graduate Degree | 0 (0.0%) | 0.0 |
| Total | 7 (100.0%) | 52.0 |
Fertility by Education by Marriage Status in Jonesville
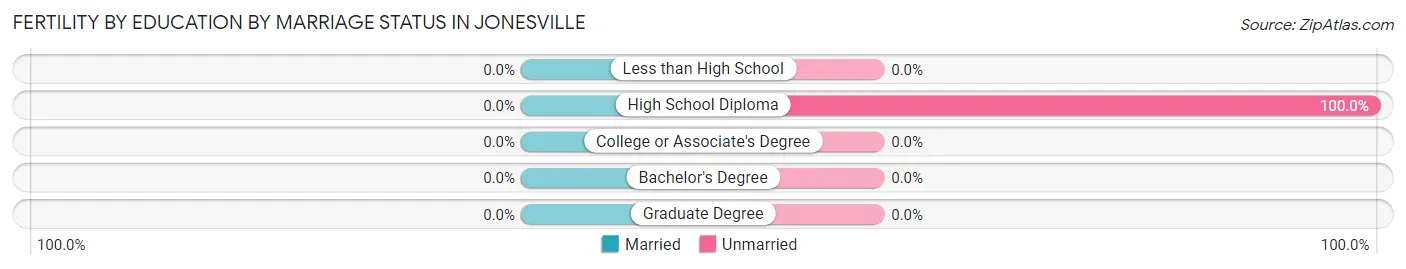
| Educational Attainment | Married | Unmarried |
| Less than High School | 0 (0.0%) | 0 (0.0%) |
| High School Diploma | 0 (0.0%) | 7 (100.0%) |
| College or Associate's Degree | 0 (0.0%) | 0 (0.0%) |
| Bachelor's Degree | 0 (0.0%) | 0 (0.0%) |
| Graduate Degree | 0 (0.0%) | 0 (0.0%) |
| Total | 0 (0.0%) | 7 (100.0%) |
Income in Jonesville
Income Overview in Jonesville
Per Capita Income in Jonesville is $22,786, while median incomes of families and households are $54,167 and $36,023 respectively.
| Characteristic | Number | Measure |
| Per Capita Income | 925 | $22,786 |
| Median Family Income | 270 | $54,167 |
| Mean Family Income | 270 | $53,891 |
| Median Household Income | 421 | $36,023 |
| Mean Household Income | 421 | $45,127 |
| Income Deficit | 270 | $0 |
| Wage / Income Gap (%) | 925 | 37.33% |
| Wage / Income Gap ($) | 925 | 62.67¢ per $1 |
| Gini / Inequality Index | 925 | 0.40 |
Earnings by Sex in Jonesville
Average Earnings in Jonesville are $32,596, $40,750 for men and $25,536 for women, a difference of 37.3%.
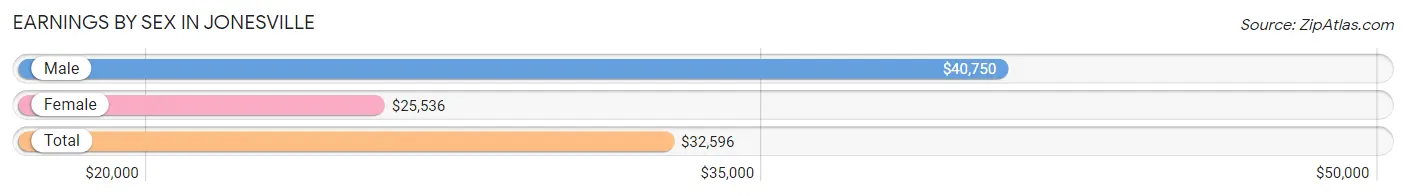
| Sex | Number | Average Earnings |
| Male | 290 (63.2%) | $40,750 |
| Female | 169 (36.8%) | $25,536 |
| Total | 459 (100.0%) | $32,596 |
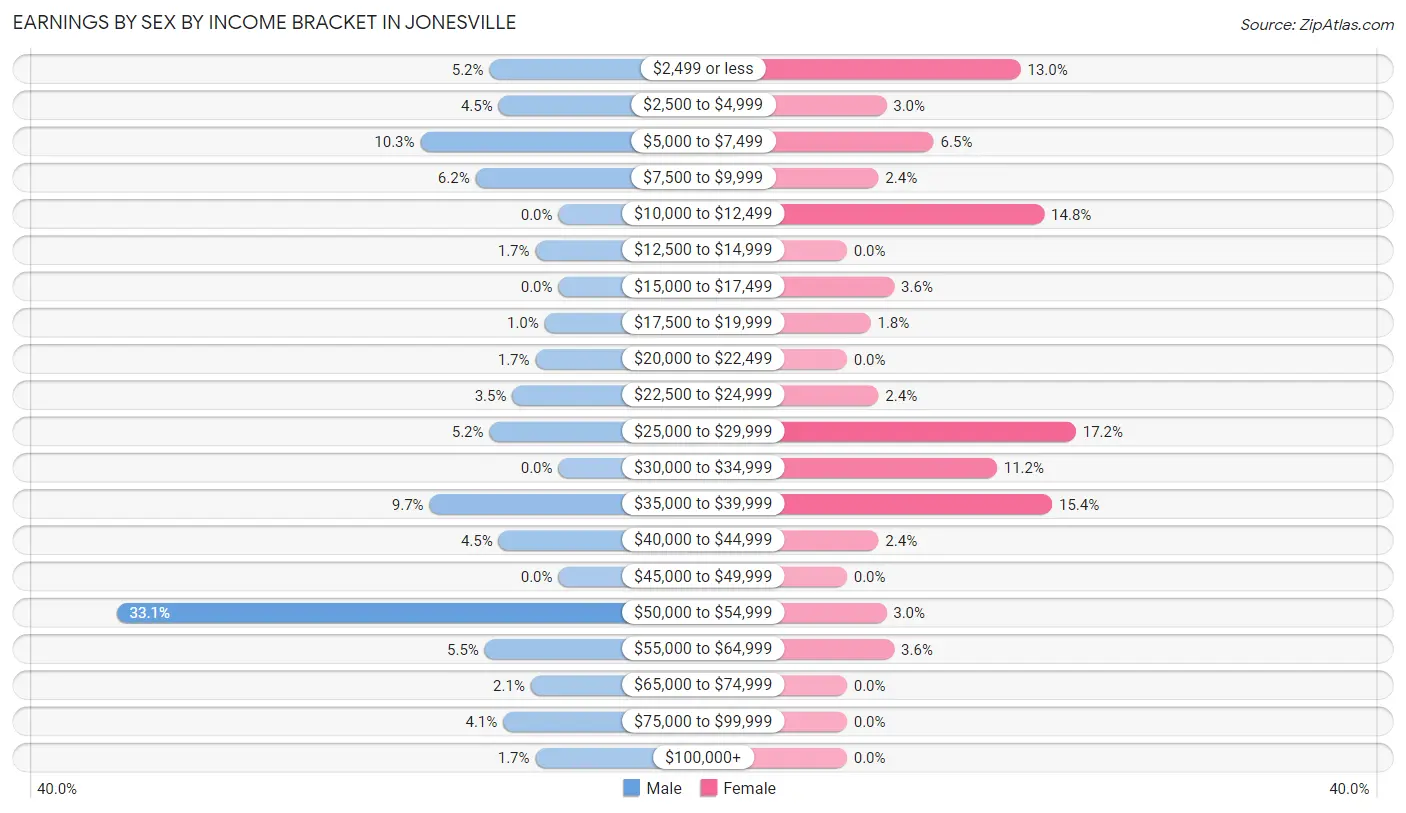
Earnings by Sex by Income Bracket in Jonesville
The most common earnings brackets in Jonesville are $50,000 to $54,999 for men (96 | 33.1%) and $25,000 to $29,999 for women (29 | 17.2%).
| Income | Male | Female |
| $2,499 or less | 15 (5.2%) | 22 (13.0%) |
| $2,500 to $4,999 | 13 (4.5%) | 5 (3.0%) |
| $5,000 to $7,499 | 30 (10.3%) | 11 (6.5%) |
| $7,500 to $9,999 | 18 (6.2%) | 4 (2.4%) |
| $10,000 to $12,499 | 0 (0.0%) | 25 (14.8%) |
| $12,500 to $14,999 | 5 (1.7%) | 0 (0.0%) |
| $15,000 to $17,499 | 0 (0.0%) | 6 (3.5%) |
| $17,500 to $19,999 | 3 (1.0%) | 3 (1.8%) |
| $20,000 to $22,499 | 5 (1.7%) | 0 (0.0%) |
| $22,500 to $24,999 | 10 (3.5%) | 4 (2.4%) |
| $25,000 to $29,999 | 15 (5.2%) | 29 (17.2%) |
| $30,000 to $34,999 | 0 (0.0%) | 19 (11.2%) |
| $35,000 to $39,999 | 28 (9.7%) | 26 (15.4%) |
| $40,000 to $44,999 | 13 (4.5%) | 4 (2.4%) |
| $45,000 to $49,999 | 0 (0.0%) | 0 (0.0%) |
| $50,000 to $54,999 | 96 (33.1%) | 5 (3.0%) |
| $55,000 to $64,999 | 16 (5.5%) | 6 (3.5%) |
| $65,000 to $74,999 | 6 (2.1%) | 0 (0.0%) |
| $75,000 to $99,999 | 12 (4.1%) | 0 (0.0%) |
| $100,000+ | 5 (1.7%) | 0 (0.0%) |
| Total | 290 (100.0%) | 169 (100.0%) |
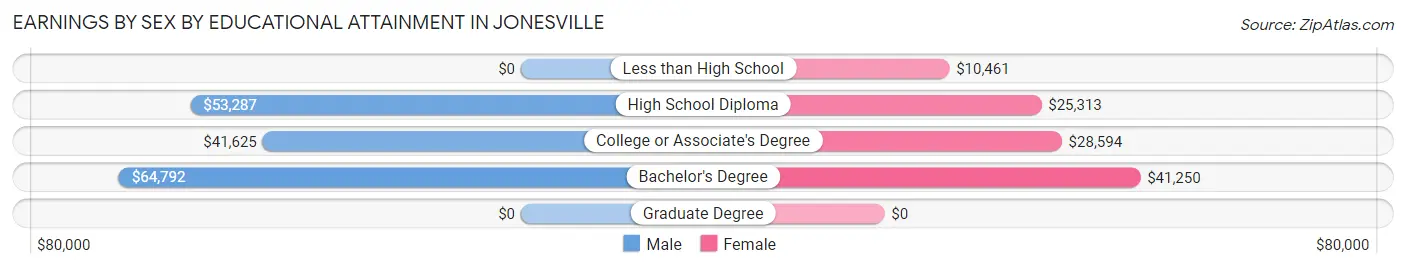
Earnings by Sex by Educational Attainment in Jonesville
Average earnings in Jonesville are $52,690 for men and $24,688 for women, a difference of 53.1%. Men with an educational attainment of bachelor's degree enjoy the highest average annual earnings of $64,792, while those with college or associate's degree education earn the least with $41,625. Women with an educational attainment of bachelor's degree earn the most with the average annual earnings of $41,250, while those with less than high school education have the smallest earnings of $10,461.
| Educational Attainment | Male Income | Female Income |
| Less than High School | - | - |
| High School Diploma | $53,287 | $25,313 |
| College or Associate's Degree | $41,625 | $28,594 |
| Bachelor's Degree | $64,792 | $41,250 |
| Graduate Degree | - | - |
| Total | $52,690 | $24,688 |
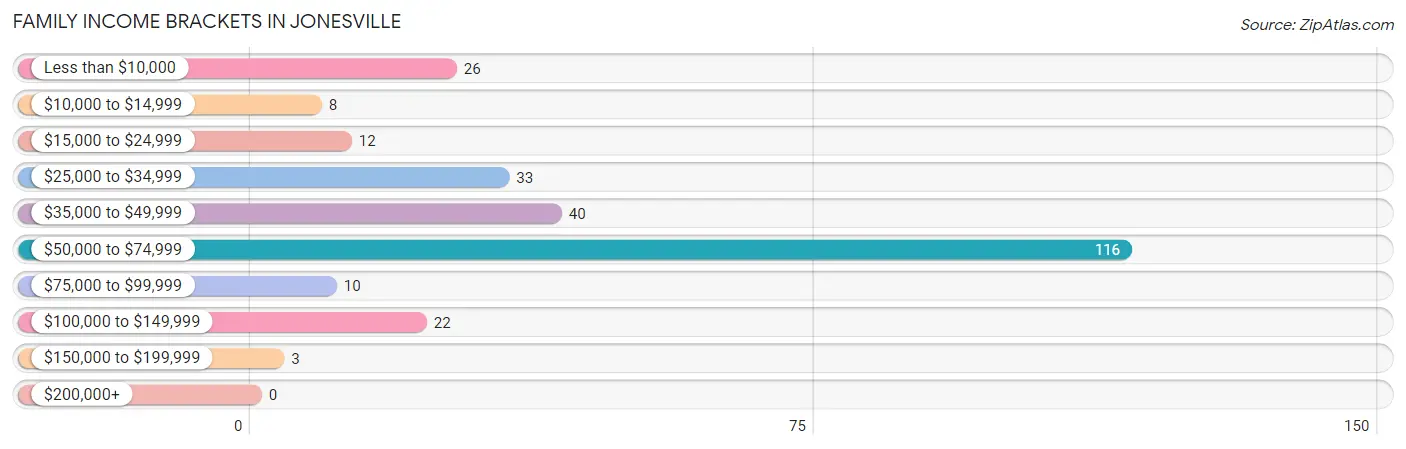
Family Income in Jonesville
Family Income Brackets in Jonesville
According to the Jonesville family income data, there are 116 families falling into the $50,000 to $74,999 income range, which is the most common income bracket and makes up 43.0% of all families.
| Income Bracket | # Families | % Families |
| Less than $10,000 | 26 | 9.6% |
| $10,000 to $14,999 | 8 | 3.0% |
| $15,000 to $24,999 | 12 | 4.4% |
| $25,000 to $34,999 | 33 | 12.2% |
| $35,000 to $49,999 | 40 | 14.8% |
| $50,000 to $74,999 | 116 | 43.0% |
| $75,000 to $99,999 | 10 | 3.7% |
| $100,000 to $149,999 | 22 | 8.1% |
| $150,000 to $199,999 | 3 | 1.1% |
| $200,000+ | 0 | 0.0% |
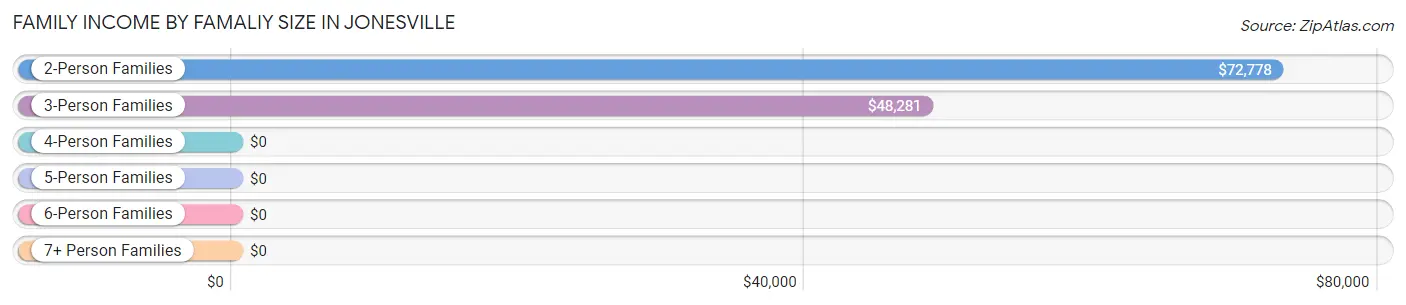
Family Income by Famaliy Size in Jonesville
2-person families (156 | 57.8%) account for the highest median family income in Jonesville with $72,778 per family, while 2-person families (156 | 57.8%) have the highest median income of $36,389 per family member.
| Income Bracket | # Families | Median Income |
| 2-Person Families | 156 (57.8%) | $72,778 |
| 3-Person Families | 93 (34.4%) | $48,281 |
| 4-Person Families | 8 (3.0%) | $0 |
| 5-Person Families | 13 (4.8%) | $0 |
| 6-Person Families | 0 (0.0%) | $0 |
| 7+ Person Families | 0 (0.0%) | $0 |
| Total | 270 (100.0%) | $54,167 |
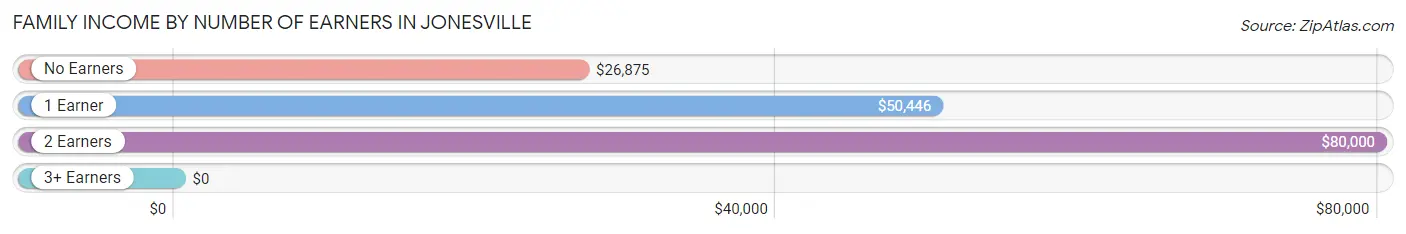
Family Income by Number of Earners in Jonesville
| Number of Earners | # Families | Median Income |
| No Earners | 23 (8.5%) | $26,875 |
| 1 Earner | 185 (68.5%) | $50,446 |
| 2 Earners | 58 (21.5%) | $80,000 |
| 3+ Earners | 4 (1.5%) | $0 |
| Total | 270 (100.0%) | $54,167 |
Household Income in Jonesville
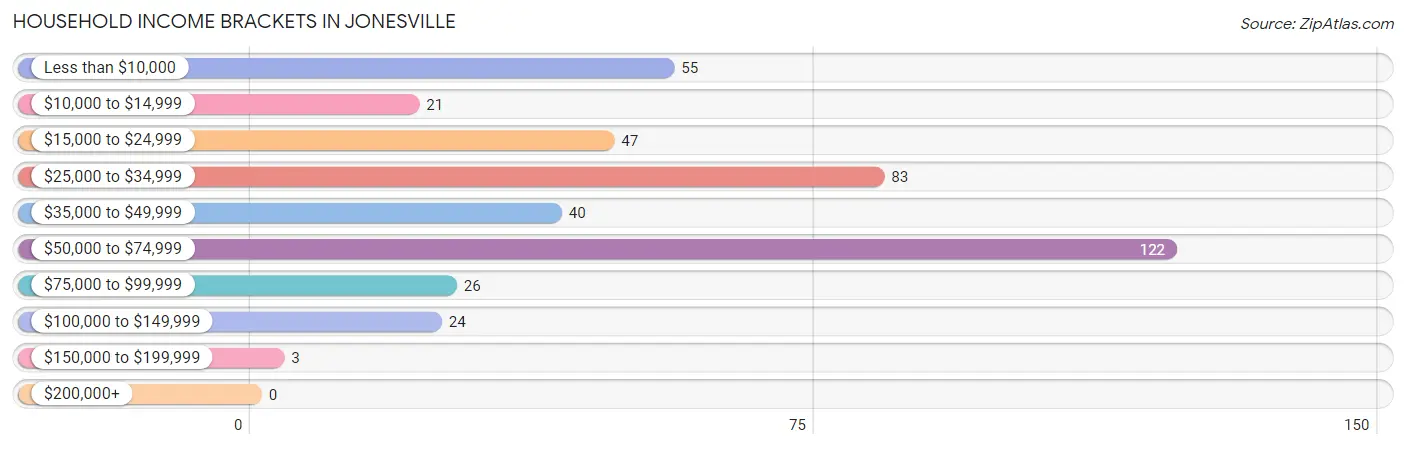
Household Income Brackets in Jonesville
With 122 households falling in the category, the $50,000 to $74,999 income range is the most frequent in Jonesville, accounting for 29.0% of all households.
| Income Bracket | # Households | % Households |
| Less than $10,000 | 55 | 13.1% |
| $10,000 to $14,999 | 21 | 5.0% |
| $15,000 to $24,999 | 47 | 11.2% |
| $25,000 to $34,999 | 83 | 19.7% |
| $35,000 to $49,999 | 40 | 9.5% |
| $50,000 to $74,999 | 122 | 29.0% |
| $75,000 to $99,999 | 26 | 6.2% |
| $100,000 to $149,999 | 24 | 5.7% |
| $150,000 to $199,999 | 3 | 0.7% |
| $200,000+ | 0 | 0.0% |
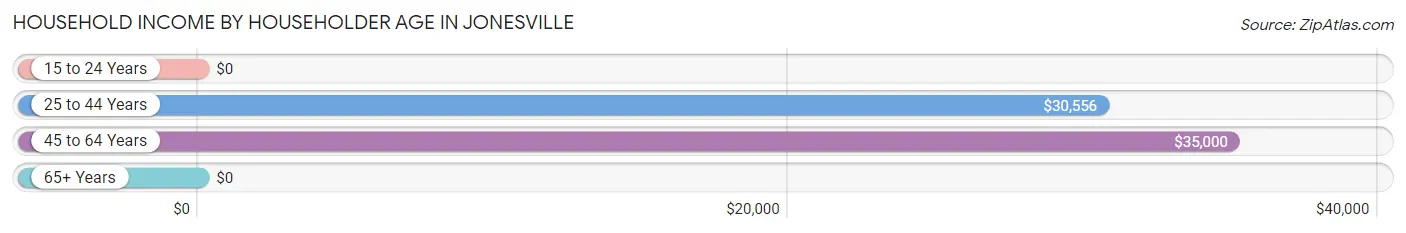
Household Income by Householder Age in Jonesville
The median household income in Jonesville is $36,023, with the highest median household income of $35,000 found in the 45 to 64 years age bracket for the primary householder. A total of 140 households (33.3%) fall into this category. Meanwhile, the 15 to 24 years age bracket for the primary householder has the lowest median household income of $0, with 16 households (3.8%) in this group.
| Income Bracket | # Households | Median Income |
| 15 to 24 Years | 16 (3.8%) | $0 |
| 25 to 44 Years | 80 (19.0%) | $30,556 |
| 45 to 64 Years | 140 (33.3%) | $35,000 |
| 65+ Years | 185 (43.9%) | $0 |
| Total | 421 (100.0%) | $36,023 |
Poverty in Jonesville
Income Below Poverty by Sex and Age in Jonesville
With 14.5% poverty level for males and 23.4% for females among the residents of Jonesville, 45 to 54 year old males and 16 and 17 year old females are the most vulnerable to poverty, with 9 males (23.7%) and 15 females (100.0%) in their respective age groups living below the poverty level.
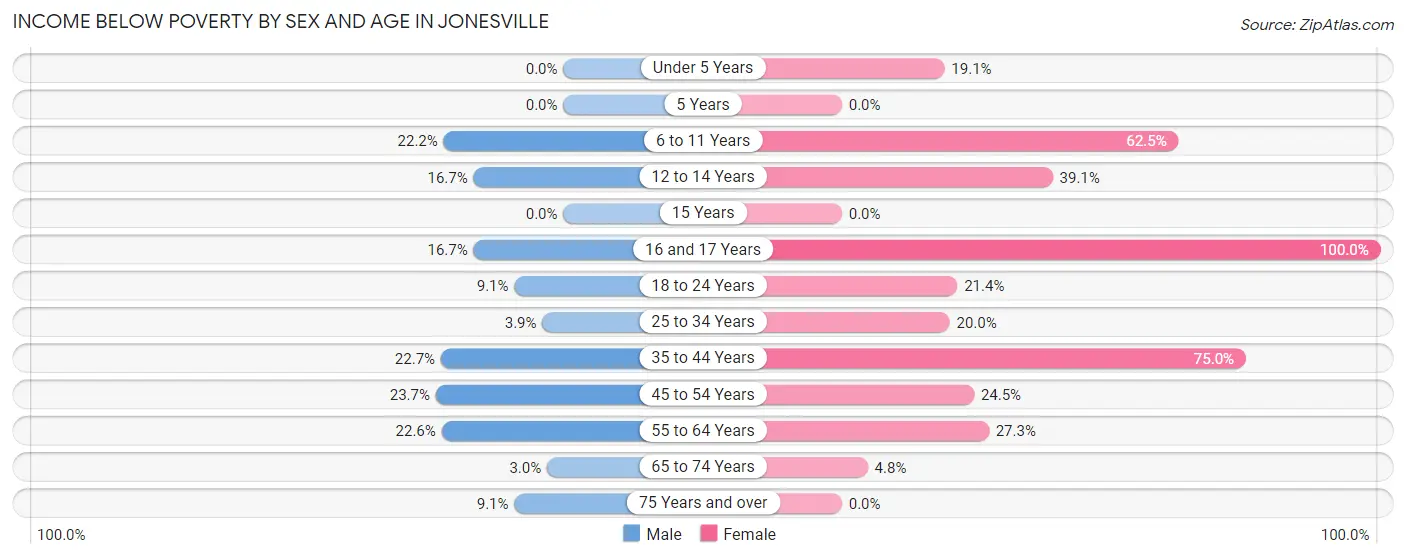
| Age Bracket | Male | Female |
| Under 5 Years | 0 (0.0%) | 4 (19.1%) |
| 5 Years | 0 (0.0%) | 0 (0.0%) |
| 6 to 11 Years | 2 (22.2%) | 15 (62.5%) |
| 12 to 14 Years | 2 (16.7%) | 9 (39.1%) |
| 15 Years | 0 (0.0%) | 0 (0.0%) |
| 16 and 17 Years | 4 (16.7%) | 15 (100.0%) |
| 18 to 24 Years | 2 (9.1%) | 6 (21.4%) |
| 25 to 34 Years | 3 (3.9%) | 10 (20.0%) |
| 35 to 44 Years | 5 (22.7%) | 15 (75.0%) |
| 45 to 54 Years | 9 (23.7%) | 13 (24.5%) |
| 55 to 64 Years | 40 (22.6%) | 9 (27.3%) |
| 65 to 74 Years | 2 (3.0%) | 6 (4.8%) |
| 75 Years and over | 2 (9.1%) | 0 (0.0%) |
| Total | 71 (14.5%) | 102 (23.4%) |
Income Above Poverty by Sex and Age in Jonesville
According to the poverty statistics in Jonesville, males aged under 5 years and females aged 75 years and over are the age groups that are most secure financially, with 100.0% of males and 100.0% of females in these age groups living above the poverty line.
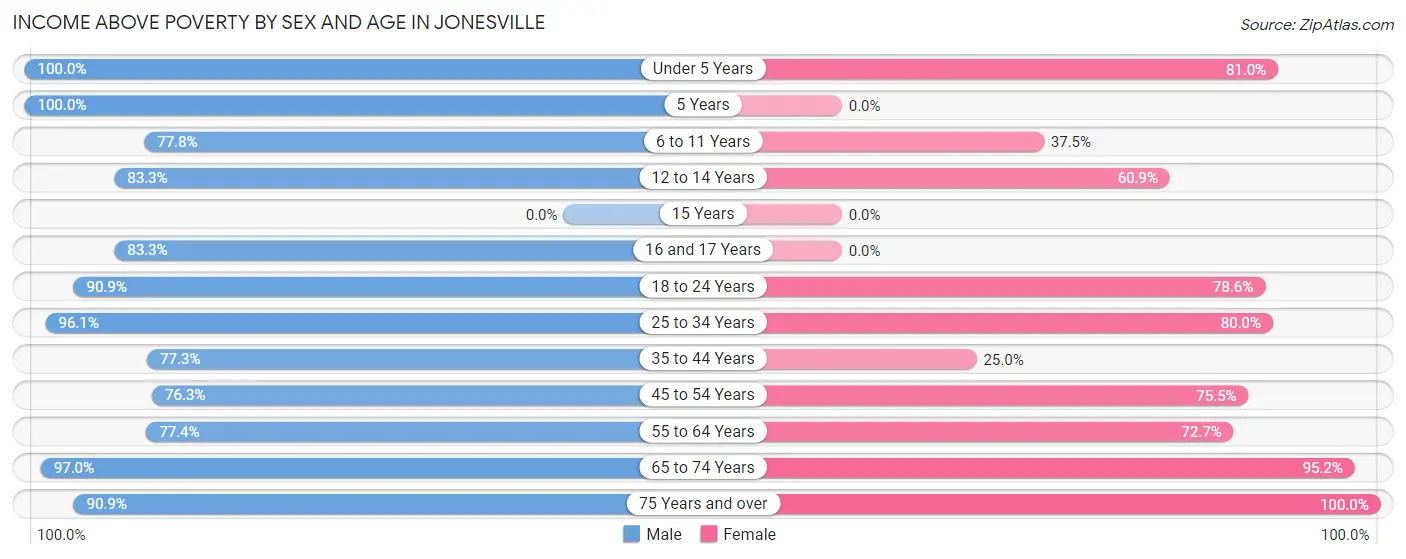
| Age Bracket | Male | Female |
| Under 5 Years | 17 (100.0%) | 17 (80.9%) |
| 5 Years | 3 (100.0%) | 0 (0.0%) |
| 6 to 11 Years | 7 (77.8%) | 9 (37.5%) |
| 12 to 14 Years | 10 (83.3%) | 14 (60.9%) |
| 15 Years | 0 (0.0%) | 0 (0.0%) |
| 16 and 17 Years | 20 (83.3%) | 0 (0.0%) |
| 18 to 24 Years | 20 (90.9%) | 22 (78.6%) |
| 25 to 34 Years | 74 (96.1%) | 40 (80.0%) |
| 35 to 44 Years | 17 (77.3%) | 5 (25.0%) |
| 45 to 54 Years | 29 (76.3%) | 40 (75.5%) |
| 55 to 64 Years | 137 (77.4%) | 24 (72.7%) |
| 65 to 74 Years | 64 (97.0%) | 119 (95.2%) |
| 75 Years and over | 20 (90.9%) | 44 (100.0%) |
| Total | 418 (85.5%) | 334 (76.6%) |
Income Below Poverty Among Married-Couple Families in Jonesville
The poverty statistics for married-couple families in Jonesville show that 7.1% or 12 of the total 170 families live below the poverty line. Families with no children have the highest poverty rate of 9.0%, comprising of 12 families. On the other hand, families with 1 or 2 children have the lowest poverty rate of 0.0%, which includes 0 families.
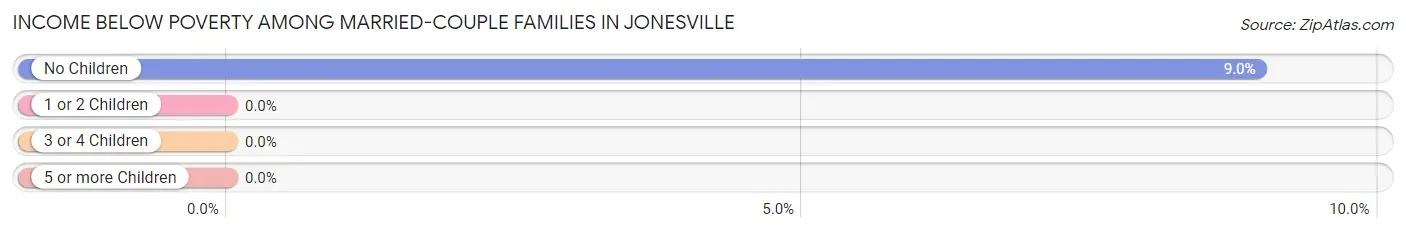
| Children | Above Poverty | Below Poverty |
| No Children | 122 (91.0%) | 12 (9.0%) |
| 1 or 2 Children | 34 (100.0%) | 0 (0.0%) |
| 3 or 4 Children | 2 (100.0%) | 0 (0.0%) |
| 5 or more Children | 0 (0.0%) | 0 (0.0%) |
| Total | 158 (92.9%) | 12 (7.1%) |
Income Below Poverty Among Single-Parent Households in Jonesville
According to the poverty data in Jonesville, 14.0% or 6 single-father households and 49.1% or 28 single-mother households are living below the poverty line. Among single-father households, those with no children have the highest poverty rate, with 2 households (22.2%) experiencing poverty. Likewise, among single-mother households, those with 1 or 2 children have the highest poverty rate, with 28 households (60.9%) falling below the poverty line.
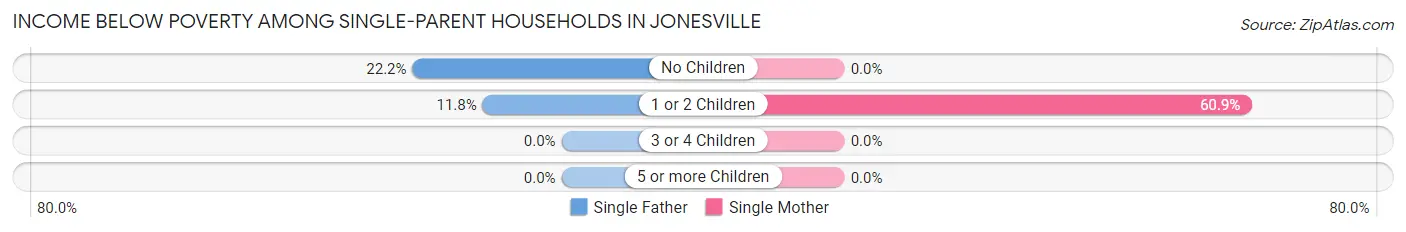
| Children | Single Father | Single Mother |
| No Children | 2 (22.2%) | 0 (0.0%) |
| 1 or 2 Children | 4 (11.8%) | 28 (60.9%) |
| 3 or 4 Children | 0 (0.0%) | 0 (0.0%) |
| 5 or more Children | 0 (0.0%) | 0 (0.0%) |
| Total | 6 (14.0%) | 28 (49.1%) |
Income Below Poverty Among Married-Couple vs Single-Parent Households in Jonesville
The poverty data for Jonesville shows that 12 of the married-couple family households (7.1%) and 34 of the single-parent households (34.0%) are living below the poverty level. Within the married-couple family households, those with no children have the highest poverty rate, with 12 households (9.0%) falling below the poverty line. Among the single-parent households, those with 1 or 2 children have the highest poverty rate, with 32 household (40.0%) living below poverty.
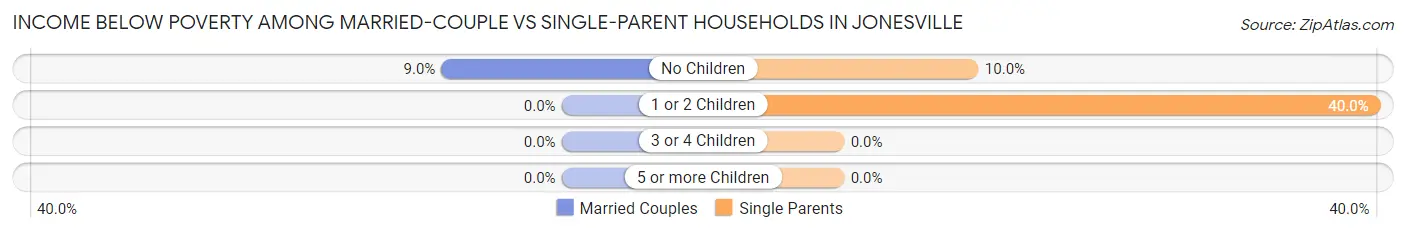
| Children | Married-Couple Families | Single-Parent Households |
| No Children | 12 (9.0%) | 2 (10.0%) |
| 1 or 2 Children | 0 (0.0%) | 32 (40.0%) |
| 3 or 4 Children | 0 (0.0%) | 0 (0.0%) |
| 5 or more Children | 0 (0.0%) | 0 (0.0%) |
| Total | 12 (7.1%) | 34 (34.0%) |
Employment Characteristics in Jonesville
Employment by Class of Employer in Jonesville
Among the 407 employed individuals in Jonesville, private company employees (343 | 84.3%), local government employees (32 | 7.9%), and not-for-profit organizations (21 | 5.2%) make up the most common classes of employment.
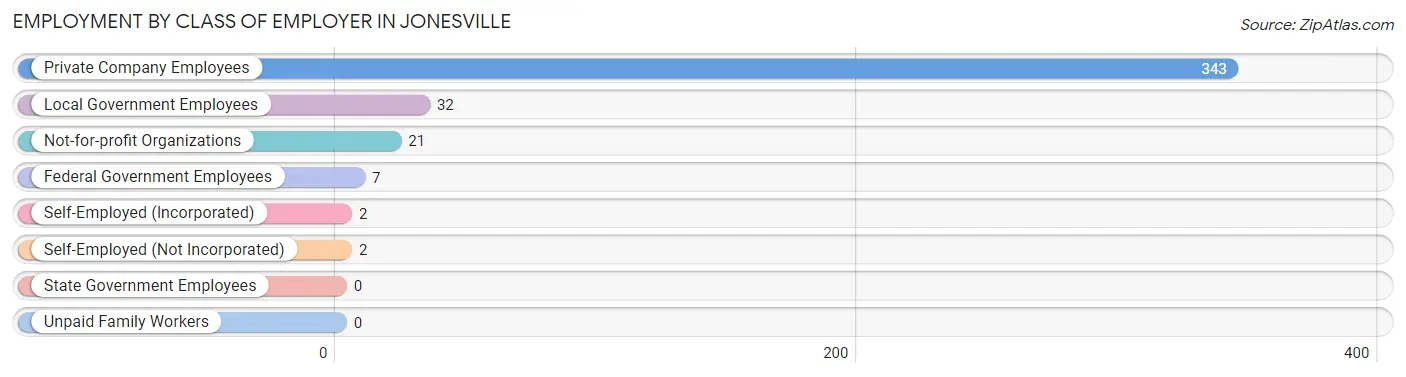
| Employer Class | # Employees | % Employees |
| Private Company Employees | 343 | 84.3% |
| Self-Employed (Incorporated) | 2 | 0.5% |
| Self-Employed (Not Incorporated) | 2 | 0.5% |
| Not-for-profit Organizations | 21 | 5.2% |
| Local Government Employees | 32 | 7.9% |
| State Government Employees | 0 | 0.0% |
| Federal Government Employees | 7 | 1.7% |
| Unpaid Family Workers | 0 | 0.0% |
| Total | 407 | 100.0% |
Employment Status by Age in Jonesville
According to the labor force statistics for Jonesville, out of the total population over 16 years of age (816), 56.5% or 461 individuals are in the labor force, with 6.2% or 29 of them unemployed. The age group with the highest labor force participation rate is 20 to 24 years, with 100.0% or 38 individuals in the labor force. Within the labor force, the 35 to 44 years age range has the highest percentage of unemployed individuals, with 24.2% or 8 of them being unemployed.
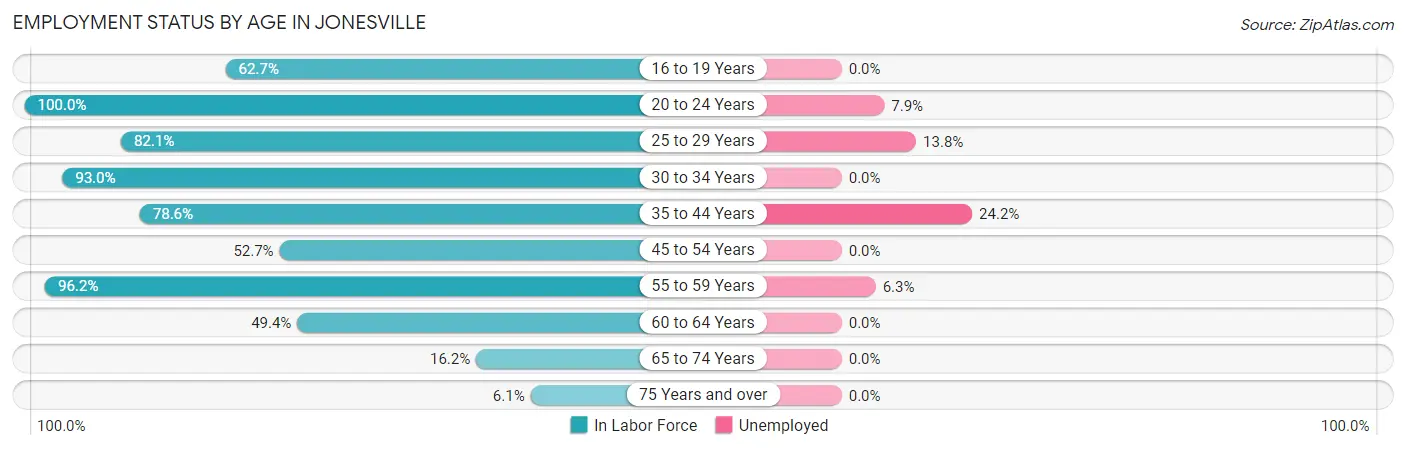
| Age Bracket | In Labor Force | Unemployed |
| 16 to 19 Years | 32 (62.7%) | 0 (0.0%) |
| 20 to 24 Years | 38 (100.0%) | 3 (7.9%) |
| 25 to 29 Years | 69 (82.1%) | 10 (13.8%) |
| 30 to 34 Years | 40 (93.0%) | 0 (0.0%) |
| 35 to 44 Years | 33 (78.6%) | 8 (24.2%) |
| 45 to 54 Years | 48 (52.7%) | 0 (0.0%) |
| 55 to 59 Years | 128 (96.2%) | 8 (6.3%) |
| 60 to 64 Years | 38 (49.4%) | 0 (0.0%) |
| 65 to 74 Years | 31 (16.2%) | 0 (0.0%) |
| 75 Years and over | 4 (6.1%) | 0 (0.0%) |
| Total | 461 (56.5%) | 29 (6.2%) |
Employment Status by Educational Attainment in Jonesville
According to labor force statistics for Jonesville, 75.7% of individuals (356) out of the total population between 25 and 64 years of age (470) are in the labor force, with 7.2% or 26 of them being unemployed. The group with the highest labor force participation rate are those with the educational attainment of bachelor's degree or higher, with 84.6% or 33 individuals in the labor force. Within the labor force, individuals with bachelor's degree or higher education have the highest percentage of unemployment, with 27.3% or 9 of them being unemployed.
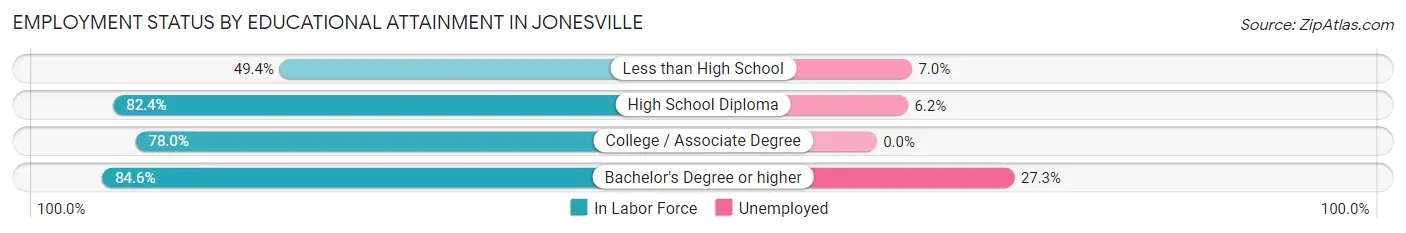
| Educational Attainment | In Labor Force | Unemployed |
| Less than High School | 43 (49.4%) | 6 (7.0%) |
| High School Diploma | 216 (82.4%) | 16 (6.2%) |
| College / Associate Degree | 64 (78.0%) | 0 (0.0%) |
| Bachelor's Degree or higher | 33 (84.6%) | 11 (27.3%) |
| Total | 356 (75.7%) | 34 (7.2%) |
Employment Occupations by Sex in Jonesville
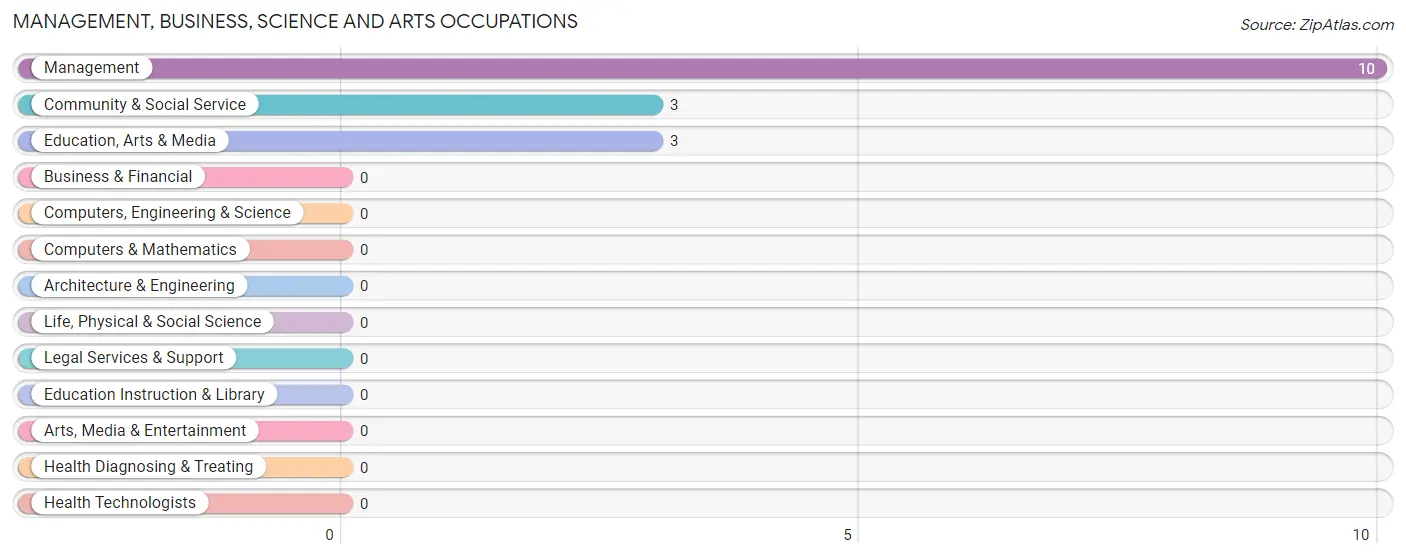
Management, Business, Science and Arts Occupations
The most common Management, Business, Science and Arts occupations in Jonesville are Management (10 | 2.4%), Community & Social Service (3 | 0.7%), and Education, Arts & Media (3 | 0.7%).
Management, Business, Science and Arts Occupations by Sex
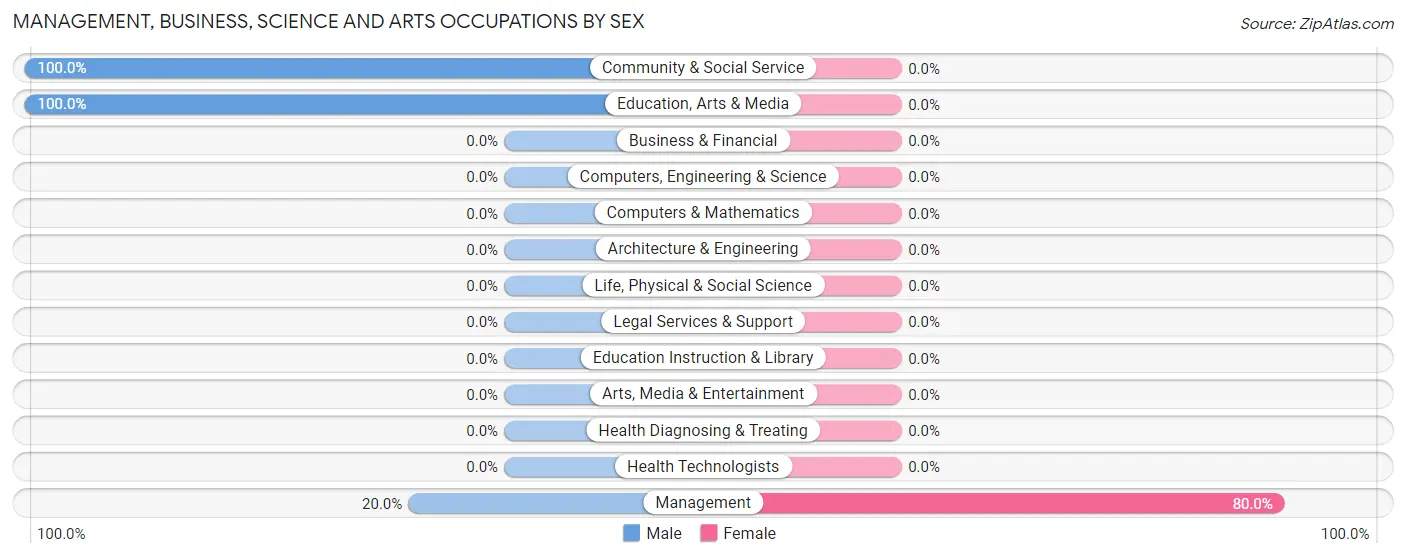
| Occupation | Male | Female |
| Management | 2 (20.0%) | 8 (80.0%) |
| Business & Financial | 0 (0.0%) | 0 (0.0%) |
| Computers, Engineering & Science | 0 (0.0%) | 0 (0.0%) |
| Computers & Mathematics | 0 (0.0%) | 0 (0.0%) |
| Architecture & Engineering | 0 (0.0%) | 0 (0.0%) |
| Life, Physical & Social Science | 0 (0.0%) | 0 (0.0%) |
| Community & Social Service | 3 (100.0%) | 0 (0.0%) |
| Education, Arts & Media | 3 (100.0%) | 0 (0.0%) |
| Legal Services & Support | 0 (0.0%) | 0 (0.0%) |
| Education Instruction & Library | 0 (0.0%) | 0 (0.0%) |
| Arts, Media & Entertainment | 0 (0.0%) | 0 (0.0%) |
| Health Diagnosing & Treating | 0 (0.0%) | 0 (0.0%) |
| Health Technologists | 0 (0.0%) | 0 (0.0%) |
| Total (Category) | 5 (38.5%) | 8 (61.5%) |
| Total (Overall) | 272 (63.8%) | 154 (36.1%) |
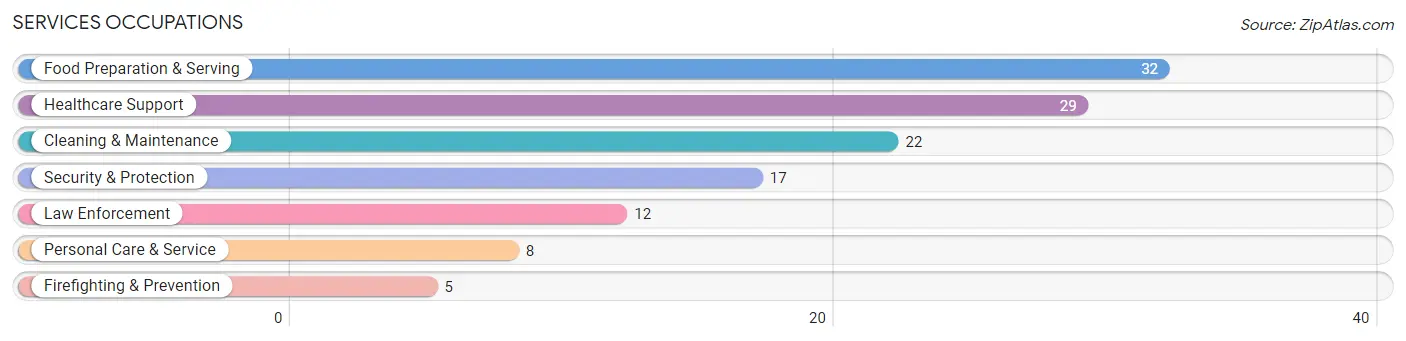
Services Occupations
The most common Services occupations in Jonesville are Food Preparation & Serving (32 | 7.5%), Healthcare Support (29 | 6.8%), Cleaning & Maintenance (22 | 5.2%), Security & Protection (17 | 4.0%), and Law Enforcement (12 | 2.8%).
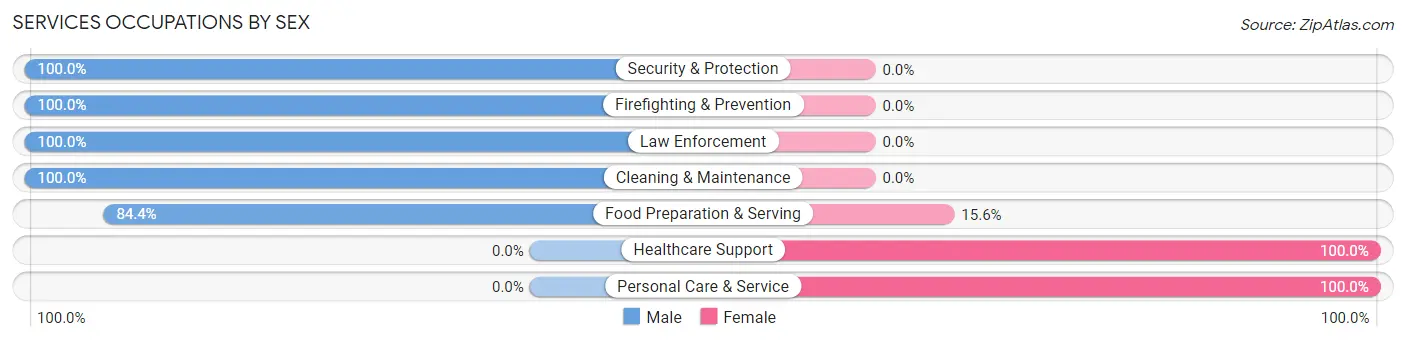
Services Occupations by Sex
Within the Services occupations in Jonesville, the most male-oriented occupations are Security & Protection (100.0%), Firefighting & Prevention (100.0%), and Law Enforcement (100.0%), while the most female-oriented occupations are Healthcare Support (100.0%), Personal Care & Service (100.0%), and Food Preparation & Serving (15.6%).
| Occupation | Male | Female |
| Healthcare Support | 0 (0.0%) | 29 (100.0%) |
| Security & Protection | 17 (100.0%) | 0 (0.0%) |
| Firefighting & Prevention | 5 (100.0%) | 0 (0.0%) |
| Law Enforcement | 12 (100.0%) | 0 (0.0%) |
| Food Preparation & Serving | 27 (84.4%) | 5 (15.6%) |
| Cleaning & Maintenance | 22 (100.0%) | 0 (0.0%) |
| Personal Care & Service | 0 (0.0%) | 8 (100.0%) |
| Total (Category) | 66 (61.1%) | 42 (38.9%) |
| Total (Overall) | 272 (63.8%) | 154 (36.1%) |
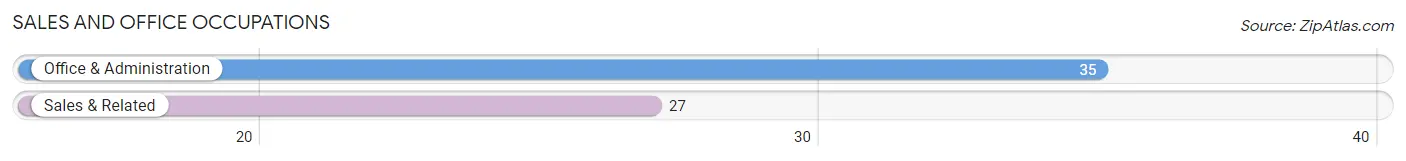
Sales and Office Occupations
The most common Sales and Office occupations in Jonesville are Office & Administration (35 | 8.2%), and Sales & Related (27 | 6.3%).
Sales and Office Occupations by Sex
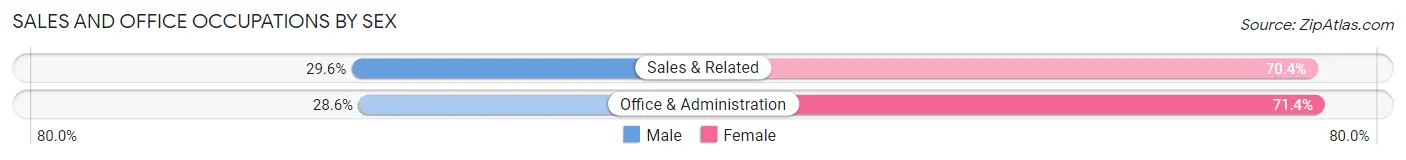
| Occupation | Male | Female |
| Sales & Related | 8 (29.6%) | 19 (70.4%) |
| Office & Administration | 10 (28.6%) | 25 (71.4%) |
| Total (Category) | 18 (29.0%) | 44 (71.0%) |
| Total (Overall) | 272 (63.8%) | 154 (36.1%) |
Natural Resources, Construction and Maintenance Occupations
The most common Natural Resources, Construction and Maintenance occupations in Jonesville are Installation, Maintenance & Repair (42 | 9.9%), Farming, Fishing & Forestry (14 | 3.3%), and Construction & Extraction (14 | 3.3%).

Natural Resources, Construction and Maintenance Occupations by Sex

| Occupation | Male | Female |
| Farming, Fishing & Forestry | 14 (100.0%) | 0 (0.0%) |
| Construction & Extraction | 14 (100.0%) | 0 (0.0%) |
| Installation, Maintenance & Repair | 23 (54.8%) | 19 (45.2%) |
| Total (Category) | 51 (72.9%) | 19 (27.1%) |
| Total (Overall) | 272 (63.8%) | 154 (36.1%) |
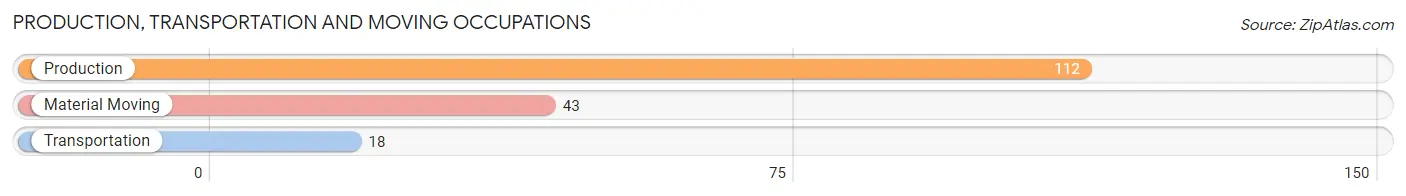
Production, Transportation and Moving Occupations
The most common Production, Transportation and Moving occupations in Jonesville are Production (112 | 26.3%), Material Moving (43 | 10.1%), and Transportation (18 | 4.2%).
Production, Transportation and Moving Occupations by Sex
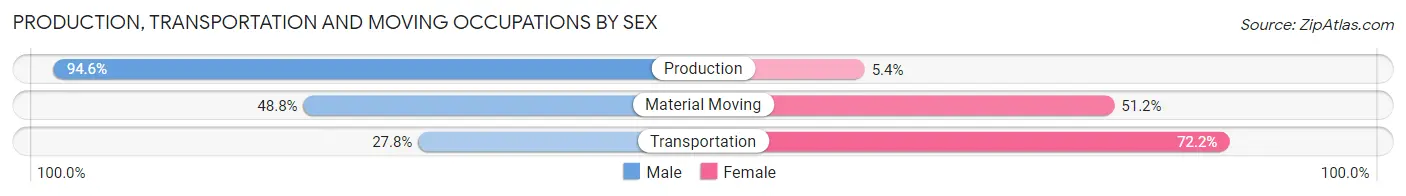
| Occupation | Male | Female |
| Production | 106 (94.6%) | 6 (5.4%) |
| Transportation | 5 (27.8%) | 13 (72.2%) |
| Material Moving | 21 (48.8%) | 22 (51.2%) |
| Total (Category) | 132 (76.3%) | 41 (23.7%) |
| Total (Overall) | 272 (63.8%) | 154 (36.1%) |
Employment Industries by Sex in Jonesville
Employment Industries in Jonesville
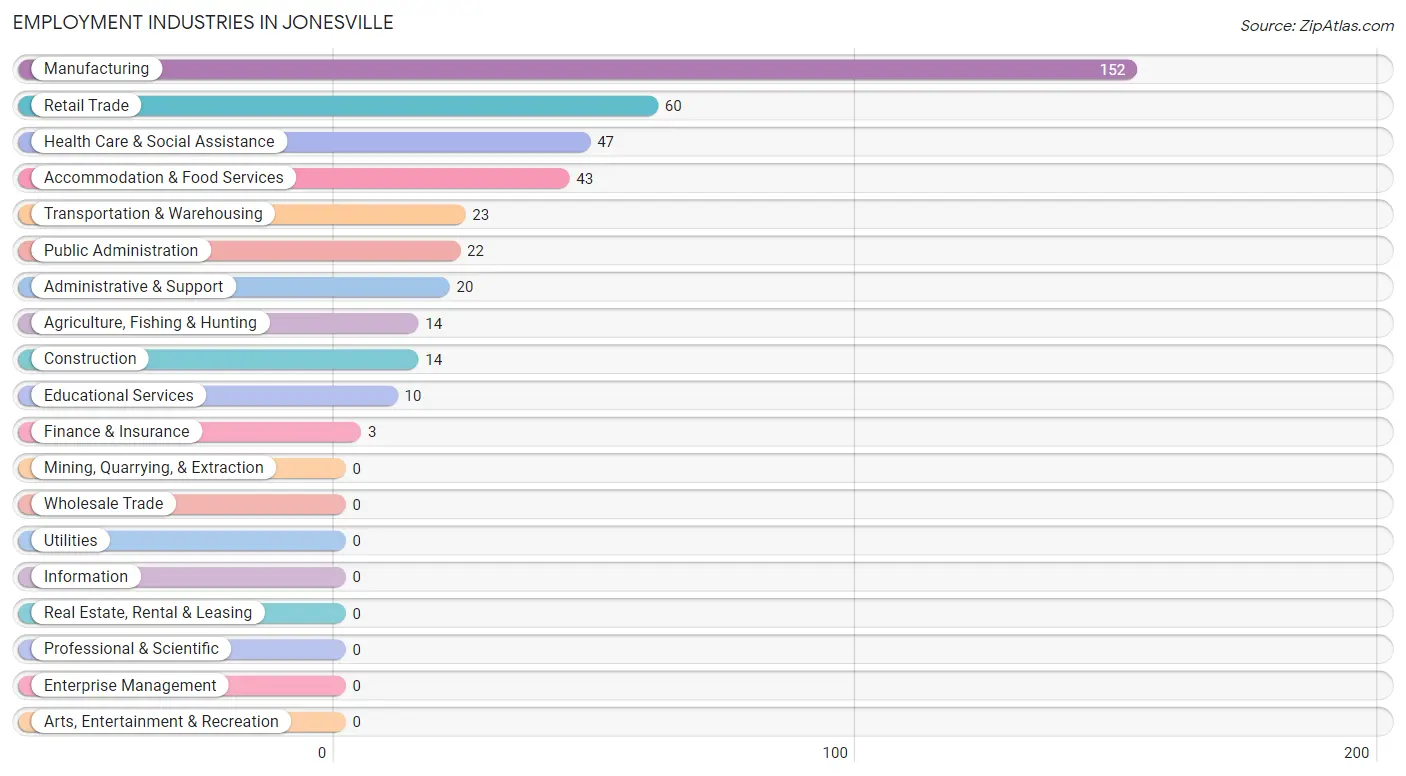
The major employment industries in Jonesville include Manufacturing (152 | 35.7%), Retail Trade (60 | 14.1%), Health Care & Social Assistance (47 | 11.0%), Accommodation & Food Services (43 | 10.1%), and Transportation & Warehousing (23 | 5.4%).
Employment Industries by Sex in Jonesville
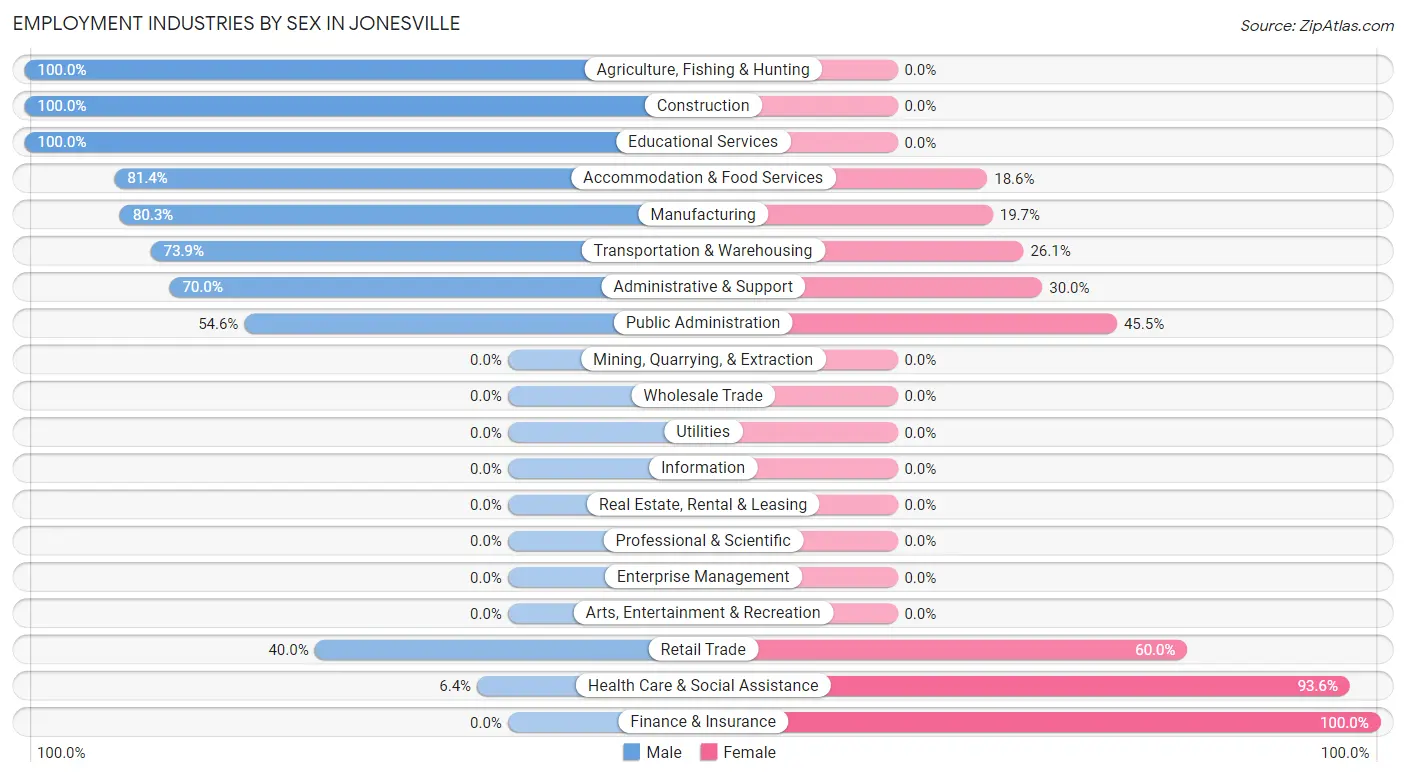
The Jonesville industries that see more men than women are Agriculture, Fishing & Hunting (100.0%), Construction (100.0%), and Educational Services (100.0%), whereas the industries that tend to have a higher number of women are Finance & Insurance (100.0%), Health Care & Social Assistance (93.6%), and Retail Trade (60.0%).
| Industry | Male | Female |
| Agriculture, Fishing & Hunting | 14 (100.0%) | 0 (0.0%) |
| Mining, Quarrying, & Extraction | 0 (0.0%) | 0 (0.0%) |
| Construction | 14 (100.0%) | 0 (0.0%) |
| Manufacturing | 122 (80.3%) | 30 (19.7%) |
| Wholesale Trade | 0 (0.0%) | 0 (0.0%) |
| Retail Trade | 24 (40.0%) | 36 (60.0%) |
| Transportation & Warehousing | 17 (73.9%) | 6 (26.1%) |
| Utilities | 0 (0.0%) | 0 (0.0%) |
| Information | 0 (0.0%) | 0 (0.0%) |
| Finance & Insurance | 0 (0.0%) | 3 (100.0%) |
| Real Estate, Rental & Leasing | 0 (0.0%) | 0 (0.0%) |
| Professional & Scientific | 0 (0.0%) | 0 (0.0%) |
| Enterprise Management | 0 (0.0%) | 0 (0.0%) |
| Administrative & Support | 14 (70.0%) | 6 (30.0%) |
| Educational Services | 10 (100.0%) | 0 (0.0%) |
| Health Care & Social Assistance | 3 (6.4%) | 44 (93.6%) |
| Arts, Entertainment & Recreation | 0 (0.0%) | 0 (0.0%) |
| Accommodation & Food Services | 35 (81.4%) | 8 (18.6%) |
| Public Administration | 12 (54.5%) | 10 (45.5%) |
| Total | 272 (63.8%) | 154 (36.1%) |
Education in Jonesville
School Enrollment in Jonesville
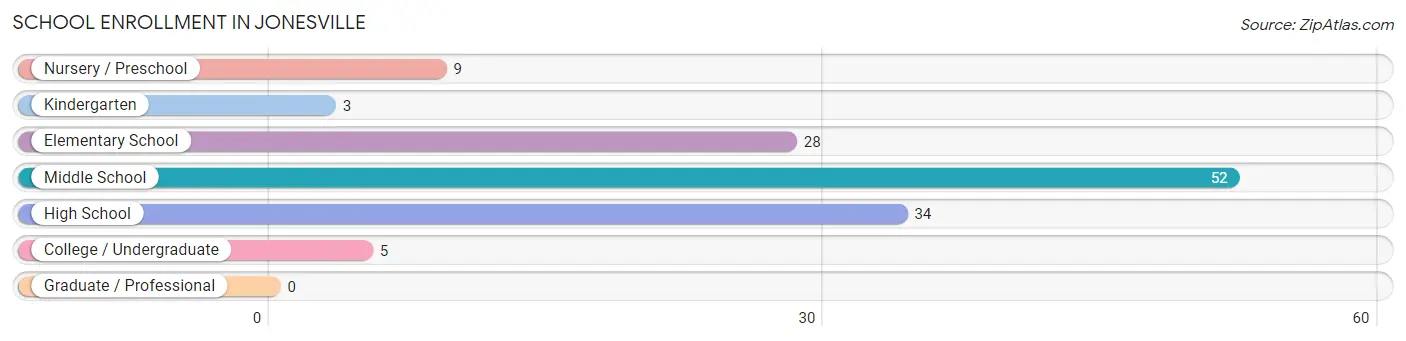
The most common levels of schooling among the 131 students in Jonesville are middle school (52 | 39.7%), high school (34 | 26.0%), and elementary school (28 | 21.4%).
| School Level | # Students | % Students |
| Nursery / Preschool | 9 | 6.9% |
| Kindergarten | 3 | 2.3% |
| Elementary School | 28 | 21.4% |
| Middle School | 52 | 39.7% |
| High School | 34 | 26.0% |
| College / Undergraduate | 5 | 3.8% |
| Graduate / Professional | 0 | 0.0% |
| Total | 131 | 100.0% |
School Enrollment by Age by Funding Source in Jonesville
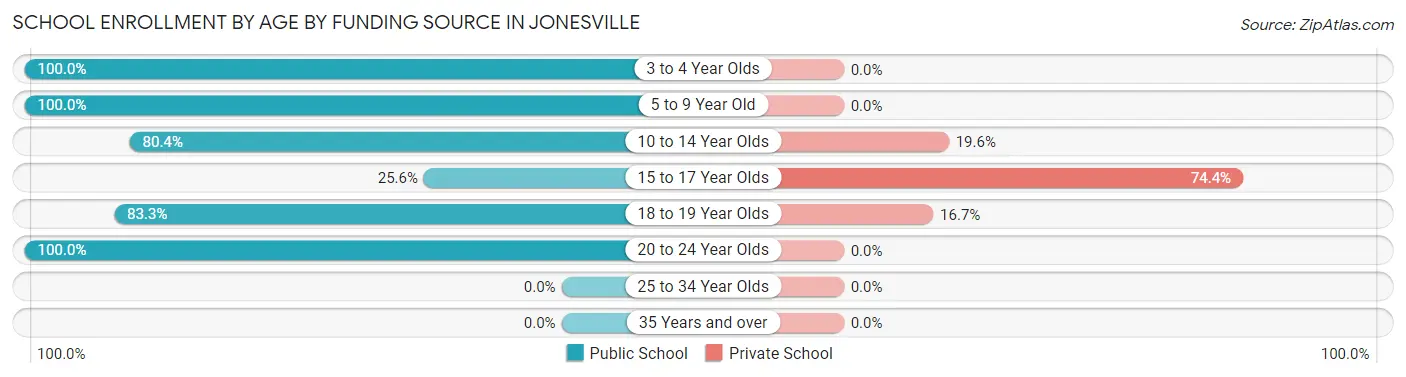
Out of a total of 131 students who are enrolled in schools in Jonesville, 40 (30.5%) attend a private institution, while the remaining 91 (69.5%) are enrolled in public schools. The age group of 15 to 17 year olds has the highest likelihood of being enrolled in private schools, with 29 (74.4% in the age bracket) enrolled. Conversely, the age group of 3 to 4 year olds has the lowest likelihood of being enrolled in a private school, with 9 (100.0% in the age bracket) attending a public institution.
| Age Bracket | Public School | Private School |
| 3 to 4 Year Olds | 9 (100.0%) | 0 (0.0%) |
| 5 to 9 Year Old | 22 (100.0%) | 0 (0.0%) |
| 10 to 14 Year Olds | 37 (80.4%) | 9 (19.6%) |
| 15 to 17 Year Olds | 10 (25.6%) | 29 (74.4%) |
| 18 to 19 Year Olds | 10 (83.3%) | 2 (16.7%) |
| 20 to 24 Year Olds | 3 (100.0%) | 0 (0.0%) |
| 25 to 34 Year Olds | 0 (0.0%) | 0 (0.0%) |
| 35 Years and over | 0 (0.0%) | 0 (0.0%) |
| Total | 91 (69.5%) | 40 (30.5%) |
Educational Attainment by Field of Study in Jonesville
Bio, nature & agricultural (17 | 32.7%), liberal arts & history (15 | 28.8%), business (11 | 21.1%), social sciences (8 | 15.4%), and multidisciplinary studies (1 | 1.9%) are the most common fields of study among 52 individuals in Jonesville who have obtained a bachelor's degree or higher.
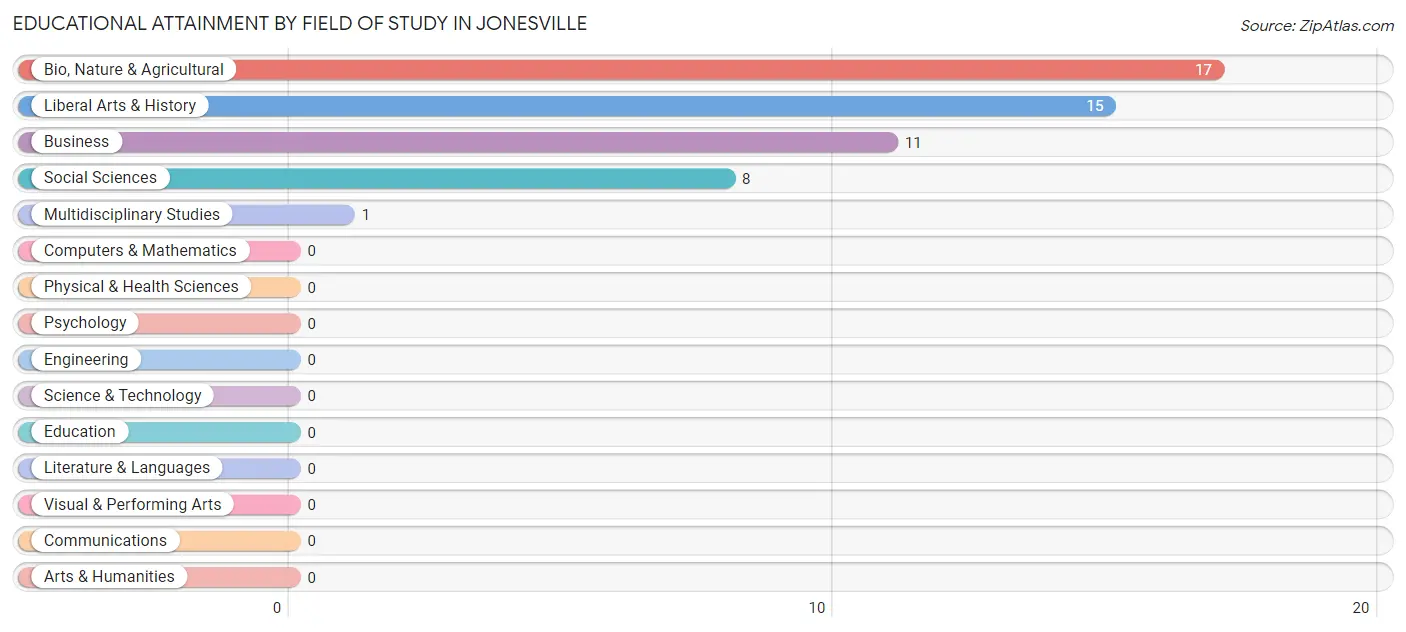
| Field of Study | # Graduates | % Graduates |
| Computers & Mathematics | 0 | 0.0% |
| Bio, Nature & Agricultural | 17 | 32.7% |
| Physical & Health Sciences | 0 | 0.0% |
| Psychology | 0 | 0.0% |
| Social Sciences | 8 | 15.4% |
| Engineering | 0 | 0.0% |
| Multidisciplinary Studies | 1 | 1.9% |
| Science & Technology | 0 | 0.0% |
| Business | 11 | 21.1% |
| Education | 0 | 0.0% |
| Literature & Languages | 0 | 0.0% |
| Liberal Arts & History | 15 | 28.8% |
| Visual & Performing Arts | 0 | 0.0% |
| Communications | 0 | 0.0% |
| Arts & Humanities | 0 | 0.0% |
| Total | 52 | 100.0% |
Transportation & Commute in Jonesville
Vehicle Availability by Sex in Jonesville
The most prevalent vehicle ownership categories in Jonesville are males with 3 vehicles (130, accounting for 52.0%) and females with 3 vehicles (4, making up 87.8%).
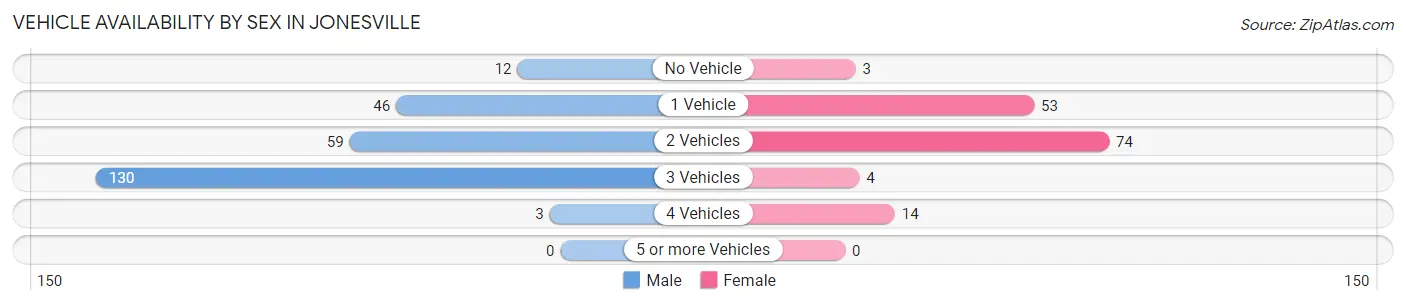
| Vehicles Available | Male | Female |
| No Vehicle | 12 (4.8%) | 3 (2.0%) |
| 1 Vehicle | 46 (18.4%) | 53 (35.8%) |
| 2 Vehicles | 59 (23.6%) | 74 (50.0%) |
| 3 Vehicles | 130 (52.0%) | 4 (2.7%) |
| 4 Vehicles | 3 (1.2%) | 14 (9.5%) |
| 5 or more Vehicles | 0 (0.0%) | 0 (0.0%) |
| Total | 250 (100.0%) | 148 (100.0%) |
Commute Time in Jonesville
The most frequently occuring commute durations in Jonesville are 15 to 19 minutes (123 commuters, 30.4%), 10 to 14 minutes (67 commuters, 16.5%), and 20 to 24 minutes (51 commuters, 12.6%).
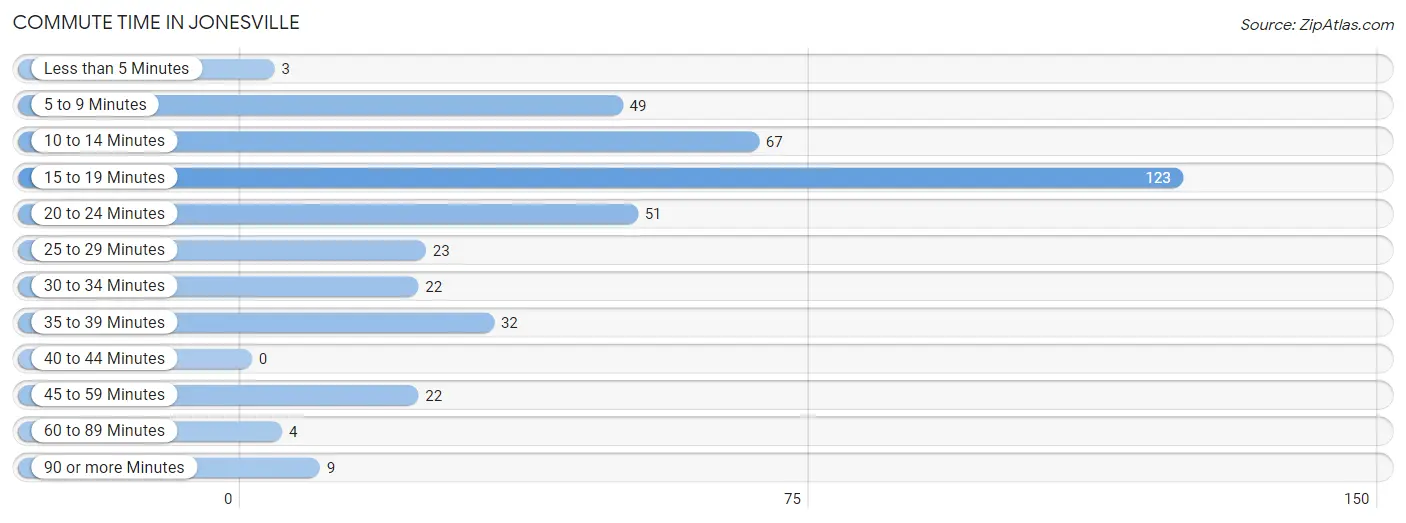
| Commute Time | # Commuters | % Commuters |
| Less than 5 Minutes | 3 | 0.7% |
| 5 to 9 Minutes | 49 | 12.1% |
| 10 to 14 Minutes | 67 | 16.5% |
| 15 to 19 Minutes | 123 | 30.4% |
| 20 to 24 Minutes | 51 | 12.6% |
| 25 to 29 Minutes | 23 | 5.7% |
| 30 to 34 Minutes | 22 | 5.4% |
| 35 to 39 Minutes | 32 | 7.9% |
| 40 to 44 Minutes | 0 | 0.0% |
| 45 to 59 Minutes | 22 | 5.4% |
| 60 to 89 Minutes | 4 | 1.0% |
| 90 or more Minutes | 9 | 2.2% |
Commute Time by Sex in Jonesville
The most common commute times in Jonesville are 15 to 19 minutes (104 commuters, 40.5%) for males and 20 to 24 minutes (31 commuters, 20.9%) for females.
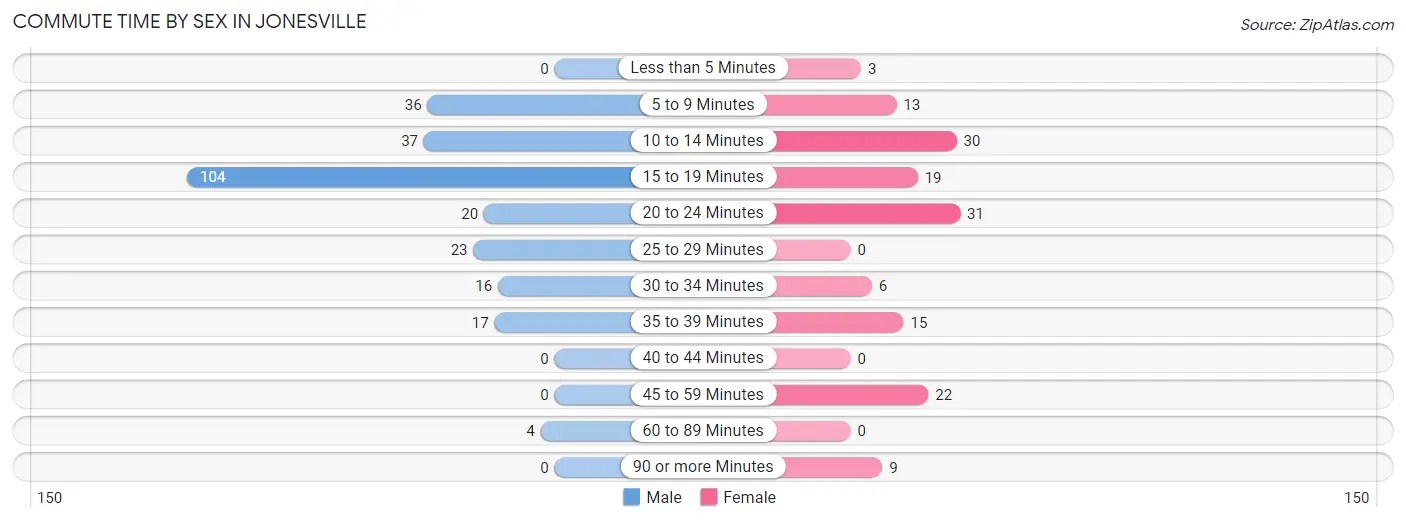
| Commute Time | Male | Female |
| Less than 5 Minutes | 0 (0.0%) | 3 (2.0%) |
| 5 to 9 Minutes | 36 (14.0%) | 13 (8.8%) |
| 10 to 14 Minutes | 37 (14.4%) | 30 (20.3%) |
| 15 to 19 Minutes | 104 (40.5%) | 19 (12.8%) |
| 20 to 24 Minutes | 20 (7.8%) | 31 (20.9%) |
| 25 to 29 Minutes | 23 (8.9%) | 0 (0.0%) |
| 30 to 34 Minutes | 16 (6.2%) | 6 (4.1%) |
| 35 to 39 Minutes | 17 (6.6%) | 15 (10.1%) |
| 40 to 44 Minutes | 0 (0.0%) | 0 (0.0%) |
| 45 to 59 Minutes | 0 (0.0%) | 22 (14.9%) |
| 60 to 89 Minutes | 4 (1.6%) | 0 (0.0%) |
| 90 or more Minutes | 0 (0.0%) | 9 (6.1%) |
Time of Departure to Work by Sex in Jonesville
The most frequent times of departure to work in Jonesville are 6:30 AM to 6:59 AM (106, 41.2%) for males and 6:30 AM to 6:59 AM (44, 29.7%) for females.
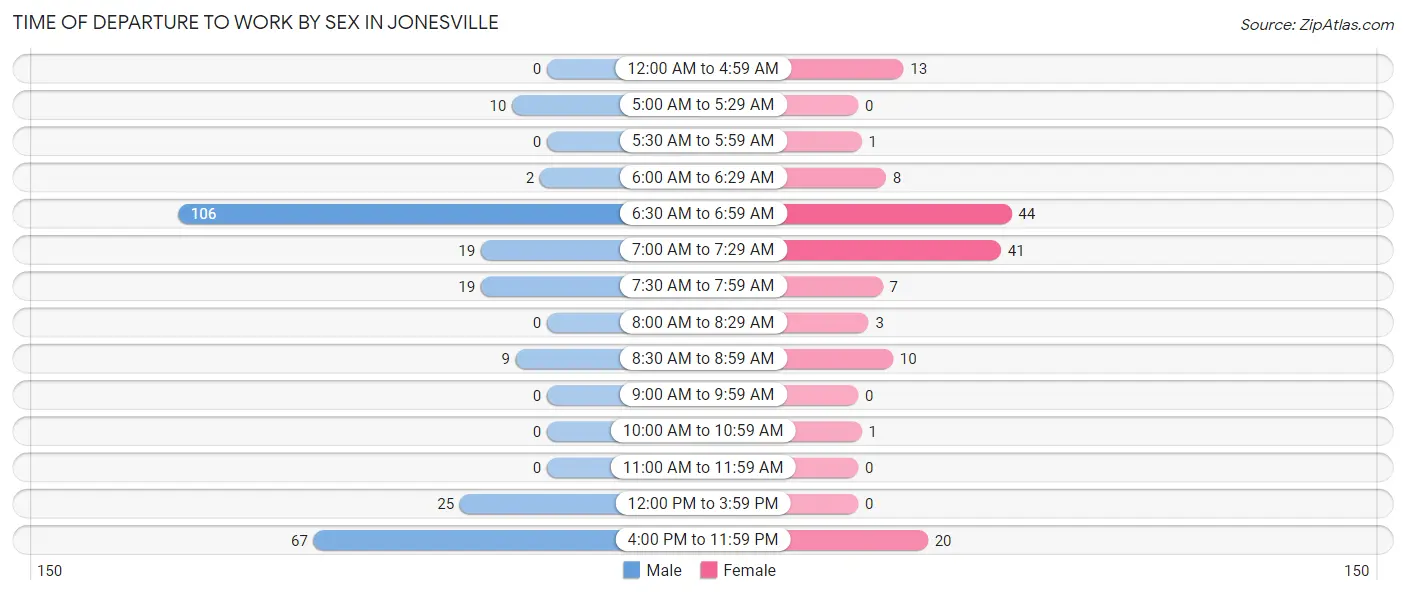
| Time of Departure | Male | Female |
| 12:00 AM to 4:59 AM | 0 (0.0%) | 13 (8.8%) |
| 5:00 AM to 5:29 AM | 10 (3.9%) | 0 (0.0%) |
| 5:30 AM to 5:59 AM | 0 (0.0%) | 1 (0.7%) |
| 6:00 AM to 6:29 AM | 2 (0.8%) | 8 (5.4%) |
| 6:30 AM to 6:59 AM | 106 (41.2%) | 44 (29.7%) |
| 7:00 AM to 7:29 AM | 19 (7.4%) | 41 (27.7%) |
| 7:30 AM to 7:59 AM | 19 (7.4%) | 7 (4.7%) |
| 8:00 AM to 8:29 AM | 0 (0.0%) | 3 (2.0%) |
| 8:30 AM to 8:59 AM | 9 (3.5%) | 10 (6.8%) |
| 9:00 AM to 9:59 AM | 0 (0.0%) | 0 (0.0%) |
| 10:00 AM to 10:59 AM | 0 (0.0%) | 1 (0.7%) |
| 11:00 AM to 11:59 AM | 0 (0.0%) | 0 (0.0%) |
| 12:00 PM to 3:59 PM | 25 (9.7%) | 0 (0.0%) |
| 4:00 PM to 11:59 PM | 67 (26.1%) | 20 (13.5%) |
| Total | 257 (100.0%) | 148 (100.0%) |
Housing Occupancy in Jonesville
Occupancy by Ownership in Jonesville
Of the total 421 dwellings in Jonesville, owner-occupied units account for 305 (72.5%), while renter-occupied units make up 116 (27.6%).
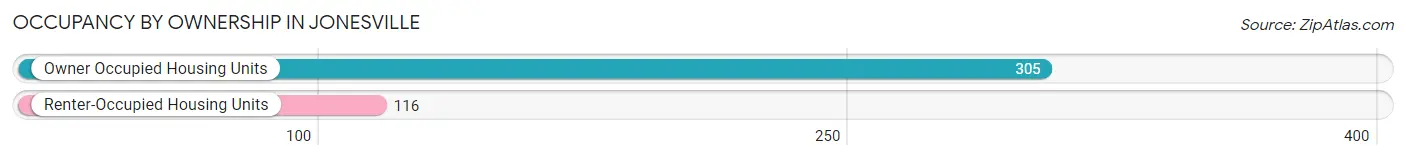
| Occupancy | # Housing Units | % Housing Units |
| Owner Occupied Housing Units | 305 | 72.5% |
| Renter-Occupied Housing Units | 116 | 27.6% |
| Total Occupied Housing Units | 421 | 100.0% |
Occupancy by Household Size in Jonesville
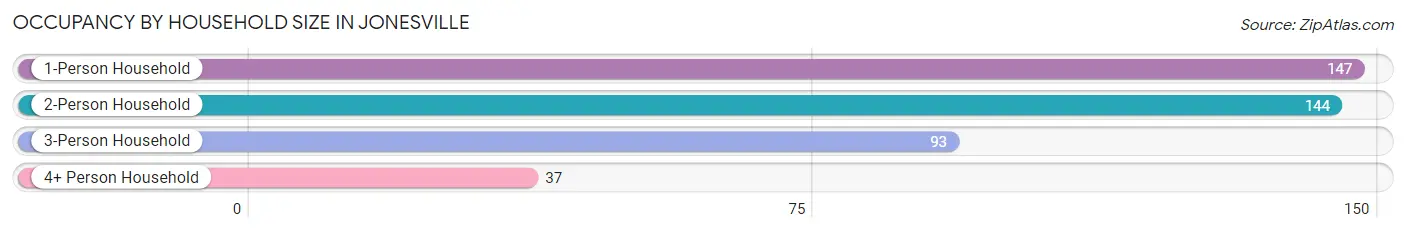
| Household Size | # Housing Units | % Housing Units |
| 1-Person Household | 147 | 34.9% |
| 2-Person Household | 144 | 34.2% |
| 3-Person Household | 93 | 22.1% |
| 4+ Person Household | 37 | 8.8% |
| Total Housing Units | 421 | 100.0% |
Occupancy by Ownership by Household Size in Jonesville
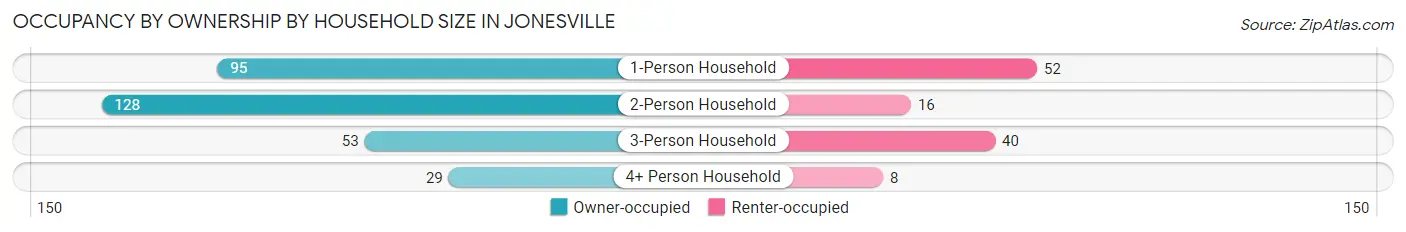
| Household Size | Owner-occupied | Renter-occupied |
| 1-Person Household | 95 (64.6%) | 52 (35.4%) |
| 2-Person Household | 128 (88.9%) | 16 (11.1%) |
| 3-Person Household | 53 (57.0%) | 40 (43.0%) |
| 4+ Person Household | 29 (78.4%) | 8 (21.6%) |
| Total Housing Units | 305 (72.5%) | 116 (27.6%) |
Occupancy by Educational Attainment in Jonesville
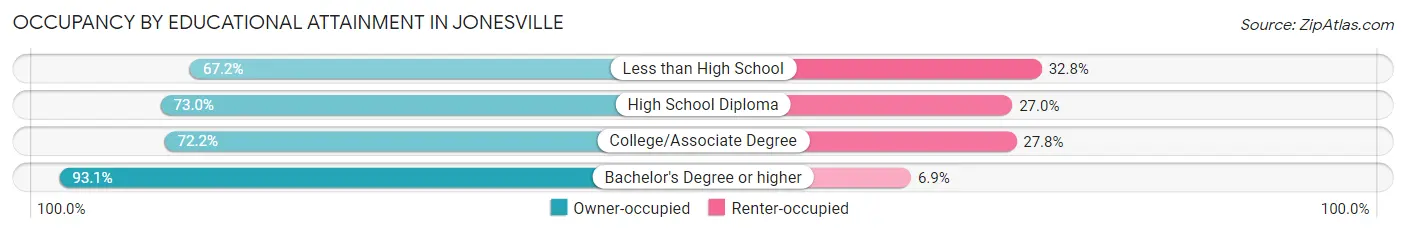
| Household Size | Owner-occupied | Renter-occupied |
| Less than High School | 88 (67.2%) | 43 (32.8%) |
| High School Diploma | 138 (73.0%) | 51 (27.0%) |
| College/Associate Degree | 52 (72.2%) | 20 (27.8%) |
| Bachelor's Degree or higher | 27 (93.1%) | 2 (6.9%) |
Occupancy by Age of Householder in Jonesville
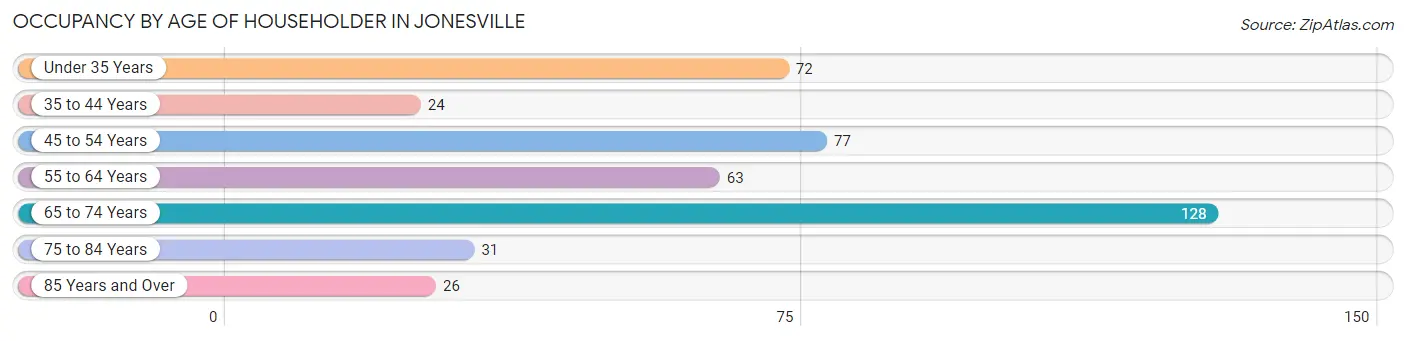
| Age Bracket | # Households | % Households |
| Under 35 Years | 72 | 17.1% |
| 35 to 44 Years | 24 | 5.7% |
| 45 to 54 Years | 77 | 18.3% |
| 55 to 64 Years | 63 | 15.0% |
| 65 to 74 Years | 128 | 30.4% |
| 75 to 84 Years | 31 | 7.4% |
| 85 Years and Over | 26 | 6.2% |
| Total | 421 | 100.0% |
Housing Finances in Jonesville
Median Income by Occupancy in Jonesville
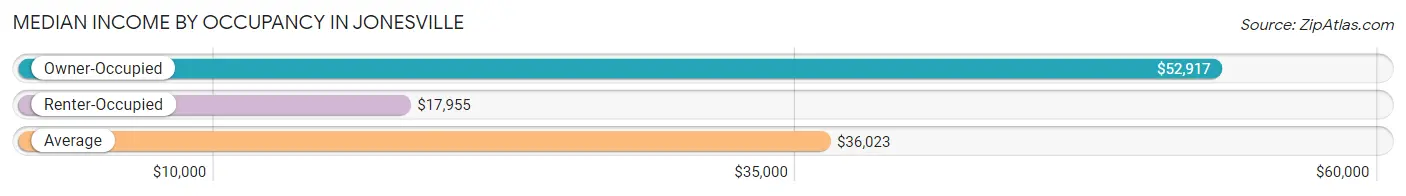
| Occupancy Type | # Households | Median Income |
| Owner-Occupied | 305 (72.5%) | $52,917 |
| Renter-Occupied | 116 (27.6%) | $17,955 |
| Average | 421 (100.0%) | $36,023 |
Occupancy by Householder Income Bracket in Jonesville
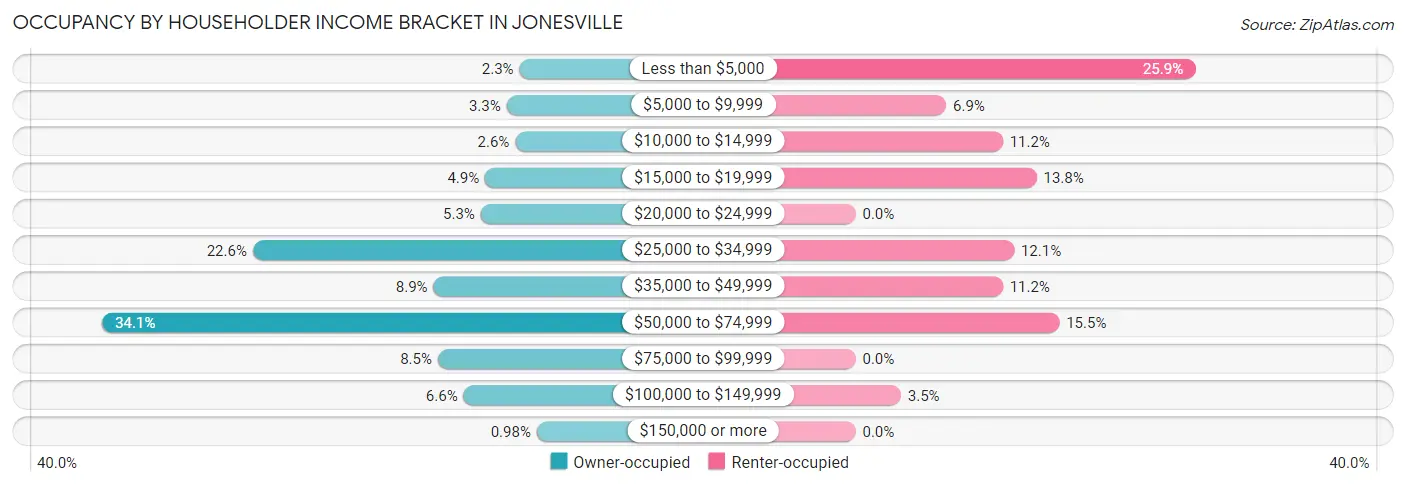
| Income Bracket | Owner-occupied | Renter-occupied |
| Less than $5,000 | 7 (2.3%) | 30 (25.9%) |
| $5,000 to $9,999 | 10 (3.3%) | 8 (6.9%) |
| $10,000 to $14,999 | 8 (2.6%) | 13 (11.2%) |
| $15,000 to $19,999 | 15 (4.9%) | 16 (13.8%) |
| $20,000 to $24,999 | 16 (5.2%) | 0 (0.0%) |
| $25,000 to $34,999 | 69 (22.6%) | 14 (12.1%) |
| $35,000 to $49,999 | 27 (8.8%) | 13 (11.2%) |
| $50,000 to $74,999 | 104 (34.1%) | 18 (15.5%) |
| $75,000 to $99,999 | 26 (8.5%) | 0 (0.0%) |
| $100,000 to $149,999 | 20 (6.6%) | 4 (3.5%) |
| $150,000 or more | 3 (1.0%) | 0 (0.0%) |
| Total | 305 (100.0%) | 116 (100.0%) |
Monthly Housing Cost Tiers in Jonesville
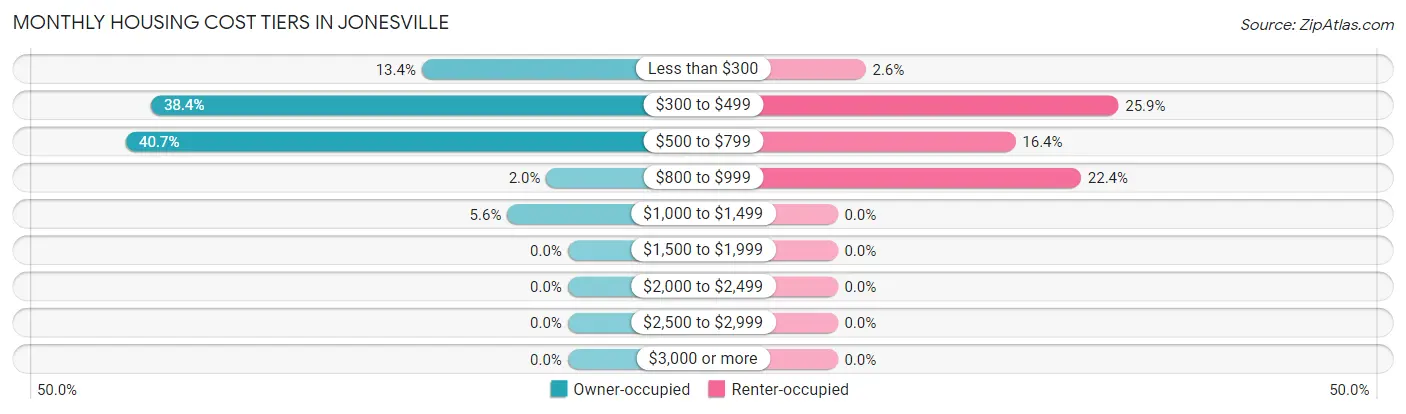
| Monthly Cost | Owner-occupied | Renter-occupied |
| Less than $300 | 41 (13.4%) | 3 (2.6%) |
| $300 to $499 | 117 (38.4%) | 30 (25.9%) |
| $500 to $799 | 124 (40.7%) | 19 (16.4%) |
| $800 to $999 | 6 (2.0%) | 26 (22.4%) |
| $1,000 to $1,499 | 17 (5.6%) | 0 (0.0%) |
| $1,500 to $1,999 | 0 (0.0%) | 0 (0.0%) |
| $2,000 to $2,499 | 0 (0.0%) | 0 (0.0%) |
| $2,500 to $2,999 | 0 (0.0%) | 0 (0.0%) |
| $3,000 or more | 0 (0.0%) | 0 (0.0%) |
| Total | 305 (100.0%) | 116 (100.0%) |
Physical Housing Characteristics in Jonesville
Housing Structures in Jonesville
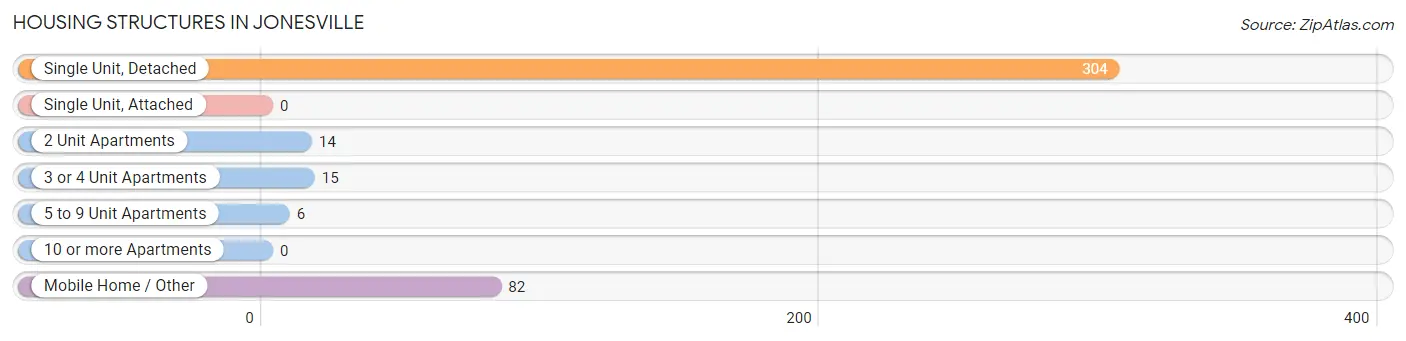
| Structure Type | # Housing Units | % Housing Units |
| Single Unit, Detached | 304 | 72.2% |
| Single Unit, Attached | 0 | 0.0% |
| 2 Unit Apartments | 14 | 3.3% |
| 3 or 4 Unit Apartments | 15 | 3.6% |
| 5 to 9 Unit Apartments | 6 | 1.4% |
| 10 or more Apartments | 0 | 0.0% |
| Mobile Home / Other | 82 | 19.5% |
| Total | 421 | 100.0% |
Housing Structures by Occupancy in Jonesville
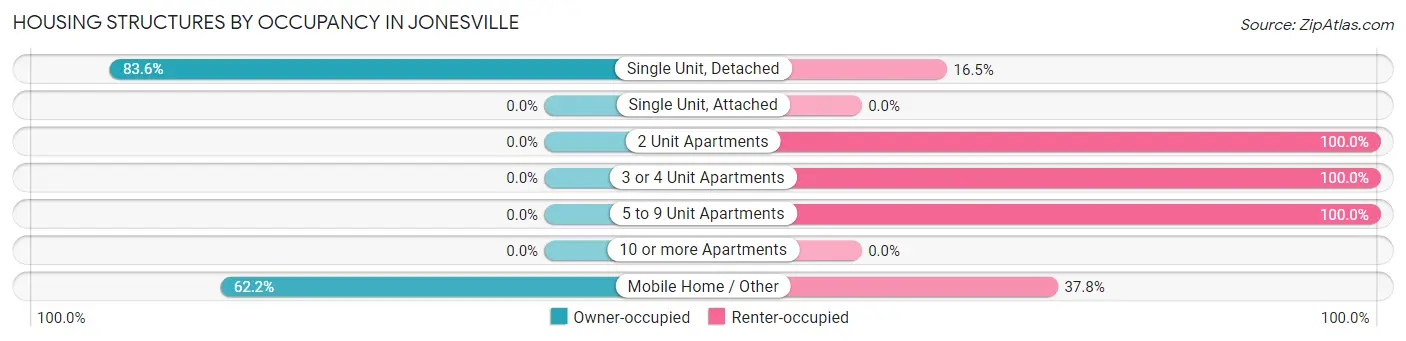
| Structure Type | Owner-occupied | Renter-occupied |
| Single Unit, Detached | 254 (83.6%) | 50 (16.5%) |
| Single Unit, Attached | 0 (0.0%) | 0 (0.0%) |
| 2 Unit Apartments | 0 (0.0%) | 14 (100.0%) |
| 3 or 4 Unit Apartments | 0 (0.0%) | 15 (100.0%) |
| 5 to 9 Unit Apartments | 0 (0.0%) | 6 (100.0%) |
| 10 or more Apartments | 0 (0.0%) | 0 (0.0%) |
| Mobile Home / Other | 51 (62.2%) | 31 (37.8%) |
| Total | 305 (72.5%) | 116 (27.6%) |
Housing Structures by Number of Rooms in Jonesville
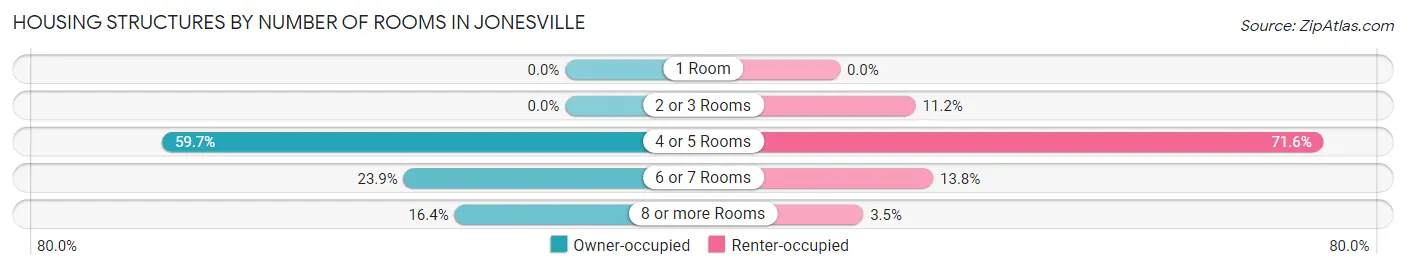
| Number of Rooms | Owner-occupied | Renter-occupied |
| 1 Room | 0 (0.0%) | 0 (0.0%) |
| 2 or 3 Rooms | 0 (0.0%) | 13 (11.2%) |
| 4 or 5 Rooms | 182 (59.7%) | 83 (71.6%) |
| 6 or 7 Rooms | 73 (23.9%) | 16 (13.8%) |
| 8 or more Rooms | 50 (16.4%) | 4 (3.5%) |
| Total | 305 (100.0%) | 116 (100.0%) |
Housing Structure by Heating Type in Jonesville
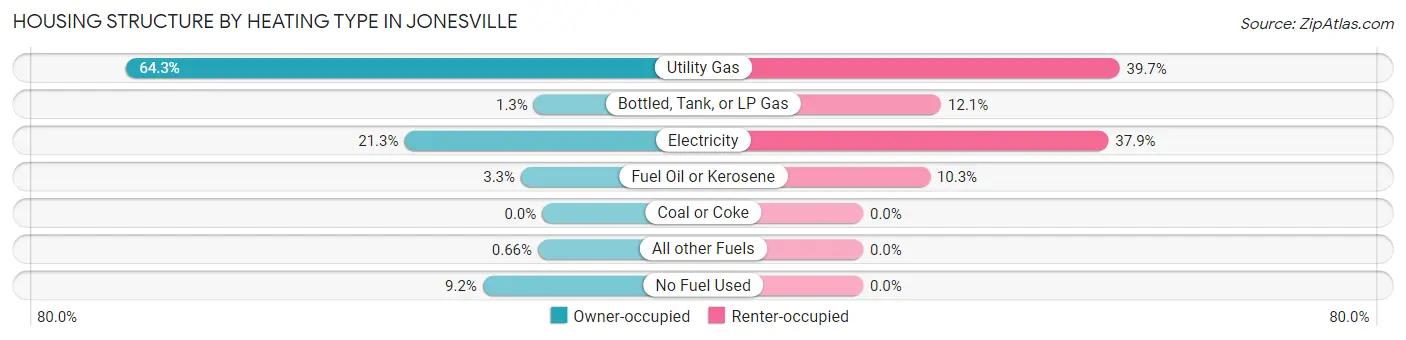
| Heating Type | Owner-occupied | Renter-occupied |
| Utility Gas | 196 (64.3%) | 46 (39.7%) |
| Bottled, Tank, or LP Gas | 4 (1.3%) | 14 (12.1%) |
| Electricity | 65 (21.3%) | 44 (37.9%) |
| Fuel Oil or Kerosene | 10 (3.3%) | 12 (10.3%) |
| Coal or Coke | 0 (0.0%) | 0 (0.0%) |
| All other Fuels | 2 (0.7%) | 0 (0.0%) |
| No Fuel Used | 28 (9.2%) | 0 (0.0%) |
| Total | 305 (100.0%) | 116 (100.0%) |
Household Vehicle Usage in Jonesville
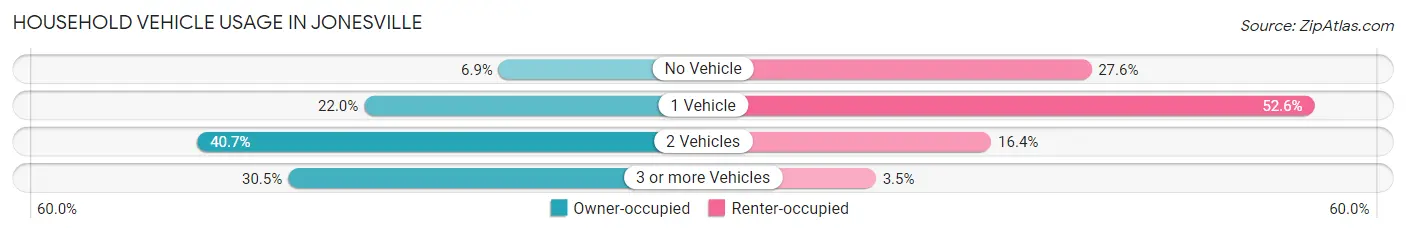
| Vehicles per Household | Owner-occupied | Renter-occupied |
| No Vehicle | 21 (6.9%) | 32 (27.6%) |
| 1 Vehicle | 67 (22.0%) | 61 (52.6%) |
| 2 Vehicles | 124 (40.7%) | 19 (16.4%) |
| 3 or more Vehicles | 93 (30.5%) | 4 (3.5%) |
| Total | 305 (100.0%) | 116 (100.0%) |
Real Estate & Mortgages in Jonesville
Real Estate and Mortgage Overview in Jonesville
| Characteristic | Without Mortgage | With Mortgage |
| Housing Units | 248 | 57 |
| Median Property Value | $58,600 | $79,500 |
| Median Household Income | $41,750 | $0 |
| Monthly Housing Costs | $424 | $0 |
| Real Estate Taxes | $641 | $9 |
Property Value by Mortgage Status in Jonesville
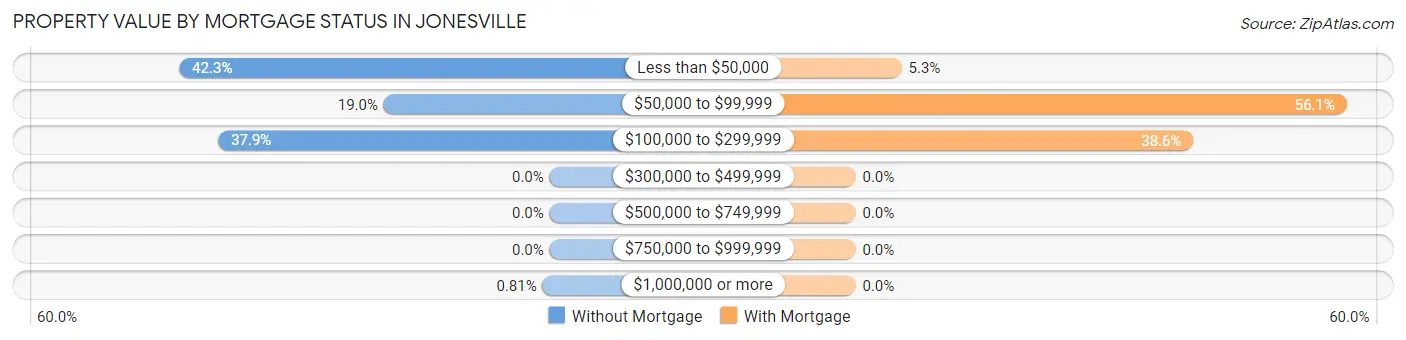
| Property Value | Without Mortgage | With Mortgage |
| Less than $50,000 | 105 (42.3%) | 3 (5.3%) |
| $50,000 to $99,999 | 47 (19.0%) | 32 (56.1%) |
| $100,000 to $299,999 | 94 (37.9%) | 22 (38.6%) |
| $300,000 to $499,999 | 0 (0.0%) | 0 (0.0%) |
| $500,000 to $749,999 | 0 (0.0%) | 0 (0.0%) |
| $750,000 to $999,999 | 0 (0.0%) | 0 (0.0%) |
| $1,000,000 or more | 2 (0.8%) | 0 (0.0%) |
| Total | 248 (100.0%) | 57 (100.0%) |
Household Income by Mortgage Status in Jonesville
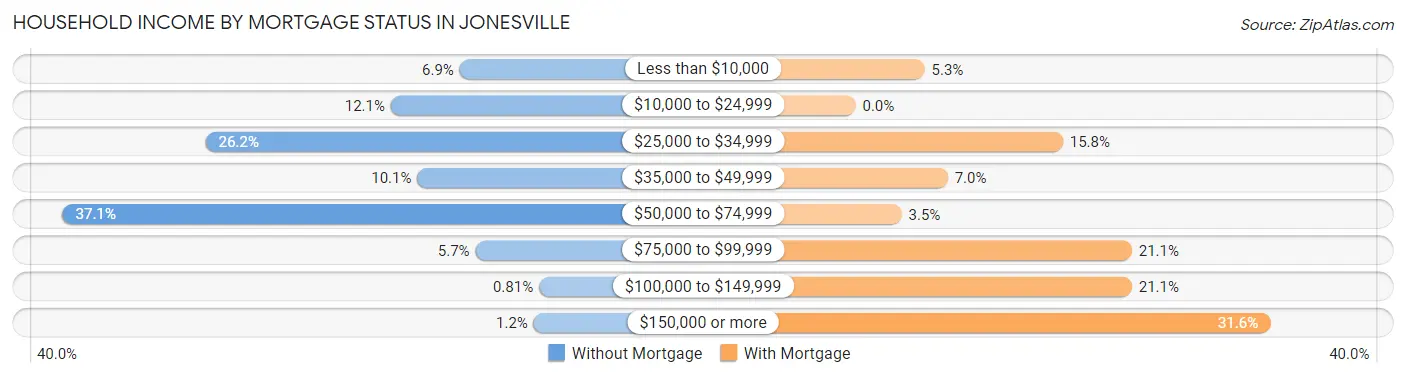
| Household Income | Without Mortgage | With Mortgage |
| Less than $10,000 | 17 (6.9%) | 3 (5.3%) |
| $10,000 to $24,999 | 30 (12.1%) | 0 (0.0%) |
| $25,000 to $34,999 | 65 (26.2%) | 9 (15.8%) |
| $35,000 to $49,999 | 25 (10.1%) | 4 (7.0%) |
| $50,000 to $74,999 | 92 (37.1%) | 2 (3.5%) |
| $75,000 to $99,999 | 14 (5.7%) | 12 (21.0%) |
| $100,000 to $149,999 | 2 (0.8%) | 12 (21.0%) |
| $150,000 or more | 3 (1.2%) | 18 (31.6%) |
| Total | 248 (100.0%) | 57 (100.0%) |
Property Value to Household Income Ratio in Jonesville
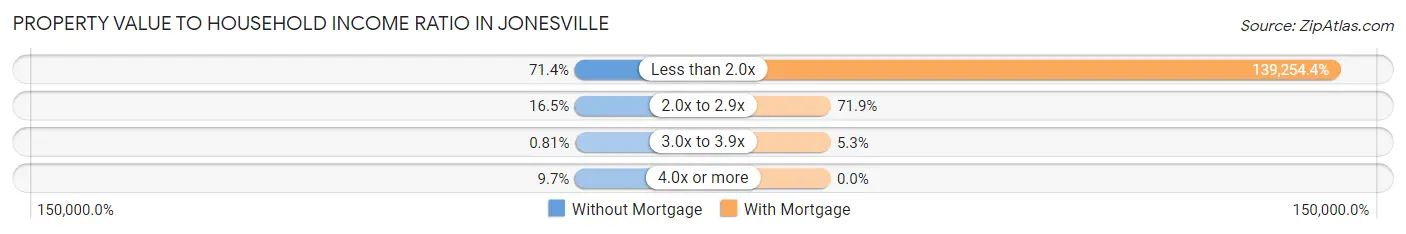
| Value-to-Income Ratio | Without Mortgage | With Mortgage |
| Less than 2.0x | 177 (71.4%) | 79,375 (139,254.4%) |
| 2.0x to 2.9x | 41 (16.5%) | 41 (71.9%) |
| 3.0x to 3.9x | 2 (0.8%) | 3 (5.3%) |
| 4.0x or more | 24 (9.7%) | 0 (0.0%) |
| Total | 248 (100.0%) | 57 (100.0%) |
Real Estate Taxes by Mortgage Status in Jonesville
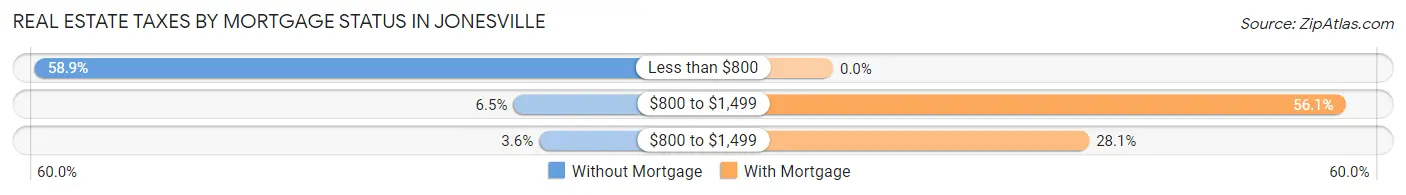
| Property Taxes | Without Mortgage | With Mortgage |
| Less than $800 | 146 (58.9%) | 0 (0.0%) |
| $800 to $1,499 | 16 (6.5%) | 32 (56.1%) |
| $800 to $1,499 | 9 (3.6%) | 16 (28.1%) |
| Total | 248 (100.0%) | 57 (100.0%) |
Health & Disability in Jonesville
Health Insurance Coverage by Age in Jonesville
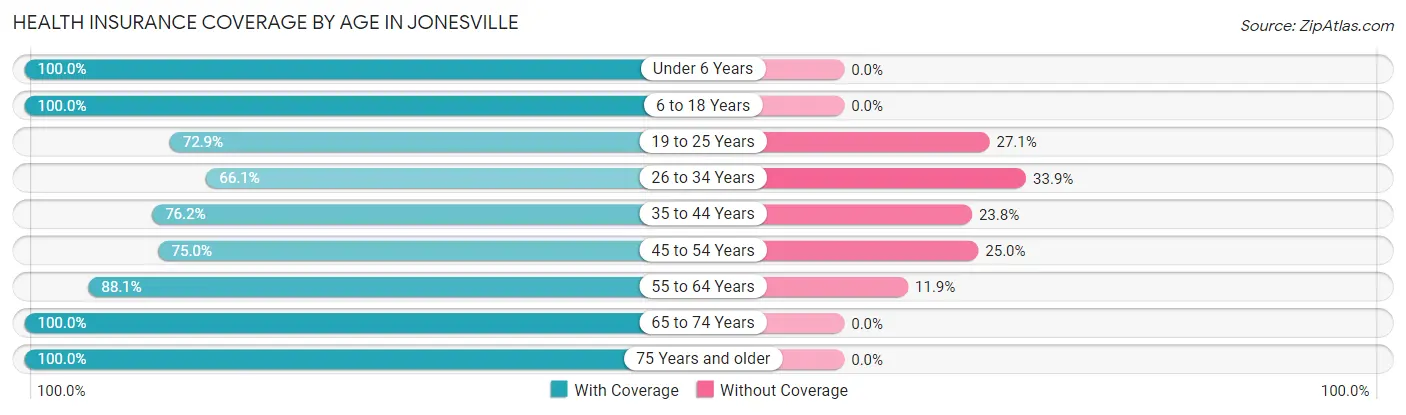
| Age Bracket | With Coverage | Without Coverage |
| Under 6 Years | 41 (100.0%) | 0 (0.0%) |
| 6 to 18 Years | 117 (100.0%) | 0 (0.0%) |
| 19 to 25 Years | 35 (72.9%) | 13 (27.1%) |
| 26 to 34 Years | 76 (66.1%) | 39 (33.9%) |
| 35 to 44 Years | 32 (76.2%) | 10 (23.8%) |
| 45 to 54 Years | 66 (75.0%) | 22 (25.0%) |
| 55 to 64 Years | 185 (88.1%) | 25 (11.9%) |
| 65 to 74 Years | 191 (100.0%) | 0 (0.0%) |
| 75 Years and older | 66 (100.0%) | 0 (0.0%) |
| Total | 809 (88.1%) | 109 (11.9%) |
Health Insurance Coverage by Citizenship Status in Jonesville
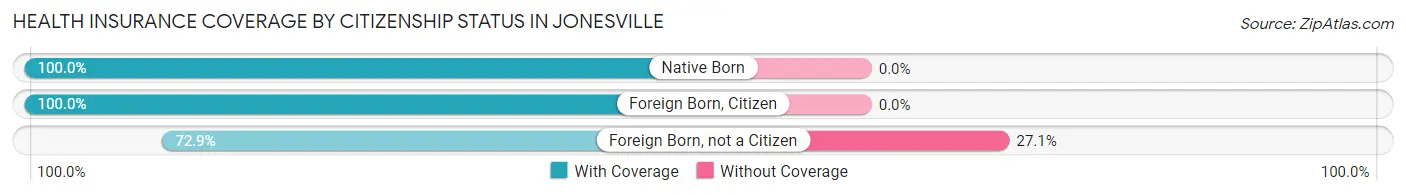
| Citizenship Status | With Coverage | Without Coverage |
| Native Born | 41 (100.0%) | 0 (0.0%) |
| Foreign Born, Citizen | 117 (100.0%) | 0 (0.0%) |
| Foreign Born, not a Citizen | 35 (72.9%) | 13 (27.1%) |
Health Insurance Coverage by Household Income in Jonesville
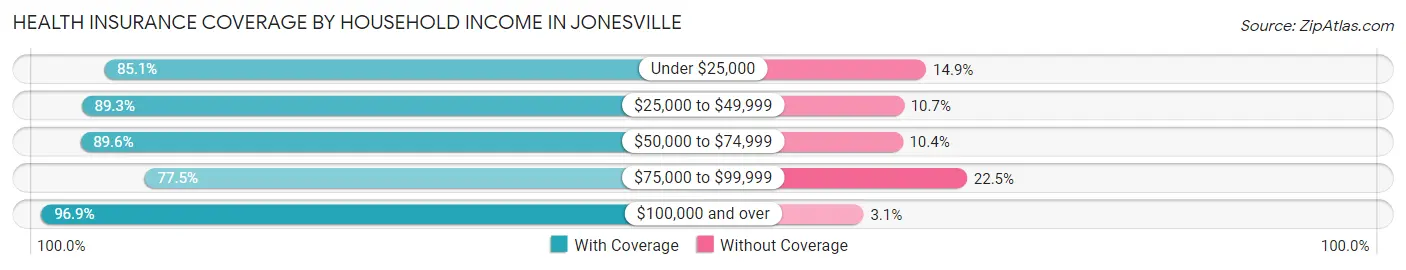
| Household Income | With Coverage | Without Coverage |
| Under $25,000 | 166 (85.1%) | 29 (14.9%) |
| $25,000 to $49,999 | 201 (89.3%) | 24 (10.7%) |
| $50,000 to $74,999 | 309 (89.6%) | 36 (10.4%) |
| $75,000 to $99,999 | 62 (77.5%) | 18 (22.5%) |
| $100,000 and over | 62 (96.9%) | 2 (3.1%) |
Public vs Private Health Insurance Coverage by Age in Jonesville
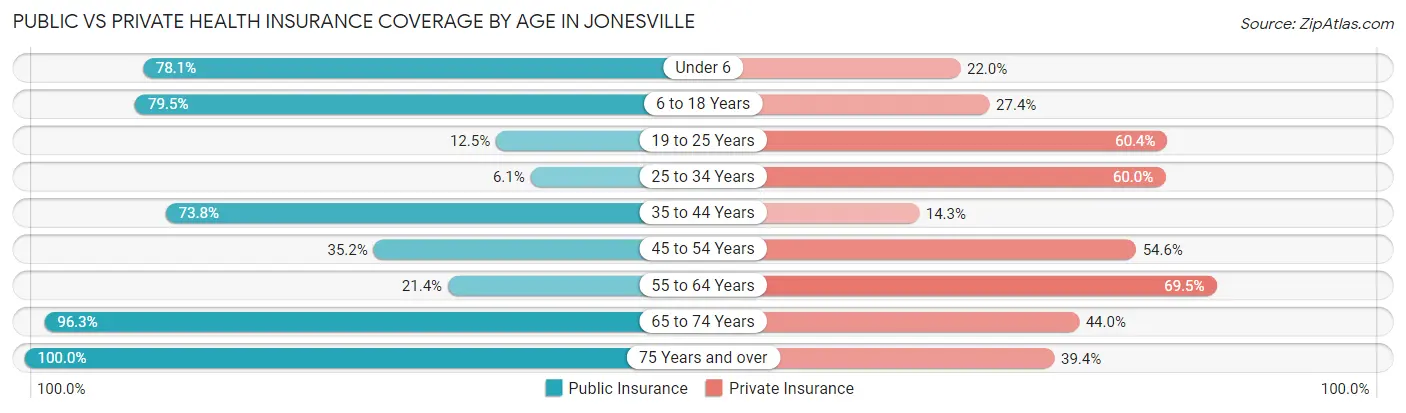
| Age Bracket | Public Insurance | Private Insurance |
| Under 6 | 32 (78.0%) | 9 (22.0%) |
| 6 to 18 Years | 93 (79.5%) | 32 (27.4%) |
| 19 to 25 Years | 6 (12.5%) | 29 (60.4%) |
| 25 to 34 Years | 7 (6.1%) | 69 (60.0%) |
| 35 to 44 Years | 31 (73.8%) | 6 (14.3%) |
| 45 to 54 Years | 31 (35.2%) | 48 (54.5%) |
| 55 to 64 Years | 45 (21.4%) | 146 (69.5%) |
| 65 to 74 Years | 184 (96.3%) | 84 (44.0%) |
| 75 Years and over | 66 (100.0%) | 26 (39.4%) |
| Total | 495 (53.9%) | 449 (48.9%) |
Disability Status by Sex by Age in Jonesville
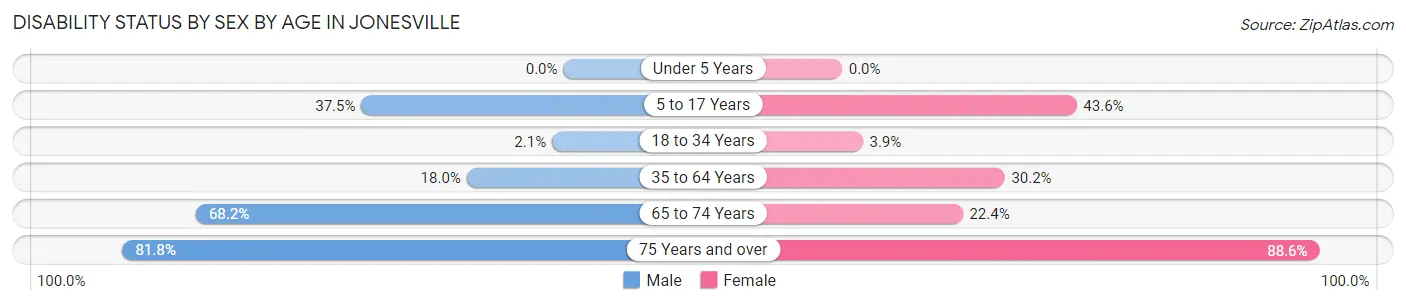
| Age Bracket | Male | Female |
| Under 5 Years | 0 (0.0%) | 0 (0.0%) |
| 5 to 17 Years | 18 (37.5%) | 27 (43.5%) |
| 18 to 34 Years | 2 (2.1%) | 3 (3.8%) |
| 35 to 64 Years | 42 (17.9%) | 32 (30.2%) |
| 65 to 74 Years | 45 (68.2%) | 28 (22.4%) |
| 75 Years and over | 18 (81.8%) | 39 (88.6%) |
Disability Class by Sex by Age in Jonesville
Disability Class: Hearing Difficulty
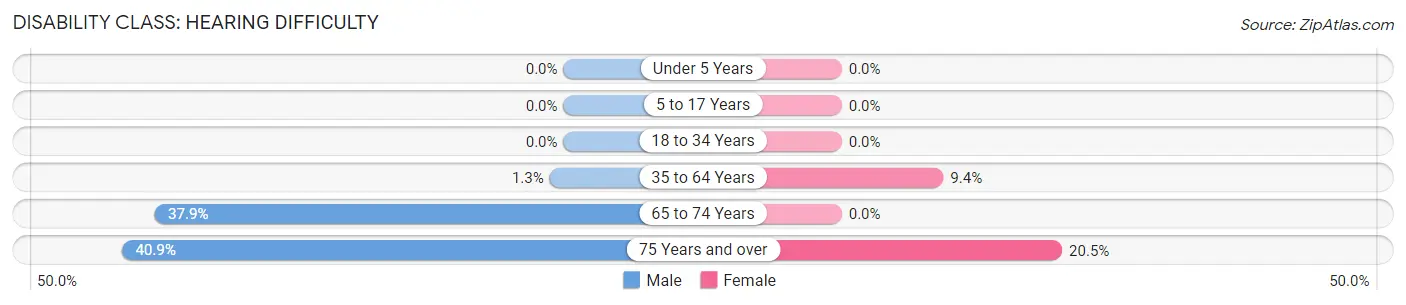
| Age Bracket | Male | Female |
| Under 5 Years | 0 (0.0%) | 0 (0.0%) |
| 5 to 17 Years | 0 (0.0%) | 0 (0.0%) |
| 18 to 34 Years | 0 (0.0%) | 0 (0.0%) |
| 35 to 64 Years | 3 (1.3%) | 10 (9.4%) |
| 65 to 74 Years | 25 (37.9%) | 0 (0.0%) |
| 75 Years and over | 9 (40.9%) | 9 (20.4%) |
Disability Class: Vision Difficulty
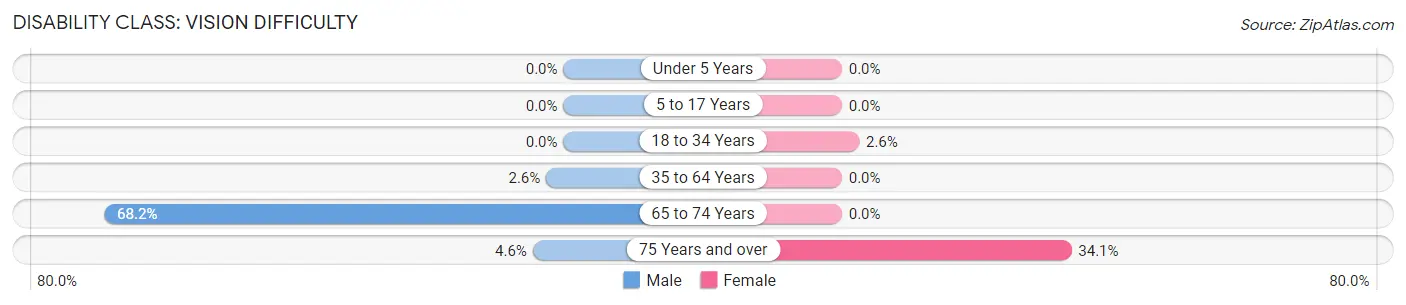
| Age Bracket | Male | Female |
| Under 5 Years | 0 (0.0%) | 0 (0.0%) |
| 5 to 17 Years | 0 (0.0%) | 0 (0.0%) |
| 18 to 34 Years | 0 (0.0%) | 2 (2.6%) |
| 35 to 64 Years | 6 (2.6%) | 0 (0.0%) |
| 65 to 74 Years | 45 (68.2%) | 0 (0.0%) |
| 75 Years and over | 1 (4.5%) | 15 (34.1%) |
Disability Class: Cognitive Difficulty
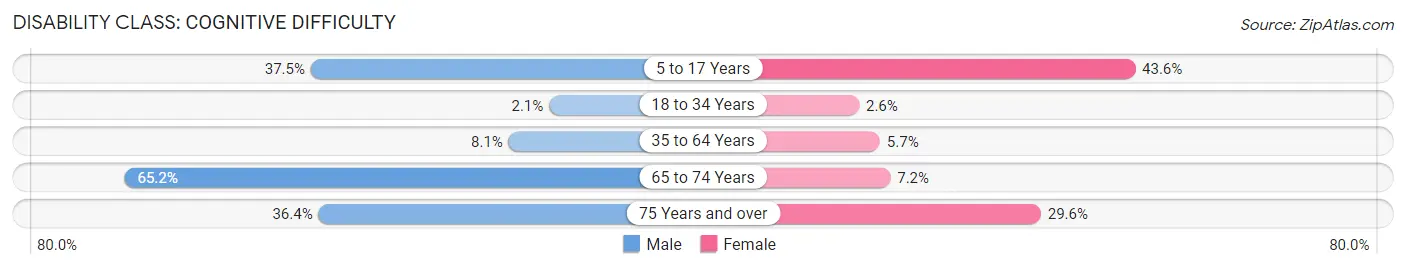
| Age Bracket | Male | Female |
| 5 to 17 Years | 18 (37.5%) | 27 (43.5%) |
| 18 to 34 Years | 2 (2.1%) | 2 (2.6%) |
| 35 to 64 Years | 19 (8.1%) | 6 (5.7%) |
| 65 to 74 Years | 43 (65.1%) | 9 (7.2%) |
| 75 Years and over | 8 (36.4%) | 13 (29.5%) |
Disability Class: Ambulatory Difficulty
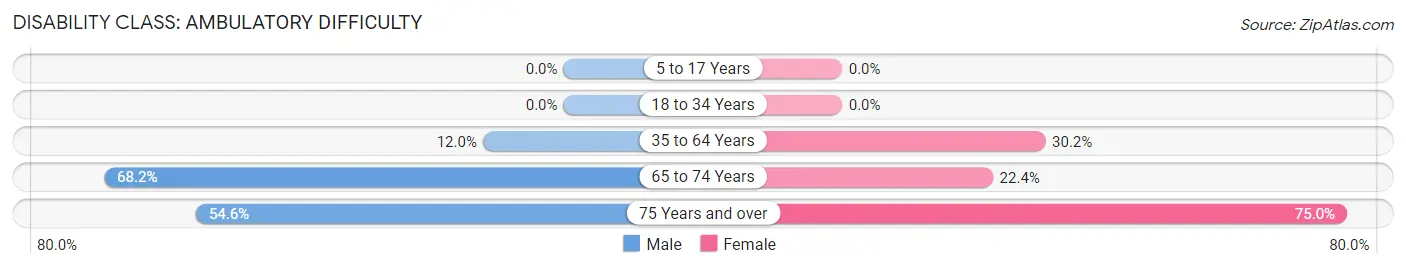
| Age Bracket | Male | Female |
| 5 to 17 Years | 0 (0.0%) | 0 (0.0%) |
| 18 to 34 Years | 0 (0.0%) | 0 (0.0%) |
| 35 to 64 Years | 28 (12.0%) | 32 (30.2%) |
| 65 to 74 Years | 45 (68.2%) | 28 (22.4%) |
| 75 Years and over | 12 (54.5%) | 33 (75.0%) |
Disability Class: Self-Care Difficulty
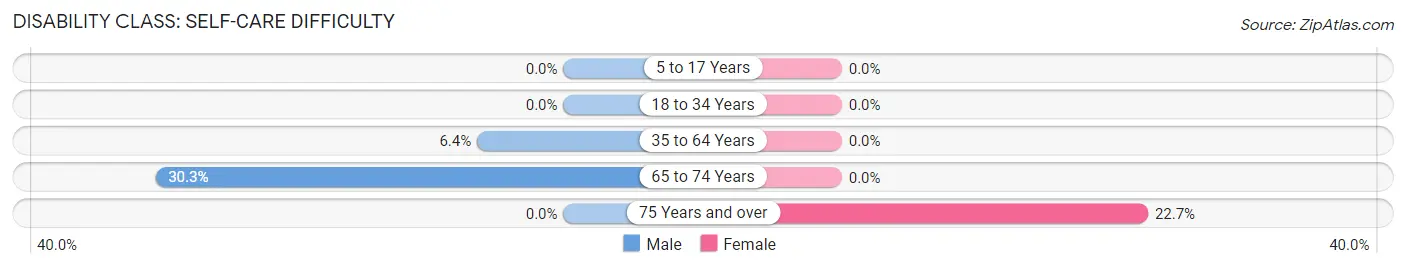
| Age Bracket | Male | Female |
| 5 to 17 Years | 0 (0.0%) | 0 (0.0%) |
| 18 to 34 Years | 0 (0.0%) | 0 (0.0%) |
| 35 to 64 Years | 15 (6.4%) | 0 (0.0%) |
| 65 to 74 Years | 20 (30.3%) | 0 (0.0%) |
| 75 Years and over | 0 (0.0%) | 10 (22.7%) |
Technology Access in Jonesville
Computing Device Access in Jonesville
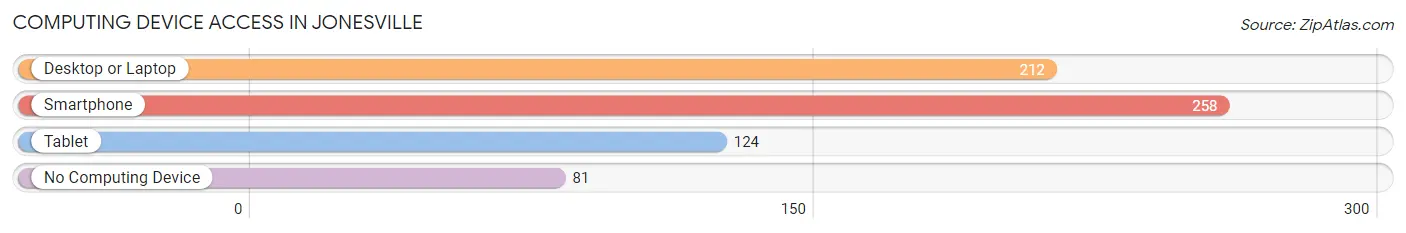
| Device Type | # Households | % Households |
| Desktop or Laptop | 212 | 50.4% |
| Smartphone | 258 | 61.3% |
| Tablet | 124 | 29.4% |
| No Computing Device | 81 | 19.2% |
| Total | 421 | 100.0% |
Internet Access in Jonesville
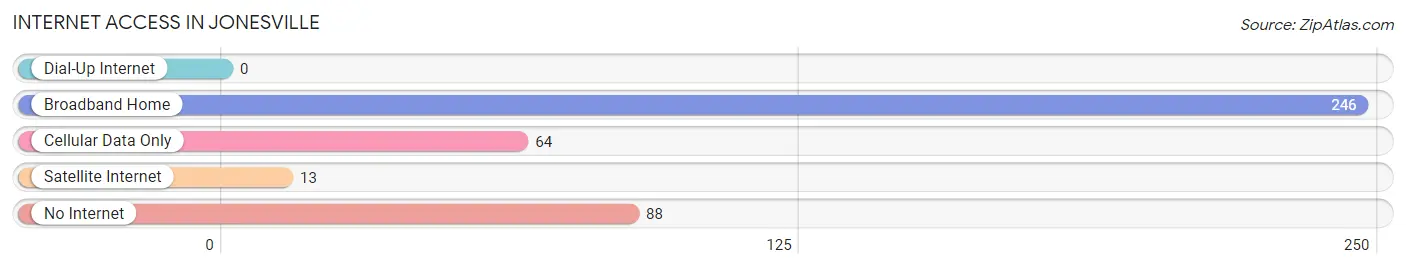
| Internet Type | # Households | % Households |
| Dial-Up Internet | 0 | 0.0% |
| Broadband Home | 246 | 58.4% |
| Cellular Data Only | 64 | 15.2% |
| Satellite Internet | 13 | 3.1% |
| No Internet | 88 | 20.9% |
| Total | 421 | 100.0% |
Jonesville Summary
Jonesville is a small town located in Union County, South Carolina. It is situated on the banks of the Broad River, and is part of the Spartanburg-Union-Cherokee Metropolitan Statistical Area. The town has a population of approximately 1,500 people, and is known for its rural charm and friendly atmosphere.
History
Jonesville was founded in 1820 by a group of settlers from North Carolina. The town was named after the Jones family, who were among the first settlers. The town was originally a farming community, and the main crops grown were cotton, corn, and tobacco. The town was also home to several mills, including a grist mill, a saw mill, and a cotton gin.
In the late 19th century, the town began to grow and develop. The railroad arrived in 1887, and the town was incorporated in 1890. The town was also home to several churches, including the First Baptist Church, which was founded in 1891.
Geography
Jonesville is located in the foothills of the Blue Ridge Mountains, and is part of the Piedmont region of South Carolina. The town is situated on the banks of the Broad River, and is surrounded by rolling hills and forests. The town is located approximately 25 miles from Spartanburg, and is about an hour’s drive from Charlotte, North Carolina.
Economy
The economy of Jonesville is largely based on agriculture. The town is home to several farms, and the main crops grown are corn, soybeans, and cotton. The town is also home to several small businesses, including restaurants, retail stores, and service providers.
Demographics
As of the 2010 census, the population of Jonesville was 1,500. The racial makeup of the town was 94.2% White, 3.3% African American, 0.7% Native American, 0.3% Asian, and 1.5% from other races. The median household income was $30,000, and the median age was 39.
Jonesville is a small town with a rich history and a friendly atmosphere. The town is home to several farms and businesses, and is a great place to live and work. The town is also home to several churches, and is a great place to raise a family.
Common Questions
What is the Total Population of Jonesville?
Total Population of Jonesville is 925.
What is the Total Male Population of Jonesville?
Total Male Population of Jonesville is 489.
What is the Total Female Population of Jonesville?
Total Female Population of Jonesville is 436.
What is the Ratio of Males per 100 Females in Jonesville?
There are 112.16 Males per 100 Females in Jonesville.
What is the Ratio of Females per 100 Males in Jonesville?
There are 89.16 Females per 100 Males in Jonesville.
What is the Median Population Age in Jonesville?
Median Population Age in Jonesville is 56.6 Years.
What is the Average Family Size in Jonesville
Average Family Size in Jonesville is 2.7 People.
What is the Average Household Size in Jonesville
Average Household Size in Jonesville is 2.2 People.
What is Per Capita Income in Jonesville?
Per Capita income in Jonesville is $22,786.
What is the Median Family Income in Jonesville?
Median Family Income in Jonesville is $54,167.
What is the Median Household income in Jonesville?
Median Household Income in Jonesville is $36,023.
What is Income or Wage Gap in Jonesville?
Income or Wage Gap in Jonesville is 37.3%.
Women in Jonesville earn 62.7 cents for every dollar earned by a man.
What is Inequality or Gini Index in Jonesville?
Inequality or Gini Index in Jonesville is 0.40.
How Large is the Labor Force in Jonesville?
There are 461 People in the Labor Forcein in Jonesville.
What is the Percentage of People in the Labor Force in Jonesville?
56.5% of People are in the Labor Force in Jonesville.
What is the Unemployment Rate in Jonesville?
Unemployment Rate in Jonesville is 6.2%.