Buhl, MN Map & Demographics
Buhl Map
Buhl Overview
$30,717
PER CAPITA INCOME
$78,194
AVG FAMILY INCOME
$55,925
AVG HOUSEHOLD INCOME
34.7%
WAGE / INCOME GAP [ % ]
65.3¢/ $1
WAGE / INCOME GAP [ $ ]
0.40
INEQUALITY / GINI INDEX
1,028
TOTAL POPULATION
484
MALE POPULATION
544
FEMALE POPULATION
88.97
MALES / 100 FEMALES
112.40
FEMALES / 100 MALES
48.3
MEDIAN AGE
2.9
AVG FAMILY SIZE
2.1
AVG HOUSEHOLD SIZE
525
LABOR FORCE [ PEOPLE ]
62.7%
PERCENT IN LABOR FORCE
5.0%
UNEMPLOYMENT RATE
Buhl Zip Codes
Buhl Area Codes
Income in Buhl
Income Overview in Buhl
Per Capita Income in Buhl is $30,717, while median incomes of families and households are $78,194 and $55,925 respectively.
| Characteristic | Number | Measure |
| Per Capita Income | 1,028 | $30,717 |
| Median Family Income | 233 | $78,194 |
| Mean Family Income | 233 | $94,314 |
| Median Household Income | 447 | $55,925 |
| Mean Household Income | 447 | $69,177 |
| Income Deficit | 233 | $0 |
| Wage / Income Gap (%) | 1,028 | 34.65% |
| Wage / Income Gap ($) | 1,028 | 65.35¢ per $1 |
| Gini / Inequality Index | 1,028 | 0.40 |
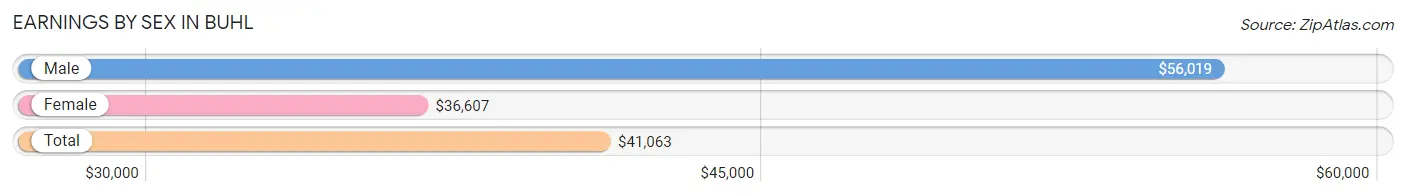
Earnings by Sex in Buhl
Average Earnings in Buhl are $41,063, $56,019 for men and $36,607 for women, a difference of 34.6%.
| Sex | Number | Average Earnings |
| Male | 279 (52.0%) | $56,019 |
| Female | 258 (48.0%) | $36,607 |
| Total | 537 (100.0%) | $41,063 |
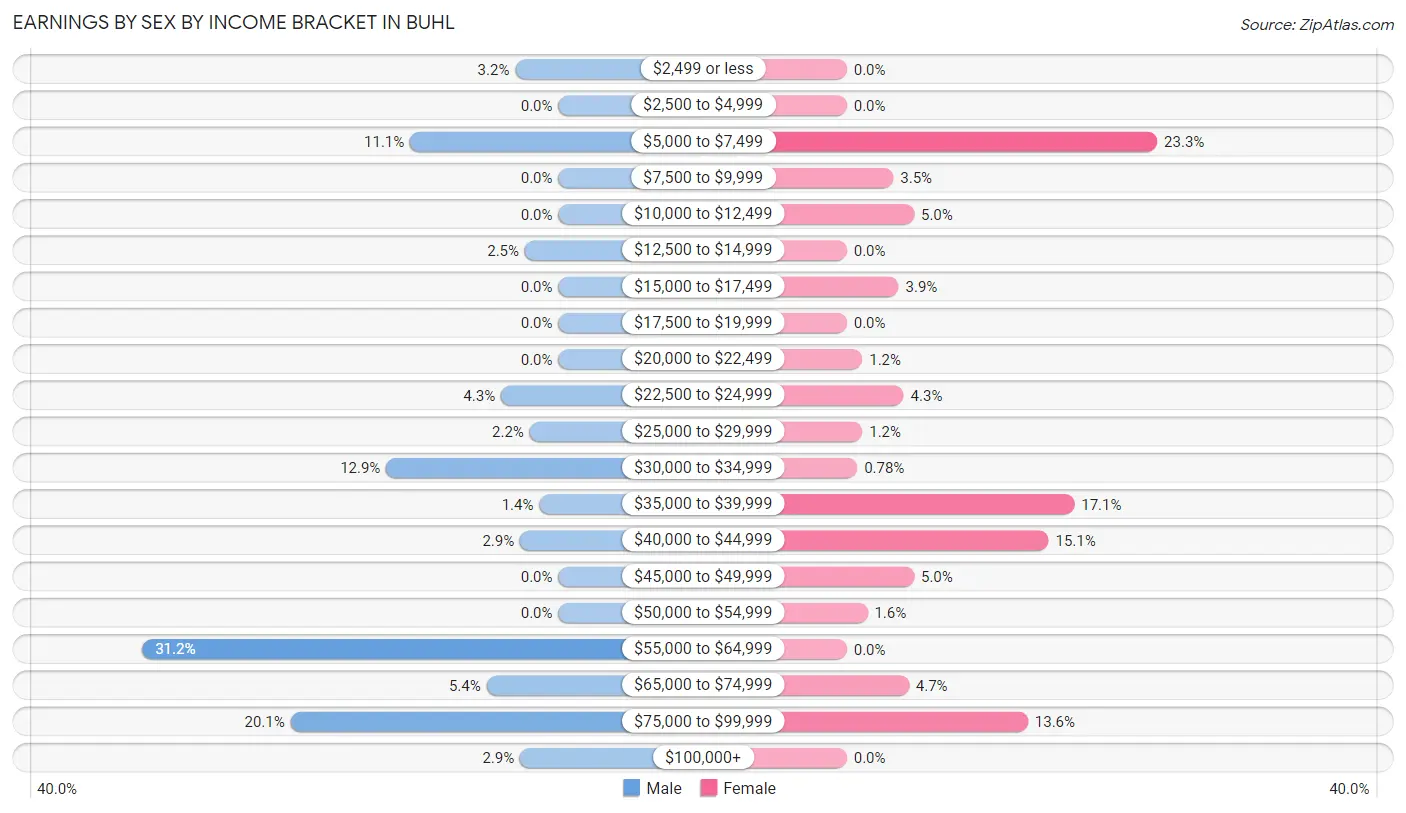
Earnings by Sex by Income Bracket in Buhl
The most common earnings brackets in Buhl are $55,000 to $64,999 for men (87 | 31.2%) and $5,000 to $7,499 for women (60 | 23.3%).
| Income | Male | Female |
| $2,499 or less | 9 (3.2%) | 0 (0.0%) |
| $2,500 to $4,999 | 0 (0.0%) | 0 (0.0%) |
| $5,000 to $7,499 | 31 (11.1%) | 60 (23.3%) |
| $7,500 to $9,999 | 0 (0.0%) | 9 (3.5%) |
| $10,000 to $12,499 | 0 (0.0%) | 13 (5.0%) |
| $12,500 to $14,999 | 7 (2.5%) | 0 (0.0%) |
| $15,000 to $17,499 | 0 (0.0%) | 10 (3.9%) |
| $17,500 to $19,999 | 0 (0.0%) | 0 (0.0%) |
| $20,000 to $22,499 | 0 (0.0%) | 3 (1.2%) |
| $22,500 to $24,999 | 12 (4.3%) | 11 (4.3%) |
| $25,000 to $29,999 | 6 (2.1%) | 3 (1.2%) |
| $30,000 to $34,999 | 36 (12.9%) | 2 (0.8%) |
| $35,000 to $39,999 | 4 (1.4%) | 44 (17.1%) |
| $40,000 to $44,999 | 8 (2.9%) | 39 (15.1%) |
| $45,000 to $49,999 | 0 (0.0%) | 13 (5.0%) |
| $50,000 to $54,999 | 0 (0.0%) | 4 (1.5%) |
| $55,000 to $64,999 | 87 (31.2%) | 0 (0.0%) |
| $65,000 to $74,999 | 15 (5.4%) | 12 (4.6%) |
| $75,000 to $99,999 | 56 (20.1%) | 35 (13.6%) |
| $100,000+ | 8 (2.9%) | 0 (0.0%) |
| Total | 279 (100.0%) | 258 (100.0%) |
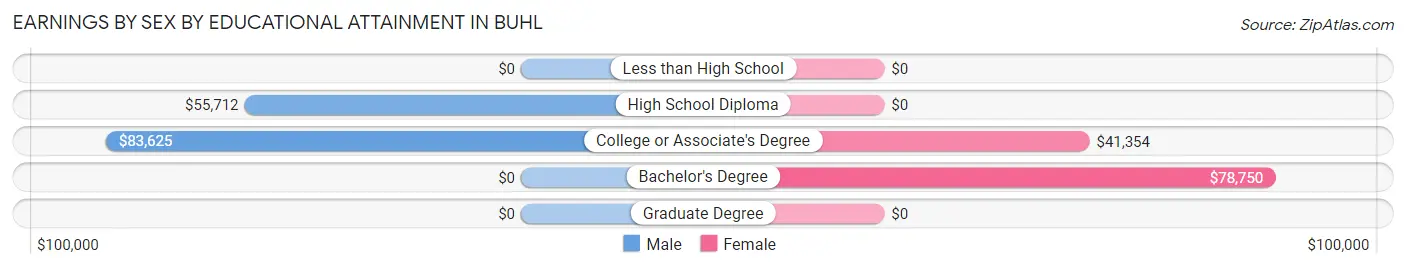
Earnings by Sex by Educational Attainment in Buhl
Average earnings in Buhl are $56,481 for men and $40,938 for women, a difference of 27.5%. Men with an educational attainment of college or associate's degree enjoy the highest average annual earnings of $83,625, while those with high school diploma education earn the least with $55,712. Women with an educational attainment of bachelor's degree earn the most with the average annual earnings of $78,750, while those with college or associate's degree education have the smallest earnings of $41,354.
| Educational Attainment | Male Income | Female Income |
| Less than High School | - | - |
| High School Diploma | $55,712 | $0 |
| College or Associate's Degree | $83,625 | $41,354 |
| Bachelor's Degree | - | - |
| Graduate Degree | - | - |
| Total | $56,481 | $40,938 |
Family Income in Buhl
Family Income Brackets in Buhl
According to the Buhl family income data, there are 69 families falling into the $150,000 to $199,999 income range, which is the most common income bracket and makes up 29.6% of all families.
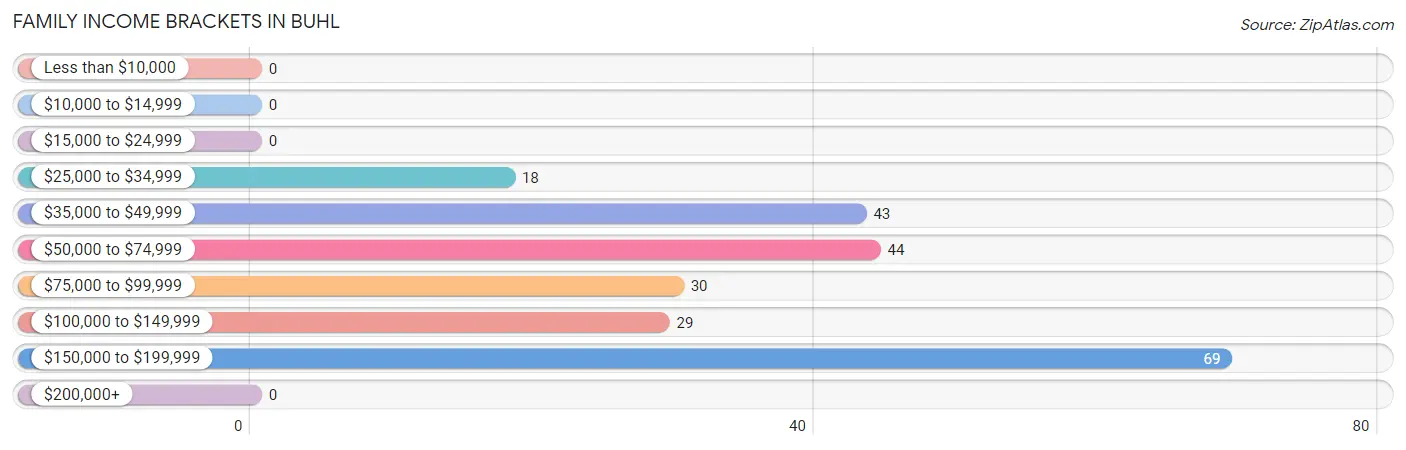
| Income Bracket | # Families | % Families |
| Less than $10,000 | 0 | 0.0% |
| $10,000 to $14,999 | 0 | 0.0% |
| $15,000 to $24,999 | 0 | 0.0% |
| $25,000 to $34,999 | 18 | 7.7% |
| $35,000 to $49,999 | 43 | 18.5% |
| $50,000 to $74,999 | 44 | 18.9% |
| $75,000 to $99,999 | 30 | 12.9% |
| $100,000 to $149,999 | 29 | 12.4% |
| $150,000 to $199,999 | 69 | 29.6% |
| $200,000+ | 0 | 0.0% |
Family Income by Famaliy Size in Buhl
3-person families (70 | 30.0%) account for the highest median family income in Buhl with $110,278 per family, while 3-person families (70 | 30.0%) have the highest median income of $36,759 per family member.
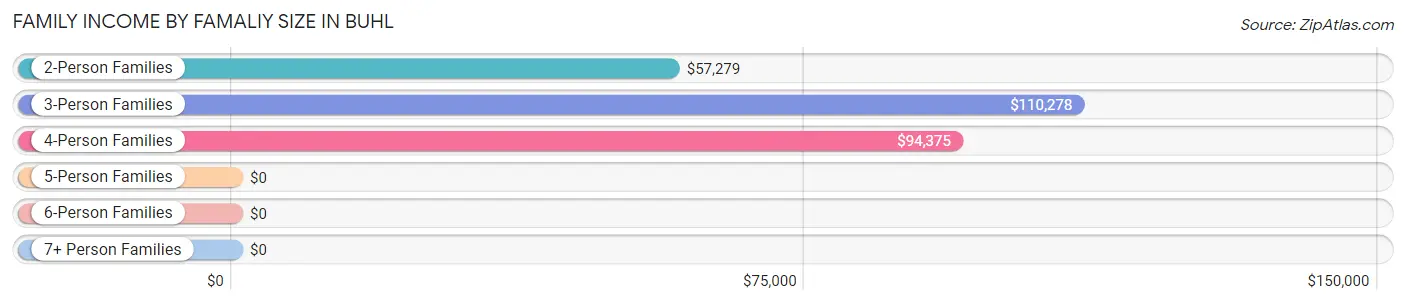
| Income Bracket | # Families | Median Income |
| 2-Person Families | 101 (43.3%) | $57,279 |
| 3-Person Families | 70 (30.0%) | $110,278 |
| 4-Person Families | 22 (9.4%) | $94,375 |
| 5-Person Families | 40 (17.2%) | $0 |
| 6-Person Families | 0 (0.0%) | $0 |
| 7+ Person Families | 0 (0.0%) | $0 |
| Total | 233 (100.0%) | $78,194 |
Family Income by Number of Earners in Buhl
The median family income in Buhl is $78,194, with families comprising 3+ earners (55) having the highest median family income of $151,445, while families with no earners (20) have the lowest median family income of $36,667, accounting for 23.6% and 8.6% of families, respectively.
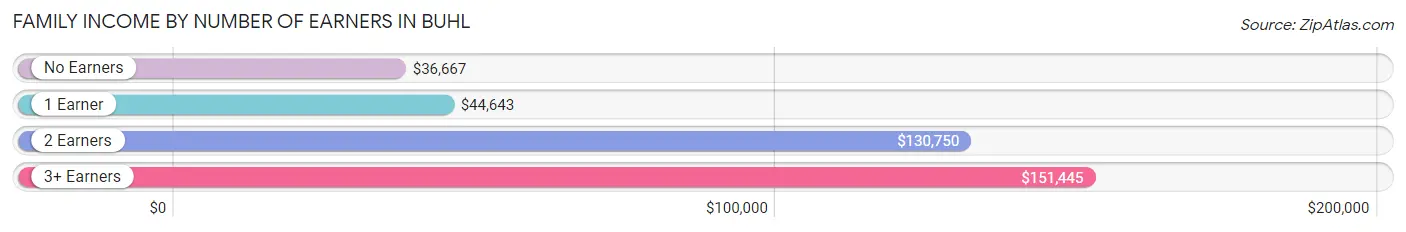
| Number of Earners | # Families | Median Income |
| No Earners | 20 (8.6%) | $36,667 |
| 1 Earner | 98 (42.1%) | $44,643 |
| 2 Earners | 60 (25.8%) | $130,750 |
| 3+ Earners | 55 (23.6%) | $151,445 |
| Total | 233 (100.0%) | $78,194 |
Household Income in Buhl
Household Income Brackets in Buhl
With 81 households falling in the category, the $50,000 to $74,999 income range is the most frequent in Buhl, accounting for 18.1% of all households.
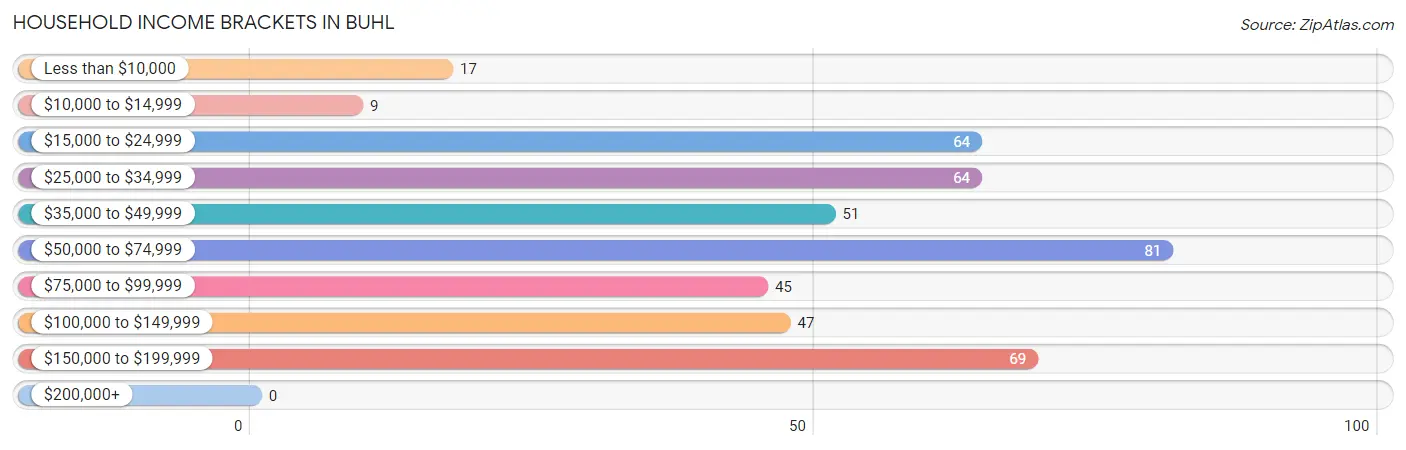
| Income Bracket | # Households | % Households |
| Less than $10,000 | 17 | 3.8% |
| $10,000 to $14,999 | 9 | 2.0% |
| $15,000 to $24,999 | 64 | 14.3% |
| $25,000 to $34,999 | 64 | 14.3% |
| $35,000 to $49,999 | 51 | 11.4% |
| $50,000 to $74,999 | 81 | 18.1% |
| $75,000 to $99,999 | 45 | 10.1% |
| $100,000 to $149,999 | 47 | 10.5% |
| $150,000 to $199,999 | 69 | 15.4% |
| $200,000+ | 0 | 0.0% |
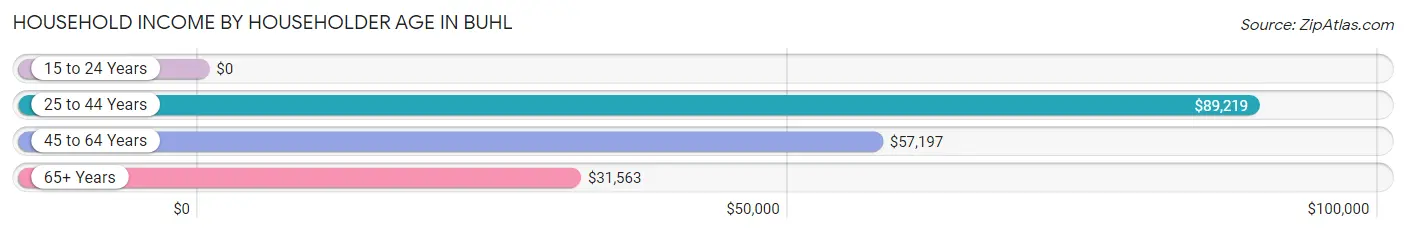
Household Income by Householder Age in Buhl
The median household income in Buhl is $55,925, with the highest median household income of $89,219 found in the 25 to 44 years age bracket for the primary householder. A total of 77 households (17.2%) fall into this category. Meanwhile, the 15 to 24 years age bracket for the primary householder has the lowest median household income of $0, with 18 households (4.0%) in this group.
| Income Bracket | # Households | Median Income |
| 15 to 24 Years | 18 (4.0%) | $0 |
| 25 to 44 Years | 77 (17.2%) | $89,219 |
| 45 to 64 Years | 198 (44.3%) | $57,197 |
| 65+ Years | 154 (34.4%) | $31,563 |
| Total | 447 (100.0%) | $55,925 |
Poverty in Buhl
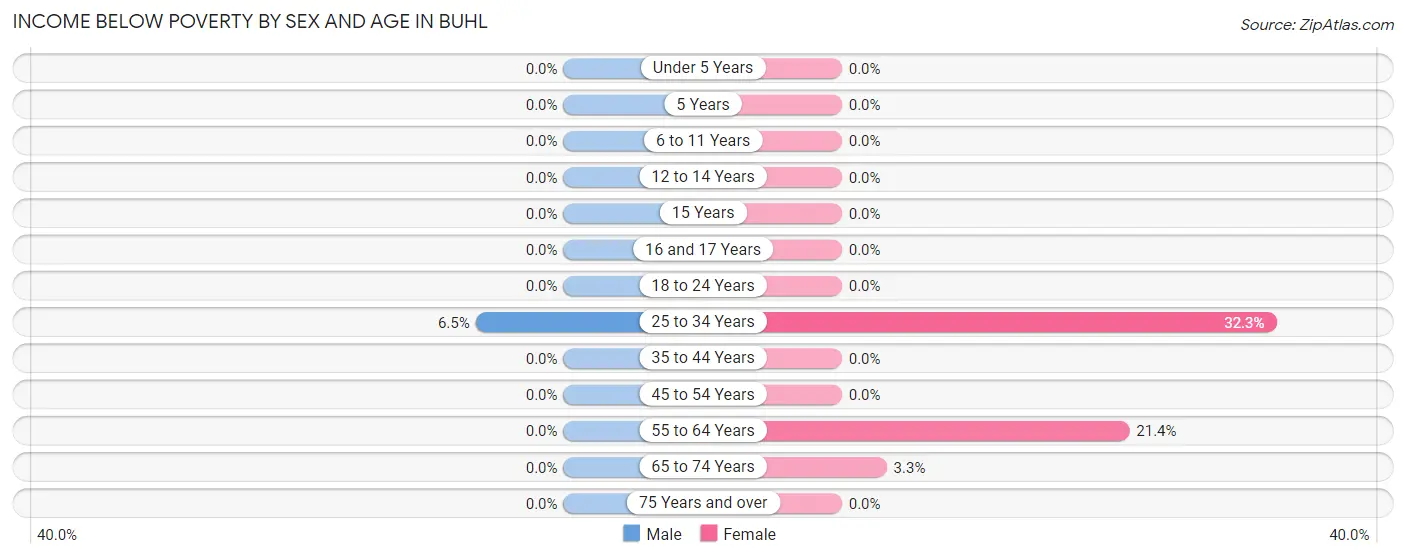
Income Below Poverty by Sex and Age in Buhl
With 0.7% poverty level for males and 6.2% for females among the residents of Buhl, 25 to 34 year old males and 25 to 34 year old females are the most vulnerable to poverty, with 3 males (6.5%) and 10 females (32.3%) in their respective age groups living below the poverty level.
| Age Bracket | Male | Female |
| Under 5 Years | 0 (0.0%) | 0 (0.0%) |
| 5 Years | 0 (0.0%) | 0 (0.0%) |
| 6 to 11 Years | 0 (0.0%) | 0 (0.0%) |
| 12 to 14 Years | 0 (0.0%) | 0 (0.0%) |
| 15 Years | 0 (0.0%) | 0 (0.0%) |
| 16 and 17 Years | 0 (0.0%) | 0 (0.0%) |
| 18 to 24 Years | 0 (0.0%) | 0 (0.0%) |
| 25 to 34 Years | 3 (6.5%) | 10 (32.3%) |
| 35 to 44 Years | 0 (0.0%) | 0 (0.0%) |
| 45 to 54 Years | 0 (0.0%) | 0 (0.0%) |
| 55 to 64 Years | 0 (0.0%) | 19 (21.3%) |
| 65 to 74 Years | 0 (0.0%) | 2 (3.3%) |
| 75 Years and over | 0 (0.0%) | 0 (0.0%) |
| Total | 3 (0.7%) | 31 (6.2%) |
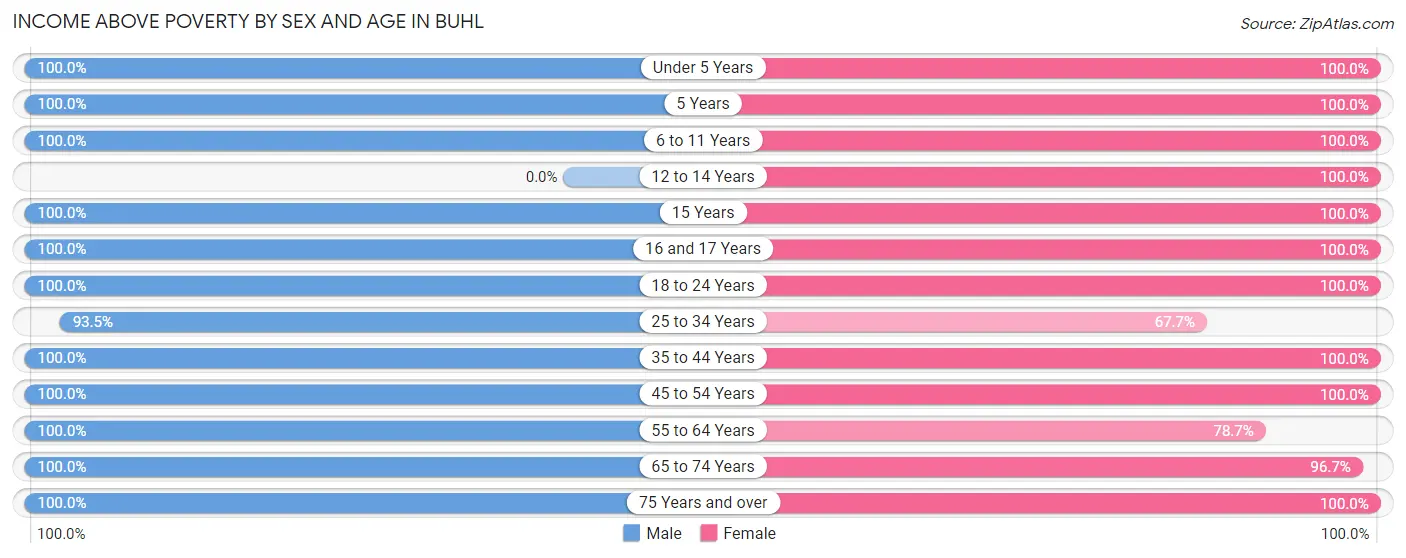
Income Above Poverty by Sex and Age in Buhl
According to the poverty statistics in Buhl, males aged under 5 years and females aged under 5 years are the age groups that are most secure financially, with 100.0% of males and 100.0% of females in these age groups living above the poverty line.
| Age Bracket | Male | Female |
| Under 5 Years | 9 (100.0%) | 13 (100.0%) |
| 5 Years | 17 (100.0%) | 3 (100.0%) |
| 6 to 11 Years | 65 (100.0%) | 37 (100.0%) |
| 12 to 14 Years | 0 (0.0%) | 26 (100.0%) |
| 15 Years | 3 (100.0%) | 2 (100.0%) |
| 16 and 17 Years | 31 (100.0%) | 9 (100.0%) |
| 18 to 24 Years | 21 (100.0%) | 66 (100.0%) |
| 25 to 34 Years | 43 (93.5%) | 21 (67.7%) |
| 35 to 44 Years | 24 (100.0%) | 34 (100.0%) |
| 45 to 54 Years | 100 (100.0%) | 62 (100.0%) |
| 55 to 64 Years | 54 (100.0%) | 70 (78.6%) |
| 65 to 74 Years | 37 (100.0%) | 58 (96.7%) |
| 75 Years and over | 37 (100.0%) | 69 (100.0%) |
| Total | 441 (99.3%) | 470 (93.8%) |
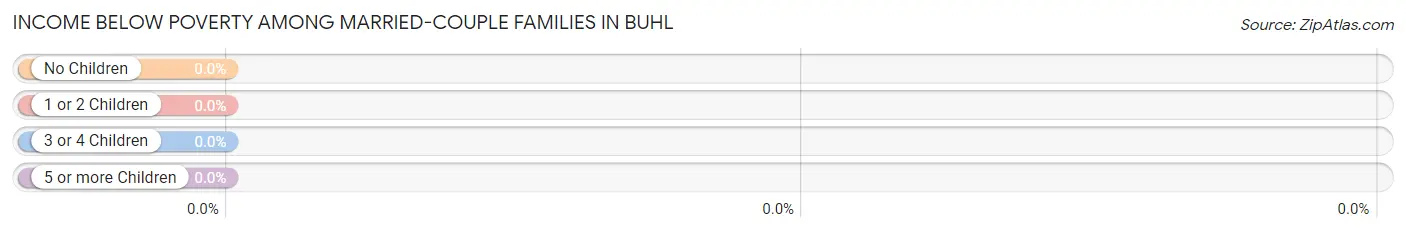
Income Below Poverty Among Married-Couple Families in Buhl
| Children | Above Poverty | Below Poverty |
| No Children | 99 (100.0%) | 0 (0.0%) |
| 1 or 2 Children | 66 (100.0%) | 0 (0.0%) |
| 3 or 4 Children | 0 (0.0%) | 0 (0.0%) |
| 5 or more Children | 0 (0.0%) | 0 (0.0%) |
| Total | 165 (100.0%) | 0 (0.0%) |
Income Below Poverty Among Single-Parent Households in Buhl
| Children | Single Father | Single Mother |
| No Children | 0 (0.0%) | 0 (0.0%) |
| 1 or 2 Children | 0 (0.0%) | 0 (0.0%) |
| 3 or 4 Children | 0 (0.0%) | 0 (0.0%) |
| 5 or more Children | 0 (0.0%) | 0 (0.0%) |
| Total | 0 (0.0%) | 0 (0.0%) |
Income Below Poverty Among Married-Couple vs Single-Parent Households in Buhl
| Children | Married-Couple Families | Single-Parent Households |
| No Children | 0 (0.0%) | 0 (0.0%) |
| 1 or 2 Children | 0 (0.0%) | 0 (0.0%) |
| 3 or 4 Children | 0 (0.0%) | 0 (0.0%) |
| 5 or more Children | 0 (0.0%) | 0 (0.0%) |
| Total | 0 (0.0%) | 0 (0.0%) |
Race in Buhl
The most populous races in Buhl are White / Caucasian (934 | 90.9%), Two or more Races (64 | 6.2%), and Native / Alaskan (16 | 1.6%).
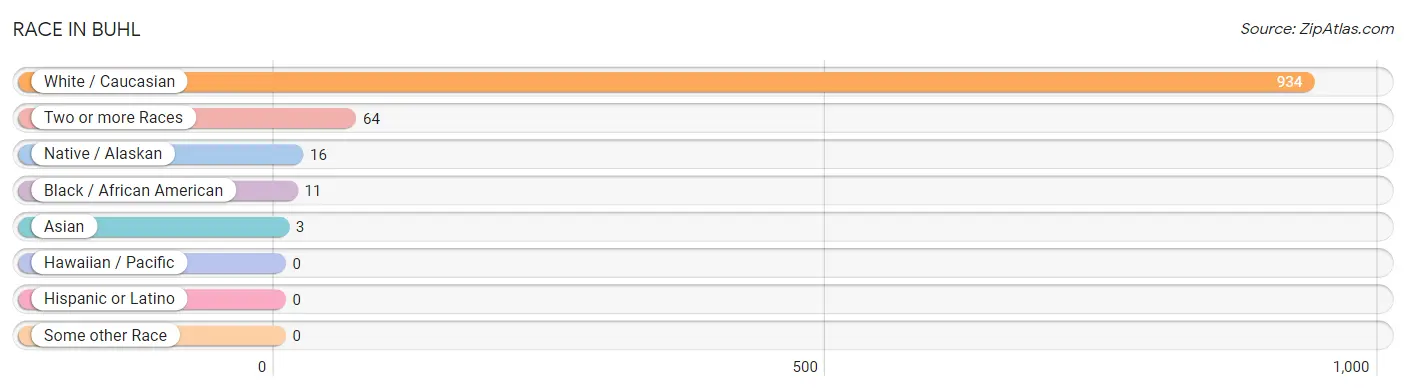
| Race | # Population | % Population |
| Asian | 3 | 0.3% |
| Black / African American | 11 | 1.1% |
| Hawaiian / Pacific | 0 | 0.0% |
| Hispanic or Latino | 0 | 0.0% |
| Native / Alaskan | 16 | 1.6% |
| White / Caucasian | 934 | 90.9% |
| Two or more Races | 64 | 6.2% |
| Some other Race | 0 | 0.0% |
| Total | 1,028 | 100.0% |
Ancestry in Buhl
The most populous ancestries reported in Buhl are German (216 | 21.0%), Norwegian (111 | 10.8%), Finnish (79 | 7.7%), American (61 | 5.9%), and Irish (59 | 5.7%), together accounting for 51.2% of all Buhl residents.
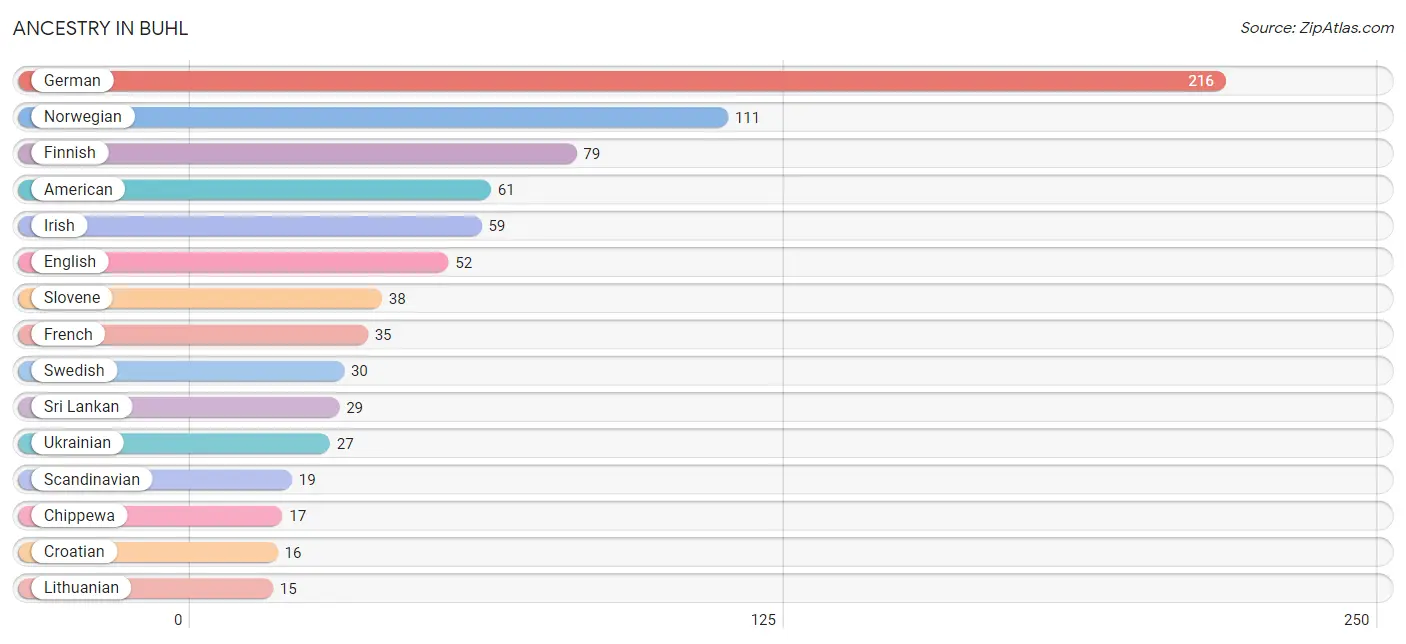
| Ancestry | # Population | % Population |
| American | 61 | 5.9% |
| Chippewa | 17 | 1.7% |
| Croatian | 16 | 1.6% |
| Czech | 13 | 1.3% |
| English | 52 | 5.1% |
| European | 8 | 0.8% |
| Finnish | 79 | 7.7% |
| French | 35 | 3.4% |
| French Canadian | 4 | 0.4% |
| German | 216 | 21.0% |
| Indian (Asian) | 4 | 0.4% |
| Irish | 59 | 5.7% |
| Italian | 6 | 0.6% |
| Korean | 13 | 1.3% |
| Liberian | 5 | 0.5% |
| Lithuanian | 15 | 1.5% |
| Luxembourger | 7 | 0.7% |
| Norwegian | 111 | 10.8% |
| Polish | 8 | 0.8% |
| Scandinavian | 19 | 1.8% |
| Slavic | 4 | 0.4% |
| Slovene | 38 | 3.7% |
| Sri Lankan | 29 | 2.8% |
| Subsaharan African | 5 | 0.5% |
| Swedish | 30 | 2.9% |
| Ukrainian | 27 | 2.6% |
| Yugoslavian | 2 | 0.2% | View All 27 Rows |
Immigrants in Buhl
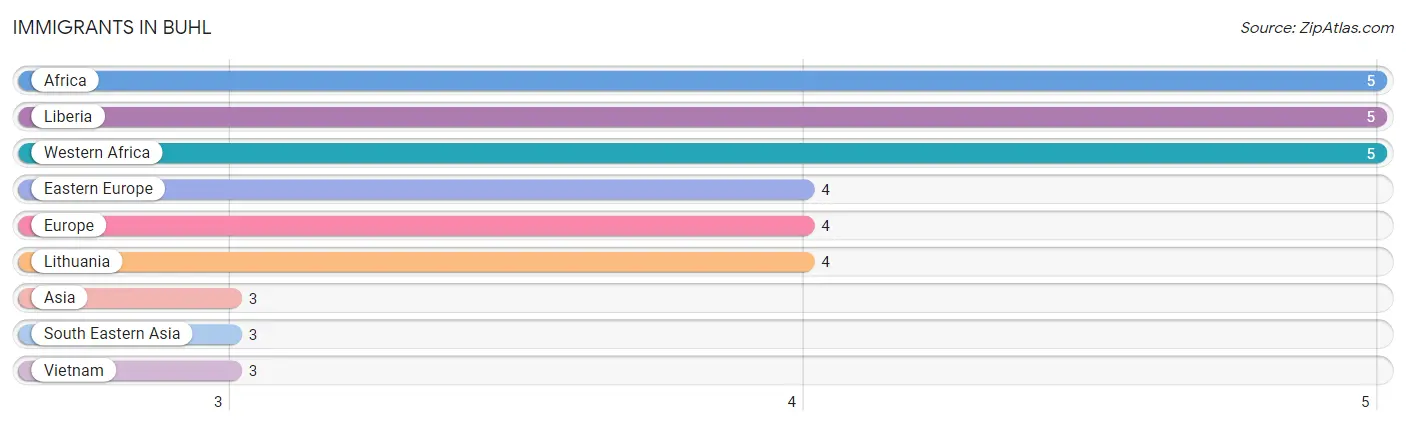
The most numerous immigrant groups reported in Buhl came from Africa (5 | 0.5%), Liberia (5 | 0.5%), Western Africa (5 | 0.5%), Eastern Europe (4 | 0.4%), and Europe (4 | 0.4%), together accounting for 2.2% of all Buhl residents.
| Immigration Origin | # Population | % Population |
| Africa | 5 | 0.5% |
| Asia | 3 | 0.3% |
| Eastern Europe | 4 | 0.4% |
| Europe | 4 | 0.4% |
| Liberia | 5 | 0.5% |
| Lithuania | 4 | 0.4% |
| South Eastern Asia | 3 | 0.3% |
| Vietnam | 3 | 0.3% |
| Western Africa | 5 | 0.5% | View All 9 Rows |
Sex and Age in Buhl
Sex and Age in Buhl
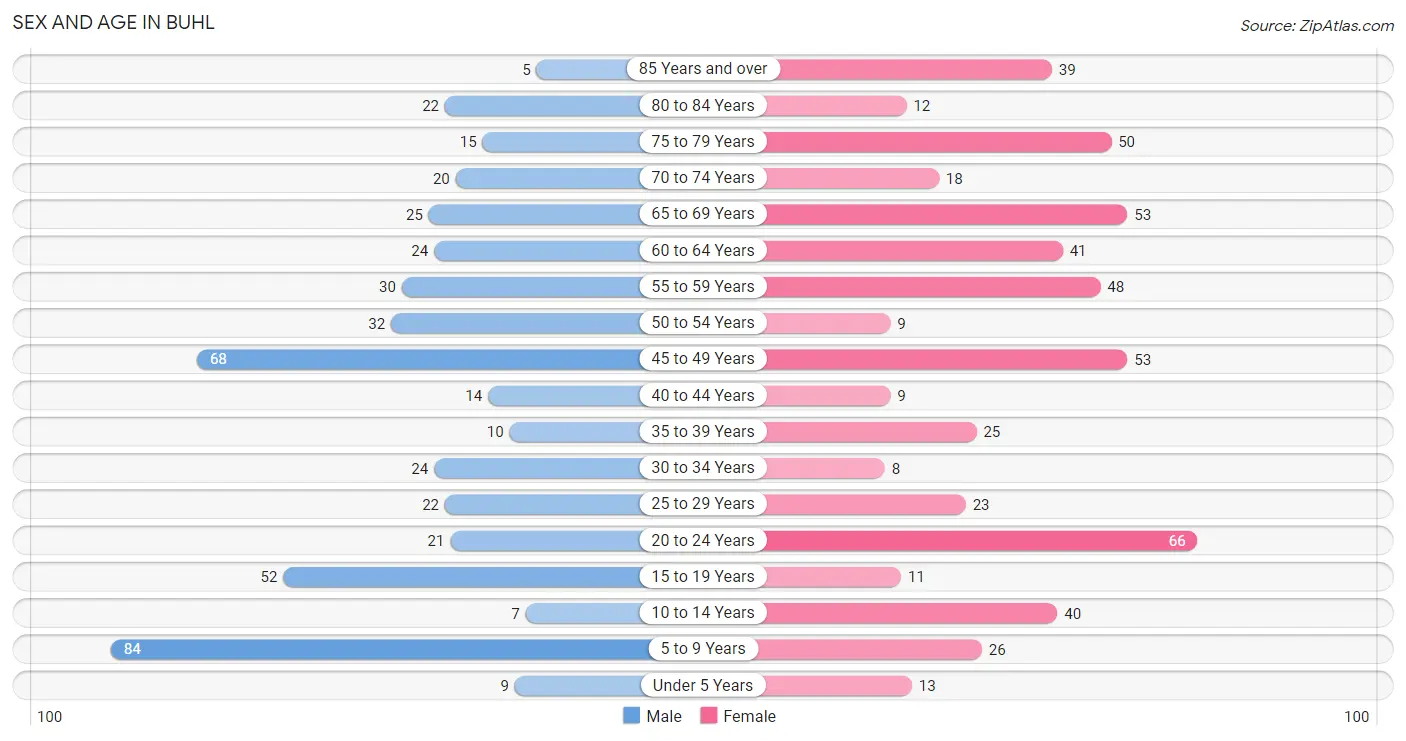
The most populous age groups in Buhl are 5 to 9 Years (84 | 17.4%) for men and 20 to 24 Years (66 | 12.1%) for women.
| Age Bracket | Male | Female |
| Under 5 Years | 9 (1.9%) | 13 (2.4%) |
| 5 to 9 Years | 84 (17.4%) | 26 (4.8%) |
| 10 to 14 Years | 7 (1.5%) | 40 (7.3%) |
| 15 to 19 Years | 52 (10.7%) | 11 (2.0%) |
| 20 to 24 Years | 21 (4.3%) | 66 (12.1%) |
| 25 to 29 Years | 22 (4.5%) | 23 (4.2%) |
| 30 to 34 Years | 24 (5.0%) | 8 (1.5%) |
| 35 to 39 Years | 10 (2.1%) | 25 (4.6%) |
| 40 to 44 Years | 14 (2.9%) | 9 (1.7%) |
| 45 to 49 Years | 68 (14.1%) | 53 (9.7%) |
| 50 to 54 Years | 32 (6.6%) | 9 (1.7%) |
| 55 to 59 Years | 30 (6.2%) | 48 (8.8%) |
| 60 to 64 Years | 24 (5.0%) | 41 (7.5%) |
| 65 to 69 Years | 25 (5.2%) | 53 (9.7%) |
| 70 to 74 Years | 20 (4.1%) | 18 (3.3%) |
| 75 to 79 Years | 15 (3.1%) | 50 (9.2%) |
| 80 to 84 Years | 22 (4.5%) | 12 (2.2%) |
| 85 Years and over | 5 (1.0%) | 39 (7.2%) |
| Total | 484 (100.0%) | 544 (100.0%) |
Families and Households in Buhl
Median Family Size in Buhl
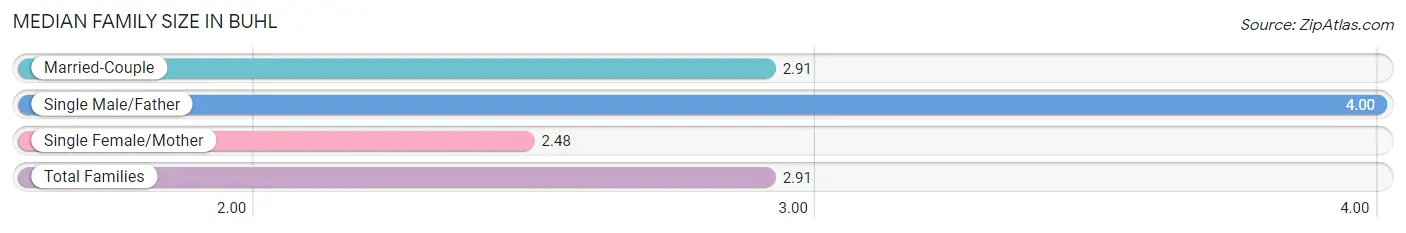
The median family size in Buhl is 2.91 persons per family, with single male/father families (20 | 8.6%) accounting for the largest median family size of 4 persons per family. On the other hand, single female/mother families (48 | 20.6%) represent the smallest median family size with 2.48 persons per family.
| Family Type | # Families | Family Size |
| Married-Couple | 165 (70.8%) | 2.91 |
| Single Male/Father | 20 (8.6%) | 4.00 |
| Single Female/Mother | 48 (20.6%) | 2.48 |
| Total Families | 233 (100.0%) | 2.91 |
Median Household Size in Buhl
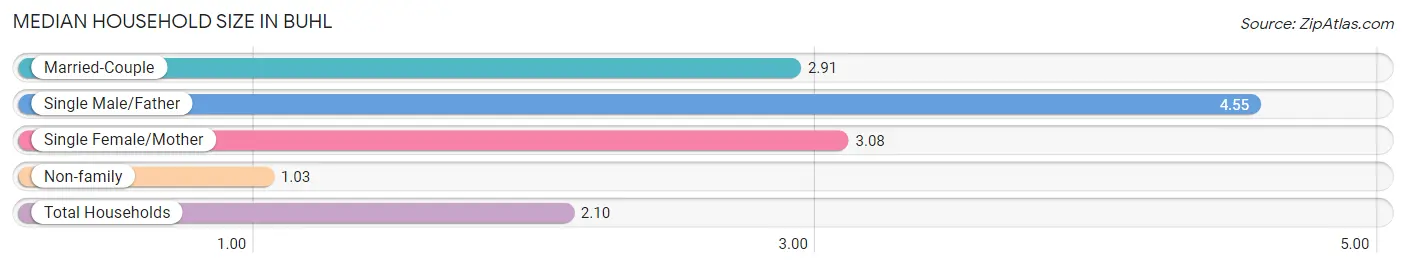
The median household size in Buhl is 2.10 persons per household, with single male/father households (20 | 4.5%) accounting for the largest median household size of 4.55 persons per household. non-family households (214 | 47.9%) represent the smallest median household size with 1.03 persons per household.
| Household Type | # Households | Household Size |
| Married-Couple | 165 (36.9%) | 2.91 |
| Single Male/Father | 20 (4.5%) | 4.55 |
| Single Female/Mother | 48 (10.7%) | 3.08 |
| Non-family | 214 (47.9%) | 1.03 |
| Total Households | 447 (100.0%) | 2.10 |
Household Size by Marriage Status in Buhl
Out of a total of 447 households in Buhl, 233 (52.1%) are family households, while 214 (47.9%) are nonfamily households. The most numerous type of family households are 3-person households, comprising 83, and the most common type of nonfamily households are 1-person households, comprising 207.
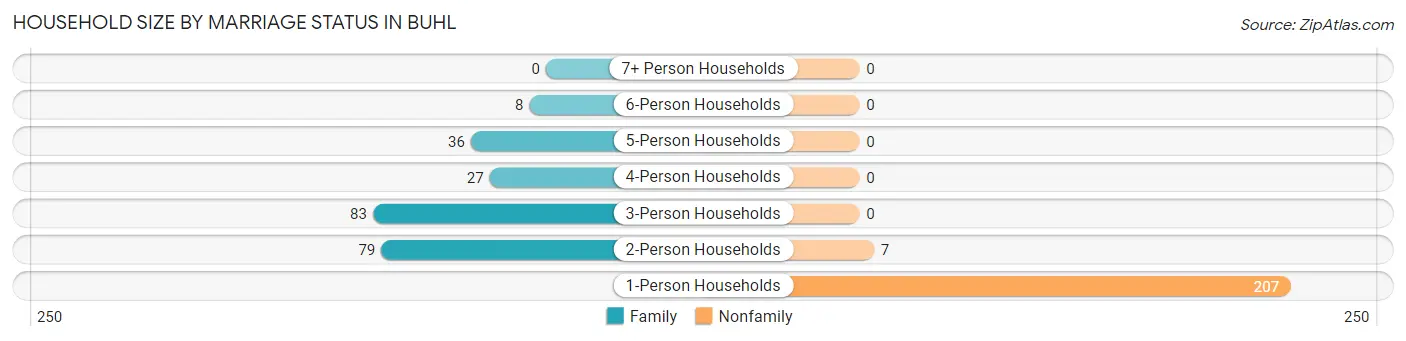
| Household Size | Family Households | Nonfamily Households |
| 1-Person Households | - | 207 (46.3%) |
| 2-Person Households | 79 (17.7%) | 7 (1.6%) |
| 3-Person Households | 83 (18.6%) | 0 (0.0%) |
| 4-Person Households | 27 (6.0%) | 0 (0.0%) |
| 5-Person Households | 36 (8.1%) | 0 (0.0%) |
| 6-Person Households | 8 (1.8%) | 0 (0.0%) |
| 7+ Person Households | 0 (0.0%) | 0 (0.0%) |
| Total | 233 (52.1%) | 214 (47.9%) |
Female Fertility in Buhl
Fertility by Age in Buhl
| Age Bracket | Women with Births | Births / 1,000 Women |
| 15 to 19 years | 0 (0.0%) | 0.0 |
| 20 to 34 years | 0 (0.0%) | 0.0 |
| 35 to 50 years | 0 (0.0%) | 0.0 |
| Total | 0 (0.0%) | 0.0 |
Fertility by Age by Marriage Status in Buhl
| Age Bracket | Married | Unmarried |
| 15 to 19 years | 0 (0.0%) | 0 (0.0%) |
| 20 to 34 years | 0 (0.0%) | 0 (0.0%) |
| 35 to 50 years | 0 (0.0%) | 0 (0.0%) |
| Total | 0 (0.0%) | 0 (0.0%) |
Fertility by Education in Buhl
| Educational Attainment | Women with Births | Births / 1,000 Women |
| Less than High School | 0 (0.0%) | 0.0 |
| High School Diploma | 0 (0.0%) | 0.0 |
| College or Associate's Degree | 0 (0.0%) | 0.0 |
| Bachelor's Degree | 0 (0.0%) | 0.0 |
| Graduate Degree | 0 (0.0%) | 0.0 |
| Total | 0 (0.0%) | 0.0 |
Fertility by Education by Marriage Status in Buhl
| Educational Attainment | Married | Unmarried |
| Less than High School | 0 (0.0%) | 0 (0.0%) |
| High School Diploma | 0 (0.0%) | 0 (0.0%) |
| College or Associate's Degree | 0 (0.0%) | 0 (0.0%) |
| Bachelor's Degree | 0 (0.0%) | 0 (0.0%) |
| Graduate Degree | 0 (0.0%) | 0 (0.0%) |
| Total | 0 (0.0%) | 0 (0.0%) |
Employment Characteristics in Buhl
Employment by Class of Employer in Buhl
Among the 490 employed individuals in Buhl, private company employees (352 | 71.8%), not-for-profit organizations (72 | 14.7%), and local government employees (50 | 10.2%) make up the most common classes of employment.
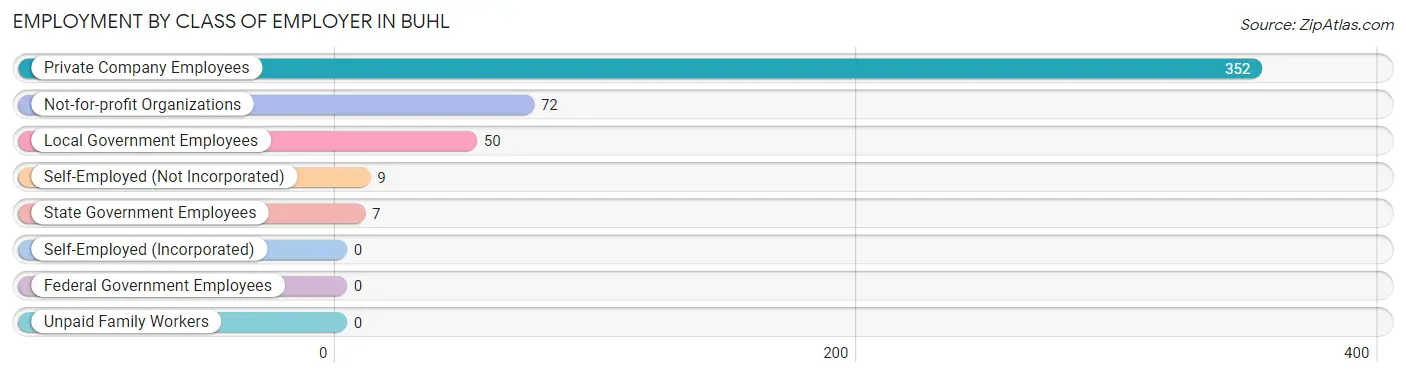
| Employer Class | # Employees | % Employees |
| Private Company Employees | 352 | 71.8% |
| Self-Employed (Incorporated) | 0 | 0.0% |
| Self-Employed (Not Incorporated) | 9 | 1.8% |
| Not-for-profit Organizations | 72 | 14.7% |
| Local Government Employees | 50 | 10.2% |
| State Government Employees | 7 | 1.4% |
| Federal Government Employees | 0 | 0.0% |
| Unpaid Family Workers | 0 | 0.0% |
| Total | 490 | 100.0% |
Employment Status by Age in Buhl
According to the labor force statistics for Buhl, out of the total population over 16 years of age (837), 62.7% or 525 individuals are in the labor force, with 5.0% or 26 of them unemployed. The age group with the highest labor force participation rate is 20 to 24 years, with 100.0% or 87 individuals in the labor force. Within the labor force, the 60 to 64 years age range has the highest percentage of unemployed individuals, with 38.9% or 14 of them being unemployed.
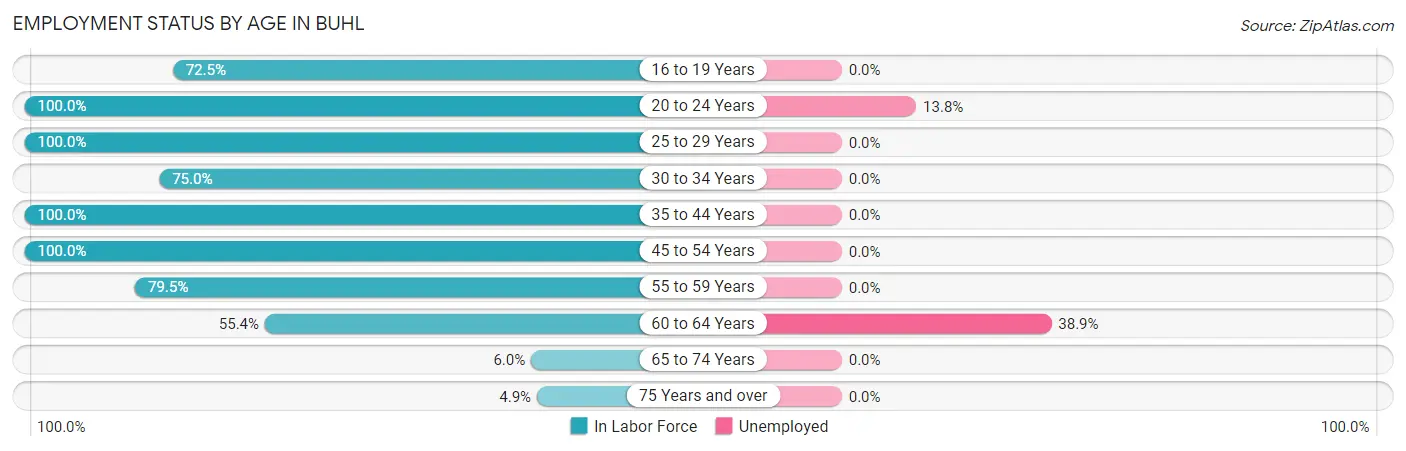
| Age Bracket | In Labor Force | Unemployed |
| 16 to 19 Years | 37 (72.5%) | 0 (0.0%) |
| 20 to 24 Years | 87 (100.0%) | 12 (13.8%) |
| 25 to 29 Years | 45 (100.0%) | 0 (0.0%) |
| 30 to 34 Years | 24 (75.0%) | 0 (0.0%) |
| 35 to 44 Years | 58 (100.0%) | 0 (0.0%) |
| 45 to 54 Years | 162 (100.0%) | 0 (0.0%) |
| 55 to 59 Years | 62 (79.5%) | 0 (0.0%) |
| 60 to 64 Years | 36 (55.4%) | 14 (38.9%) |
| 65 to 74 Years | 7 (6.0%) | 0 (0.0%) |
| 75 Years and over | 7 (4.9%) | 0 (0.0%) |
| Total | 525 (62.7%) | 26 (5.0%) |
Employment Status by Educational Attainment in Buhl
According to labor force statistics for Buhl, 88.0% of individuals (387) out of the total population between 25 and 64 years of age (440) are in the labor force, with 3.6% or 14 of them being unemployed. The group with the highest labor force participation rate are those with the educational attainment of bachelor's degree or higher, with 100.0% or 86 individuals in the labor force. Within the labor force, individuals with high school diploma education have the highest percentage of unemployment, with 7.1% or 12 of them being unemployed.
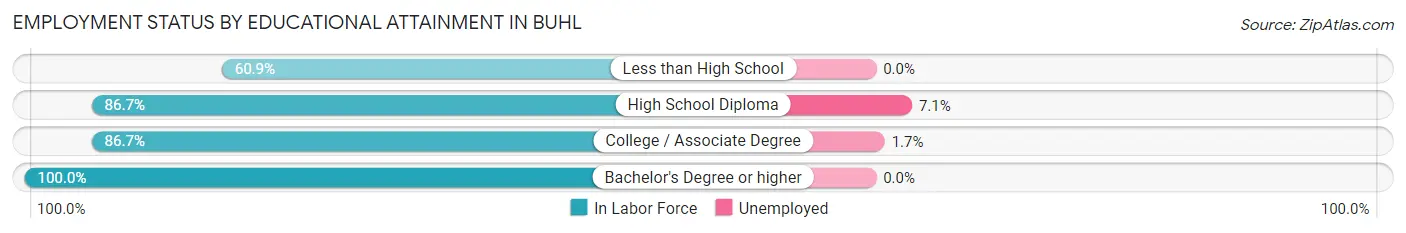
| Educational Attainment | In Labor Force | Unemployed |
| Less than High School | 14 (60.9%) | 0 (0.0%) |
| High School Diploma | 170 (86.7%) | 14 (7.1%) |
| College / Associate Degree | 117 (86.7%) | 2 (1.7%) |
| Bachelor's Degree or higher | 86 (100.0%) | 0 (0.0%) |
| Total | 387 (88.0%) | 16 (3.6%) |
Employment Occupations by Sex in Buhl
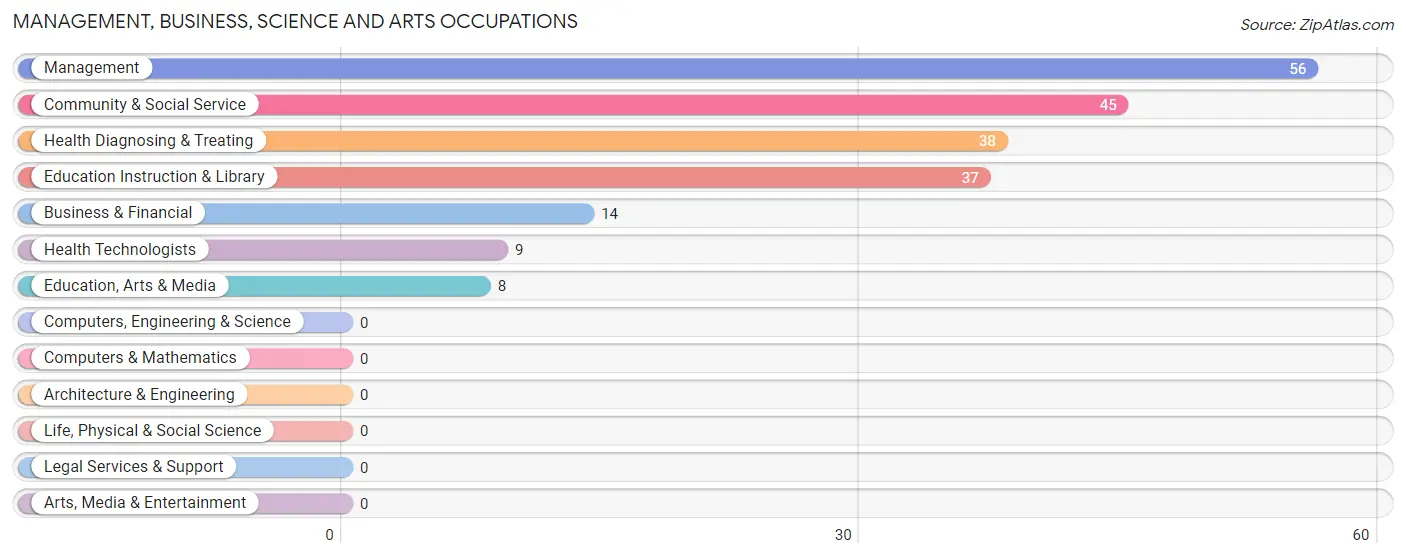
Management, Business, Science and Arts Occupations
The most common Management, Business, Science and Arts occupations in Buhl are Management (56 | 11.2%), Community & Social Service (45 | 9.0%), Health Diagnosing & Treating (38 | 7.6%), Education Instruction & Library (37 | 7.4%), and Business & Financial (14 | 2.8%).
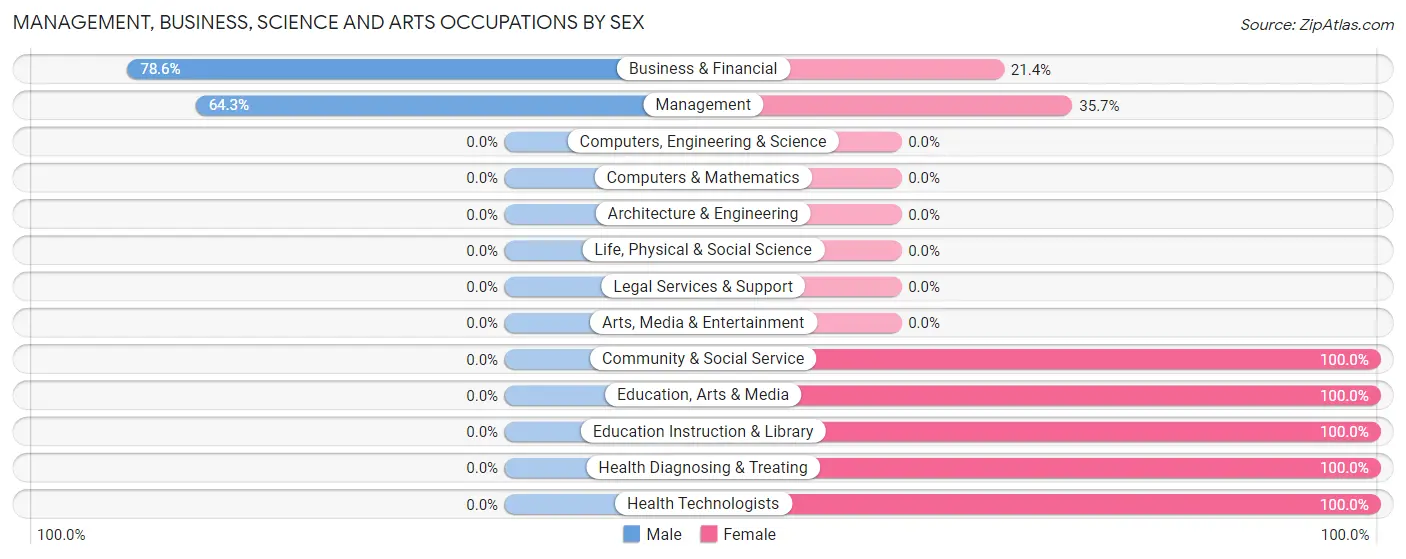
Management, Business, Science and Arts Occupations by Sex
Within the Management, Business, Science and Arts occupations in Buhl, the most male-oriented occupations are Business & Financial (78.6%), and Management (64.3%), while the most female-oriented occupations are Community & Social Service (100.0%), Education, Arts & Media (100.0%), and Education Instruction & Library (100.0%).
| Occupation | Male | Female |
| Management | 36 (64.3%) | 20 (35.7%) |
| Business & Financial | 11 (78.6%) | 3 (21.4%) |
| Computers, Engineering & Science | 0 (0.0%) | 0 (0.0%) |
| Computers & Mathematics | 0 (0.0%) | 0 (0.0%) |
| Architecture & Engineering | 0 (0.0%) | 0 (0.0%) |
| Life, Physical & Social Science | 0 (0.0%) | 0 (0.0%) |
| Community & Social Service | 0 (0.0%) | 45 (100.0%) |
| Education, Arts & Media | 0 (0.0%) | 8 (100.0%) |
| Legal Services & Support | 0 (0.0%) | 0 (0.0%) |
| Education Instruction & Library | 0 (0.0%) | 37 (100.0%) |
| Arts, Media & Entertainment | 0 (0.0%) | 0 (0.0%) |
| Health Diagnosing & Treating | 0 (0.0%) | 38 (100.0%) |
| Health Technologists | 0 (0.0%) | 9 (100.0%) |
| Total (Category) | 47 (30.7%) | 106 (69.3%) |
| Total (Overall) | 244 (48.9%) | 255 (51.1%) |
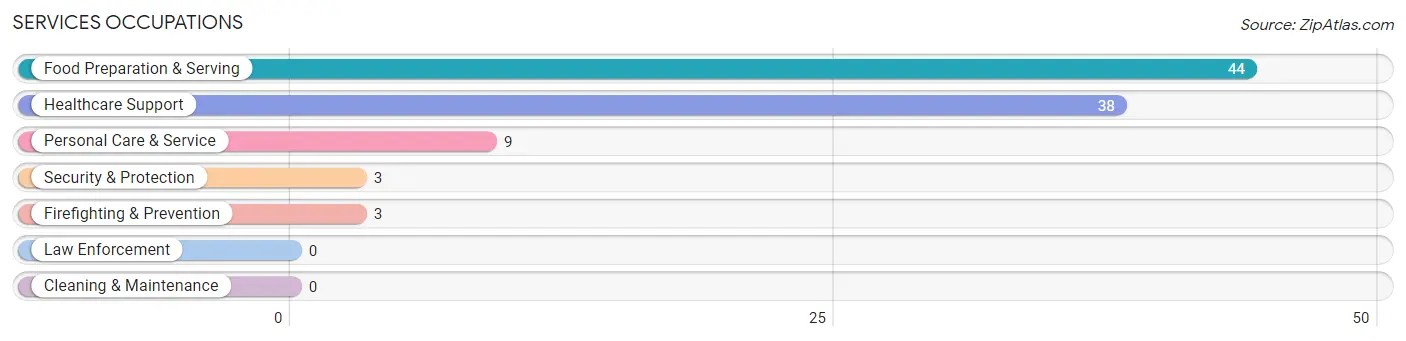
Services Occupations
The most common Services occupations in Buhl are Food Preparation & Serving (44 | 8.8%), Healthcare Support (38 | 7.6%), Personal Care & Service (9 | 1.8%), Security & Protection (3 | 0.6%), and Firefighting & Prevention (3 | 0.6%).
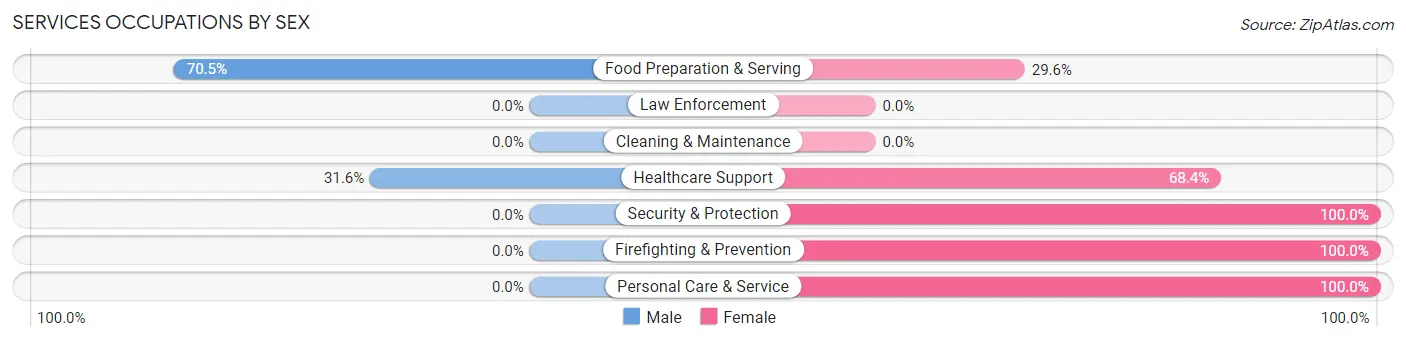
Services Occupations by Sex
Within the Services occupations in Buhl, the most male-oriented occupations are Food Preparation & Serving (70.5%), and Healthcare Support (31.6%), while the most female-oriented occupations are Security & Protection (100.0%), Firefighting & Prevention (100.0%), and Personal Care & Service (100.0%).
| Occupation | Male | Female |
| Healthcare Support | 12 (31.6%) | 26 (68.4%) |
| Security & Protection | 0 (0.0%) | 3 (100.0%) |
| Firefighting & Prevention | 0 (0.0%) | 3 (100.0%) |
| Law Enforcement | 0 (0.0%) | 0 (0.0%) |
| Food Preparation & Serving | 31 (70.5%) | 13 (29.5%) |
| Cleaning & Maintenance | 0 (0.0%) | 0 (0.0%) |
| Personal Care & Service | 0 (0.0%) | 9 (100.0%) |
| Total (Category) | 43 (45.7%) | 51 (54.3%) |
| Total (Overall) | 244 (48.9%) | 255 (51.1%) |
Sales and Office Occupations
The most common Sales and Office occupations in Buhl are Sales & Related (49 | 9.8%), and Office & Administration (26 | 5.2%).
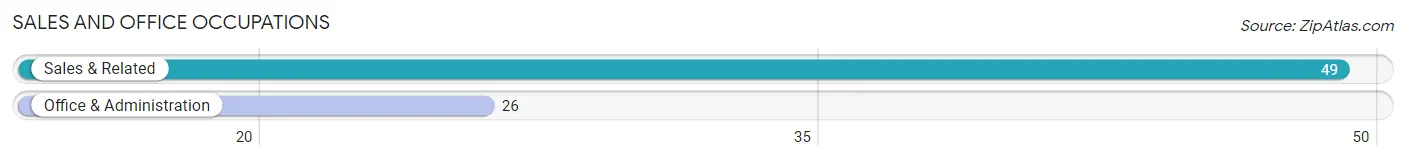
Sales and Office Occupations by Sex

| Occupation | Male | Female |
| Sales & Related | 0 (0.0%) | 49 (100.0%) |
| Office & Administration | 0 (0.0%) | 26 (100.0%) |
| Total (Category) | 0 (0.0%) | 75 (100.0%) |
| Total (Overall) | 244 (48.9%) | 255 (51.1%) |
Natural Resources, Construction and Maintenance Occupations
The most common Natural Resources, Construction and Maintenance occupations in Buhl are , and Installation, Maintenance & Repair (43 | 8.6%).
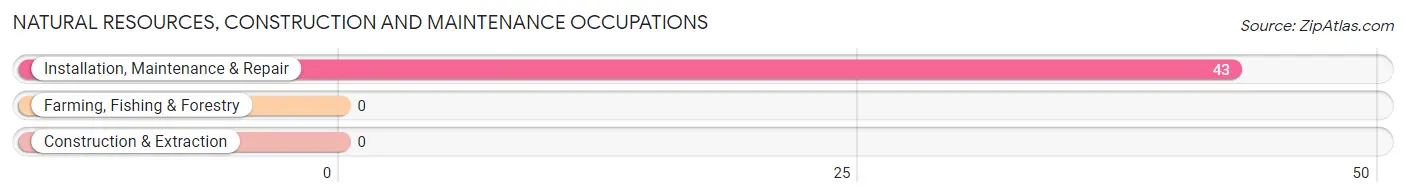
Natural Resources, Construction and Maintenance Occupations by Sex

| Occupation | Male | Female |
| Farming, Fishing & Forestry | 0 (0.0%) | 0 (0.0%) |
| Construction & Extraction | 0 (0.0%) | 0 (0.0%) |
| Installation, Maintenance & Repair | 43 (100.0%) | 0 (0.0%) |
| Total (Category) | 43 (100.0%) | 0 (0.0%) |
| Total (Overall) | 244 (48.9%) | 255 (51.1%) |
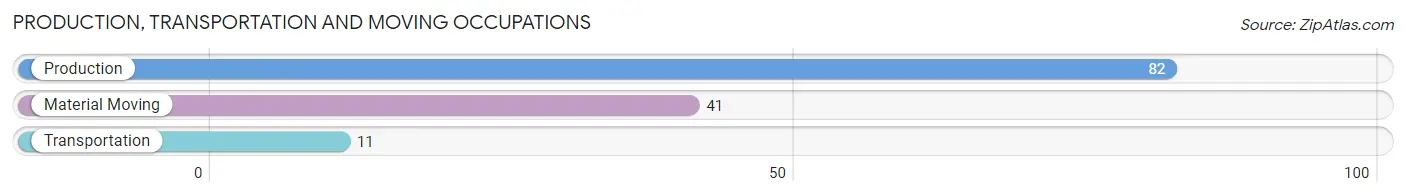
Production, Transportation and Moving Occupations
The most common Production, Transportation and Moving occupations in Buhl are Production (82 | 16.4%), Material Moving (41 | 8.2%), and Transportation (11 | 2.2%).
Production, Transportation and Moving Occupations by Sex
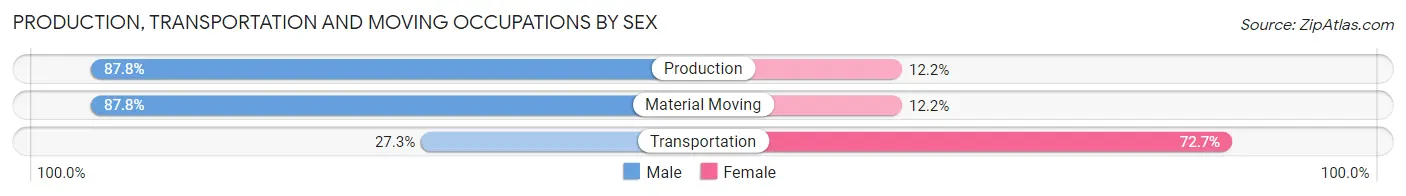
| Occupation | Male | Female |
| Production | 72 (87.8%) | 10 (12.2%) |
| Transportation | 3 (27.3%) | 8 (72.7%) |
| Material Moving | 36 (87.8%) | 5 (12.2%) |
| Total (Category) | 111 (82.8%) | 23 (17.2%) |
| Total (Overall) | 244 (48.9%) | 255 (51.1%) |
Employment Industries by Sex in Buhl
Employment Industries in Buhl
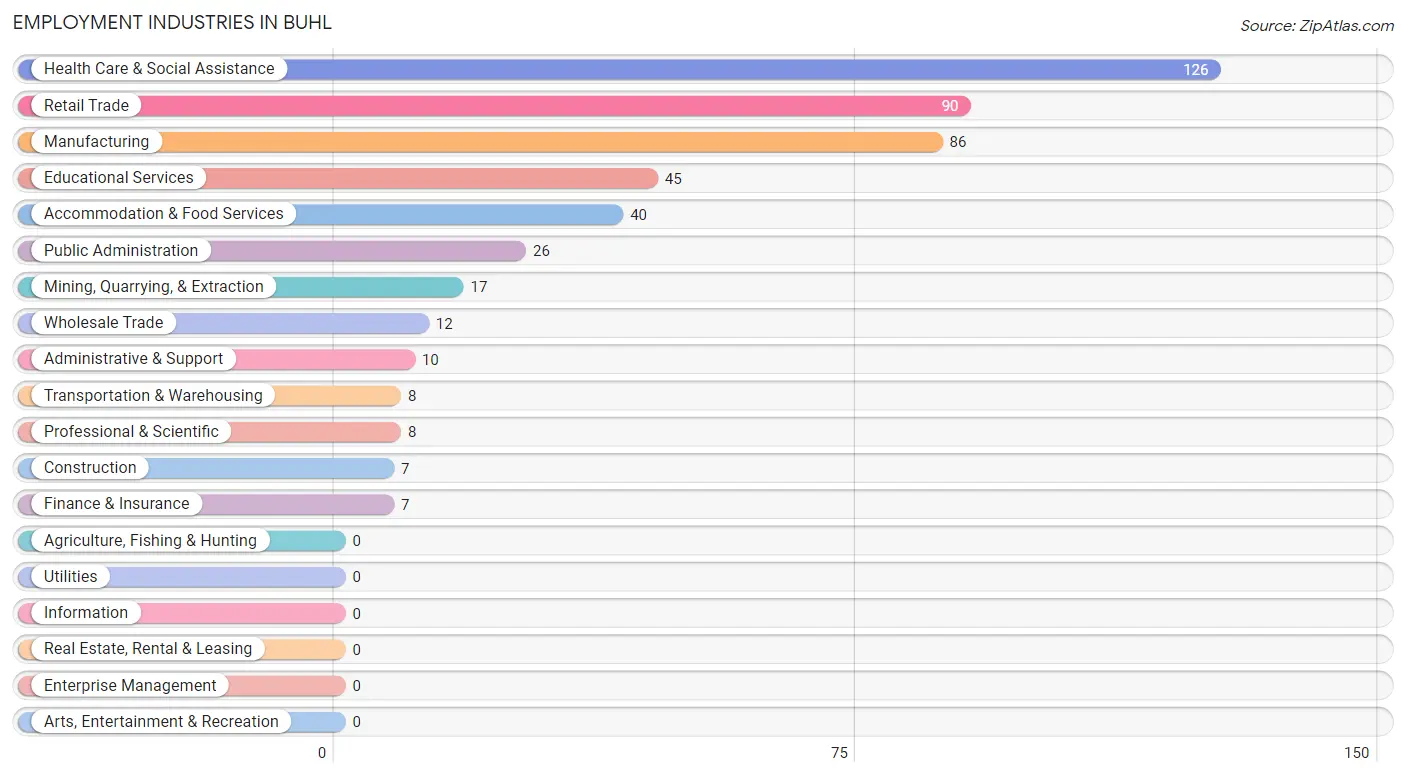
The major employment industries in Buhl include Health Care & Social Assistance (126 | 25.3%), Retail Trade (90 | 18.0%), Manufacturing (86 | 17.2%), Educational Services (45 | 9.0%), and Accommodation & Food Services (40 | 8.0%).
Employment Industries by Sex in Buhl
The Buhl industries that see more men than women are Mining, Quarrying, & Extraction (100.0%), Construction (100.0%), and Manufacturing (100.0%), whereas the industries that tend to have a higher number of women are Transportation & Warehousing (100.0%), Administrative & Support (100.0%), and Educational Services (100.0%).
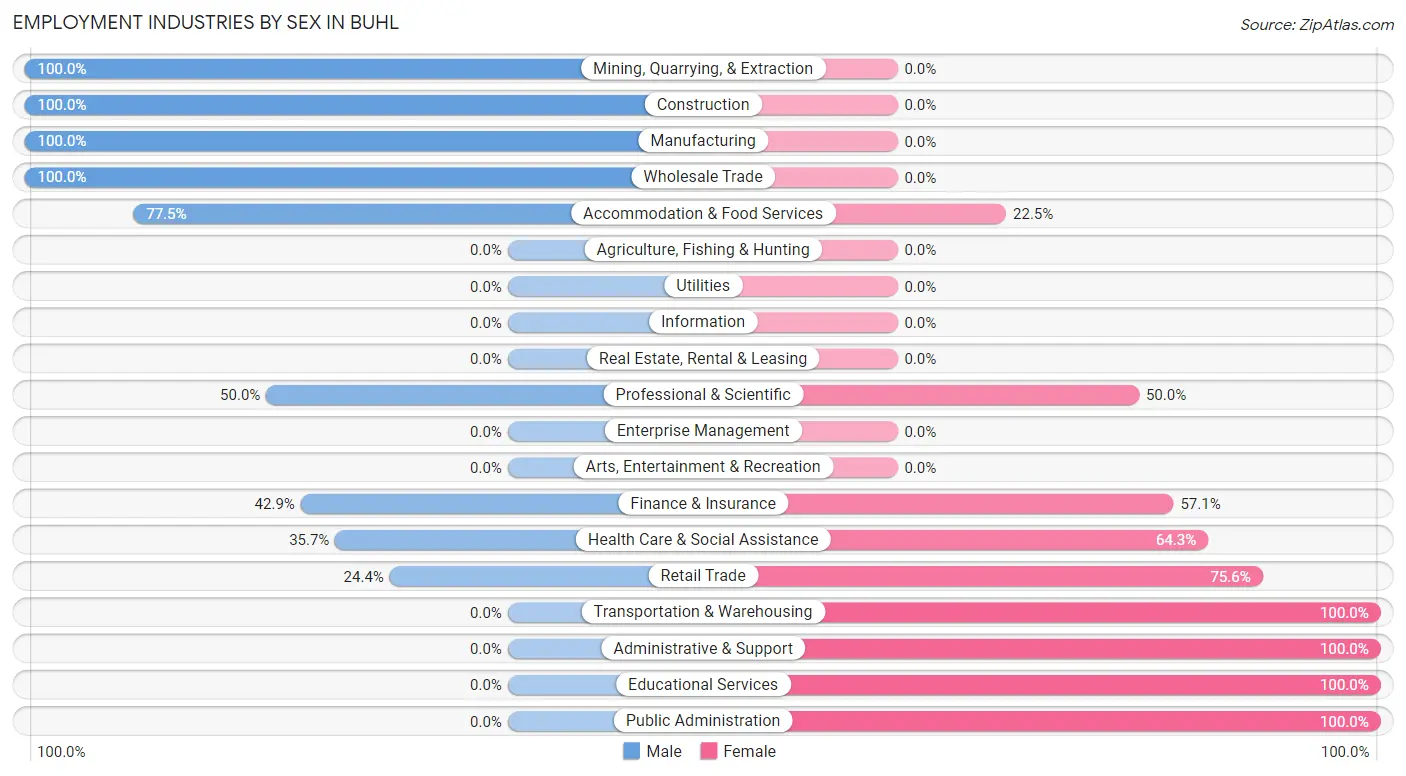
| Industry | Male | Female |
| Agriculture, Fishing & Hunting | 0 (0.0%) | 0 (0.0%) |
| Mining, Quarrying, & Extraction | 17 (100.0%) | 0 (0.0%) |
| Construction | 7 (100.0%) | 0 (0.0%) |
| Manufacturing | 86 (100.0%) | 0 (0.0%) |
| Wholesale Trade | 12 (100.0%) | 0 (0.0%) |
| Retail Trade | 22 (24.4%) | 68 (75.6%) |
| Transportation & Warehousing | 0 (0.0%) | 8 (100.0%) |
| Utilities | 0 (0.0%) | 0 (0.0%) |
| Information | 0 (0.0%) | 0 (0.0%) |
| Finance & Insurance | 3 (42.9%) | 4 (57.1%) |
| Real Estate, Rental & Leasing | 0 (0.0%) | 0 (0.0%) |
| Professional & Scientific | 4 (50.0%) | 4 (50.0%) |
| Enterprise Management | 0 (0.0%) | 0 (0.0%) |
| Administrative & Support | 0 (0.0%) | 10 (100.0%) |
| Educational Services | 0 (0.0%) | 45 (100.0%) |
| Health Care & Social Assistance | 45 (35.7%) | 81 (64.3%) |
| Arts, Entertainment & Recreation | 0 (0.0%) | 0 (0.0%) |
| Accommodation & Food Services | 31 (77.5%) | 9 (22.5%) |
| Public Administration | 0 (0.0%) | 26 (100.0%) |
| Total | 244 (48.9%) | 255 (51.1%) |
Education in Buhl
School Enrollment in Buhl
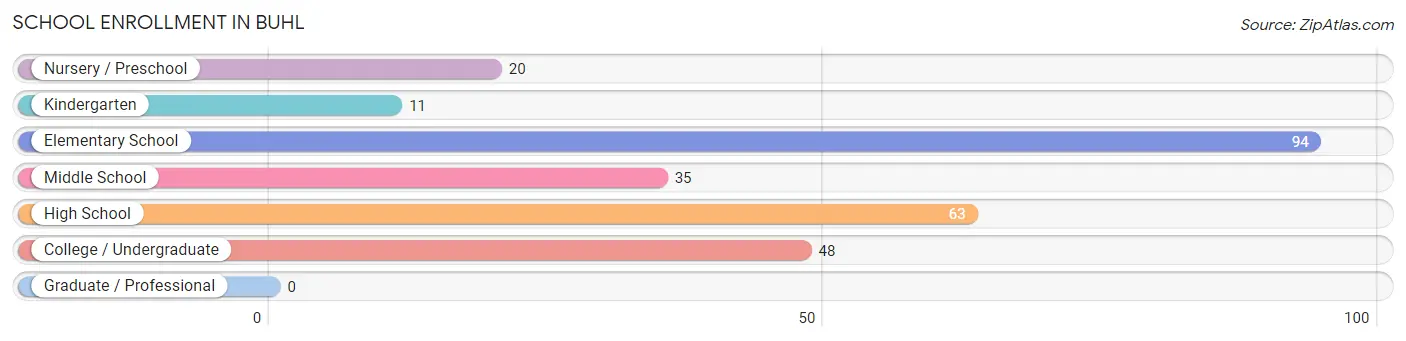
The most common levels of schooling among the 271 students in Buhl are elementary school (94 | 34.7%), high school (63 | 23.3%), and college / undergraduate (48 | 17.7%).
| School Level | # Students | % Students |
| Nursery / Preschool | 20 | 7.4% |
| Kindergarten | 11 | 4.1% |
| Elementary School | 94 | 34.7% |
| Middle School | 35 | 12.9% |
| High School | 63 | 23.3% |
| College / Undergraduate | 48 | 17.7% |
| Graduate / Professional | 0 | 0.0% |
| Total | 271 | 100.0% |
School Enrollment by Age by Funding Source in Buhl
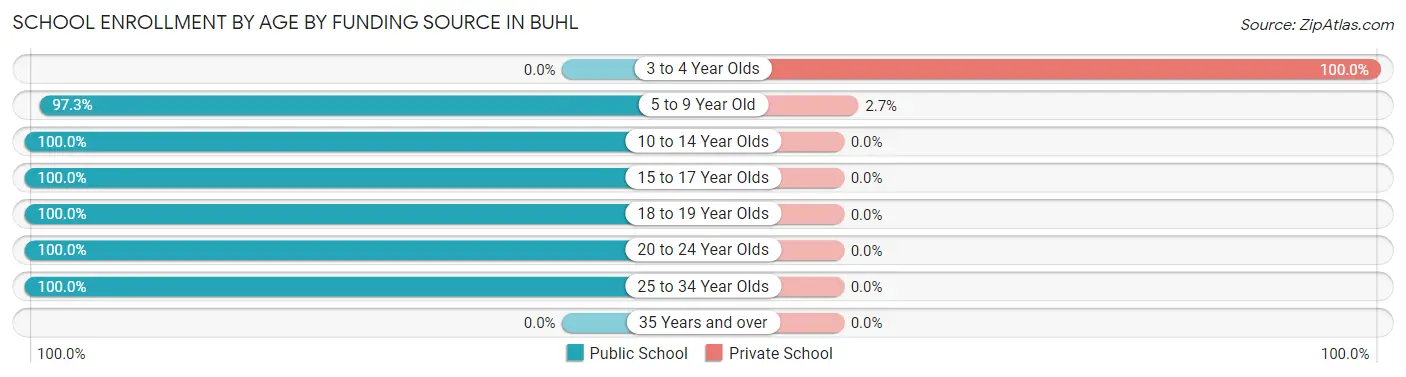
Out of a total of 271 students who are enrolled in schools in Buhl, 6 (2.2%) attend a private institution, while the remaining 265 (97.8%) are enrolled in public schools. The age group of 3 to 4 year olds has the highest likelihood of being enrolled in private schools, with 3 (100.0% in the age bracket) enrolled. Conversely, the age group of 10 to 14 year olds has the lowest likelihood of being enrolled in a private school, with 47 (100.0% in the age bracket) attending a public institution.
| Age Bracket | Public School | Private School |
| 3 to 4 Year Olds | 0 (0.0%) | 3 (100.0%) |
| 5 to 9 Year Old | 107 (97.3%) | 3 (2.7%) |
| 10 to 14 Year Olds | 47 (100.0%) | 0 (0.0%) |
| 15 to 17 Year Olds | 52 (100.0%) | 0 (0.0%) |
| 18 to 19 Year Olds | 11 (100.0%) | 0 (0.0%) |
| 20 to 24 Year Olds | 40 (100.0%) | 0 (0.0%) |
| 25 to 34 Year Olds | 8 (100.0%) | 0 (0.0%) |
| 35 Years and over | 0 (0.0%) | 0 (0.0%) |
| Total | 265 (97.8%) | 6 (2.2%) |
Educational Attainment by Field of Study in Buhl
Science & technology (35 | 26.9%), education (23 | 17.7%), psychology (20 | 15.4%), business (12 | 9.2%), and liberal arts & history (11 | 8.5%) are the most common fields of study among 130 individuals in Buhl who have obtained a bachelor's degree or higher.
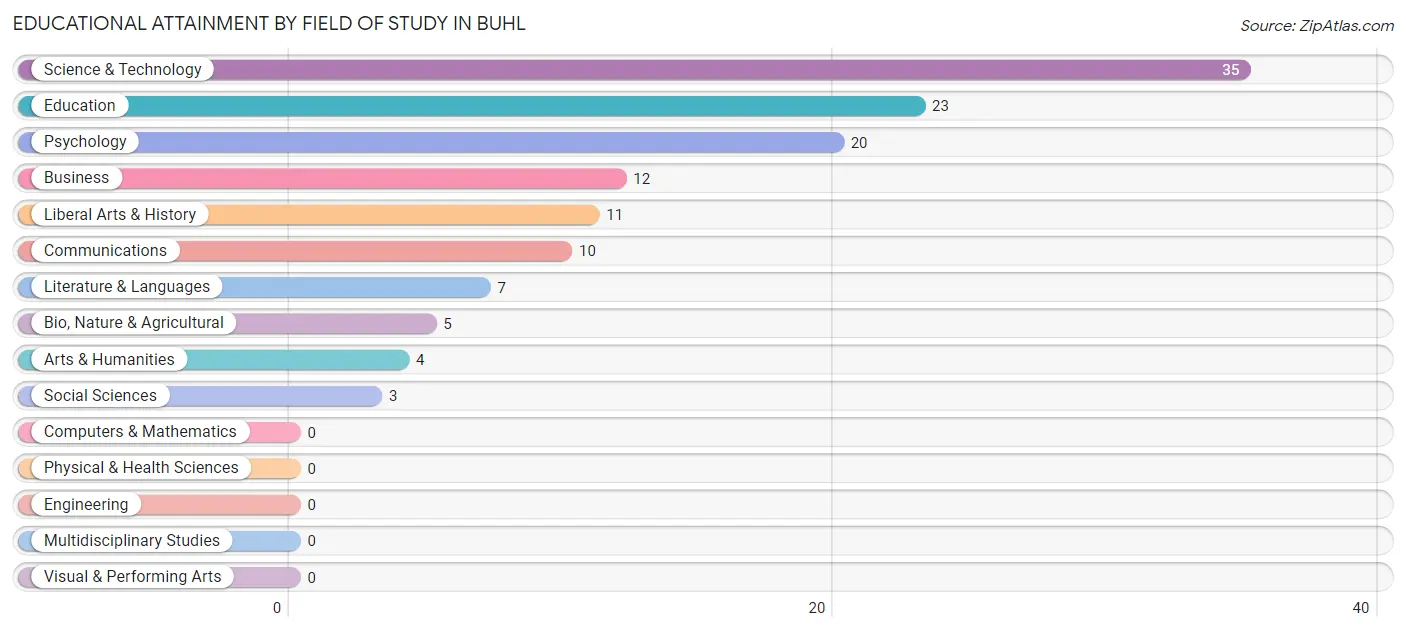
| Field of Study | # Graduates | % Graduates |
| Computers & Mathematics | 0 | 0.0% |
| Bio, Nature & Agricultural | 5 | 3.8% |
| Physical & Health Sciences | 0 | 0.0% |
| Psychology | 20 | 15.4% |
| Social Sciences | 3 | 2.3% |
| Engineering | 0 | 0.0% |
| Multidisciplinary Studies | 0 | 0.0% |
| Science & Technology | 35 | 26.9% |
| Business | 12 | 9.2% |
| Education | 23 | 17.7% |
| Literature & Languages | 7 | 5.4% |
| Liberal Arts & History | 11 | 8.5% |
| Visual & Performing Arts | 0 | 0.0% |
| Communications | 10 | 7.7% |
| Arts & Humanities | 4 | 3.1% |
| Total | 130 | 100.0% |
Transportation & Commute in Buhl
Vehicle Availability by Sex in Buhl
The most prevalent vehicle ownership categories in Buhl are males with 4 vehicles (74, accounting for 30.3%) and females with 4 vehicles (72, making up 30.3%).
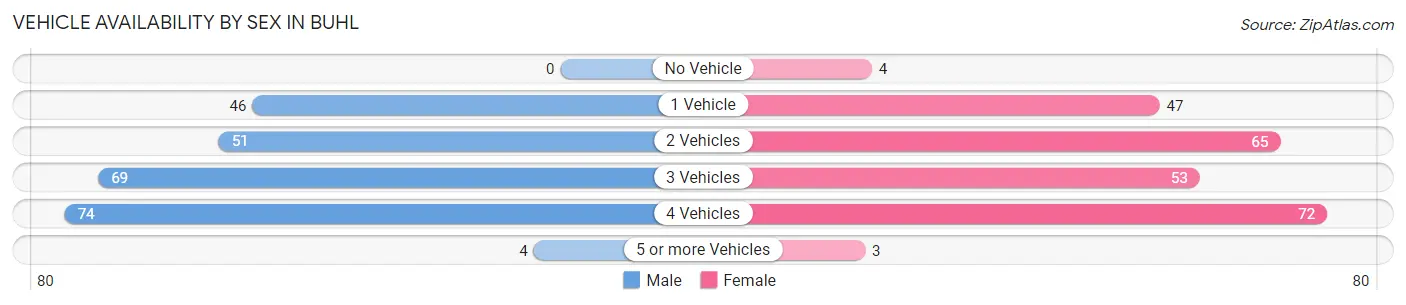
| Vehicles Available | Male | Female |
| No Vehicle | 0 (0.0%) | 4 (1.6%) |
| 1 Vehicle | 46 (18.9%) | 47 (19.3%) |
| 2 Vehicles | 51 (20.9%) | 65 (26.6%) |
| 3 Vehicles | 69 (28.3%) | 53 (21.7%) |
| 4 Vehicles | 74 (30.3%) | 72 (29.5%) |
| 5 or more Vehicles | 4 (1.6%) | 3 (1.2%) |
| Total | 244 (100.0%) | 244 (100.0%) |
Commute Time in Buhl
The most frequently occuring commute durations in Buhl are 15 to 19 minutes (144 commuters, 30.1%), 5 to 9 minutes (129 commuters, 27.0%), and 10 to 14 minutes (88 commuters, 18.4%).
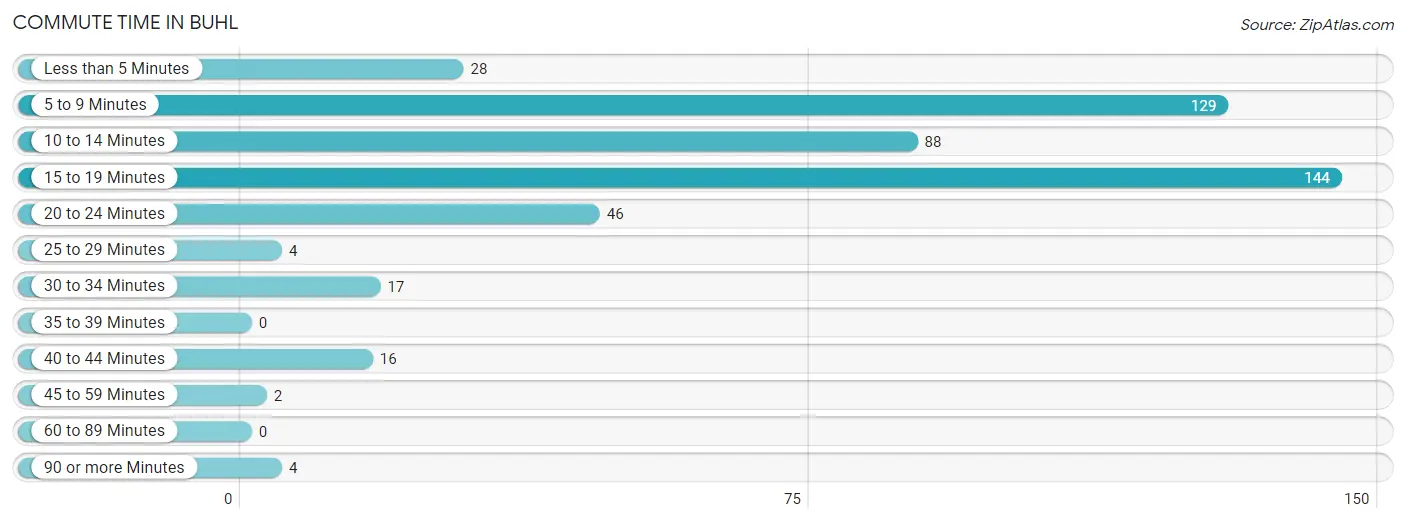
| Commute Time | # Commuters | % Commuters |
| Less than 5 Minutes | 28 | 5.9% |
| 5 to 9 Minutes | 129 | 27.0% |
| 10 to 14 Minutes | 88 | 18.4% |
| 15 to 19 Minutes | 144 | 30.1% |
| 20 to 24 Minutes | 46 | 9.6% |
| 25 to 29 Minutes | 4 | 0.8% |
| 30 to 34 Minutes | 17 | 3.6% |
| 35 to 39 Minutes | 0 | 0.0% |
| 40 to 44 Minutes | 16 | 3.4% |
| 45 to 59 Minutes | 2 | 0.4% |
| 60 to 89 Minutes | 0 | 0.0% |
| 90 or more Minutes | 4 | 0.8% |
Commute Time by Sex in Buhl
The most common commute times in Buhl are 15 to 19 minutes (104 commuters, 43.9%) for males and 10 to 14 minutes (72 commuters, 29.9%) for females.
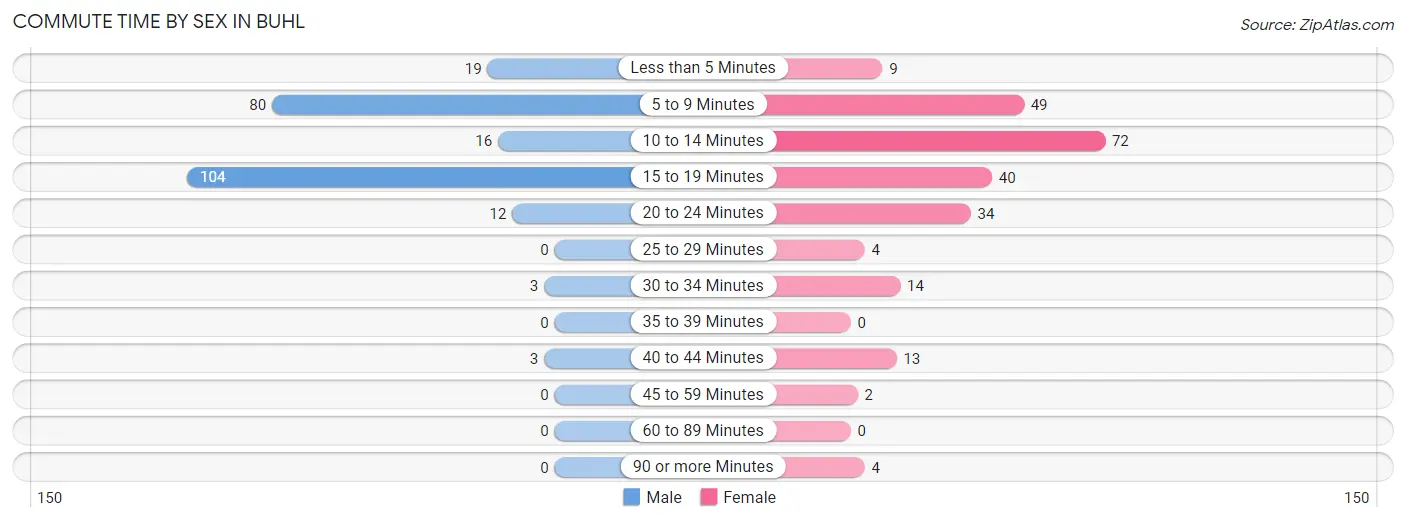
| Commute Time | Male | Female |
| Less than 5 Minutes | 19 (8.0%) | 9 (3.7%) |
| 5 to 9 Minutes | 80 (33.8%) | 49 (20.3%) |
| 10 to 14 Minutes | 16 (6.8%) | 72 (29.9%) |
| 15 to 19 Minutes | 104 (43.9%) | 40 (16.6%) |
| 20 to 24 Minutes | 12 (5.1%) | 34 (14.1%) |
| 25 to 29 Minutes | 0 (0.0%) | 4 (1.7%) |
| 30 to 34 Minutes | 3 (1.3%) | 14 (5.8%) |
| 35 to 39 Minutes | 0 (0.0%) | 0 (0.0%) |
| 40 to 44 Minutes | 3 (1.3%) | 13 (5.4%) |
| 45 to 59 Minutes | 0 (0.0%) | 2 (0.8%) |
| 60 to 89 Minutes | 0 (0.0%) | 0 (0.0%) |
| 90 or more Minutes | 0 (0.0%) | 4 (1.7%) |
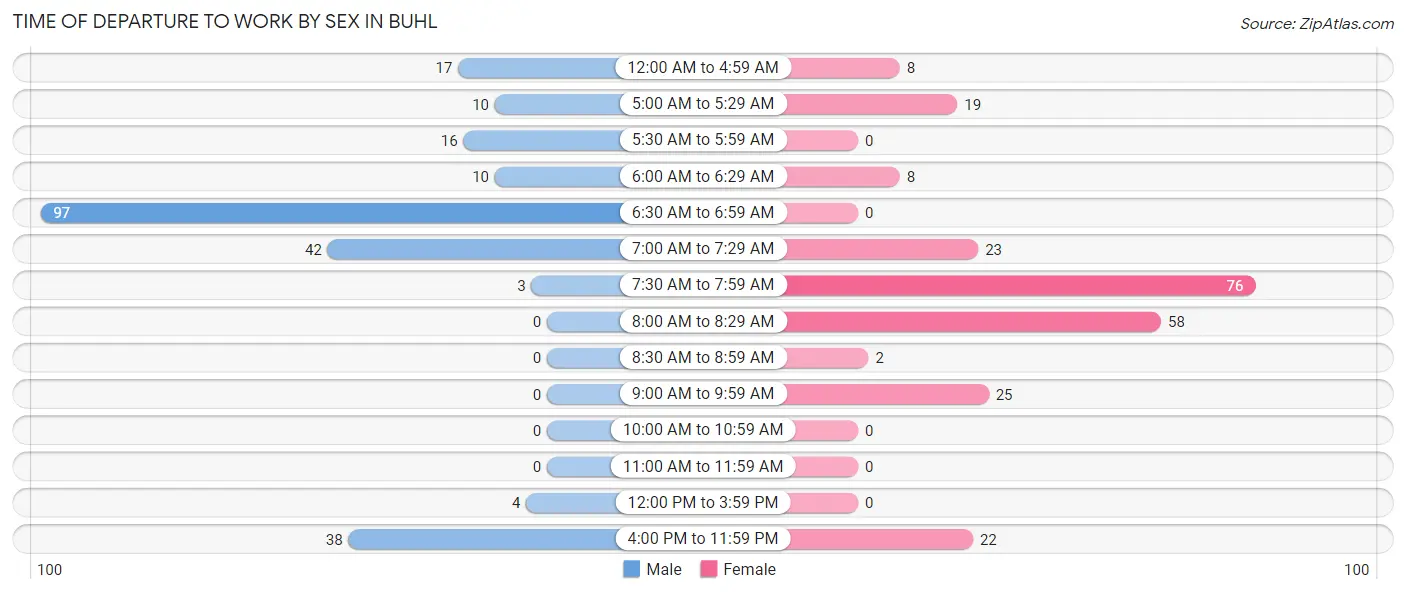
Time of Departure to Work by Sex in Buhl
The most frequent times of departure to work in Buhl are 6:30 AM to 6:59 AM (97, 40.9%) for males and 7:30 AM to 7:59 AM (76, 31.5%) for females.
| Time of Departure | Male | Female |
| 12:00 AM to 4:59 AM | 17 (7.2%) | 8 (3.3%) |
| 5:00 AM to 5:29 AM | 10 (4.2%) | 19 (7.9%) |
| 5:30 AM to 5:59 AM | 16 (6.8%) | 0 (0.0%) |
| 6:00 AM to 6:29 AM | 10 (4.2%) | 8 (3.3%) |
| 6:30 AM to 6:59 AM | 97 (40.9%) | 0 (0.0%) |
| 7:00 AM to 7:29 AM | 42 (17.7%) | 23 (9.5%) |
| 7:30 AM to 7:59 AM | 3 (1.3%) | 76 (31.5%) |
| 8:00 AM to 8:29 AM | 0 (0.0%) | 58 (24.1%) |
| 8:30 AM to 8:59 AM | 0 (0.0%) | 2 (0.8%) |
| 9:00 AM to 9:59 AM | 0 (0.0%) | 25 (10.4%) |
| 10:00 AM to 10:59 AM | 0 (0.0%) | 0 (0.0%) |
| 11:00 AM to 11:59 AM | 0 (0.0%) | 0 (0.0%) |
| 12:00 PM to 3:59 PM | 4 (1.7%) | 0 (0.0%) |
| 4:00 PM to 11:59 PM | 38 (16.0%) | 22 (9.1%) |
| Total | 237 (100.0%) | 241 (100.0%) |
Housing Occupancy in Buhl
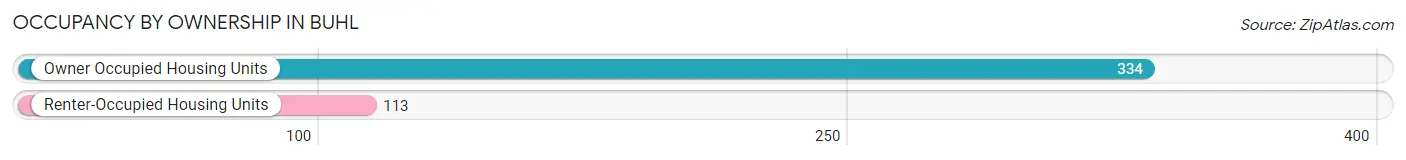
Occupancy by Ownership in Buhl
Of the total 447 dwellings in Buhl, owner-occupied units account for 334 (74.7%), while renter-occupied units make up 113 (25.3%).
| Occupancy | # Housing Units | % Housing Units |
| Owner Occupied Housing Units | 334 | 74.7% |
| Renter-Occupied Housing Units | 113 | 25.3% |
| Total Occupied Housing Units | 447 | 100.0% |
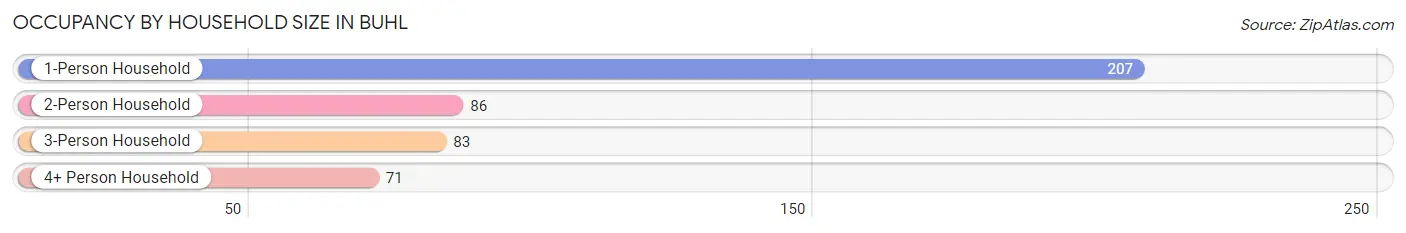
Occupancy by Household Size in Buhl
| Household Size | # Housing Units | % Housing Units |
| 1-Person Household | 207 | 46.3% |
| 2-Person Household | 86 | 19.2% |
| 3-Person Household | 83 | 18.6% |
| 4+ Person Household | 71 | 15.9% |
| Total Housing Units | 447 | 100.0% |
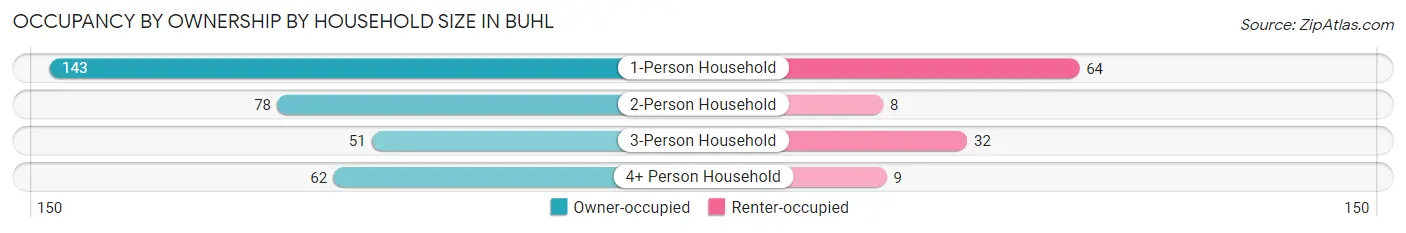
Occupancy by Ownership by Household Size in Buhl
| Household Size | Owner-occupied | Renter-occupied |
| 1-Person Household | 143 (69.1%) | 64 (30.9%) |
| 2-Person Household | 78 (90.7%) | 8 (9.3%) |
| 3-Person Household | 51 (61.5%) | 32 (38.6%) |
| 4+ Person Household | 62 (87.3%) | 9 (12.7%) |
| Total Housing Units | 334 (74.7%) | 113 (25.3%) |
Occupancy by Educational Attainment in Buhl
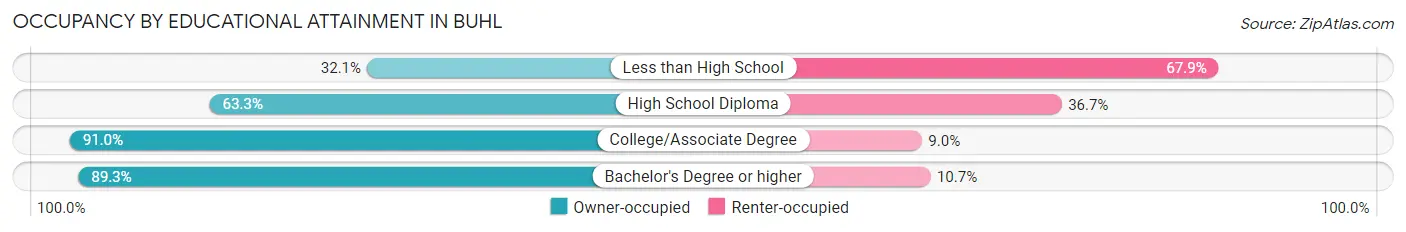
| Household Size | Owner-occupied | Renter-occupied |
| Less than High School | 9 (32.1%) | 19 (67.9%) |
| High School Diploma | 126 (63.3%) | 73 (36.7%) |
| College/Associate Degree | 132 (91.0%) | 13 (9.0%) |
| Bachelor's Degree or higher | 67 (89.3%) | 8 (10.7%) |
Occupancy by Age of Householder in Buhl
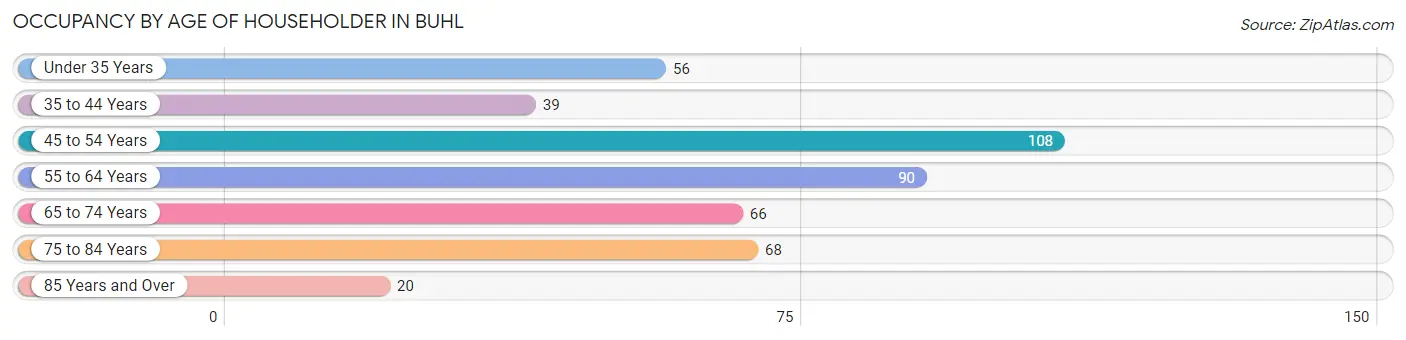
| Age Bracket | # Households | % Households |
| Under 35 Years | 56 | 12.5% |
| 35 to 44 Years | 39 | 8.7% |
| 45 to 54 Years | 108 | 24.2% |
| 55 to 64 Years | 90 | 20.1% |
| 65 to 74 Years | 66 | 14.8% |
| 75 to 84 Years | 68 | 15.2% |
| 85 Years and Over | 20 | 4.5% |
| Total | 447 | 100.0% |
Housing Finances in Buhl
Median Income by Occupancy in Buhl
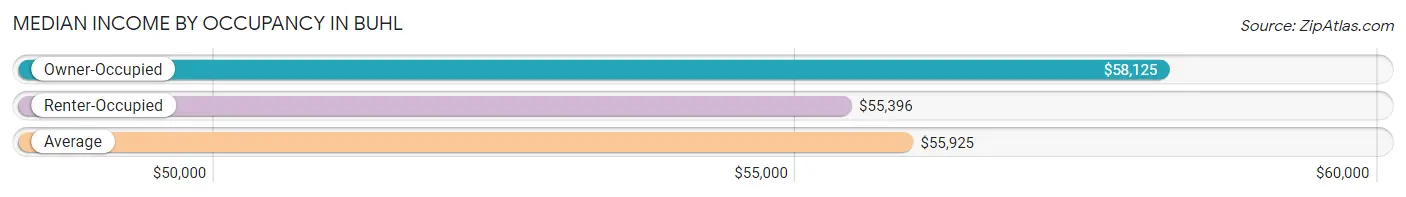
| Occupancy Type | # Households | Median Income |
| Owner-Occupied | 334 (74.7%) | $58,125 |
| Renter-Occupied | 113 (25.3%) | $55,396 |
| Average | 447 (100.0%) | $55,925 |
Occupancy by Householder Income Bracket in Buhl
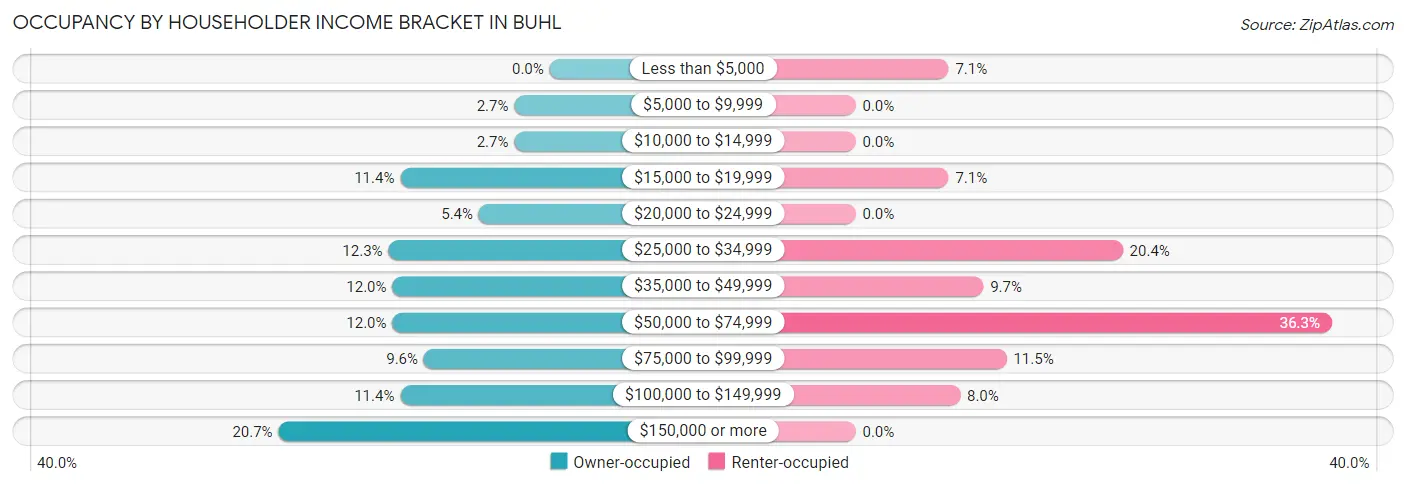
| Income Bracket | Owner-occupied | Renter-occupied |
| Less than $5,000 | 0 (0.0%) | 8 (7.1%) |
| $5,000 to $9,999 | 9 (2.7%) | 0 (0.0%) |
| $10,000 to $14,999 | 9 (2.7%) | 0 (0.0%) |
| $15,000 to $19,999 | 38 (11.4%) | 8 (7.1%) |
| $20,000 to $24,999 | 18 (5.4%) | 0 (0.0%) |
| $25,000 to $34,999 | 41 (12.3%) | 23 (20.3%) |
| $35,000 to $49,999 | 40 (12.0%) | 11 (9.7%) |
| $50,000 to $74,999 | 40 (12.0%) | 41 (36.3%) |
| $75,000 to $99,999 | 32 (9.6%) | 13 (11.5%) |
| $100,000 to $149,999 | 38 (11.4%) | 9 (8.0%) |
| $150,000 or more | 69 (20.7%) | 0 (0.0%) |
| Total | 334 (100.0%) | 113 (100.0%) |
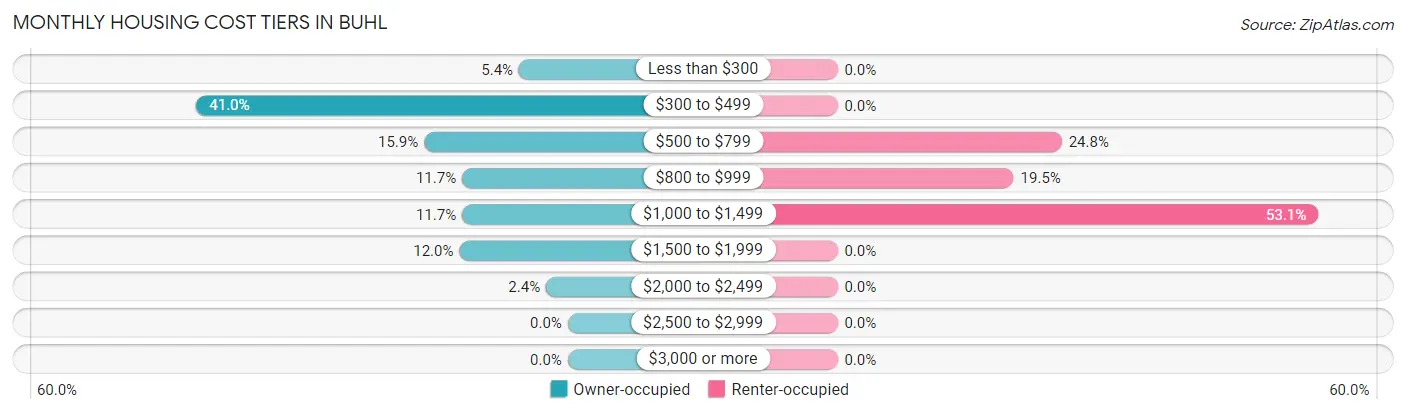
Monthly Housing Cost Tiers in Buhl
| Monthly Cost | Owner-occupied | Renter-occupied |
| Less than $300 | 18 (5.4%) | 0 (0.0%) |
| $300 to $499 | 137 (41.0%) | 0 (0.0%) |
| $500 to $799 | 53 (15.9%) | 28 (24.8%) |
| $800 to $999 | 39 (11.7%) | 22 (19.5%) |
| $1,000 to $1,499 | 39 (11.7%) | 60 (53.1%) |
| $1,500 to $1,999 | 40 (12.0%) | 0 (0.0%) |
| $2,000 to $2,499 | 8 (2.4%) | 0 (0.0%) |
| $2,500 to $2,999 | 0 (0.0%) | 0 (0.0%) |
| $3,000 or more | 0 (0.0%) | 0 (0.0%) |
| Total | 334 (100.0%) | 113 (100.0%) |
Physical Housing Characteristics in Buhl
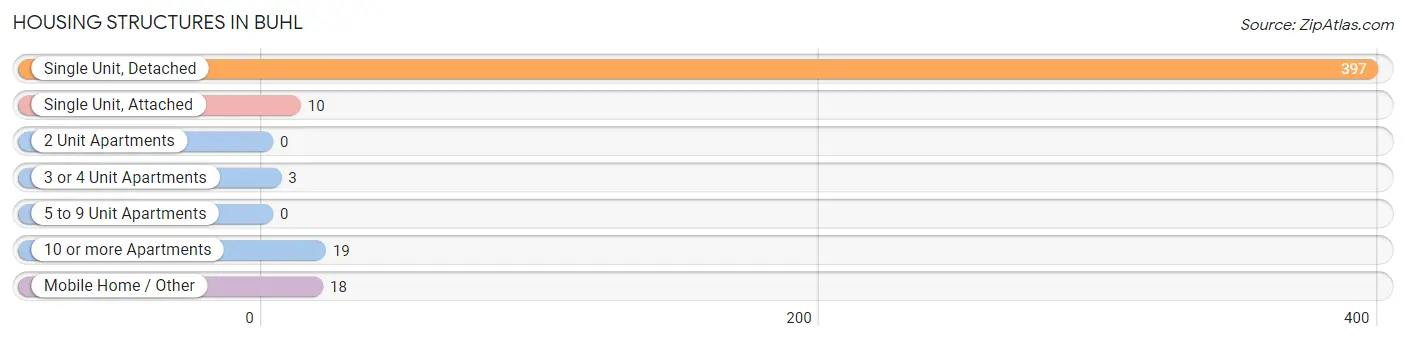
Housing Structures in Buhl
| Structure Type | # Housing Units | % Housing Units |
| Single Unit, Detached | 397 | 88.8% |
| Single Unit, Attached | 10 | 2.2% |
| 2 Unit Apartments | 0 | 0.0% |
| 3 or 4 Unit Apartments | 3 | 0.7% |
| 5 to 9 Unit Apartments | 0 | 0.0% |
| 10 or more Apartments | 19 | 4.3% |
| Mobile Home / Other | 18 | 4.0% |
| Total | 447 | 100.0% |
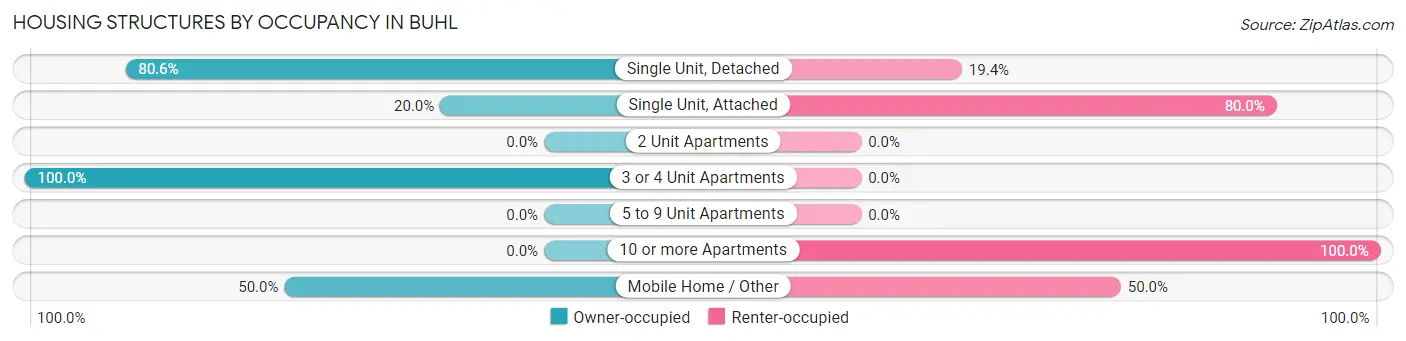
Housing Structures by Occupancy in Buhl
| Structure Type | Owner-occupied | Renter-occupied |
| Single Unit, Detached | 320 (80.6%) | 77 (19.4%) |
| Single Unit, Attached | 2 (20.0%) | 8 (80.0%) |
| 2 Unit Apartments | 0 (0.0%) | 0 (0.0%) |
| 3 or 4 Unit Apartments | 3 (100.0%) | 0 (0.0%) |
| 5 to 9 Unit Apartments | 0 (0.0%) | 0 (0.0%) |
| 10 or more Apartments | 0 (0.0%) | 19 (100.0%) |
| Mobile Home / Other | 9 (50.0%) | 9 (50.0%) |
| Total | 334 (74.7%) | 113 (25.3%) |
Housing Structures by Number of Rooms in Buhl

| Number of Rooms | Owner-occupied | Renter-occupied |
| 1 Room | 0 (0.0%) | 19 (16.8%) |
| 2 or 3 Rooms | 38 (11.4%) | 9 (8.0%) |
| 4 or 5 Rooms | 129 (38.6%) | 66 (58.4%) |
| 6 or 7 Rooms | 110 (32.9%) | 11 (9.7%) |
| 8 or more Rooms | 57 (17.1%) | 8 (7.1%) |
| Total | 334 (100.0%) | 113 (100.0%) |
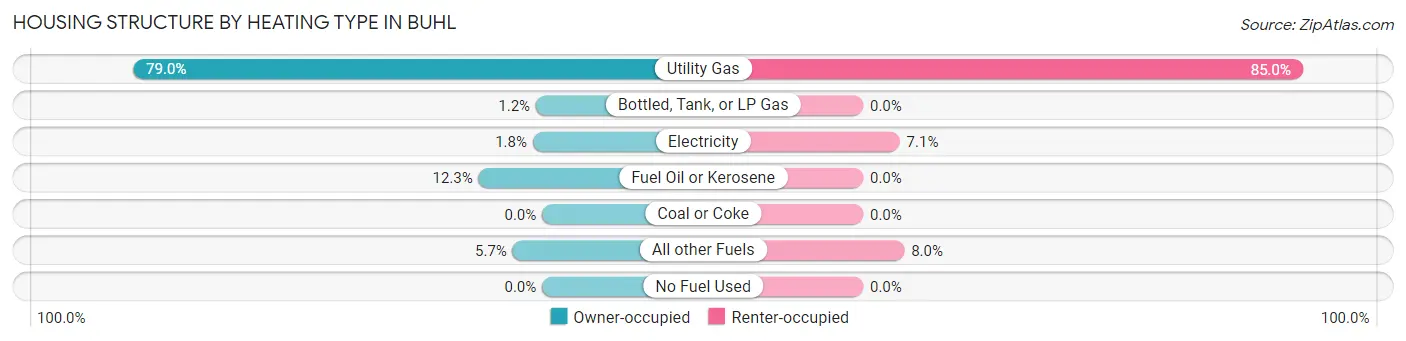
Housing Structure by Heating Type in Buhl
| Heating Type | Owner-occupied | Renter-occupied |
| Utility Gas | 264 (79.0%) | 96 (85.0%) |
| Bottled, Tank, or LP Gas | 4 (1.2%) | 0 (0.0%) |
| Electricity | 6 (1.8%) | 8 (7.1%) |
| Fuel Oil or Kerosene | 41 (12.3%) | 0 (0.0%) |
| Coal or Coke | 0 (0.0%) | 0 (0.0%) |
| All other Fuels | 19 (5.7%) | 9 (8.0%) |
| No Fuel Used | 0 (0.0%) | 0 (0.0%) |
| Total | 334 (100.0%) | 113 (100.0%) |
Household Vehicle Usage in Buhl
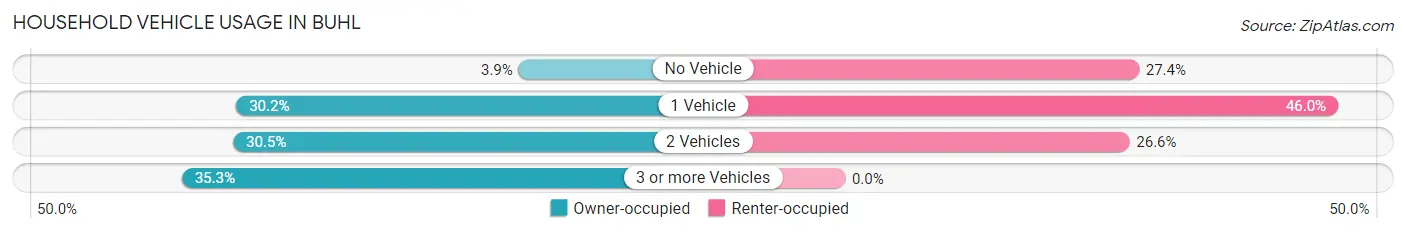
| Vehicles per Household | Owner-occupied | Renter-occupied |
| No Vehicle | 13 (3.9%) | 31 (27.4%) |
| 1 Vehicle | 101 (30.2%) | 52 (46.0%) |
| 2 Vehicles | 102 (30.5%) | 30 (26.6%) |
| 3 or more Vehicles | 118 (35.3%) | 0 (0.0%) |
| Total | 334 (100.0%) | 113 (100.0%) |
Real Estate & Mortgages in Buhl
Real Estate and Mortgage Overview in Buhl
| Characteristic | Without Mortgage | With Mortgage |
| Housing Units | 169 | 165 |
| Median Property Value | $97,200 | $132,500 |
| Median Household Income | $31,875 | $66 |
| Monthly Housing Costs | $375 | $0 |
| Real Estate Taxes | $646 | $0 |
Property Value by Mortgage Status in Buhl
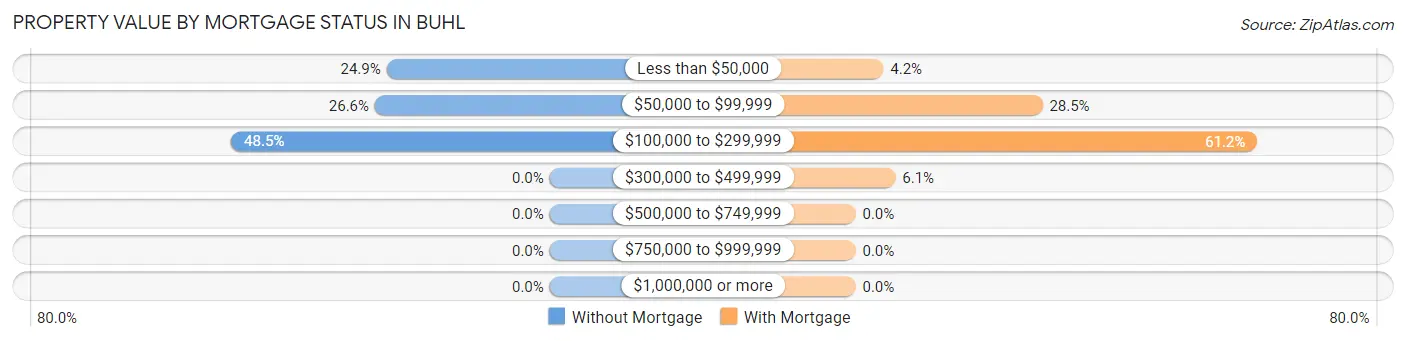
| Property Value | Without Mortgage | With Mortgage |
| Less than $50,000 | 42 (24.8%) | 7 (4.2%) |
| $50,000 to $99,999 | 45 (26.6%) | 47 (28.5%) |
| $100,000 to $299,999 | 82 (48.5%) | 101 (61.2%) |
| $300,000 to $499,999 | 0 (0.0%) | 10 (6.1%) |
| $500,000 to $749,999 | 0 (0.0%) | 0 (0.0%) |
| $750,000 to $999,999 | 0 (0.0%) | 0 (0.0%) |
| $1,000,000 or more | 0 (0.0%) | 0 (0.0%) |
| Total | 169 (100.0%) | 165 (100.0%) |
Household Income by Mortgage Status in Buhl
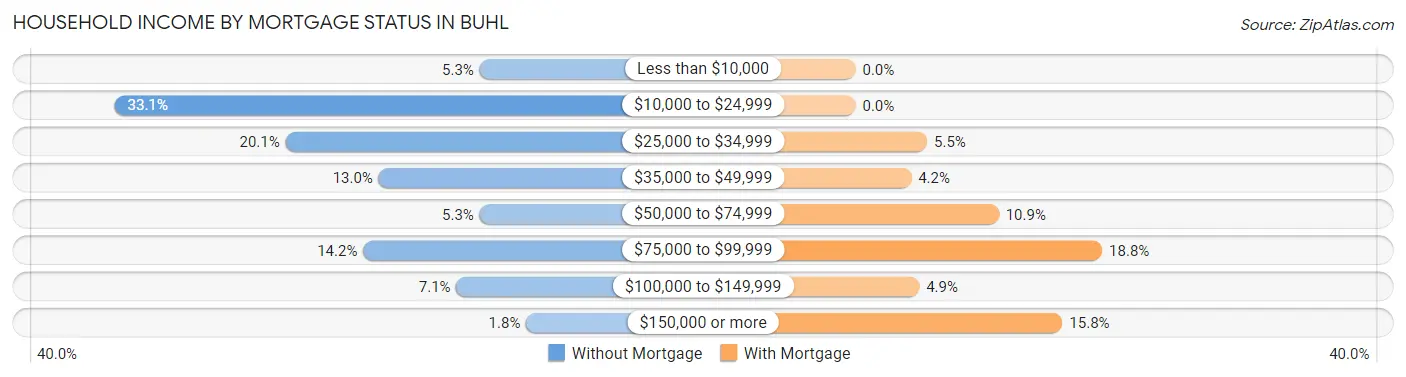
| Household Income | Without Mortgage | With Mortgage |
| Less than $10,000 | 9 (5.3%) | 0 (0.0%) |
| $10,000 to $24,999 | 56 (33.1%) | 0 (0.0%) |
| $25,000 to $34,999 | 34 (20.1%) | 9 (5.4%) |
| $35,000 to $49,999 | 22 (13.0%) | 7 (4.2%) |
| $50,000 to $74,999 | 9 (5.3%) | 18 (10.9%) |
| $75,000 to $99,999 | 24 (14.2%) | 31 (18.8%) |
| $100,000 to $149,999 | 12 (7.1%) | 8 (4.9%) |
| $150,000 or more | 3 (1.8%) | 26 (15.8%) |
| Total | 169 (100.0%) | 165 (100.0%) |
Property Value to Household Income Ratio in Buhl
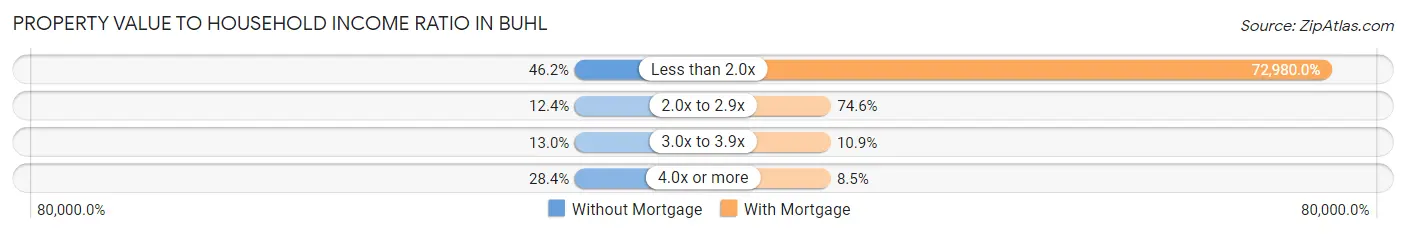
| Value-to-Income Ratio | Without Mortgage | With Mortgage |
| Less than 2.0x | 78 (46.2%) | 120,417 (72,980.0%) |
| 2.0x to 2.9x | 21 (12.4%) | 123 (74.6%) |
| 3.0x to 3.9x | 22 (13.0%) | 18 (10.9%) |
| 4.0x or more | 48 (28.4%) | 14 (8.5%) |
| Total | 169 (100.0%) | 165 (100.0%) |
Real Estate Taxes by Mortgage Status in Buhl
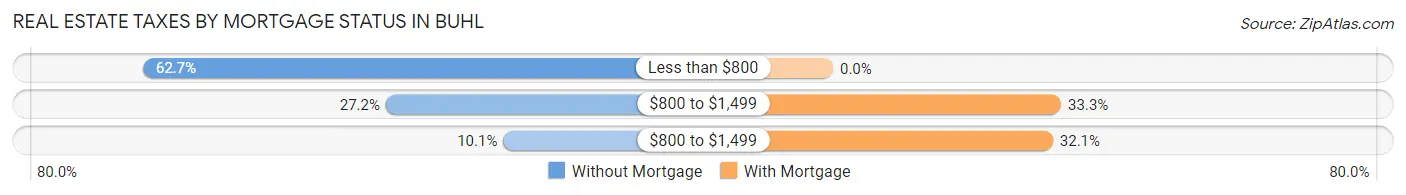
| Property Taxes | Without Mortgage | With Mortgage |
| Less than $800 | 106 (62.7%) | 0 (0.0%) |
| $800 to $1,499 | 46 (27.2%) | 55 (33.3%) |
| $800 to $1,499 | 17 (10.1%) | 53 (32.1%) |
| Total | 169 (100.0%) | 165 (100.0%) |
Health & Disability in Buhl
Health Insurance Coverage by Age in Buhl
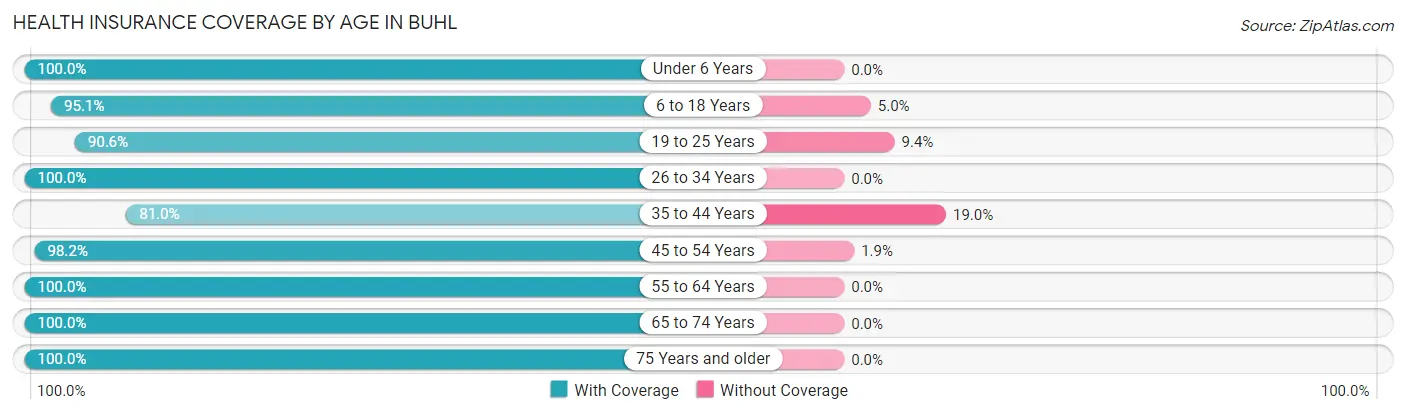
| Age Bracket | With Coverage | Without Coverage |
| Under 6 Years | 42 (100.0%) | 0 (0.0%) |
| 6 to 18 Years | 173 (95.1%) | 9 (5.0%) |
| 19 to 25 Years | 87 (90.6%) | 9 (9.4%) |
| 26 to 34 Years | 68 (100.0%) | 0 (0.0%) |
| 35 to 44 Years | 47 (81.0%) | 11 (19.0%) |
| 45 to 54 Years | 159 (98.2%) | 3 (1.8%) |
| 55 to 64 Years | 143 (100.0%) | 0 (0.0%) |
| 65 to 74 Years | 97 (100.0%) | 0 (0.0%) |
| 75 Years and older | 106 (100.0%) | 0 (0.0%) |
| Total | 922 (96.7%) | 32 (3.4%) |
Health Insurance Coverage by Citizenship Status in Buhl
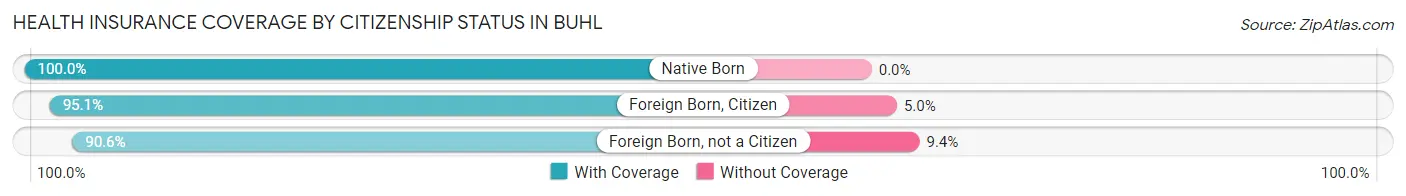
| Citizenship Status | With Coverage | Without Coverage |
| Native Born | 42 (100.0%) | 0 (0.0%) |
| Foreign Born, Citizen | 173 (95.1%) | 9 (5.0%) |
| Foreign Born, not a Citizen | 87 (90.6%) | 9 (9.4%) |
Health Insurance Coverage by Household Income in Buhl
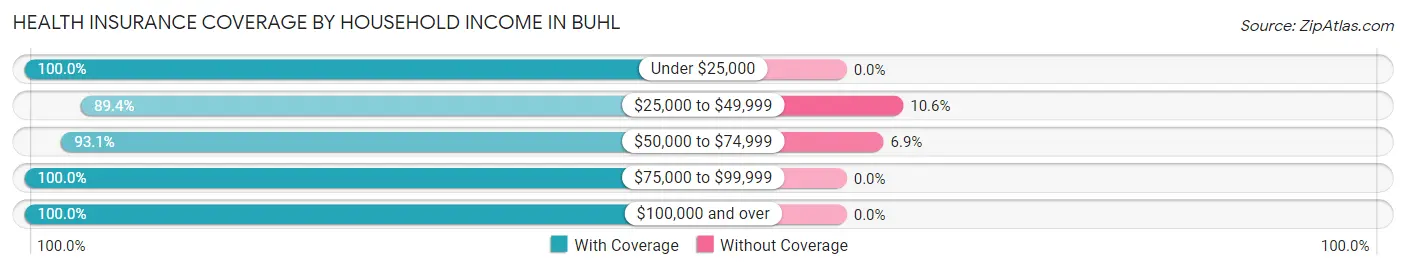
| Household Income | With Coverage | Without Coverage |
| Under $25,000 | 90 (100.0%) | 0 (0.0%) |
| $25,000 to $49,999 | 169 (89.4%) | 20 (10.6%) |
| $50,000 to $74,999 | 162 (93.1%) | 12 (6.9%) |
| $75,000 to $99,999 | 103 (100.0%) | 0 (0.0%) |
| $100,000 and over | 384 (100.0%) | 0 (0.0%) |
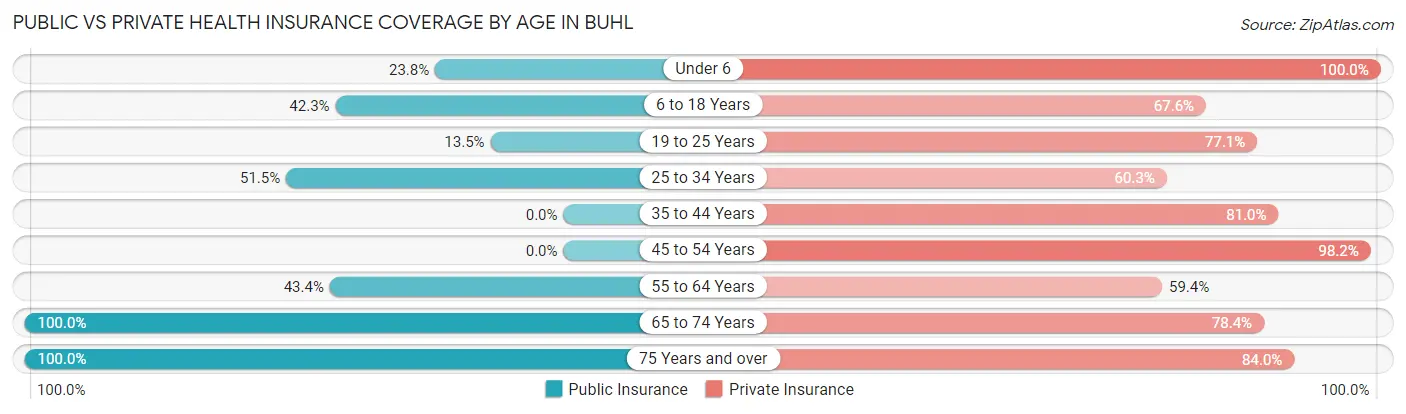
Public vs Private Health Insurance Coverage by Age in Buhl
| Age Bracket | Public Insurance | Private Insurance |
| Under 6 | 10 (23.8%) | 42 (100.0%) |
| 6 to 18 Years | 77 (42.3%) | 123 (67.6%) |
| 19 to 25 Years | 13 (13.5%) | 74 (77.1%) |
| 25 to 34 Years | 35 (51.5%) | 41 (60.3%) |
| 35 to 44 Years | 0 (0.0%) | 47 (81.0%) |
| 45 to 54 Years | 0 (0.0%) | 159 (98.2%) |
| 55 to 64 Years | 62 (43.4%) | 85 (59.4%) |
| 65 to 74 Years | 97 (100.0%) | 76 (78.3%) |
| 75 Years and over | 106 (100.0%) | 89 (84.0%) |
| Total | 400 (41.9%) | 736 (77.1%) |
Disability Status by Sex by Age in Buhl
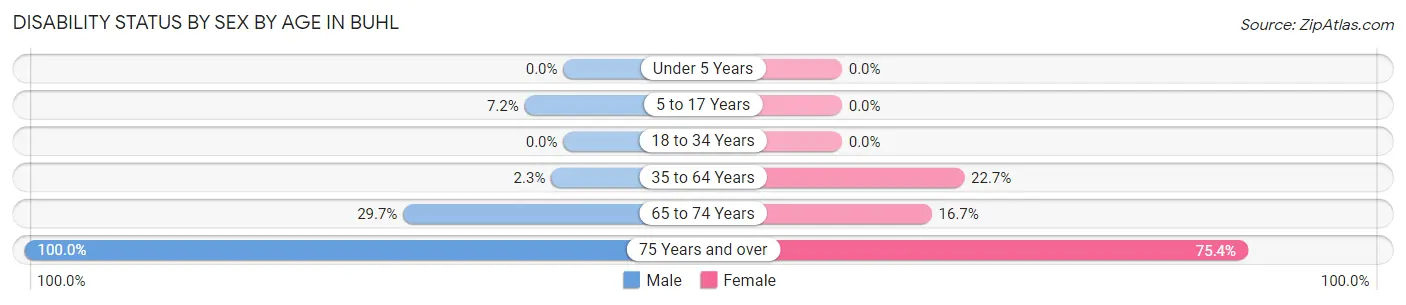
| Age Bracket | Male | Female |
| Under 5 Years | 0 (0.0%) | 0 (0.0%) |
| 5 to 17 Years | 9 (7.2%) | 0 (0.0%) |
| 18 to 34 Years | 0 (0.0%) | 0 (0.0%) |
| 35 to 64 Years | 4 (2.2%) | 42 (22.7%) |
| 65 to 74 Years | 11 (29.7%) | 10 (16.7%) |
| 75 Years and over | 37 (100.0%) | 52 (75.4%) |
Disability Class by Sex by Age in Buhl
Disability Class: Hearing Difficulty
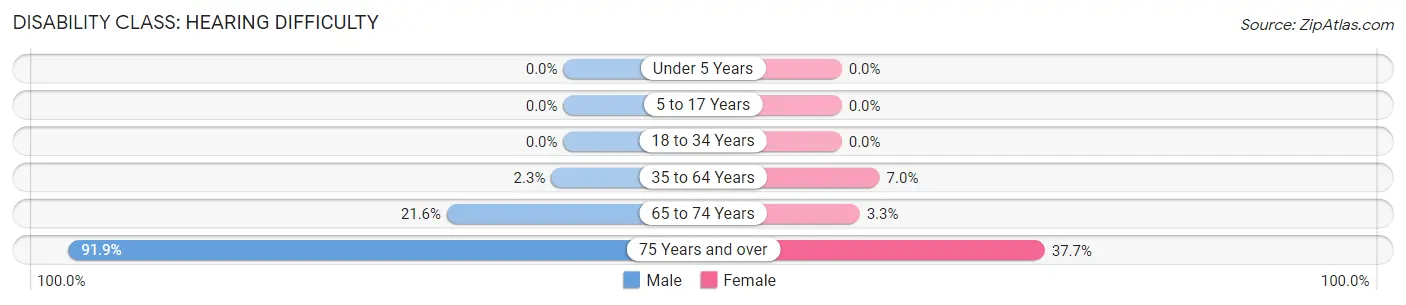
| Age Bracket | Male | Female |
| Under 5 Years | 0 (0.0%) | 0 (0.0%) |
| 5 to 17 Years | 0 (0.0%) | 0 (0.0%) |
| 18 to 34 Years | 0 (0.0%) | 0 (0.0%) |
| 35 to 64 Years | 4 (2.2%) | 13 (7.0%) |
| 65 to 74 Years | 8 (21.6%) | 2 (3.3%) |
| 75 Years and over | 34 (91.9%) | 26 (37.7%) |
Disability Class: Vision Difficulty
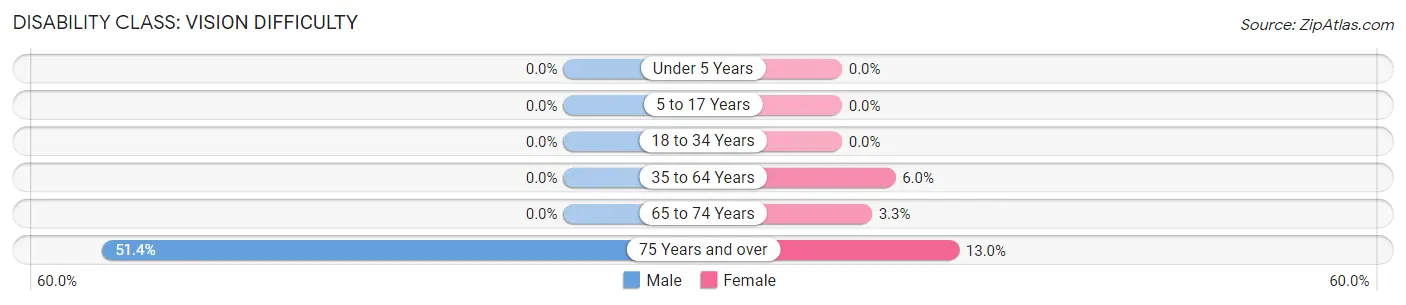
| Age Bracket | Male | Female |
| Under 5 Years | 0 (0.0%) | 0 (0.0%) |
| 5 to 17 Years | 0 (0.0%) | 0 (0.0%) |
| 18 to 34 Years | 0 (0.0%) | 0 (0.0%) |
| 35 to 64 Years | 0 (0.0%) | 11 (5.9%) |
| 65 to 74 Years | 0 (0.0%) | 2 (3.3%) |
| 75 Years and over | 19 (51.3%) | 9 (13.0%) |
Disability Class: Cognitive Difficulty
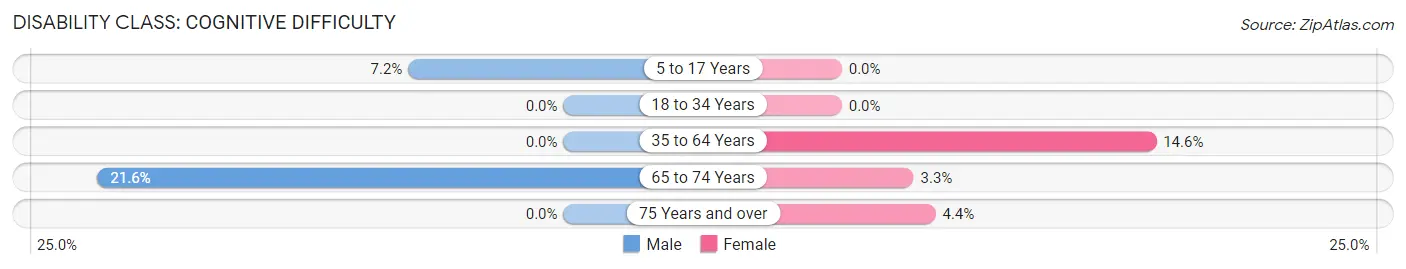
| Age Bracket | Male | Female |
| 5 to 17 Years | 9 (7.2%) | 0 (0.0%) |
| 18 to 34 Years | 0 (0.0%) | 0 (0.0%) |
| 35 to 64 Years | 0 (0.0%) | 27 (14.6%) |
| 65 to 74 Years | 8 (21.6%) | 2 (3.3%) |
| 75 Years and over | 0 (0.0%) | 3 (4.3%) |
Disability Class: Ambulatory Difficulty
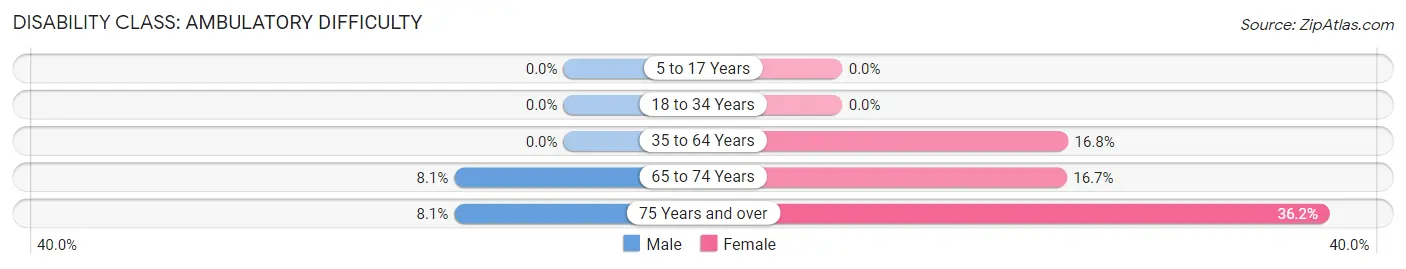
| Age Bracket | Male | Female |
| 5 to 17 Years | 0 (0.0%) | 0 (0.0%) |
| 18 to 34 Years | 0 (0.0%) | 0 (0.0%) |
| 35 to 64 Years | 0 (0.0%) | 31 (16.8%) |
| 65 to 74 Years | 3 (8.1%) | 10 (16.7%) |
| 75 Years and over | 3 (8.1%) | 25 (36.2%) |
Disability Class: Self-Care Difficulty
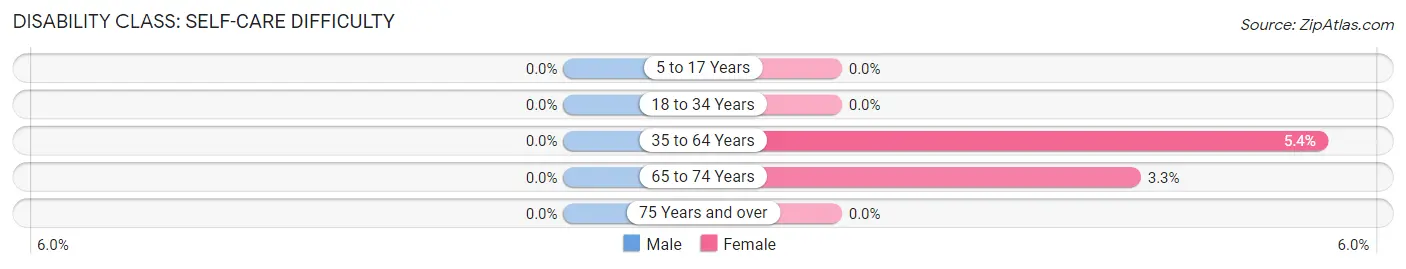
| Age Bracket | Male | Female |
| 5 to 17 Years | 0 (0.0%) | 0 (0.0%) |
| 18 to 34 Years | 0 (0.0%) | 0 (0.0%) |
| 35 to 64 Years | 0 (0.0%) | 10 (5.4%) |
| 65 to 74 Years | 0 (0.0%) | 2 (3.3%) |
| 75 Years and over | 0 (0.0%) | 0 (0.0%) |
Technology Access in Buhl
Computing Device Access in Buhl
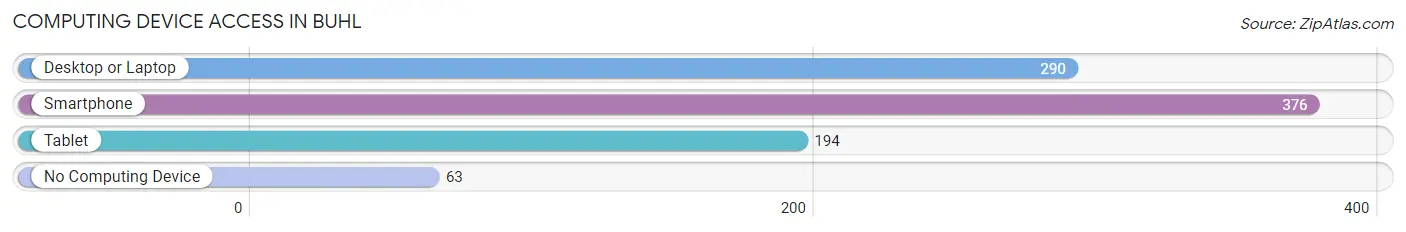
| Device Type | # Households | % Households |
| Desktop or Laptop | 290 | 64.9% |
| Smartphone | 376 | 84.1% |
| Tablet | 194 | 43.4% |
| No Computing Device | 63 | 14.1% |
| Total | 447 | 100.0% |
Internet Access in Buhl
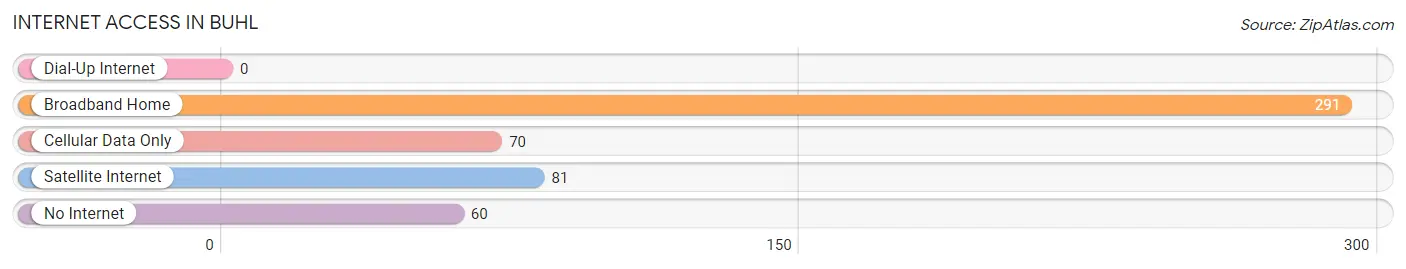
| Internet Type | # Households | % Households |
| Dial-Up Internet | 0 | 0.0% |
| Broadband Home | 291 | 65.1% |
| Cellular Data Only | 70 | 15.7% |
| Satellite Internet | 81 | 18.1% |
| No Internet | 60 | 13.4% |
| Total | 447 | 100.0% |
Buhl Summary
Buhl, Minnesota is a small city located in St. Louis County, Minnesota. It is situated on the western edge of the Mesabi Iron Range, and is part of the Iron Range region of Minnesota. The city has a population of 1,845 as of the 2010 census, and is the county seat of St. Louis County.
History
The area that is now Buhl was first settled in the late 19th century by Finnish immigrants. The city was originally known as “Finn Town”, and was later renamed Buhl after the first postmaster, John Buhl. The city was officially incorporated in 1906.
In the early 20th century, Buhl was a major center of the iron ore mining industry. The city was home to several large mines, including the Buhl Mine, which was the largest iron ore mine in the world at the time. The city also had a large steel mill, which was the largest in the state.
The city’s economy was heavily dependent on the iron ore industry, and when the industry began to decline in the mid-20th century, the city’s economy suffered. The steel mill closed in the 1970s, and the last iron ore mine in the city closed in the 1980s.
Since then, the city has diversified its economy and is now home to a variety of businesses, including manufacturing, retail, and tourism.
Geography
Buhl is located in St. Louis County, Minnesota, on the western edge of the Mesabi Iron Range. The city is situated on the banks of the Embarrass River, and is surrounded by forests and lakes. The city is located about 25 miles northwest of Duluth, and about 75 miles north of Minneapolis.
The city has a total area of 2.2 square miles, all of which is land. The city has a humid continental climate, with cold winters and warm summers.
Demographics
As of the 2010 census, the city had a population of 1,845. The racial makeup of the city was 97.2% White, 0.3% African American, 0.3% Native American, 0.3% Asian, 0.2% from other races, and 1.7% from two or more races. Hispanic or Latino of any race were 1.2% of the population.
The median income for a household in the city was $37,917, and the median income for a family was $45,000. The per capita income for the city was $19,945. About 11.2% of families and 14.2% of the population were below the poverty line, including 19.2% of those under age 18 and 8.3% of those age 65 or over.
Economy
Buhl’s economy is largely based on manufacturing, retail, and tourism. The city is home to several manufacturing companies, including a paper mill, a printing company, and a metal fabrication plant. The city also has a variety of retail stores, including a grocery store, a hardware store, and several restaurants.
The city is also a popular tourist destination, and is home to several attractions, including the Buhl Iron Mine Museum, the Buhl Historical Society Museum, and the Buhl Iron Range Railroad Museum. The city also hosts several annual events, including the Buhl Iron Range Festival and the Buhl Iron Range Days.
Conclusion
Buhl, Minnesota is a small city located in St. Louis County, Minnesota. It is situated on the western edge of the Mesabi Iron Range, and is part of the Iron Range region of Minnesota. The city has a population of 1,845 as of the 2010 census, and is the county seat of St. Louis County. The city’s economy is largely based on manufacturing, retail, and tourism. The city is home to several attractions, including the Buhl Iron Mine Museum, the Buhl Historical Society Museum, and the Buhl Iron Range Railroad Museum. The city also hosts several annual events, including the Buhl Iron Range Festival and the Buhl Iron Range Days.
Common Questions
What is Per Capita Income in Buhl?
Per Capita income in Buhl is $30,717.
What is the Median Family Income in Buhl?
Median Family Income in Buhl is $78,194.
What is the Median Household income in Buhl?
Median Household Income in Buhl is $55,925.
What is Income or Wage Gap in Buhl?
Income or Wage Gap in Buhl is 34.7%.
Women in Buhl earn 65.3 cents for every dollar earned by a man.
What is Inequality or Gini Index in Buhl?
Inequality or Gini Index in Buhl is 0.40.
What is the Total Population of Buhl?
Total Population of Buhl is 1,028.
What is the Total Male Population of Buhl?
Total Male Population of Buhl is 484.
What is the Total Female Population of Buhl?
Total Female Population of Buhl is 544.
What is the Ratio of Males per 100 Females in Buhl?
There are 88.97 Males per 100 Females in Buhl.
What is the Ratio of Females per 100 Males in Buhl?
There are 112.40 Females per 100 Males in Buhl.
What is the Median Population Age in Buhl?
Median Population Age in Buhl is 48.3 Years.
What is the Average Family Size in Buhl
Average Family Size in Buhl is 2.9 People.
What is the Average Household Size in Buhl
Average Household Size in Buhl is 2.1 People.
How Large is the Labor Force in Buhl?
There are 525 People in the Labor Forcein in Buhl.
What is the Percentage of People in the Labor Force in Buhl?
62.7% of People are in the Labor Force in Buhl.
What is the Unemployment Rate in Buhl?
Unemployment Rate in Buhl is 5.0%.