St Augustine Shores, FL Map & Demographics
St Augustine Shores Map
St Augustine Shores Overview
$37,225
PER CAPITA INCOME
$73,938
AVG FAMILY INCOME
$67,882
AVG HOUSEHOLD INCOME
0.7%
WAGE / INCOME GAP [ % ]
99.3¢/ $1
WAGE / INCOME GAP [ $ ]
$10,726
FAMILY INCOME DEFICIT
0.40
INEQUALITY / GINI INDEX
9,883
TOTAL POPULATION
4,542
MALE POPULATION
5,341
FEMALE POPULATION
85.04
MALES / 100 FEMALES
117.59
FEMALES / 100 MALES
52.7
MEDIAN AGE
2.6
AVG FAMILY SIZE
2.3
AVG HOUSEHOLD SIZE
4,895
LABOR FORCE [ PEOPLE ]
56.6%
PERCENT IN LABOR FORCE
3.7%
UNEMPLOYMENT RATE
Income in St Augustine Shores
Income Overview in St Augustine Shores
Per Capita Income in St Augustine Shores is $37,225, while median incomes of families and households are $73,938 and $67,882 respectively.
| Characteristic | Number | Measure |
| Per Capita Income | 9,883 | $37,225 |
| Median Family Income | 2,877 | $73,938 |
| Mean Family Income | 2,877 | $94,321 |
| Median Household Income | 4,325 | $67,882 |
| Mean Household Income | 4,325 | $82,707 |
| Income Deficit | 2,877 | $10,726 |
| Wage / Income Gap (%) | 9,883 | 0.68% |
| Wage / Income Gap ($) | 9,883 | 99.32¢ per $1 |
| Gini / Inequality Index | 9,883 | 0.40 |
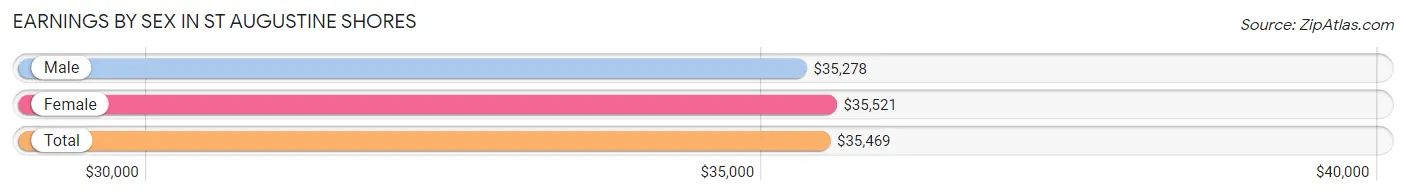
Earnings by Sex in St Augustine Shores
Average Earnings in St Augustine Shores are $35,469, $35,278 for men and $35,521 for women, a difference of 0.7%.
| Sex | Number | Average Earnings |
| Male | 2,312 (47.2%) | $35,278 |
| Female | 2,583 (52.8%) | $35,521 |
| Total | 4,895 (100.0%) | $35,469 |
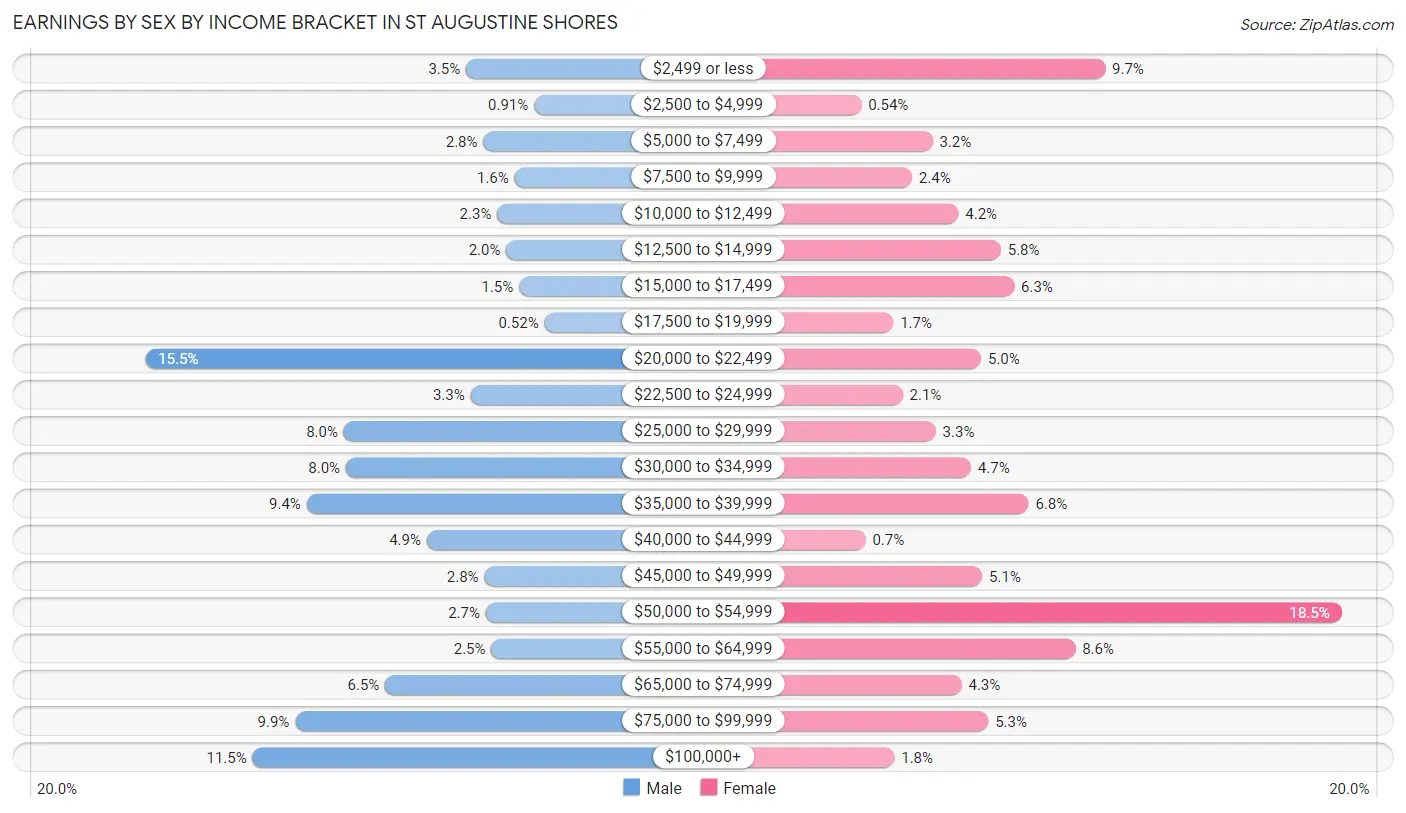
Earnings by Sex by Income Bracket in St Augustine Shores
The most common earnings brackets in St Augustine Shores are $20,000 to $22,499 for men (358 | 15.5%) and $50,000 to $54,999 for women (479 | 18.5%).
| Income | Male | Female |
| $2,499 or less | 80 (3.5%) | 250 (9.7%) |
| $2,500 to $4,999 | 21 (0.9%) | 14 (0.5%) |
| $5,000 to $7,499 | 65 (2.8%) | 83 (3.2%) |
| $7,500 to $9,999 | 38 (1.6%) | 63 (2.4%) |
| $10,000 to $12,499 | 53 (2.3%) | 108 (4.2%) |
| $12,500 to $14,999 | 45 (1.9%) | 149 (5.8%) |
| $15,000 to $17,499 | 34 (1.5%) | 162 (6.3%) |
| $17,500 to $19,999 | 12 (0.5%) | 45 (1.7%) |
| $20,000 to $22,499 | 358 (15.5%) | 130 (5.0%) |
| $22,500 to $24,999 | 76 (3.3%) | 54 (2.1%) |
| $25,000 to $29,999 | 186 (8.0%) | 86 (3.3%) |
| $30,000 to $34,999 | 184 (8.0%) | 120 (4.6%) |
| $35,000 to $39,999 | 218 (9.4%) | 176 (6.8%) |
| $40,000 to $44,999 | 114 (4.9%) | 18 (0.7%) |
| $45,000 to $49,999 | 64 (2.8%) | 131 (5.1%) |
| $50,000 to $54,999 | 63 (2.7%) | 479 (18.5%) |
| $55,000 to $64,999 | 58 (2.5%) | 221 (8.6%) |
| $65,000 to $74,999 | 150 (6.5%) | 111 (4.3%) |
| $75,000 to $99,999 | 228 (9.9%) | 137 (5.3%) |
| $100,000+ | 265 (11.5%) | 46 (1.8%) |
| Total | 2,312 (100.0%) | 2,583 (100.0%) |
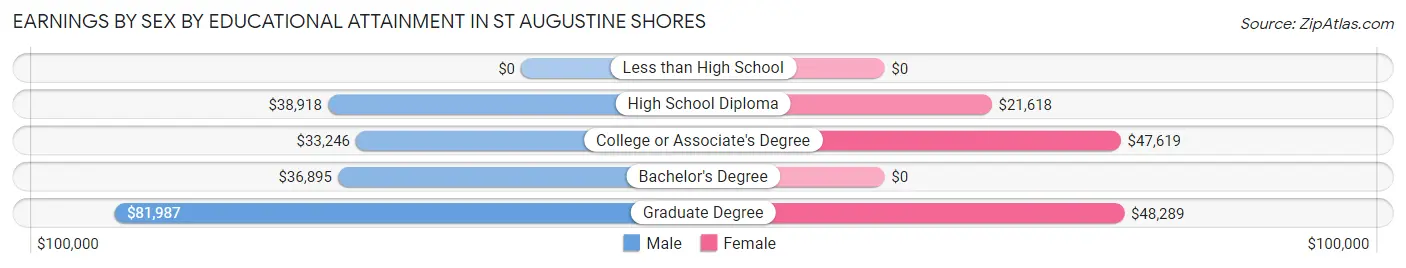
Earnings by Sex by Educational Attainment in St Augustine Shores
Average earnings in St Augustine Shores are $37,850 for men and $37,140 for women, a difference of 1.9%. Men with an educational attainment of graduate degree enjoy the highest average annual earnings of $81,987, while those with college or associate's degree education earn the least with $33,246. Women with an educational attainment of graduate degree earn the most with the average annual earnings of $48,289, while those with high school diploma education have the smallest earnings of $21,618.
| Educational Attainment | Male Income | Female Income |
| Less than High School | - | - |
| High School Diploma | $38,918 | $21,618 |
| College or Associate's Degree | $33,246 | $47,619 |
| Bachelor's Degree | $36,895 | $0 |
| Graduate Degree | $81,987 | $48,289 |
| Total | $37,850 | $37,140 |
Family Income in St Augustine Shores
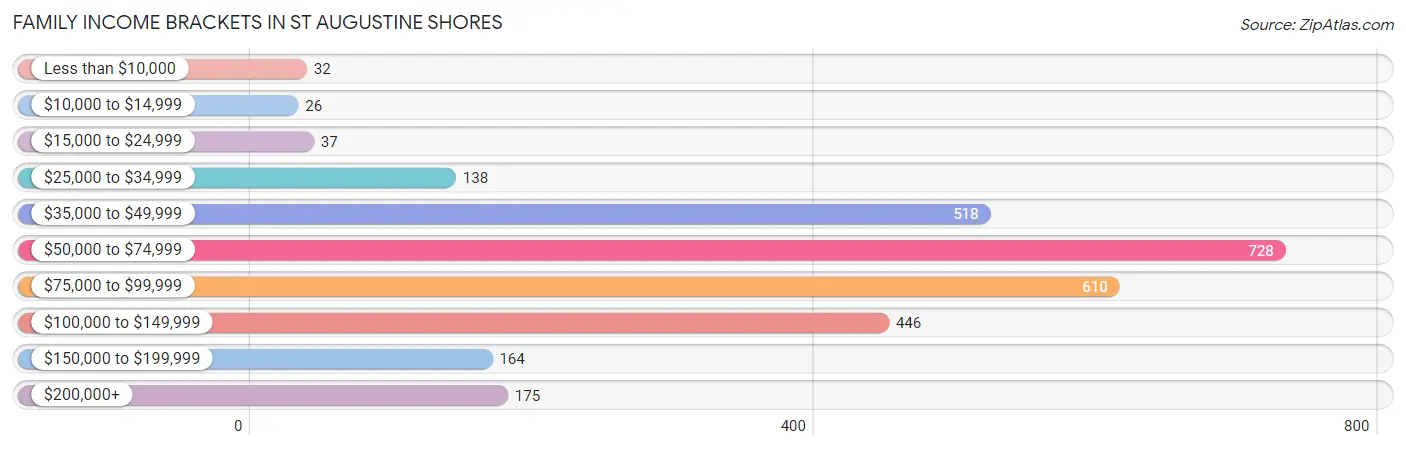
Family Income Brackets in St Augustine Shores
According to the St Augustine Shores family income data, there are 728 families falling into the $50,000 to $74,999 income range, which is the most common income bracket and makes up 25.3% of all families. Conversely, the $10,000 to $14,999 income bracket is the least frequent group with only 26 families (0.9%) belonging to this category.
| Income Bracket | # Families | % Families |
| Less than $10,000 | 32 | 1.1% |
| $10,000 to $14,999 | 26 | 0.9% |
| $15,000 to $24,999 | 37 | 1.3% |
| $25,000 to $34,999 | 138 | 4.8% |
| $35,000 to $49,999 | 518 | 18.0% |
| $50,000 to $74,999 | 728 | 25.3% |
| $75,000 to $99,999 | 610 | 21.2% |
| $100,000 to $149,999 | 446 | 15.5% |
| $150,000 to $199,999 | 164 | 5.7% |
| $200,000+ | 175 | 6.1% |
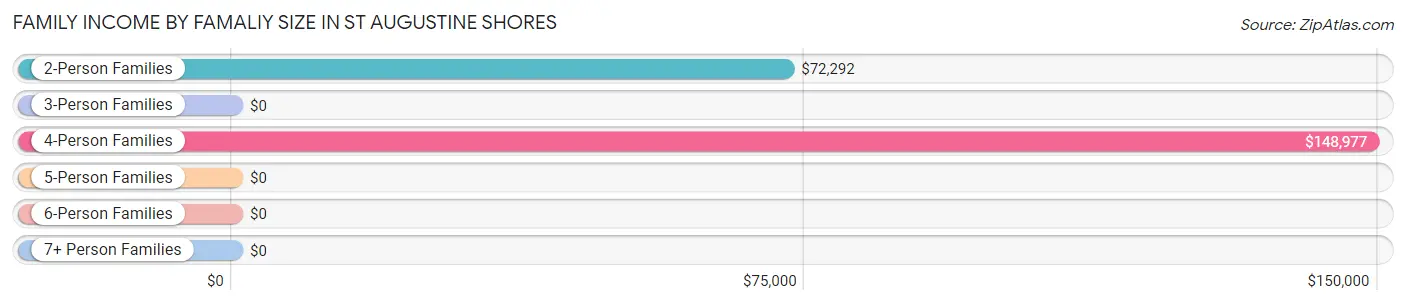
Family Income by Famaliy Size in St Augustine Shores
4-person families (390 | 13.6%) account for the highest median family income in St Augustine Shores with $148,977 per family, while 4-person families (390 | 13.6%) have the highest median income of $37,244 per family member.
| Income Bracket | # Families | Median Income |
| 2-Person Families | 1,900 (66.0%) | $72,292 |
| 3-Person Families | 538 (18.7%) | $0 |
| 4-Person Families | 390 (13.6%) | $148,977 |
| 5-Person Families | 23 (0.8%) | $0 |
| 6-Person Families | 26 (0.9%) | $0 |
| 7+ Person Families | 0 (0.0%) | $0 |
| Total | 2,877 (100.0%) | $73,938 |
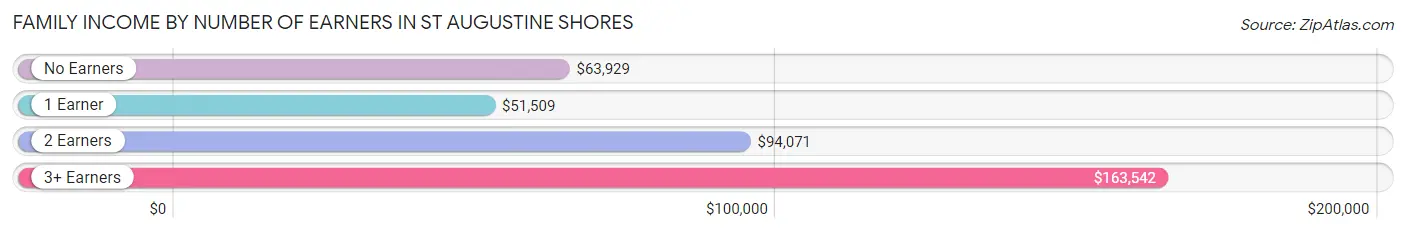
Family Income by Number of Earners in St Augustine Shores
The median family income in St Augustine Shores is $73,938, with families comprising 3+ earners (193) having the highest median family income of $163,542, while families with 1 earner (1,189) have the lowest median family income of $51,509, accounting for 6.7% and 41.3% of families, respectively.
| Number of Earners | # Families | Median Income |
| No Earners | 654 (22.7%) | $63,929 |
| 1 Earner | 1,189 (41.3%) | $51,509 |
| 2 Earners | 841 (29.2%) | $94,071 |
| 3+ Earners | 193 (6.7%) | $163,542 |
| Total | 2,877 (100.0%) | $73,938 |
Household Income in St Augustine Shores
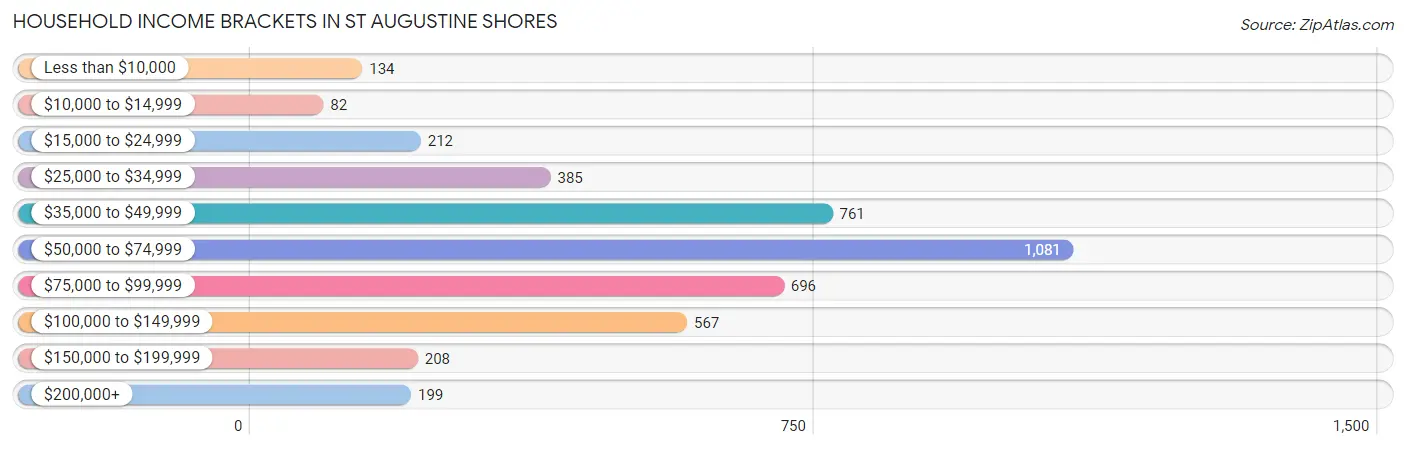
Household Income Brackets in St Augustine Shores
With 1,081 households falling in the category, the $50,000 to $74,999 income range is the most frequent in St Augustine Shores, accounting for 25.0% of all households. In contrast, only 82 households (1.9%) fall into the $10,000 to $14,999 income bracket, making it the least populous group.
| Income Bracket | # Households | % Households |
| Less than $10,000 | 134 | 3.1% |
| $10,000 to $14,999 | 82 | 1.9% |
| $15,000 to $24,999 | 212 | 4.9% |
| $25,000 to $34,999 | 385 | 8.9% |
| $35,000 to $49,999 | 761 | 17.6% |
| $50,000 to $74,999 | 1,081 | 25.0% |
| $75,000 to $99,999 | 696 | 16.1% |
| $100,000 to $149,999 | 567 | 13.1% |
| $150,000 to $199,999 | 208 | 4.8% |
| $200,000+ | 199 | 4.6% |
Household Income by Householder Age in St Augustine Shores
The median household income in St Augustine Shores is $67,882, with the highest median household income of $78,125 found in the 45 to 64 years age bracket for the primary householder. A total of 1,499 households (34.7%) fall into this category. Meanwhile, the 15 to 24 years age bracket for the primary householder has the lowest median household income of $0, with 25 households (0.6%) in this group.
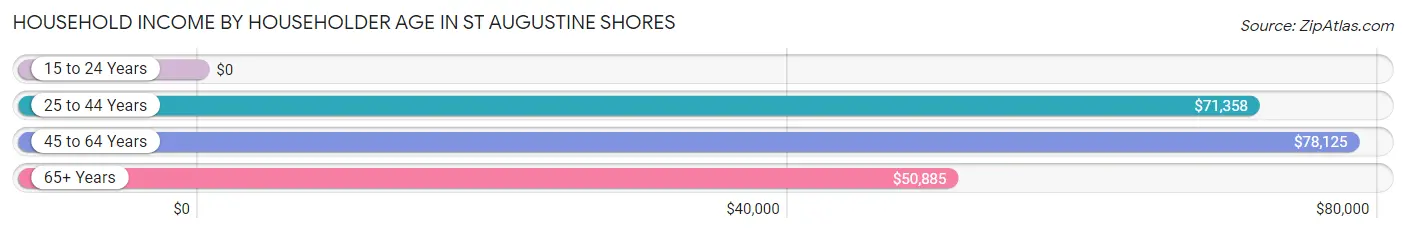
| Income Bracket | # Households | Median Income |
| 15 to 24 Years | 25 (0.6%) | $0 |
| 25 to 44 Years | 816 (18.9%) | $71,358 |
| 45 to 64 Years | 1,499 (34.7%) | $78,125 |
| 65+ Years | 1,985 (45.9%) | $50,885 |
| Total | 4,325 (100.0%) | $67,882 |
Poverty in St Augustine Shores
Income Below Poverty by Sex and Age in St Augustine Shores
With 7.7% poverty level for males and 3.5% for females among the residents of St Augustine Shores, 12 to 14 year old males and 75 year old and over females are the most vulnerable to poverty, with 15 males (20.0%) and 69 females (8.6%) in their respective age groups living below the poverty level.
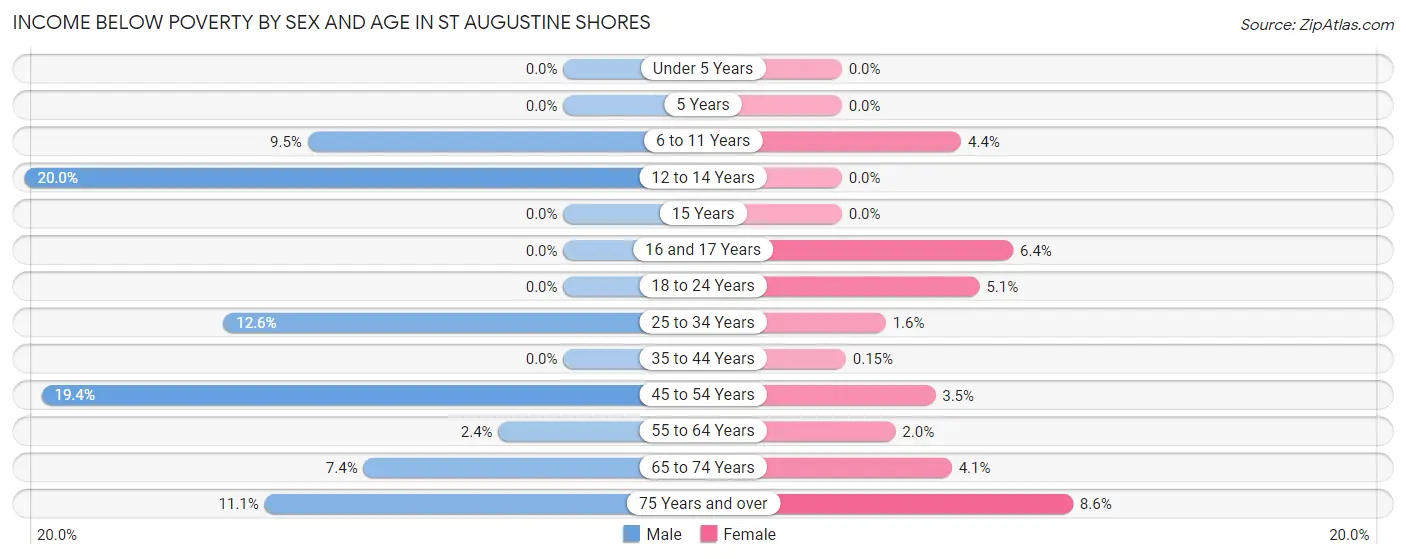
| Age Bracket | Male | Female |
| Under 5 Years | 0 (0.0%) | 0 (0.0%) |
| 5 Years | 0 (0.0%) | 0 (0.0%) |
| 6 to 11 Years | 15 (9.5%) | 16 (4.4%) |
| 12 to 14 Years | 15 (20.0%) | 0 (0.0%) |
| 15 Years | 0 (0.0%) | 0 (0.0%) |
| 16 and 17 Years | 0 (0.0%) | 11 (6.4%) |
| 18 to 24 Years | 0 (0.0%) | 7 (5.1%) |
| 25 to 34 Years | 51 (12.6%) | 6 (1.6%) |
| 35 to 44 Years | 0 (0.0%) | 1 (0.2%) |
| 45 to 54 Years | 129 (19.4%) | 22 (3.5%) |
| 55 to 64 Years | 16 (2.4%) | 22 (2.0%) |
| 65 to 74 Years | 50 (7.4%) | 34 (4.1%) |
| 75 Years and over | 76 (11.1%) | 69 (8.6%) |
| Total | 352 (7.7%) | 188 (3.5%) |
Income Above Poverty by Sex and Age in St Augustine Shores
According to the poverty statistics in St Augustine Shores, males aged under 5 years and females aged under 5 years are the age groups that are most secure financially, with 100.0% of males and 100.0% of females in these age groups living above the poverty line.
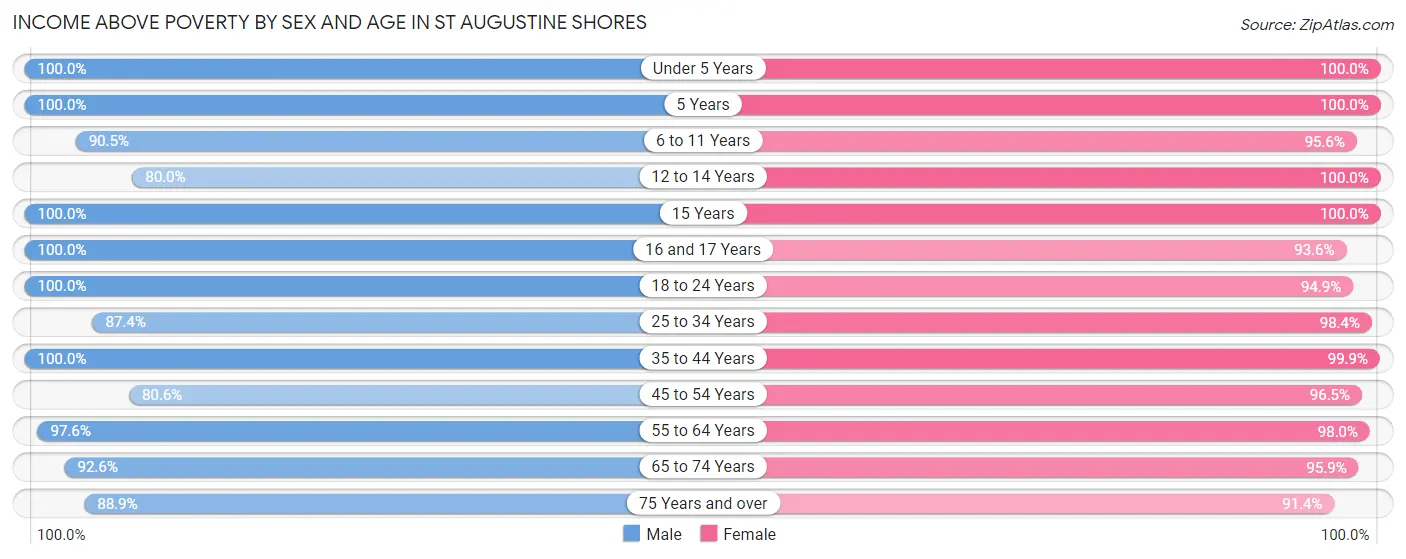
| Age Bracket | Male | Female |
| Under 5 Years | 102 (100.0%) | 124 (100.0%) |
| 5 Years | 11 (100.0%) | 34 (100.0%) |
| 6 to 11 Years | 143 (90.5%) | 345 (95.6%) |
| 12 to 14 Years | 60 (80.0%) | 51 (100.0%) |
| 15 Years | 266 (100.0%) | 53 (100.0%) |
| 16 and 17 Years | 43 (100.0%) | 162 (93.6%) |
| 18 to 24 Years | 223 (100.0%) | 130 (94.9%) |
| 25 to 34 Years | 353 (87.4%) | 363 (98.4%) |
| 35 to 44 Years | 570 (100.0%) | 650 (99.9%) |
| 45 to 54 Years | 537 (80.6%) | 612 (96.5%) |
| 55 to 64 Years | 649 (97.6%) | 1,086 (98.0%) |
| 65 to 74 Years | 624 (92.6%) | 799 (95.9%) |
| 75 Years and over | 609 (88.9%) | 735 (91.4%) |
| Total | 4,190 (92.2%) | 5,144 (96.5%) |
Income Below Poverty Among Married-Couple Families in St Augustine Shores
The poverty statistics for married-couple families in St Augustine Shores show that 3.5% or 78 of the total 2,200 families live below the poverty line. Families with 3 or 4 children have the highest poverty rate of 42.4%, comprising of 14 families. On the other hand, families with 1 or 2 children have the lowest poverty rate of 0.0%, which includes 0 families.
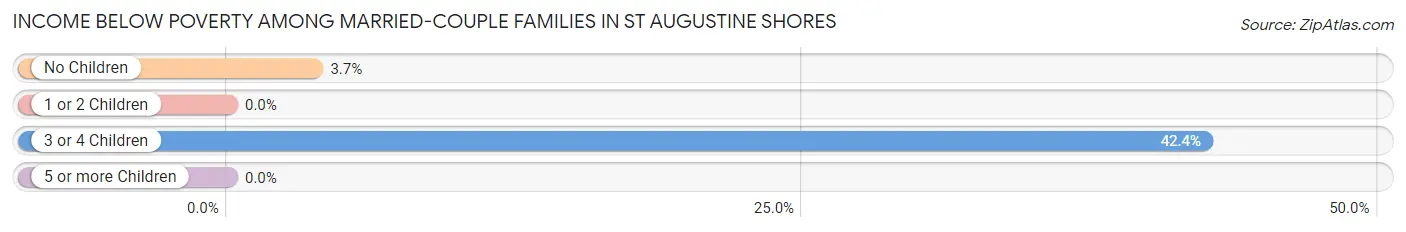
| Children | Above Poverty | Below Poverty |
| No Children | 1,658 (96.3%) | 64 (3.7%) |
| 1 or 2 Children | 445 (100.0%) | 0 (0.0%) |
| 3 or 4 Children | 19 (57.6%) | 14 (42.4%) |
| 5 or more Children | 0 (0.0%) | 0 (0.0%) |
| Total | 2,122 (96.5%) | 78 (3.5%) |
Income Below Poverty Among Single-Parent Households in St Augustine Shores
| Children | Single Father | Single Mother |
| No Children | 0 (0.0%) | 0 (0.0%) |
| 1 or 2 Children | 0 (0.0%) | 0 (0.0%) |
| 3 or 4 Children | 0 (0.0%) | 0 (0.0%) |
| 5 or more Children | 0 (0.0%) | 0 (0.0%) |
| Total | 0 (0.0%) | 0 (0.0%) |
Income Below Poverty Among Married-Couple vs Single-Parent Households in St Augustine Shores
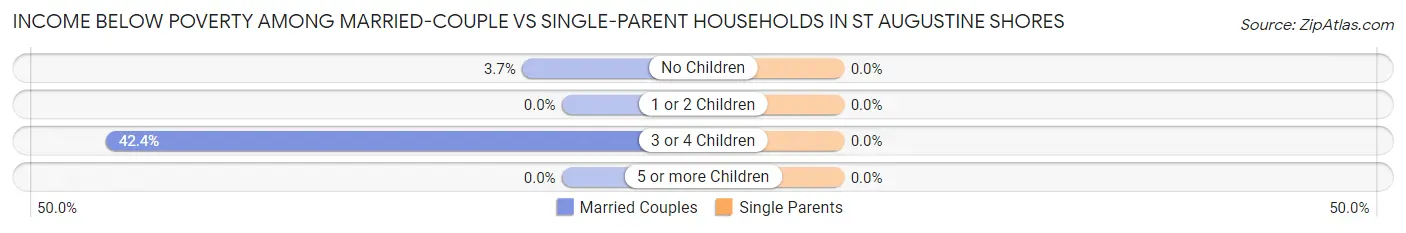
| Children | Married-Couple Families | Single-Parent Households |
| No Children | 64 (3.7%) | 0 (0.0%) |
| 1 or 2 Children | 0 (0.0%) | 0 (0.0%) |
| 3 or 4 Children | 14 (42.4%) | 0 (0.0%) |
| 5 or more Children | 0 (0.0%) | 0 (0.0%) |
| Total | 78 (3.5%) | 0 (0.0%) |
Race in St Augustine Shores
The most populous races in St Augustine Shores are White / Caucasian (9,118 | 92.3%), Hispanic or Latino (635 | 6.4%), and Two or more Races (303 | 3.1%).
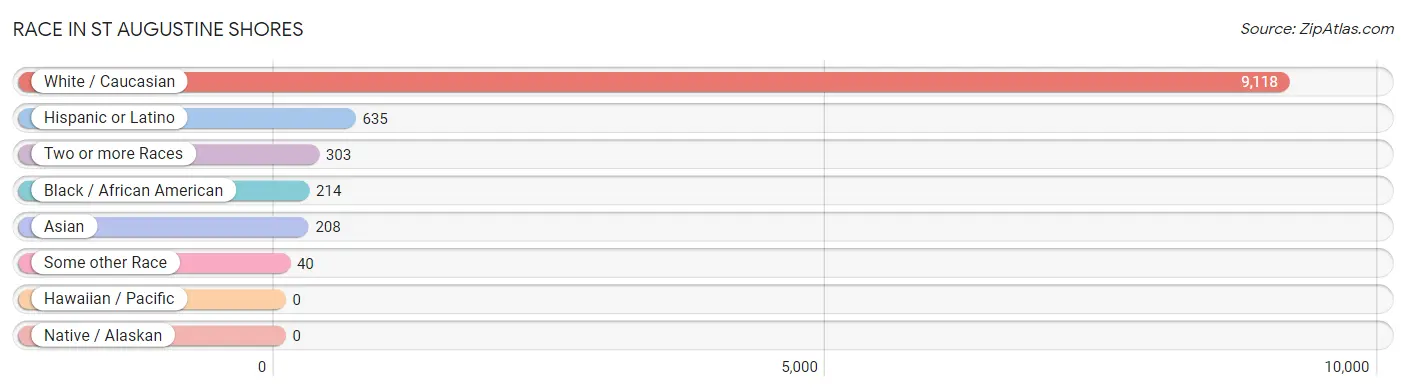
| Race | # Population | % Population |
| Asian | 208 | 2.1% |
| Black / African American | 214 | 2.2% |
| Hawaiian / Pacific | 0 | 0.0% |
| Hispanic or Latino | 635 | 6.4% |
| Native / Alaskan | 0 | 0.0% |
| White / Caucasian | 9,118 | 92.3% |
| Two or more Races | 303 | 3.1% |
| Some other Race | 40 | 0.4% |
| Total | 9,883 | 100.0% |
Ancestry in St Augustine Shores
The most populous ancestries reported in St Augustine Shores are Irish (2,216 | 22.4%), German (1,673 | 16.9%), Italian (1,272 | 12.9%), English (1,243 | 12.6%), and American (586 | 5.9%), together accounting for 70.7% of all St Augustine Shores residents.
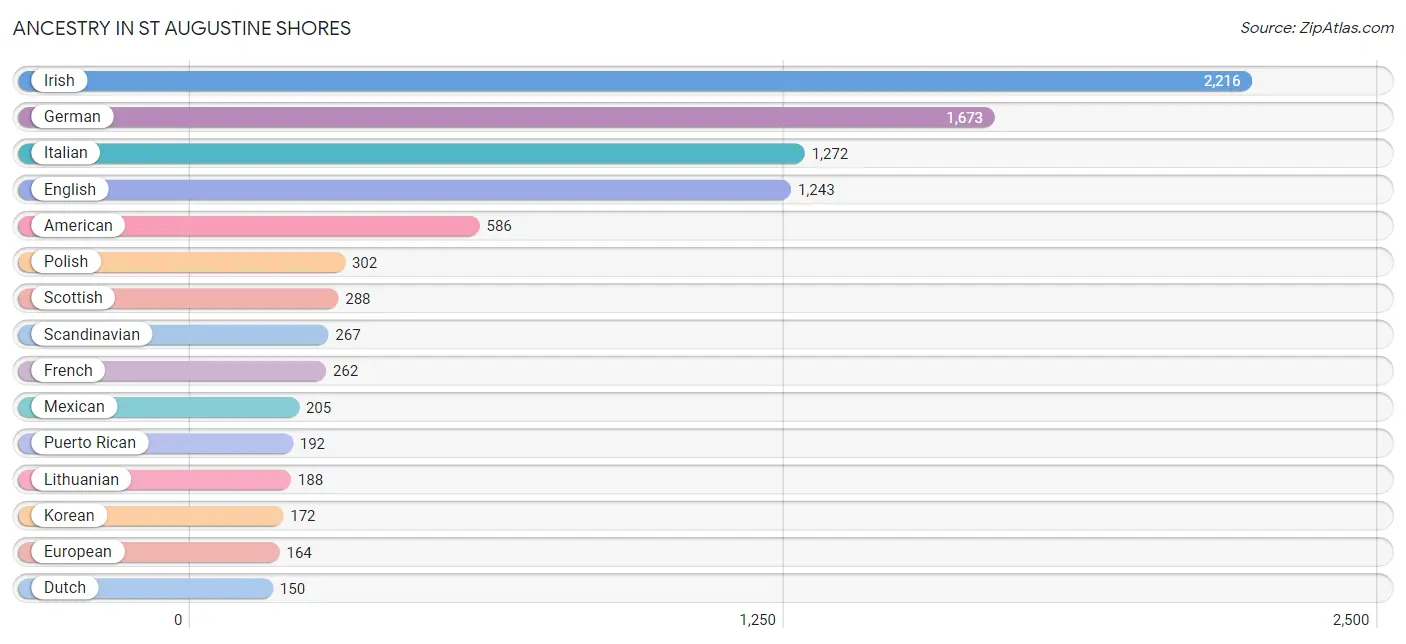
| Ancestry | # Population | % Population |
| American | 586 | 5.9% |
| Arab | 13 | 0.1% |
| Armenian | 18 | 0.2% |
| Austrian | 36 | 0.4% |
| Belgian | 7 | 0.1% |
| Bhutanese | 27 | 0.3% |
| Brazilian | 10 | 0.1% |
| British | 6 | 0.1% |
| Burmese | 5 | 0.1% |
| Canadian | 39 | 0.4% |
| Cherokee | 7 | 0.1% |
| Croatian | 65 | 0.7% |
| Cuban | 82 | 0.8% |
| Czech | 34 | 0.3% |
| Czechoslovakian | 60 | 0.6% |
| Dutch | 150 | 1.5% |
| Eastern European | 10 | 0.1% |
| English | 1,243 | 12.6% |
| European | 164 | 1.7% |
| Finnish | 17 | 0.2% |
| French | 262 | 2.6% |
| French Canadian | 61 | 0.6% |
| German | 1,673 | 16.9% |
| Greek | 21 | 0.2% |
| Hungarian | 42 | 0.4% |
| Indian (Asian) | 31 | 0.3% |
| Irish | 2,216 | 22.4% |
| Italian | 1,272 | 12.9% |
| Jamaican | 16 | 0.2% |
| Korean | 172 | 1.7% |
| Lebanese | 8 | 0.1% |
| Lithuanian | 188 | 1.9% |
| Mexican | 205 | 2.1% |
| Norwegian | 56 | 0.6% |
| Palestinian | 5 | 0.1% |
| Peruvian | 29 | 0.3% |
| Polish | 302 | 3.1% |
| Portuguese | 64 | 0.6% |
| Puerto Rican | 192 | 1.9% |
| Russian | 20 | 0.2% |
| Scandinavian | 267 | 2.7% |
| Scotch-Irish | 148 | 1.5% |
| Scottish | 288 | 2.9% |
| Slovene | 10 | 0.1% |
| South American | 29 | 0.3% |
| Spaniard | 15 | 0.2% |
| Spanish | 72 | 0.7% |
| Swedish | 52 | 0.5% |
| Swiss | 41 | 0.4% |
| Welsh | 53 | 0.5% | View All 50 Rows |
Immigrants in St Augustine Shores
The most numerous immigrant groups reported in St Augustine Shores came from Europe (430 | 4.3%), Eastern Europe (207 | 2.1%), Asia (196 | 2.0%), Western Europe (187 | 1.9%), and Philippines (172 | 1.7%), together accounting for 12.0% of all St Augustine Shores residents.
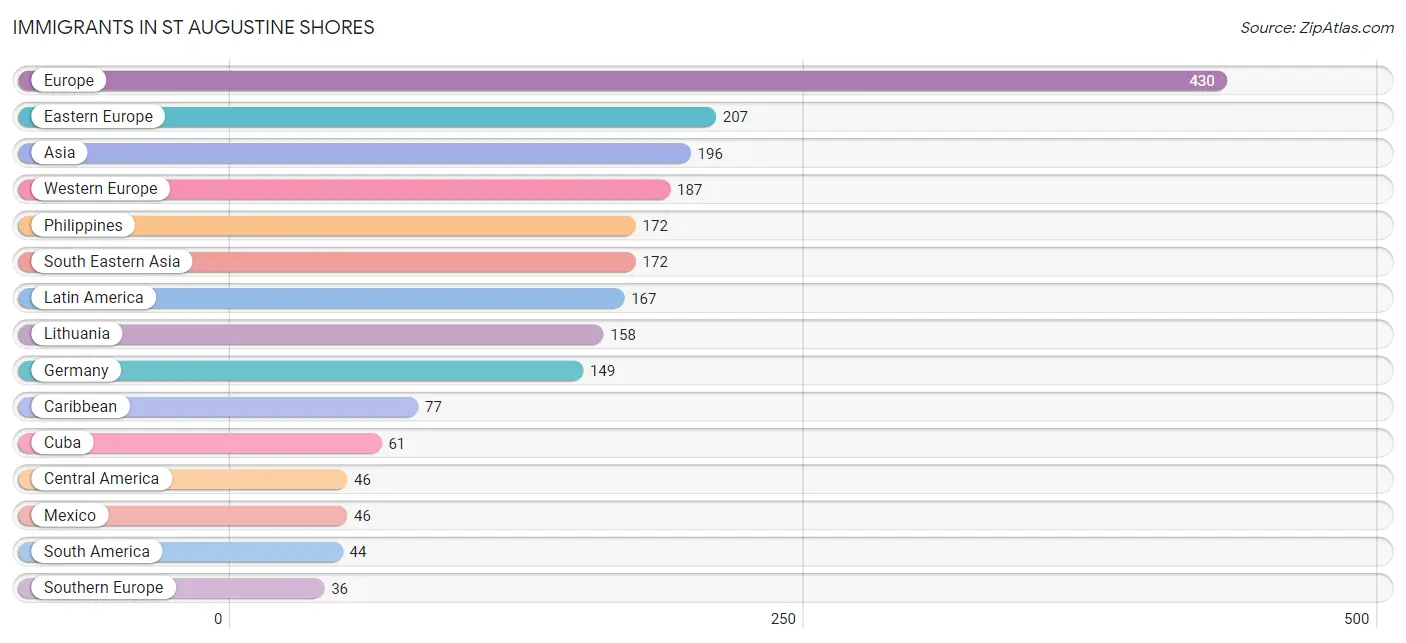
| Immigration Origin | # Population | % Population |
| Asia | 196 | 2.0% |
| Austria | 11 | 0.1% |
| Brazil | 10 | 0.1% |
| Canada | 19 | 0.2% |
| Caribbean | 77 | 0.8% |
| Central America | 46 | 0.5% |
| China | 19 | 0.2% |
| Colombia | 5 | 0.1% |
| Croatia | 17 | 0.2% |
| Cuba | 61 | 0.6% |
| Eastern Asia | 24 | 0.2% |
| Eastern Europe | 207 | 2.1% |
| Europe | 430 | 4.3% |
| Germany | 149 | 1.5% |
| Greece | 19 | 0.2% |
| Italy | 17 | 0.2% |
| Jamaica | 16 | 0.2% |
| Korea | 5 | 0.1% |
| Latin America | 167 | 1.7% |
| Lithuania | 158 | 1.6% |
| Mexico | 46 | 0.5% |
| Netherlands | 27 | 0.3% |
| Peru | 29 | 0.3% |
| Philippines | 172 | 1.7% |
| Poland | 32 | 0.3% |
| South America | 44 | 0.4% |
| South Eastern Asia | 172 | 1.7% |
| Southern Europe | 36 | 0.4% |
| Western Europe | 187 | 1.9% | View All 29 Rows |
Sex and Age in St Augustine Shores
Sex and Age in St Augustine Shores
The most populous age groups in St Augustine Shores are 50 to 54 Years (428 | 9.4%) for men and 55 to 59 Years (640 | 12.0%) for women.
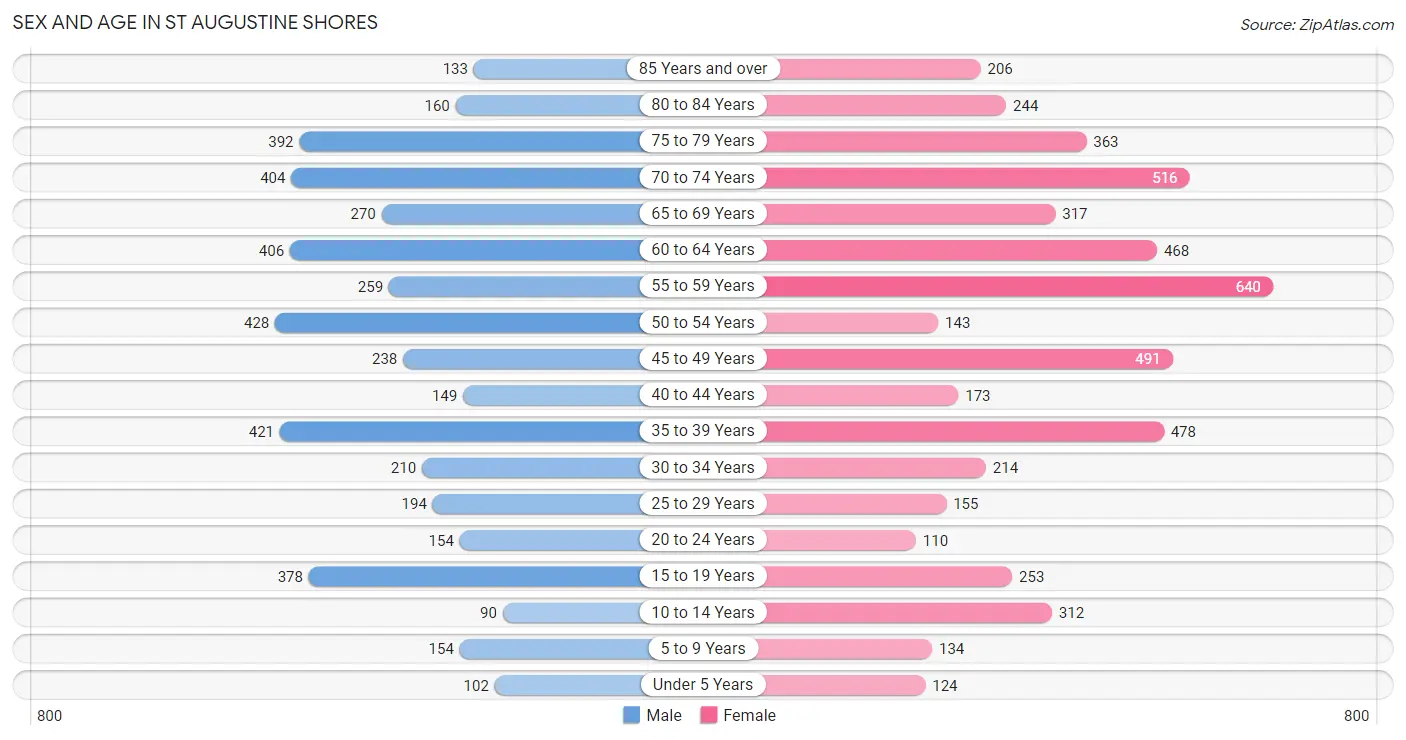
| Age Bracket | Male | Female |
| Under 5 Years | 102 (2.2%) | 124 (2.3%) |
| 5 to 9 Years | 154 (3.4%) | 134 (2.5%) |
| 10 to 14 Years | 90 (2.0%) | 312 (5.8%) |
| 15 to 19 Years | 378 (8.3%) | 253 (4.7%) |
| 20 to 24 Years | 154 (3.4%) | 110 (2.1%) |
| 25 to 29 Years | 194 (4.3%) | 155 (2.9%) |
| 30 to 34 Years | 210 (4.6%) | 214 (4.0%) |
| 35 to 39 Years | 421 (9.3%) | 478 (8.9%) |
| 40 to 44 Years | 149 (3.3%) | 173 (3.2%) |
| 45 to 49 Years | 238 (5.2%) | 491 (9.2%) |
| 50 to 54 Years | 428 (9.4%) | 143 (2.7%) |
| 55 to 59 Years | 259 (5.7%) | 640 (12.0%) |
| 60 to 64 Years | 406 (8.9%) | 468 (8.8%) |
| 65 to 69 Years | 270 (5.9%) | 317 (5.9%) |
| 70 to 74 Years | 404 (8.9%) | 516 (9.7%) |
| 75 to 79 Years | 392 (8.6%) | 363 (6.8%) |
| 80 to 84 Years | 160 (3.5%) | 244 (4.6%) |
| 85 Years and over | 133 (2.9%) | 206 (3.9%) |
| Total | 4,542 (100.0%) | 5,341 (100.0%) |
Families and Households in St Augustine Shores
Median Family Size in St Augustine Shores
The median family size in St Augustine Shores is 2.63 persons per family, with single female/mother families (616 | 21.4%) accounting for the largest median family size of 2.77 persons per family. On the other hand, single male/father families (61 | 2.1%) represent the smallest median family size with 1.67 persons per family.
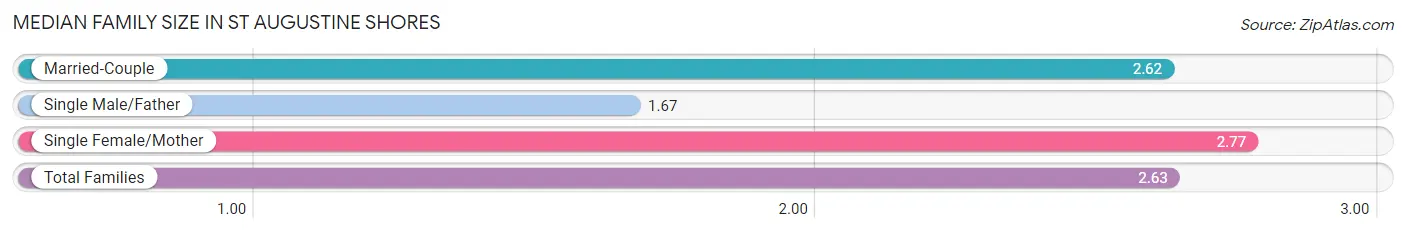
| Family Type | # Families | Family Size |
| Married-Couple | 2,200 (76.5%) | 2.62 |
| Single Male/Father | 61 (2.1%) | 1.67 |
| Single Female/Mother | 616 (21.4%) | 2.77 |
| Total Families | 2,877 (100.0%) | 2.63 |
Median Household Size in St Augustine Shores
The median household size in St Augustine Shores is 2.28 persons per household, with single female/mother households (616 | 14.2%) accounting for the largest median household size of 3.33 persons per household. non-family households (1,448 | 33.5%) represent the smallest median household size with 1.30 persons per household.
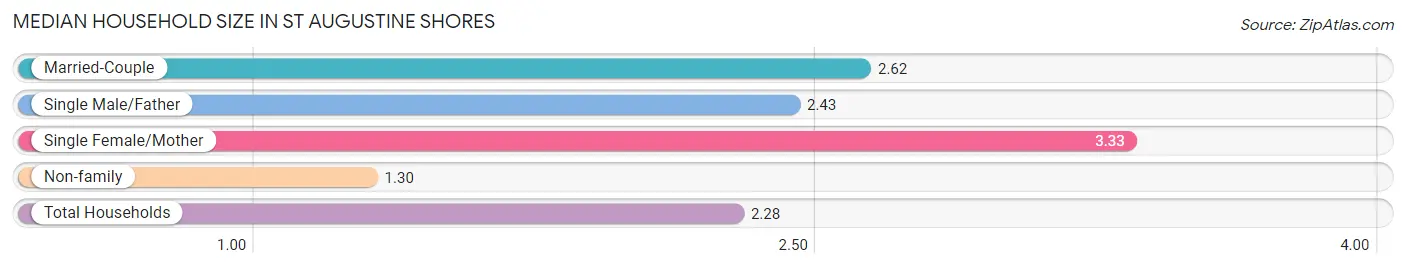
| Household Type | # Households | Household Size |
| Married-Couple | 2,200 (50.9%) | 2.62 |
| Single Male/Father | 61 (1.4%) | 2.43 |
| Single Female/Mother | 616 (14.2%) | 3.33 |
| Non-family | 1,448 (33.5%) | 1.30 |
| Total Households | 4,325 (100.0%) | 2.28 |
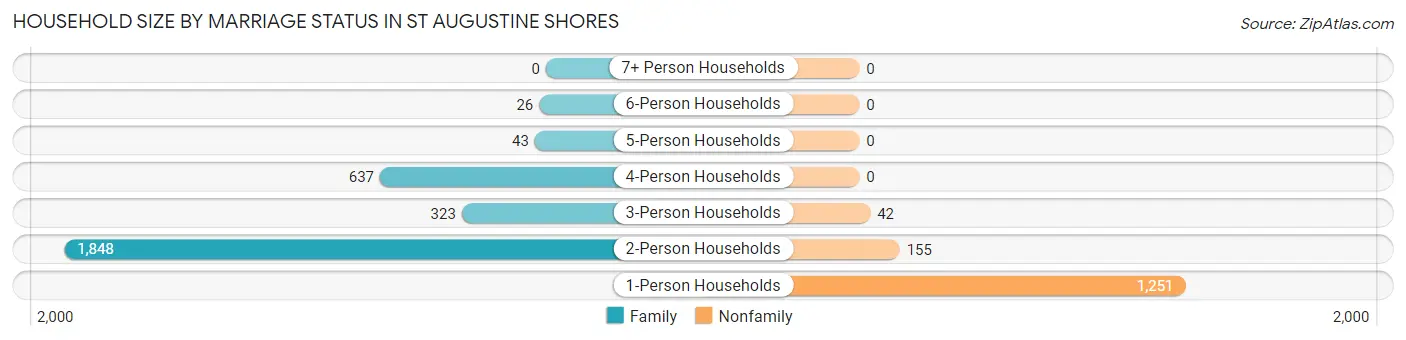
Household Size by Marriage Status in St Augustine Shores
Out of a total of 4,325 households in St Augustine Shores, 2,877 (66.5%) are family households, while 1,448 (33.5%) are nonfamily households. The most numerous type of family households are 2-person households, comprising 1,848, and the most common type of nonfamily households are 1-person households, comprising 1,251.
| Household Size | Family Households | Nonfamily Households |
| 1-Person Households | - | 1,251 (28.9%) |
| 2-Person Households | 1,848 (42.7%) | 155 (3.6%) |
| 3-Person Households | 323 (7.5%) | 42 (1.0%) |
| 4-Person Households | 637 (14.7%) | 0 (0.0%) |
| 5-Person Households | 43 (1.0%) | 0 (0.0%) |
| 6-Person Households | 26 (0.6%) | 0 (0.0%) |
| 7+ Person Households | 0 (0.0%) | 0 (0.0%) |
| Total | 2,877 (66.5%) | 1,448 (33.5%) |
Female Fertility in St Augustine Shores
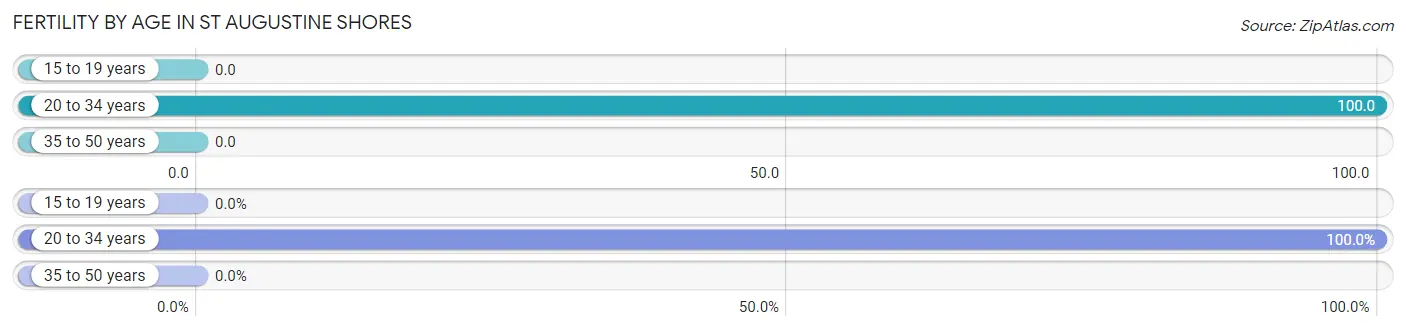
Fertility by Age in St Augustine Shores
Average fertility rate in St Augustine Shores is 25.0 births per 1,000 women. Women in the age bracket of 20 to 34 years have the highest fertility rate with 100.0 births per 1,000 women. Women in the age bracket of 20 to 34 years acount for 100.0% of all women with births.
| Age Bracket | Women with Births | Births / 1,000 Women |
| 15 to 19 years | 0 (0.0%) | 0.0 |
| 20 to 34 years | 48 (100.0%) | 100.0 |
| 35 to 50 years | 0 (0.0%) | 0.0 |
| Total | 48 (100.0%) | 25.0 |
Fertility by Age by Marriage Status in St Augustine Shores
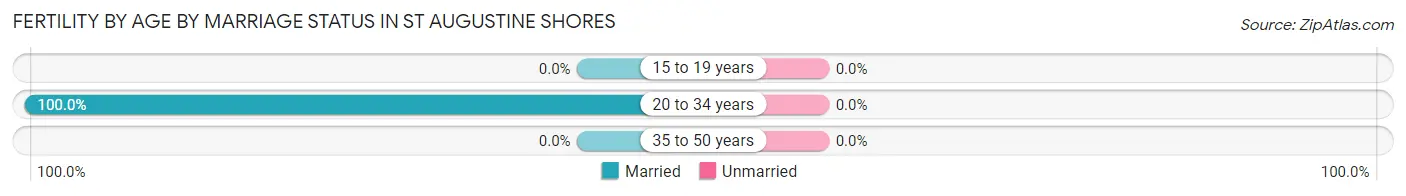
| Age Bracket | Married | Unmarried |
| 15 to 19 years | 0 (0.0%) | 0 (0.0%) |
| 20 to 34 years | 48 (100.0%) | 0 (0.0%) |
| 35 to 50 years | 0 (0.0%) | 0 (0.0%) |
| Total | 48 (100.0%) | 0 (0.0%) |
Fertility by Education in St Augustine Shores
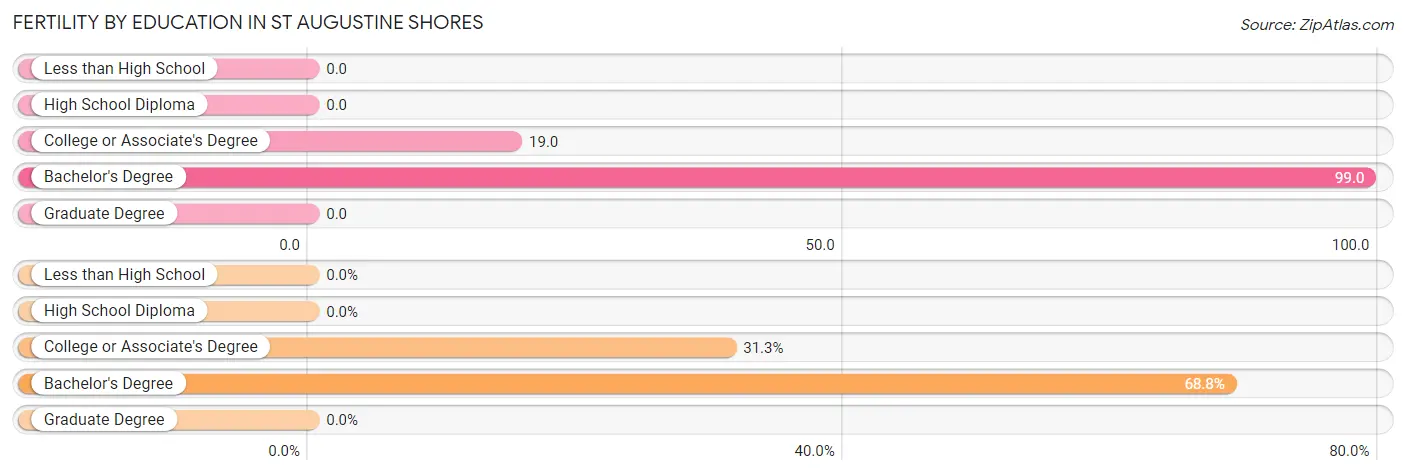
| Educational Attainment | Women with Births | Births / 1,000 Women |
| Less than High School | 0 (0.0%) | 0.0 |
| High School Diploma | 0 (0.0%) | 0.0 |
| College or Associate's Degree | 15 (31.2%) | 19.0 |
| Bachelor's Degree | 33 (68.8%) | 99.0 |
| Graduate Degree | 0 (0.0%) | 0.0 |
| Total | 48 (100.0%) | 25.0 |
Fertility by Education by Marriage Status in St Augustine Shores
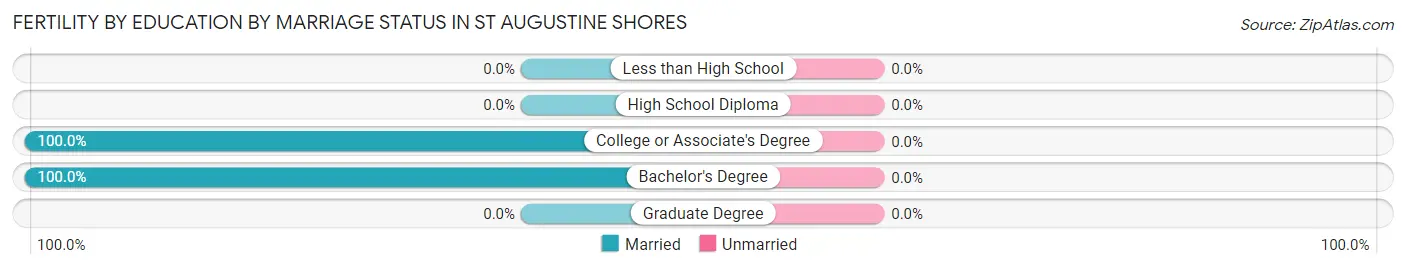
| Educational Attainment | Married | Unmarried |
| Less than High School | 0 (0.0%) | 0 (0.0%) |
| High School Diploma | 0 (0.0%) | 0 (0.0%) |
| College or Associate's Degree | 15 (100.0%) | 0 (0.0%) |
| Bachelor's Degree | 33 (100.0%) | 0 (0.0%) |
| Graduate Degree | 0 (0.0%) | 0 (0.0%) |
| Total | 48 (100.0%) | 0 (0.0%) |
Employment Characteristics in St Augustine Shores
Employment by Class of Employer in St Augustine Shores
Among the 4,700 employed individuals in St Augustine Shores, private company employees (2,682 | 57.1%), self-employed (not incorporated) (778 | 16.6%), and not-for-profit organizations (504 | 10.7%) make up the most common classes of employment.
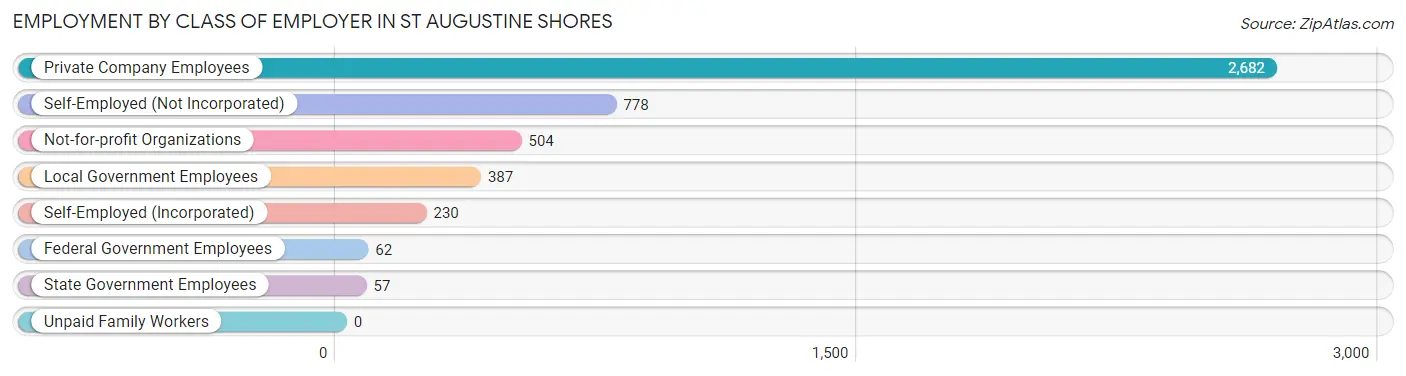
| Employer Class | # Employees | % Employees |
| Private Company Employees | 2,682 | 57.1% |
| Self-Employed (Incorporated) | 230 | 4.9% |
| Self-Employed (Not Incorporated) | 778 | 16.6% |
| Not-for-profit Organizations | 504 | 10.7% |
| Local Government Employees | 387 | 8.2% |
| State Government Employees | 57 | 1.2% |
| Federal Government Employees | 62 | 1.3% |
| Unpaid Family Workers | 0 | 0.0% |
| Total | 4,700 | 100.0% |
Employment Status by Age in St Augustine Shores
According to the labor force statistics for St Augustine Shores, out of the total population over 16 years of age (8,648), 56.6% or 4,895 individuals are in the labor force, with 3.7% or 181 of them unemployed. The age group with the highest labor force participation rate is 25 to 29 years, with 96.3% or 336 individuals in the labor force. Within the labor force, the 16 to 19 years age range has the highest percentage of unemployed individuals, with 17.4% or 20 of them being unemployed.
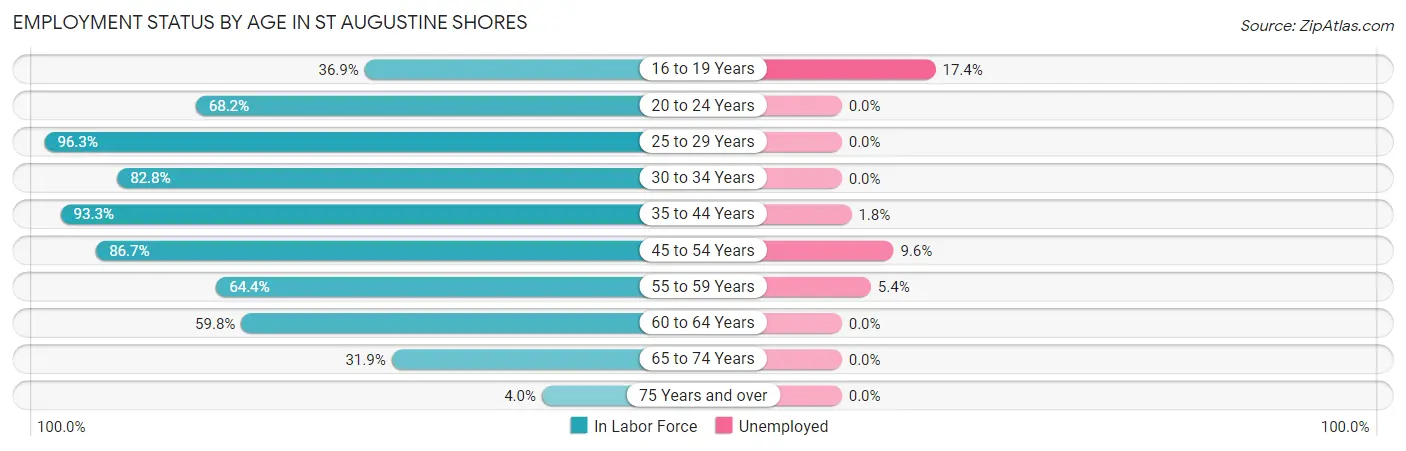
| Age Bracket | In Labor Force | Unemployed |
| 16 to 19 Years | 115 (36.9%) | 20 (17.4%) |
| 20 to 24 Years | 180 (68.2%) | 0 (0.0%) |
| 25 to 29 Years | 336 (96.3%) | 0 (0.0%) |
| 30 to 34 Years | 351 (82.8%) | 0 (0.0%) |
| 35 to 44 Years | 1,139 (93.3%) | 21 (1.8%) |
| 45 to 54 Years | 1,127 (86.7%) | 108 (9.6%) |
| 55 to 59 Years | 579 (64.4%) | 31 (5.4%) |
| 60 to 64 Years | 523 (59.8%) | 0 (0.0%) |
| 65 to 74 Years | 481 (31.9%) | 0 (0.0%) |
| 75 Years and over | 60 (4.0%) | 0 (0.0%) |
| Total | 4,895 (56.6%) | 181 (3.7%) |
Employment Status by Educational Attainment in St Augustine Shores
According to labor force statistics for St Augustine Shores, 80.0% of individuals (4,054) out of the total population between 25 and 64 years of age (5,067) are in the labor force, with 3.9% or 158 of them being unemployed. The group with the highest labor force participation rate are those with the educational attainment of bachelor's degree or higher, with 87.4% or 1,186 individuals in the labor force. Within the labor force, individuals with high school diploma education have the highest percentage of unemployment, with 12.0% or 108 of them being unemployed.
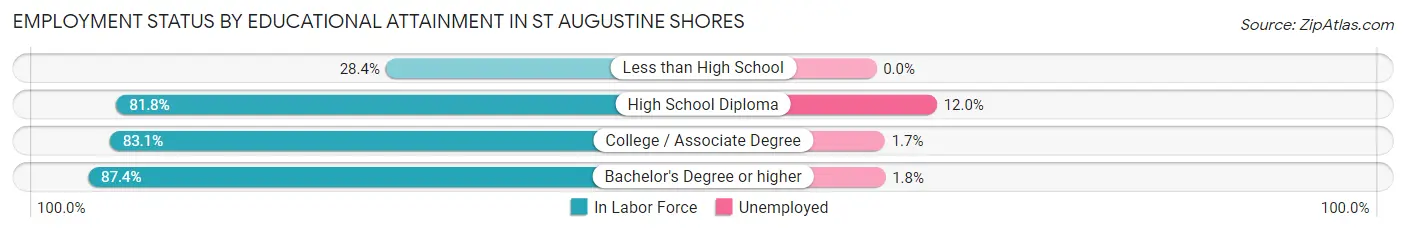
| Educational Attainment | In Labor Force | Unemployed |
| Less than High School | 104 (28.4%) | 0 (0.0%) |
| High School Diploma | 900 (81.8%) | 132 (12.0%) |
| College / Associate Degree | 1,865 (83.1%) | 38 (1.7%) |
| Bachelor's Degree or higher | 1,186 (87.4%) | 24 (1.8%) |
| Total | 4,054 (80.0%) | 198 (3.9%) |
Employment Occupations by Sex in St Augustine Shores
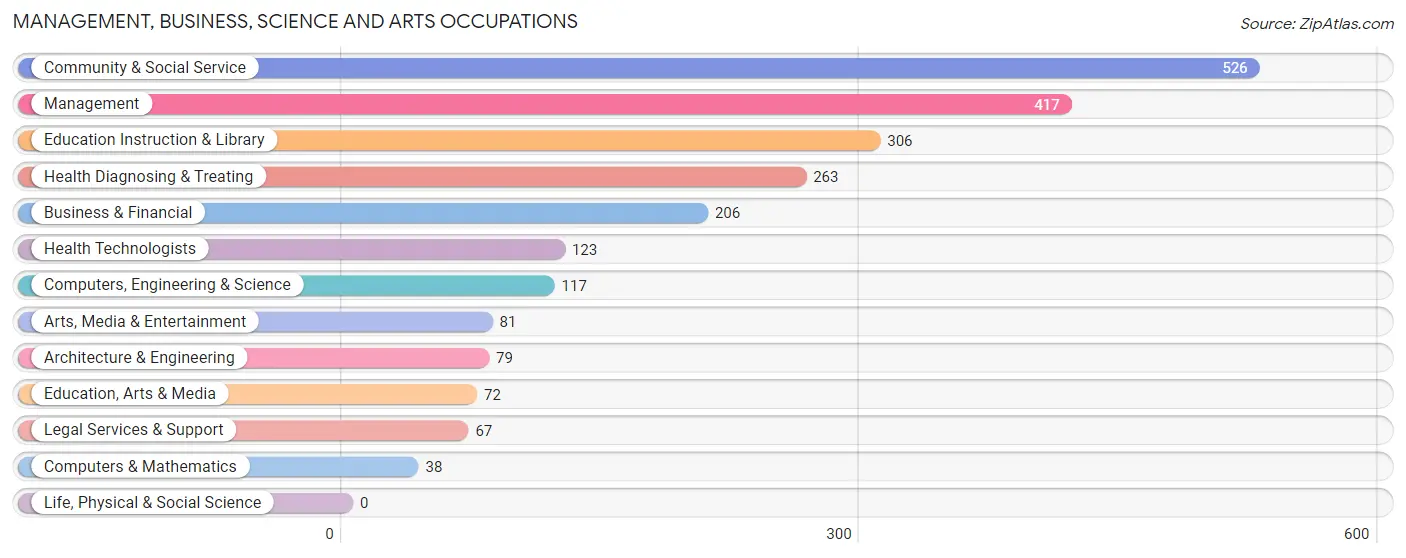
Management, Business, Science and Arts Occupations
The most common Management, Business, Science and Arts occupations in St Augustine Shores are Community & Social Service (526 | 11.2%), Management (417 | 8.8%), Education Instruction & Library (306 | 6.5%), Health Diagnosing & Treating (263 | 5.6%), and Business & Financial (206 | 4.4%).
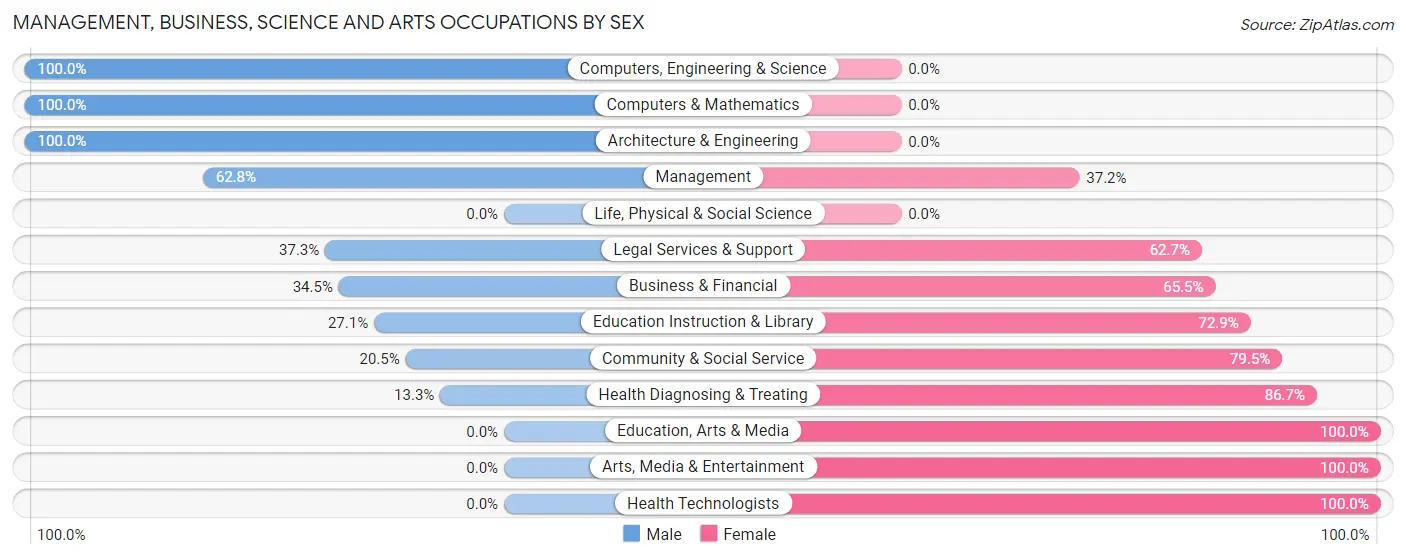
Management, Business, Science and Arts Occupations by Sex
Within the Management, Business, Science and Arts occupations in St Augustine Shores, the most male-oriented occupations are Computers, Engineering & Science (100.0%), Computers & Mathematics (100.0%), and Architecture & Engineering (100.0%), while the most female-oriented occupations are Education, Arts & Media (100.0%), Arts, Media & Entertainment (100.0%), and Health Technologists (100.0%).
| Occupation | Male | Female |
| Management | 262 (62.8%) | 155 (37.2%) |
| Business & Financial | 71 (34.5%) | 135 (65.5%) |
| Computers, Engineering & Science | 117 (100.0%) | 0 (0.0%) |
| Computers & Mathematics | 38 (100.0%) | 0 (0.0%) |
| Architecture & Engineering | 79 (100.0%) | 0 (0.0%) |
| Life, Physical & Social Science | 0 (0.0%) | 0 (0.0%) |
| Community & Social Service | 108 (20.5%) | 418 (79.5%) |
| Education, Arts & Media | 0 (0.0%) | 72 (100.0%) |
| Legal Services & Support | 25 (37.3%) | 42 (62.7%) |
| Education Instruction & Library | 83 (27.1%) | 223 (72.9%) |
| Arts, Media & Entertainment | 0 (0.0%) | 81 (100.0%) |
| Health Diagnosing & Treating | 35 (13.3%) | 228 (86.7%) |
| Health Technologists | 0 (0.0%) | 123 (100.0%) |
| Total (Category) | 593 (38.8%) | 936 (61.2%) |
| Total (Overall) | 2,251 (47.8%) | 2,460 (52.2%) |
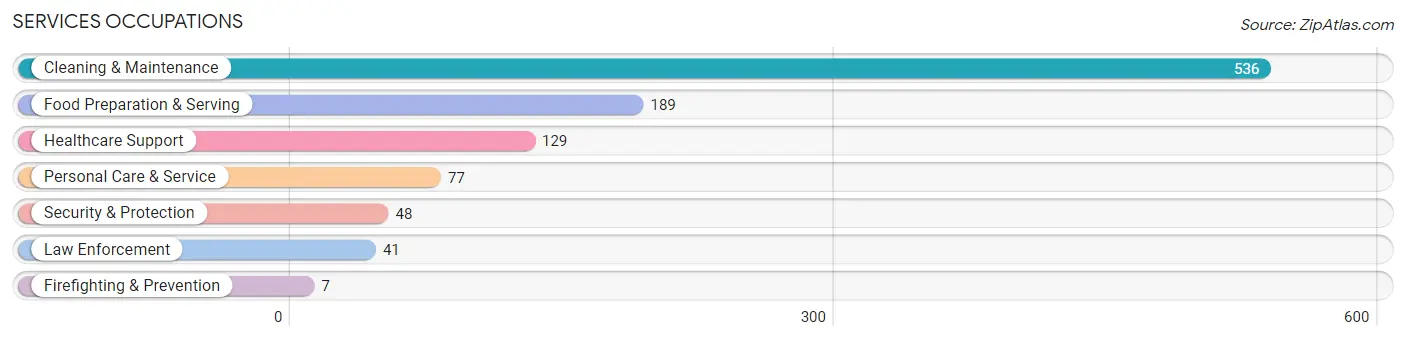
Services Occupations
The most common Services occupations in St Augustine Shores are Cleaning & Maintenance (536 | 11.4%), Food Preparation & Serving (189 | 4.0%), Healthcare Support (129 | 2.7%), Personal Care & Service (77 | 1.6%), and Security & Protection (48 | 1.0%).
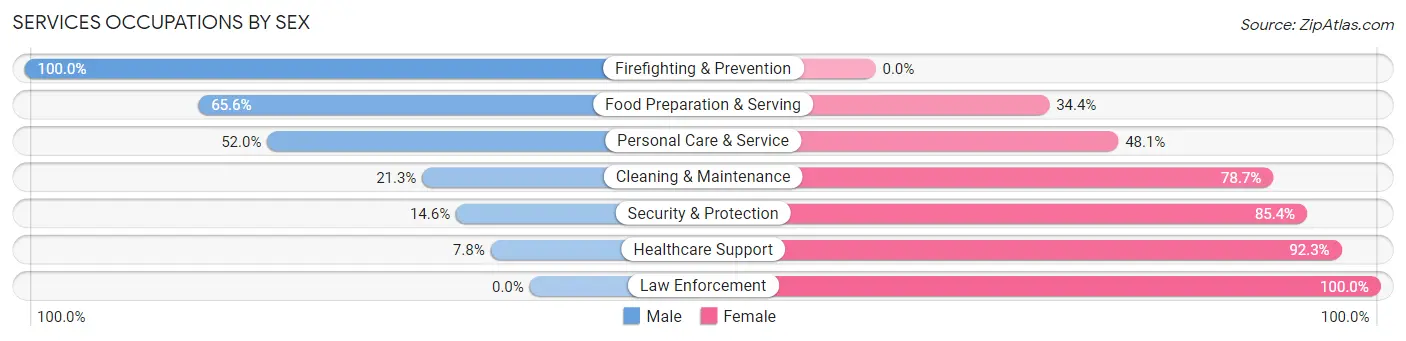
Services Occupations by Sex
Within the Services occupations in St Augustine Shores, the most male-oriented occupations are Firefighting & Prevention (100.0%), Food Preparation & Serving (65.6%), and Personal Care & Service (51.9%), while the most female-oriented occupations are Law Enforcement (100.0%), Healthcare Support (92.2%), and Security & Protection (85.4%).
| Occupation | Male | Female |
| Healthcare Support | 10 (7.7%) | 119 (92.2%) |
| Security & Protection | 7 (14.6%) | 41 (85.4%) |
| Firefighting & Prevention | 7 (100.0%) | 0 (0.0%) |
| Law Enforcement | 0 (0.0%) | 41 (100.0%) |
| Food Preparation & Serving | 124 (65.6%) | 65 (34.4%) |
| Cleaning & Maintenance | 114 (21.3%) | 422 (78.7%) |
| Personal Care & Service | 40 (51.9%) | 37 (48.0%) |
| Total (Category) | 295 (30.1%) | 684 (69.9%) |
| Total (Overall) | 2,251 (47.8%) | 2,460 (52.2%) |
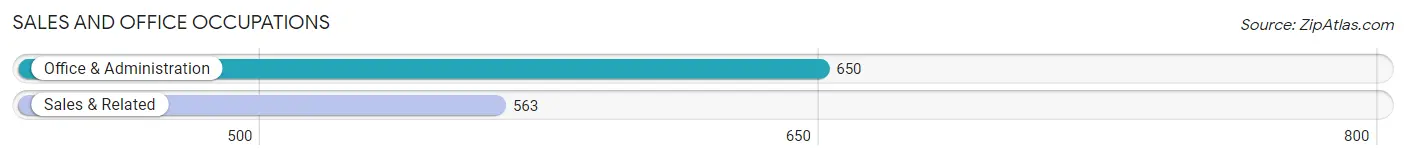
Sales and Office Occupations
The most common Sales and Office occupations in St Augustine Shores are Office & Administration (650 | 13.8%), and Sales & Related (563 | 11.9%).
Sales and Office Occupations by Sex
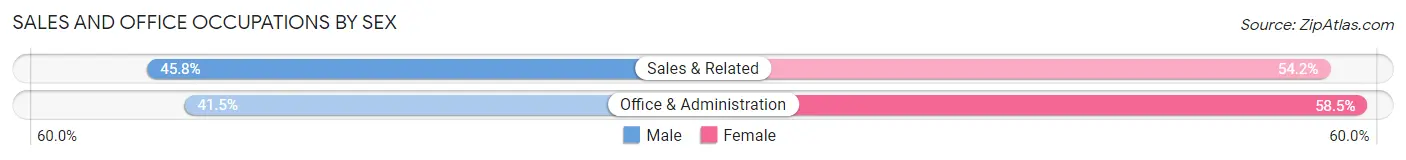
| Occupation | Male | Female |
| Sales & Related | 258 (45.8%) | 305 (54.2%) |
| Office & Administration | 270 (41.5%) | 380 (58.5%) |
| Total (Category) | 528 (43.5%) | 685 (56.5%) |
| Total (Overall) | 2,251 (47.8%) | 2,460 (52.2%) |
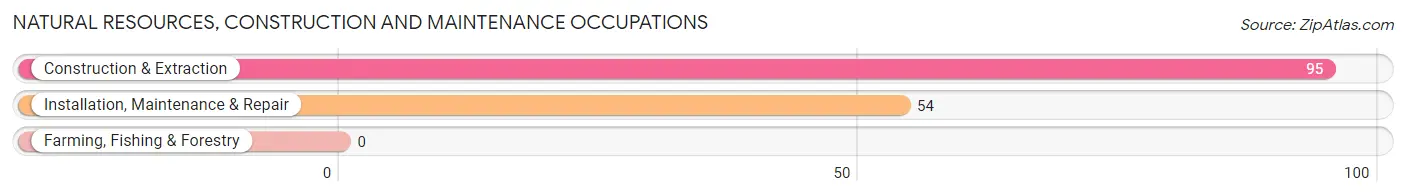
Natural Resources, Construction and Maintenance Occupations
The most common Natural Resources, Construction and Maintenance occupations in St Augustine Shores are Construction & Extraction (95 | 2.0%), and Installation, Maintenance & Repair (54 | 1.1%).
Natural Resources, Construction and Maintenance Occupations by Sex
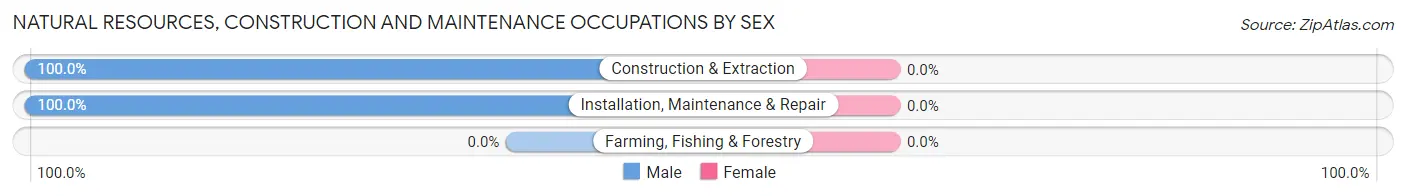
| Occupation | Male | Female |
| Farming, Fishing & Forestry | 0 (0.0%) | 0 (0.0%) |
| Construction & Extraction | 95 (100.0%) | 0 (0.0%) |
| Installation, Maintenance & Repair | 54 (100.0%) | 0 (0.0%) |
| Total (Category) | 149 (100.0%) | 0 (0.0%) |
| Total (Overall) | 2,251 (47.8%) | 2,460 (52.2%) |
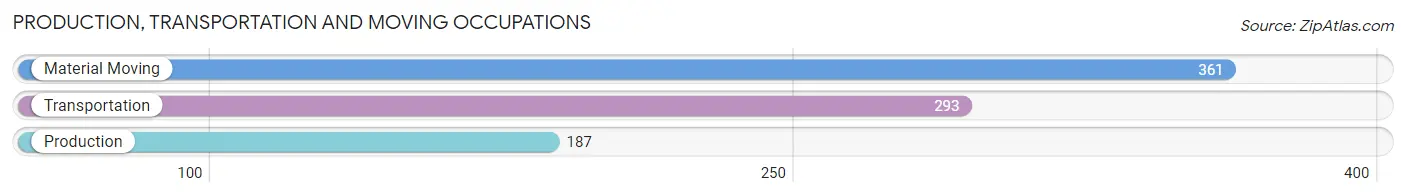
Production, Transportation and Moving Occupations
The most common Production, Transportation and Moving occupations in St Augustine Shores are Material Moving (361 | 7.7%), Transportation (293 | 6.2%), and Production (187 | 4.0%).
Production, Transportation and Moving Occupations by Sex
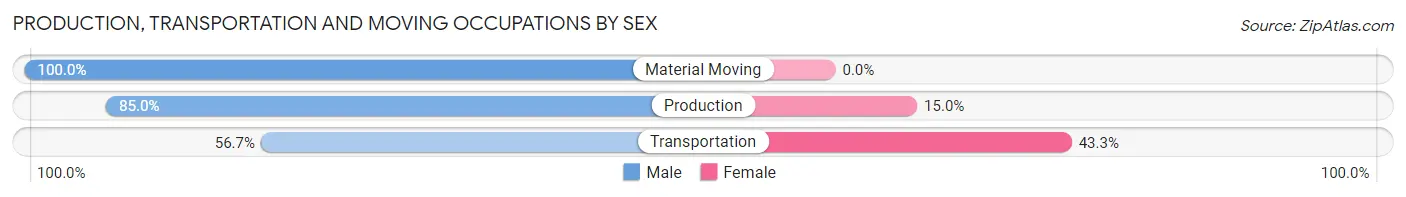
| Occupation | Male | Female |
| Production | 159 (85.0%) | 28 (15.0%) |
| Transportation | 166 (56.7%) | 127 (43.3%) |
| Material Moving | 361 (100.0%) | 0 (0.0%) |
| Total (Category) | 686 (81.6%) | 155 (18.4%) |
| Total (Overall) | 2,251 (47.8%) | 2,460 (52.2%) |
Employment Industries by Sex in St Augustine Shores
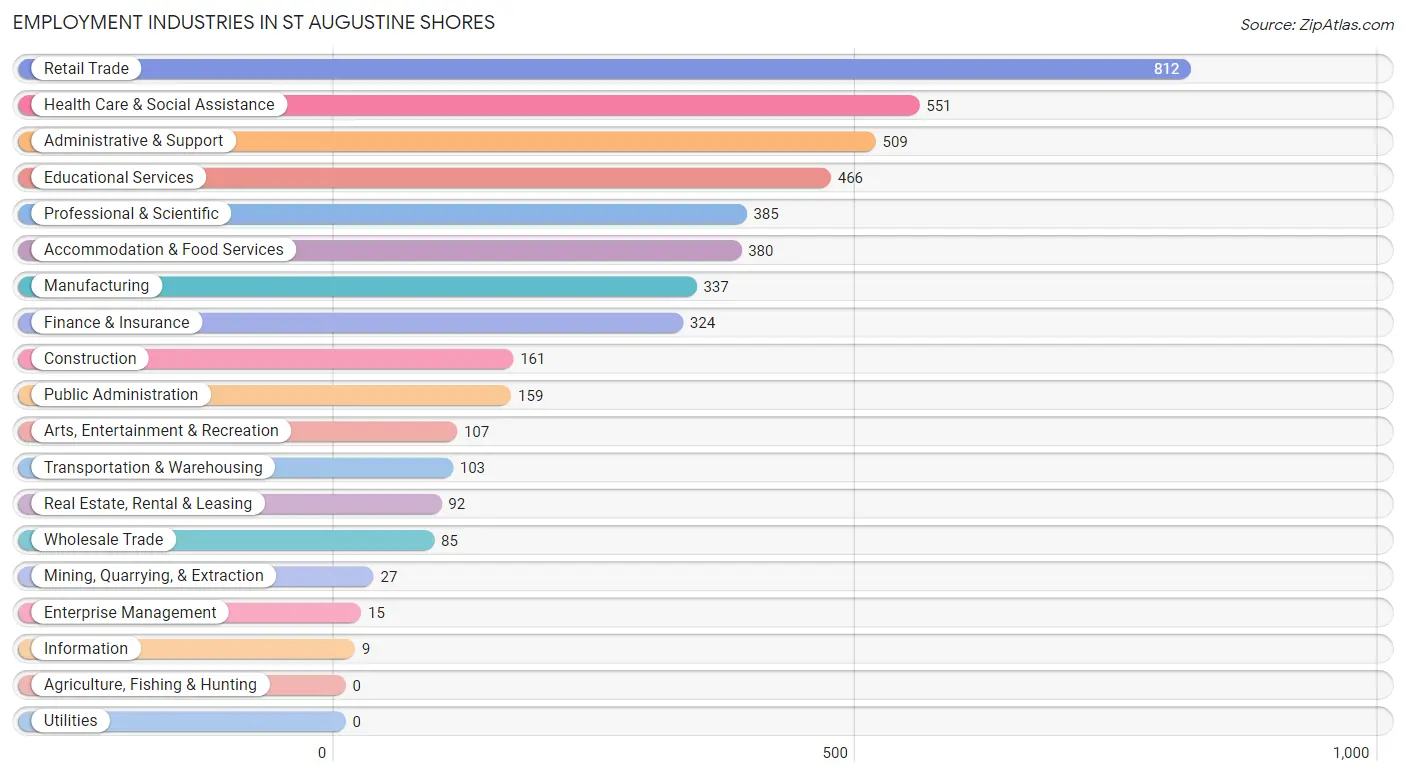
Employment Industries in St Augustine Shores
The major employment industries in St Augustine Shores include Retail Trade (812 | 17.2%), Health Care & Social Assistance (551 | 11.7%), Administrative & Support (509 | 10.8%), Educational Services (466 | 9.9%), and Professional & Scientific (385 | 8.2%).
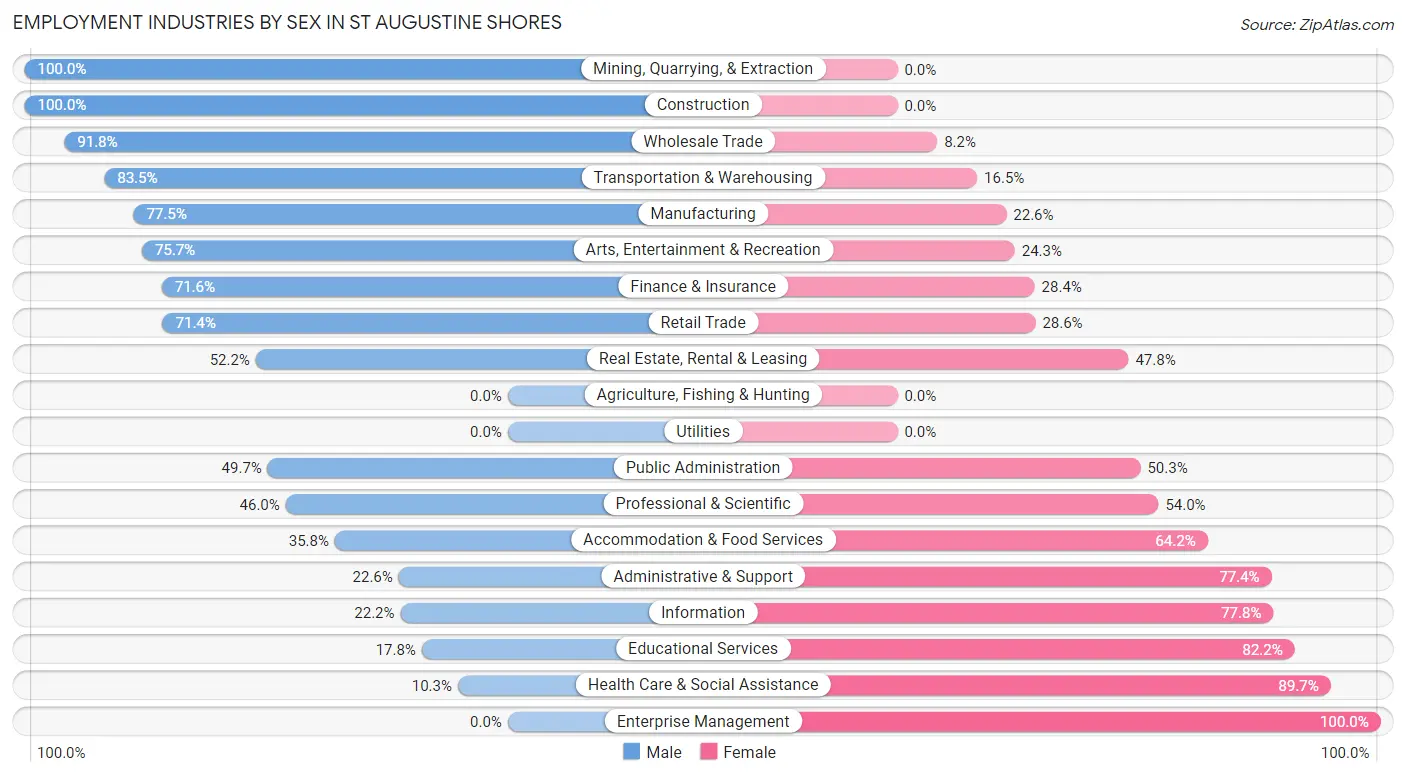
Employment Industries by Sex in St Augustine Shores
The St Augustine Shores industries that see more men than women are Mining, Quarrying, & Extraction (100.0%), Construction (100.0%), and Wholesale Trade (91.8%), whereas the industries that tend to have a higher number of women are Enterprise Management (100.0%), Health Care & Social Assistance (89.7%), and Educational Services (82.2%).
| Industry | Male | Female |
| Agriculture, Fishing & Hunting | 0 (0.0%) | 0 (0.0%) |
| Mining, Quarrying, & Extraction | 27 (100.0%) | 0 (0.0%) |
| Construction | 161 (100.0%) | 0 (0.0%) |
| Manufacturing | 261 (77.4%) | 76 (22.6%) |
| Wholesale Trade | 78 (91.8%) | 7 (8.2%) |
| Retail Trade | 580 (71.4%) | 232 (28.6%) |
| Transportation & Warehousing | 86 (83.5%) | 17 (16.5%) |
| Utilities | 0 (0.0%) | 0 (0.0%) |
| Information | 2 (22.2%) | 7 (77.8%) |
| Finance & Insurance | 232 (71.6%) | 92 (28.4%) |
| Real Estate, Rental & Leasing | 48 (52.2%) | 44 (47.8%) |
| Professional & Scientific | 177 (46.0%) | 208 (54.0%) |
| Enterprise Management | 0 (0.0%) | 15 (100.0%) |
| Administrative & Support | 115 (22.6%) | 394 (77.4%) |
| Educational Services | 83 (17.8%) | 383 (82.2%) |
| Health Care & Social Assistance | 57 (10.3%) | 494 (89.7%) |
| Arts, Entertainment & Recreation | 81 (75.7%) | 26 (24.3%) |
| Accommodation & Food Services | 136 (35.8%) | 244 (64.2%) |
| Public Administration | 79 (49.7%) | 80 (50.3%) |
| Total | 2,251 (47.8%) | 2,460 (52.2%) |
Education in St Augustine Shores
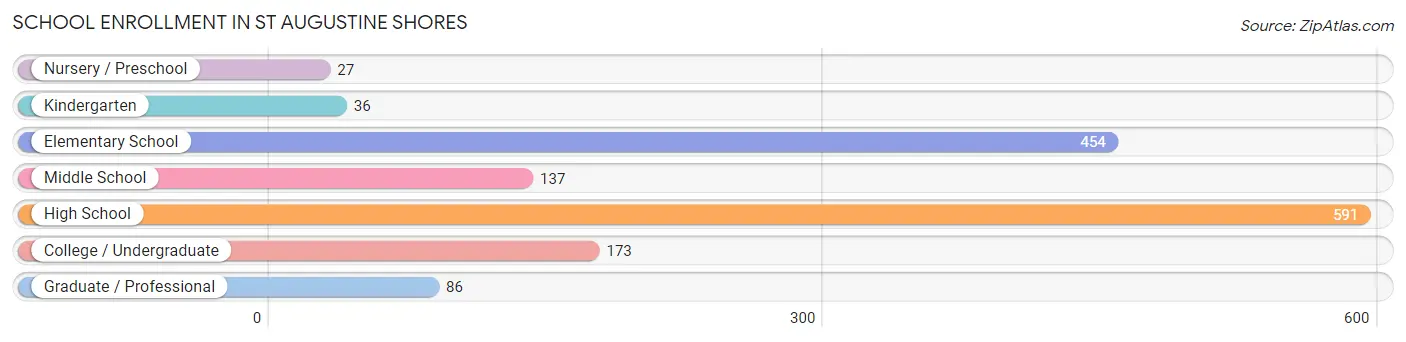
School Enrollment in St Augustine Shores
The most common levels of schooling among the 1,504 students in St Augustine Shores are high school (591 | 39.3%), elementary school (454 | 30.2%), and college / undergraduate (173 | 11.5%).
| School Level | # Students | % Students |
| Nursery / Preschool | 27 | 1.8% |
| Kindergarten | 36 | 2.4% |
| Elementary School | 454 | 30.2% |
| Middle School | 137 | 9.1% |
| High School | 591 | 39.3% |
| College / Undergraduate | 173 | 11.5% |
| Graduate / Professional | 86 | 5.7% |
| Total | 1,504 | 100.0% |
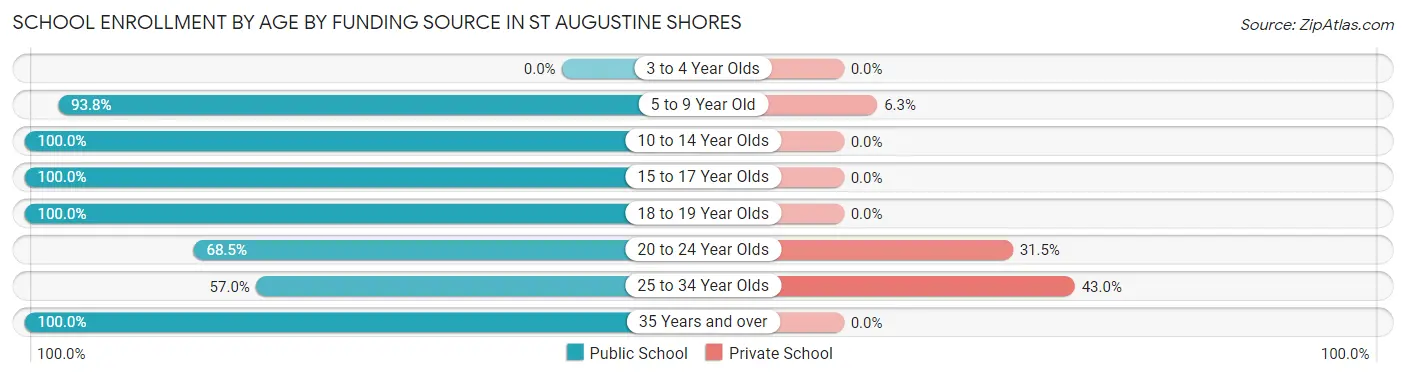
School Enrollment by Age by Funding Source in St Augustine Shores
Out of a total of 1,504 students who are enrolled in schools in St Augustine Shores, 86 (5.7%) attend a private institution, while the remaining 1,418 (94.3%) are enrolled in public schools. The age group of 25 to 34 year olds has the highest likelihood of being enrolled in private schools, with 34 (43.0% in the age bracket) enrolled. Conversely, the age group of 10 to 14 year olds has the lowest likelihood of being enrolled in a private school, with 402 (100.0% in the age bracket) attending a public institution.
| Age Bracket | Public School | Private School |
| 3 to 4 Year Olds | 0 (0.0%) | 0 (0.0%) |
| 5 to 9 Year Old | 270 (93.8%) | 18 (6.2%) |
| 10 to 14 Year Olds | 402 (100.0%) | 0 (0.0%) |
| 15 to 17 Year Olds | 535 (100.0%) | 0 (0.0%) |
| 18 to 19 Year Olds | 47 (100.0%) | 0 (0.0%) |
| 20 to 24 Year Olds | 74 (68.5%) | 34 (31.5%) |
| 25 to 34 Year Olds | 45 (57.0%) | 34 (43.0%) |
| 35 Years and over | 45 (100.0%) | 0 (0.0%) |
| Total | 1,418 (94.3%) | 86 (5.7%) |
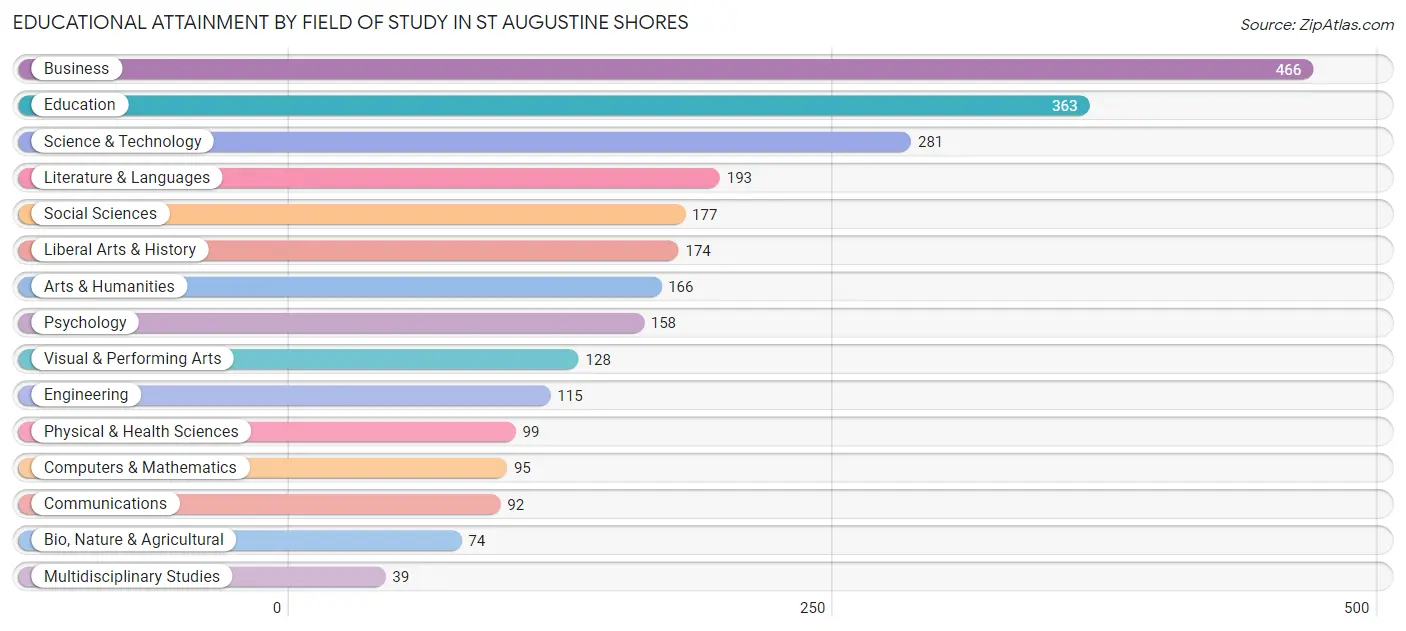
Educational Attainment by Field of Study in St Augustine Shores
Business (466 | 17.8%), education (363 | 13.9%), science & technology (281 | 10.7%), literature & languages (193 | 7.4%), and social sciences (177 | 6.8%) are the most common fields of study among 2,620 individuals in St Augustine Shores who have obtained a bachelor's degree or higher.
| Field of Study | # Graduates | % Graduates |
| Computers & Mathematics | 95 | 3.6% |
| Bio, Nature & Agricultural | 74 | 2.8% |
| Physical & Health Sciences | 99 | 3.8% |
| Psychology | 158 | 6.0% |
| Social Sciences | 177 | 6.8% |
| Engineering | 115 | 4.4% |
| Multidisciplinary Studies | 39 | 1.5% |
| Science & Technology | 281 | 10.7% |
| Business | 466 | 17.8% |
| Education | 363 | 13.9% |
| Literature & Languages | 193 | 7.4% |
| Liberal Arts & History | 174 | 6.6% |
| Visual & Performing Arts | 128 | 4.9% |
| Communications | 92 | 3.5% |
| Arts & Humanities | 166 | 6.3% |
| Total | 2,620 | 100.0% |
Transportation & Commute in St Augustine Shores
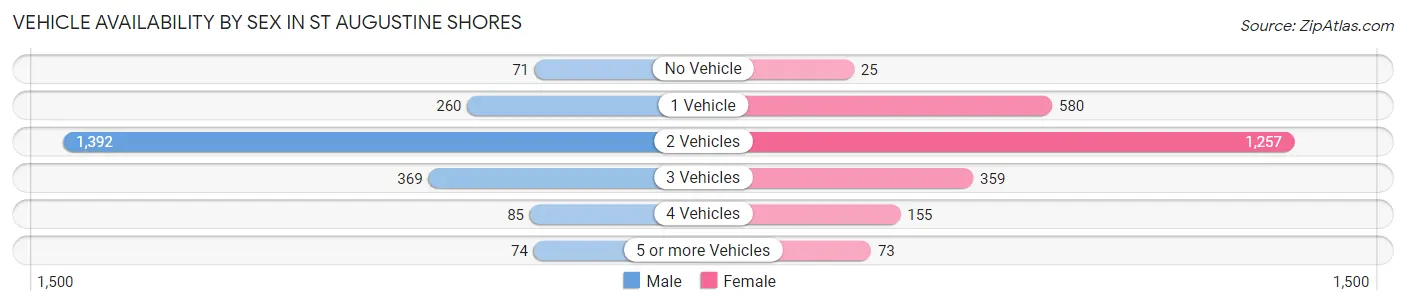
Vehicle Availability by Sex in St Augustine Shores
The most prevalent vehicle ownership categories in St Augustine Shores are males with 2 vehicles (1,392, accounting for 61.8%) and females with 2 vehicles (1,257, making up 56.8%).
| Vehicles Available | Male | Female |
| No Vehicle | 71 (3.2%) | 25 (1.0%) |
| 1 Vehicle | 260 (11.6%) | 580 (23.7%) |
| 2 Vehicles | 1,392 (61.8%) | 1,257 (51.3%) |
| 3 Vehicles | 369 (16.4%) | 359 (14.7%) |
| 4 Vehicles | 85 (3.8%) | 155 (6.3%) |
| 5 or more Vehicles | 74 (3.3%) | 73 (3.0%) |
| Total | 2,251 (100.0%) | 2,449 (100.0%) |
Commute Time in St Augustine Shores
The most frequently occuring commute durations in St Augustine Shores are 15 to 19 minutes (1,168 commuters, 28.5%), 10 to 14 minutes (607 commuters, 14.8%), and 20 to 24 minutes (542 commuters, 13.2%).
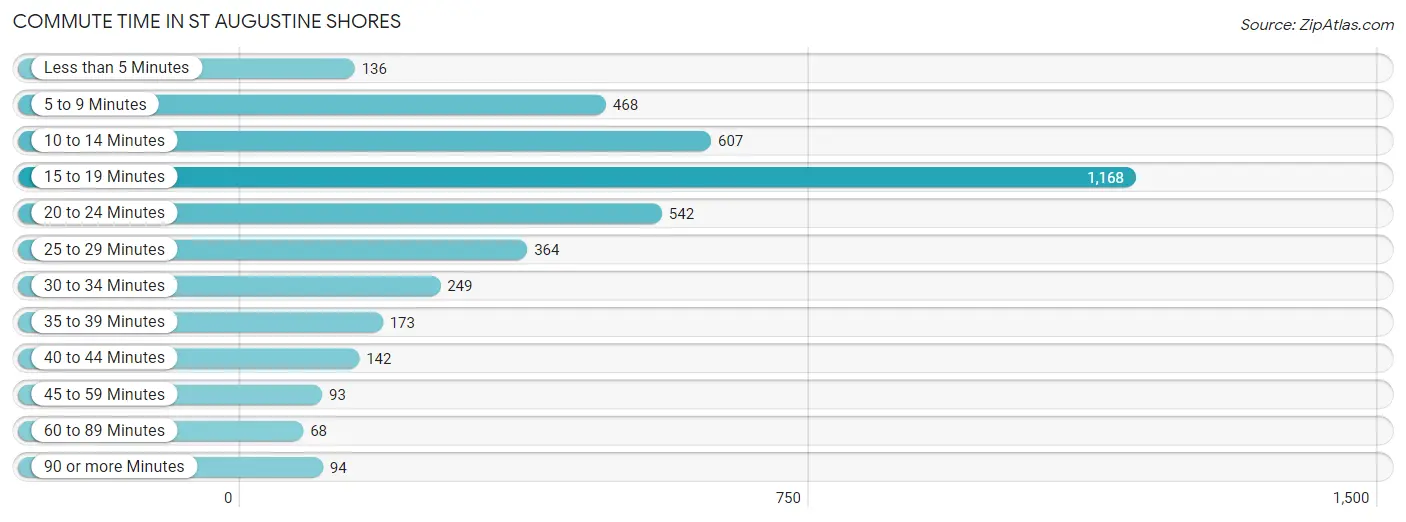
| Commute Time | # Commuters | % Commuters |
| Less than 5 Minutes | 136 | 3.3% |
| 5 to 9 Minutes | 468 | 11.4% |
| 10 to 14 Minutes | 607 | 14.8% |
| 15 to 19 Minutes | 1,168 | 28.5% |
| 20 to 24 Minutes | 542 | 13.2% |
| 25 to 29 Minutes | 364 | 8.9% |
| 30 to 34 Minutes | 249 | 6.1% |
| 35 to 39 Minutes | 173 | 4.2% |
| 40 to 44 Minutes | 142 | 3.5% |
| 45 to 59 Minutes | 93 | 2.3% |
| 60 to 89 Minutes | 68 | 1.7% |
| 90 or more Minutes | 94 | 2.3% |
Commute Time by Sex in St Augustine Shores
The most common commute times in St Augustine Shores are 15 to 19 minutes (512 commuters, 25.3%) for males and 15 to 19 minutes (656 commuters, 31.5%) for females.
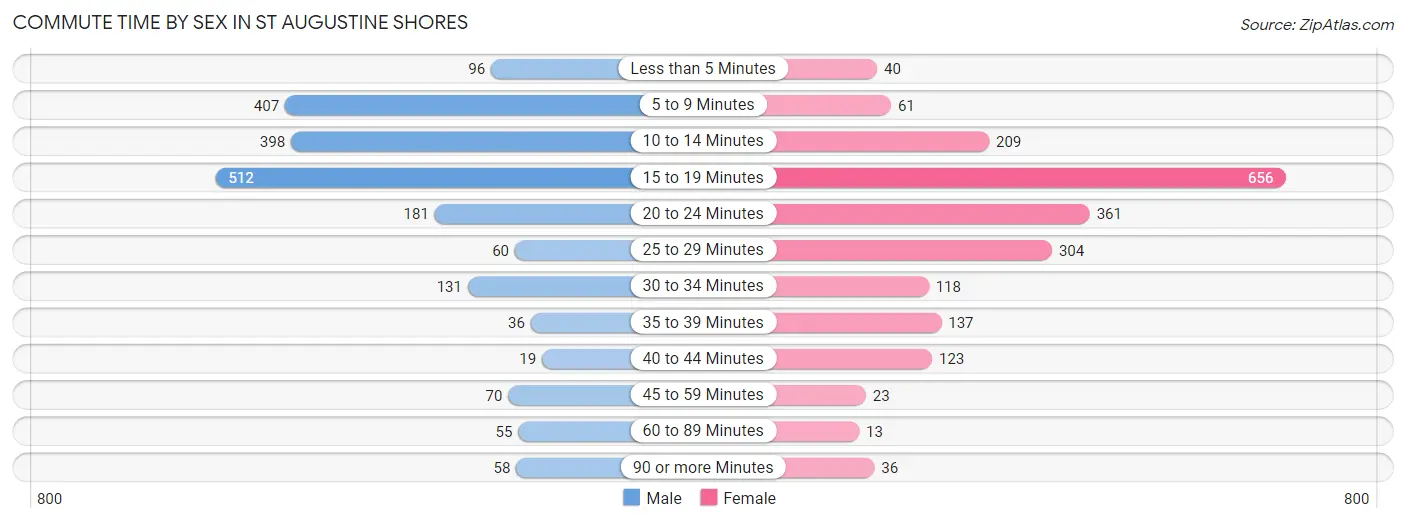
| Commute Time | Male | Female |
| Less than 5 Minutes | 96 (4.8%) | 40 (1.9%) |
| 5 to 9 Minutes | 407 (20.1%) | 61 (2.9%) |
| 10 to 14 Minutes | 398 (19.7%) | 209 (10.0%) |
| 15 to 19 Minutes | 512 (25.3%) | 656 (31.5%) |
| 20 to 24 Minutes | 181 (8.9%) | 361 (17.3%) |
| 25 to 29 Minutes | 60 (3.0%) | 304 (14.6%) |
| 30 to 34 Minutes | 131 (6.5%) | 118 (5.7%) |
| 35 to 39 Minutes | 36 (1.8%) | 137 (6.6%) |
| 40 to 44 Minutes | 19 (0.9%) | 123 (5.9%) |
| 45 to 59 Minutes | 70 (3.5%) | 23 (1.1%) |
| 60 to 89 Minutes | 55 (2.7%) | 13 (0.6%) |
| 90 or more Minutes | 58 (2.9%) | 36 (1.7%) |
Time of Departure to Work by Sex in St Augustine Shores
The most frequent times of departure to work in St Augustine Shores are 5:30 AM to 5:59 AM (376, 18.6%) for males and 7:30 AM to 7:59 AM (483, 23.2%) for females.
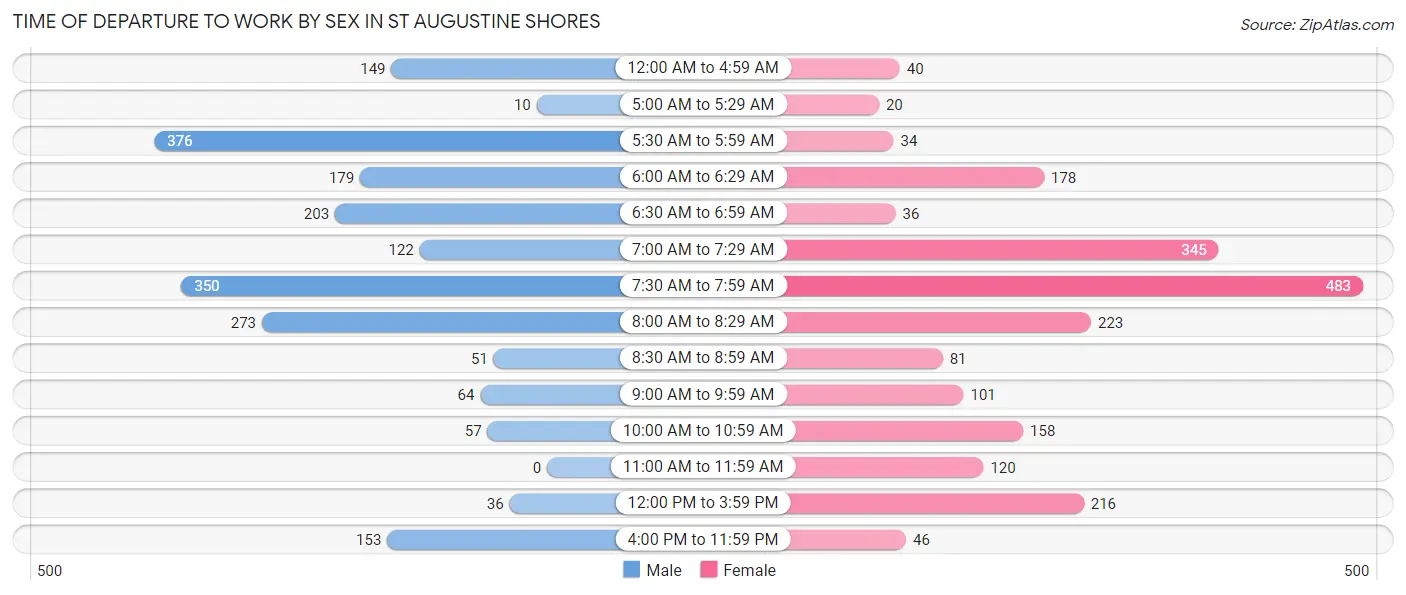
| Time of Departure | Male | Female |
| 12:00 AM to 4:59 AM | 149 (7.4%) | 40 (1.9%) |
| 5:00 AM to 5:29 AM | 10 (0.5%) | 20 (1.0%) |
| 5:30 AM to 5:59 AM | 376 (18.6%) | 34 (1.6%) |
| 6:00 AM to 6:29 AM | 179 (8.8%) | 178 (8.6%) |
| 6:30 AM to 6:59 AM | 203 (10.0%) | 36 (1.7%) |
| 7:00 AM to 7:29 AM | 122 (6.0%) | 345 (16.6%) |
| 7:30 AM to 7:59 AM | 350 (17.3%) | 483 (23.2%) |
| 8:00 AM to 8:29 AM | 273 (13.5%) | 223 (10.7%) |
| 8:30 AM to 8:59 AM | 51 (2.5%) | 81 (3.9%) |
| 9:00 AM to 9:59 AM | 64 (3.2%) | 101 (4.9%) |
| 10:00 AM to 10:59 AM | 57 (2.8%) | 158 (7.6%) |
| 11:00 AM to 11:59 AM | 0 (0.0%) | 120 (5.8%) |
| 12:00 PM to 3:59 PM | 36 (1.8%) | 216 (10.4%) |
| 4:00 PM to 11:59 PM | 153 (7.6%) | 46 (2.2%) |
| Total | 2,023 (100.0%) | 2,081 (100.0%) |
Housing Occupancy in St Augustine Shores
Occupancy by Ownership in St Augustine Shores
Of the total 4,325 dwellings in St Augustine Shores, owner-occupied units account for 3,062 (70.8%), while renter-occupied units make up 1,263 (29.2%).
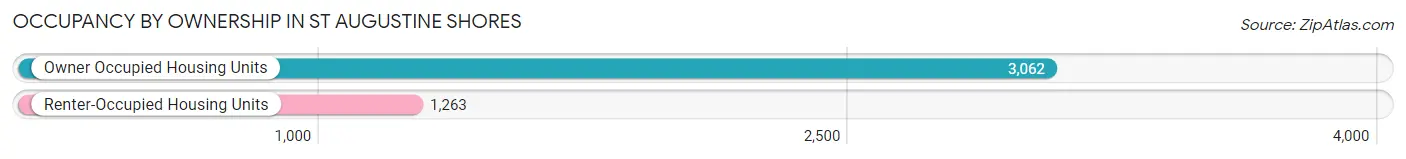
| Occupancy | # Housing Units | % Housing Units |
| Owner Occupied Housing Units | 3,062 | 70.8% |
| Renter-Occupied Housing Units | 1,263 | 29.2% |
| Total Occupied Housing Units | 4,325 | 100.0% |
Occupancy by Household Size in St Augustine Shores
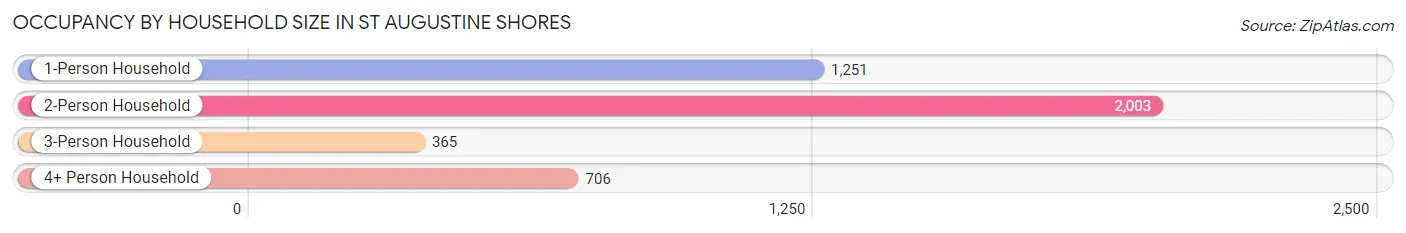
| Household Size | # Housing Units | % Housing Units |
| 1-Person Household | 1,251 | 28.9% |
| 2-Person Household | 2,003 | 46.3% |
| 3-Person Household | 365 | 8.4% |
| 4+ Person Household | 706 | 16.3% |
| Total Housing Units | 4,325 | 100.0% |
Occupancy by Ownership by Household Size in St Augustine Shores
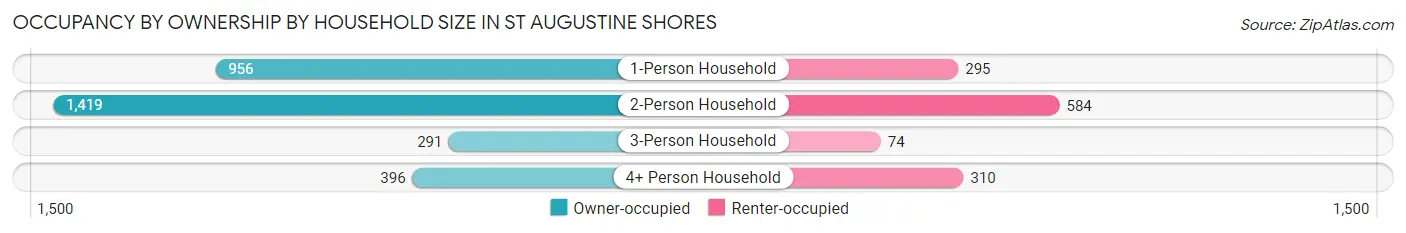
| Household Size | Owner-occupied | Renter-occupied |
| 1-Person Household | 956 (76.4%) | 295 (23.6%) |
| 2-Person Household | 1,419 (70.8%) | 584 (29.2%) |
| 3-Person Household | 291 (79.7%) | 74 (20.3%) |
| 4+ Person Household | 396 (56.1%) | 310 (43.9%) |
| Total Housing Units | 3,062 (70.8%) | 1,263 (29.2%) |
Occupancy by Educational Attainment in St Augustine Shores
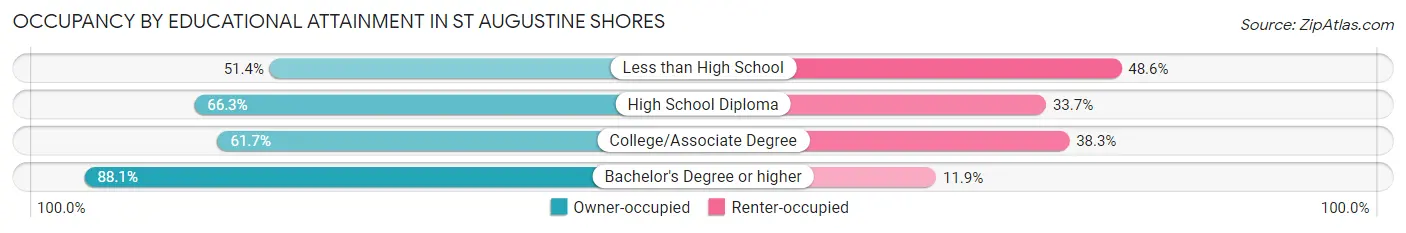
| Household Size | Owner-occupied | Renter-occupied |
| Less than High School | 110 (51.4%) | 104 (48.6%) |
| High School Diploma | 593 (66.3%) | 301 (33.7%) |
| College/Associate Degree | 1,113 (61.7%) | 690 (38.3%) |
| Bachelor's Degree or higher | 1,246 (88.1%) | 168 (11.9%) |
Occupancy by Age of Householder in St Augustine Shores
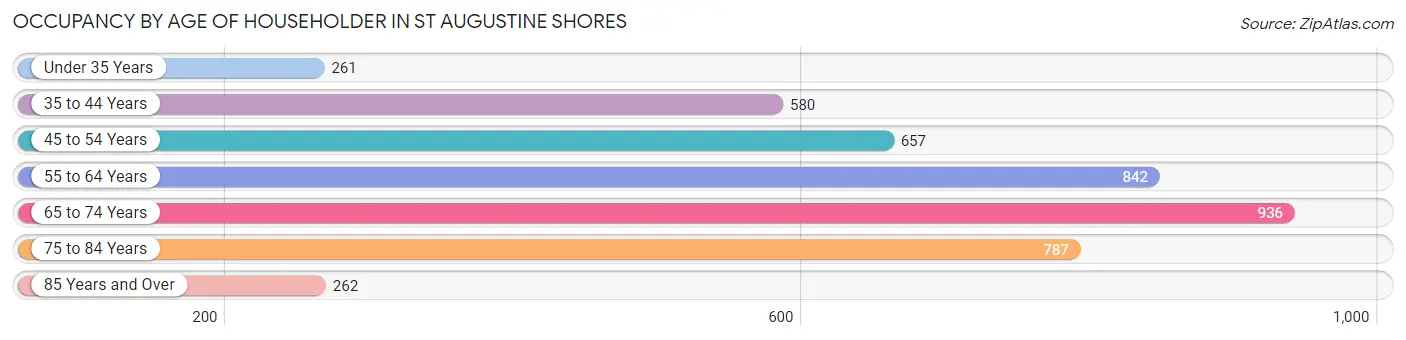
| Age Bracket | # Households | % Households |
| Under 35 Years | 261 | 6.0% |
| 35 to 44 Years | 580 | 13.4% |
| 45 to 54 Years | 657 | 15.2% |
| 55 to 64 Years | 842 | 19.5% |
| 65 to 74 Years | 936 | 21.6% |
| 75 to 84 Years | 787 | 18.2% |
| 85 Years and Over | 262 | 6.1% |
| Total | 4,325 | 100.0% |
Housing Finances in St Augustine Shores
Median Income by Occupancy in St Augustine Shores
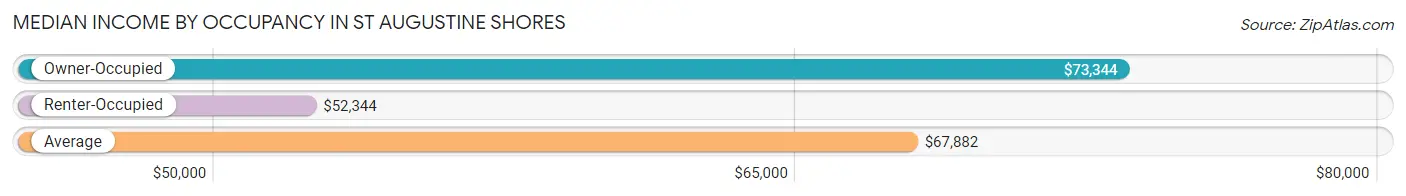
| Occupancy Type | # Households | Median Income |
| Owner-Occupied | 3,062 (70.8%) | $73,344 |
| Renter-Occupied | 1,263 (29.2%) | $52,344 |
| Average | 4,325 (100.0%) | $67,882 |
Occupancy by Householder Income Bracket in St Augustine Shores
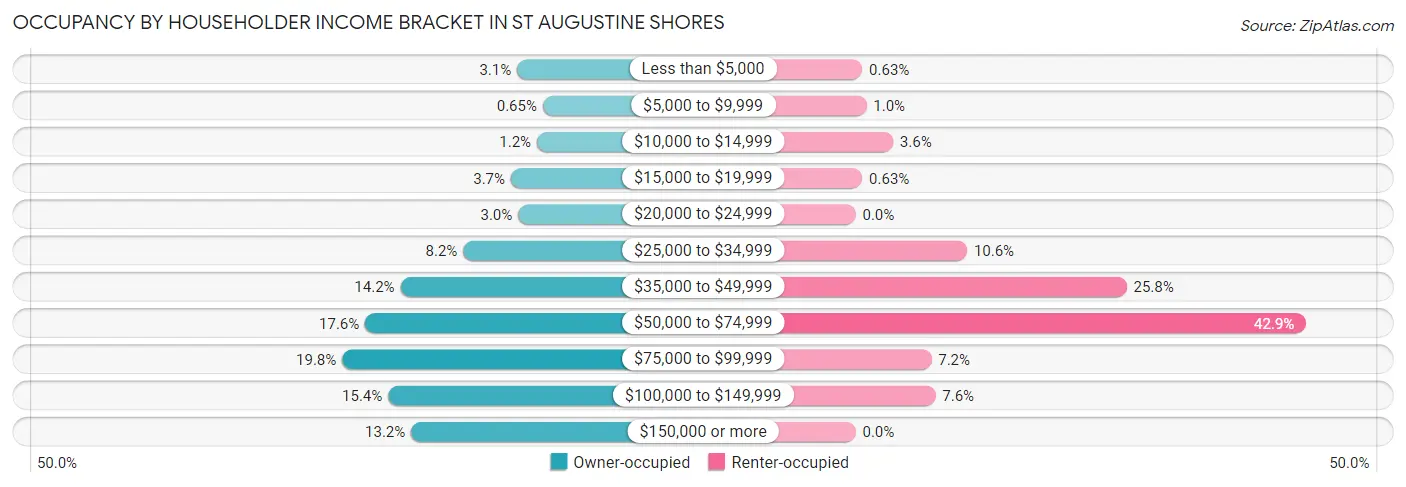
| Income Bracket | Owner-occupied | Renter-occupied |
| Less than $5,000 | 95 (3.1%) | 8 (0.6%) |
| $5,000 to $9,999 | 20 (0.6%) | 13 (1.0%) |
| $10,000 to $14,999 | 37 (1.2%) | 45 (3.6%) |
| $15,000 to $19,999 | 113 (3.7%) | 8 (0.6%) |
| $20,000 to $24,999 | 92 (3.0%) | 0 (0.0%) |
| $25,000 to $34,999 | 252 (8.2%) | 134 (10.6%) |
| $35,000 to $49,999 | 435 (14.2%) | 326 (25.8%) |
| $50,000 to $74,999 | 538 (17.6%) | 542 (42.9%) |
| $75,000 to $99,999 | 605 (19.8%) | 91 (7.2%) |
| $100,000 to $149,999 | 471 (15.4%) | 96 (7.6%) |
| $150,000 or more | 404 (13.2%) | 0 (0.0%) |
| Total | 3,062 (100.0%) | 1,263 (100.0%) |
Monthly Housing Cost Tiers in St Augustine Shores
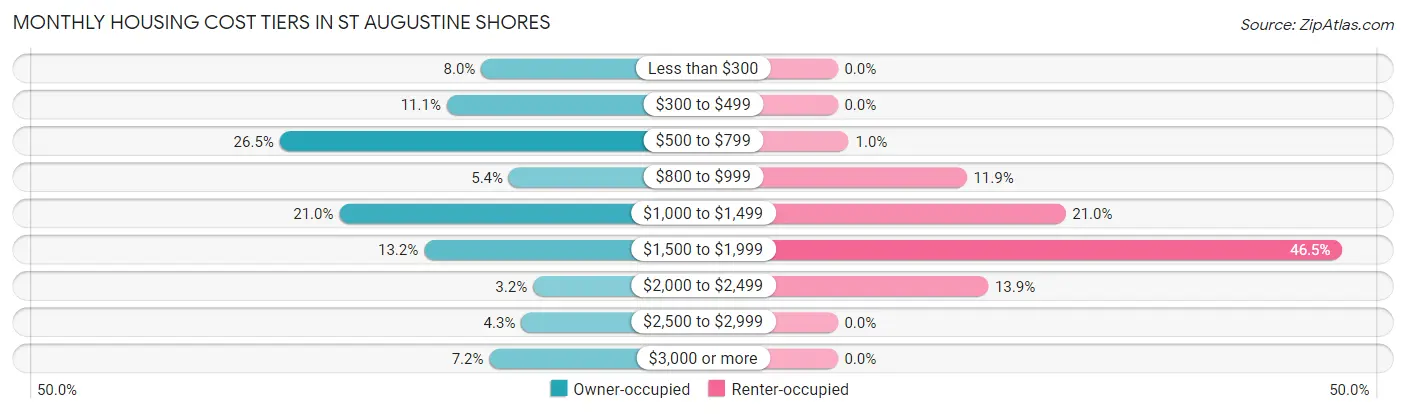
| Monthly Cost | Owner-occupied | Renter-occupied |
| Less than $300 | 244 (8.0%) | 0 (0.0%) |
| $300 to $499 | 341 (11.1%) | 0 (0.0%) |
| $500 to $799 | 812 (26.5%) | 13 (1.0%) |
| $800 to $999 | 166 (5.4%) | 150 (11.9%) |
| $1,000 to $1,499 | 644 (21.0%) | 265 (21.0%) |
| $1,500 to $1,999 | 405 (13.2%) | 587 (46.5%) |
| $2,000 to $2,499 | 98 (3.2%) | 175 (13.9%) |
| $2,500 to $2,999 | 131 (4.3%) | 0 (0.0%) |
| $3,000 or more | 221 (7.2%) | 0 (0.0%) |
| Total | 3,062 (100.0%) | 1,263 (100.0%) |
Physical Housing Characteristics in St Augustine Shores
Housing Structures in St Augustine Shores
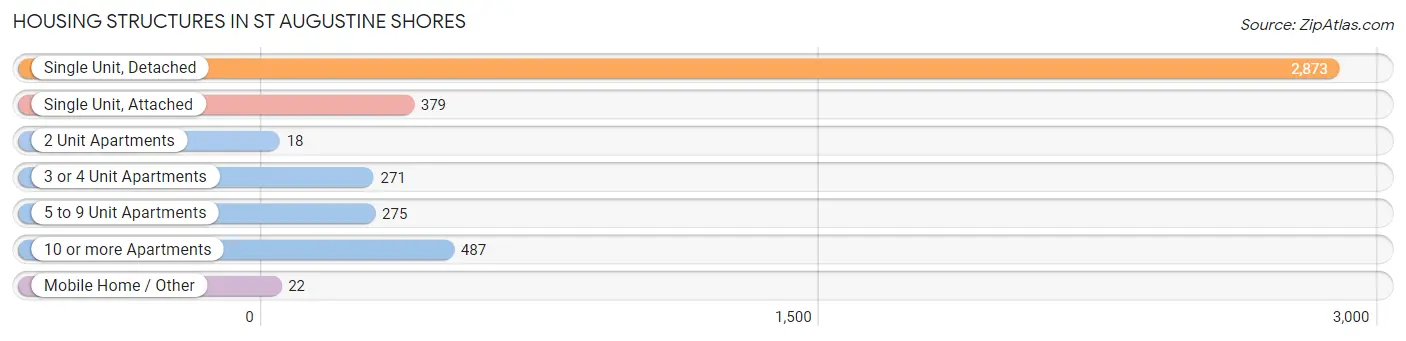
| Structure Type | # Housing Units | % Housing Units |
| Single Unit, Detached | 2,873 | 66.4% |
| Single Unit, Attached | 379 | 8.8% |
| 2 Unit Apartments | 18 | 0.4% |
| 3 or 4 Unit Apartments | 271 | 6.3% |
| 5 to 9 Unit Apartments | 275 | 6.4% |
| 10 or more Apartments | 487 | 11.3% |
| Mobile Home / Other | 22 | 0.5% |
| Total | 4,325 | 100.0% |
Housing Structures by Occupancy in St Augustine Shores
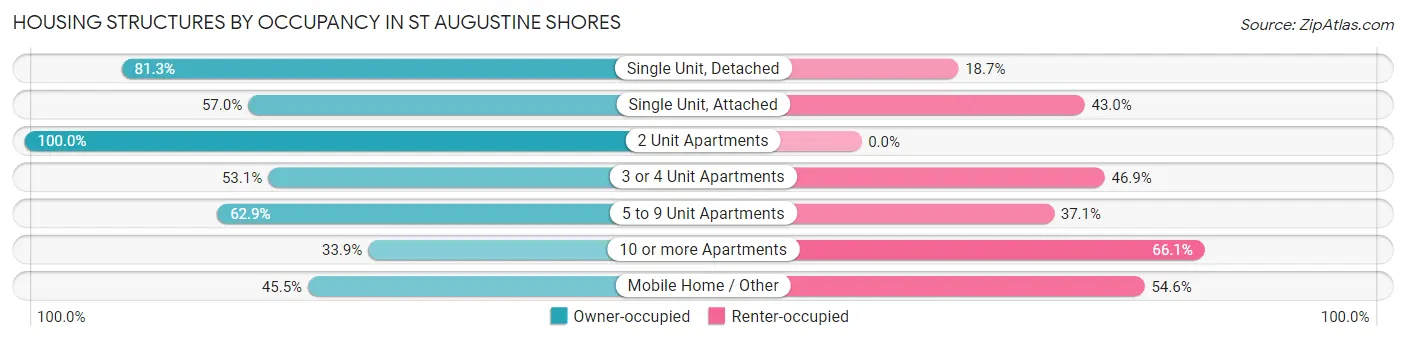
| Structure Type | Owner-occupied | Renter-occupied |
| Single Unit, Detached | 2,336 (81.3%) | 537 (18.7%) |
| Single Unit, Attached | 216 (57.0%) | 163 (43.0%) |
| 2 Unit Apartments | 18 (100.0%) | 0 (0.0%) |
| 3 or 4 Unit Apartments | 144 (53.1%) | 127 (46.9%) |
| 5 to 9 Unit Apartments | 173 (62.9%) | 102 (37.1%) |
| 10 or more Apartments | 165 (33.9%) | 322 (66.1%) |
| Mobile Home / Other | 10 (45.5%) | 12 (54.5%) |
| Total | 3,062 (70.8%) | 1,263 (29.2%) |
Housing Structures by Number of Rooms in St Augustine Shores
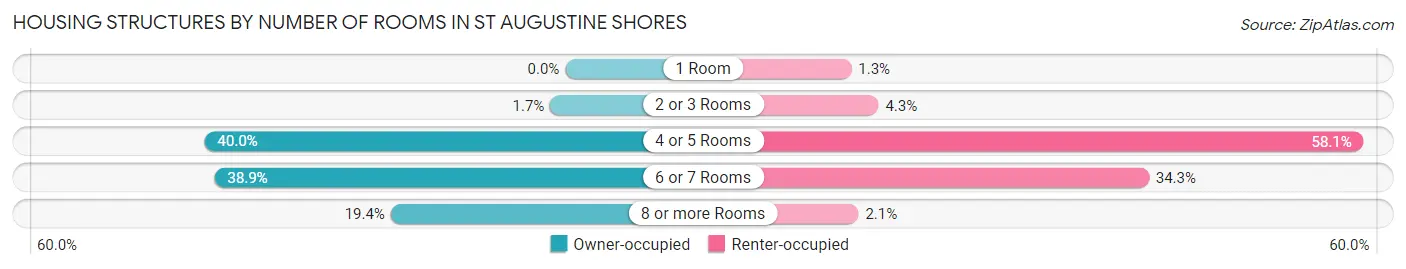
| Number of Rooms | Owner-occupied | Renter-occupied |
| 1 Room | 0 (0.0%) | 16 (1.3%) |
| 2 or 3 Rooms | 51 (1.7%) | 54 (4.3%) |
| 4 or 5 Rooms | 1,226 (40.0%) | 734 (58.1%) |
| 6 or 7 Rooms | 1,192 (38.9%) | 433 (34.3%) |
| 8 or more Rooms | 593 (19.4%) | 26 (2.1%) |
| Total | 3,062 (100.0%) | 1,263 (100.0%) |
Housing Structure by Heating Type in St Augustine Shores
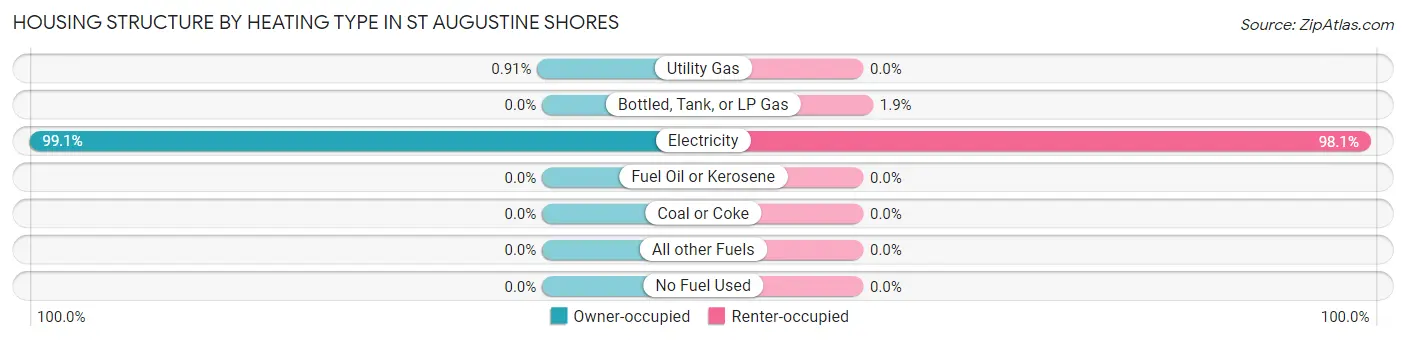
| Heating Type | Owner-occupied | Renter-occupied |
| Utility Gas | 28 (0.9%) | 0 (0.0%) |
| Bottled, Tank, or LP Gas | 0 (0.0%) | 24 (1.9%) |
| Electricity | 3,034 (99.1%) | 1,239 (98.1%) |
| Fuel Oil or Kerosene | 0 (0.0%) | 0 (0.0%) |
| Coal or Coke | 0 (0.0%) | 0 (0.0%) |
| All other Fuels | 0 (0.0%) | 0 (0.0%) |
| No Fuel Used | 0 (0.0%) | 0 (0.0%) |
| Total | 3,062 (100.0%) | 1,263 (100.0%) |
Household Vehicle Usage in St Augustine Shores
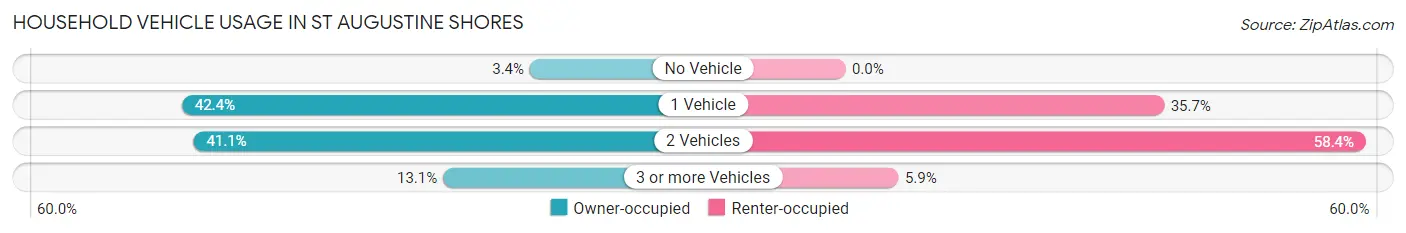
| Vehicles per Household | Owner-occupied | Renter-occupied |
| No Vehicle | 104 (3.4%) | 0 (0.0%) |
| 1 Vehicle | 1,298 (42.4%) | 451 (35.7%) |
| 2 Vehicles | 1,258 (41.1%) | 737 (58.4%) |
| 3 or more Vehicles | 402 (13.1%) | 75 (5.9%) |
| Total | 3,062 (100.0%) | 1,263 (100.0%) |
Real Estate & Mortgages in St Augustine Shores
Real Estate and Mortgage Overview in St Augustine Shores
| Characteristic | Without Mortgage | With Mortgage |
| Housing Units | 1,422 | 1,640 |
| Median Property Value | $240,800 | $281,100 |
| Median Household Income | $60,905 | $328 |
| Monthly Housing Costs | $539 | $190 |
| Real Estate Taxes | $1,416 | $28 |
Property Value by Mortgage Status in St Augustine Shores
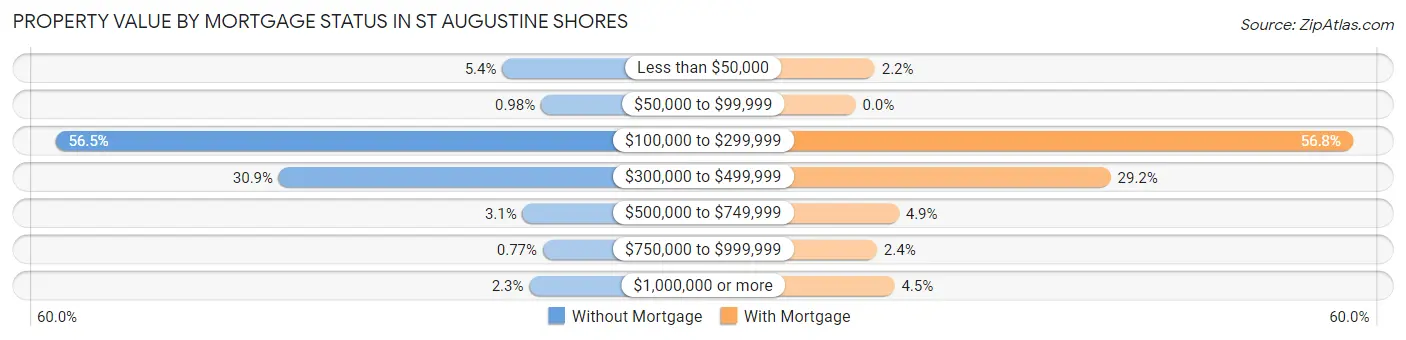
| Property Value | Without Mortgage | With Mortgage |
| Less than $50,000 | 77 (5.4%) | 36 (2.2%) |
| $50,000 to $99,999 | 14 (1.0%) | 0 (0.0%) |
| $100,000 to $299,999 | 803 (56.5%) | 932 (56.8%) |
| $300,000 to $499,999 | 440 (30.9%) | 478 (29.1%) |
| $500,000 to $749,999 | 44 (3.1%) | 81 (4.9%) |
| $750,000 to $999,999 | 11 (0.8%) | 40 (2.4%) |
| $1,000,000 or more | 33 (2.3%) | 73 (4.4%) |
| Total | 1,422 (100.0%) | 1,640 (100.0%) |
Household Income by Mortgage Status in St Augustine Shores
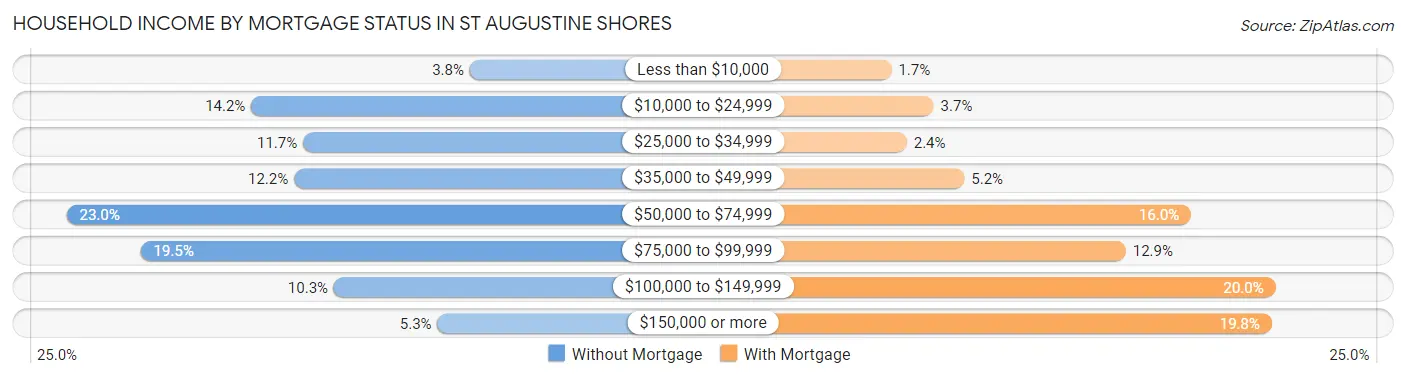
| Household Income | Without Mortgage | With Mortgage |
| Less than $10,000 | 54 (3.8%) | 28 (1.7%) |
| $10,000 to $24,999 | 202 (14.2%) | 61 (3.7%) |
| $25,000 to $34,999 | 167 (11.7%) | 40 (2.4%) |
| $35,000 to $49,999 | 173 (12.2%) | 85 (5.2%) |
| $50,000 to $74,999 | 327 (23.0%) | 262 (16.0%) |
| $75,000 to $99,999 | 277 (19.5%) | 211 (12.9%) |
| $100,000 to $149,999 | 146 (10.3%) | 328 (20.0%) |
| $150,000 or more | 76 (5.3%) | 325 (19.8%) |
| Total | 1,422 (100.0%) | 1,640 (100.0%) |
Property Value to Household Income Ratio in St Augustine Shores
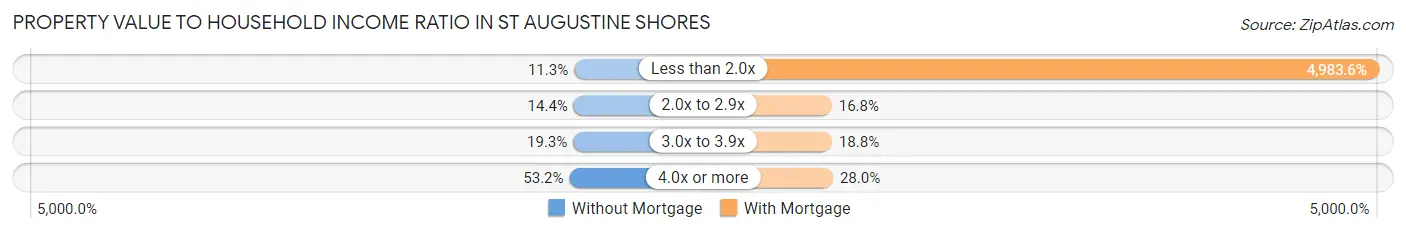
| Value-to-Income Ratio | Without Mortgage | With Mortgage |
| Less than 2.0x | 161 (11.3%) | 81,731 (4,983.6%) |
| 2.0x to 2.9x | 204 (14.3%) | 276 (16.8%) |
| 3.0x to 3.9x | 275 (19.3%) | 309 (18.8%) |
| 4.0x or more | 756 (53.2%) | 459 (28.0%) |
| Total | 1,422 (100.0%) | 1,640 (100.0%) |
Real Estate Taxes by Mortgage Status in St Augustine Shores

| Property Taxes | Without Mortgage | With Mortgage |
| Less than $800 | 370 (26.0%) | 26 (1.6%) |
| $800 to $1,499 | 383 (26.9%) | 159 (9.7%) |
| $800 to $1,499 | 669 (47.0%) | 500 (30.5%) |
| Total | 1,422 (100.0%) | 1,640 (100.0%) |
Health & Disability in St Augustine Shores
Health Insurance Coverage by Age in St Augustine Shores
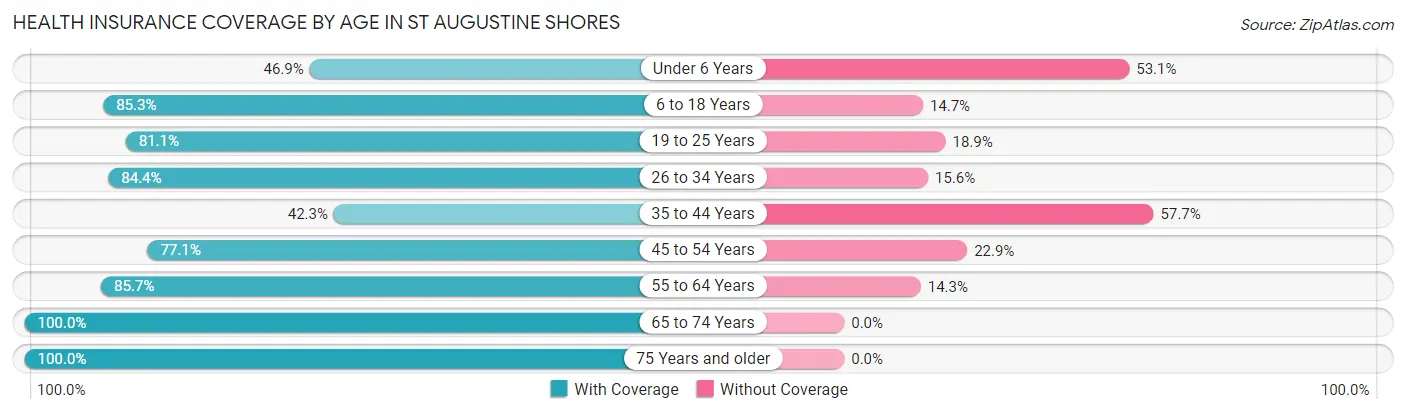
| Age Bracket | With Coverage | Without Coverage |
| Under 6 Years | 127 (46.9%) | 144 (53.1%) |
| 6 to 18 Years | 1,047 (85.3%) | 180 (14.7%) |
| 19 to 25 Years | 305 (81.1%) | 71 (18.9%) |
| 26 to 34 Years | 599 (84.4%) | 111 (15.6%) |
| 35 to 44 Years | 517 (42.3%) | 704 (57.7%) |
| 45 to 54 Years | 1,002 (77.1%) | 298 (22.9%) |
| 55 to 64 Years | 1,520 (85.7%) | 253 (14.3%) |
| 65 to 74 Years | 1,507 (100.0%) | 0 (0.0%) |
| 75 Years and older | 1,489 (100.0%) | 0 (0.0%) |
| Total | 8,113 (82.2%) | 1,761 (17.8%) |
Health Insurance Coverage by Citizenship Status in St Augustine Shores
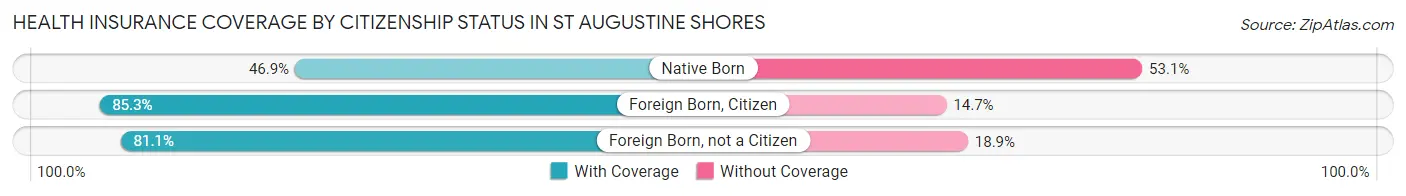
| Citizenship Status | With Coverage | Without Coverage |
| Native Born | 127 (46.9%) | 144 (53.1%) |
| Foreign Born, Citizen | 1,047 (85.3%) | 180 (14.7%) |
| Foreign Born, not a Citizen | 305 (81.1%) | 71 (18.9%) |
Health Insurance Coverage by Household Income in St Augustine Shores
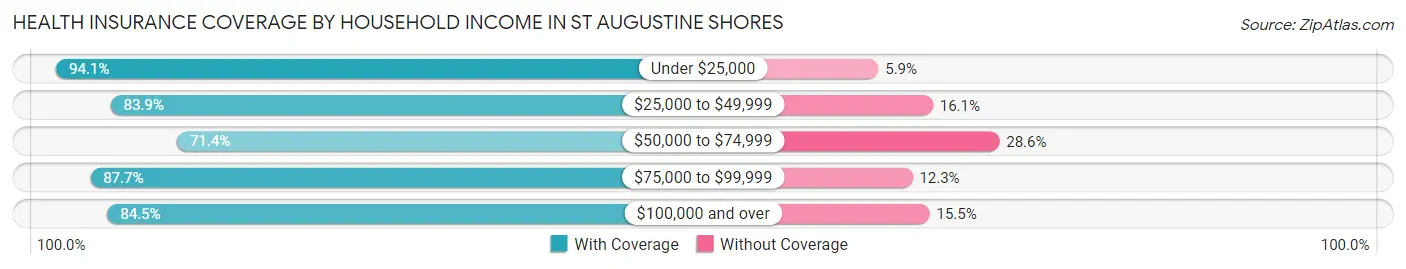
| Household Income | With Coverage | Without Coverage |
| Under $25,000 | 574 (94.1%) | 36 (5.9%) |
| $25,000 to $49,999 | 1,718 (83.9%) | 330 (16.1%) |
| $50,000 to $74,999 | 1,840 (71.4%) | 736 (28.6%) |
| $75,000 to $99,999 | 1,554 (87.7%) | 218 (12.3%) |
| $100,000 and over | 2,403 (84.5%) | 441 (15.5%) |
Public vs Private Health Insurance Coverage by Age in St Augustine Shores
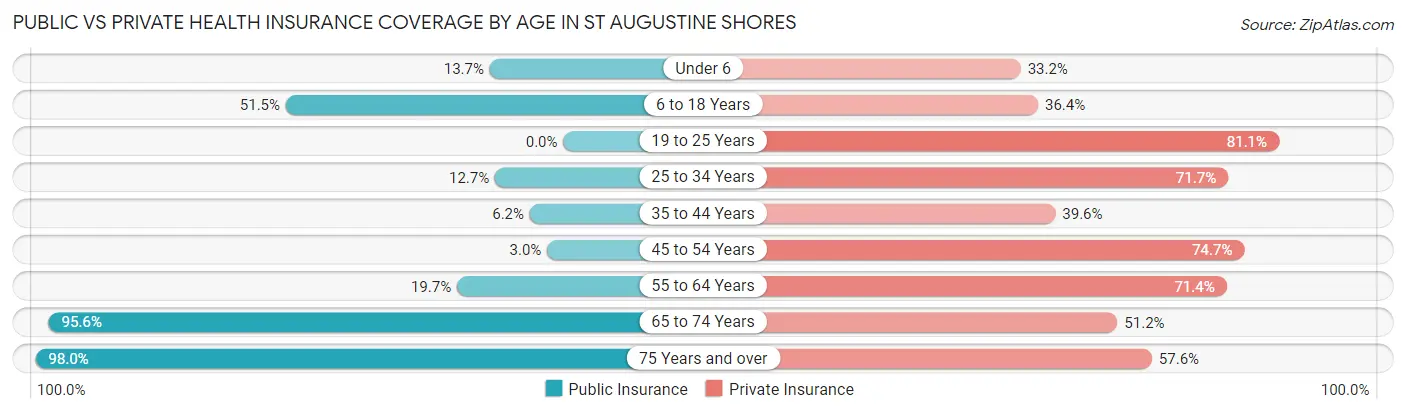
| Age Bracket | Public Insurance | Private Insurance |
| Under 6 | 37 (13.7%) | 90 (33.2%) |
| 6 to 18 Years | 632 (51.5%) | 447 (36.4%) |
| 19 to 25 Years | 0 (0.0%) | 305 (81.1%) |
| 25 to 34 Years | 90 (12.7%) | 509 (71.7%) |
| 35 to 44 Years | 76 (6.2%) | 484 (39.6%) |
| 45 to 54 Years | 39 (3.0%) | 971 (74.7%) |
| 55 to 64 Years | 350 (19.7%) | 1,266 (71.4%) |
| 65 to 74 Years | 1,440 (95.6%) | 771 (51.2%) |
| 75 Years and over | 1,459 (98.0%) | 857 (57.6%) |
| Total | 4,123 (41.8%) | 5,700 (57.7%) |
Disability Status by Sex by Age in St Augustine Shores
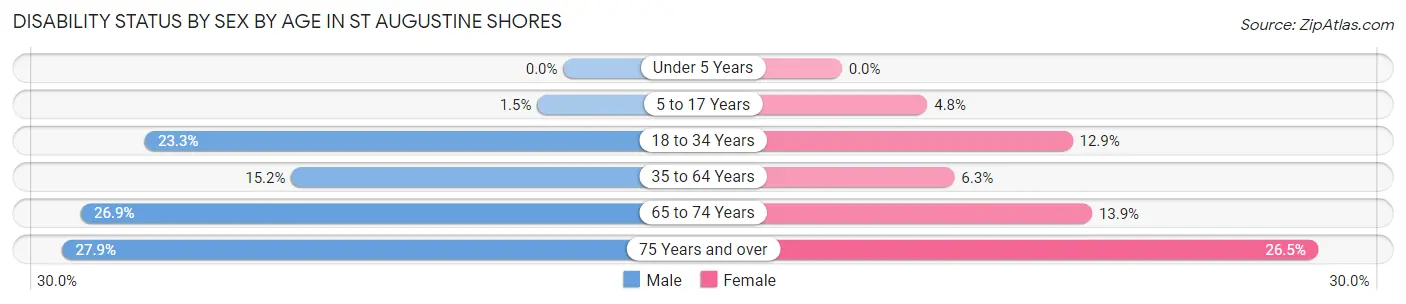
| Age Bracket | Male | Female |
| Under 5 Years | 0 (0.0%) | 0 (0.0%) |
| 5 to 17 Years | 8 (1.5%) | 32 (4.8%) |
| 18 to 34 Years | 146 (23.3%) | 65 (12.9%) |
| 35 to 64 Years | 288 (15.1%) | 150 (6.3%) |
| 65 to 74 Years | 181 (26.9%) | 116 (13.9%) |
| 75 Years and over | 191 (27.9%) | 213 (26.5%) |
Disability Class by Sex by Age in St Augustine Shores
Disability Class: Hearing Difficulty
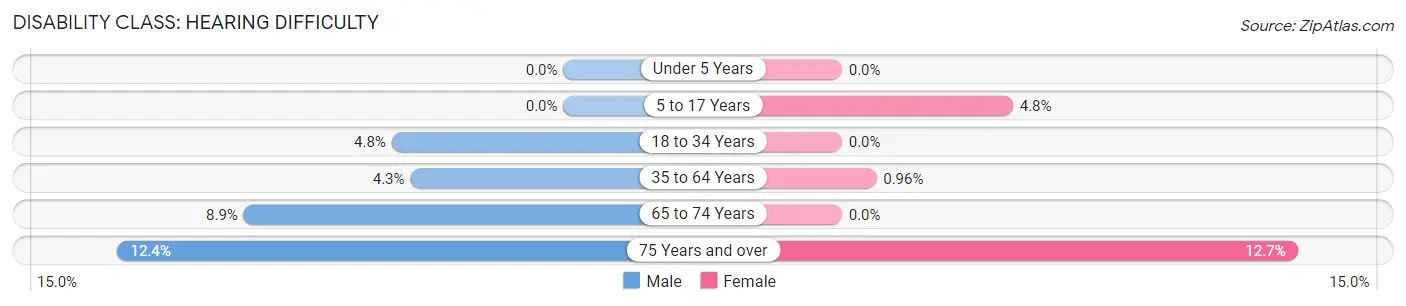
| Age Bracket | Male | Female |
| Under 5 Years | 0 (0.0%) | 0 (0.0%) |
| 5 to 17 Years | 0 (0.0%) | 32 (4.8%) |
| 18 to 34 Years | 30 (4.8%) | 0 (0.0%) |
| 35 to 64 Years | 81 (4.3%) | 23 (1.0%) |
| 65 to 74 Years | 60 (8.9%) | 0 (0.0%) |
| 75 Years and over | 85 (12.4%) | 102 (12.7%) |
Disability Class: Vision Difficulty
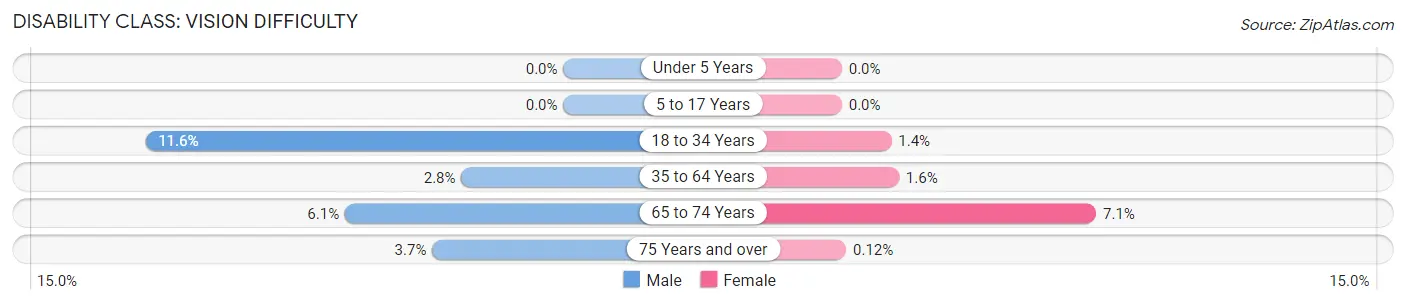
| Age Bracket | Male | Female |
| Under 5 Years | 0 (0.0%) | 0 (0.0%) |
| 5 to 17 Years | 0 (0.0%) | 0 (0.0%) |
| 18 to 34 Years | 73 (11.6%) | 7 (1.4%) |
| 35 to 64 Years | 54 (2.8%) | 38 (1.6%) |
| 65 to 74 Years | 41 (6.1%) | 59 (7.1%) |
| 75 Years and over | 25 (3.6%) | 1 (0.1%) |
Disability Class: Cognitive Difficulty
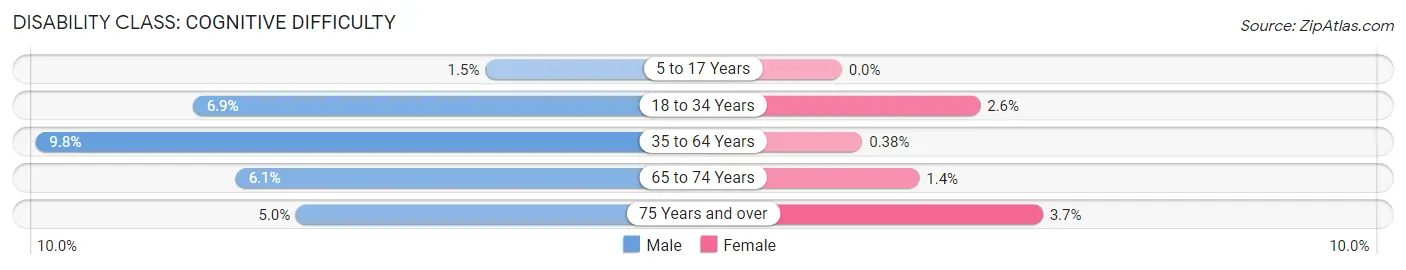
| Age Bracket | Male | Female |
| 5 to 17 Years | 8 (1.5%) | 0 (0.0%) |
| 18 to 34 Years | 43 (6.9%) | 13 (2.6%) |
| 35 to 64 Years | 186 (9.8%) | 9 (0.4%) |
| 65 to 74 Years | 41 (6.1%) | 12 (1.4%) |
| 75 Years and over | 34 (5.0%) | 30 (3.7%) |
Disability Class: Ambulatory Difficulty
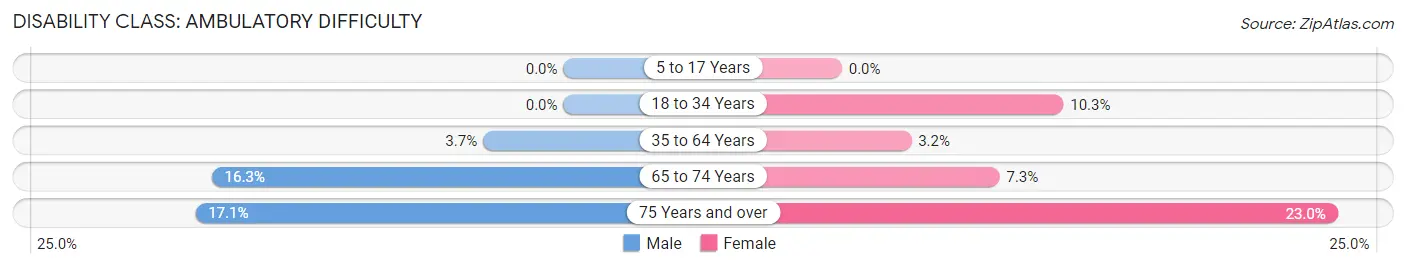
| Age Bracket | Male | Female |
| 5 to 17 Years | 0 (0.0%) | 0 (0.0%) |
| 18 to 34 Years | 0 (0.0%) | 52 (10.3%) |
| 35 to 64 Years | 71 (3.7%) | 77 (3.2%) |
| 65 to 74 Years | 110 (16.3%) | 61 (7.3%) |
| 75 Years and over | 117 (17.1%) | 185 (23.0%) |
Disability Class: Self-Care Difficulty
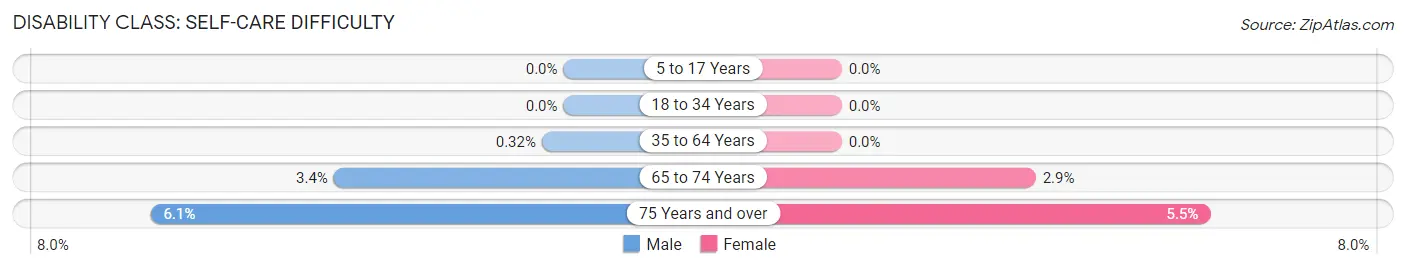
| Age Bracket | Male | Female |
| 5 to 17 Years | 0 (0.0%) | 0 (0.0%) |
| 18 to 34 Years | 0 (0.0%) | 0 (0.0%) |
| 35 to 64 Years | 6 (0.3%) | 0 (0.0%) |
| 65 to 74 Years | 23 (3.4%) | 24 (2.9%) |
| 75 Years and over | 42 (6.1%) | 44 (5.5%) |
Technology Access in St Augustine Shores
Computing Device Access in St Augustine Shores
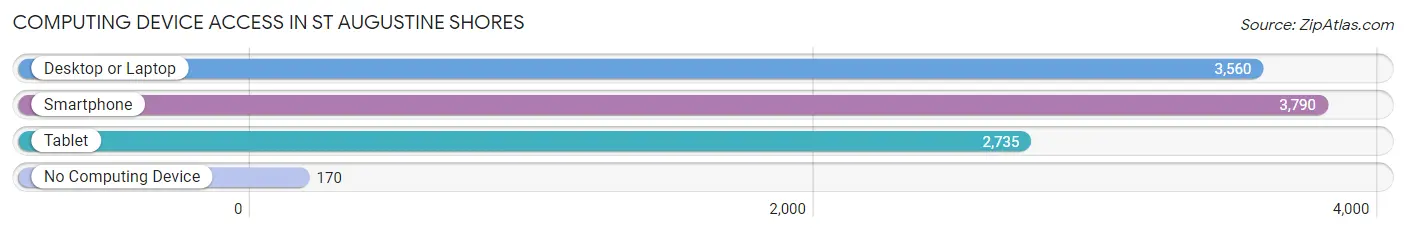
| Device Type | # Households | % Households |
| Desktop or Laptop | 3,560 | 82.3% |
| Smartphone | 3,790 | 87.6% |
| Tablet | 2,735 | 63.2% |
| No Computing Device | 170 | 3.9% |
| Total | 4,325 | 100.0% |
Internet Access in St Augustine Shores
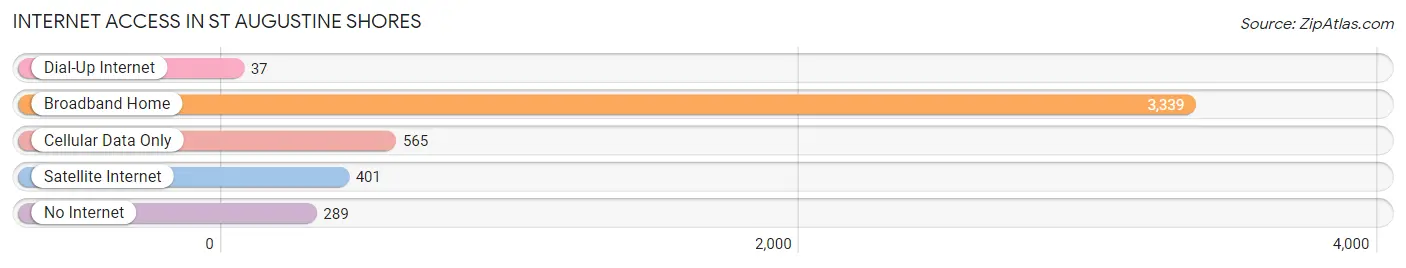
| Internet Type | # Households | % Households |
| Dial-Up Internet | 37 | 0.9% |
| Broadband Home | 3,339 | 77.2% |
| Cellular Data Only | 565 | 13.1% |
| Satellite Internet | 401 | 9.3% |
| No Internet | 289 | 6.7% |
| Total | 4,325 | 100.0% |
St Augustine Shores Summary
St Augustine Shores is a census-designated place (CDP) located in St. Johns County, Florida, United States. It is part of the Jacksonville metropolitan area. As of the 2010 census, the population of St Augustine Shores was 8,890.
History
St Augustine Shores was first settled in the late 1950s by a group of developers from the St. Augustine area. The developers purchased a large tract of land and began to develop it into a residential community. The first homes were built in the late 1950s and early 1960s. The community was officially incorporated in 1965.
The community was originally planned as a retirement community, but it quickly grew to include a variety of housing types. The community has grown steadily over the years and now includes a variety of housing types, including single-family homes, townhomes, and condominiums.
Geography
St Augustine Shores is located in St. Johns County, Florida, approximately 25 miles south of Jacksonville. It is bordered by the Intracoastal Waterway to the east, the St. Johns River to the north, and the Atlantic Ocean to the south. The community is located on the western side of the Intracoastal Waterway, and is accessible by boat or car.
The community is located on a peninsula, with the Intracoastal Waterway to the east and the St. Johns River to the north. The community is located on a flat, sandy terrain, with a few small hills. The average elevation of the community is 10 feet above sea level.
Economy
St Augustine Shores is primarily a residential community, with a few small businesses located in the area. The community is home to a variety of retail stores, restaurants, and other businesses. The community is also home to a number of professional offices, including medical and legal offices.
The community is also home to a number of recreational facilities, including a golf course, tennis courts, and a swimming pool. The community also has a number of parks and green spaces, including a nature preserve.
Demographics
As of the 2010 census, the population of St Augustine Shores was 8,890. The population is primarily white (87.3%), with a small percentage of African Americans (7.2%), Hispanics (3.2%), and Asians (1.3%). The median household income is $50,945, and the median age is 48.
Conclusion
St Augustine Shores is a census-designated place located in St. Johns County, Florida. It is part of the Jacksonville metropolitan area and is home to a population of 8,890. The community was originally planned as a retirement community, but it has since grown to include a variety of housing types. The economy of the community is primarily based on retail stores, restaurants, and other businesses. The population is primarily white, with a small percentage of African Americans, Hispanics, and Asians. The median household income is $50,945, and the median age is 48.
Common Questions
What is Per Capita Income in St Augustine Shores?
Per Capita income in St Augustine Shores is $37,225.
What is the Median Family Income in St Augustine Shores?
Median Family Income in St Augustine Shores is $73,938.
What is the Median Household income in St Augustine Shores?
Median Household Income in St Augustine Shores is $67,882.
What is Income or Wage Gap in St Augustine Shores?
Income or Wage Gap in St Augustine Shores is 0.7%.
Women in St Augustine Shores earn 99.3 cents for every dollar earned by a man.
What is Family Income Deficit in St Augustine Shores?
Family Income Deficit in St Augustine Shores is $10,726.
Families that are below poverty line in St Augustine Shores earn $10,726 less on average than the poverty threshold level.
What is Inequality or Gini Index in St Augustine Shores?
Inequality or Gini Index in St Augustine Shores is 0.40.
What is the Total Population of St Augustine Shores?
Total Population of St Augustine Shores is 9,883.
What is the Total Male Population of St Augustine Shores?
Total Male Population of St Augustine Shores is 4,542.
What is the Total Female Population of St Augustine Shores?
Total Female Population of St Augustine Shores is 5,341.
What is the Ratio of Males per 100 Females in St Augustine Shores?
There are 85.04 Males per 100 Females in St Augustine Shores.
What is the Ratio of Females per 100 Males in St Augustine Shores?
There are 117.59 Females per 100 Males in St Augustine Shores.
What is the Median Population Age in St Augustine Shores?
Median Population Age in St Augustine Shores is 52.7 Years.
What is the Average Family Size in St Augustine Shores
Average Family Size in St Augustine Shores is 2.6 People.
What is the Average Household Size in St Augustine Shores
Average Household Size in St Augustine Shores is 2.3 People.
How Large is the Labor Force in St Augustine Shores?
There are 4,895 People in the Labor Forcein in St Augustine Shores.
What is the Percentage of People in the Labor Force in St Augustine Shores?
56.6% of People are in the Labor Force in St Augustine Shores.
What is the Unemployment Rate in St Augustine Shores?
Unemployment Rate in St Augustine Shores is 3.7%.