Blue Diamond, NV Map & Demographics
Blue Diamond Map
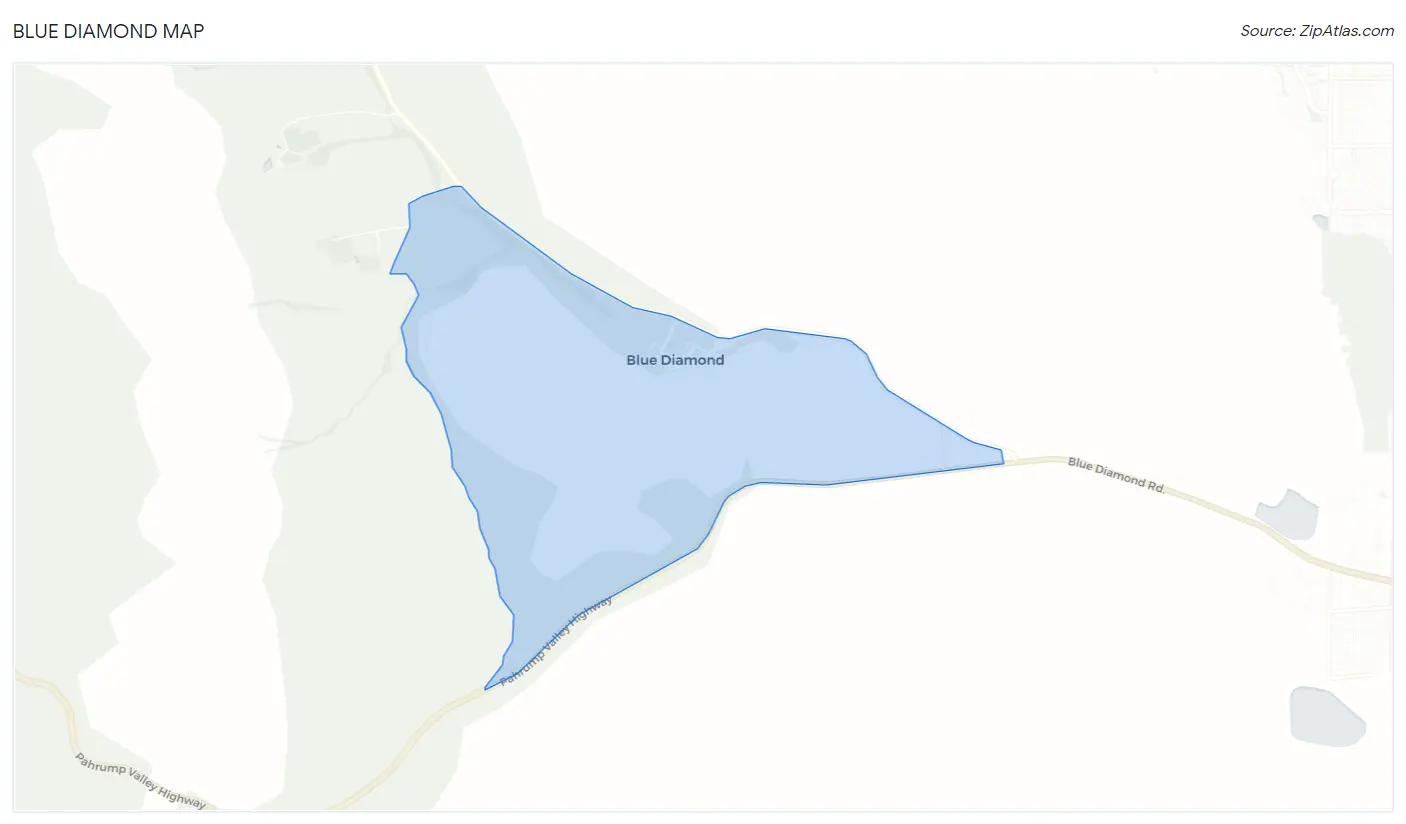
Blue Diamond Overview
$47,884
PER CAPITA INCOME
$145,956
AVG FAMILY INCOME
$81,023
AVG HOUSEHOLD INCOME
0.31
INEQUALITY / GINI INDEX
247
TOTAL POPULATION
140
MALE POPULATION
107
FEMALE POPULATION
130.84
MALES / 100 FEMALES
76.43
FEMALES / 100 MALES
50.7
MEDIAN AGE
2.5
AVG FAMILY SIZE
2.2
AVG HOUSEHOLD SIZE
169
LABOR FORCE [ PEOPLE ]
68.4%
PERCENT IN LABOR FORCE
14.8%
UNEMPLOYMENT RATE
Blue Diamond Zip Codes
Blue Diamond Area Codes
Income in Blue Diamond
Income Overview in Blue Diamond
Per Capita Income in Blue Diamond is $47,884, while median incomes of families and households are $145,956 and $81,023 respectively.
| Characteristic | Number | Measure |
| Per Capita Income | 247 | $47,884 |
| Median Family Income | 47 | $145,956 |
| Mean Family Income | 47 | $121,121 |
| Median Household Income | 111 | $81,023 |
| Mean Household Income | 111 | $100,319 |
| Income Deficit | 47 | $0 |
| Wage / Income Gap (%) | 247 | 0.00% |
| Wage / Income Gap ($) | 247 | 100.00¢ per $1 |
| Gini / Inequality Index | 247 | 0.31 |
Earnings by Sex in Blue Diamond
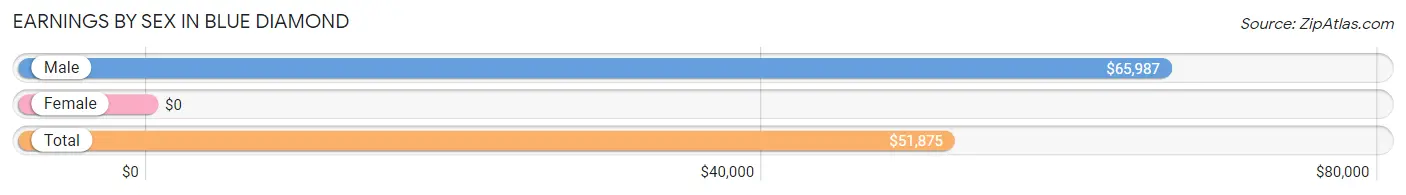
| Sex | Number | Average Earnings |
| Male | 97 (53.0%) | $65,987 |
| Female | 86 (47.0%) | $0 |
| Total | 183 (100.0%) | $51,875 |
Earnings by Sex by Income Bracket in Blue Diamond
The most common earnings brackets in Blue Diamond are $100,000+ for men (29 | 29.9%) and $50,000 to $54,999 for women (28 | 32.6%).
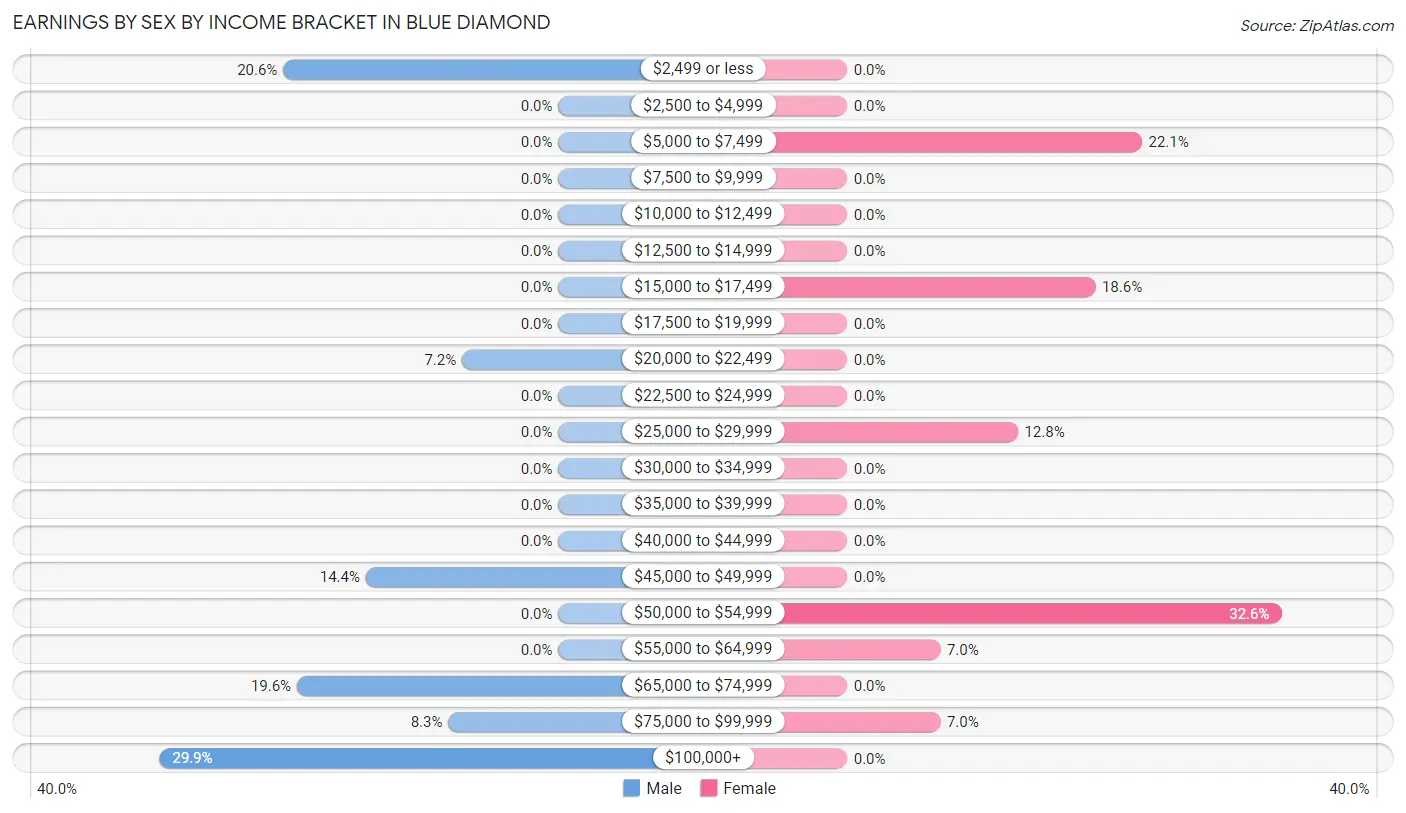
| Income | Male | Female |
| $2,499 or less | 20 (20.6%) | 0 (0.0%) |
| $2,500 to $4,999 | 0 (0.0%) | 0 (0.0%) |
| $5,000 to $7,499 | 0 (0.0%) | 19 (22.1%) |
| $7,500 to $9,999 | 0 (0.0%) | 0 (0.0%) |
| $10,000 to $12,499 | 0 (0.0%) | 0 (0.0%) |
| $12,500 to $14,999 | 0 (0.0%) | 0 (0.0%) |
| $15,000 to $17,499 | 0 (0.0%) | 16 (18.6%) |
| $17,500 to $19,999 | 0 (0.0%) | 0 (0.0%) |
| $20,000 to $22,499 | 7 (7.2%) | 0 (0.0%) |
| $22,500 to $24,999 | 0 (0.0%) | 0 (0.0%) |
| $25,000 to $29,999 | 0 (0.0%) | 11 (12.8%) |
| $30,000 to $34,999 | 0 (0.0%) | 0 (0.0%) |
| $35,000 to $39,999 | 0 (0.0%) | 0 (0.0%) |
| $40,000 to $44,999 | 0 (0.0%) | 0 (0.0%) |
| $45,000 to $49,999 | 14 (14.4%) | 0 (0.0%) |
| $50,000 to $54,999 | 0 (0.0%) | 28 (32.6%) |
| $55,000 to $64,999 | 0 (0.0%) | 6 (7.0%) |
| $65,000 to $74,999 | 19 (19.6%) | 0 (0.0%) |
| $75,000 to $99,999 | 8 (8.3%) | 6 (7.0%) |
| $100,000+ | 29 (29.9%) | 0 (0.0%) |
| Total | 97 (100.0%) | 86 (100.0%) |
Earnings by Sex by Educational Attainment in Blue Diamond
| Educational Attainment | Male Income | Female Income |
| Less than High School | - | - |
| High School Diploma | - | - |
| College or Associate's Degree | - | - |
| Bachelor's Degree | - | - |
| Graduate Degree | - | - |
| Total | - | - |
Family Income in Blue Diamond
Family Income Brackets in Blue Diamond
According to the Blue Diamond family income data, there are 23 families falling into the $100,000 to $149,999 income range, which is the most common income bracket and makes up 48.9% of all families.
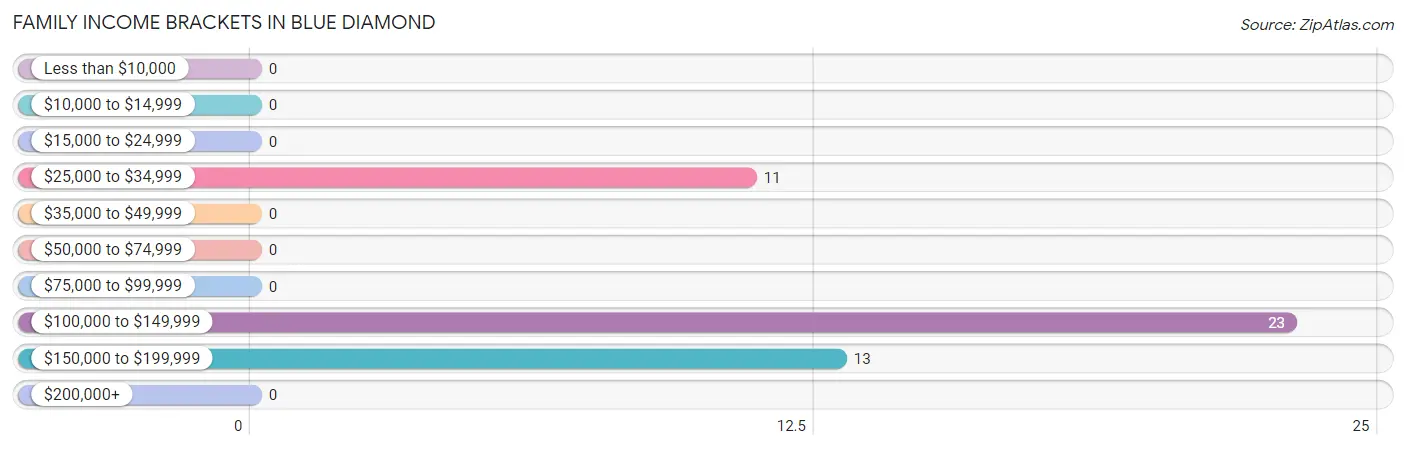
| Income Bracket | # Families | % Families |
| Less than $10,000 | 0 | 0.0% |
| $10,000 to $14,999 | 0 | 0.0% |
| $15,000 to $24,999 | 0 | 0.0% |
| $25,000 to $34,999 | 11 | 23.4% |
| $35,000 to $49,999 | 0 | 0.0% |
| $50,000 to $74,999 | 0 | 0.0% |
| $75,000 to $99,999 | 0 | 0.0% |
| $100,000 to $149,999 | 23 | 48.9% |
| $150,000 to $199,999 | 13 | 27.7% |
| $200,000+ | 0 | 0.0% |
Family Income by Famaliy Size in Blue Diamond
| Income Bracket | # Families | Median Income |
| 2-Person Families | 30 (63.8%) | $0 |
| 3-Person Families | 17 (36.2%) | $0 |
| 4-Person Families | 0 (0.0%) | $0 |
| 5-Person Families | 0 (0.0%) | $0 |
| 6-Person Families | 0 (0.0%) | $0 |
| 7+ Person Families | 0 (0.0%) | $0 |
| Total | 47 (100.0%) | $145,956 |
Family Income by Number of Earners in Blue Diamond
| Number of Earners | # Families | Median Income |
| No Earners | 7 (14.9%) | $0 |
| 1 Earner | 17 (36.2%) | $0 |
| 2 Earners | 6 (12.8%) | $0 |
| 3+ Earners | 17 (36.2%) | $0 |
| Total | 47 (100.0%) | $145,956 |
Household Income in Blue Diamond
Household Income Brackets in Blue Diamond
With 30 households falling in the category, the $100,000 to $149,999 income range is the most frequent in Blue Diamond, accounting for 27.0% of all households.
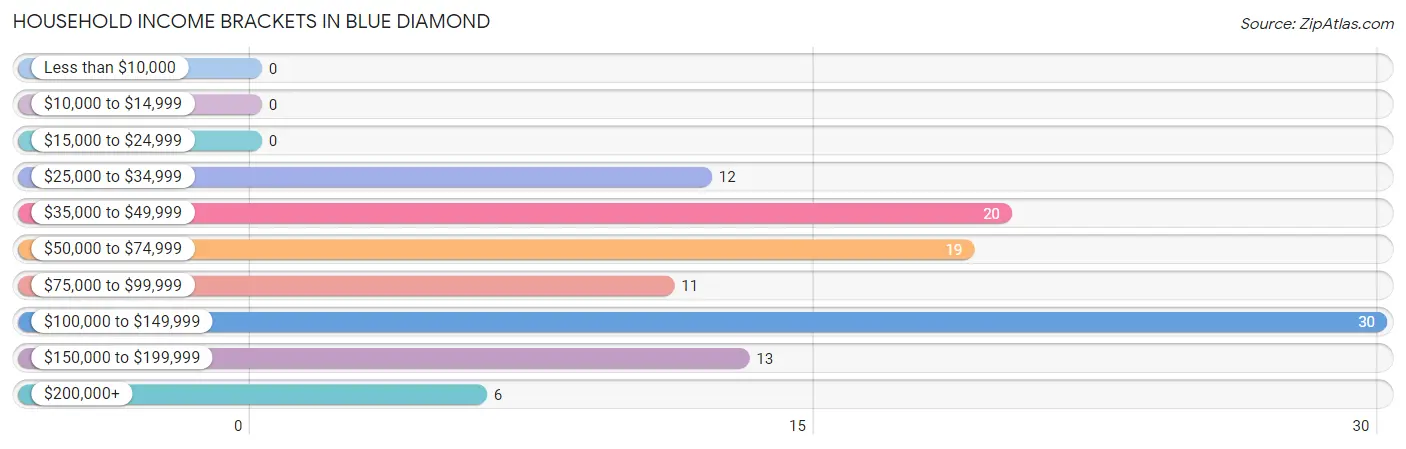
| Income Bracket | # Households | % Households |
| Less than $10,000 | 0 | 0.0% |
| $10,000 to $14,999 | 0 | 0.0% |
| $15,000 to $24,999 | 0 | 0.0% |
| $25,000 to $34,999 | 12 | 10.8% |
| $35,000 to $49,999 | 20 | 18.0% |
| $50,000 to $74,999 | 19 | 17.1% |
| $75,000 to $99,999 | 11 | 9.9% |
| $100,000 to $149,999 | 30 | 27.0% |
| $150,000 to $199,999 | 13 | 11.7% |
| $200,000+ | 6 | 5.4% |
Household Income by Householder Age in Blue Diamond
The median household income in Blue Diamond is $81,023, with the highest median household income of $163,542 found in the 25 to 44 years age bracket for the primary householder. A total of 19 households (17.1%) fall into this category.
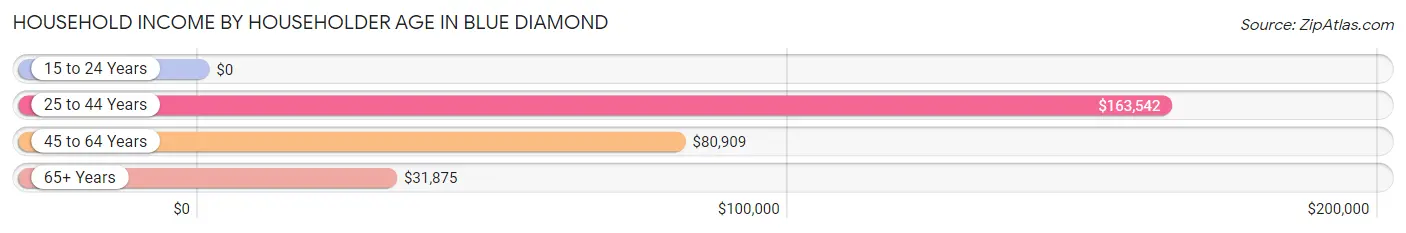
| Income Bracket | # Households | Median Income |
| 15 to 24 Years | 0 (0.0%) | $0 |
| 25 to 44 Years | 19 (17.1%) | $163,542 |
| 45 to 64 Years | 74 (66.7%) | $80,909 |
| 65+ Years | 18 (16.2%) | $31,875 |
| Total | 111 (100.0%) | $81,023 |
Poverty in Blue Diamond
Income Below Poverty by Sex and Age in Blue Diamond
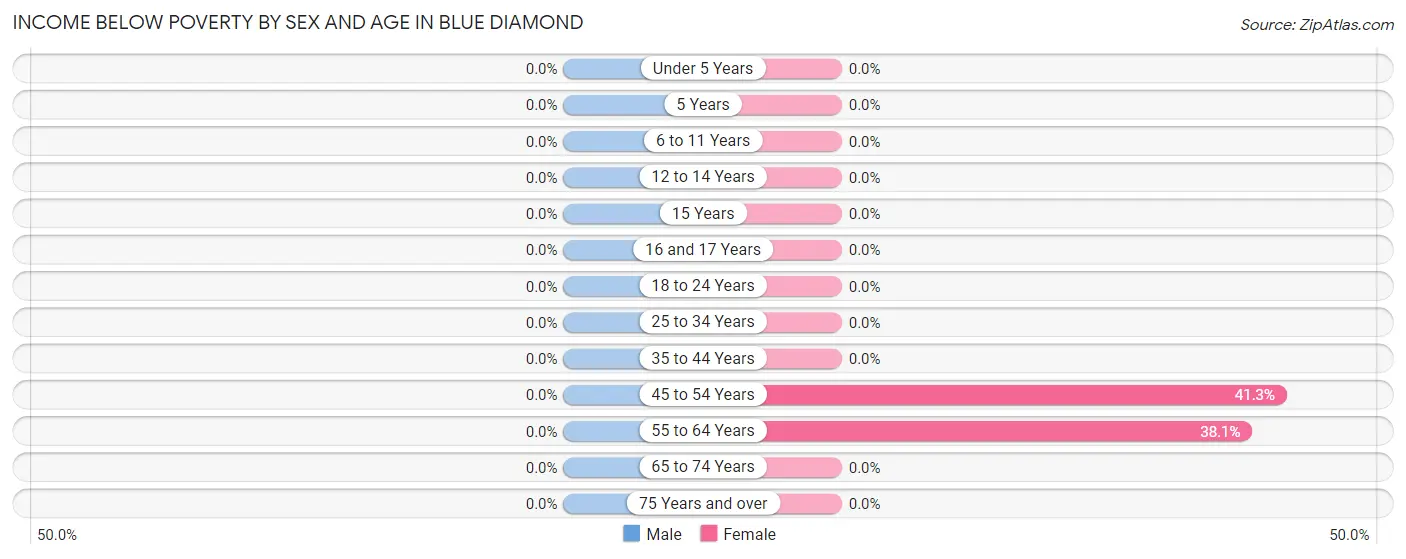
| Age Bracket | Male | Female |
| Under 5 Years | 0 (0.0%) | 0 (0.0%) |
| 5 Years | 0 (0.0%) | 0 (0.0%) |
| 6 to 11 Years | 0 (0.0%) | 0 (0.0%) |
| 12 to 14 Years | 0 (0.0%) | 0 (0.0%) |
| 15 Years | 0 (0.0%) | 0 (0.0%) |
| 16 and 17 Years | 0 (0.0%) | 0 (0.0%) |
| 18 to 24 Years | 0 (0.0%) | 0 (0.0%) |
| 25 to 34 Years | 0 (0.0%) | 0 (0.0%) |
| 35 to 44 Years | 0 (0.0%) | 0 (0.0%) |
| 45 to 54 Years | 0 (0.0%) | 19 (41.3%) |
| 55 to 64 Years | 0 (0.0%) | 8 (38.1%) |
| 65 to 74 Years | 0 (0.0%) | 0 (0.0%) |
| 75 Years and over | 0 (0.0%) | 0 (0.0%) |
| Total | 0 (0.0%) | 27 (25.2%) |
Income Above Poverty by Sex and Age in Blue Diamond
According to the poverty statistics in Blue Diamond, males aged 18 to 24 years and females aged 25 to 34 years are the age groups that are most secure financially, with 100.0% of males and 100.0% of females in these age groups living above the poverty line.
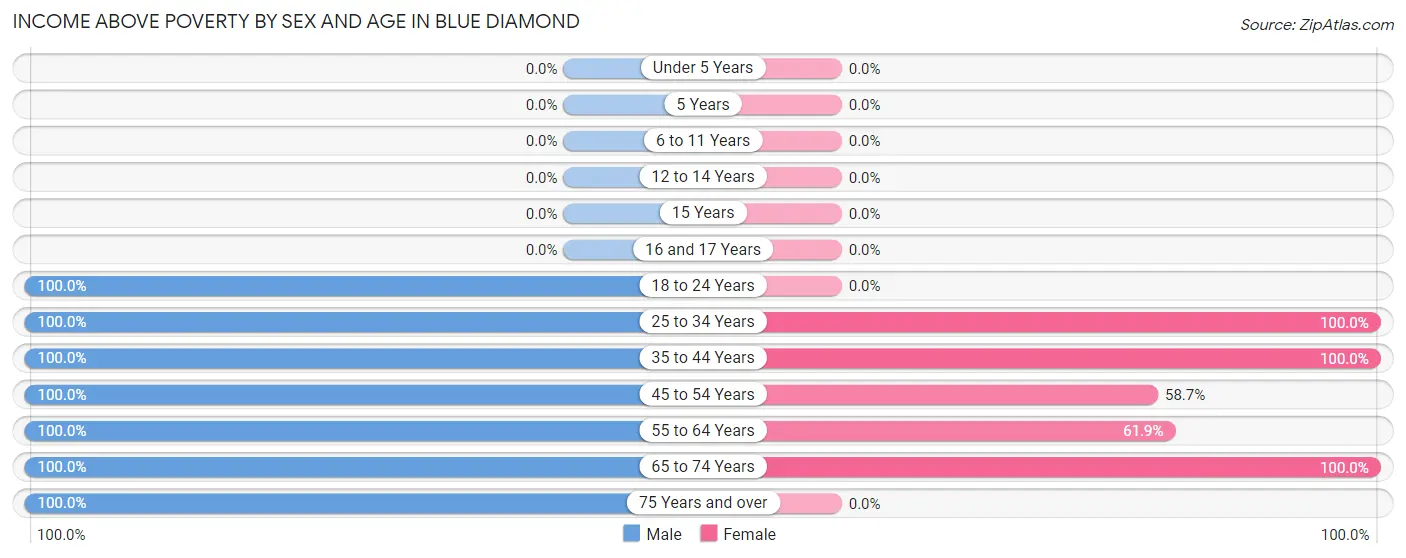
| Age Bracket | Male | Female |
| Under 5 Years | 0 (0.0%) | 0 (0.0%) |
| 5 Years | 0 (0.0%) | 0 (0.0%) |
| 6 to 11 Years | 0 (0.0%) | 0 (0.0%) |
| 12 to 14 Years | 0 (0.0%) | 0 (0.0%) |
| 15 Years | 0 (0.0%) | 0 (0.0%) |
| 16 and 17 Years | 0 (0.0%) | 0 (0.0%) |
| 18 to 24 Years | 20 (100.0%) | 0 (0.0%) |
| 25 to 34 Years | 6 (100.0%) | 6 (100.0%) |
| 35 to 44 Years | 21 (100.0%) | 28 (100.0%) |
| 45 to 54 Years | 35 (100.0%) | 27 (58.7%) |
| 55 to 64 Years | 46 (100.0%) | 13 (61.9%) |
| 65 to 74 Years | 6 (100.0%) | 6 (100.0%) |
| 75 Years and over | 6 (100.0%) | 0 (0.0%) |
| Total | 140 (100.0%) | 80 (74.8%) |
Income Below Poverty Among Married-Couple Families in Blue Diamond
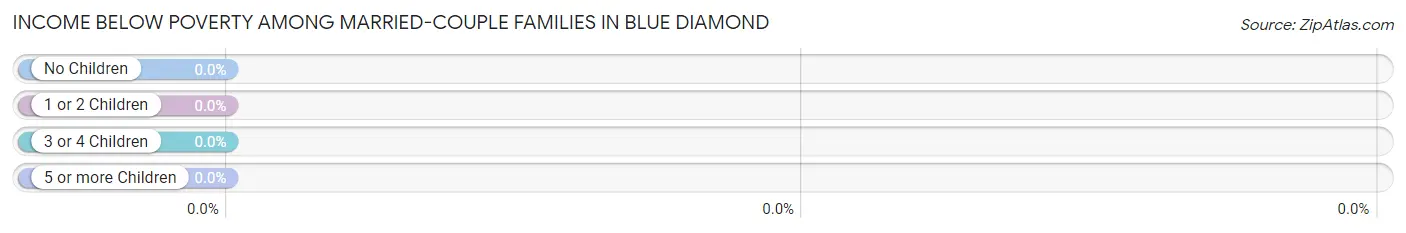
| Children | Above Poverty | Below Poverty |
| No Children | 47 (100.0%) | 0 (0.0%) |
| 1 or 2 Children | 0 (0.0%) | 0 (0.0%) |
| 3 or 4 Children | 0 (0.0%) | 0 (0.0%) |
| 5 or more Children | 0 (0.0%) | 0 (0.0%) |
| Total | 47 (100.0%) | 0 (0.0%) |
Income Below Poverty Among Single-Parent Households in Blue Diamond
| Children | Single Father | Single Mother |
| No Children | 0 (0.0%) | 0 (0.0%) |
| 1 or 2 Children | 0 (0.0%) | 0 (0.0%) |
| 3 or 4 Children | 0 (0.0%) | 0 (0.0%) |
| 5 or more Children | 0 (0.0%) | 0 (0.0%) |
| Total | 0 (0.0%) | 0 (0.0%) |
Income Below Poverty Among Married-Couple vs Single-Parent Households in Blue Diamond
| Children | Married-Couple Families | Single-Parent Households |
| No Children | 0 (0.0%) | 0 (0.0%) |
| 1 or 2 Children | 0 (0.0%) | 0 (0.0%) |
| 3 or 4 Children | 0 (0.0%) | 0 (0.0%) |
| 5 or more Children | 0 (0.0%) | 0 (0.0%) |
| Total | 0 (0.0%) | 0 (0.0%) |
Race in Blue Diamond
The most populous races in Blue Diamond are White / Caucasian (236 | 95.6%), and Native / Alaskan (11 | 4.4%).
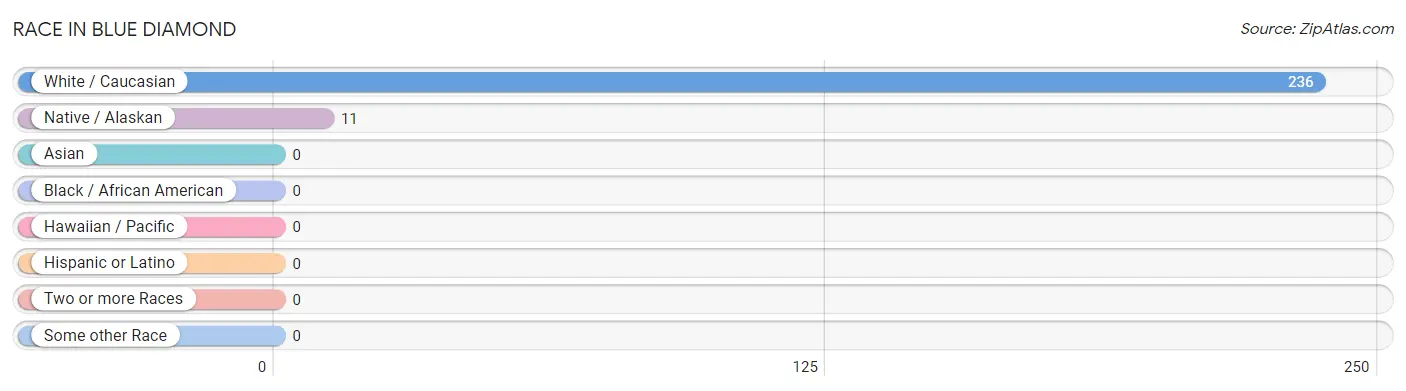
| Race | # Population | % Population |
| Asian | 0 | 0.0% |
| Black / African American | 0 | 0.0% |
| Hawaiian / Pacific | 0 | 0.0% |
| Hispanic or Latino | 0 | 0.0% |
| Native / Alaskan | 11 | 4.4% |
| White / Caucasian | 236 | 95.6% |
| Two or more Races | 0 | 0.0% |
| Some other Race | 0 | 0.0% |
| Total | 247 | 100.0% |
Ancestry in Blue Diamond
The most populous ancestries reported in Blue Diamond are German (60 | 24.3%), Lithuanian (53 | 21.5%), Italian (27 | 10.9%), Finnish (18 | 7.3%), and American (15 | 6.1%), together accounting for 70.0% of all Blue Diamond residents.
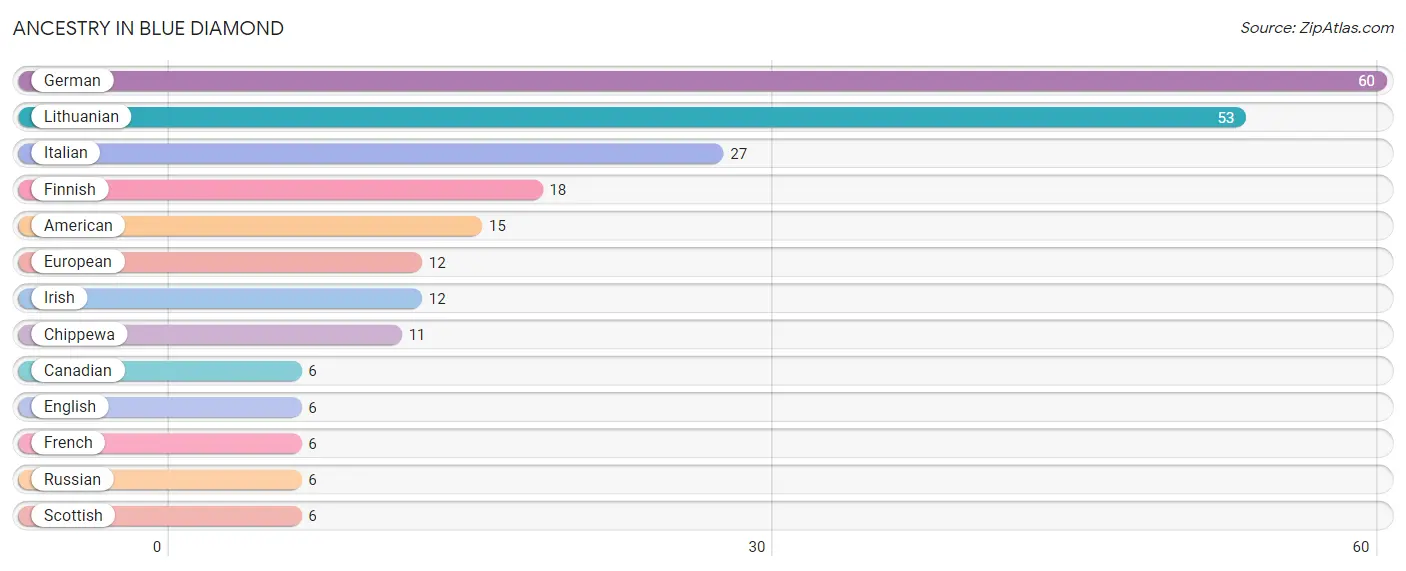
| Ancestry | # Population | % Population |
| American | 15 | 6.1% |
| Canadian | 6 | 2.4% |
| Chippewa | 11 | 4.4% |
| English | 6 | 2.4% |
| European | 12 | 4.9% |
| Finnish | 18 | 7.3% |
| French | 6 | 2.4% |
| German | 60 | 24.3% |
| Irish | 12 | 4.9% |
| Italian | 27 | 10.9% |
| Lithuanian | 53 | 21.5% |
| Russian | 6 | 2.4% |
| Scottish | 6 | 2.4% | View All 13 Rows |
Immigrants in Blue Diamond
The most numerous immigrant groups reported in Blue Diamond came from Canada (35 | 14.2%), Eastern Europe (33 | 13.4%), Europe (33 | 13.4%), and Lithuania (33 | 13.4%), together accounting for 54.2% of all Blue Diamond residents.
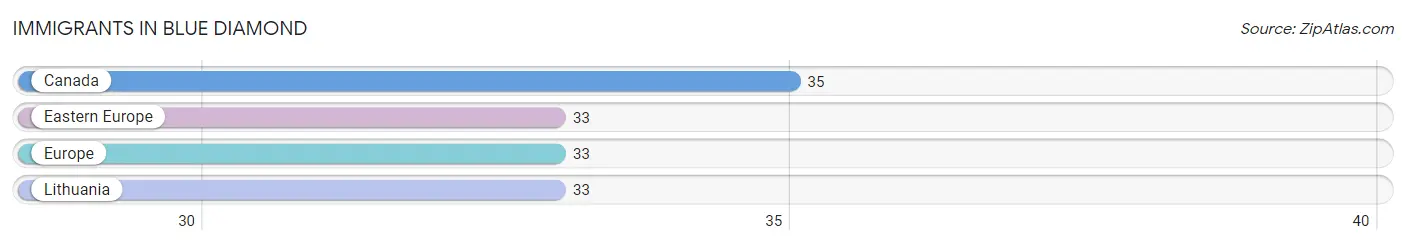
| Immigration Origin | # Population | % Population |
| Canada | 35 | 14.2% |
| Eastern Europe | 33 | 13.4% |
| Europe | 33 | 13.4% |
| Lithuania | 33 | 13.4% | View All 4 Rows |
Sex and Age in Blue Diamond
Sex and Age in Blue Diamond
The most populous age groups in Blue Diamond are 50 to 54 Years (35 | 25.0%) for men and 45 to 49 Years (30 | 28.0%) for women.
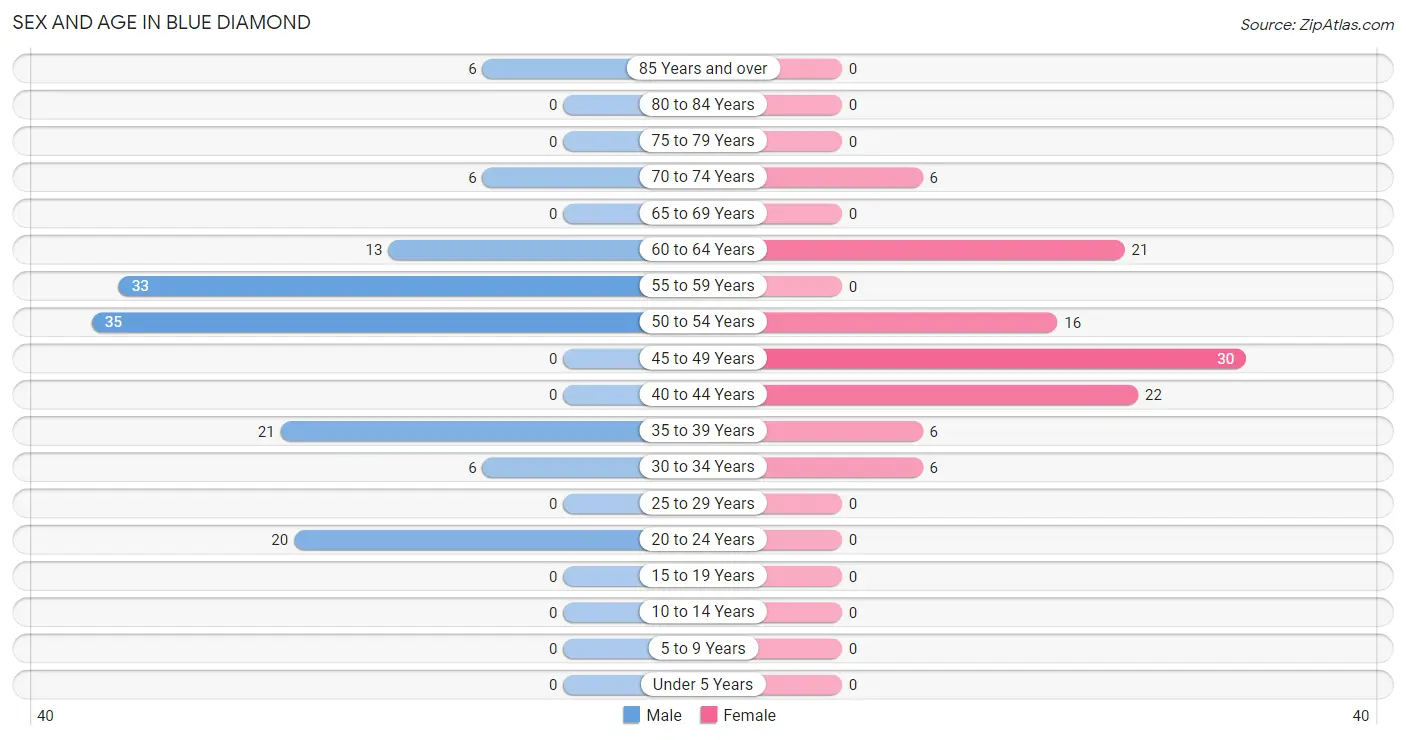
| Age Bracket | Male | Female |
| Under 5 Years | 0 (0.0%) | 0 (0.0%) |
| 5 to 9 Years | 0 (0.0%) | 0 (0.0%) |
| 10 to 14 Years | 0 (0.0%) | 0 (0.0%) |
| 15 to 19 Years | 0 (0.0%) | 0 (0.0%) |
| 20 to 24 Years | 20 (14.3%) | 0 (0.0%) |
| 25 to 29 Years | 0 (0.0%) | 0 (0.0%) |
| 30 to 34 Years | 6 (4.3%) | 6 (5.6%) |
| 35 to 39 Years | 21 (15.0%) | 6 (5.6%) |
| 40 to 44 Years | 0 (0.0%) | 22 (20.6%) |
| 45 to 49 Years | 0 (0.0%) | 30 (28.0%) |
| 50 to 54 Years | 35 (25.0%) | 16 (14.9%) |
| 55 to 59 Years | 33 (23.6%) | 0 (0.0%) |
| 60 to 64 Years | 13 (9.3%) | 21 (19.6%) |
| 65 to 69 Years | 0 (0.0%) | 0 (0.0%) |
| 70 to 74 Years | 6 (4.3%) | 6 (5.6%) |
| 75 to 79 Years | 0 (0.0%) | 0 (0.0%) |
| 80 to 84 Years | 0 (0.0%) | 0 (0.0%) |
| 85 Years and over | 6 (4.3%) | 0 (0.0%) |
| Total | 140 (100.0%) | 107 (100.0%) |
Families and Households in Blue Diamond
Median Family Size in Blue Diamond
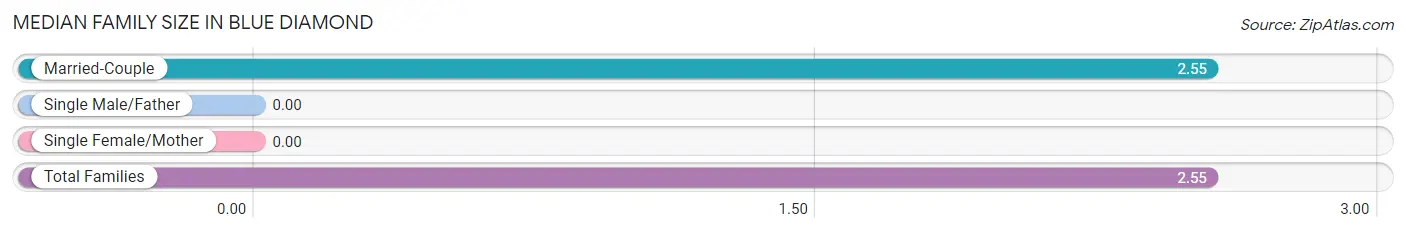
| Family Type | # Families | Family Size |
| Married-Couple | 47 (100.0%) | 2.55 |
| Single Male/Father | 0 (0.0%) | - |
| Single Female/Mother | 0 (0.0%) | - |
| Total Families | 47 (100.0%) | 2.55 |
Median Household Size in Blue Diamond
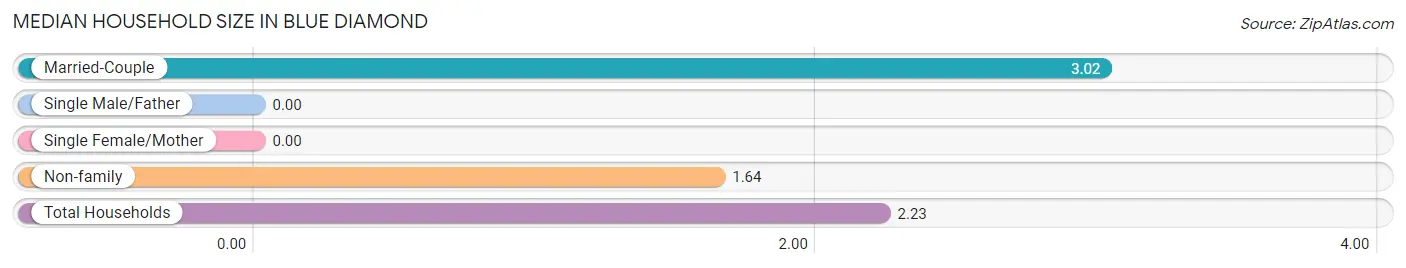
| Household Type | # Households | Household Size |
| Married-Couple | 47 (42.3%) | 3.02 |
| Single Male/Father | 0 (0.0%) | - |
| Single Female/Mother | 0 (0.0%) | - |
| Non-family | 64 (57.7%) | 1.64 |
| Total Households | 111 (100.0%) | 2.23 |
Household Size by Marriage Status in Blue Diamond
Out of a total of 111 households in Blue Diamond, 47 (42.3%) are family households, while 64 (57.7%) are nonfamily households. The most numerous type of family households are 3-person households, comprising 28, and the most common type of nonfamily households are 2-person households, comprising 38.
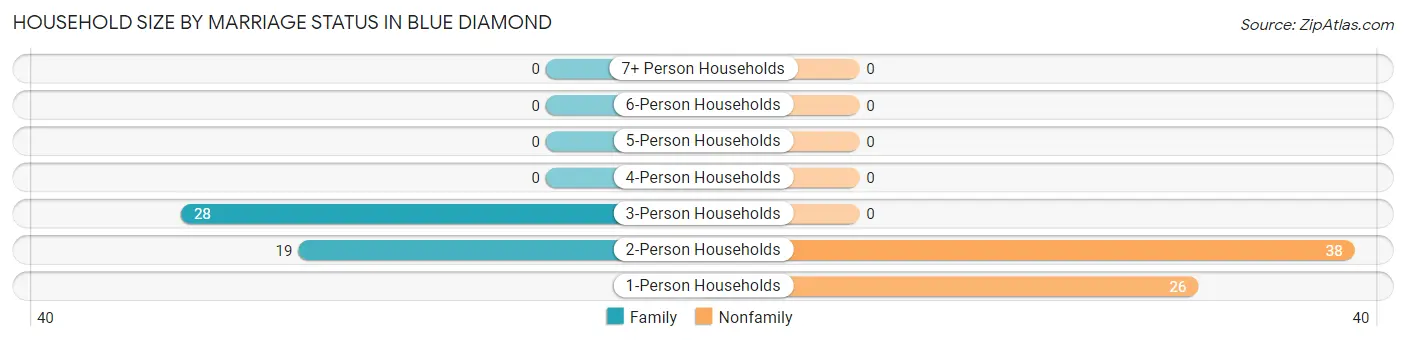
| Household Size | Family Households | Nonfamily Households |
| 1-Person Households | - | 26 (23.4%) |
| 2-Person Households | 19 (17.1%) | 38 (34.2%) |
| 3-Person Households | 28 (25.2%) | 0 (0.0%) |
| 4-Person Households | 0 (0.0%) | 0 (0.0%) |
| 5-Person Households | 0 (0.0%) | 0 (0.0%) |
| 6-Person Households | 0 (0.0%) | 0 (0.0%) |
| 7+ Person Households | 0 (0.0%) | 0 (0.0%) |
| Total | 47 (42.3%) | 64 (57.7%) |
Female Fertility in Blue Diamond
Fertility by Age in Blue Diamond
| Age Bracket | Women with Births | Births / 1,000 Women |
| 15 to 19 years | 0 (0.0%) | 0.0 |
| 20 to 34 years | 0 (0.0%) | 0.0 |
| 35 to 50 years | 0 (0.0%) | 0.0 |
| Total | 0 (0.0%) | 0.0 |
Fertility by Age by Marriage Status in Blue Diamond
| Age Bracket | Married | Unmarried |
| 15 to 19 years | 0 (0.0%) | 0 (0.0%) |
| 20 to 34 years | 0 (0.0%) | 0 (0.0%) |
| 35 to 50 years | 0 (0.0%) | 0 (0.0%) |
| Total | 0 (0.0%) | 0 (0.0%) |
Fertility by Education in Blue Diamond
| Educational Attainment | Women with Births | Births / 1,000 Women |
| Less than High School | 0 (0.0%) | 0.0 |
| High School Diploma | 0 (0.0%) | 0.0 |
| College or Associate's Degree | 0 (0.0%) | 0.0 |
| Bachelor's Degree | 0 (0.0%) | 0.0 |
| Graduate Degree | 0 (0.0%) | 0.0 |
| Total | 0 (0.0%) | 0.0 |
Fertility by Education by Marriage Status in Blue Diamond
| Educational Attainment | Married | Unmarried |
| Less than High School | 0 (0.0%) | 0 (0.0%) |
| High School Diploma | 0 (0.0%) | 0 (0.0%) |
| College or Associate's Degree | 0 (0.0%) | 0 (0.0%) |
| Bachelor's Degree | 0 (0.0%) | 0 (0.0%) |
| Graduate Degree | 0 (0.0%) | 0 (0.0%) |
| Total | 0 (0.0%) | 0 (0.0%) |
Employment Characteristics in Blue Diamond
Employment by Class of Employer in Blue Diamond
Among the 132 employed individuals in Blue Diamond, private company employees (84 | 63.6%), self-employed (not incorporated) (19 | 14.4%), and self-employed (incorporated) (17 | 12.9%) make up the most common classes of employment.
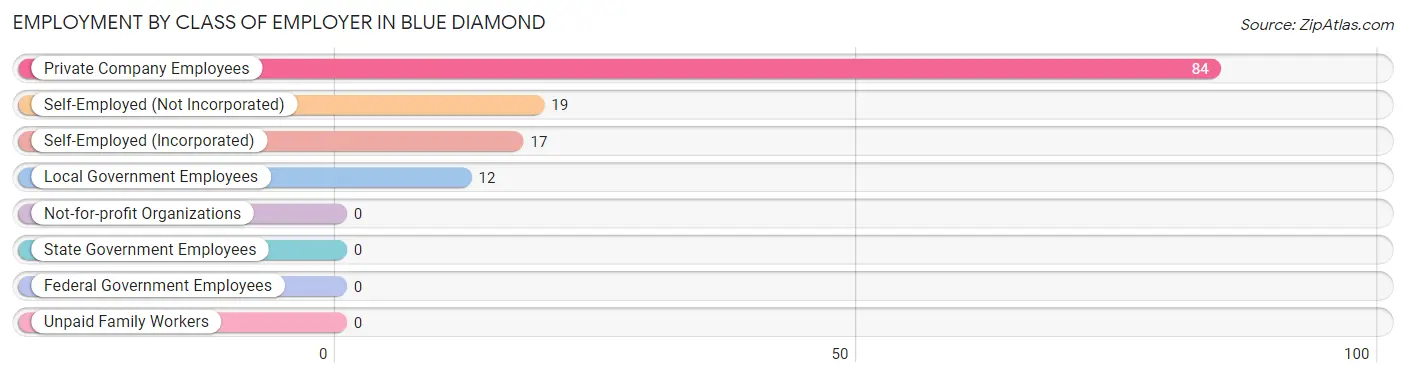
| Employer Class | # Employees | % Employees |
| Private Company Employees | 84 | 63.6% |
| Self-Employed (Incorporated) | 17 | 12.9% |
| Self-Employed (Not Incorporated) | 19 | 14.4% |
| Not-for-profit Organizations | 0 | 0.0% |
| Local Government Employees | 12 | 9.1% |
| State Government Employees | 0 | 0.0% |
| Federal Government Employees | 0 | 0.0% |
| Unpaid Family Workers | 0 | 0.0% |
| Total | 132 | 100.0% |
Employment Status by Age in Blue Diamond
According to the labor force statistics for Blue Diamond, out of the total population over 16 years of age (247), 68.4% or 169 individuals are in the labor force, with 14.8% or 25 of them unemployed. The age group with the highest labor force participation rate is 30 to 34 years, with 100.0% or 12 individuals in the labor force. Within the labor force, the 60 to 64 years age range has the highest percentage of unemployed individuals, with 50.0% or 6 of them being unemployed.
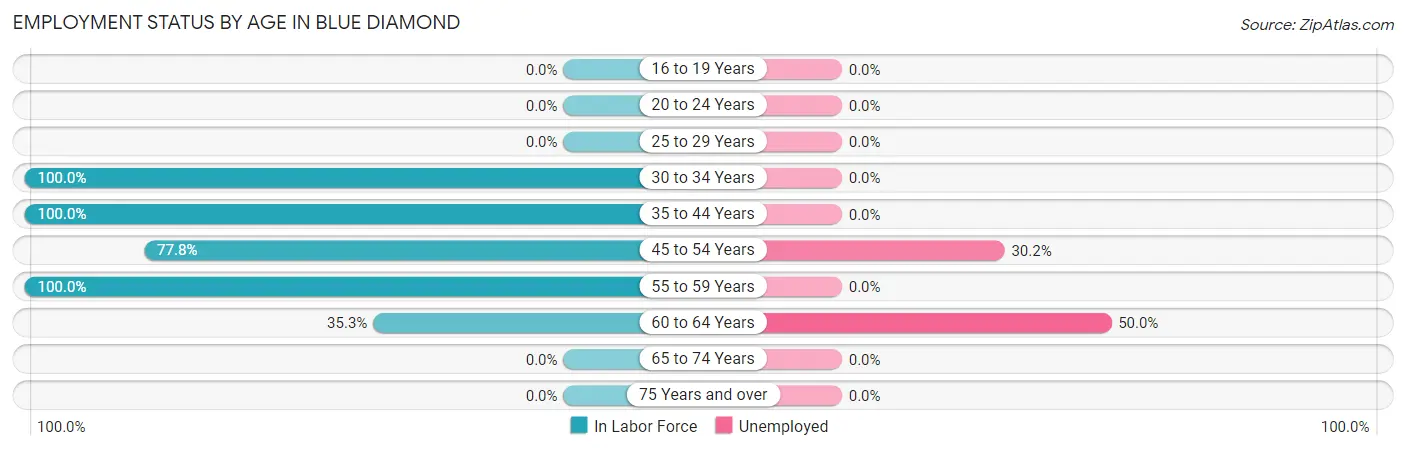
| Age Bracket | In Labor Force | Unemployed |
| 16 to 19 Years | 0 (0.0%) | 0 (0.0%) |
| 20 to 24 Years | 0 (0.0%) | 0 (0.0%) |
| 25 to 29 Years | 0 (0.0%) | 0 (0.0%) |
| 30 to 34 Years | 12 (100.0%) | 0 (0.0%) |
| 35 to 44 Years | 49 (100.0%) | 0 (0.0%) |
| 45 to 54 Years | 63 (77.8%) | 19 (30.2%) |
| 55 to 59 Years | 33 (100.0%) | 0 (0.0%) |
| 60 to 64 Years | 12 (35.3%) | 6 (50.0%) |
| 65 to 74 Years | 0 (0.0%) | 0 (0.0%) |
| 75 Years and over | 0 (0.0%) | 0 (0.0%) |
| Total | 169 (68.4%) | 25 (14.8%) |
Employment Status by Educational Attainment in Blue Diamond
According to labor force statistics for Blue Diamond, 80.9% of individuals (169) out of the total population between 25 and 64 years of age (209) are in the labor force, with 14.8% or 25 of them being unemployed. The group with the highest labor force participation rate are those with the educational attainment of high school diploma, with 100.0% or 14 individuals in the labor force. Within the labor force, individuals with college / associate degree education have the highest percentage of unemployment, with 40.3% or 25 of them being unemployed.
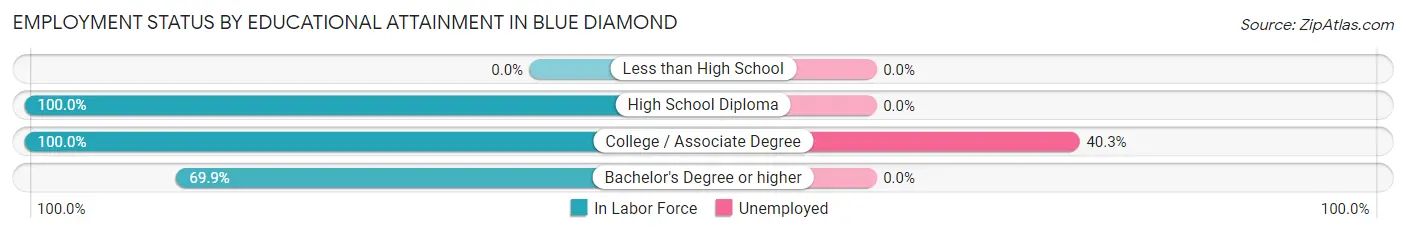
| Educational Attainment | In Labor Force | Unemployed |
| Less than High School | 0 (0.0%) | 0 (0.0%) |
| High School Diploma | 14 (100.0%) | 0 (0.0%) |
| College / Associate Degree | 62 (100.0%) | 25 (40.3%) |
| Bachelor's Degree or higher | 93 (69.9%) | 0 (0.0%) |
| Total | 169 (80.9%) | 31 (14.8%) |
Employment Occupations by Sex in Blue Diamond
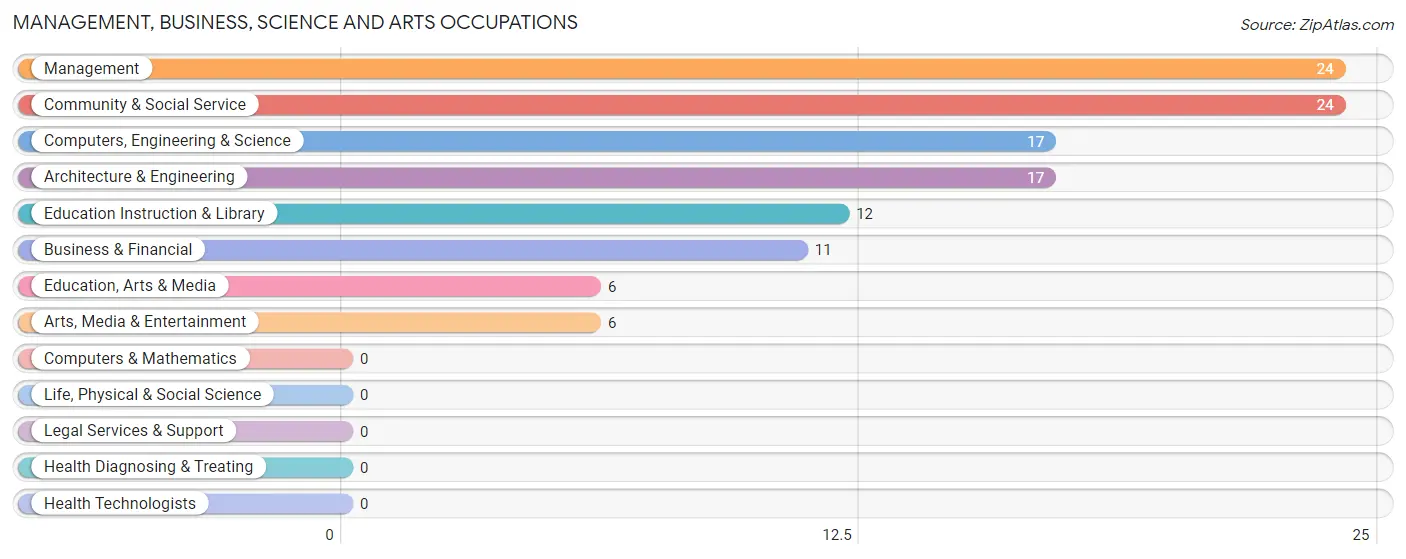
Management, Business, Science and Arts Occupations
The most common Management, Business, Science and Arts occupations in Blue Diamond are Management (24 | 16.7%), Community & Social Service (24 | 16.7%), Computers, Engineering & Science (17 | 11.8%), Architecture & Engineering (17 | 11.8%), and Education Instruction & Library (12 | 8.3%).
Management, Business, Science and Arts Occupations by Sex
Within the Management, Business, Science and Arts occupations in Blue Diamond, the most male-oriented occupations are Computers, Engineering & Science (100.0%), Architecture & Engineering (100.0%), and Arts, Media & Entertainment (100.0%), while the most female-oriented occupations are Business & Financial (100.0%), Education, Arts & Media (100.0%), and Education Instruction & Library (100.0%).
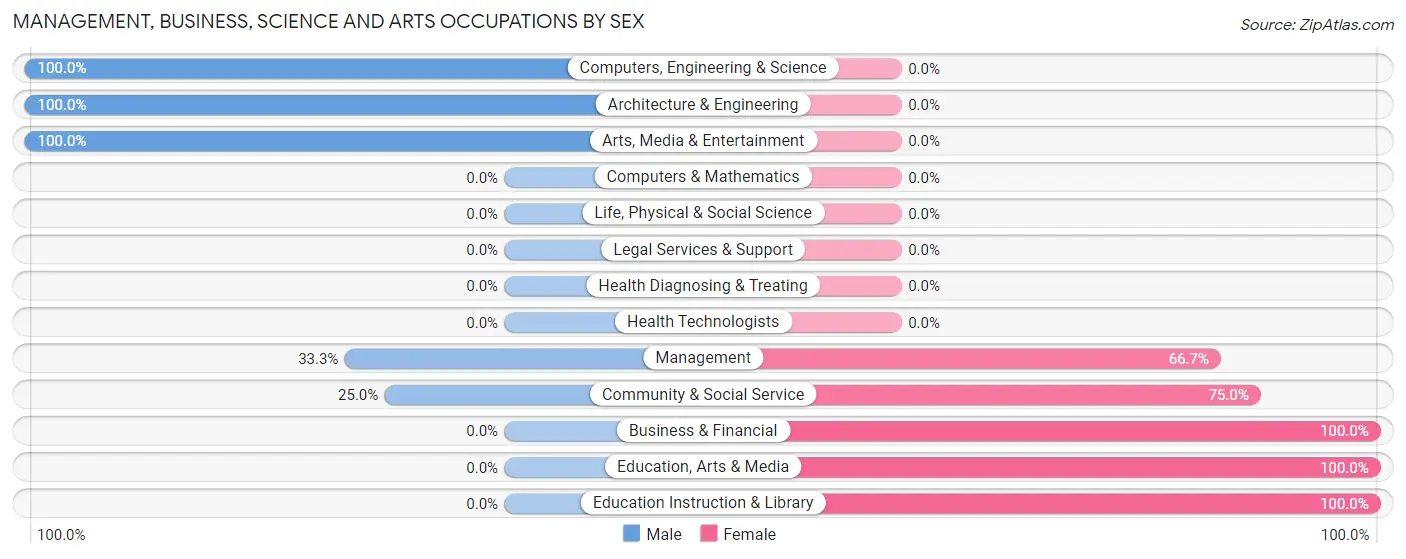
| Occupation | Male | Female |
| Management | 8 (33.3%) | 16 (66.7%) |
| Business & Financial | 0 (0.0%) | 11 (100.0%) |
| Computers, Engineering & Science | 17 (100.0%) | 0 (0.0%) |
| Computers & Mathematics | 0 (0.0%) | 0 (0.0%) |
| Architecture & Engineering | 17 (100.0%) | 0 (0.0%) |
| Life, Physical & Social Science | 0 (0.0%) | 0 (0.0%) |
| Community & Social Service | 6 (25.0%) | 18 (75.0%) |
| Education, Arts & Media | 0 (0.0%) | 6 (100.0%) |
| Legal Services & Support | 0 (0.0%) | 0 (0.0%) |
| Education Instruction & Library | 0 (0.0%) | 12 (100.0%) |
| Arts, Media & Entertainment | 6 (100.0%) | 0 (0.0%) |
| Health Diagnosing & Treating | 0 (0.0%) | 0 (0.0%) |
| Health Technologists | 0 (0.0%) | 0 (0.0%) |
| Total (Category) | 31 (40.8%) | 45 (59.2%) |
| Total (Overall) | 77 (53.5%) | 67 (46.5%) |
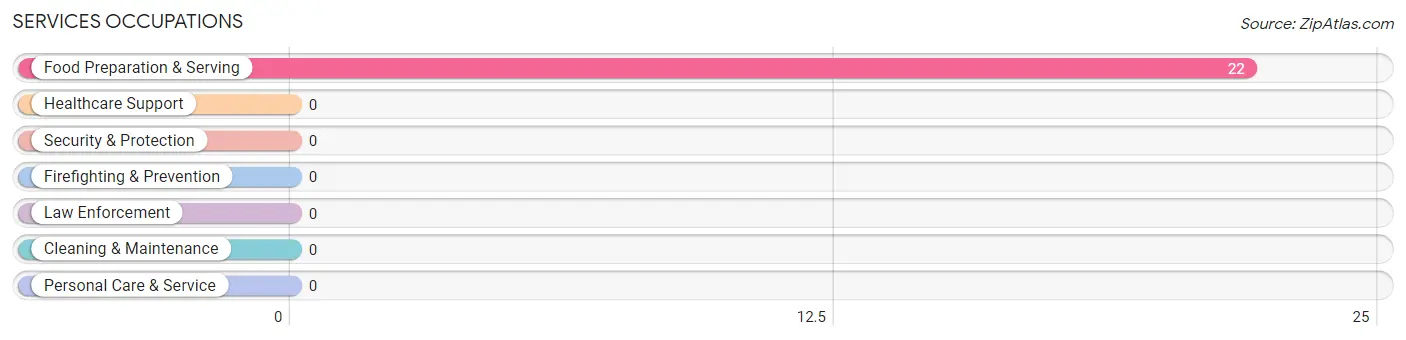
Services Occupations
The most common Services occupations in Blue Diamond are , and Food Preparation & Serving (22 | 15.3%).
Services Occupations by Sex
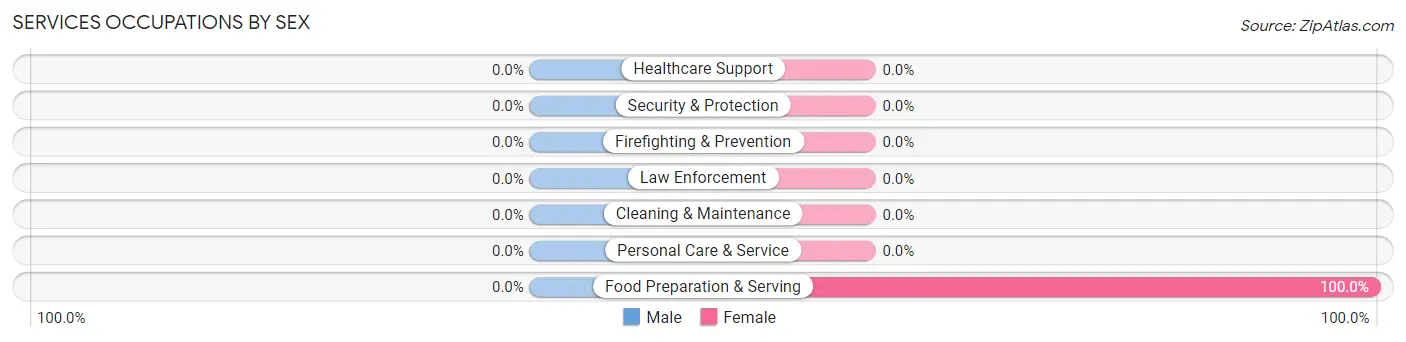
| Occupation | Male | Female |
| Healthcare Support | 0 (0.0%) | 0 (0.0%) |
| Security & Protection | 0 (0.0%) | 0 (0.0%) |
| Firefighting & Prevention | 0 (0.0%) | 0 (0.0%) |
| Law Enforcement | 0 (0.0%) | 0 (0.0%) |
| Food Preparation & Serving | 0 (0.0%) | 22 (100.0%) |
| Cleaning & Maintenance | 0 (0.0%) | 0 (0.0%) |
| Personal Care & Service | 0 (0.0%) | 0 (0.0%) |
| Total (Category) | 0 (0.0%) | 22 (100.0%) |
| Total (Overall) | 77 (53.5%) | 67 (46.5%) |
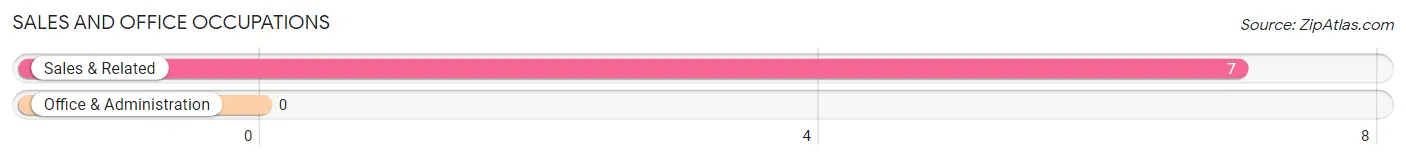
Sales and Office Occupations
The most common Sales and Office occupations in Blue Diamond are , and Sales & Related (7 | 4.9%).
Sales and Office Occupations by Sex
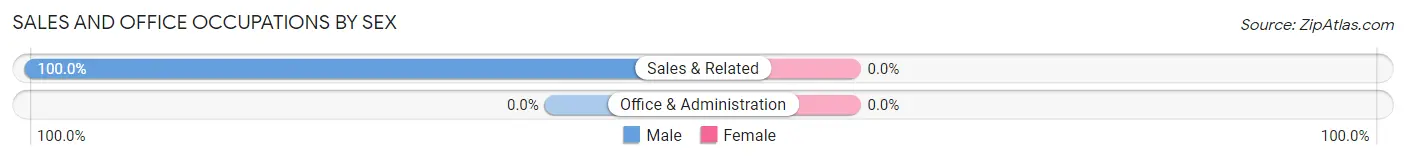
| Occupation | Male | Female |
| Sales & Related | 7 (100.0%) | 0 (0.0%) |
| Office & Administration | 0 (0.0%) | 0 (0.0%) |
| Total (Category) | 7 (100.0%) | 0 (0.0%) |
| Total (Overall) | 77 (53.5%) | 67 (46.5%) |
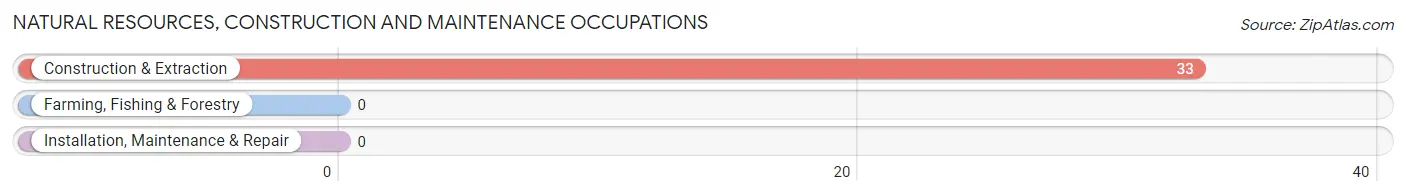
Natural Resources, Construction and Maintenance Occupations
The most common Natural Resources, Construction and Maintenance occupations in Blue Diamond are , and Construction & Extraction (33 | 22.9%).
Natural Resources, Construction and Maintenance Occupations by Sex
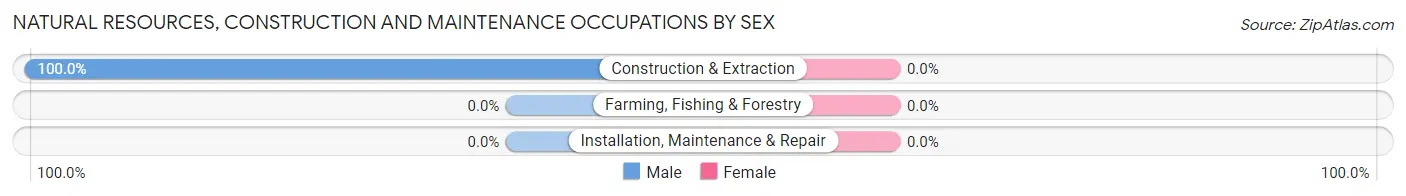
| Occupation | Male | Female |
| Farming, Fishing & Forestry | 0 (0.0%) | 0 (0.0%) |
| Construction & Extraction | 33 (100.0%) | 0 (0.0%) |
| Installation, Maintenance & Repair | 0 (0.0%) | 0 (0.0%) |
| Total (Category) | 33 (100.0%) | 0 (0.0%) |
| Total (Overall) | 77 (53.5%) | 67 (46.5%) |
Production, Transportation and Moving Occupations
The most common Production, Transportation and Moving occupations in Blue Diamond are , and Transportation (6 | 4.2%).
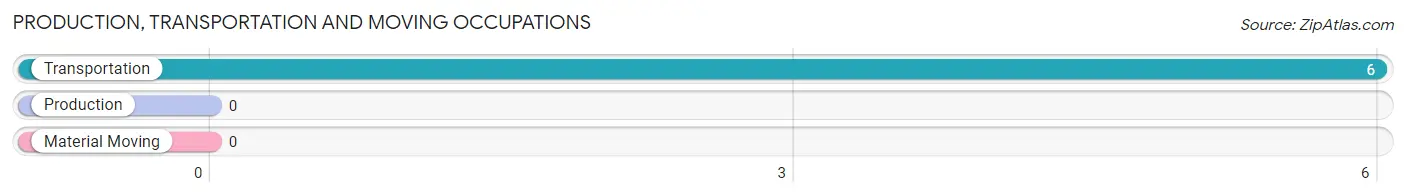
Production, Transportation and Moving Occupations by Sex
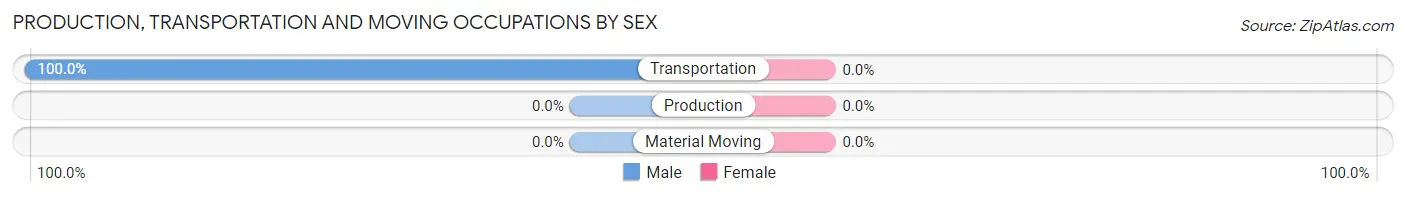
| Occupation | Male | Female |
| Production | 0 (0.0%) | 0 (0.0%) |
| Transportation | 6 (100.0%) | 0 (0.0%) |
| Material Moving | 0 (0.0%) | 0 (0.0%) |
| Total (Category) | 6 (100.0%) | 0 (0.0%) |
| Total (Overall) | 77 (53.5%) | 67 (46.5%) |
Employment Industries by Sex in Blue Diamond
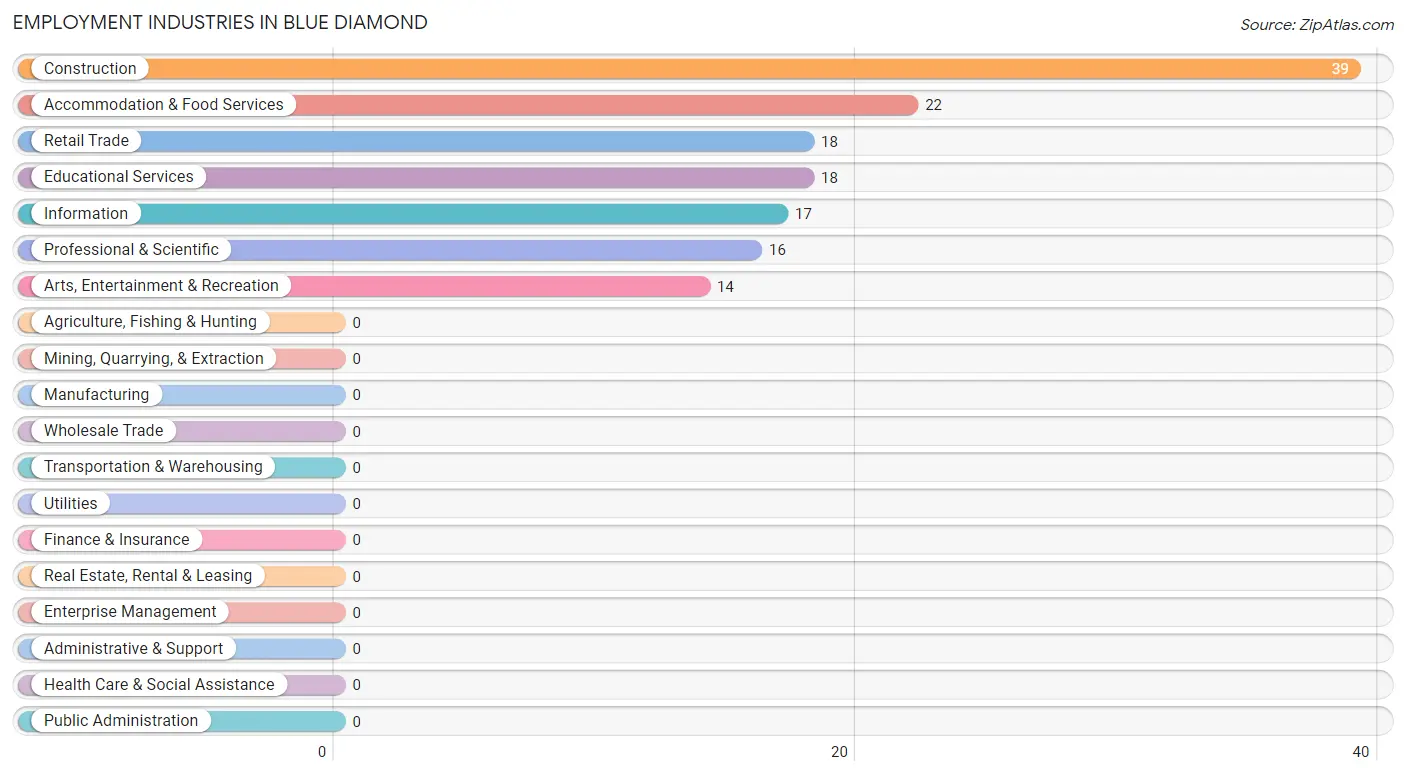
Employment Industries in Blue Diamond
The major employment industries in Blue Diamond include Construction (39 | 27.1%), Accommodation & Food Services (22 | 15.3%), Retail Trade (18 | 12.5%), Educational Services (18 | 12.5%), and Information (17 | 11.8%).
Employment Industries by Sex in Blue Diamond
The Blue Diamond industries that see more men than women are Construction (100.0%), Information (100.0%), and Arts, Entertainment & Recreation (100.0%), whereas the industries that tend to have a higher number of women are Professional & Scientific (100.0%), Educational Services (100.0%), and Accommodation & Food Services (100.0%).
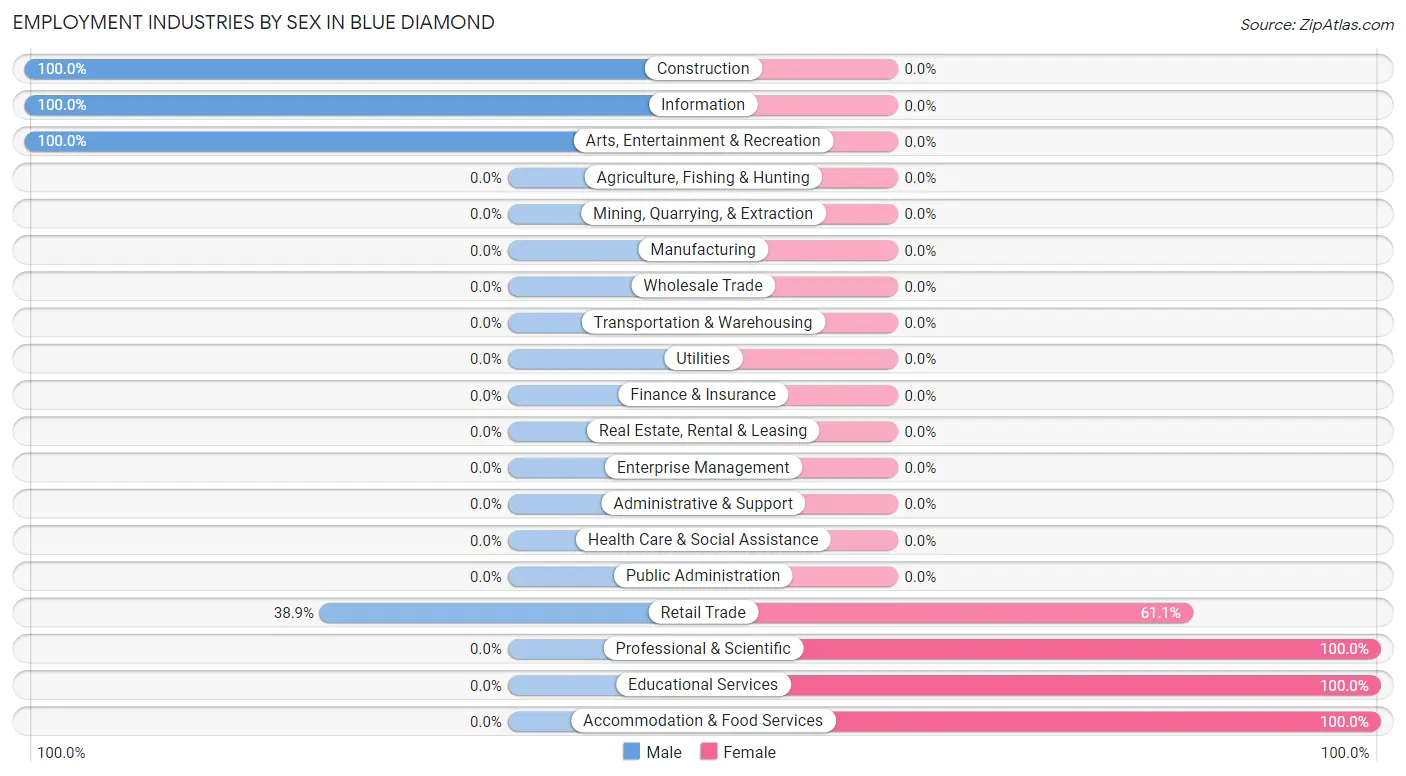
| Industry | Male | Female |
| Agriculture, Fishing & Hunting | 0 (0.0%) | 0 (0.0%) |
| Mining, Quarrying, & Extraction | 0 (0.0%) | 0 (0.0%) |
| Construction | 39 (100.0%) | 0 (0.0%) |
| Manufacturing | 0 (0.0%) | 0 (0.0%) |
| Wholesale Trade | 0 (0.0%) | 0 (0.0%) |
| Retail Trade | 7 (38.9%) | 11 (61.1%) |
| Transportation & Warehousing | 0 (0.0%) | 0 (0.0%) |
| Utilities | 0 (0.0%) | 0 (0.0%) |
| Information | 17 (100.0%) | 0 (0.0%) |
| Finance & Insurance | 0 (0.0%) | 0 (0.0%) |
| Real Estate, Rental & Leasing | 0 (0.0%) | 0 (0.0%) |
| Professional & Scientific | 0 (0.0%) | 16 (100.0%) |
| Enterprise Management | 0 (0.0%) | 0 (0.0%) |
| Administrative & Support | 0 (0.0%) | 0 (0.0%) |
| Educational Services | 0 (0.0%) | 18 (100.0%) |
| Health Care & Social Assistance | 0 (0.0%) | 0 (0.0%) |
| Arts, Entertainment & Recreation | 14 (100.0%) | 0 (0.0%) |
| Accommodation & Food Services | 0 (0.0%) | 22 (100.0%) |
| Public Administration | 0 (0.0%) | 0 (0.0%) |
| Total | 77 (53.5%) | 67 (46.5%) |
Education in Blue Diamond
School Enrollment in Blue Diamond
The most common levels of schooling among the 34 students in Blue Diamond are college / undergraduate (28 | 82.4%), and graduate / professional (6 | 17.6%).
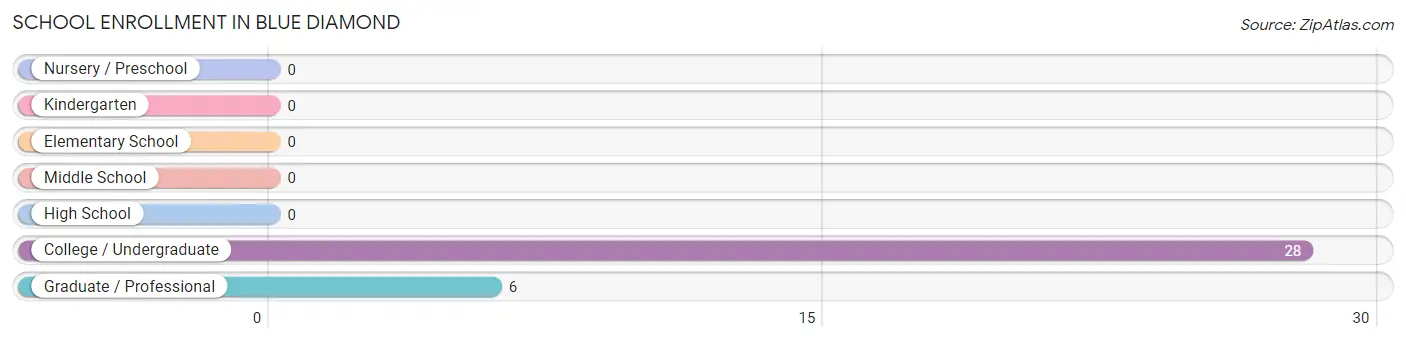
| School Level | # Students | % Students |
| Nursery / Preschool | 0 | 0.0% |
| Kindergarten | 0 | 0.0% |
| Elementary School | 0 | 0.0% |
| Middle School | 0 | 0.0% |
| High School | 0 | 0.0% |
| College / Undergraduate | 28 | 82.4% |
| Graduate / Professional | 6 | 17.6% |
| Total | 34 | 100.0% |
School Enrollment by Age by Funding Source in Blue Diamond
Out of a total of 34 students who are enrolled in schools in Blue Diamond, 6 (17.6%) attend a private institution, while the remaining 28 (82.4%) are enrolled in public schools. The age group of 25 to 34 year olds has the highest likelihood of being enrolled in private schools, with 6 (100.0% in the age bracket) enrolled. Conversely, the age group of 20 to 24 year olds has the lowest likelihood of being enrolled in a private school, with 20 (100.0% in the age bracket) attending a public institution.
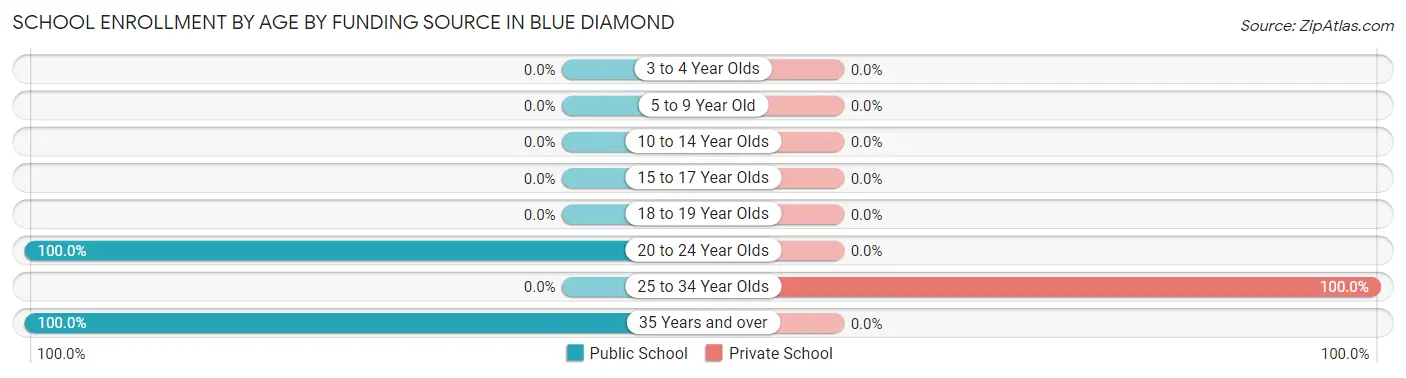
| Age Bracket | Public School | Private School |
| 3 to 4 Year Olds | 0 (0.0%) | 0 (0.0%) |
| 5 to 9 Year Old | 0 (0.0%) | 0 (0.0%) |
| 10 to 14 Year Olds | 0 (0.0%) | 0 (0.0%) |
| 15 to 17 Year Olds | 0 (0.0%) | 0 (0.0%) |
| 18 to 19 Year Olds | 0 (0.0%) | 0 (0.0%) |
| 20 to 24 Year Olds | 20 (100.0%) | 0 (0.0%) |
| 25 to 34 Year Olds | 0 (0.0%) | 6 (100.0%) |
| 35 Years and over | 8 (100.0%) | 0 (0.0%) |
| Total | 28 (82.4%) | 6 (17.6%) |
Educational Attainment by Field of Study in Blue Diamond
Education (41 | 28.5%), business (24 | 16.7%), engineering (19 | 13.2%), liberal arts & history (18 | 12.5%), and science & technology (17 | 11.8%) are the most common fields of study among 144 individuals in Blue Diamond who have obtained a bachelor's degree or higher.
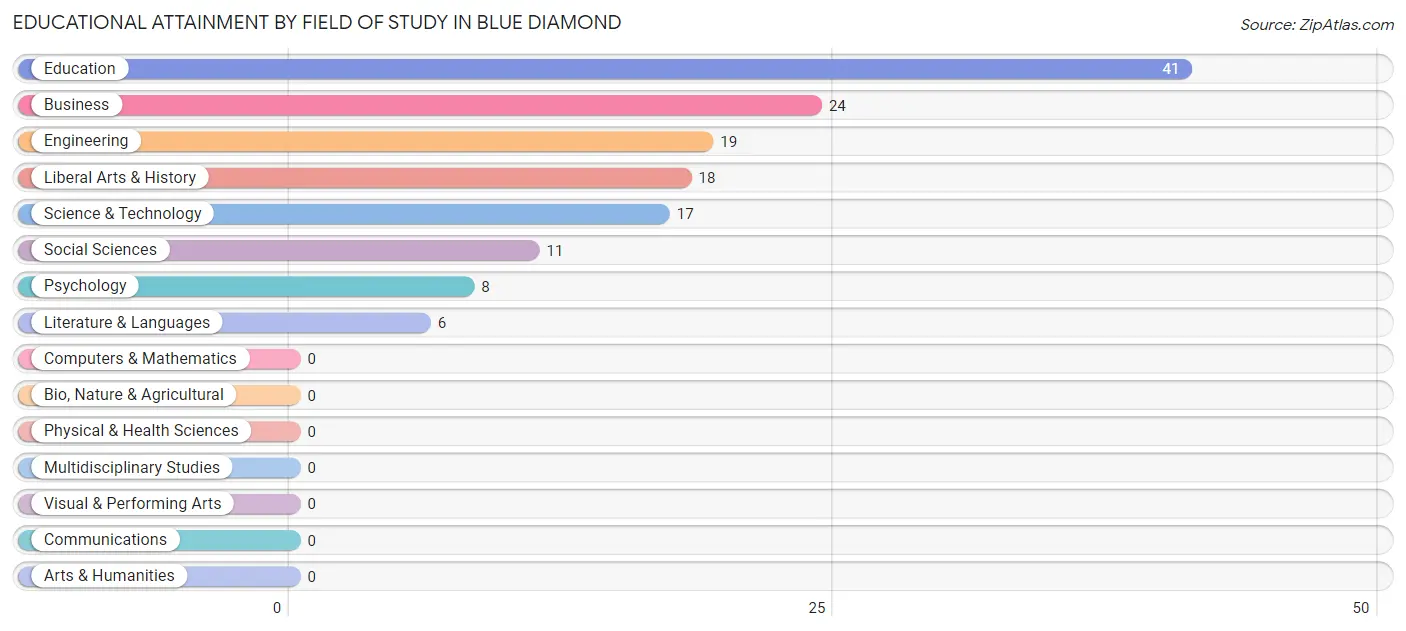
| Field of Study | # Graduates | % Graduates |
| Computers & Mathematics | 0 | 0.0% |
| Bio, Nature & Agricultural | 0 | 0.0% |
| Physical & Health Sciences | 0 | 0.0% |
| Psychology | 8 | 5.6% |
| Social Sciences | 11 | 7.6% |
| Engineering | 19 | 13.2% |
| Multidisciplinary Studies | 0 | 0.0% |
| Science & Technology | 17 | 11.8% |
| Business | 24 | 16.7% |
| Education | 41 | 28.5% |
| Literature & Languages | 6 | 4.2% |
| Liberal Arts & History | 18 | 12.5% |
| Visual & Performing Arts | 0 | 0.0% |
| Communications | 0 | 0.0% |
| Arts & Humanities | 0 | 0.0% |
| Total | 144 | 100.0% |
Transportation & Commute in Blue Diamond
Vehicle Availability by Sex in Blue Diamond
The most prevalent vehicle ownership categories in Blue Diamond are males with 3 vehicles (38, accounting for 53.5%) and females with 3 vehicles (55, making up 62.3%).
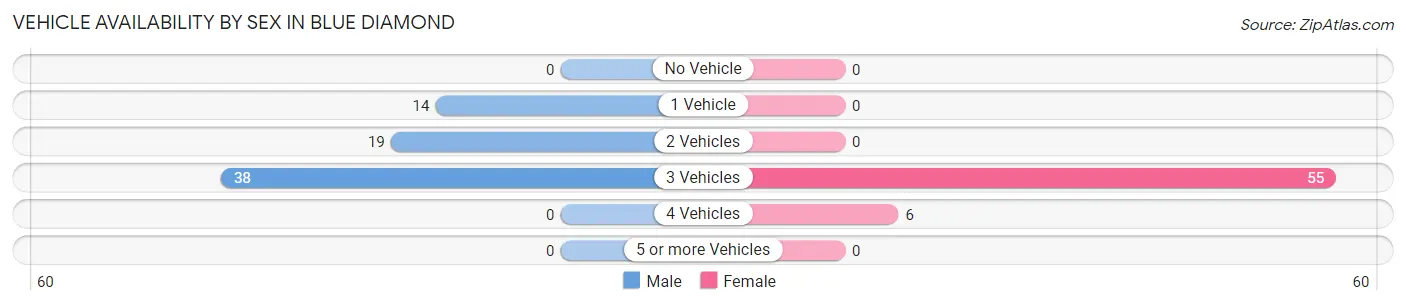
| Vehicles Available | Male | Female |
| No Vehicle | 0 (0.0%) | 0 (0.0%) |
| 1 Vehicle | 14 (19.7%) | 0 (0.0%) |
| 2 Vehicles | 19 (26.8%) | 0 (0.0%) |
| 3 Vehicles | 38 (53.5%) | 55 (90.2%) |
| 4 Vehicles | 0 (0.0%) | 6 (9.8%) |
| 5 or more Vehicles | 0 (0.0%) | 0 (0.0%) |
| Total | 71 (100.0%) | 61 (100.0%) |
Commute Time in Blue Diamond
The most frequently occuring commute durations in Blue Diamond are 30 to 34 minutes (53 commuters, 45.7%), 45 to 59 minutes (19 commuters, 16.4%), and 40 to 44 minutes (17 commuters, 14.7%).
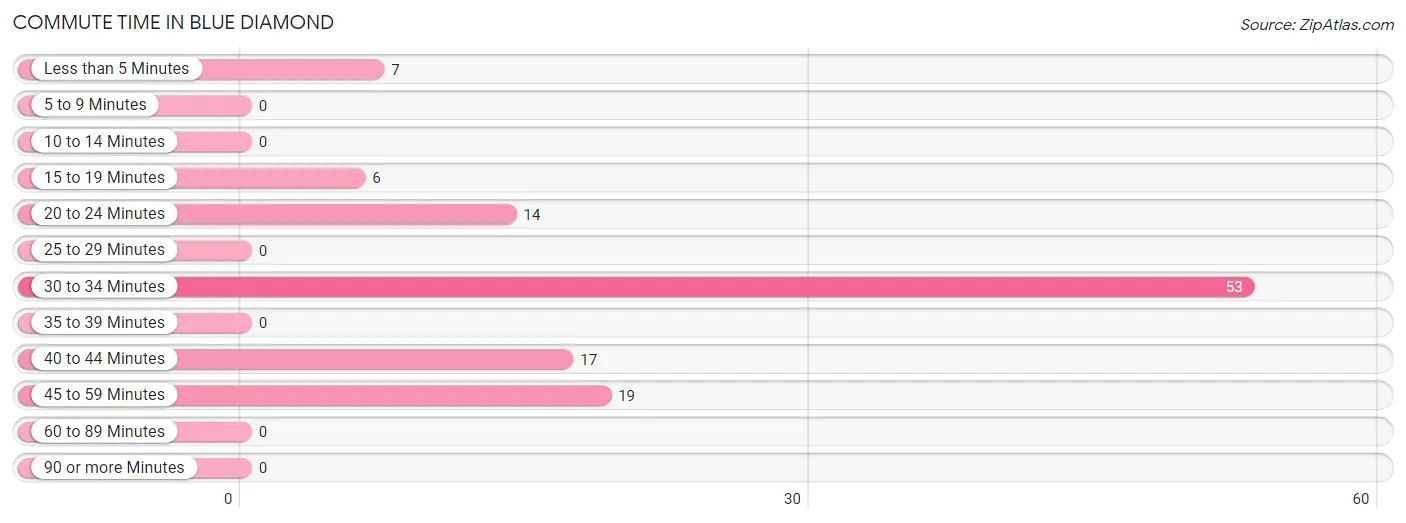
| Commute Time | # Commuters | % Commuters |
| Less than 5 Minutes | 7 | 6.0% |
| 5 to 9 Minutes | 0 | 0.0% |
| 10 to 14 Minutes | 0 | 0.0% |
| 15 to 19 Minutes | 6 | 5.2% |
| 20 to 24 Minutes | 14 | 12.1% |
| 25 to 29 Minutes | 0 | 0.0% |
| 30 to 34 Minutes | 53 | 45.7% |
| 35 to 39 Minutes | 0 | 0.0% |
| 40 to 44 Minutes | 17 | 14.7% |
| 45 to 59 Minutes | 19 | 16.4% |
| 60 to 89 Minutes | 0 | 0.0% |
| 90 or more Minutes | 0 | 0.0% |
Commute Time by Sex in Blue Diamond
The most common commute times in Blue Diamond are 30 to 34 minutes (31 commuters, 43.7%) for males and 30 to 34 minutes (22 commuters, 48.9%) for females.
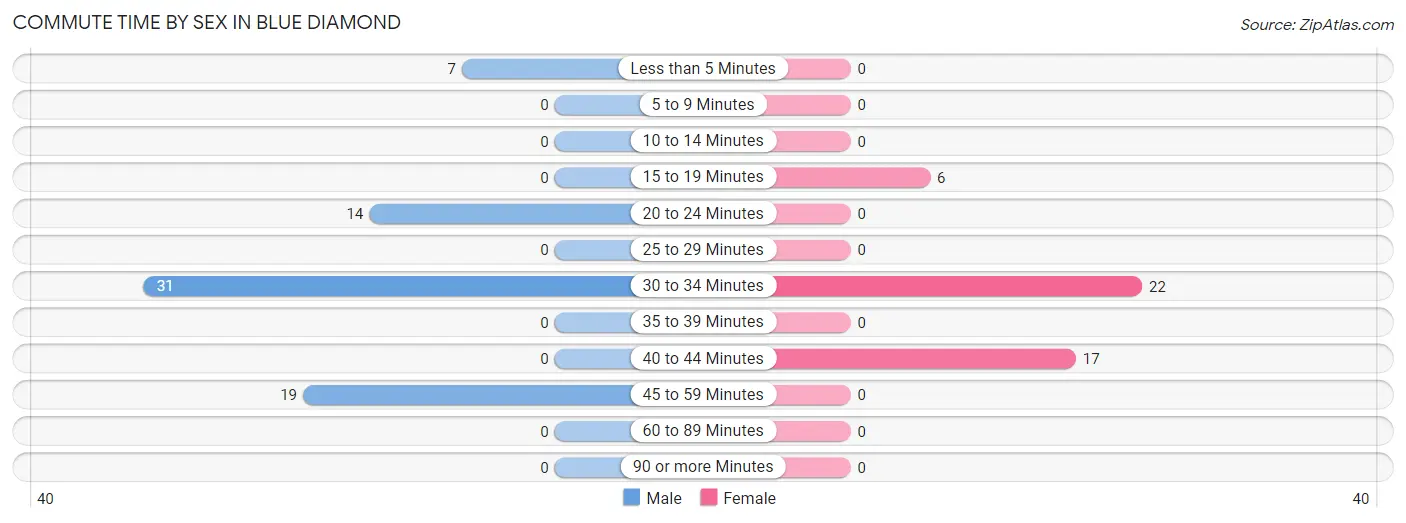
| Commute Time | Male | Female |
| Less than 5 Minutes | 7 (9.9%) | 0 (0.0%) |
| 5 to 9 Minutes | 0 (0.0%) | 0 (0.0%) |
| 10 to 14 Minutes | 0 (0.0%) | 0 (0.0%) |
| 15 to 19 Minutes | 0 (0.0%) | 6 (13.3%) |
| 20 to 24 Minutes | 14 (19.7%) | 0 (0.0%) |
| 25 to 29 Minutes | 0 (0.0%) | 0 (0.0%) |
| 30 to 34 Minutes | 31 (43.7%) | 22 (48.9%) |
| 35 to 39 Minutes | 0 (0.0%) | 0 (0.0%) |
| 40 to 44 Minutes | 0 (0.0%) | 17 (37.8%) |
| 45 to 59 Minutes | 19 (26.8%) | 0 (0.0%) |
| 60 to 89 Minutes | 0 (0.0%) | 0 (0.0%) |
| 90 or more Minutes | 0 (0.0%) | 0 (0.0%) |
Time of Departure to Work by Sex in Blue Diamond
The most frequent times of departure to work in Blue Diamond are 7:00 AM to 7:29 AM (25, 35.2%) for males and 12:00 AM to 4:59 AM (22, 48.9%) for females.
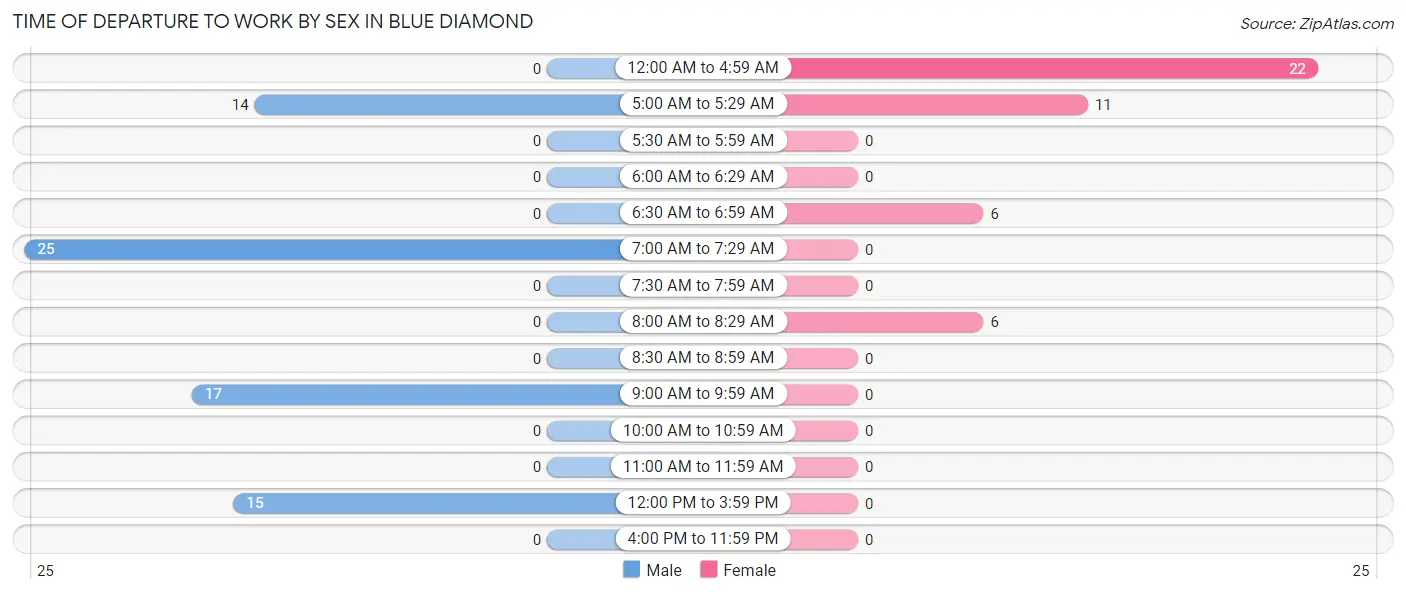
| Time of Departure | Male | Female |
| 12:00 AM to 4:59 AM | 0 (0.0%) | 22 (48.9%) |
| 5:00 AM to 5:29 AM | 14 (19.7%) | 11 (24.4%) |
| 5:30 AM to 5:59 AM | 0 (0.0%) | 0 (0.0%) |
| 6:00 AM to 6:29 AM | 0 (0.0%) | 0 (0.0%) |
| 6:30 AM to 6:59 AM | 0 (0.0%) | 6 (13.3%) |
| 7:00 AM to 7:29 AM | 25 (35.2%) | 0 (0.0%) |
| 7:30 AM to 7:59 AM | 0 (0.0%) | 0 (0.0%) |
| 8:00 AM to 8:29 AM | 0 (0.0%) | 6 (13.3%) |
| 8:30 AM to 8:59 AM | 0 (0.0%) | 0 (0.0%) |
| 9:00 AM to 9:59 AM | 17 (23.9%) | 0 (0.0%) |
| 10:00 AM to 10:59 AM | 0 (0.0%) | 0 (0.0%) |
| 11:00 AM to 11:59 AM | 0 (0.0%) | 0 (0.0%) |
| 12:00 PM to 3:59 PM | 15 (21.1%) | 0 (0.0%) |
| 4:00 PM to 11:59 PM | 0 (0.0%) | 0 (0.0%) |
| Total | 71 (100.0%) | 45 (100.0%) |
Housing Occupancy in Blue Diamond
Occupancy by Ownership in Blue Diamond
Of the total 111 dwellings in Blue Diamond, owner-occupied units account for 79 (71.2%), while renter-occupied units make up 32 (28.8%).
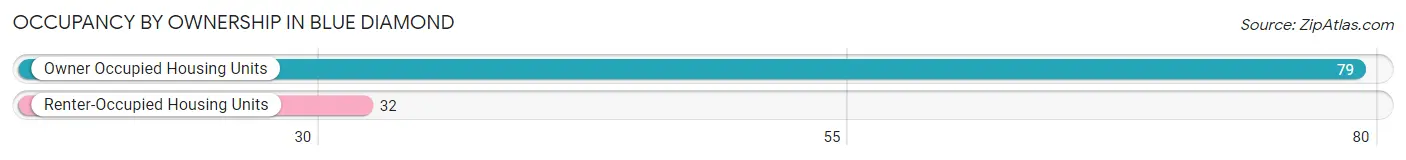
| Occupancy | # Housing Units | % Housing Units |
| Owner Occupied Housing Units | 79 | 71.2% |
| Renter-Occupied Housing Units | 32 | 28.8% |
| Total Occupied Housing Units | 111 | 100.0% |
Occupancy by Household Size in Blue Diamond
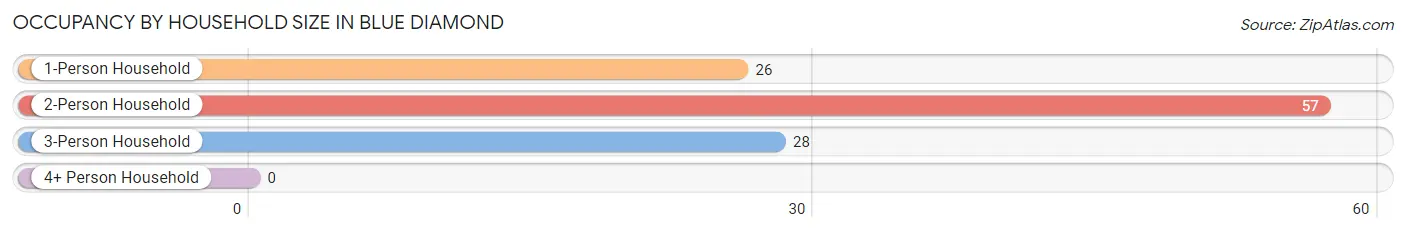
| Household Size | # Housing Units | % Housing Units |
| 1-Person Household | 26 | 23.4% |
| 2-Person Household | 57 | 51.3% |
| 3-Person Household | 28 | 25.2% |
| 4+ Person Household | 0 | 0.0% |
| Total Housing Units | 111 | 100.0% |
Occupancy by Ownership by Household Size in Blue Diamond
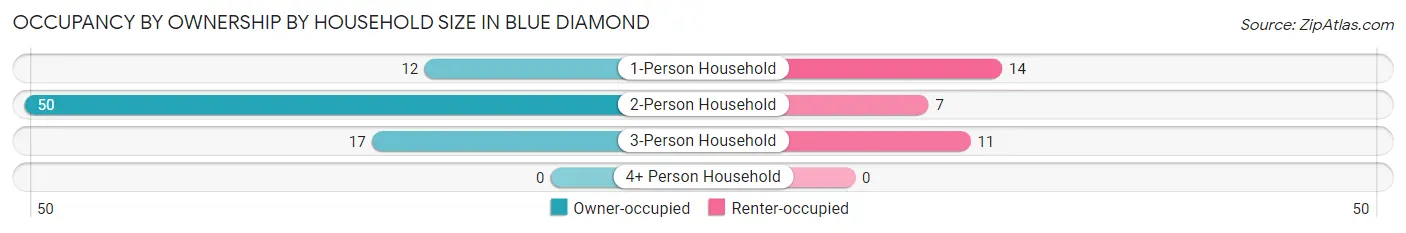
| Household Size | Owner-occupied | Renter-occupied |
| 1-Person Household | 12 (46.2%) | 14 (53.8%) |
| 2-Person Household | 50 (87.7%) | 7 (12.3%) |
| 3-Person Household | 17 (60.7%) | 11 (39.3%) |
| 4+ Person Household | 0 (0.0%) | 0 (0.0%) |
| Total Housing Units | 79 (71.2%) | 32 (28.8%) |
Occupancy by Educational Attainment in Blue Diamond
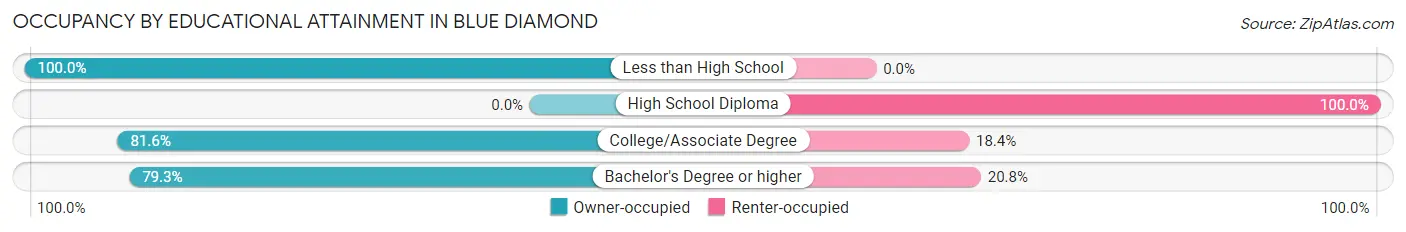
| Household Size | Owner-occupied | Renter-occupied |
| Less than High School | 6 (100.0%) | 0 (0.0%) |
| High School Diploma | 0 (0.0%) | 14 (100.0%) |
| College/Associate Degree | 31 (81.6%) | 7 (18.4%) |
| Bachelor's Degree or higher | 42 (79.2%) | 11 (20.7%) |
Occupancy by Age of Householder in Blue Diamond
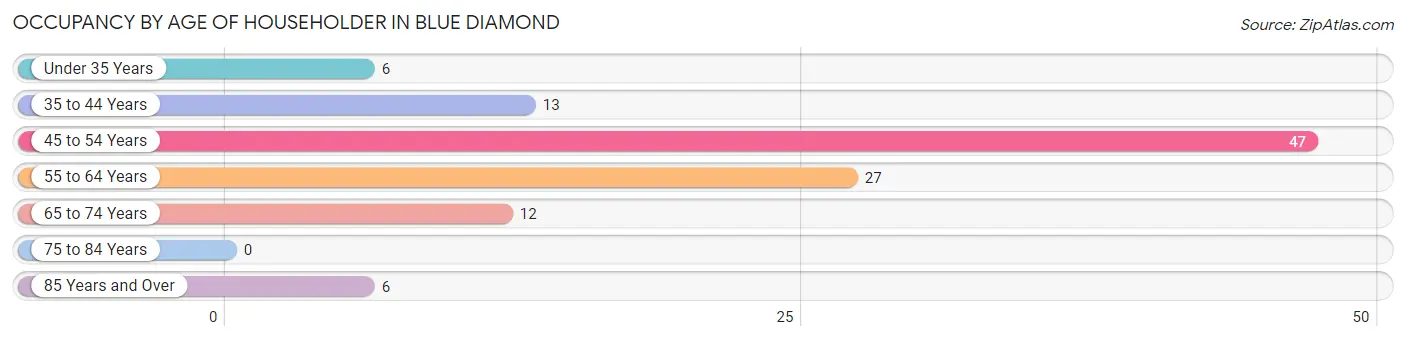
| Age Bracket | # Households | % Households |
| Under 35 Years | 6 | 5.4% |
| 35 to 44 Years | 13 | 11.7% |
| 45 to 54 Years | 47 | 42.3% |
| 55 to 64 Years | 27 | 24.3% |
| 65 to 74 Years | 12 | 10.8% |
| 75 to 84 Years | 0 | 0.0% |
| 85 Years and Over | 6 | 5.4% |
| Total | 111 | 100.0% |
Housing Finances in Blue Diamond
Median Income by Occupancy in Blue Diamond
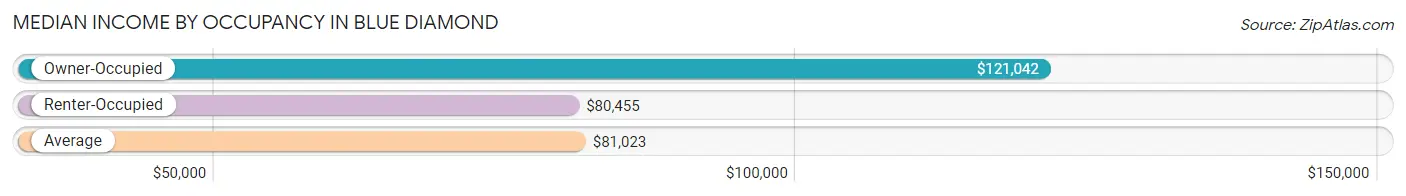
| Occupancy Type | # Households | Median Income |
| Owner-Occupied | 79 (71.2%) | $121,042 |
| Renter-Occupied | 32 (28.8%) | $80,455 |
| Average | 111 (100.0%) | $81,023 |
Occupancy by Householder Income Bracket in Blue Diamond
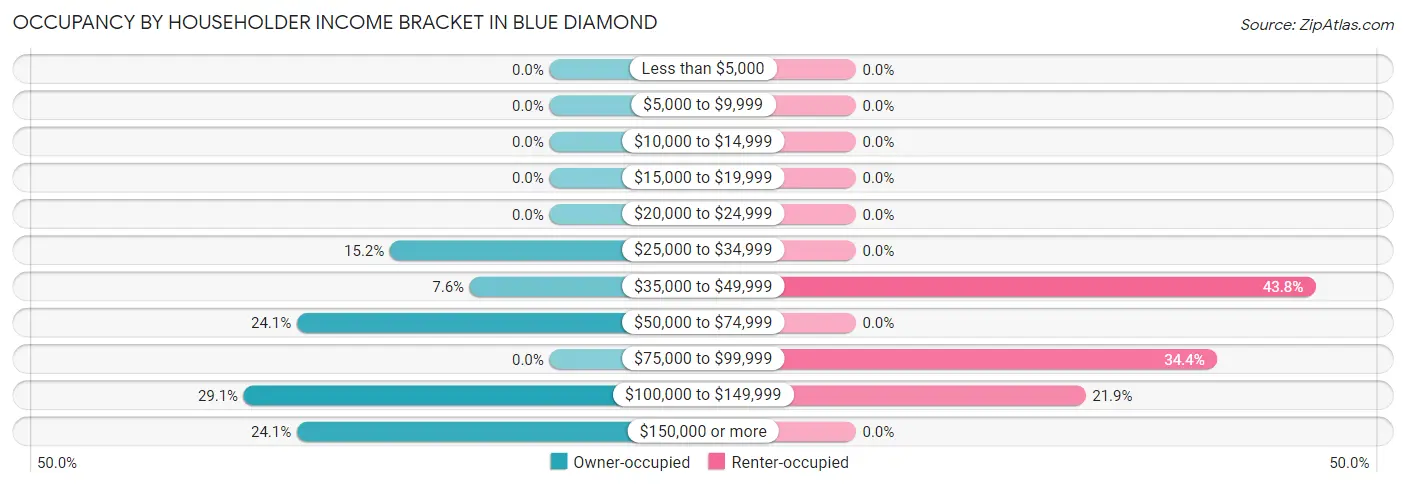
| Income Bracket | Owner-occupied | Renter-occupied |
| Less than $5,000 | 0 (0.0%) | 0 (0.0%) |
| $5,000 to $9,999 | 0 (0.0%) | 0 (0.0%) |
| $10,000 to $14,999 | 0 (0.0%) | 0 (0.0%) |
| $15,000 to $19,999 | 0 (0.0%) | 0 (0.0%) |
| $20,000 to $24,999 | 0 (0.0%) | 0 (0.0%) |
| $25,000 to $34,999 | 12 (15.2%) | 0 (0.0%) |
| $35,000 to $49,999 | 6 (7.6%) | 14 (43.8%) |
| $50,000 to $74,999 | 19 (24.0%) | 0 (0.0%) |
| $75,000 to $99,999 | 0 (0.0%) | 11 (34.4%) |
| $100,000 to $149,999 | 23 (29.1%) | 7 (21.9%) |
| $150,000 or more | 19 (24.0%) | 0 (0.0%) |
| Total | 79 (100.0%) | 32 (100.0%) |
Monthly Housing Cost Tiers in Blue Diamond
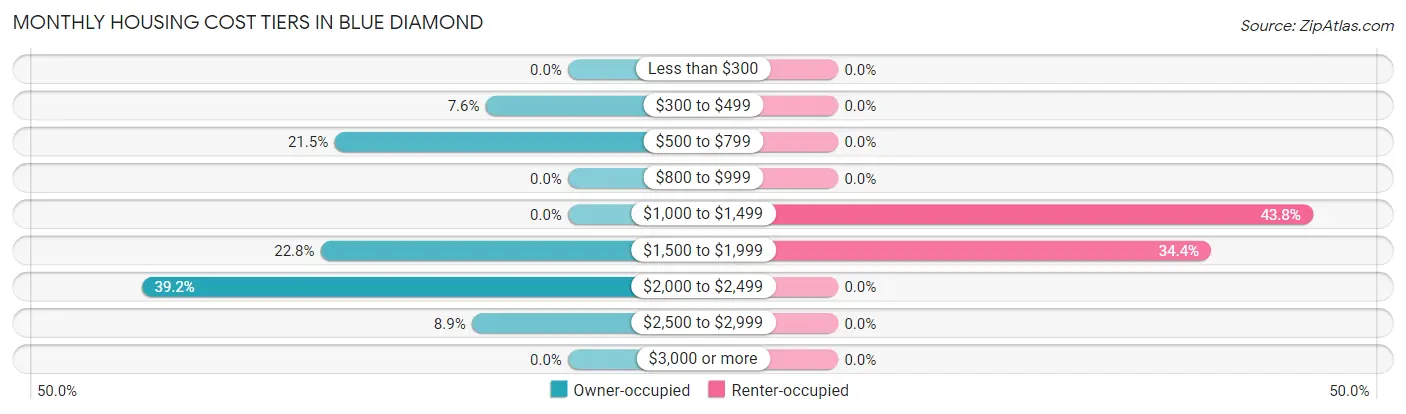
| Monthly Cost | Owner-occupied | Renter-occupied |
| Less than $300 | 0 (0.0%) | 0 (0.0%) |
| $300 to $499 | 6 (7.6%) | 0 (0.0%) |
| $500 to $799 | 17 (21.5%) | 0 (0.0%) |
| $800 to $999 | 0 (0.0%) | 0 (0.0%) |
| $1,000 to $1,499 | 0 (0.0%) | 14 (43.8%) |
| $1,500 to $1,999 | 18 (22.8%) | 11 (34.4%) |
| $2,000 to $2,499 | 31 (39.2%) | 0 (0.0%) |
| $2,500 to $2,999 | 7 (8.9%) | 0 (0.0%) |
| $3,000 or more | 0 (0.0%) | 0 (0.0%) |
| Total | 79 (100.0%) | 32 (100.0%) |
Physical Housing Characteristics in Blue Diamond
Housing Structures in Blue Diamond
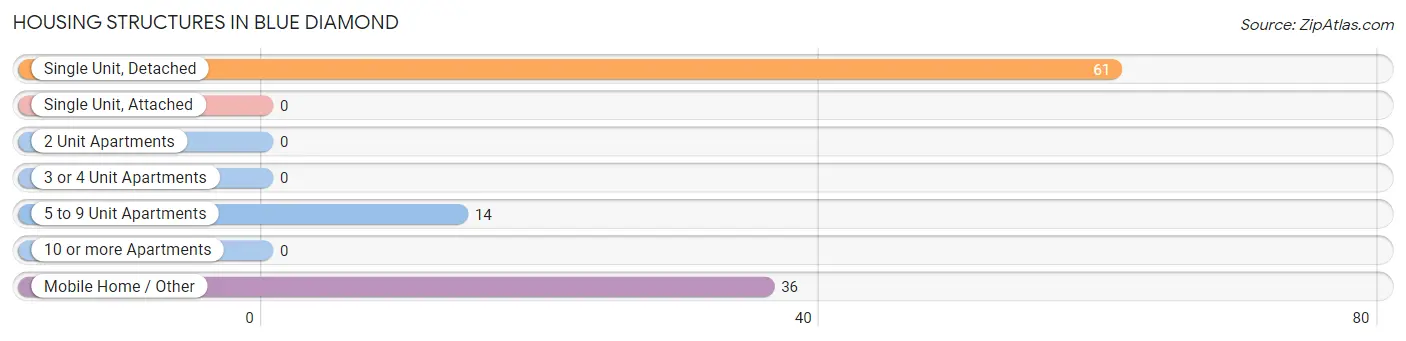
| Structure Type | # Housing Units | % Housing Units |
| Single Unit, Detached | 61 | 54.9% |
| Single Unit, Attached | 0 | 0.0% |
| 2 Unit Apartments | 0 | 0.0% |
| 3 or 4 Unit Apartments | 0 | 0.0% |
| 5 to 9 Unit Apartments | 14 | 12.6% |
| 10 or more Apartments | 0 | 0.0% |
| Mobile Home / Other | 36 | 32.4% |
| Total | 111 | 100.0% |
Housing Structures by Occupancy in Blue Diamond
| Structure Type | Owner-occupied | Renter-occupied |
| Single Unit, Detached | 54 (88.5%) | 7 (11.5%) |
| Single Unit, Attached | 0 (0.0%) | 0 (0.0%) |
| 2 Unit Apartments | 0 (0.0%) | 0 (0.0%) |
| 3 or 4 Unit Apartments | 0 (0.0%) | 0 (0.0%) |
| 5 to 9 Unit Apartments | 0 (0.0%) | 14 (100.0%) |
| 10 or more Apartments | 0 (0.0%) | 0 (0.0%) |
| Mobile Home / Other | 25 (69.4%) | 11 (30.6%) |
| Total | 79 (71.2%) | 32 (28.8%) |
Housing Structures by Number of Rooms in Blue Diamond
| Number of Rooms | Owner-occupied | Renter-occupied |
| 1 Room | 0 (0.0%) | 0 (0.0%) |
| 2 or 3 Rooms | 0 (0.0%) | 14 (43.8%) |
| 4 or 5 Rooms | 48 (60.8%) | 0 (0.0%) |
| 6 or 7 Rooms | 18 (22.8%) | 7 (21.9%) |
| 8 or more Rooms | 13 (16.5%) | 11 (34.4%) |
| Total | 79 (100.0%) | 32 (100.0%) |
Housing Structure by Heating Type in Blue Diamond
| Heating Type | Owner-occupied | Renter-occupied |
| Utility Gas | 50 (63.3%) | 32 (100.0%) |
| Bottled, Tank, or LP Gas | 0 (0.0%) | 0 (0.0%) |
| Electricity | 29 (36.7%) | 0 (0.0%) |
| Fuel Oil or Kerosene | 0 (0.0%) | 0 (0.0%) |
| Coal or Coke | 0 (0.0%) | 0 (0.0%) |
| All other Fuels | 0 (0.0%) | 0 (0.0%) |
| No Fuel Used | 0 (0.0%) | 0 (0.0%) |
| Total | 79 (100.0%) | 32 (100.0%) |
Household Vehicle Usage in Blue Diamond
| Vehicles per Household | Owner-occupied | Renter-occupied |
| No Vehicle | 0 (0.0%) | 0 (0.0%) |
| 1 Vehicle | 18 (22.8%) | 14 (43.8%) |
| 2 Vehicles | 19 (24.0%) | 0 (0.0%) |
| 3 or more Vehicles | 42 (53.2%) | 18 (56.2%) |
| Total | 79 (100.0%) | 32 (100.0%) |
Real Estate & Mortgages in Blue Diamond
Real Estate and Mortgage Overview in Blue Diamond
| Characteristic | Without Mortgage | With Mortgage |
| Housing Units | 23 | 56 |
| Median Property Value | - | - |
| Median Household Income | - | - |
| Monthly Housing Costs | - | - |
| Real Estate Taxes | - | - |
Property Value by Mortgage Status in Blue Diamond
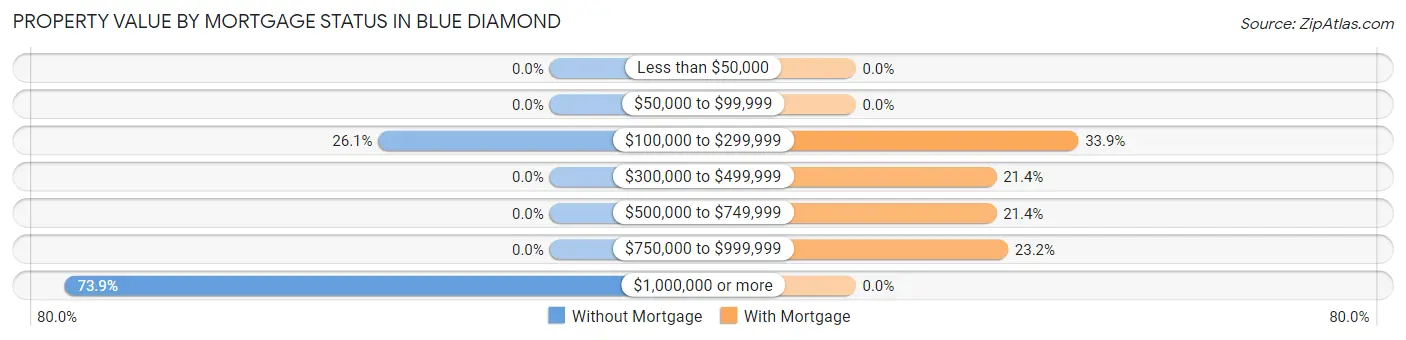
| Property Value | Without Mortgage | With Mortgage |
| Less than $50,000 | 0 (0.0%) | 0 (0.0%) |
| $50,000 to $99,999 | 0 (0.0%) | 0 (0.0%) |
| $100,000 to $299,999 | 6 (26.1%) | 19 (33.9%) |
| $300,000 to $499,999 | 0 (0.0%) | 12 (21.4%) |
| $500,000 to $749,999 | 0 (0.0%) | 12 (21.4%) |
| $750,000 to $999,999 | 0 (0.0%) | 13 (23.2%) |
| $1,000,000 or more | 17 (73.9%) | 0 (0.0%) |
| Total | 23 (100.0%) | 56 (100.0%) |
Household Income by Mortgage Status in Blue Diamond
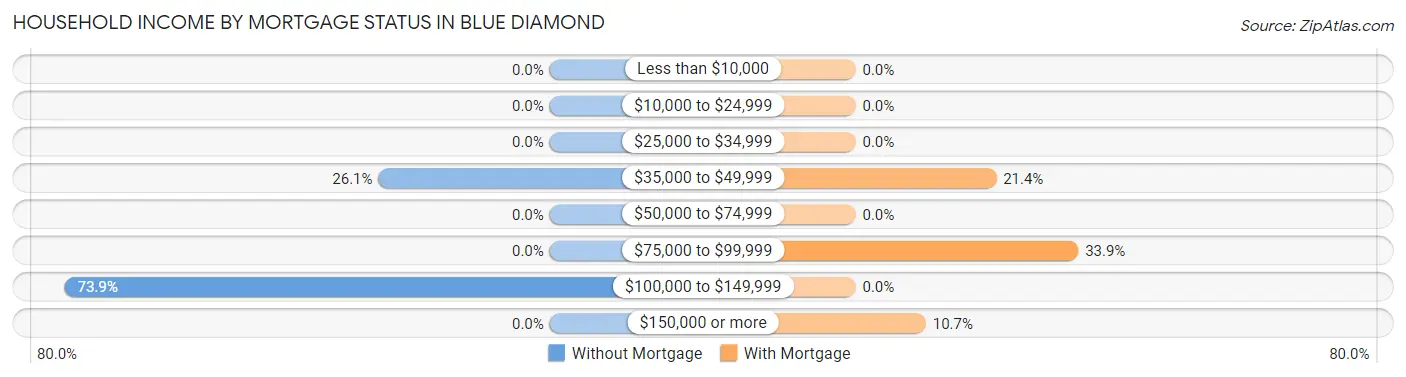
| Household Income | Without Mortgage | With Mortgage |
| Less than $10,000 | 0 (0.0%) | 0 (0.0%) |
| $10,000 to $24,999 | 0 (0.0%) | 0 (0.0%) |
| $25,000 to $34,999 | 0 (0.0%) | 0 (0.0%) |
| $35,000 to $49,999 | 6 (26.1%) | 12 (21.4%) |
| $50,000 to $74,999 | 0 (0.0%) | 0 (0.0%) |
| $75,000 to $99,999 | 0 (0.0%) | 19 (33.9%) |
| $100,000 to $149,999 | 17 (73.9%) | 0 (0.0%) |
| $150,000 or more | 0 (0.0%) | 6 (10.7%) |
| Total | 23 (100.0%) | 56 (100.0%) |
Property Value to Household Income Ratio in Blue Diamond
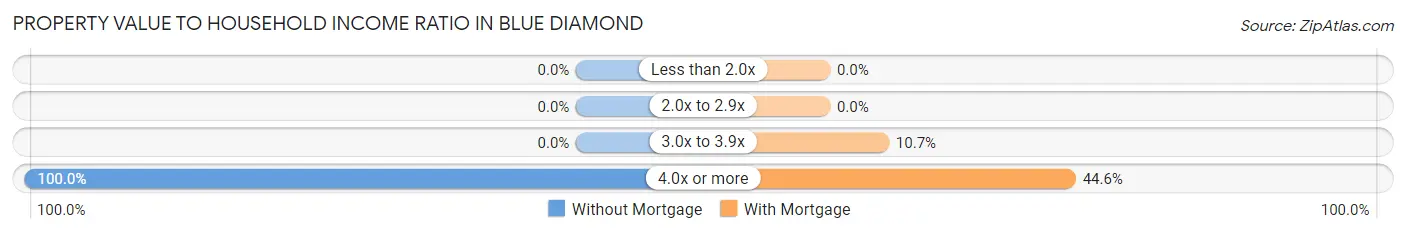
| Value-to-Income Ratio | Without Mortgage | With Mortgage |
| Less than 2.0x | 0 (0.0%) | 0 (0.0%) |
| 2.0x to 2.9x | 0 (0.0%) | 0 (0.0%) |
| 3.0x to 3.9x | 0 (0.0%) | 6 (10.7%) |
| 4.0x or more | 23 (100.0%) | 25 (44.6%) |
| Total | 23 (100.0%) | 56 (100.0%) |
Real Estate Taxes by Mortgage Status in Blue Diamond
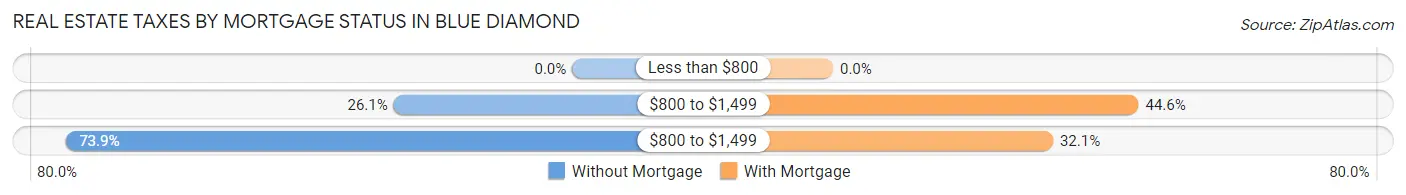
| Property Taxes | Without Mortgage | With Mortgage |
| Less than $800 | 0 (0.0%) | 0 (0.0%) |
| $800 to $1,499 | 6 (26.1%) | 25 (44.6%) |
| $800 to $1,499 | 17 (73.9%) | 18 (32.1%) |
| Total | 23 (100.0%) | 56 (100.0%) |
Health & Disability in Blue Diamond
Health Insurance Coverage by Age in Blue Diamond
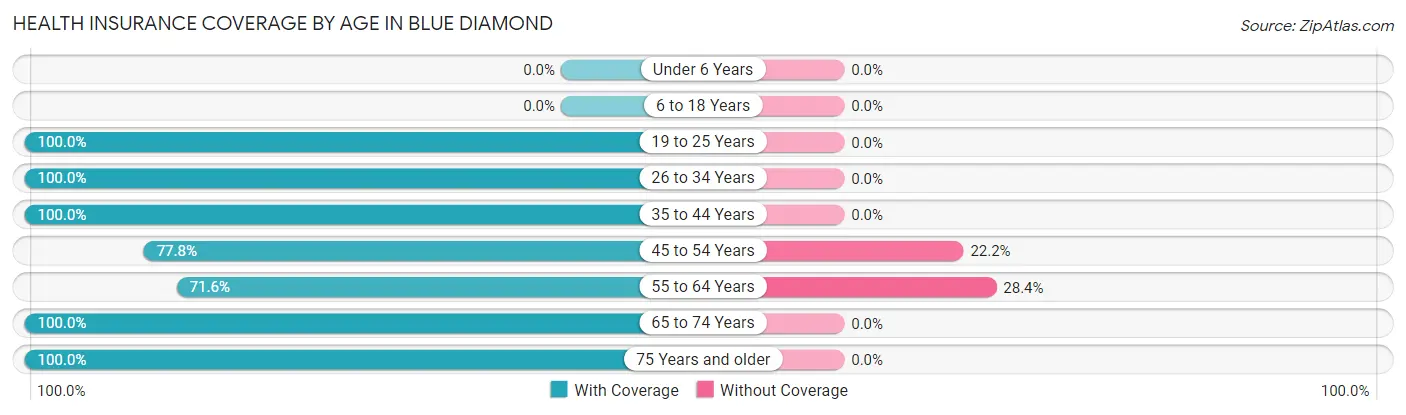
| Age Bracket | With Coverage | Without Coverage |
| Under 6 Years | 0 (0.0%) | 0 (0.0%) |
| 6 to 18 Years | 0 (0.0%) | 0 (0.0%) |
| 19 to 25 Years | 20 (100.0%) | 0 (0.0%) |
| 26 to 34 Years | 12 (100.0%) | 0 (0.0%) |
| 35 to 44 Years | 49 (100.0%) | 0 (0.0%) |
| 45 to 54 Years | 63 (77.8%) | 18 (22.2%) |
| 55 to 64 Years | 48 (71.6%) | 19 (28.4%) |
| 65 to 74 Years | 12 (100.0%) | 0 (0.0%) |
| 75 Years and older | 6 (100.0%) | 0 (0.0%) |
| Total | 210 (85.0%) | 37 (15.0%) |
Health Insurance Coverage by Citizenship Status in Blue Diamond
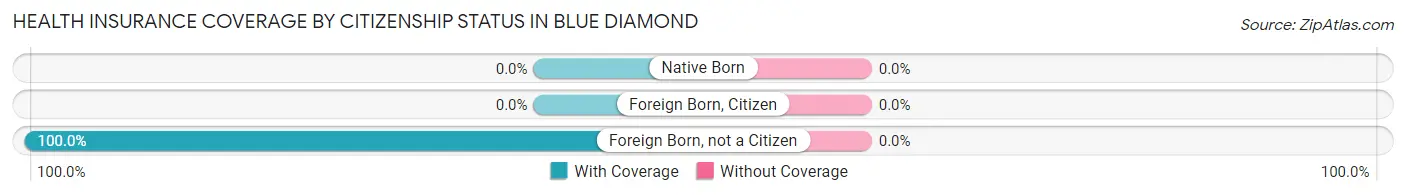
| Citizenship Status | With Coverage | Without Coverage |
| Native Born | 0 (0.0%) | 0 (0.0%) |
| Foreign Born, Citizen | 0 (0.0%) | 0 (0.0%) |
| Foreign Born, not a Citizen | 20 (100.0%) | 0 (0.0%) |
Health Insurance Coverage by Household Income in Blue Diamond
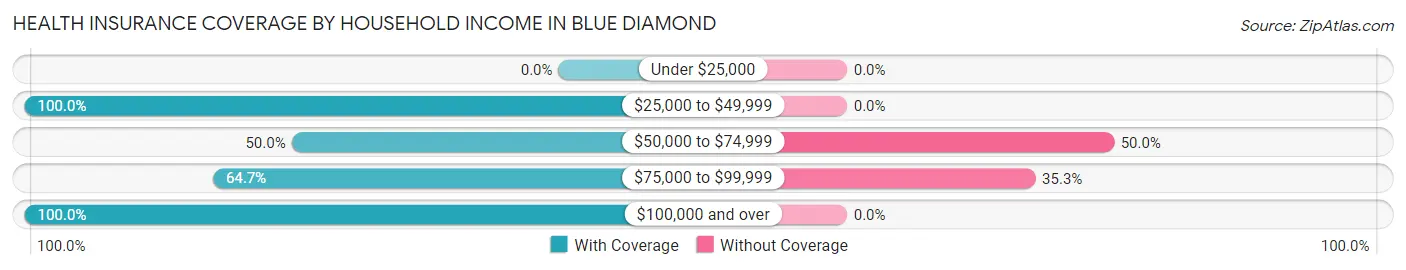
| Household Income | With Coverage | Without Coverage |
| Under $25,000 | 0 (0.0%) | 0 (0.0%) |
| $25,000 to $49,999 | 40 (100.0%) | 0 (0.0%) |
| $50,000 to $74,999 | 19 (50.0%) | 19 (50.0%) |
| $75,000 to $99,999 | 33 (64.7%) | 18 (35.3%) |
| $100,000 and over | 118 (100.0%) | 0 (0.0%) |
Public vs Private Health Insurance Coverage by Age in Blue Diamond
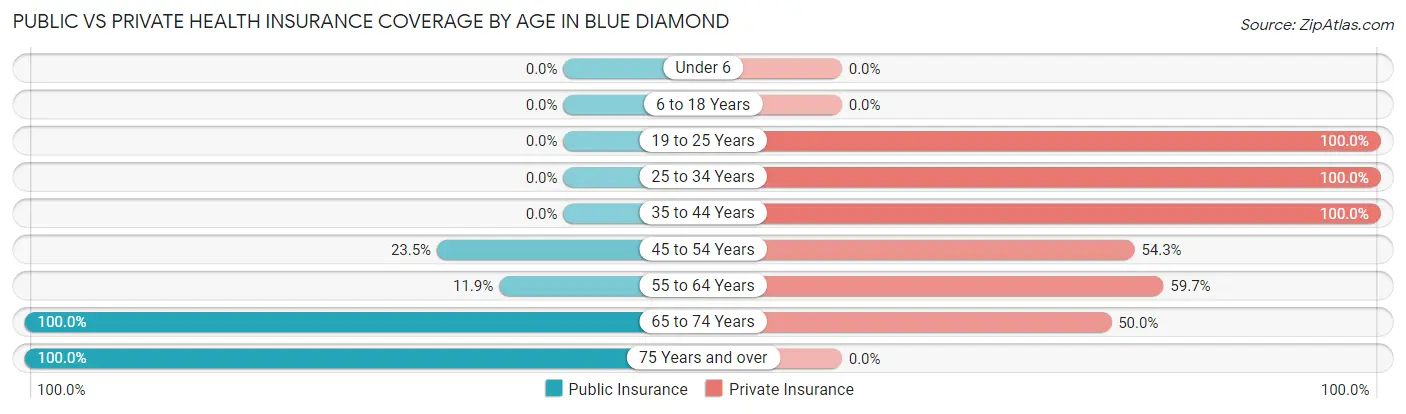
| Age Bracket | Public Insurance | Private Insurance |
| Under 6 | 0 (0.0%) | 0 (0.0%) |
| 6 to 18 Years | 0 (0.0%) | 0 (0.0%) |
| 19 to 25 Years | 0 (0.0%) | 20 (100.0%) |
| 25 to 34 Years | 0 (0.0%) | 12 (100.0%) |
| 35 to 44 Years | 0 (0.0%) | 49 (100.0%) |
| 45 to 54 Years | 19 (23.5%) | 44 (54.3%) |
| 55 to 64 Years | 8 (11.9%) | 40 (59.7%) |
| 65 to 74 Years | 12 (100.0%) | 6 (50.0%) |
| 75 Years and over | 6 (100.0%) | 0 (0.0%) |
| Total | 45 (18.2%) | 171 (69.2%) |
Disability Status by Sex by Age in Blue Diamond
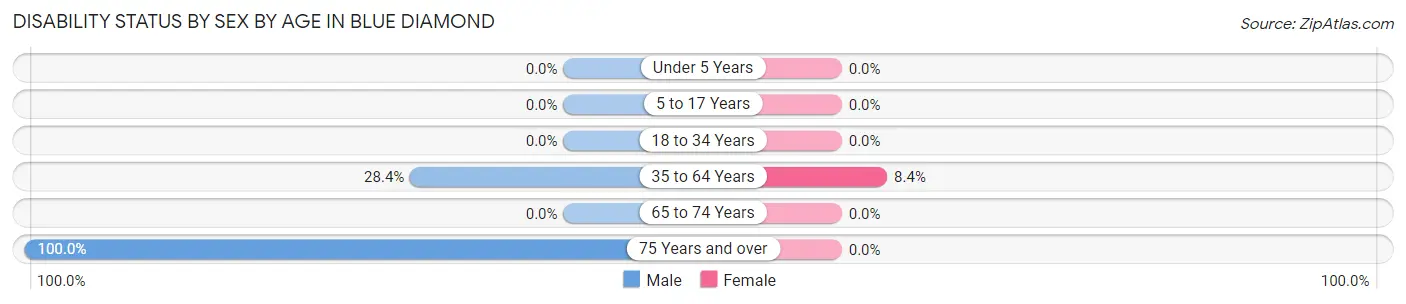
| Age Bracket | Male | Female |
| Under 5 Years | 0 (0.0%) | 0 (0.0%) |
| 5 to 17 Years | 0 (0.0%) | 0 (0.0%) |
| 18 to 34 Years | 0 (0.0%) | 0 (0.0%) |
| 35 to 64 Years | 29 (28.4%) | 8 (8.4%) |
| 65 to 74 Years | 0 (0.0%) | 0 (0.0%) |
| 75 Years and over | 6 (100.0%) | 0 (0.0%) |
Disability Class by Sex by Age in Blue Diamond
Disability Class: Hearing Difficulty
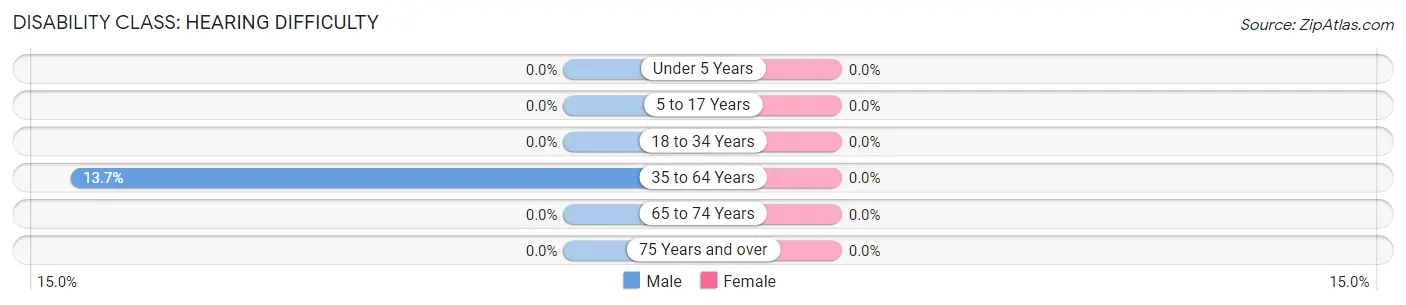
| Age Bracket | Male | Female |
| Under 5 Years | 0 (0.0%) | 0 (0.0%) |
| 5 to 17 Years | 0 (0.0%) | 0 (0.0%) |
| 18 to 34 Years | 0 (0.0%) | 0 (0.0%) |
| 35 to 64 Years | 14 (13.7%) | 0 (0.0%) |
| 65 to 74 Years | 0 (0.0%) | 0 (0.0%) |
| 75 Years and over | 0 (0.0%) | 0 (0.0%) |
Disability Class: Vision Difficulty
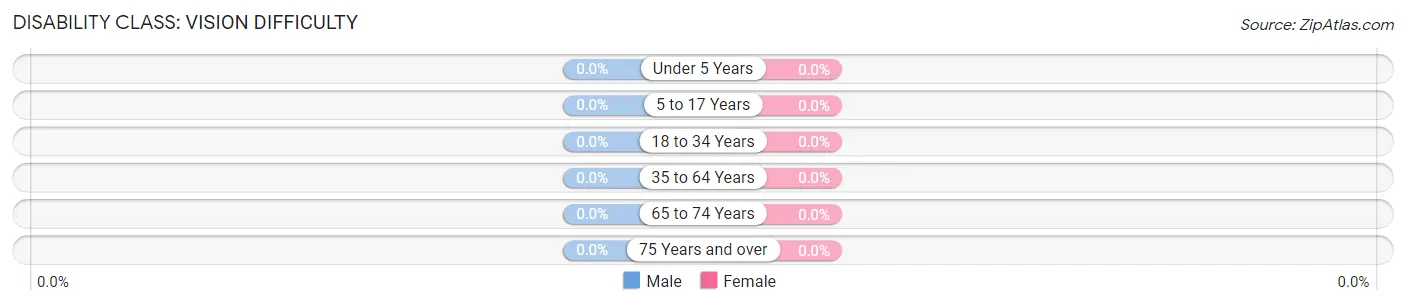
| Age Bracket | Male | Female |
| Under 5 Years | 0 (0.0%) | 0 (0.0%) |
| 5 to 17 Years | 0 (0.0%) | 0 (0.0%) |
| 18 to 34 Years | 0 (0.0%) | 0 (0.0%) |
| 35 to 64 Years | 0 (0.0%) | 0 (0.0%) |
| 65 to 74 Years | 0 (0.0%) | 0 (0.0%) |
| 75 Years and over | 0 (0.0%) | 0 (0.0%) |
Disability Class: Cognitive Difficulty
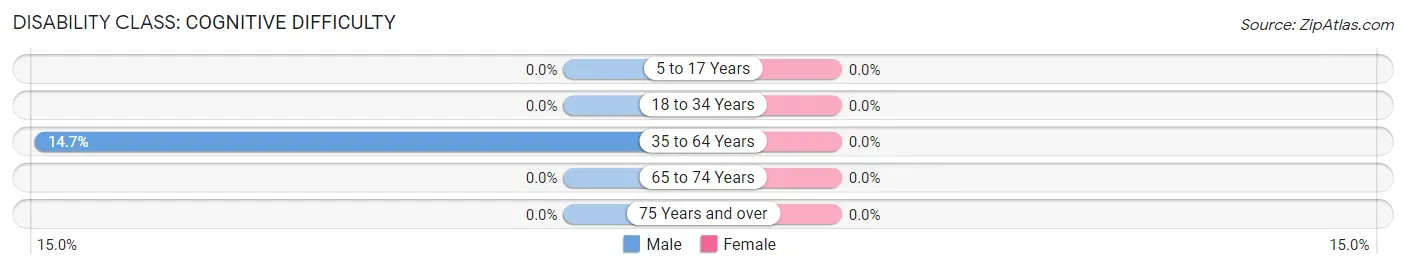
| Age Bracket | Male | Female |
| 5 to 17 Years | 0 (0.0%) | 0 (0.0%) |
| 18 to 34 Years | 0 (0.0%) | 0 (0.0%) |
| 35 to 64 Years | 15 (14.7%) | 0 (0.0%) |
| 65 to 74 Years | 0 (0.0%) | 0 (0.0%) |
| 75 Years and over | 0 (0.0%) | 0 (0.0%) |
Disability Class: Ambulatory Difficulty
| Age Bracket | Male | Female |
| 5 to 17 Years | 0 (0.0%) | 0 (0.0%) |
| 18 to 34 Years | 0 (0.0%) | 0 (0.0%) |
| 35 to 64 Years | 0 (0.0%) | 8 (8.4%) |
| 65 to 74 Years | 0 (0.0%) | 0 (0.0%) |
| 75 Years and over | 6 (100.0%) | 0 (0.0%) |
Disability Class: Self-Care Difficulty
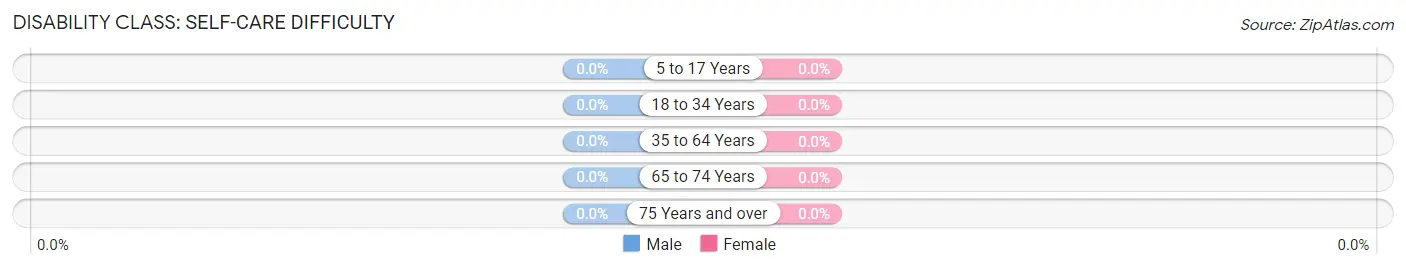
| Age Bracket | Male | Female |
| 5 to 17 Years | 0 (0.0%) | 0 (0.0%) |
| 18 to 34 Years | 0 (0.0%) | 0 (0.0%) |
| 35 to 64 Years | 0 (0.0%) | 0 (0.0%) |
| 65 to 74 Years | 0 (0.0%) | 0 (0.0%) |
| 75 Years and over | 0 (0.0%) | 0 (0.0%) |
Technology Access in Blue Diamond
Computing Device Access in Blue Diamond
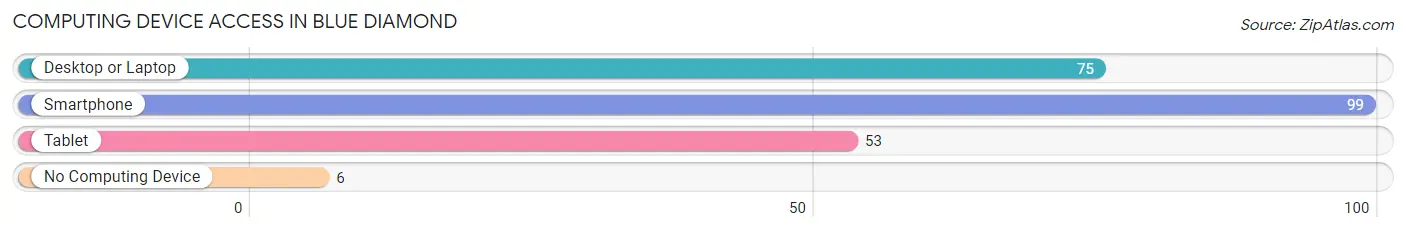
| Device Type | # Households | % Households |
| Desktop or Laptop | 75 | 67.6% |
| Smartphone | 99 | 89.2% |
| Tablet | 53 | 47.7% |
| No Computing Device | 6 | 5.4% |
| Total | 111 | 100.0% |
Internet Access in Blue Diamond
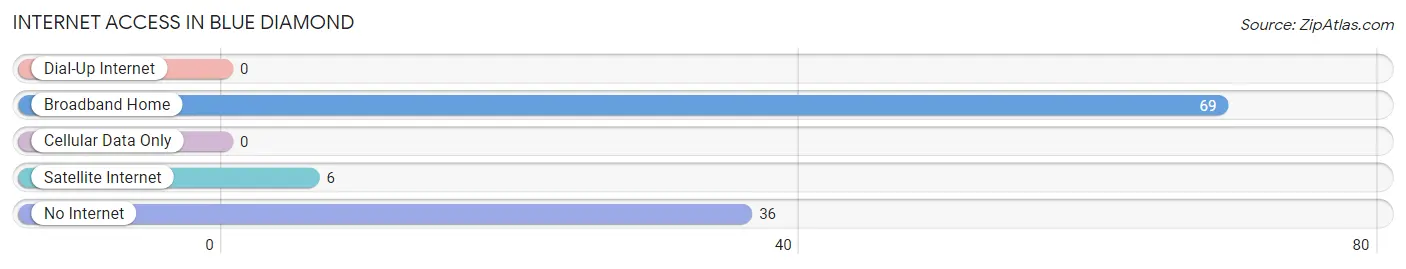
| Internet Type | # Households | % Households |
| Dial-Up Internet | 0 | 0.0% |
| Broadband Home | 69 | 62.2% |
| Cellular Data Only | 0 | 0.0% |
| Satellite Internet | 6 | 5.4% |
| No Internet | 36 | 32.4% |
| Total | 111 | 100.0% |
Blue Diamond Summary
Diamond, Nevada is a small unincorporated community located in Clark County, Nevada. It is situated in the Mojave Desert, approximately 25 miles south of Las Vegas. The town is named after the nearby Blue Diamond Hill, which is a prominent feature in the area. The population of Blue Diamond was estimated to be around 300 people in 2020.
Geography
Blue Diamond is located in the Mojave Desert, at an elevation of 2,890 feet. The town is situated on the eastern side of the Spring Mountains, which are part of the larger Mojave Desert. The area is characterized by its dry climate, with temperatures ranging from the mid-90s in the summer to the mid-50s in the winter. The town is located near the Red Rock Canyon National Conservation Area, which is a popular destination for hikers and rock climbers.
Economy
The economy of Blue Diamond is largely based on tourism. The town is home to several resorts and hotels, as well as a variety of restaurants and shops. The town is also home to a number of wineries, which produce a variety of wines. Additionally, the town is home to a number of small businesses, such as auto repair shops and convenience stores.
Demographics
The population of Blue Diamond was estimated to be around 300 people in 2020. The town is predominantly white, with a small Hispanic population. The median household income in Blue Diamond is $50,000, which is slightly lower than the national average. The town has a high rate of homeownership, with nearly 80% of residents owning their own homes.
History
Blue Diamond was first settled in the late 19th century by miners who were searching for gold and silver. The town was officially established in 1908, and the first post office was opened in 1909. The town was named after the nearby Blue Diamond Hill, which is a prominent feature in the area. The town grew steadily throughout the 20th century, and by the 1950s, it had become a popular tourist destination.
In the late 20th century, the town began to experience a decline in population as people moved away to larger cities. However, in recent years, the town has seen a resurgence in popularity due to its proximity to Las Vegas and its natural beauty. Today, Blue Diamond is a popular destination for tourists and locals alike, and it is home to a variety of resorts, restaurants, and shops.
Common Questions
What is Per Capita Income in Blue Diamond?
Per Capita income in Blue Diamond is $47,884.
What is the Median Family Income in Blue Diamond?
Median Family Income in Blue Diamond is $145,956.
What is the Median Household income in Blue Diamond?
Median Household Income in Blue Diamond is $81,023.
What is Inequality or Gini Index in Blue Diamond?
Inequality or Gini Index in Blue Diamond is 0.31.
What is the Total Population of Blue Diamond?
Total Population of Blue Diamond is 247.
What is the Total Male Population of Blue Diamond?
Total Male Population of Blue Diamond is 140.
What is the Total Female Population of Blue Diamond?
Total Female Population of Blue Diamond is 107.
What is the Ratio of Males per 100 Females in Blue Diamond?
There are 130.84 Males per 100 Females in Blue Diamond.
What is the Ratio of Females per 100 Males in Blue Diamond?
There are 76.43 Females per 100 Males in Blue Diamond.
What is the Median Population Age in Blue Diamond?
Median Population Age in Blue Diamond is 50.7 Years.
What is the Average Family Size in Blue Diamond
Average Family Size in Blue Diamond is 2.5 People.
What is the Average Household Size in Blue Diamond
Average Household Size in Blue Diamond is 2.2 People.
How Large is the Labor Force in Blue Diamond?
There are 169 People in the Labor Forcein in Blue Diamond.
What is the Percentage of People in the Labor Force in Blue Diamond?
68.4% of People are in the Labor Force in Blue Diamond.
What is the Unemployment Rate in Blue Diamond?
Unemployment Rate in Blue Diamond is 14.8%.