Benton City, WA Map & Demographics
Benton City Map
Benton City Overview
$21,319
PER CAPITA INCOME
$65,000
AVG FAMILY INCOME
$51,558
AVG HOUSEHOLD INCOME
41.4%
WAGE / INCOME GAP [ % ]
58.6¢/ $1
WAGE / INCOME GAP [ $ ]
0.40
INEQUALITY / GINI INDEX
3,498
TOTAL POPULATION
1,688
MALE POPULATION
1,810
FEMALE POPULATION
93.26
MALES / 100 FEMALES
107.23
FEMALES / 100 MALES
29.1
MEDIAN AGE
3.4
AVG FAMILY SIZE
2.7
AVG HOUSEHOLD SIZE
1,284
LABOR FORCE [ PEOPLE ]
52.5%
PERCENT IN LABOR FORCE
5.3%
UNEMPLOYMENT RATE
Benton City Zip Codes
Benton City Area Codes
Income in Benton City
Income Overview in Benton City
Per Capita Income in Benton City is $21,319, while median incomes of families and households are $65,000 and $51,558 respectively.
| Characteristic | Number | Measure |
| Per Capita Income | 3,498 | $21,319 |
| Median Family Income | 810 | $65,000 |
| Mean Family Income | 810 | $66,700 |
| Median Household Income | 1,310 | $51,558 |
| Mean Household Income | 1,310 | $58,192 |
| Income Deficit | 810 | $0 |
| Wage / Income Gap (%) | 3,498 | 41.36% |
| Wage / Income Gap ($) | 3,498 | 58.64¢ per $1 |
| Gini / Inequality Index | 3,498 | 0.40 |
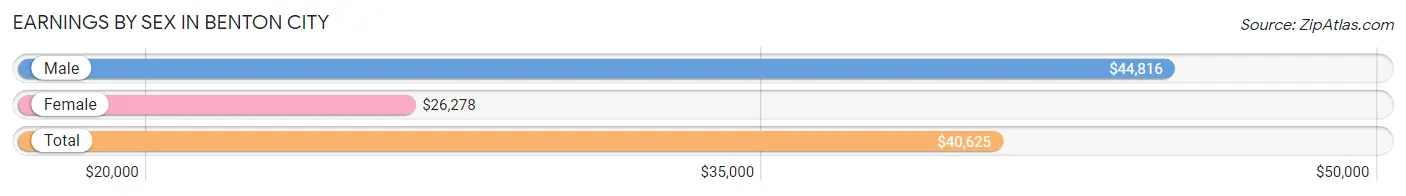
Earnings by Sex in Benton City
Average Earnings in Benton City are $40,625, $44,816 for men and $26,278 for women, a difference of 41.4%.
| Sex | Number | Average Earnings |
| Male | 715 (54.5%) | $44,816 |
| Female | 598 (45.5%) | $26,278 |
| Total | 1,313 (100.0%) | $40,625 |
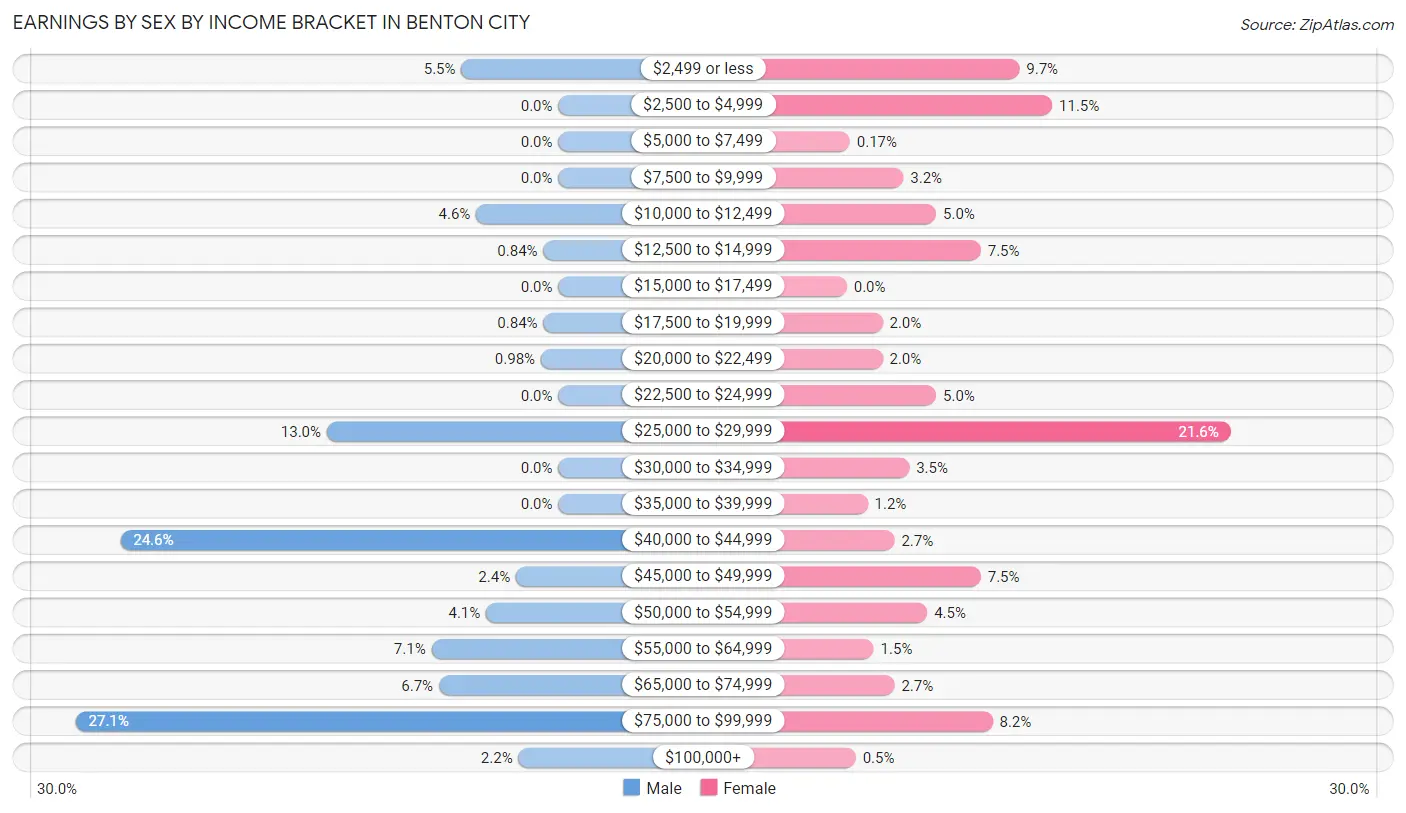
Earnings by Sex by Income Bracket in Benton City
The most common earnings brackets in Benton City are $75,000 to $99,999 for men (194 | 27.1%) and $25,000 to $29,999 for women (129 | 21.6%).
| Income | Male | Female |
| $2,499 or less | 39 (5.4%) | 58 (9.7%) |
| $2,500 to $4,999 | 0 (0.0%) | 69 (11.5%) |
| $5,000 to $7,499 | 0 (0.0%) | 1 (0.2%) |
| $7,500 to $9,999 | 0 (0.0%) | 19 (3.2%) |
| $10,000 to $12,499 | 33 (4.6%) | 30 (5.0%) |
| $12,500 to $14,999 | 6 (0.8%) | 45 (7.5%) |
| $15,000 to $17,499 | 0 (0.0%) | 0 (0.0%) |
| $17,500 to $19,999 | 6 (0.8%) | 12 (2.0%) |
| $20,000 to $22,499 | 7 (1.0%) | 12 (2.0%) |
| $22,500 to $24,999 | 0 (0.0%) | 30 (5.0%) |
| $25,000 to $29,999 | 93 (13.0%) | 129 (21.6%) |
| $30,000 to $34,999 | 0 (0.0%) | 21 (3.5%) |
| $35,000 to $39,999 | 0 (0.0%) | 7 (1.2%) |
| $40,000 to $44,999 | 176 (24.6%) | 16 (2.7%) |
| $45,000 to $49,999 | 17 (2.4%) | 45 (7.5%) |
| $50,000 to $54,999 | 29 (4.1%) | 27 (4.5%) |
| $55,000 to $64,999 | 51 (7.1%) | 9 (1.5%) |
| $65,000 to $74,999 | 48 (6.7%) | 16 (2.7%) |
| $75,000 to $99,999 | 194 (27.1%) | 49 (8.2%) |
| $100,000+ | 16 (2.2%) | 3 (0.5%) |
| Total | 715 (100.0%) | 598 (100.0%) |
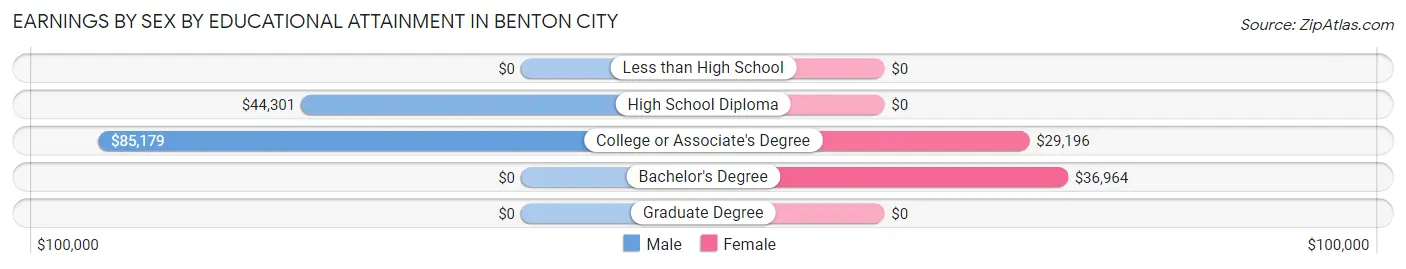
Earnings by Sex by Educational Attainment in Benton City
Average earnings in Benton City are $44,449 for men and $28,155 for women, a difference of 36.7%. Men with an educational attainment of college or associate's degree enjoy the highest average annual earnings of $85,179, while those with high school diploma education earn the least with $44,301. Women with an educational attainment of bachelor's degree earn the most with the average annual earnings of $36,964, while those with college or associate's degree education have the smallest earnings of $29,196.
| Educational Attainment | Male Income | Female Income |
| Less than High School | - | - |
| High School Diploma | $44,301 | $0 |
| College or Associate's Degree | $85,179 | $29,196 |
| Bachelor's Degree | - | - |
| Graduate Degree | - | - |
| Total | $44,449 | $28,155 |
Family Income in Benton City
Family Income Brackets in Benton City
According to the Benton City family income data, there are 214 families falling into the $50,000 to $74,999 income range, which is the most common income bracket and makes up 26.4% of all families.
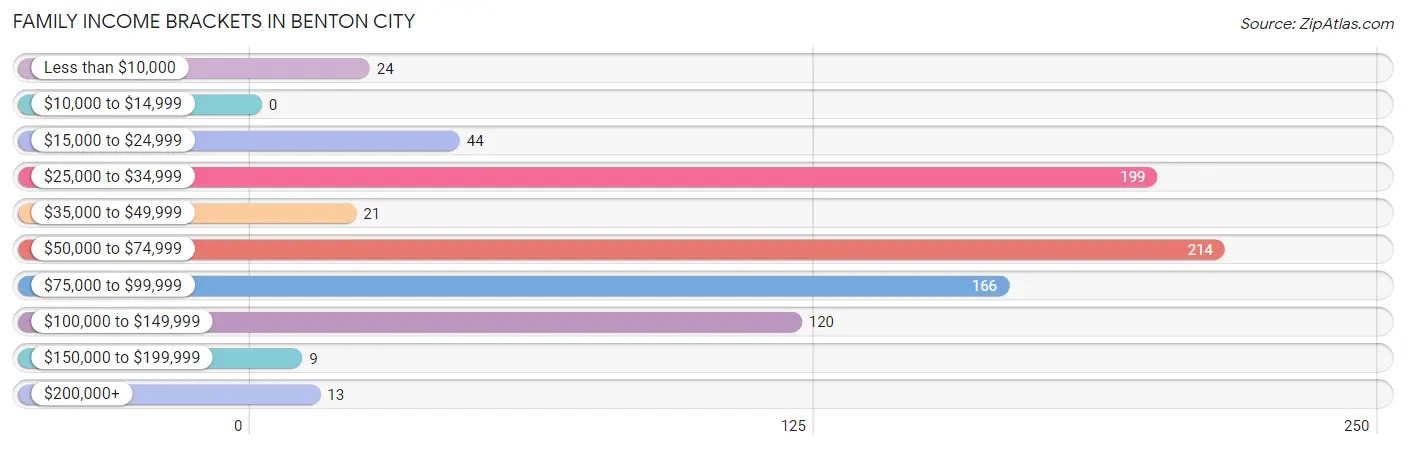
| Income Bracket | # Families | % Families |
| Less than $10,000 | 24 | 3.0% |
| $10,000 to $14,999 | 0 | 0.0% |
| $15,000 to $24,999 | 44 | 5.4% |
| $25,000 to $34,999 | 199 | 24.6% |
| $35,000 to $49,999 | 21 | 2.6% |
| $50,000 to $74,999 | 214 | 26.4% |
| $75,000 to $99,999 | 166 | 20.5% |
| $100,000 to $149,999 | 120 | 14.8% |
| $150,000 to $199,999 | 9 | 1.1% |
| $200,000+ | 13 | 1.6% |
Family Income by Famaliy Size in Benton City
6-person families (124 | 15.3%) account for the highest median family income in Benton City with $114,167 per family, while 2-person families (352 | 43.5%) have the highest median income of $28,978 per family member.
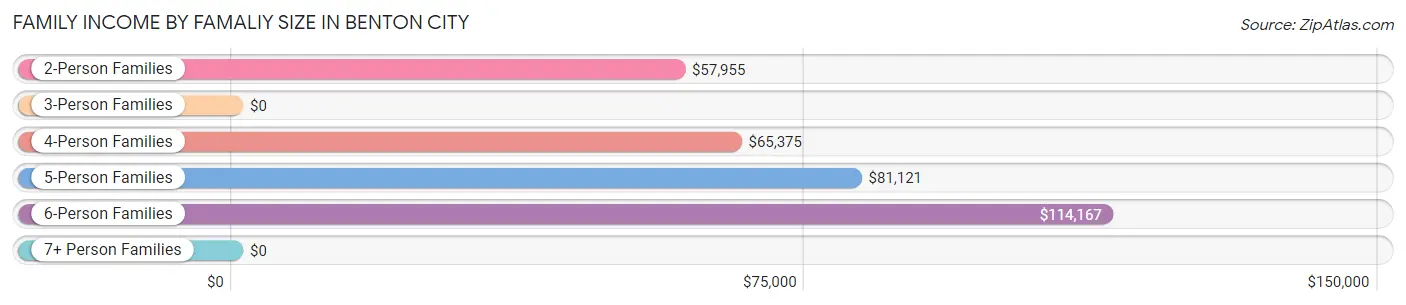
| Income Bracket | # Families | Median Income |
| 2-Person Families | 352 (43.5%) | $57,955 |
| 3-Person Families | 176 (21.7%) | $0 |
| 4-Person Families | 65 (8.0%) | $65,375 |
| 5-Person Families | 78 (9.6%) | $81,121 |
| 6-Person Families | 124 (15.3%) | $114,167 |
| 7+ Person Families | 15 (1.8%) | $0 |
| Total | 810 (100.0%) | $65,000 |
Family Income by Number of Earners in Benton City
The median family income in Benton City is $65,000, with families comprising 3+ earners (23) having the highest median family income of $222,788, while families with 1 earner (450) have the lowest median family income of $32,021, accounting for 2.8% and 55.6% of families, respectively.
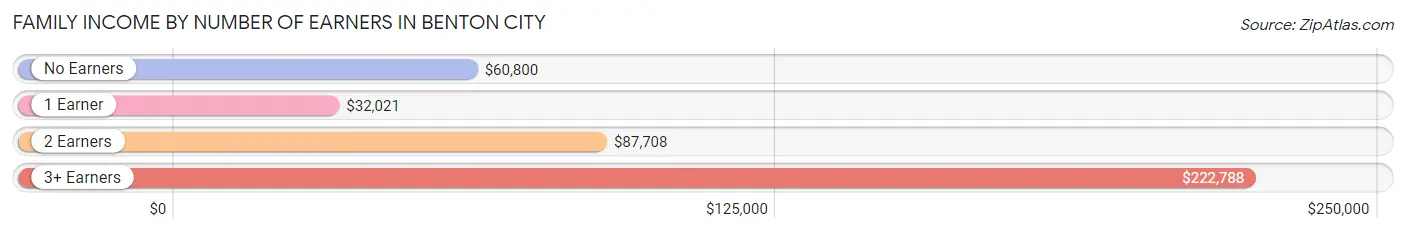
| Number of Earners | # Families | Median Income |
| No Earners | 92 (11.4%) | $60,800 |
| 1 Earner | 450 (55.6%) | $32,021 |
| 2 Earners | 245 (30.2%) | $87,708 |
| 3+ Earners | 23 (2.8%) | $222,788 |
| Total | 810 (100.0%) | $65,000 |
Household Income in Benton City
Household Income Brackets in Benton City
With 288 households falling in the category, the $50,000 to $74,999 income range is the most frequent in Benton City, accounting for 22.0% of all households. In contrast, only 4 households (0.3%) fall into the $150,000 to $199,999 income bracket, making it the least populous group.
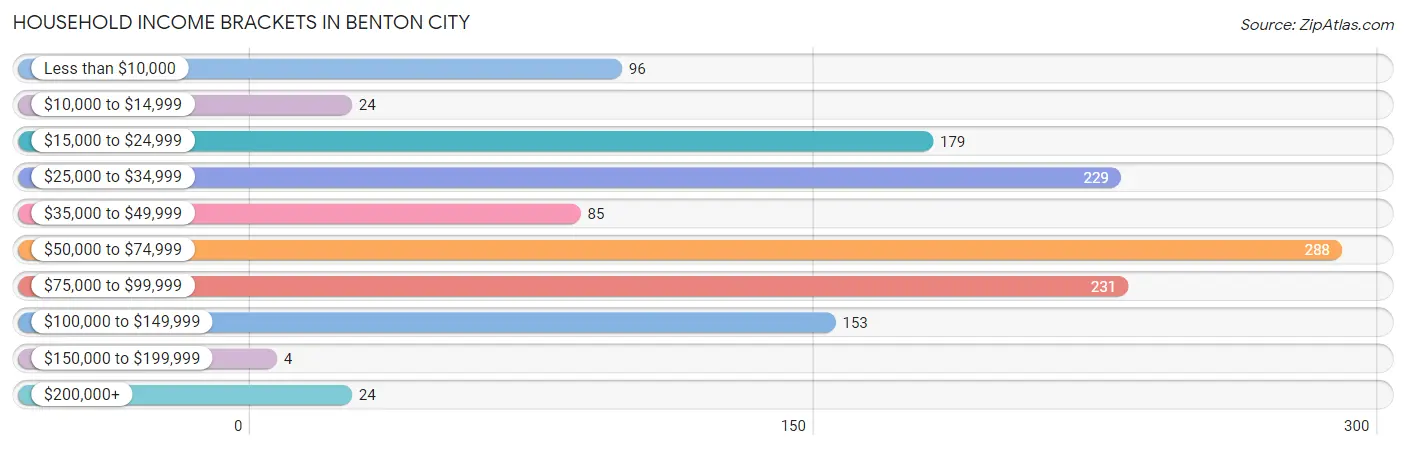
| Income Bracket | # Households | % Households |
| Less than $10,000 | 96 | 7.3% |
| $10,000 to $14,999 | 24 | 1.8% |
| $15,000 to $24,999 | 179 | 13.7% |
| $25,000 to $34,999 | 229 | 17.5% |
| $35,000 to $49,999 | 85 | 6.5% |
| $50,000 to $74,999 | 288 | 22.0% |
| $75,000 to $99,999 | 231 | 17.6% |
| $100,000 to $149,999 | 153 | 11.7% |
| $150,000 to $199,999 | 4 | 0.3% |
| $200,000+ | 24 | 1.8% |
Household Income by Householder Age in Benton City
The median household income in Benton City is $51,558, with the highest median household income of $65,722 found in the 45 to 64 years age bracket for the primary householder. A total of 364 households (27.8%) fall into this category. Meanwhile, the 65+ years age bracket for the primary householder has the lowest median household income of $23,810, with 334 households (25.5%) in this group.
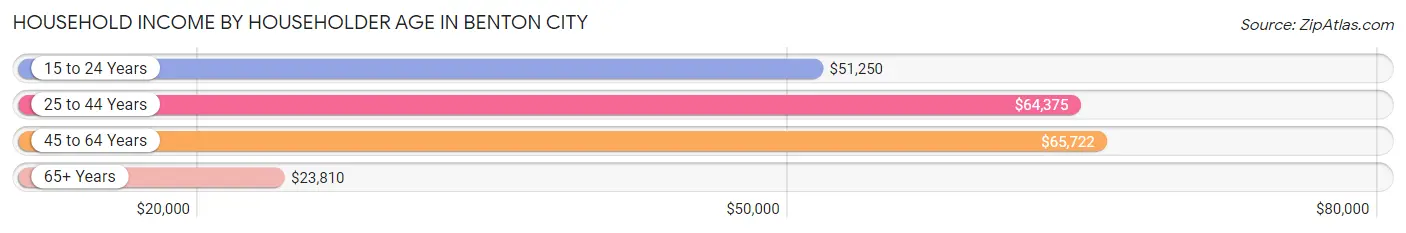
| Income Bracket | # Households | Median Income |
| 15 to 24 Years | 80 (6.1%) | $51,250 |
| 25 to 44 Years | 532 (40.6%) | $64,375 |
| 45 to 64 Years | 364 (27.8%) | $65,722 |
| 65+ Years | 334 (25.5%) | $23,810 |
| Total | 1,310 (100.0%) | $51,558 |
Poverty in Benton City
Income Below Poverty by Sex and Age in Benton City
With 13.9% poverty level for males and 19.0% for females among the residents of Benton City, 6 to 11 year old males and 18 to 24 year old females are the most vulnerable to poverty, with 84 males (37.8%) and 92 females (41.1%) in their respective age groups living below the poverty level.
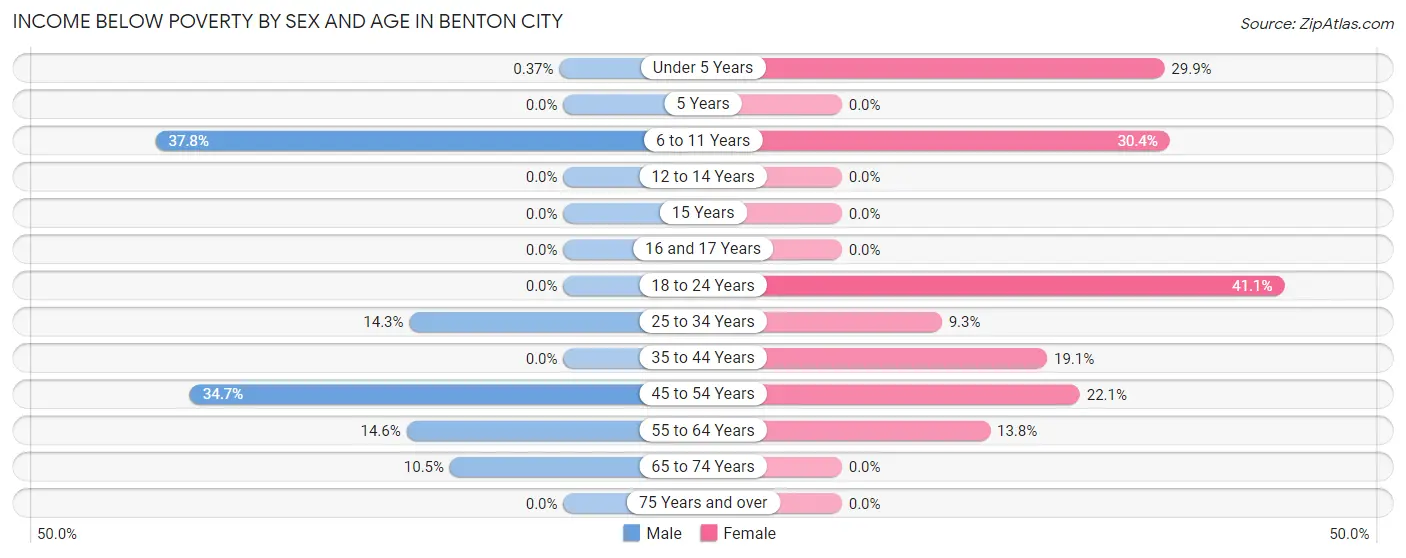
| Age Bracket | Male | Female |
| Under 5 Years | 1 (0.4%) | 97 (29.9%) |
| 5 Years | 0 (0.0%) | 0 (0.0%) |
| 6 to 11 Years | 84 (37.8%) | 35 (30.4%) |
| 12 to 14 Years | 0 (0.0%) | 0 (0.0%) |
| 15 Years | 0 (0.0%) | 0 (0.0%) |
| 16 and 17 Years | 0 (0.0%) | 0 (0.0%) |
| 18 to 24 Years | 0 (0.0%) | 92 (41.1%) |
| 25 to 34 Years | 54 (14.3%) | 29 (9.3%) |
| 35 to 44 Years | 0 (0.0%) | 24 (19.1%) |
| 45 to 54 Years | 61 (34.7%) | 36 (22.1%) |
| 55 to 64 Years | 16 (14.5%) | 30 (13.8%) |
| 65 to 74 Years | 18 (10.5%) | 0 (0.0%) |
| 75 Years and over | 0 (0.0%) | 0 (0.0%) |
| Total | 234 (13.9%) | 343 (19.0%) |
Income Above Poverty by Sex and Age in Benton City
According to the poverty statistics in Benton City, males aged 12 to 14 years and females aged 5 years are the age groups that are most secure financially, with 100.0% of males and 100.0% of females in these age groups living above the poverty line.
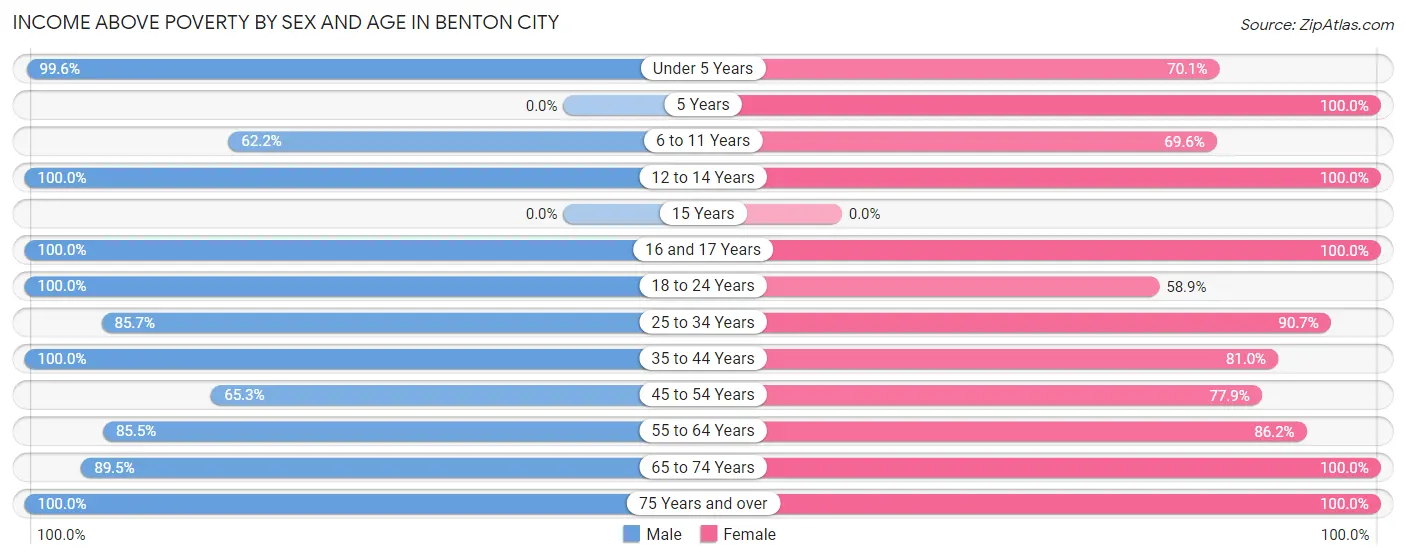
| Age Bracket | Male | Female |
| Under 5 Years | 270 (99.6%) | 227 (70.1%) |
| 5 Years | 0 (0.0%) | 84 (100.0%) |
| 6 to 11 Years | 138 (62.2%) | 80 (69.6%) |
| 12 to 14 Years | 20 (100.0%) | 17 (100.0%) |
| 15 Years | 0 (0.0%) | 0 (0.0%) |
| 16 and 17 Years | 5 (100.0%) | 29 (100.0%) |
| 18 to 24 Years | 92 (100.0%) | 132 (58.9%) |
| 25 to 34 Years | 324 (85.7%) | 284 (90.7%) |
| 35 to 44 Years | 190 (100.0%) | 102 (80.9%) |
| 45 to 54 Years | 115 (65.3%) | 127 (77.9%) |
| 55 to 64 Years | 94 (85.5%) | 188 (86.2%) |
| 65 to 74 Years | 153 (89.5%) | 133 (100.0%) |
| 75 Years and over | 53 (100.0%) | 64 (100.0%) |
| Total | 1,454 (86.1%) | 1,467 (81.0%) |
Income Below Poverty Among Married-Couple Families in Benton City
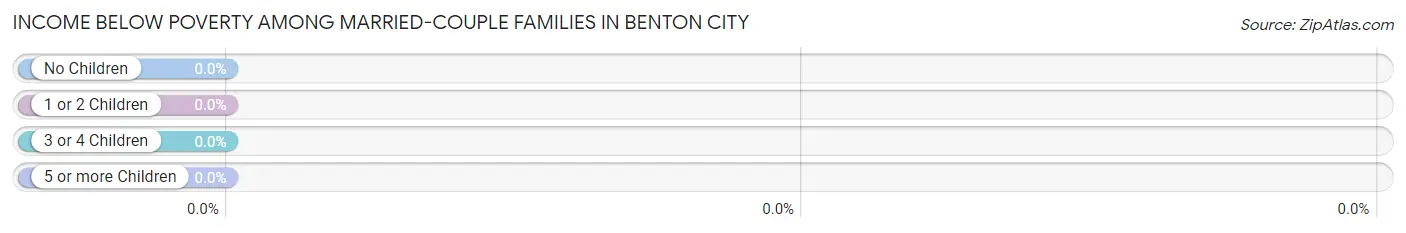
| Children | Above Poverty | Below Poverty |
| No Children | 303 (100.0%) | 0 (0.0%) |
| 1 or 2 Children | 128 (100.0%) | 0 (0.0%) |
| 3 or 4 Children | 156 (100.0%) | 0 (0.0%) |
| 5 or more Children | 0 (0.0%) | 0 (0.0%) |
| Total | 587 (100.0%) | 0 (0.0%) |
Income Below Poverty Among Single-Parent Households in Benton City
According to the poverty data in Benton City, 1.2% or 1 single-father households and 37.3% or 53 single-mother households are living below the poverty line. Among single-father households, those with 3 or 4 children have the highest poverty rate, with 1 households (100.0%) experiencing poverty. Likewise, among single-mother households, those with 3 or 4 children have the highest poverty rate, with 53 households (96.4%) falling below the poverty line.
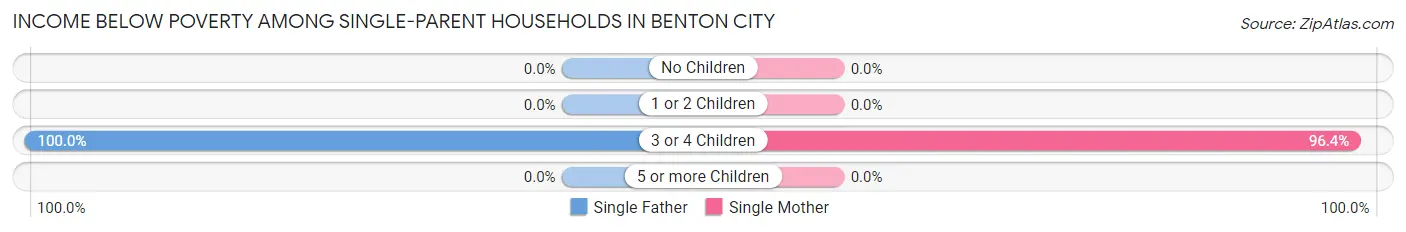
| Children | Single Father | Single Mother |
| No Children | 0 (0.0%) | 0 (0.0%) |
| 1 or 2 Children | 0 (0.0%) | 0 (0.0%) |
| 3 or 4 Children | 1 (100.0%) | 53 (96.4%) |
| 5 or more Children | 0 (0.0%) | 0 (0.0%) |
| Total | 1 (1.2%) | 53 (37.3%) |
Income Below Poverty Among Married-Couple vs Single-Parent Households in Benton City
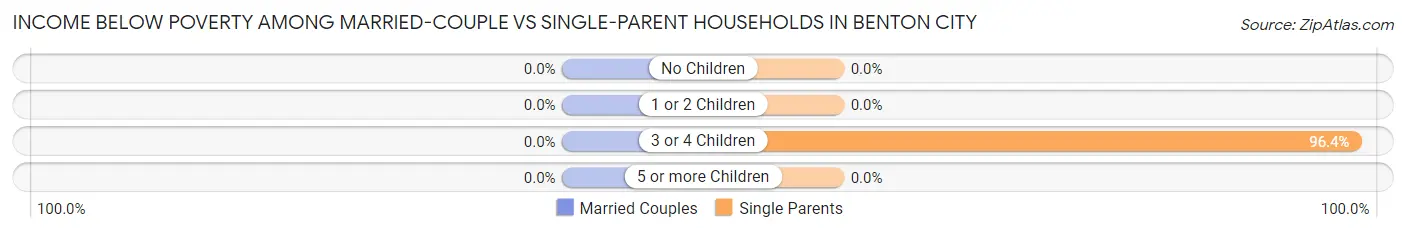
| Children | Married-Couple Families | Single-Parent Households |
| No Children | 0 (0.0%) | 0 (0.0%) |
| 1 or 2 Children | 0 (0.0%) | 0 (0.0%) |
| 3 or 4 Children | 0 (0.0%) | 54 (96.4%) |
| 5 or more Children | 0 (0.0%) | 0 (0.0%) |
| Total | 0 (0.0%) | 54 (24.2%) |
Race in Benton City
The most populous races in Benton City are White / Caucasian (2,320 | 66.3%), Hispanic or Latino (1,503 | 43.0%), and Some other Race (641 | 18.3%).
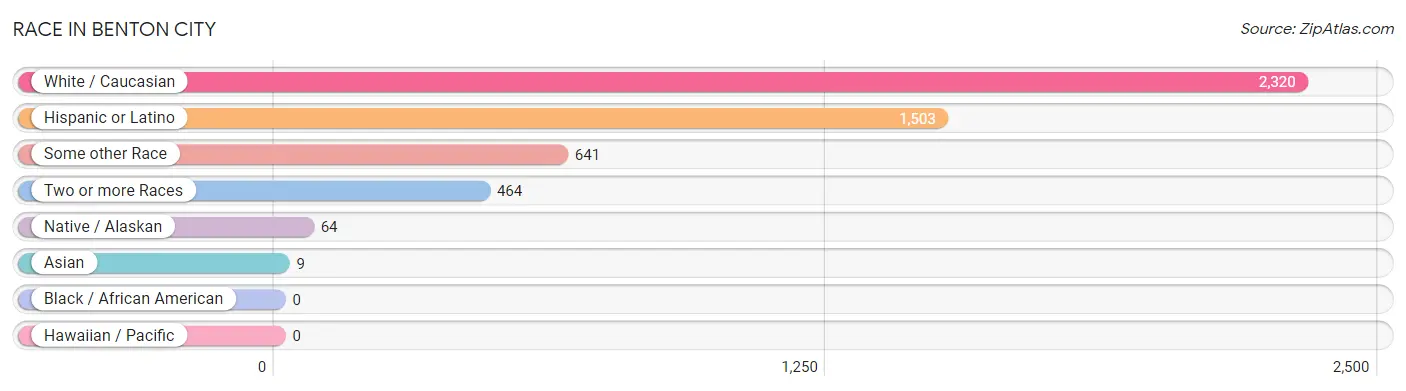
| Race | # Population | % Population |
| Asian | 9 | 0.3% |
| Black / African American | 0 | 0.0% |
| Hawaiian / Pacific | 0 | 0.0% |
| Hispanic or Latino | 1,503 | 43.0% |
| Native / Alaskan | 64 | 1.8% |
| White / Caucasian | 2,320 | 66.3% |
| Two or more Races | 464 | 13.3% |
| Some other Race | 641 | 18.3% |
| Total | 3,498 | 100.0% |
Ancestry in Benton City
The most populous ancestries reported in Benton City are Mexican (1,229 | 35.1%), German (914 | 26.1%), English (298 | 8.5%), Irish (290 | 8.3%), and Dutch (277 | 7.9%), together accounting for 86.0% of all Benton City residents.
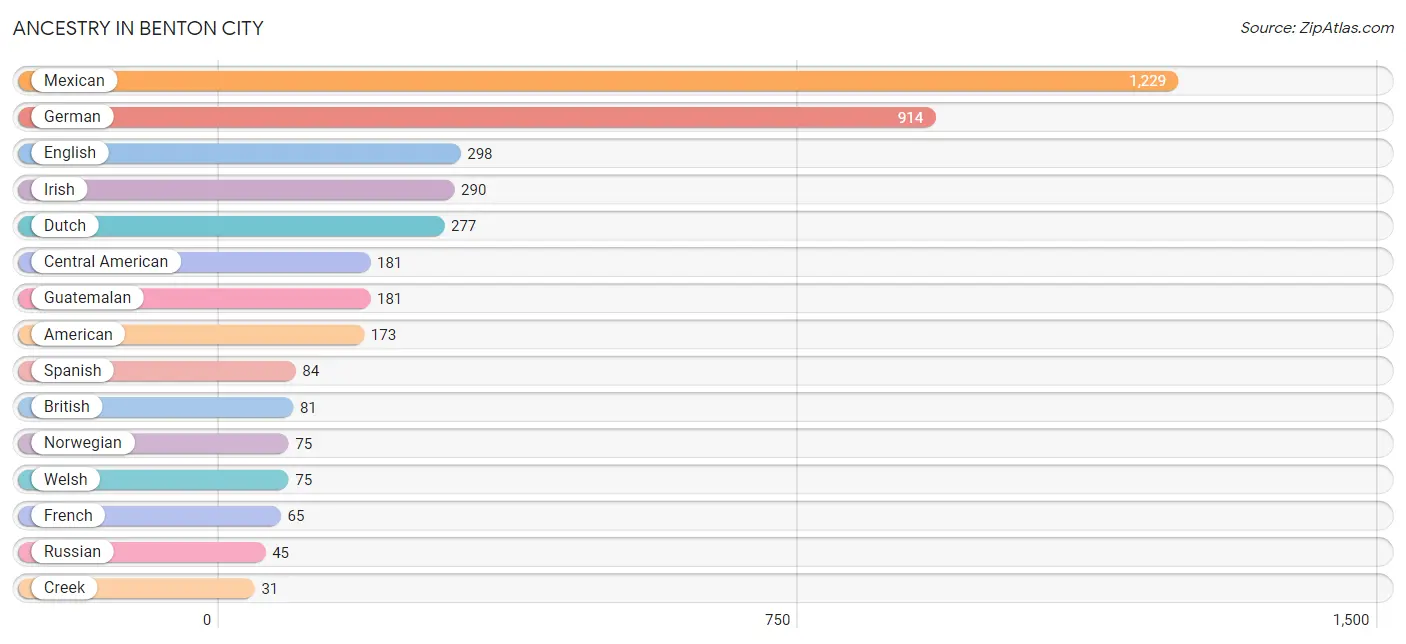
| Ancestry | # Population | % Population |
| American | 173 | 5.0% |
| Belizean | 4 | 0.1% |
| Bhutanese | 5 | 0.1% |
| British | 81 | 2.3% |
| Central American | 181 | 5.2% |
| Creek | 31 | 0.9% |
| Danish | 21 | 0.6% |
| Dutch | 277 | 7.9% |
| English | 298 | 8.5% |
| Finnish | 21 | 0.6% |
| French | 65 | 1.9% |
| French Canadian | 12 | 0.3% |
| German | 914 | 26.1% |
| Guatemalan | 181 | 5.2% |
| Indian (Asian) | 5 | 0.1% |
| Irish | 290 | 8.3% |
| Italian | 12 | 0.3% |
| Korean | 4 | 0.1% |
| Mexican | 1,229 | 35.1% |
| Mexican American Indian | 13 | 0.4% |
| Navajo | 12 | 0.3% |
| Norwegian | 75 | 2.1% |
| Russian | 45 | 1.3% |
| Scotch-Irish | 5 | 0.1% |
| Scottish | 3 | 0.1% |
| Spanish | 84 | 2.4% |
| Swiss | 16 | 0.5% |
| Tlingit-Haida | 4 | 0.1% |
| Welsh | 75 | 2.1% |
| Yugoslavian | 31 | 0.9% | View All 30 Rows |
Immigrants in Benton City
The most numerous immigrant groups reported in Benton City came from Central America (587 | 16.8%), Latin America (587 | 16.8%), Mexico (422 | 12.1%), Guatemala (165 | 4.7%), and Europe (44 | 1.3%), together accounting for 51.6% of all Benton City residents.
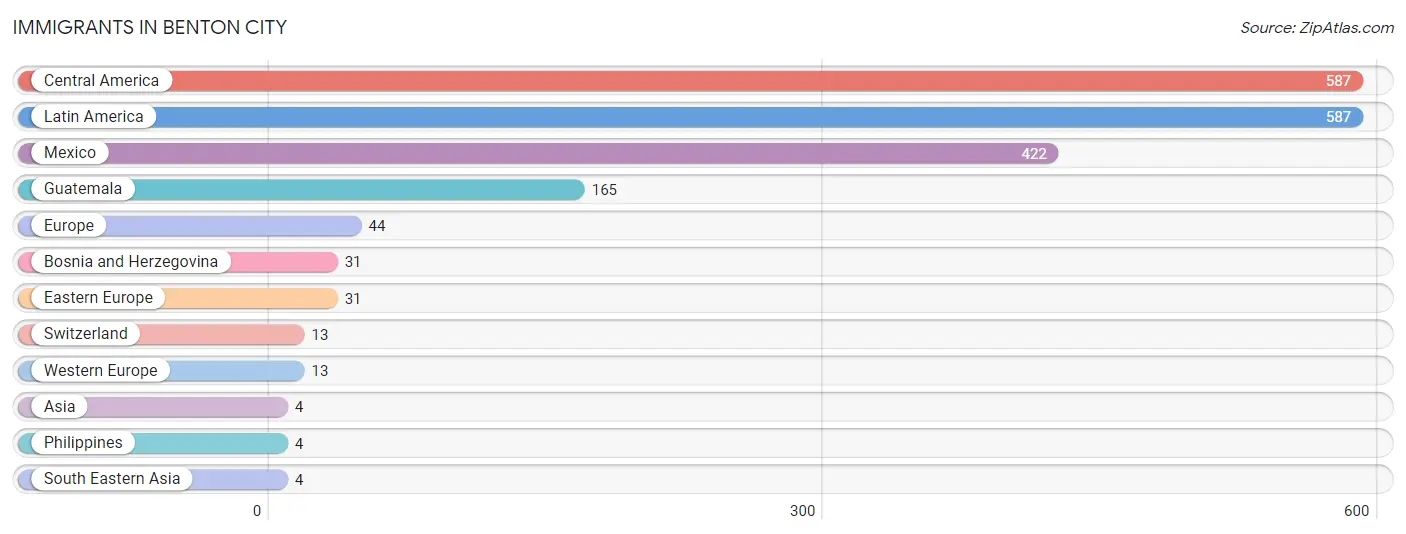
| Immigration Origin | # Population | % Population |
| Asia | 4 | 0.1% |
| Bosnia and Herzegovina | 31 | 0.9% |
| Central America | 587 | 16.8% |
| Eastern Europe | 31 | 0.9% |
| Europe | 44 | 1.3% |
| Guatemala | 165 | 4.7% |
| Latin America | 587 | 16.8% |
| Mexico | 422 | 12.1% |
| Philippines | 4 | 0.1% |
| South Eastern Asia | 4 | 0.1% |
| Switzerland | 13 | 0.4% |
| Western Europe | 13 | 0.4% | View All 12 Rows |
Sex and Age in Benton City
Sex and Age in Benton City
The most populous age groups in Benton City are Under 5 Years (271 | 16.1%) for men and Under 5 Years (324 | 17.9%) for women.
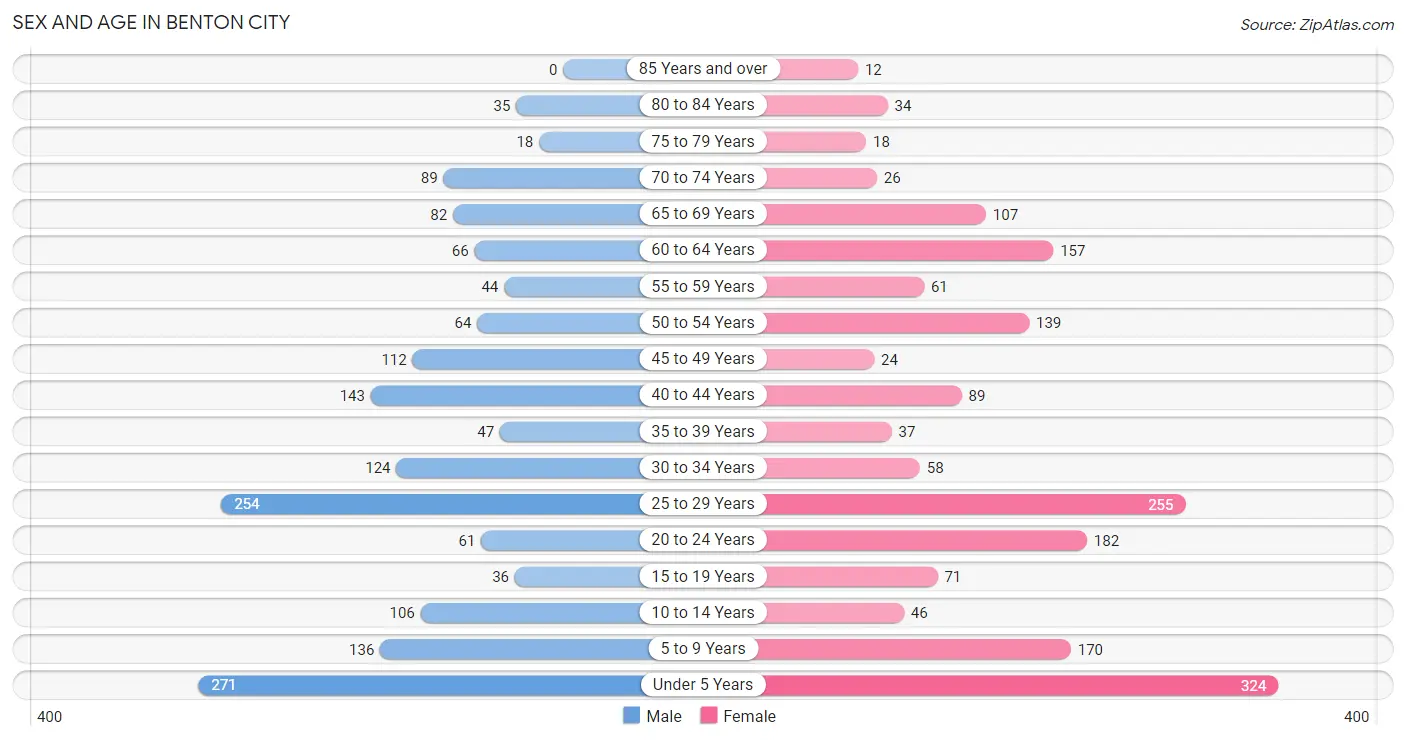
| Age Bracket | Male | Female |
| Under 5 Years | 271 (16.1%) | 324 (17.9%) |
| 5 to 9 Years | 136 (8.1%) | 170 (9.4%) |
| 10 to 14 Years | 106 (6.3%) | 46 (2.5%) |
| 15 to 19 Years | 36 (2.1%) | 71 (3.9%) |
| 20 to 24 Years | 61 (3.6%) | 182 (10.1%) |
| 25 to 29 Years | 254 (15.0%) | 255 (14.1%) |
| 30 to 34 Years | 124 (7.3%) | 58 (3.2%) |
| 35 to 39 Years | 47 (2.8%) | 37 (2.0%) |
| 40 to 44 Years | 143 (8.5%) | 89 (4.9%) |
| 45 to 49 Years | 112 (6.6%) | 24 (1.3%) |
| 50 to 54 Years | 64 (3.8%) | 139 (7.7%) |
| 55 to 59 Years | 44 (2.6%) | 61 (3.4%) |
| 60 to 64 Years | 66 (3.9%) | 157 (8.7%) |
| 65 to 69 Years | 82 (4.9%) | 107 (5.9%) |
| 70 to 74 Years | 89 (5.3%) | 26 (1.4%) |
| 75 to 79 Years | 18 (1.1%) | 18 (1.0%) |
| 80 to 84 Years | 35 (2.1%) | 34 (1.9%) |
| 85 Years and over | 0 (0.0%) | 12 (0.7%) |
| Total | 1,688 (100.0%) | 1,810 (100.0%) |
Families and Households in Benton City
Median Family Size in Benton City
The median family size in Benton City is 3.40 persons per family, with single female/mother families (142 | 17.5%) accounting for the largest median family size of 3.96 persons per family. On the other hand, single male/father families (81 | 10.0%) represent the smallest median family size with 2.30 persons per family.
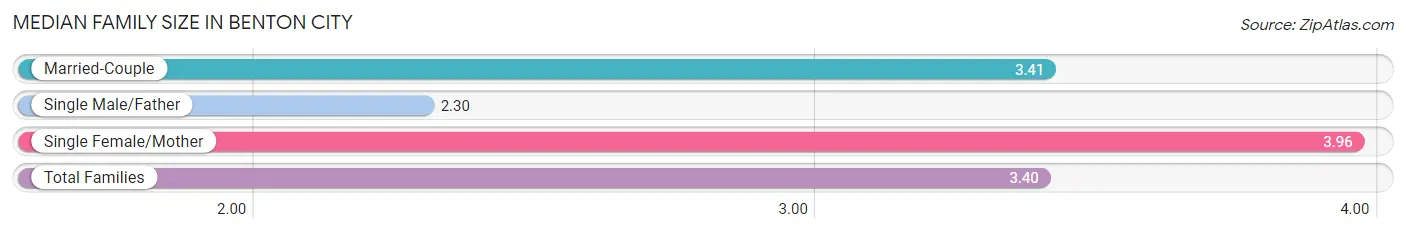
| Family Type | # Families | Family Size |
| Married-Couple | 587 (72.5%) | 3.41 |
| Single Male/Father | 81 (10.0%) | 2.30 |
| Single Female/Mother | 142 (17.5%) | 3.96 |
| Total Families | 810 (100.0%) | 3.40 |
Median Household Size in Benton City
The median household size in Benton City is 2.67 persons per household, with single female/mother households (142 | 10.8%) accounting for the largest median household size of 4.42 persons per household. non-family households (500 | 38.2%) represent the smallest median household size with 1.18 persons per household.
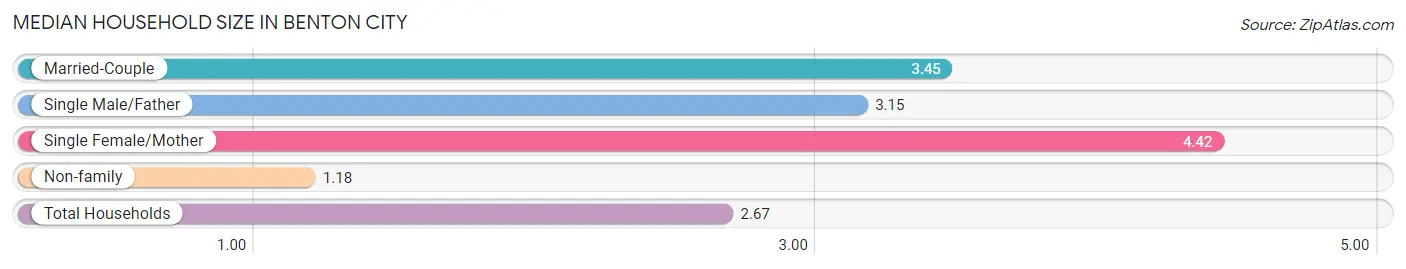
| Household Type | # Households | Household Size |
| Married-Couple | 587 (44.8%) | 3.45 |
| Single Male/Father | 81 (6.2%) | 3.15 |
| Single Female/Mother | 142 (10.8%) | 4.42 |
| Non-family | 500 (38.2%) | 1.18 |
| Total Households | 1,310 (100.0%) | 2.67 |
Household Size by Marriage Status in Benton City
Out of a total of 1,310 households in Benton City, 810 (61.8%) are family households, while 500 (38.2%) are nonfamily households. The most numerous type of family households are 3-person households, comprising 275, and the most common type of nonfamily households are 1-person households, comprising 414.
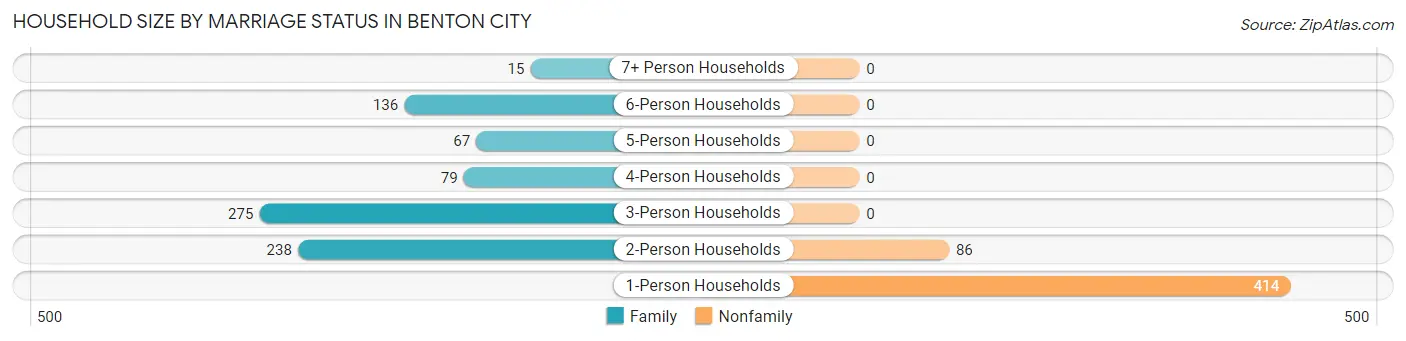
| Household Size | Family Households | Nonfamily Households |
| 1-Person Households | - | 414 (31.6%) |
| 2-Person Households | 238 (18.2%) | 86 (6.6%) |
| 3-Person Households | 275 (21.0%) | 0 (0.0%) |
| 4-Person Households | 79 (6.0%) | 0 (0.0%) |
| 5-Person Households | 67 (5.1%) | 0 (0.0%) |
| 6-Person Households | 136 (10.4%) | 0 (0.0%) |
| 7+ Person Households | 15 (1.1%) | 0 (0.0%) |
| Total | 810 (61.8%) | 500 (38.2%) |
Female Fertility in Benton City
Fertility by Age in Benton City
Average fertility rate in Benton City is 216.0 births per 1,000 women. Women in the age bracket of 15 to 19 years have the highest fertility rate with 324.0 births per 1,000 women. Women in the age bracket of 20 to 34 years acount for 85.5% of all women with births.
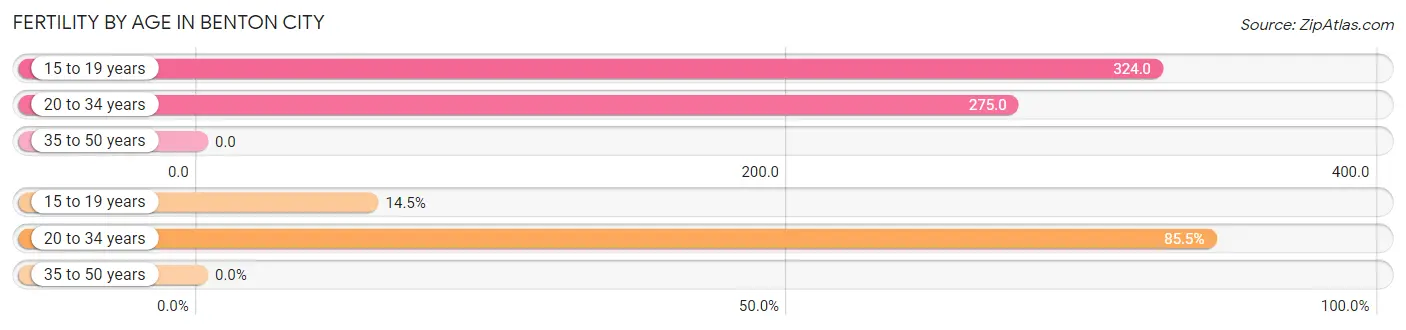
| Age Bracket | Women with Births | Births / 1,000 Women |
| 15 to 19 years | 23 (14.5%) | 324.0 |
| 20 to 34 years | 136 (85.5%) | 275.0 |
| 35 to 50 years | 0 (0.0%) | 0.0 |
| Total | 159 (100.0%) | 216.0 |
Fertility by Age by Marriage Status in Benton City
78.0% of women with births (159) in Benton City are married. The highest percentage of unmarried women with births falls into 15 to 19 years age bracket with 100.0% of them unmarried at the time of birth, while the lowest percentage of unmarried women with births belong to 20 to 34 years age bracket with 8.8% of them unmarried.
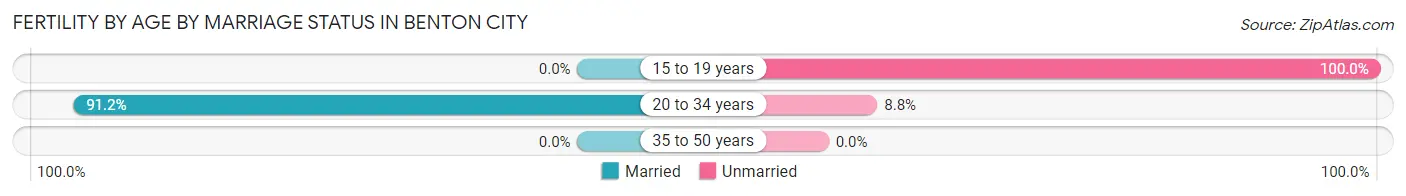
| Age Bracket | Married | Unmarried |
| 15 to 19 years | 0 (0.0%) | 23 (100.0%) |
| 20 to 34 years | 124 (91.2%) | 12 (8.8%) |
| 35 to 50 years | 0 (0.0%) | 0 (0.0%) |
| Total | 124 (78.0%) | 35 (22.0%) |
Fertility by Education in Benton City
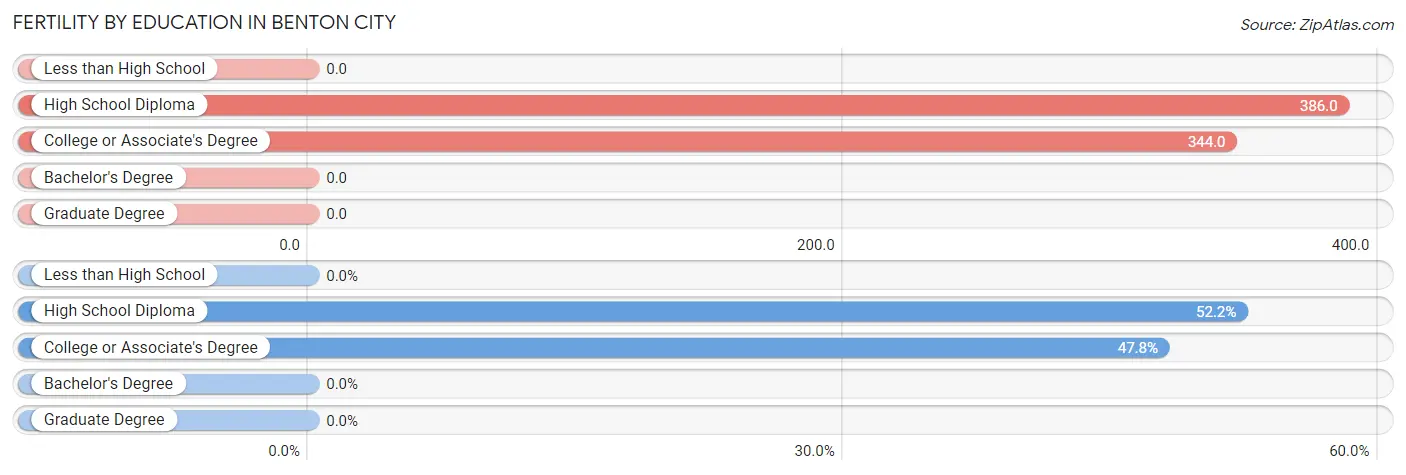
| Educational Attainment | Women with Births | Births / 1,000 Women |
| Less than High School | 0 (0.0%) | 0.0 |
| High School Diploma | 83 (52.2%) | 386.0 |
| College or Associate's Degree | 76 (47.8%) | 344.0 |
| Bachelor's Degree | 0 (0.0%) | 0.0 |
| Graduate Degree | 0 (0.0%) | 0.0 |
| Total | 159 (100.0%) | 216.0 |
Fertility by Education by Marriage Status in Benton City
22.0% of women with births in Benton City are unmarried. Women with the educational attainment of college or associate's degree are most likely to be married with 84.2% of them married at childbirth, while women with the educational attainment of high school diploma are least likely to be married with 27.7% of them unmarried at childbirth.
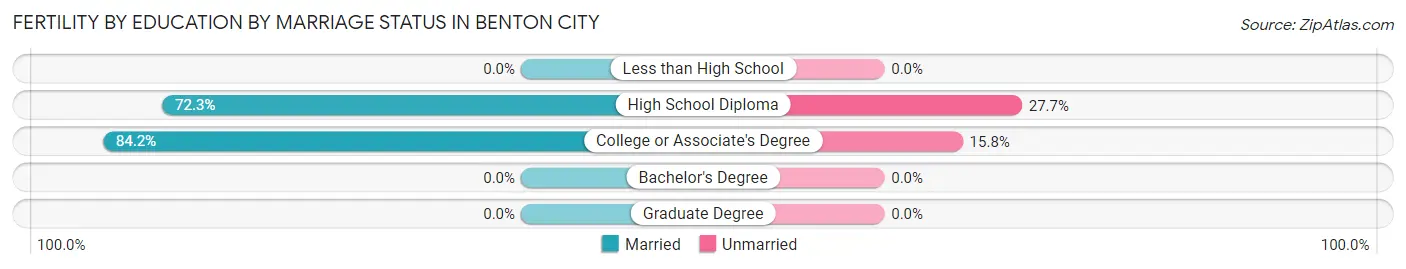
| Educational Attainment | Married | Unmarried |
| Less than High School | 0 (0.0%) | 0 (0.0%) |
| High School Diploma | 60 (72.3%) | 23 (27.7%) |
| College or Associate's Degree | 64 (84.2%) | 12 (15.8%) |
| Bachelor's Degree | 0 (0.0%) | 0 (0.0%) |
| Graduate Degree | 0 (0.0%) | 0 (0.0%) |
| Total | 124 (78.0%) | 35 (22.0%) |
Employment Characteristics in Benton City
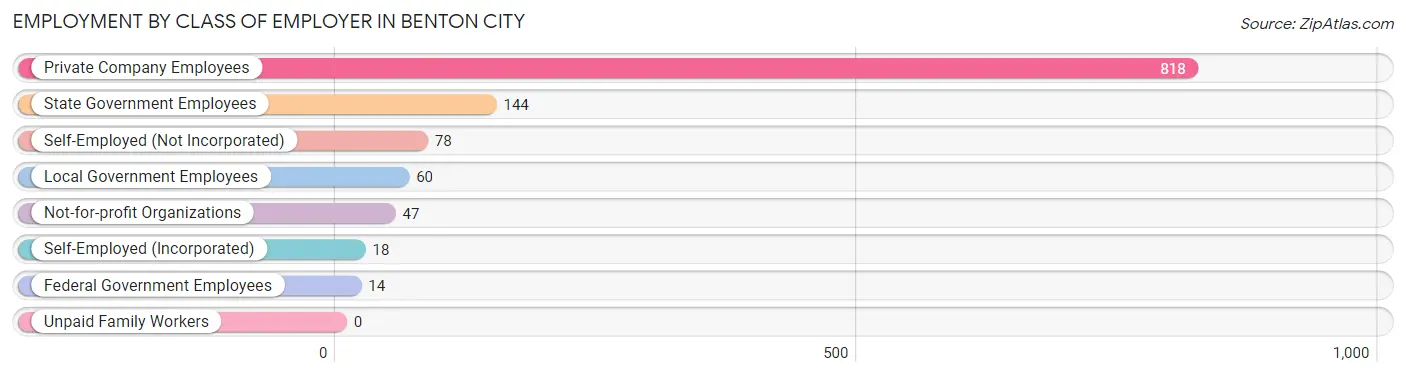
Employment by Class of Employer in Benton City
Among the 1,179 employed individuals in Benton City, private company employees (818 | 69.4%), state government employees (144 | 12.2%), and self-employed (not incorporated) (78 | 6.6%) make up the most common classes of employment.
| Employer Class | # Employees | % Employees |
| Private Company Employees | 818 | 69.4% |
| Self-Employed (Incorporated) | 18 | 1.5% |
| Self-Employed (Not Incorporated) | 78 | 6.6% |
| Not-for-profit Organizations | 47 | 4.0% |
| Local Government Employees | 60 | 5.1% |
| State Government Employees | 144 | 12.2% |
| Federal Government Employees | 14 | 1.2% |
| Unpaid Family Workers | 0 | 0.0% |
| Total | 1,179 | 100.0% |
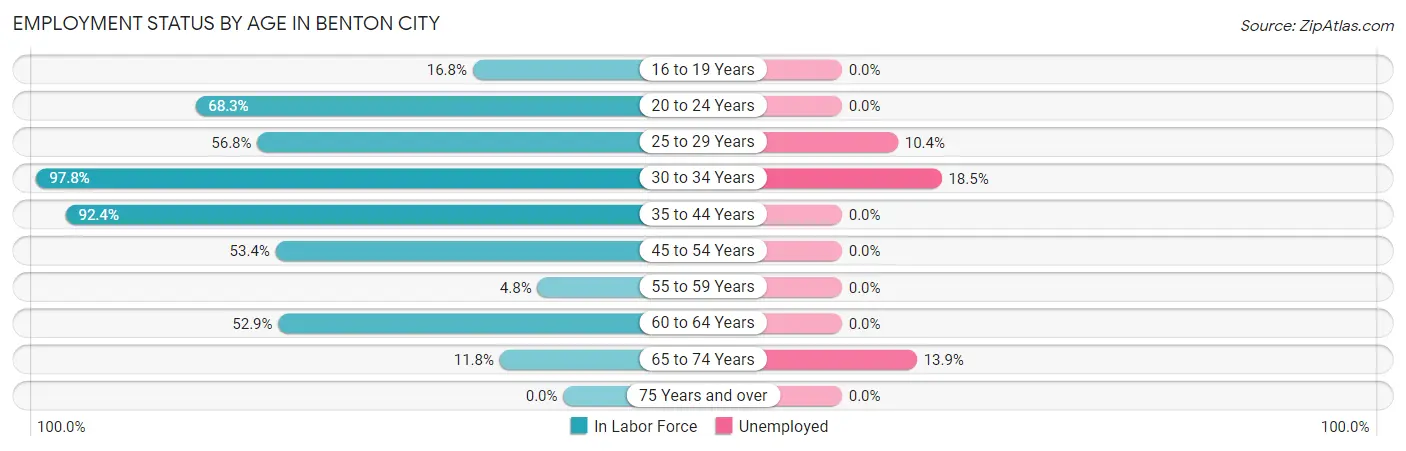
Employment Status by Age in Benton City
According to the labor force statistics for Benton City, out of the total population over 16 years of age (2,445), 52.5% or 1,284 individuals are in the labor force, with 5.3% or 68 of them unemployed. The age group with the highest labor force participation rate is 30 to 34 years, with 97.8% or 178 individuals in the labor force. Within the labor force, the 30 to 34 years age range has the highest percentage of unemployed individuals, with 18.5% or 33 of them being unemployed.
| Age Bracket | In Labor Force | Unemployed |
| 16 to 19 Years | 18 (16.8%) | 0 (0.0%) |
| 20 to 24 Years | 166 (68.3%) | 0 (0.0%) |
| 25 to 29 Years | 289 (56.8%) | 30 (10.4%) |
| 30 to 34 Years | 178 (97.8%) | 33 (18.5%) |
| 35 to 44 Years | 292 (92.4%) | 0 (0.0%) |
| 45 to 54 Years | 181 (53.4%) | 0 (0.0%) |
| 55 to 59 Years | 5 (4.8%) | 0 (0.0%) |
| 60 to 64 Years | 118 (52.9%) | 0 (0.0%) |
| 65 to 74 Years | 36 (11.8%) | 5 (13.9%) |
| 75 Years and over | 0 (0.0%) | 0 (0.0%) |
| Total | 1,284 (52.5%) | 68 (5.3%) |
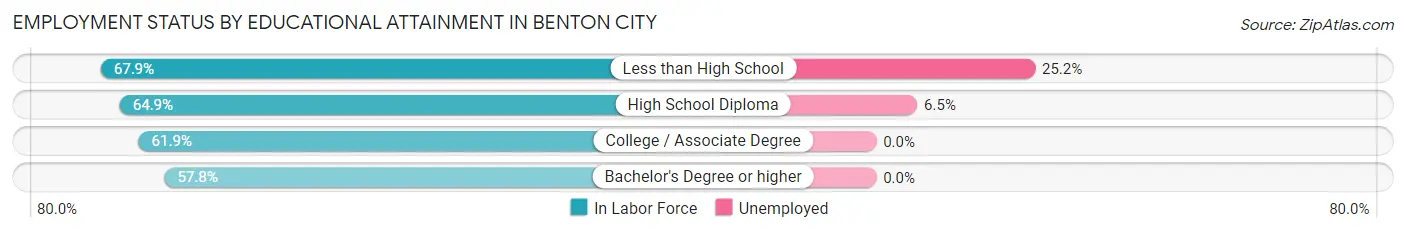
Employment Status by Educational Attainment in Benton City
According to labor force statistics for Benton City, 63.5% of individuals (1,063) out of the total population between 25 and 64 years of age (1,674) are in the labor force, with 5.9% or 63 of them being unemployed. The group with the highest labor force participation rate are those with the educational attainment of less than high school, with 67.9% or 131 individuals in the labor force. Within the labor force, individuals with less than high school education have the highest percentage of unemployment, with 25.2% or 33 of them being unemployed.
| Educational Attainment | In Labor Force | Unemployed |
| Less than High School | 131 (67.9%) | 49 (25.2%) |
| High School Diploma | 465 (64.9%) | 47 (6.5%) |
| College / Associate Degree | 374 (61.9%) | 0 (0.0%) |
| Bachelor's Degree or higher | 93 (57.8%) | 0 (0.0%) |
| Total | 1,063 (63.5%) | 99 (5.9%) |
Employment Occupations by Sex in Benton City
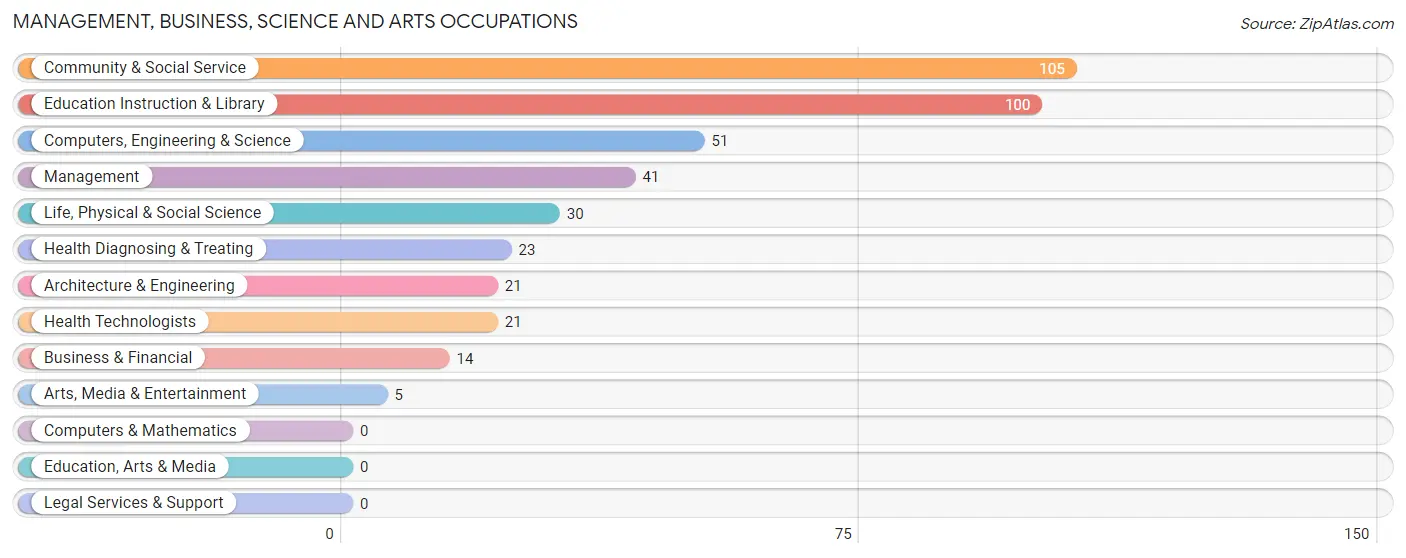
Management, Business, Science and Arts Occupations
The most common Management, Business, Science and Arts occupations in Benton City are Community & Social Service (105 | 8.6%), Education Instruction & Library (100 | 8.2%), Computers, Engineering & Science (51 | 4.2%), Management (41 | 3.4%), and Life, Physical & Social Science (30 | 2.5%).
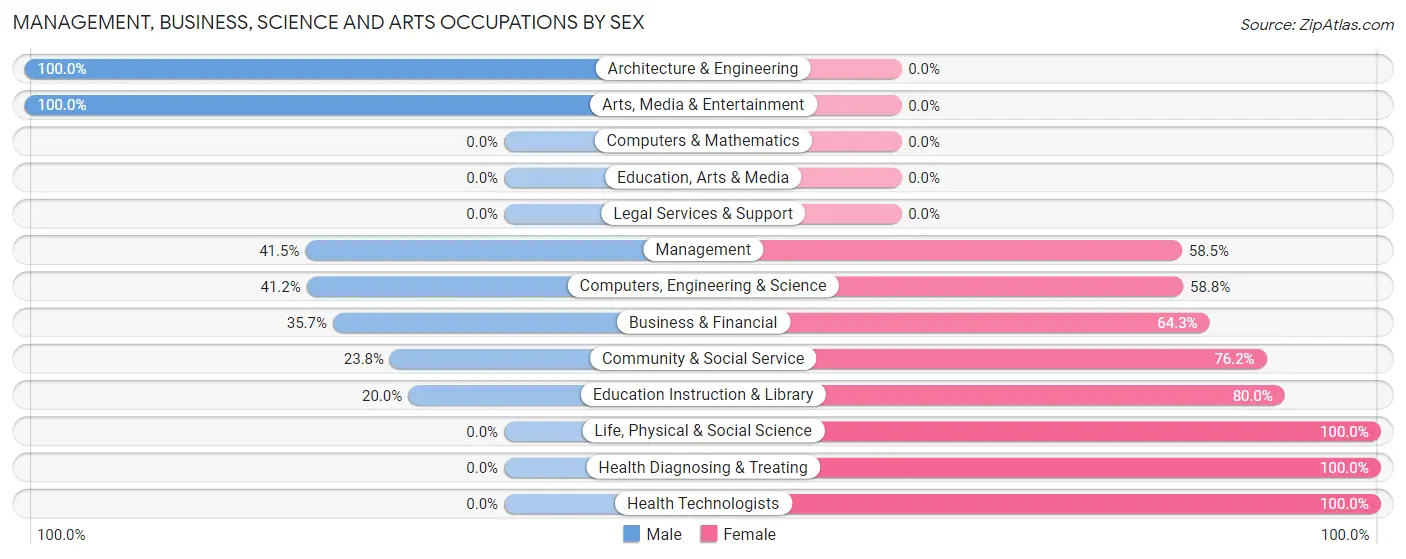
Management, Business, Science and Arts Occupations by Sex
Within the Management, Business, Science and Arts occupations in Benton City, the most male-oriented occupations are Architecture & Engineering (100.0%), Arts, Media & Entertainment (100.0%), and Management (41.5%), while the most female-oriented occupations are Life, Physical & Social Science (100.0%), Health Diagnosing & Treating (100.0%), and Health Technologists (100.0%).
| Occupation | Male | Female |
| Management | 17 (41.5%) | 24 (58.5%) |
| Business & Financial | 5 (35.7%) | 9 (64.3%) |
| Computers, Engineering & Science | 21 (41.2%) | 30 (58.8%) |
| Computers & Mathematics | 0 (0.0%) | 0 (0.0%) |
| Architecture & Engineering | 21 (100.0%) | 0 (0.0%) |
| Life, Physical & Social Science | 0 (0.0%) | 30 (100.0%) |
| Community & Social Service | 25 (23.8%) | 80 (76.2%) |
| Education, Arts & Media | 0 (0.0%) | 0 (0.0%) |
| Legal Services & Support | 0 (0.0%) | 0 (0.0%) |
| Education Instruction & Library | 20 (20.0%) | 80 (80.0%) |
| Arts, Media & Entertainment | 5 (100.0%) | 0 (0.0%) |
| Health Diagnosing & Treating | 0 (0.0%) | 23 (100.0%) |
| Health Technologists | 0 (0.0%) | 21 (100.0%) |
| Total (Category) | 68 (29.1%) | 166 (70.9%) |
| Total (Overall) | 627 (51.6%) | 588 (48.4%) |
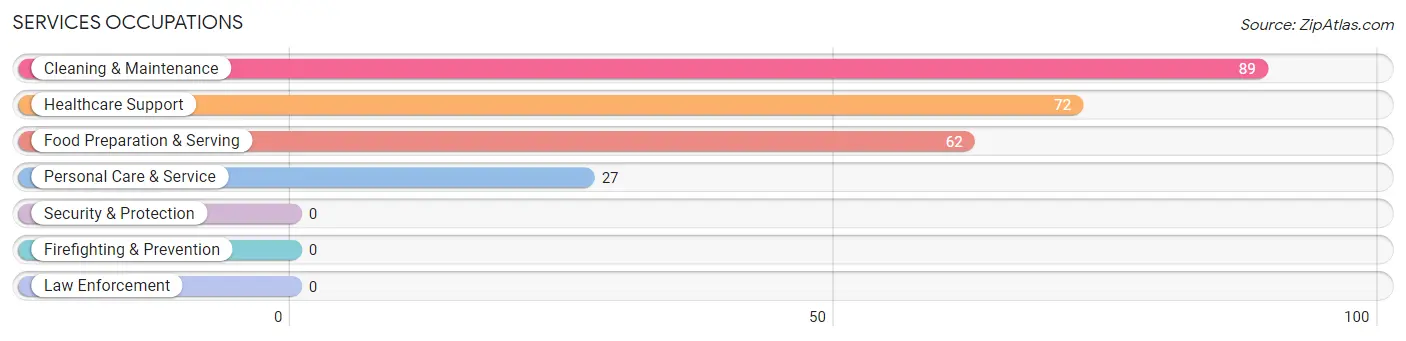
Services Occupations
The most common Services occupations in Benton City are Cleaning & Maintenance (89 | 7.3%), Healthcare Support (72 | 5.9%), Food Preparation & Serving (62 | 5.1%), and Personal Care & Service (27 | 2.2%).
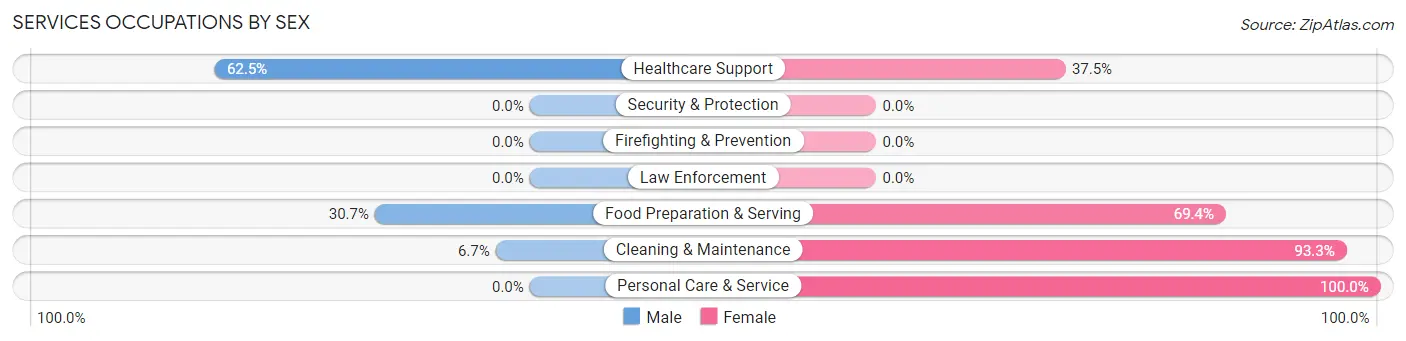
Services Occupations by Sex
Within the Services occupations in Benton City, the most male-oriented occupations are Healthcare Support (62.5%), Food Preparation & Serving (30.6%), and Cleaning & Maintenance (6.7%), while the most female-oriented occupations are Personal Care & Service (100.0%), Cleaning & Maintenance (93.3%), and Food Preparation & Serving (69.4%).
| Occupation | Male | Female |
| Healthcare Support | 45 (62.5%) | 27 (37.5%) |
| Security & Protection | 0 (0.0%) | 0 (0.0%) |
| Firefighting & Prevention | 0 (0.0%) | 0 (0.0%) |
| Law Enforcement | 0 (0.0%) | 0 (0.0%) |
| Food Preparation & Serving | 19 (30.6%) | 43 (69.4%) |
| Cleaning & Maintenance | 6 (6.7%) | 83 (93.3%) |
| Personal Care & Service | 0 (0.0%) | 27 (100.0%) |
| Total (Category) | 70 (28.0%) | 180 (72.0%) |
| Total (Overall) | 627 (51.6%) | 588 (48.4%) |
Sales and Office Occupations
The most common Sales and Office occupations in Benton City are Office & Administration (145 | 11.9%), and Sales & Related (41 | 3.4%).
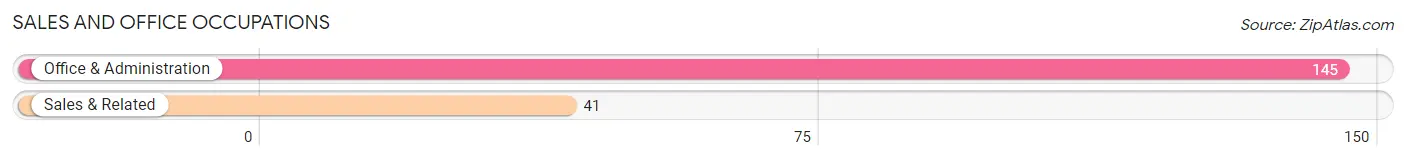
Sales and Office Occupations by Sex
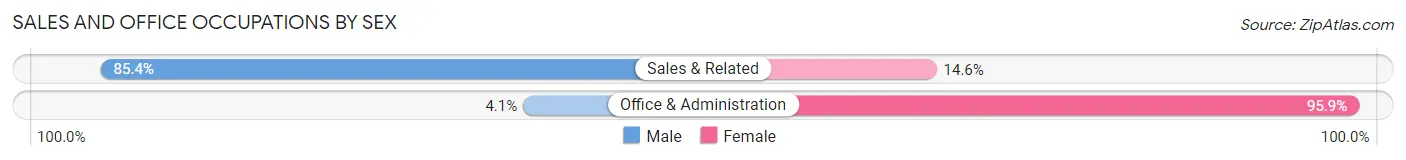
| Occupation | Male | Female |
| Sales & Related | 35 (85.4%) | 6 (14.6%) |
| Office & Administration | 6 (4.1%) | 139 (95.9%) |
| Total (Category) | 41 (22.0%) | 145 (78.0%) |
| Total (Overall) | 627 (51.6%) | 588 (48.4%) |
Natural Resources, Construction and Maintenance Occupations
The most common Natural Resources, Construction and Maintenance occupations in Benton City are Installation, Maintenance & Repair (125 | 10.3%), Farming, Fishing & Forestry (118 | 9.7%), and Construction & Extraction (80 | 6.6%).
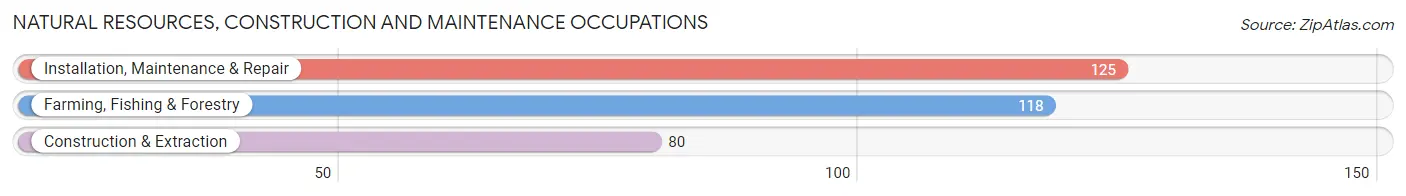
Natural Resources, Construction and Maintenance Occupations by Sex
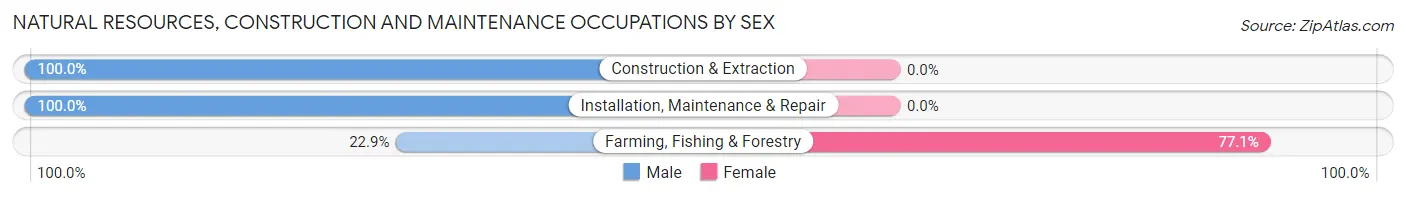
| Occupation | Male | Female |
| Farming, Fishing & Forestry | 27 (22.9%) | 91 (77.1%) |
| Construction & Extraction | 80 (100.0%) | 0 (0.0%) |
| Installation, Maintenance & Repair | 125 (100.0%) | 0 (0.0%) |
| Total (Category) | 232 (71.8%) | 91 (28.2%) |
| Total (Overall) | 627 (51.6%) | 588 (48.4%) |
Production, Transportation and Moving Occupations
The most common Production, Transportation and Moving occupations in Benton City are Transportation (95 | 7.8%), Material Moving (66 | 5.4%), and Production (61 | 5.0%).
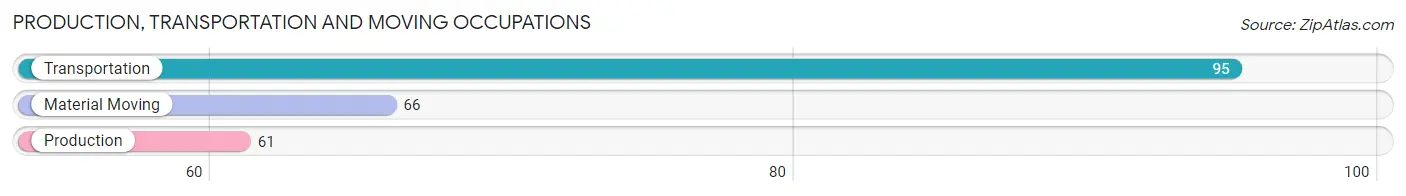
Production, Transportation and Moving Occupations by Sex
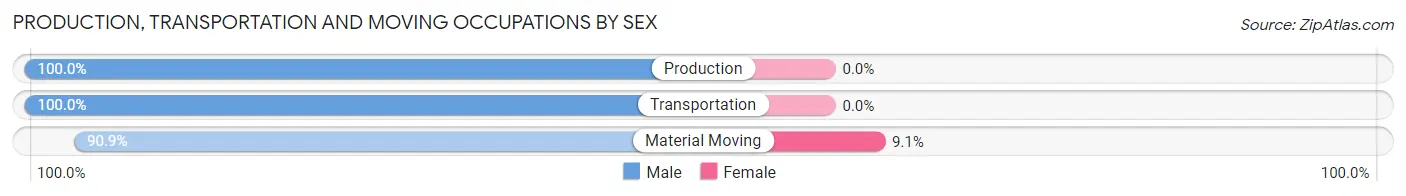
| Occupation | Male | Female |
| Production | 61 (100.0%) | 0 (0.0%) |
| Transportation | 95 (100.0%) | 0 (0.0%) |
| Material Moving | 60 (90.9%) | 6 (9.1%) |
| Total (Category) | 216 (97.3%) | 6 (2.7%) |
| Total (Overall) | 627 (51.6%) | 588 (48.4%) |
Employment Industries by Sex in Benton City
Employment Industries in Benton City
The major employment industries in Benton City include Agriculture, Fishing & Hunting (180 | 14.8%), Transportation & Warehousing (137 | 11.3%), Manufacturing (132 | 10.9%), Educational Services (130 | 10.7%), and Construction (98 | 8.1%).
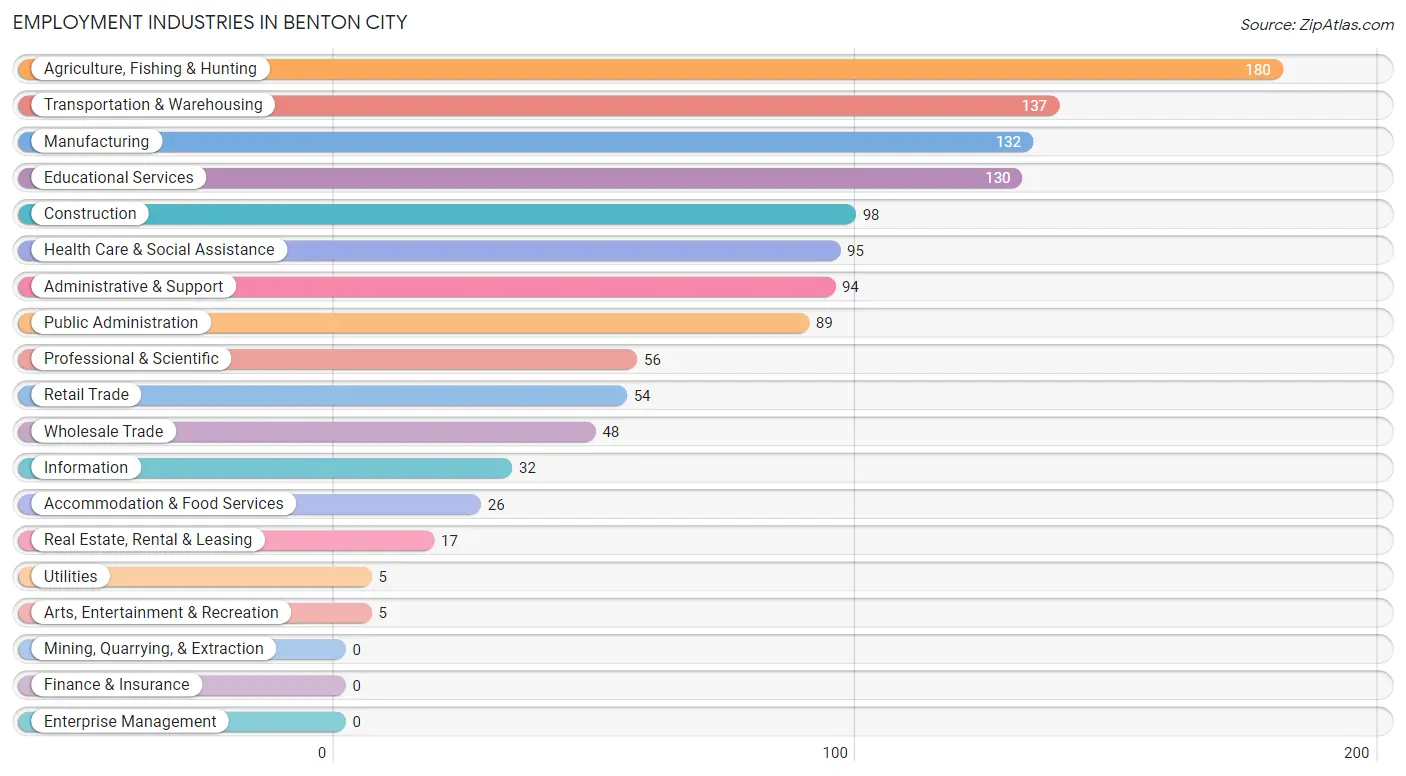
Employment Industries by Sex in Benton City
The Benton City industries that see more men than women are Utilities (100.0%), Real Estate, Rental & Leasing (100.0%), and Arts, Entertainment & Recreation (100.0%), whereas the industries that tend to have a higher number of women are Information (100.0%), Health Care & Social Assistance (100.0%), and Administrative & Support (88.3%).
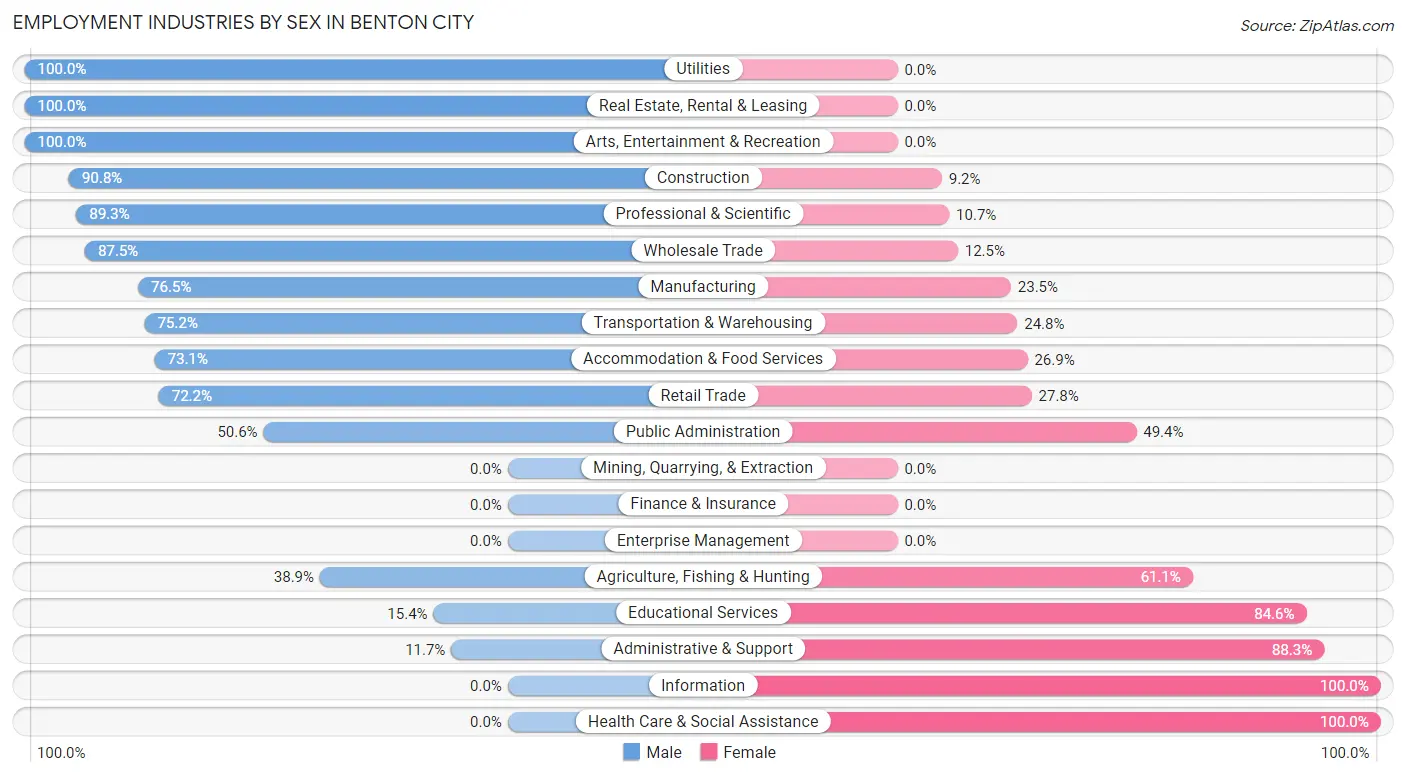
| Industry | Male | Female |
| Agriculture, Fishing & Hunting | 70 (38.9%) | 110 (61.1%) |
| Mining, Quarrying, & Extraction | 0 (0.0%) | 0 (0.0%) |
| Construction | 89 (90.8%) | 9 (9.2%) |
| Manufacturing | 101 (76.5%) | 31 (23.5%) |
| Wholesale Trade | 42 (87.5%) | 6 (12.5%) |
| Retail Trade | 39 (72.2%) | 15 (27.8%) |
| Transportation & Warehousing | 103 (75.2%) | 34 (24.8%) |
| Utilities | 5 (100.0%) | 0 (0.0%) |
| Information | 0 (0.0%) | 32 (100.0%) |
| Finance & Insurance | 0 (0.0%) | 0 (0.0%) |
| Real Estate, Rental & Leasing | 17 (100.0%) | 0 (0.0%) |
| Professional & Scientific | 50 (89.3%) | 6 (10.7%) |
| Enterprise Management | 0 (0.0%) | 0 (0.0%) |
| Administrative & Support | 11 (11.7%) | 83 (88.3%) |
| Educational Services | 20 (15.4%) | 110 (84.6%) |
| Health Care & Social Assistance | 0 (0.0%) | 95 (100.0%) |
| Arts, Entertainment & Recreation | 5 (100.0%) | 0 (0.0%) |
| Accommodation & Food Services | 19 (73.1%) | 7 (26.9%) |
| Public Administration | 45 (50.6%) | 44 (49.4%) |
| Total | 627 (51.6%) | 588 (48.4%) |
Education in Benton City
School Enrollment in Benton City
The most common levels of schooling among the 674 students in Benton City are elementary school (209 | 31.0%), middle school (141 | 20.9%), and nursery / preschool (138 | 20.5%).
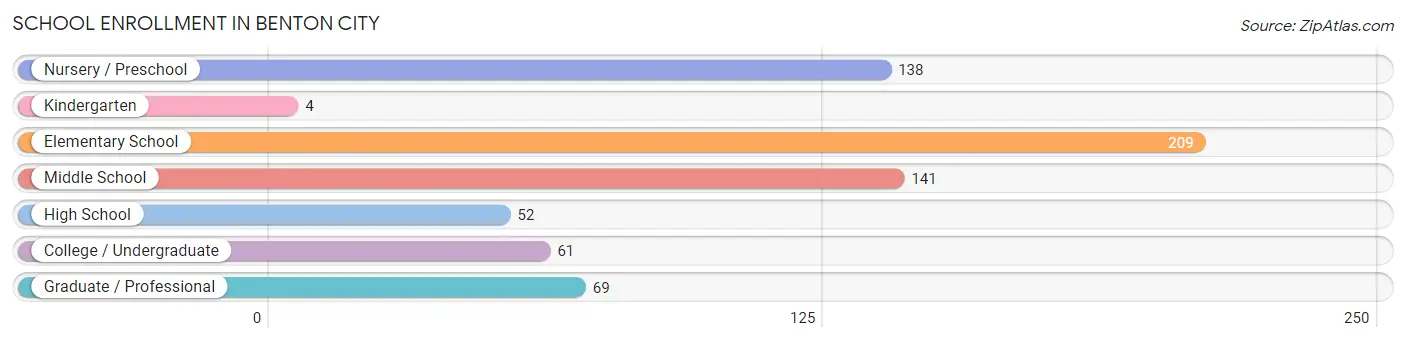
| School Level | # Students | % Students |
| Nursery / Preschool | 138 | 20.5% |
| Kindergarten | 4 | 0.6% |
| Elementary School | 209 | 31.0% |
| Middle School | 141 | 20.9% |
| High School | 52 | 7.7% |
| College / Undergraduate | 61 | 9.0% |
| Graduate / Professional | 69 | 10.2% |
| Total | 674 | 100.0% |
School Enrollment by Age by Funding Source in Benton City
Out of a total of 674 students who are enrolled in schools in Benton City, 15 (2.2%) attend a private institution, while the remaining 659 (97.8%) are enrolled in public schools. The age group of 20 to 24 year olds has the highest likelihood of being enrolled in private schools, with 6 (7.7% in the age bracket) enrolled. Conversely, the age group of 3 to 4 year olds has the lowest likelihood of being enrolled in a private school, with 60 (100.0% in the age bracket) attending a public institution.
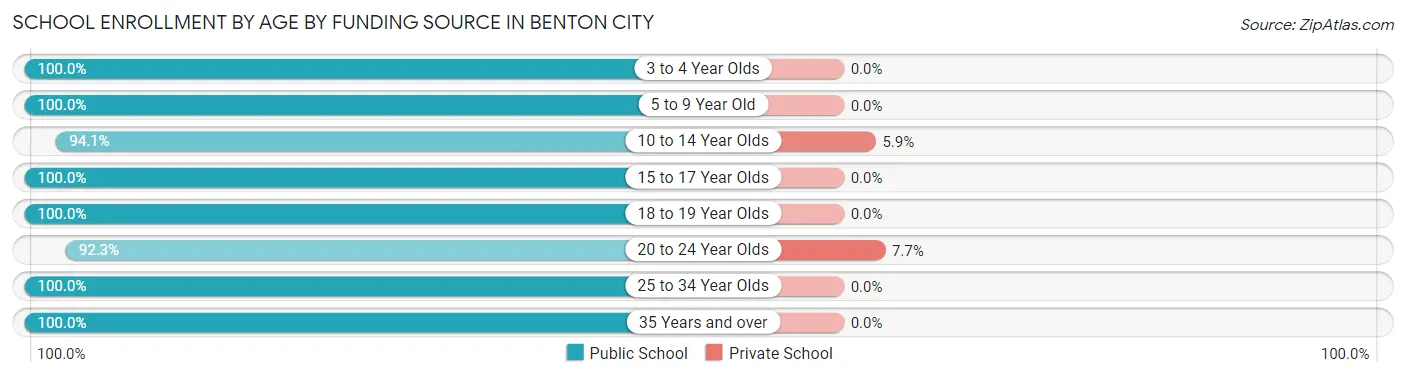
| Age Bracket | Public School | Private School |
| 3 to 4 Year Olds | 60 (100.0%) | 0 (0.0%) |
| 5 to 9 Year Old | 282 (100.0%) | 0 (0.0%) |
| 10 to 14 Year Olds | 143 (94.1%) | 9 (5.9%) |
| 15 to 17 Year Olds | 15 (100.0%) | 0 (0.0%) |
| 18 to 19 Year Olds | 35 (100.0%) | 0 (0.0%) |
| 20 to 24 Year Olds | 72 (92.3%) | 6 (7.7%) |
| 25 to 34 Year Olds | 32 (100.0%) | 0 (0.0%) |
| 35 Years and over | 20 (100.0%) | 0 (0.0%) |
| Total | 659 (97.8%) | 15 (2.2%) |
Educational Attainment by Field of Study in Benton City
Bio, nature & agricultural (51 | 26.3%), science & technology (37 | 19.1%), arts & humanities (25 | 12.9%), business (22 | 11.3%), and engineering (21 | 10.8%) are the most common fields of study among 194 individuals in Benton City who have obtained a bachelor's degree or higher.
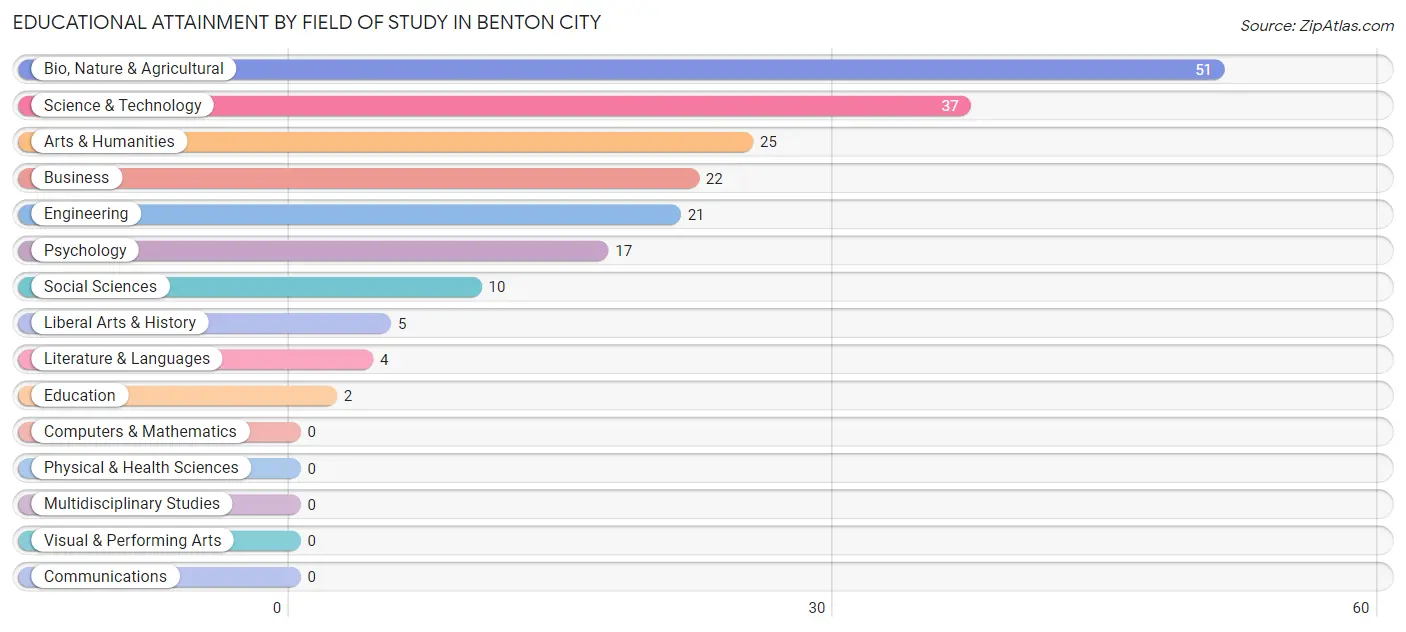
| Field of Study | # Graduates | % Graduates |
| Computers & Mathematics | 0 | 0.0% |
| Bio, Nature & Agricultural | 51 | 26.3% |
| Physical & Health Sciences | 0 | 0.0% |
| Psychology | 17 | 8.8% |
| Social Sciences | 10 | 5.1% |
| Engineering | 21 | 10.8% |
| Multidisciplinary Studies | 0 | 0.0% |
| Science & Technology | 37 | 19.1% |
| Business | 22 | 11.3% |
| Education | 2 | 1.0% |
| Literature & Languages | 4 | 2.1% |
| Liberal Arts & History | 5 | 2.6% |
| Visual & Performing Arts | 0 | 0.0% |
| Communications | 0 | 0.0% |
| Arts & Humanities | 25 | 12.9% |
| Total | 194 | 100.0% |
Transportation & Commute in Benton City
Vehicle Availability by Sex in Benton City
The most prevalent vehicle ownership categories in Benton City are males with 2 vehicles (242, accounting for 40.6%) and females with 2 vehicles (213, making up 41.5%).
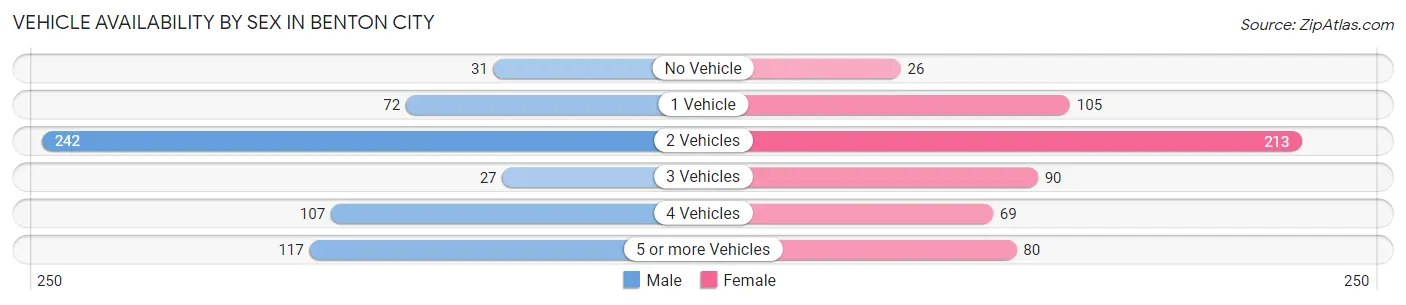
| Vehicles Available | Male | Female |
| No Vehicle | 31 (5.2%) | 26 (4.5%) |
| 1 Vehicle | 72 (12.1%) | 105 (18.0%) |
| 2 Vehicles | 242 (40.6%) | 213 (36.5%) |
| 3 Vehicles | 27 (4.5%) | 90 (15.4%) |
| 4 Vehicles | 107 (17.9%) | 69 (11.8%) |
| 5 or more Vehicles | 117 (19.6%) | 80 (13.7%) |
| Total | 596 (100.0%) | 583 (100.0%) |
Commute Time in Benton City
The most frequently occuring commute durations in Benton City are 20 to 24 minutes (230 commuters, 20.6%), 30 to 34 minutes (175 commuters, 15.7%), and 15 to 19 minutes (164 commuters, 14.7%).
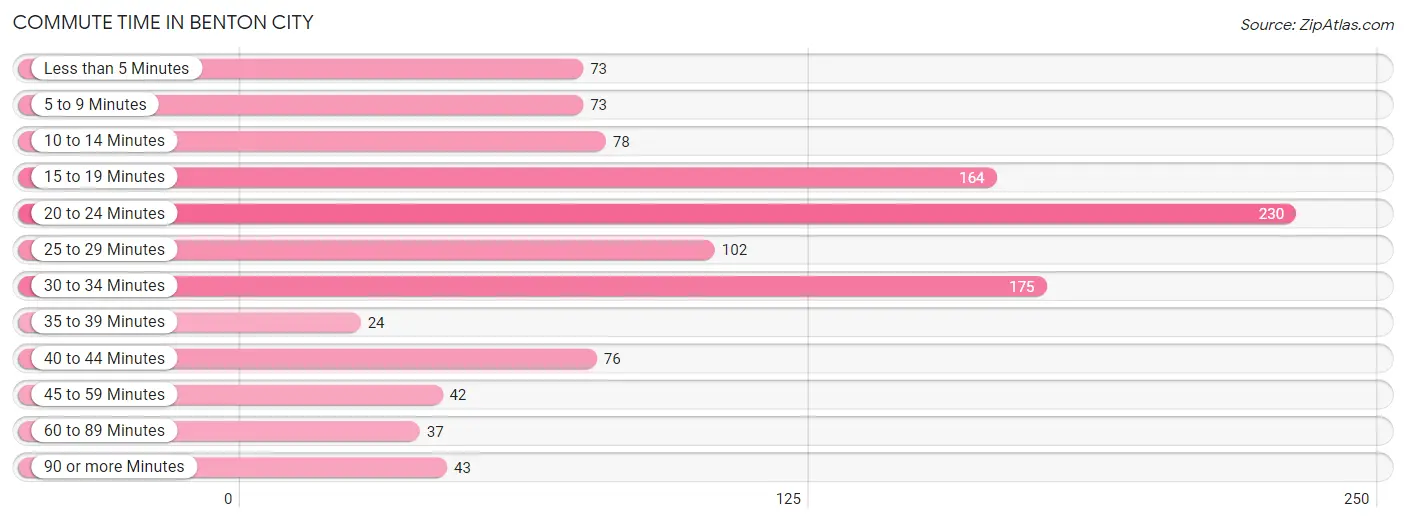
| Commute Time | # Commuters | % Commuters |
| Less than 5 Minutes | 73 | 6.5% |
| 5 to 9 Minutes | 73 | 6.5% |
| 10 to 14 Minutes | 78 | 7.0% |
| 15 to 19 Minutes | 164 | 14.7% |
| 20 to 24 Minutes | 230 | 20.6% |
| 25 to 29 Minutes | 102 | 9.1% |
| 30 to 34 Minutes | 175 | 15.7% |
| 35 to 39 Minutes | 24 | 2.1% |
| 40 to 44 Minutes | 76 | 6.8% |
| 45 to 59 Minutes | 42 | 3.8% |
| 60 to 89 Minutes | 37 | 3.3% |
| 90 or more Minutes | 43 | 3.8% |
Commute Time by Sex in Benton City
The most common commute times in Benton City are 30 to 34 minutes (150 commuters, 26.9%) for males and 20 to 24 minutes (199 commuters, 35.6%) for females.
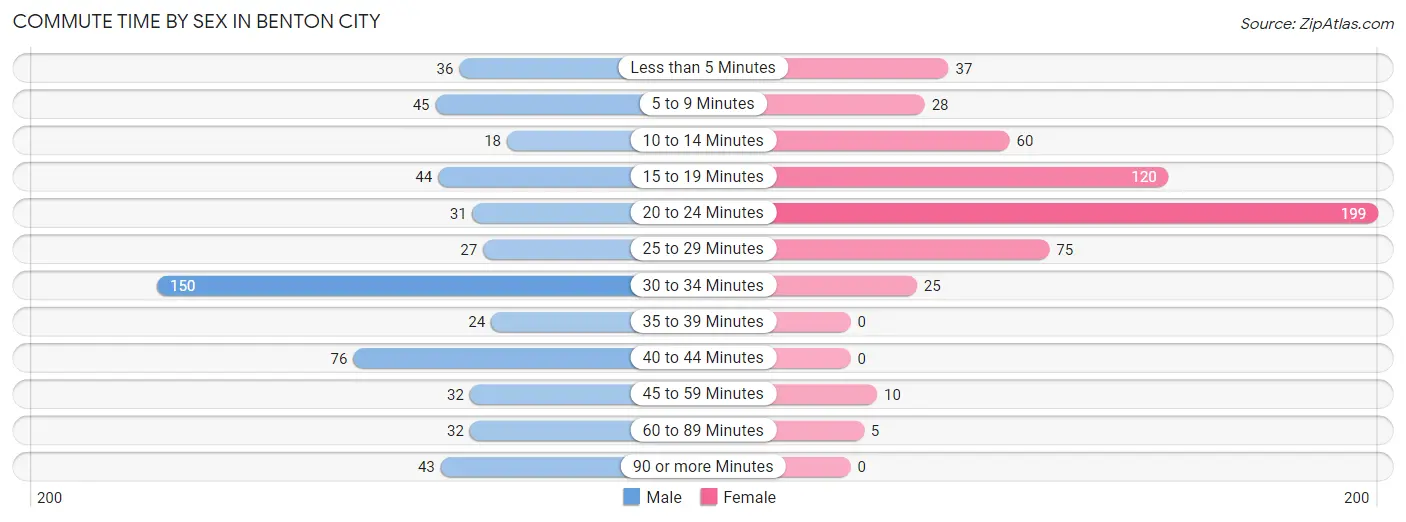
| Commute Time | Male | Female |
| Less than 5 Minutes | 36 (6.5%) | 37 (6.6%) |
| 5 to 9 Minutes | 45 (8.1%) | 28 (5.0%) |
| 10 to 14 Minutes | 18 (3.2%) | 60 (10.7%) |
| 15 to 19 Minutes | 44 (7.9%) | 120 (21.5%) |
| 20 to 24 Minutes | 31 (5.6%) | 199 (35.6%) |
| 25 to 29 Minutes | 27 (4.8%) | 75 (13.4%) |
| 30 to 34 Minutes | 150 (26.9%) | 25 (4.5%) |
| 35 to 39 Minutes | 24 (4.3%) | 0 (0.0%) |
| 40 to 44 Minutes | 76 (13.6%) | 0 (0.0%) |
| 45 to 59 Minutes | 32 (5.7%) | 10 (1.8%) |
| 60 to 89 Minutes | 32 (5.7%) | 5 (0.9%) |
| 90 or more Minutes | 43 (7.7%) | 0 (0.0%) |
Time of Departure to Work by Sex in Benton City
The most frequent times of departure to work in Benton City are 5:30 AM to 5:59 AM (117, 21.0%) for males and 9:00 AM to 9:59 AM (89, 15.9%) for females.
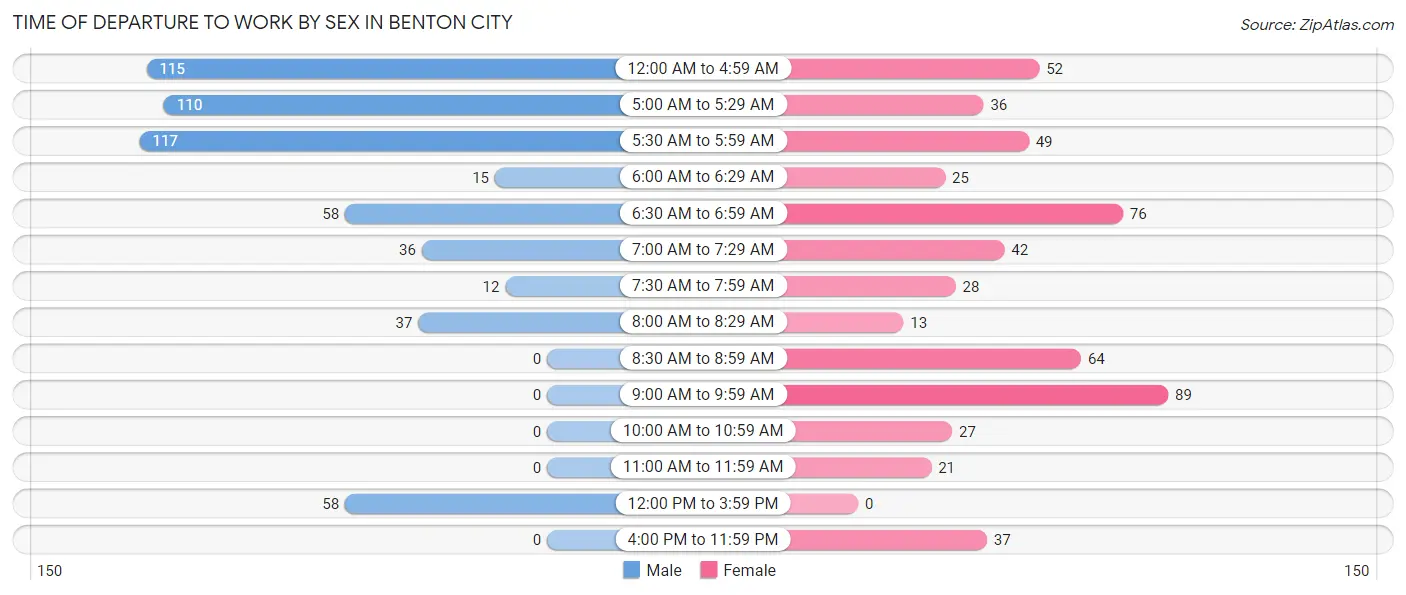
| Time of Departure | Male | Female |
| 12:00 AM to 4:59 AM | 115 (20.6%) | 52 (9.3%) |
| 5:00 AM to 5:29 AM | 110 (19.7%) | 36 (6.4%) |
| 5:30 AM to 5:59 AM | 117 (21.0%) | 49 (8.8%) |
| 6:00 AM to 6:29 AM | 15 (2.7%) | 25 (4.5%) |
| 6:30 AM to 6:59 AM | 58 (10.4%) | 76 (13.6%) |
| 7:00 AM to 7:29 AM | 36 (6.5%) | 42 (7.5%) |
| 7:30 AM to 7:59 AM | 12 (2.1%) | 28 (5.0%) |
| 8:00 AM to 8:29 AM | 37 (6.6%) | 13 (2.3%) |
| 8:30 AM to 8:59 AM | 0 (0.0%) | 64 (11.5%) |
| 9:00 AM to 9:59 AM | 0 (0.0%) | 89 (15.9%) |
| 10:00 AM to 10:59 AM | 0 (0.0%) | 27 (4.8%) |
| 11:00 AM to 11:59 AM | 0 (0.0%) | 21 (3.8%) |
| 12:00 PM to 3:59 PM | 58 (10.4%) | 0 (0.0%) |
| 4:00 PM to 11:59 PM | 0 (0.0%) | 37 (6.6%) |
| Total | 558 (100.0%) | 559 (100.0%) |
Housing Occupancy in Benton City
Occupancy by Ownership in Benton City
Of the total 1,310 dwellings in Benton City, owner-occupied units account for 1,032 (78.8%), while renter-occupied units make up 278 (21.2%).
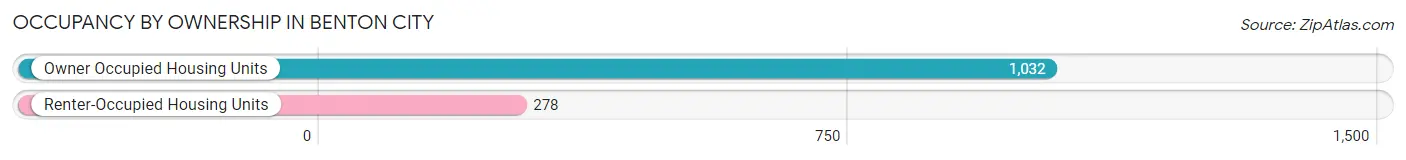
| Occupancy | # Housing Units | % Housing Units |
| Owner Occupied Housing Units | 1,032 | 78.8% |
| Renter-Occupied Housing Units | 278 | 21.2% |
| Total Occupied Housing Units | 1,310 | 100.0% |
Occupancy by Household Size in Benton City
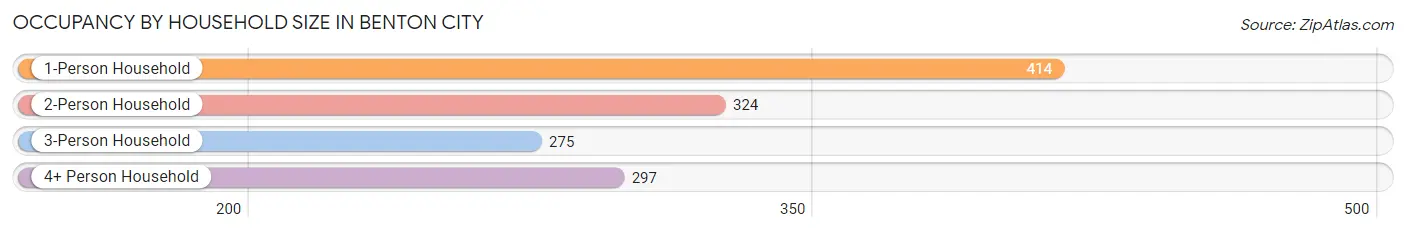
| Household Size | # Housing Units | % Housing Units |
| 1-Person Household | 414 | 31.6% |
| 2-Person Household | 324 | 24.7% |
| 3-Person Household | 275 | 21.0% |
| 4+ Person Household | 297 | 22.7% |
| Total Housing Units | 1,310 | 100.0% |
Occupancy by Ownership by Household Size in Benton City
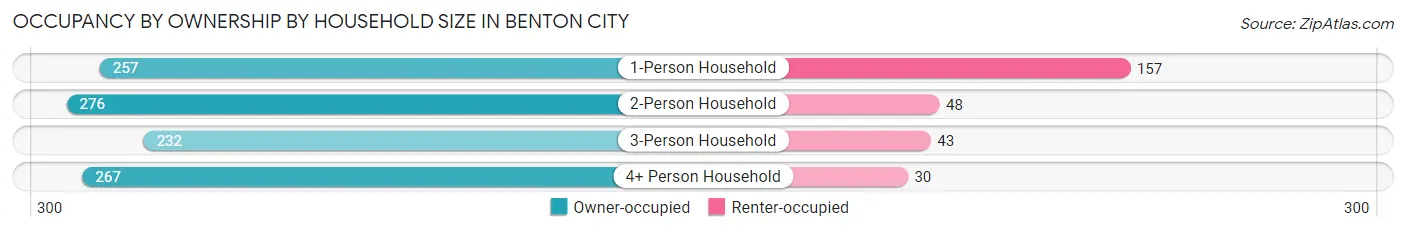
| Household Size | Owner-occupied | Renter-occupied |
| 1-Person Household | 257 (62.1%) | 157 (37.9%) |
| 2-Person Household | 276 (85.2%) | 48 (14.8%) |
| 3-Person Household | 232 (84.4%) | 43 (15.6%) |
| 4+ Person Household | 267 (89.9%) | 30 (10.1%) |
| Total Housing Units | 1,032 (78.8%) | 278 (21.2%) |
Occupancy by Educational Attainment in Benton City
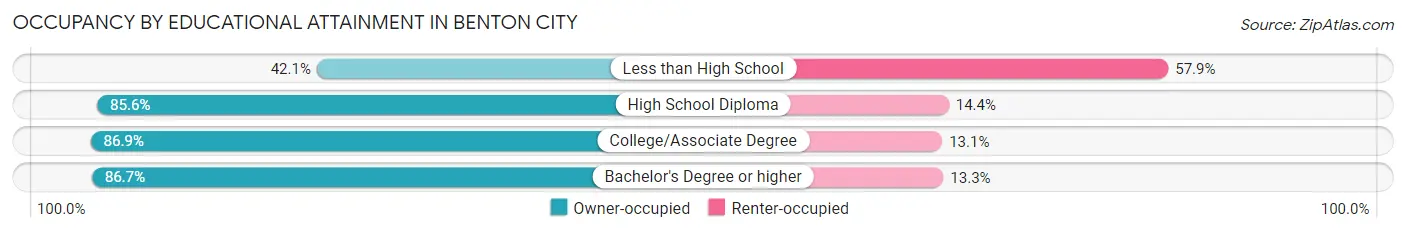
| Household Size | Owner-occupied | Renter-occupied |
| Less than High School | 93 (42.1%) | 128 (57.9%) |
| High School Diploma | 476 (85.6%) | 80 (14.4%) |
| College/Associate Degree | 398 (86.9%) | 60 (13.1%) |
| Bachelor's Degree or higher | 65 (86.7%) | 10 (13.3%) |
Occupancy by Age of Householder in Benton City
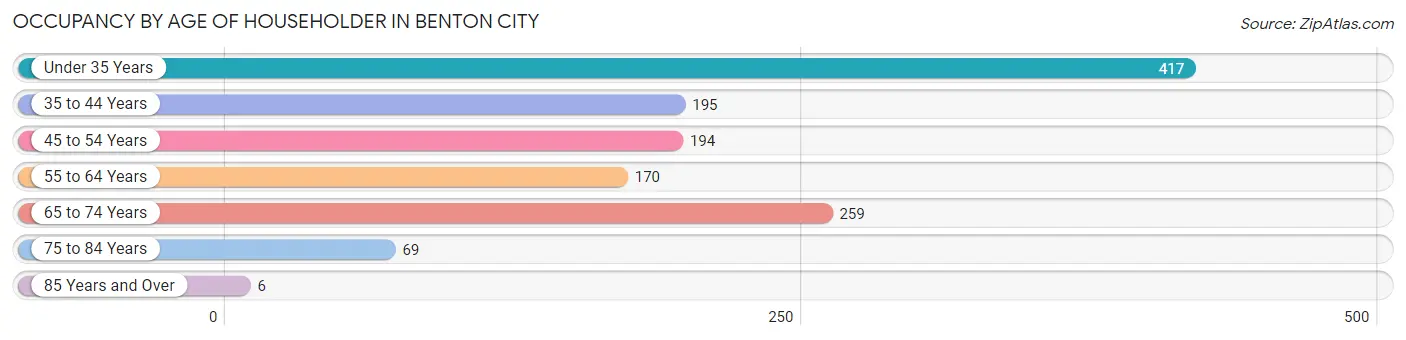
| Age Bracket | # Households | % Households |
| Under 35 Years | 417 | 31.8% |
| 35 to 44 Years | 195 | 14.9% |
| 45 to 54 Years | 194 | 14.8% |
| 55 to 64 Years | 170 | 13.0% |
| 65 to 74 Years | 259 | 19.8% |
| 75 to 84 Years | 69 | 5.3% |
| 85 Years and Over | 6 | 0.5% |
| Total | 1,310 | 100.0% |
Housing Finances in Benton City
Median Income by Occupancy in Benton City
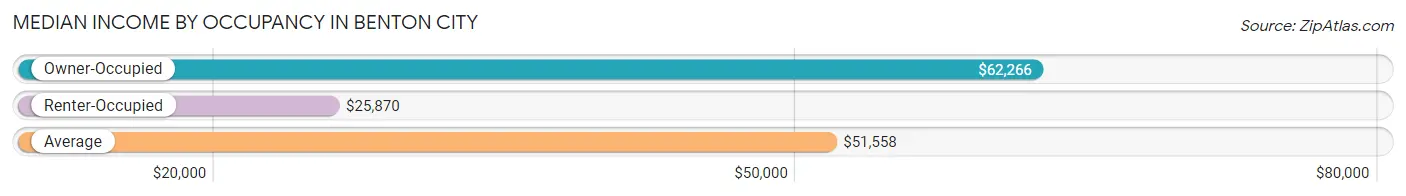
| Occupancy Type | # Households | Median Income |
| Owner-Occupied | 1,032 (78.8%) | $62,266 |
| Renter-Occupied | 278 (21.2%) | $25,870 |
| Average | 1,310 (100.0%) | $51,558 |
Occupancy by Householder Income Bracket in Benton City
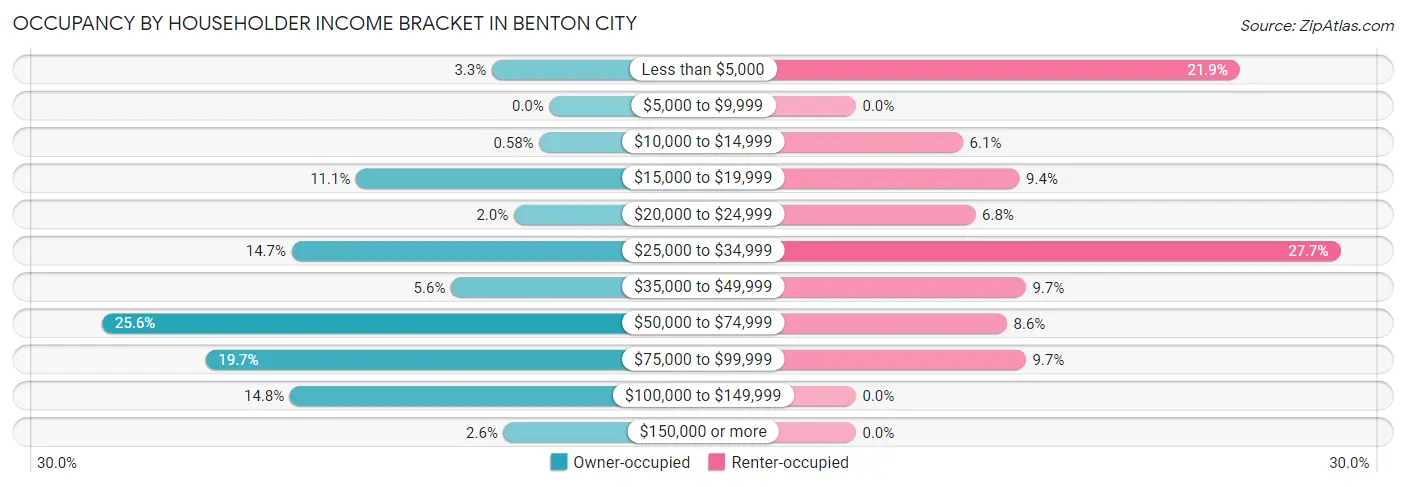
| Income Bracket | Owner-occupied | Renter-occupied |
| Less than $5,000 | 34 (3.3%) | 61 (21.9%) |
| $5,000 to $9,999 | 0 (0.0%) | 0 (0.0%) |
| $10,000 to $14,999 | 6 (0.6%) | 17 (6.1%) |
| $15,000 to $19,999 | 114 (11.1%) | 26 (9.3%) |
| $20,000 to $24,999 | 21 (2.0%) | 19 (6.8%) |
| $25,000 to $34,999 | 152 (14.7%) | 77 (27.7%) |
| $35,000 to $49,999 | 58 (5.6%) | 27 (9.7%) |
| $50,000 to $74,999 | 264 (25.6%) | 24 (8.6%) |
| $75,000 to $99,999 | 203 (19.7%) | 27 (9.7%) |
| $100,000 to $149,999 | 153 (14.8%) | 0 (0.0%) |
| $150,000 or more | 27 (2.6%) | 0 (0.0%) |
| Total | 1,032 (100.0%) | 278 (100.0%) |
Monthly Housing Cost Tiers in Benton City
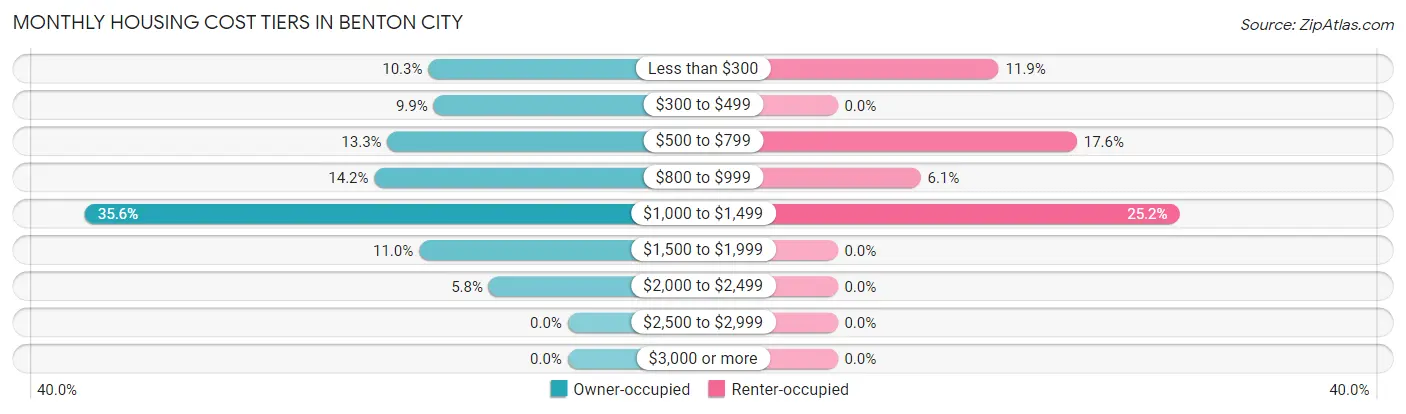
| Monthly Cost | Owner-occupied | Renter-occupied |
| Less than $300 | 106 (10.3%) | 33 (11.9%) |
| $300 to $499 | 102 (9.9%) | 0 (0.0%) |
| $500 to $799 | 137 (13.3%) | 49 (17.6%) |
| $800 to $999 | 147 (14.2%) | 17 (6.1%) |
| $1,000 to $1,499 | 367 (35.6%) | 70 (25.2%) |
| $1,500 to $1,999 | 113 (11.0%) | 0 (0.0%) |
| $2,000 to $2,499 | 60 (5.8%) | 0 (0.0%) |
| $2,500 to $2,999 | 0 (0.0%) | 0 (0.0%) |
| $3,000 or more | 0 (0.0%) | 0 (0.0%) |
| Total | 1,032 (100.0%) | 278 (100.0%) |
Physical Housing Characteristics in Benton City
Housing Structures in Benton City
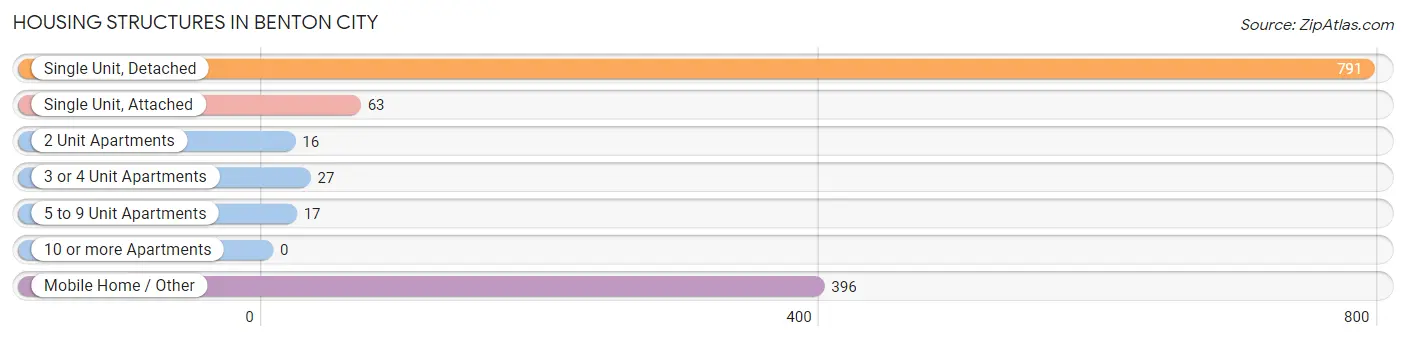
| Structure Type | # Housing Units | % Housing Units |
| Single Unit, Detached | 791 | 60.4% |
| Single Unit, Attached | 63 | 4.8% |
| 2 Unit Apartments | 16 | 1.2% |
| 3 or 4 Unit Apartments | 27 | 2.1% |
| 5 to 9 Unit Apartments | 17 | 1.3% |
| 10 or more Apartments | 0 | 0.0% |
| Mobile Home / Other | 396 | 30.2% |
| Total | 1,310 | 100.0% |
Housing Structures by Occupancy in Benton City
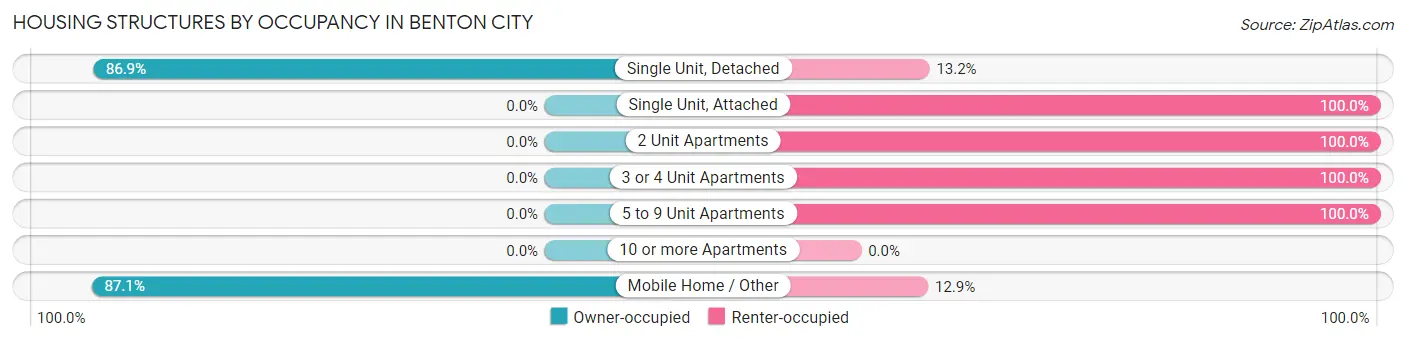
| Structure Type | Owner-occupied | Renter-occupied |
| Single Unit, Detached | 687 (86.9%) | 104 (13.2%) |
| Single Unit, Attached | 0 (0.0%) | 63 (100.0%) |
| 2 Unit Apartments | 0 (0.0%) | 16 (100.0%) |
| 3 or 4 Unit Apartments | 0 (0.0%) | 27 (100.0%) |
| 5 to 9 Unit Apartments | 0 (0.0%) | 17 (100.0%) |
| 10 or more Apartments | 0 (0.0%) | 0 (0.0%) |
| Mobile Home / Other | 345 (87.1%) | 51 (12.9%) |
| Total | 1,032 (78.8%) | 278 (21.2%) |
Housing Structures by Number of Rooms in Benton City
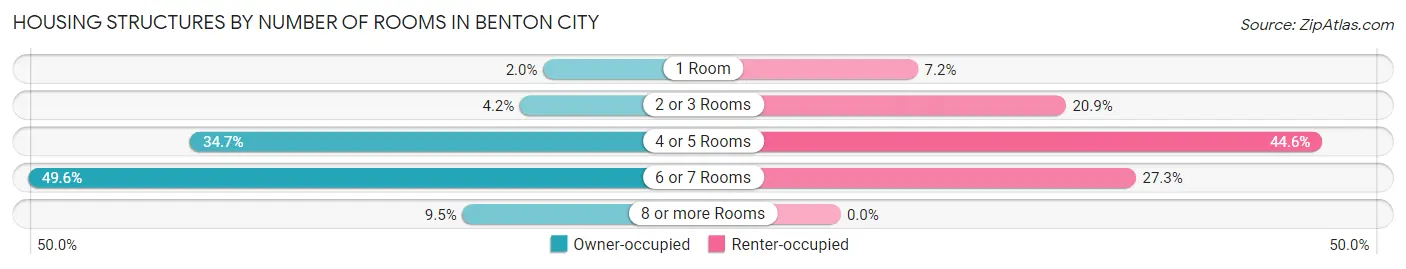
| Number of Rooms | Owner-occupied | Renter-occupied |
| 1 Room | 21 (2.0%) | 20 (7.2%) |
| 2 or 3 Rooms | 43 (4.2%) | 58 (20.9%) |
| 4 or 5 Rooms | 358 (34.7%) | 124 (44.6%) |
| 6 or 7 Rooms | 512 (49.6%) | 76 (27.3%) |
| 8 or more Rooms | 98 (9.5%) | 0 (0.0%) |
| Total | 1,032 (100.0%) | 278 (100.0%) |
Housing Structure by Heating Type in Benton City
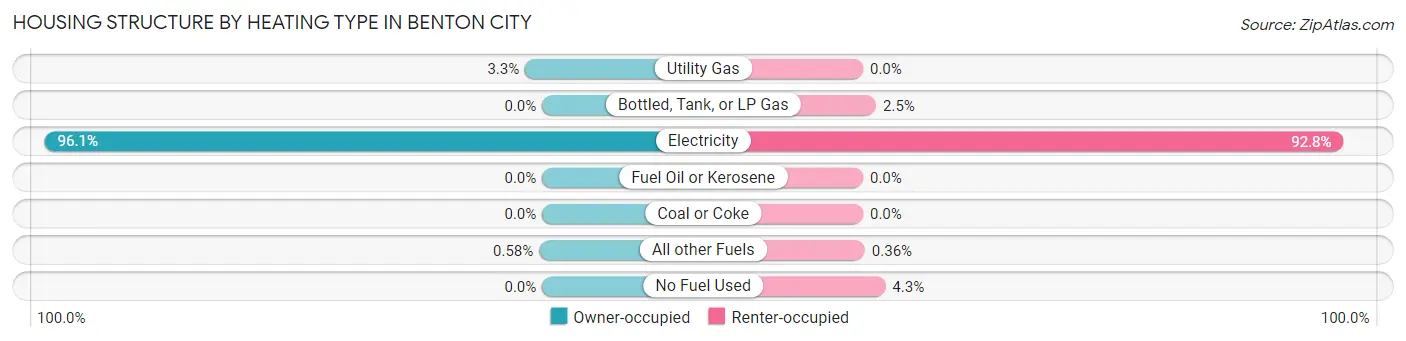
| Heating Type | Owner-occupied | Renter-occupied |
| Utility Gas | 34 (3.3%) | 0 (0.0%) |
| Bottled, Tank, or LP Gas | 0 (0.0%) | 7 (2.5%) |
| Electricity | 992 (96.1%) | 258 (92.8%) |
| Fuel Oil or Kerosene | 0 (0.0%) | 0 (0.0%) |
| Coal or Coke | 0 (0.0%) | 0 (0.0%) |
| All other Fuels | 6 (0.6%) | 1 (0.4%) |
| No Fuel Used | 0 (0.0%) | 12 (4.3%) |
| Total | 1,032 (100.0%) | 278 (100.0%) |
Household Vehicle Usage in Benton City
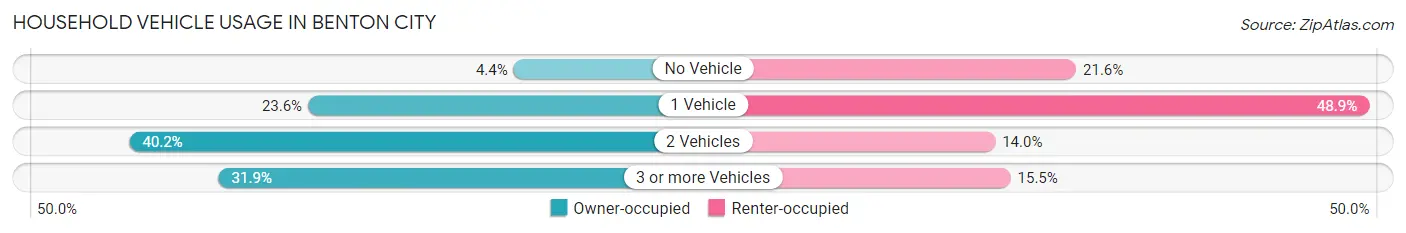
| Vehicles per Household | Owner-occupied | Renter-occupied |
| No Vehicle | 45 (4.4%) | 60 (21.6%) |
| 1 Vehicle | 243 (23.5%) | 136 (48.9%) |
| 2 Vehicles | 415 (40.2%) | 39 (14.0%) |
| 3 or more Vehicles | 329 (31.9%) | 43 (15.5%) |
| Total | 1,032 (100.0%) | 278 (100.0%) |
Real Estate & Mortgages in Benton City
Real Estate and Mortgage Overview in Benton City
| Characteristic | Without Mortgage | With Mortgage |
| Housing Units | 290 | 742 |
| Median Property Value | $146,100 | $229,800 |
| Median Household Income | $55,417 | $22 |
| Monthly Housing Costs | $417 | $0 |
| Real Estate Taxes | $1,767 | $24 |
Property Value by Mortgage Status in Benton City
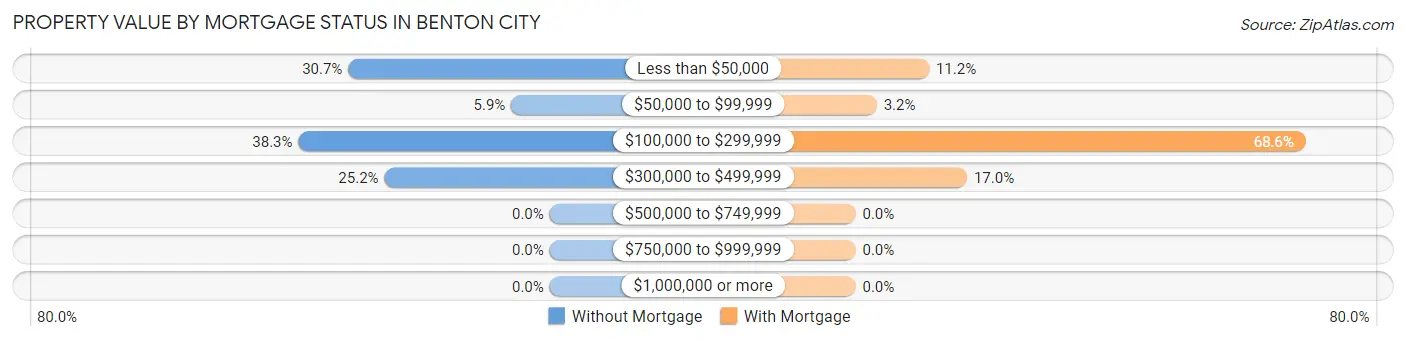
| Property Value | Without Mortgage | With Mortgage |
| Less than $50,000 | 89 (30.7%) | 83 (11.2%) |
| $50,000 to $99,999 | 17 (5.9%) | 24 (3.2%) |
| $100,000 to $299,999 | 111 (38.3%) | 509 (68.6%) |
| $300,000 to $499,999 | 73 (25.2%) | 126 (17.0%) |
| $500,000 to $749,999 | 0 (0.0%) | 0 (0.0%) |
| $750,000 to $999,999 | 0 (0.0%) | 0 (0.0%) |
| $1,000,000 or more | 0 (0.0%) | 0 (0.0%) |
| Total | 290 (100.0%) | 742 (100.0%) |
Household Income by Mortgage Status in Benton City
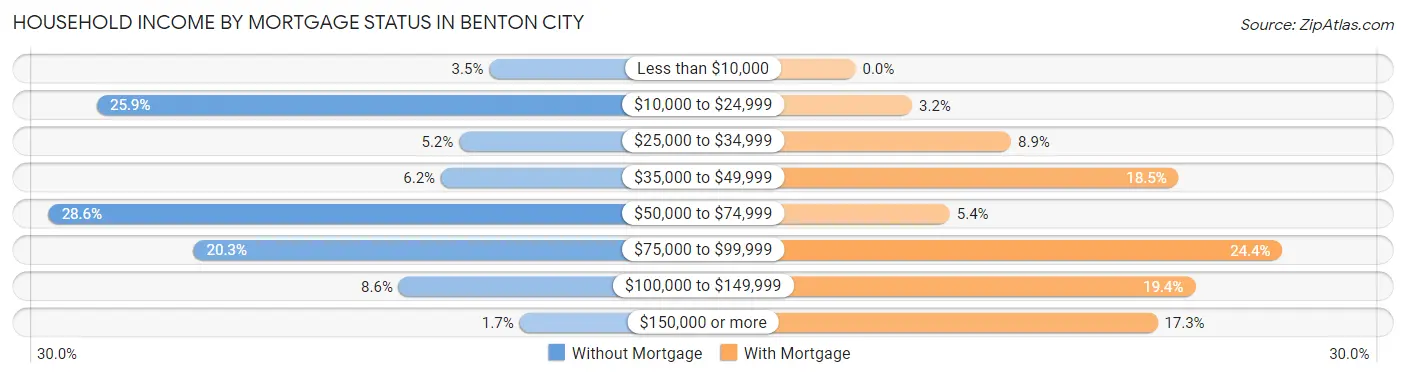
| Household Income | Without Mortgage | With Mortgage |
| Less than $10,000 | 10 (3.5%) | 0 (0.0%) |
| $10,000 to $24,999 | 75 (25.9%) | 24 (3.2%) |
| $25,000 to $34,999 | 15 (5.2%) | 66 (8.9%) |
| $35,000 to $49,999 | 18 (6.2%) | 137 (18.5%) |
| $50,000 to $74,999 | 83 (28.6%) | 40 (5.4%) |
| $75,000 to $99,999 | 59 (20.3%) | 181 (24.4%) |
| $100,000 to $149,999 | 25 (8.6%) | 144 (19.4%) |
| $150,000 or more | 5 (1.7%) | 128 (17.2%) |
| Total | 290 (100.0%) | 742 (100.0%) |
Property Value to Household Income Ratio in Benton City
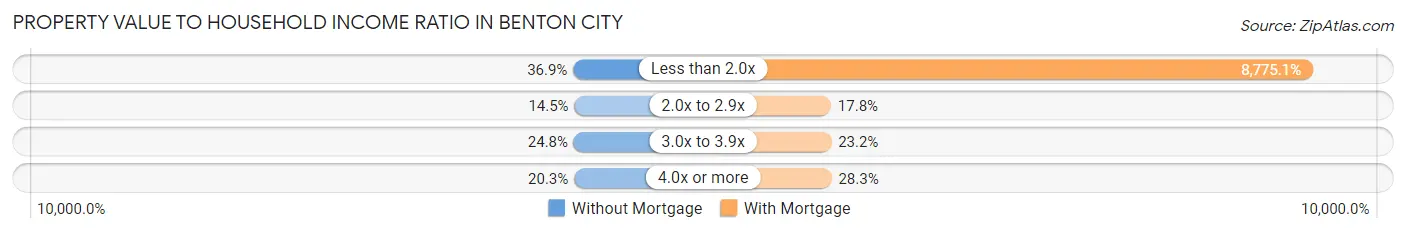
| Value-to-Income Ratio | Without Mortgage | With Mortgage |
| Less than 2.0x | 107 (36.9%) | 65,111 (8,775.1%) |
| 2.0x to 2.9x | 42 (14.5%) | 132 (17.8%) |
| 3.0x to 3.9x | 72 (24.8%) | 172 (23.2%) |
| 4.0x or more | 59 (20.3%) | 210 (28.3%) |
| Total | 290 (100.0%) | 742 (100.0%) |
Real Estate Taxes by Mortgage Status in Benton City
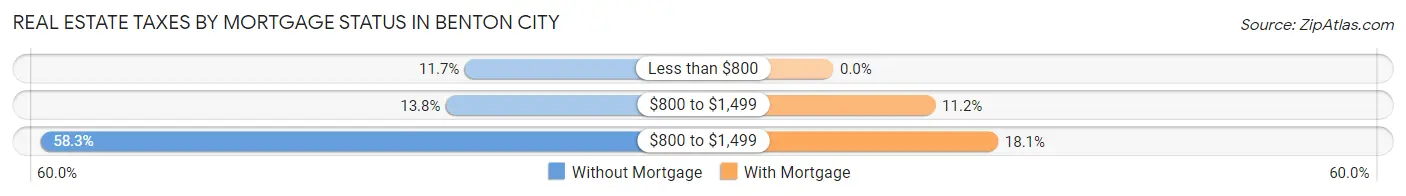
| Property Taxes | Without Mortgage | With Mortgage |
| Less than $800 | 34 (11.7%) | 0 (0.0%) |
| $800 to $1,499 | 40 (13.8%) | 83 (11.2%) |
| $800 to $1,499 | 169 (58.3%) | 134 (18.1%) |
| Total | 290 (100.0%) | 742 (100.0%) |
Health & Disability in Benton City
Health Insurance Coverage by Age in Benton City
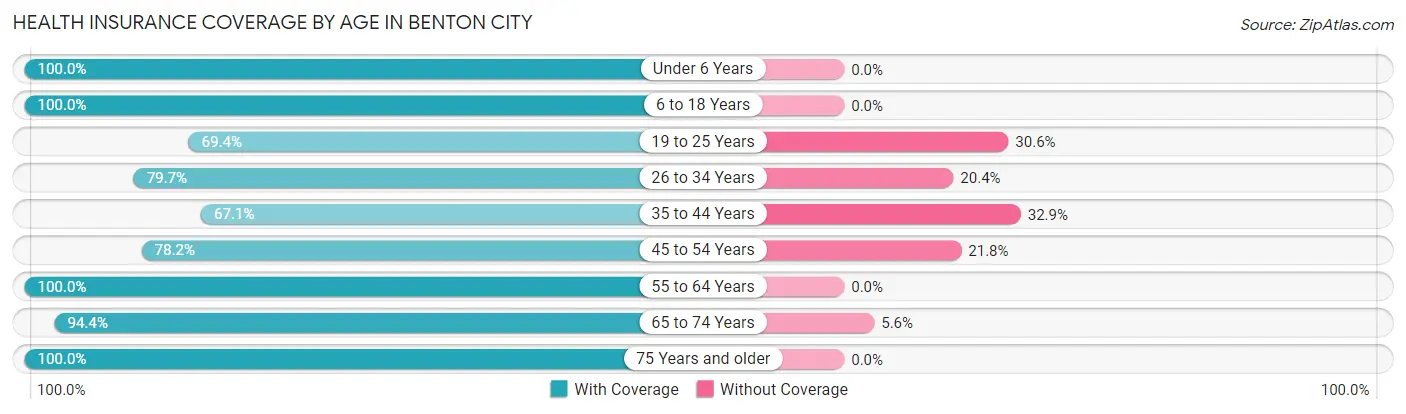
| Age Bracket | With Coverage | Without Coverage |
| Under 6 Years | 679 (100.0%) | 0 (0.0%) |
| 6 to 18 Years | 443 (100.0%) | 0 (0.0%) |
| 19 to 25 Years | 279 (69.4%) | 123 (30.6%) |
| 26 to 34 Years | 454 (79.6%) | 116 (20.3%) |
| 35 to 44 Years | 212 (67.1%) | 104 (32.9%) |
| 45 to 54 Years | 265 (78.2%) | 74 (21.8%) |
| 55 to 64 Years | 328 (100.0%) | 0 (0.0%) |
| 65 to 74 Years | 287 (94.4%) | 17 (5.6%) |
| 75 Years and older | 117 (100.0%) | 0 (0.0%) |
| Total | 3,064 (87.6%) | 434 (12.4%) |
Health Insurance Coverage by Citizenship Status in Benton City
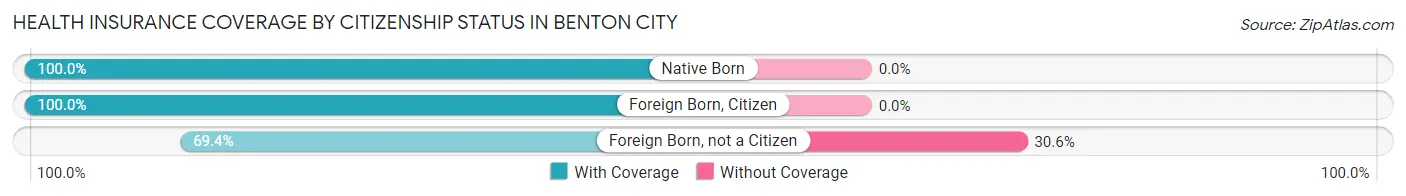
| Citizenship Status | With Coverage | Without Coverage |
| Native Born | 679 (100.0%) | 0 (0.0%) |
| Foreign Born, Citizen | 443 (100.0%) | 0 (0.0%) |
| Foreign Born, not a Citizen | 279 (69.4%) | 123 (30.6%) |
Health Insurance Coverage by Household Income in Benton City
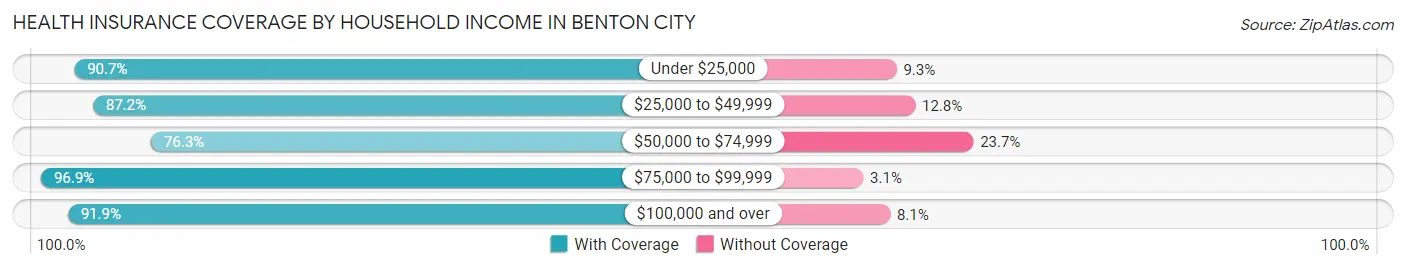
| Household Income | With Coverage | Without Coverage |
| Under $25,000 | 429 (90.7%) | 44 (9.3%) |
| $25,000 to $49,999 | 696 (87.2%) | 102 (12.8%) |
| $50,000 to $74,999 | 664 (76.3%) | 206 (23.7%) |
| $75,000 to $99,999 | 537 (96.9%) | 17 (3.1%) |
| $100,000 and over | 738 (91.9%) | 65 (8.1%) |
Public vs Private Health Insurance Coverage by Age in Benton City
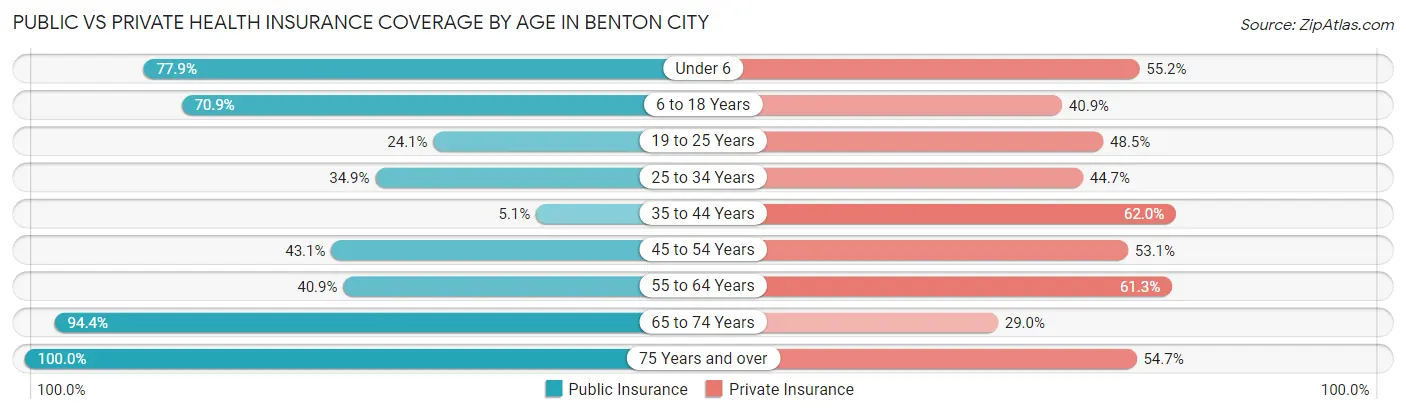
| Age Bracket | Public Insurance | Private Insurance |
| Under 6 | 529 (77.9%) | 375 (55.2%) |
| 6 to 18 Years | 314 (70.9%) | 181 (40.9%) |
| 19 to 25 Years | 97 (24.1%) | 195 (48.5%) |
| 25 to 34 Years | 199 (34.9%) | 255 (44.7%) |
| 35 to 44 Years | 16 (5.1%) | 196 (62.0%) |
| 45 to 54 Years | 146 (43.1%) | 180 (53.1%) |
| 55 to 64 Years | 134 (40.8%) | 201 (61.3%) |
| 65 to 74 Years | 287 (94.4%) | 88 (28.9%) |
| 75 Years and over | 117 (100.0%) | 64 (54.7%) |
| Total | 1,839 (52.6%) | 1,735 (49.6%) |
Disability Status by Sex by Age in Benton City
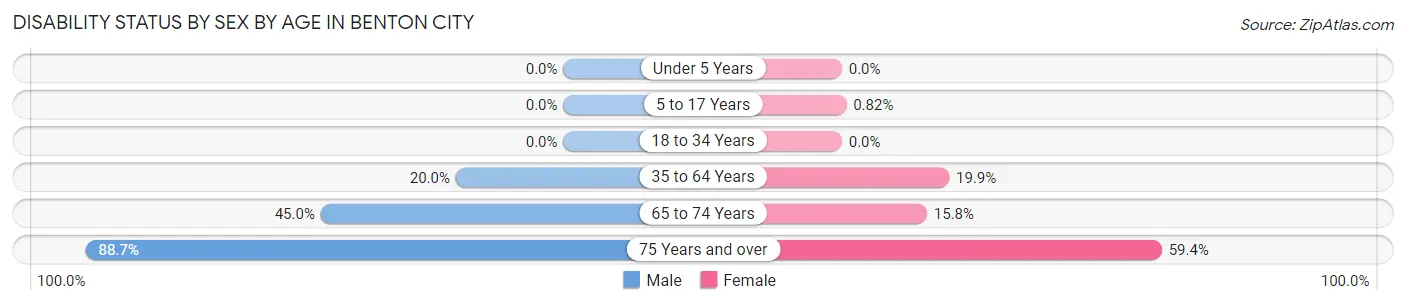
| Age Bracket | Male | Female |
| Under 5 Years | 0 (0.0%) | 0 (0.0%) |
| 5 to 17 Years | 0 (0.0%) | 2 (0.8%) |
| 18 to 34 Years | 0 (0.0%) | 0 (0.0%) |
| 35 to 64 Years | 95 (20.0%) | 101 (19.9%) |
| 65 to 74 Years | 77 (45.0%) | 21 (15.8%) |
| 75 Years and over | 47 (88.7%) | 38 (59.4%) |
Disability Class by Sex by Age in Benton City
Disability Class: Hearing Difficulty
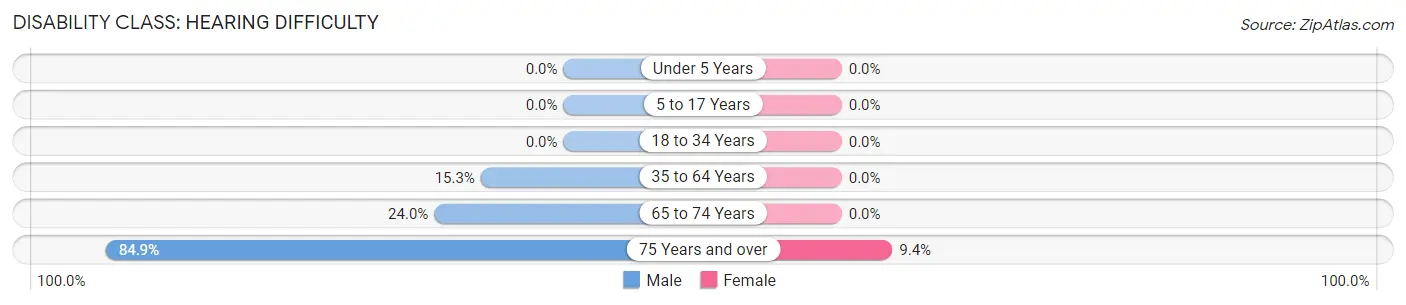
| Age Bracket | Male | Female |
| Under 5 Years | 0 (0.0%) | 0 (0.0%) |
| 5 to 17 Years | 0 (0.0%) | 0 (0.0%) |
| 18 to 34 Years | 0 (0.0%) | 0 (0.0%) |
| 35 to 64 Years | 73 (15.3%) | 0 (0.0%) |
| 65 to 74 Years | 41 (24.0%) | 0 (0.0%) |
| 75 Years and over | 45 (84.9%) | 6 (9.4%) |
Disability Class: Vision Difficulty
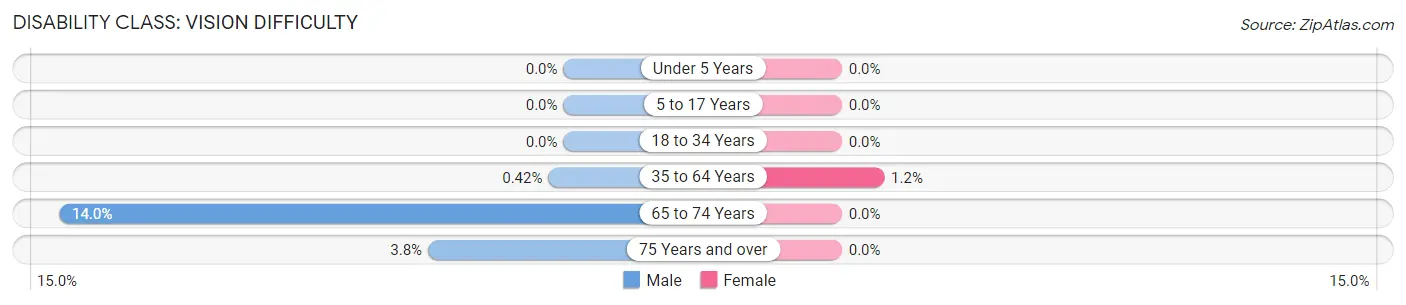
| Age Bracket | Male | Female |
| Under 5 Years | 0 (0.0%) | 0 (0.0%) |
| 5 to 17 Years | 0 (0.0%) | 0 (0.0%) |
| 18 to 34 Years | 0 (0.0%) | 0 (0.0%) |
| 35 to 64 Years | 2 (0.4%) | 6 (1.2%) |
| 65 to 74 Years | 24 (14.0%) | 0 (0.0%) |
| 75 Years and over | 2 (3.8%) | 0 (0.0%) |
Disability Class: Cognitive Difficulty
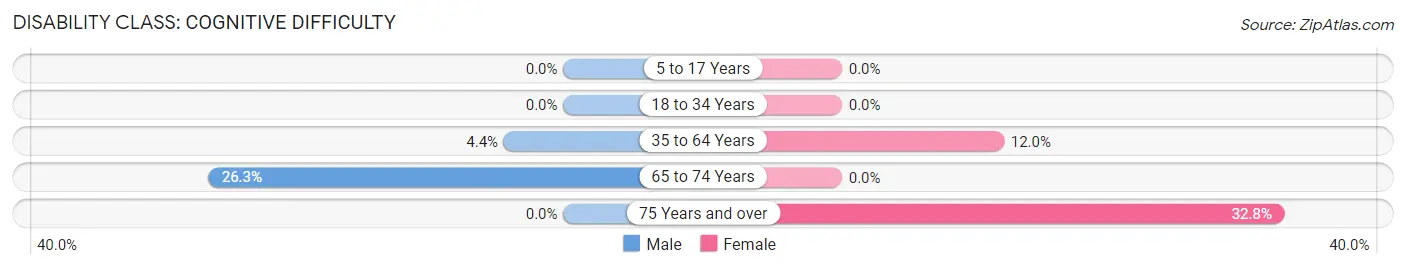
| Age Bracket | Male | Female |
| 5 to 17 Years | 0 (0.0%) | 0 (0.0%) |
| 18 to 34 Years | 0 (0.0%) | 0 (0.0%) |
| 35 to 64 Years | 21 (4.4%) | 61 (12.0%) |
| 65 to 74 Years | 45 (26.3%) | 0 (0.0%) |
| 75 Years and over | 0 (0.0%) | 21 (32.8%) |
Disability Class: Ambulatory Difficulty
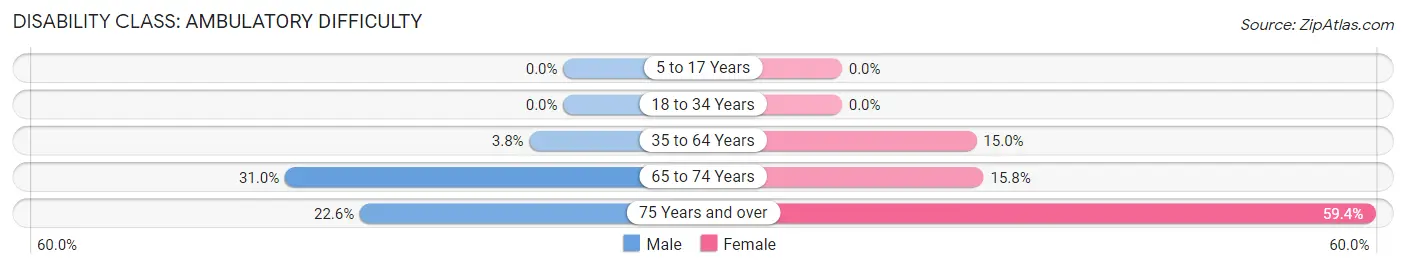
| Age Bracket | Male | Female |
| 5 to 17 Years | 0 (0.0%) | 0 (0.0%) |
| 18 to 34 Years | 0 (0.0%) | 0 (0.0%) |
| 35 to 64 Years | 18 (3.8%) | 76 (15.0%) |
| 65 to 74 Years | 53 (31.0%) | 21 (15.8%) |
| 75 Years and over | 12 (22.6%) | 38 (59.4%) |
Disability Class: Self-Care Difficulty
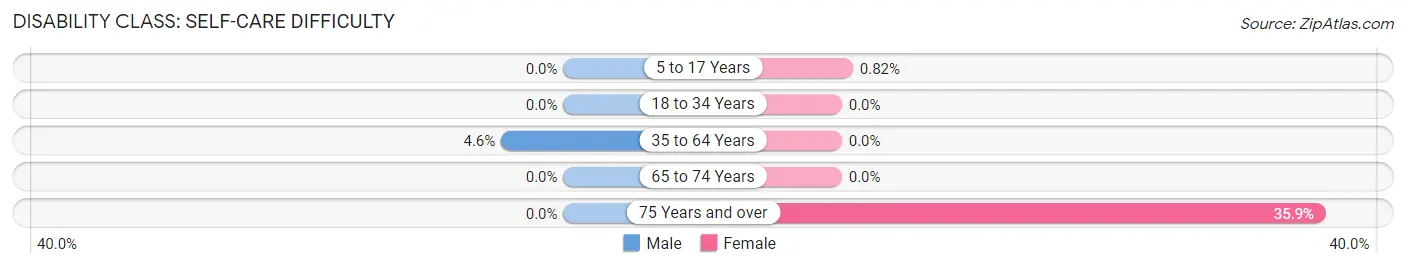
| Age Bracket | Male | Female |
| 5 to 17 Years | 0 (0.0%) | 2 (0.8%) |
| 18 to 34 Years | 0 (0.0%) | 0 (0.0%) |
| 35 to 64 Years | 22 (4.6%) | 0 (0.0%) |
| 65 to 74 Years | 0 (0.0%) | 0 (0.0%) |
| 75 Years and over | 0 (0.0%) | 23 (35.9%) |
Technology Access in Benton City
Computing Device Access in Benton City
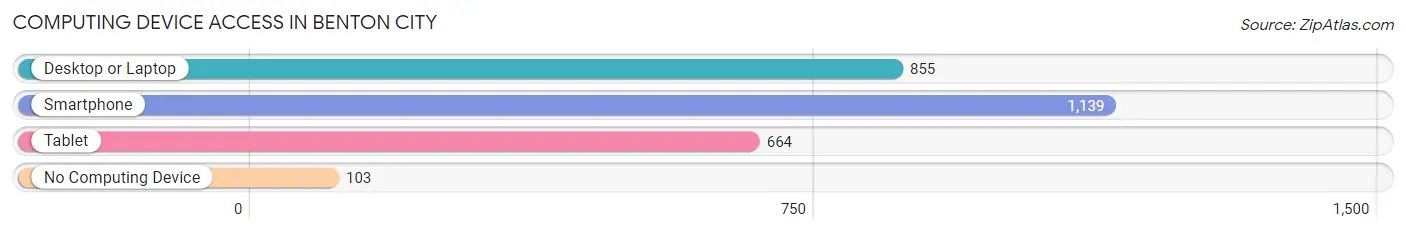
| Device Type | # Households | % Households |
| Desktop or Laptop | 855 | 65.3% |
| Smartphone | 1,139 | 87.0% |
| Tablet | 664 | 50.7% |
| No Computing Device | 103 | 7.9% |
| Total | 1,310 | 100.0% |
Internet Access in Benton City
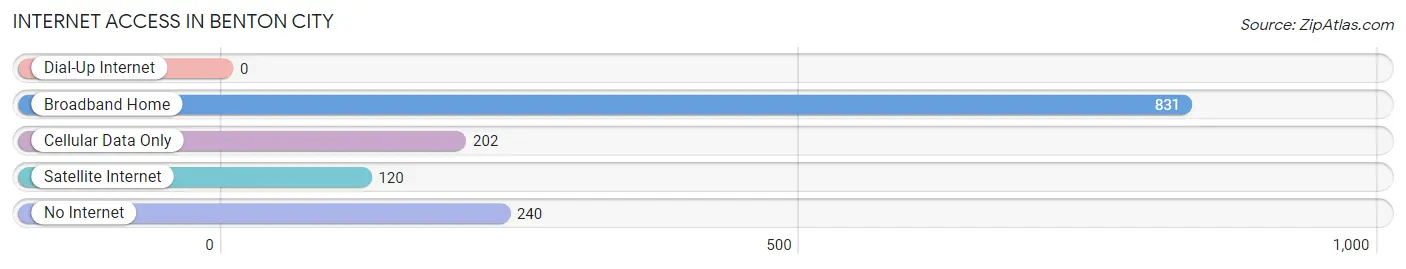
| Internet Type | # Households | % Households |
| Dial-Up Internet | 0 | 0.0% |
| Broadband Home | 831 | 63.4% |
| Cellular Data Only | 202 | 15.4% |
| Satellite Internet | 120 | 9.2% |
| No Internet | 240 | 18.3% |
| Total | 1,310 | 100.0% |
Benton City Summary
Benton City is a small city located in the southeastern corner of Washington State, in the United States. It is situated in the Yakima Valley, which is part of the Columbia Plateau. The city is located in Benton County, and is part of the Tri-Cities metropolitan area, which includes the cities of Kennewick, Pasco, and Richland. The population of Benton City was 4,845 at the 2010 census.
History
The area that is now Benton City was first settled in the late 1800s by homesteaders. The first post office was established in 1891, and the town was officially incorporated in 1909. The city was named after Thomas Hart Benton, a U.S. Senator from Missouri.
The city was originally an agricultural community, and the main crops grown were apples, cherries, and hops. The Yakima Valley was known for its fruit production, and Benton City was no exception. The city was also home to several hop farms, which supplied hops to the local breweries.
In the 1950s, the city began to experience a population boom, as people moved to the area to take advantage of the booming agricultural industry. The population of Benton City peaked in the 1960s, and has since declined slightly.
Geography
Benton City is located in the southeastern corner of Washington State, in the Yakima Valley. The city is situated at an elevation of 545 feet (166 m) above sea level. The city is located in Benton County, and is part of the Tri-Cities metropolitan area, which includes the cities of Kennewick, Pasco, and Richland.
The city is located on the banks of the Yakima River, and is surrounded by rolling hills and farmland. The climate in Benton City is semi-arid, with hot summers and cold winters. The average annual precipitation is 8.5 inches (216 mm).
Economy
The economy of Benton City is largely based on agriculture. The city is home to several fruit orchards, and the main crops grown are apples, cherries, and hops. The city is also home to several wineries, which produce a variety of wines.
The city is also home to several manufacturing companies, including a plastics manufacturer and a metal fabrication company. The city is also home to several retail stores, restaurants, and other businesses.
Demographics
As of the 2010 census, the population of Benton City was 4,845. The racial makeup of the city was 79.2% White, 0.7% African American, 0.7% Native American, 0.7% Asian, 0.2% Pacific Islander, 16.2% from other races, and 2.4% from two or more races. Hispanic or Latino of any race were 28.2% of the population.
The median income for a household in the city was $37,917, and the median income for a family was $41,917. The per capita income for the city was $17,845. About 17.2% of families and 20.2% of the population were below the poverty line, including 28.2% of those under age 18 and 8.2% of those age 65 or over.
Common Questions
What is Per Capita Income in Benton City?
Per Capita income in Benton City is $21,319.
What is the Median Family Income in Benton City?
Median Family Income in Benton City is $65,000.
What is the Median Household income in Benton City?
Median Household Income in Benton City is $51,558.
What is Income or Wage Gap in Benton City?
Income or Wage Gap in Benton City is 41.4%.
Women in Benton City earn 58.6 cents for every dollar earned by a man.
What is Inequality or Gini Index in Benton City?
Inequality or Gini Index in Benton City is 0.40.
What is the Total Population of Benton City?
Total Population of Benton City is 3,498.
What is the Total Male Population of Benton City?
Total Male Population of Benton City is 1,688.
What is the Total Female Population of Benton City?
Total Female Population of Benton City is 1,810.
What is the Ratio of Males per 100 Females in Benton City?
There are 93.26 Males per 100 Females in Benton City.
What is the Ratio of Females per 100 Males in Benton City?
There are 107.23 Females per 100 Males in Benton City.
What is the Median Population Age in Benton City?
Median Population Age in Benton City is 29.1 Years.
What is the Average Family Size in Benton City
Average Family Size in Benton City is 3.4 People.
What is the Average Household Size in Benton City
Average Household Size in Benton City is 2.7 People.
How Large is the Labor Force in Benton City?
There are 1,284 People in the Labor Forcein in Benton City.
What is the Percentage of People in the Labor Force in Benton City?
52.5% of People are in the Labor Force in Benton City.
What is the Unemployment Rate in Benton City?
Unemployment Rate in Benton City is 5.3%.