Lisbon, ND Map & Demographics
Lisbon Map
Lisbon Overview
$30,473
PER CAPITA INCOME
$83,810
AVG FAMILY INCOME
$61,250
AVG HOUSEHOLD INCOME
42.2%
WAGE / INCOME GAP [ % ]
57.8¢/ $1
WAGE / INCOME GAP [ $ ]
0.43
INEQUALITY / GINI INDEX
2,159
TOTAL POPULATION
1,082
MALE POPULATION
1,077
FEMALE POPULATION
100.46
MALES / 100 FEMALES
99.54
FEMALES / 100 MALES
42.5
MEDIAN AGE
3.1
AVG FAMILY SIZE
2.3
AVG HOUSEHOLD SIZE
926
LABOR FORCE [ PEOPLE ]
54.0%
PERCENT IN LABOR FORCE
4.5%
UNEMPLOYMENT RATE
Lisbon Zip Codes
Lisbon Area Codes
Income in Lisbon
Income Overview in Lisbon
Per Capita Income in Lisbon is $30,473, while median incomes of families and households are $83,810 and $61,250 respectively.
| Characteristic | Number | Measure |
| Per Capita Income | 2,159 | $30,473 |
| Median Family Income | 496 | $83,810 |
| Mean Family Income | 496 | $90,422 |
| Median Household Income | 896 | $61,250 |
| Mean Household Income | 896 | $70,855 |
| Income Deficit | 496 | $0 |
| Wage / Income Gap (%) | 2,159 | 42.25% |
| Wage / Income Gap ($) | 2,159 | 57.75¢ per $1 |
| Gini / Inequality Index | 2,159 | 0.43 |
Earnings by Sex in Lisbon
Average Earnings in Lisbon are $42,799, $58,063 for men and $33,534 for women, a difference of 42.2%.
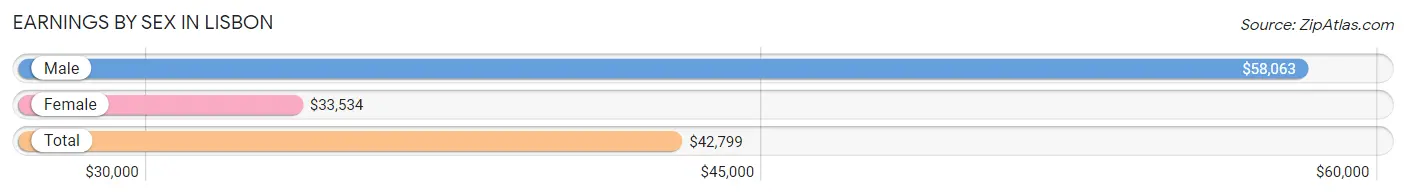
| Sex | Number | Average Earnings |
| Male | 499 (54.1%) | $58,063 |
| Female | 424 (45.9%) | $33,534 |
| Total | 923 (100.0%) | $42,799 |
Earnings by Sex by Income Bracket in Lisbon
The most common earnings brackets in Lisbon are $65,000 to $74,999 for men (103 | 20.6%) and $55,000 to $64,999 for women (66 | 15.6%).
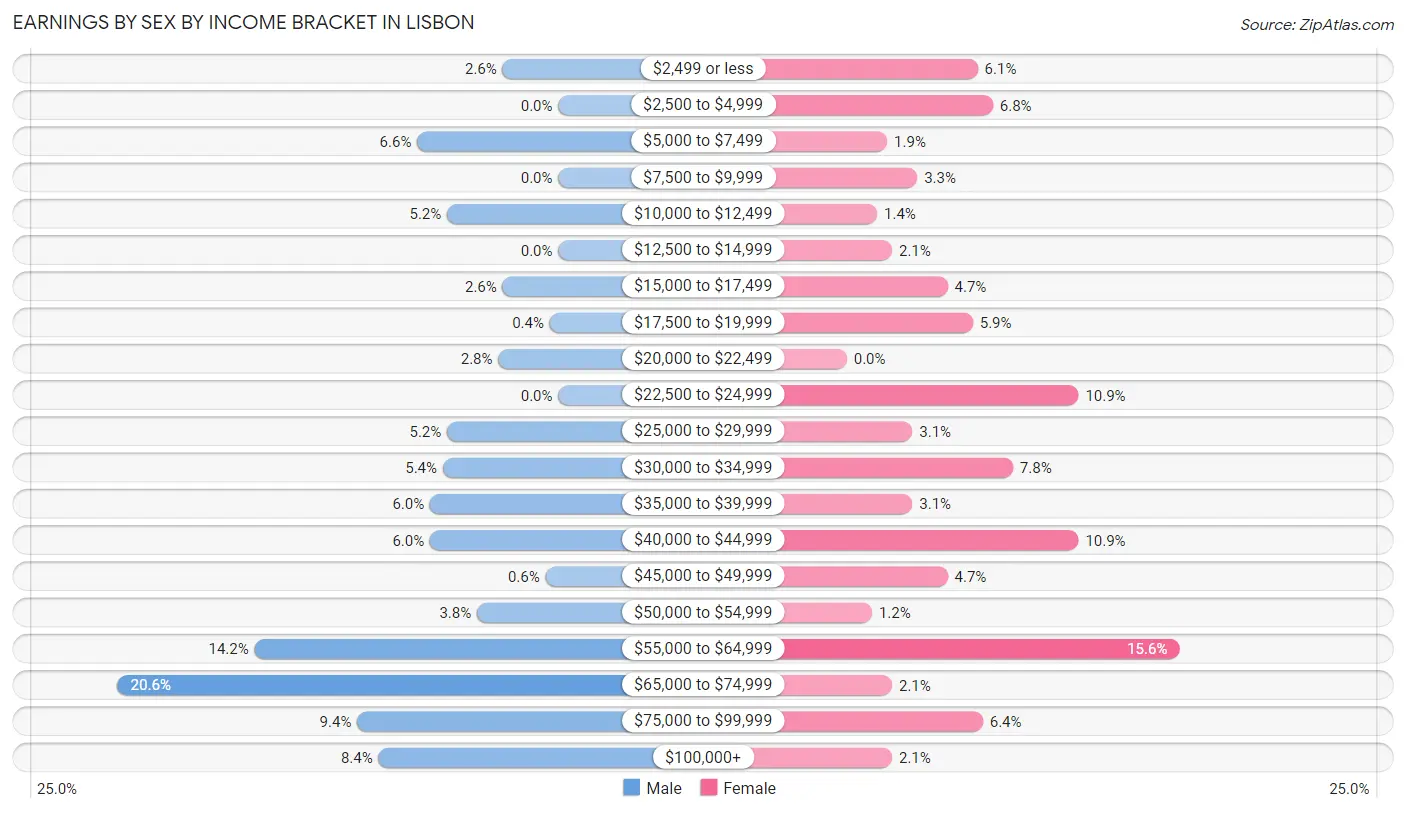
| Income | Male | Female |
| $2,499 or less | 13 (2.6%) | 26 (6.1%) |
| $2,500 to $4,999 | 0 (0.0%) | 29 (6.8%) |
| $5,000 to $7,499 | 33 (6.6%) | 8 (1.9%) |
| $7,500 to $9,999 | 0 (0.0%) | 14 (3.3%) |
| $10,000 to $12,499 | 26 (5.2%) | 6 (1.4%) |
| $12,500 to $14,999 | 0 (0.0%) | 9 (2.1%) |
| $15,000 to $17,499 | 13 (2.6%) | 20 (4.7%) |
| $17,500 to $19,999 | 2 (0.4%) | 25 (5.9%) |
| $20,000 to $22,499 | 14 (2.8%) | 0 (0.0%) |
| $22,500 to $24,999 | 0 (0.0%) | 46 (10.8%) |
| $25,000 to $29,999 | 26 (5.2%) | 13 (3.1%) |
| $30,000 to $34,999 | 27 (5.4%) | 33 (7.8%) |
| $35,000 to $39,999 | 30 (6.0%) | 13 (3.1%) |
| $40,000 to $44,999 | 30 (6.0%) | 46 (10.8%) |
| $45,000 to $49,999 | 3 (0.6%) | 20 (4.7%) |
| $50,000 to $54,999 | 19 (3.8%) | 5 (1.2%) |
| $55,000 to $64,999 | 71 (14.2%) | 66 (15.6%) |
| $65,000 to $74,999 | 103 (20.6%) | 9 (2.1%) |
| $75,000 to $99,999 | 47 (9.4%) | 27 (6.4%) |
| $100,000+ | 42 (8.4%) | 9 (2.1%) |
| Total | 499 (100.0%) | 424 (100.0%) |
Earnings by Sex by Educational Attainment in Lisbon
Average earnings in Lisbon are $59,104 for men and $40,260 for women, a difference of 31.9%. Men with an educational attainment of bachelor's degree enjoy the highest average annual earnings of $86,406, while those with high school diploma education earn the least with $51,250. Women with an educational attainment of graduate degree earn the most with the average annual earnings of $58,598, while those with college or associate's degree education have the smallest earnings of $25,833.
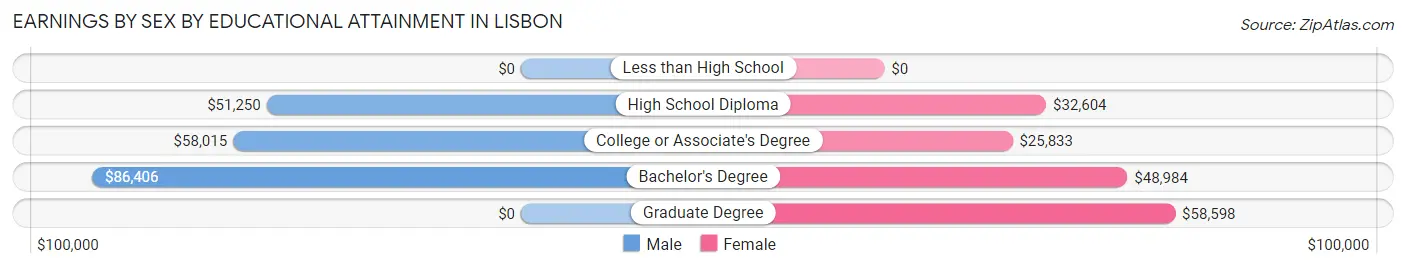
| Educational Attainment | Male Income | Female Income |
| Less than High School | - | - |
| High School Diploma | $51,250 | $32,604 |
| College or Associate's Degree | $58,015 | $25,833 |
| Bachelor's Degree | $86,406 | $48,984 |
| Graduate Degree | - | - |
| Total | $59,104 | $40,260 |
Family Income in Lisbon
Family Income Brackets in Lisbon
According to the Lisbon family income data, there are 126 families falling into the $100,000 to $149,999 income range, which is the most common income bracket and makes up 25.4% of all families.
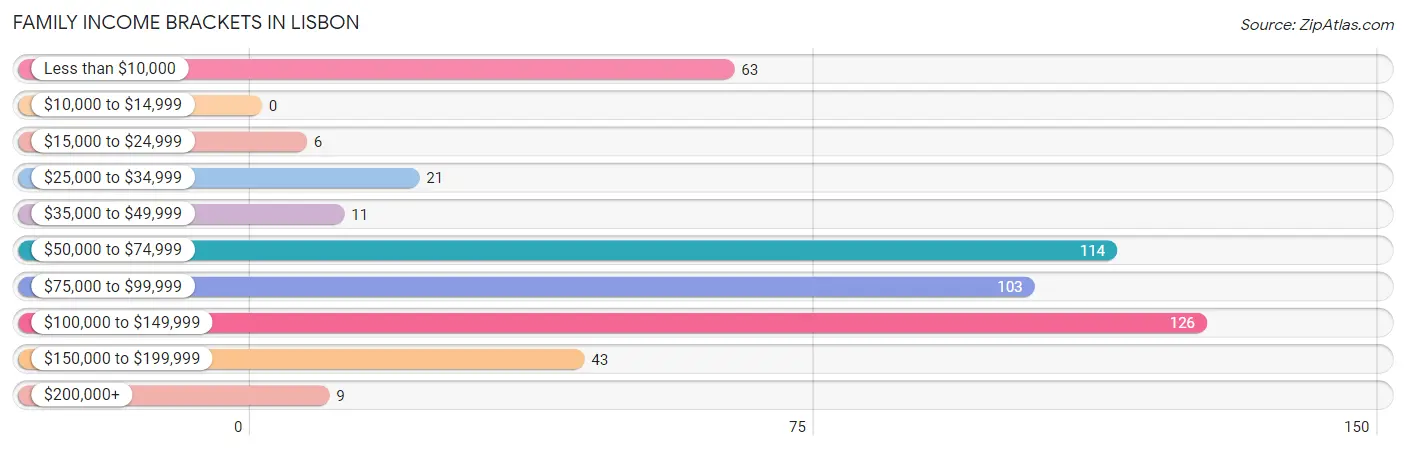
| Income Bracket | # Families | % Families |
| Less than $10,000 | 63 | 12.7% |
| $10,000 to $14,999 | 0 | 0.0% |
| $15,000 to $24,999 | 6 | 1.2% |
| $25,000 to $34,999 | 21 | 4.2% |
| $35,000 to $49,999 | 11 | 2.2% |
| $50,000 to $74,999 | 114 | 23.0% |
| $75,000 to $99,999 | 103 | 20.8% |
| $100,000 to $149,999 | 126 | 25.4% |
| $150,000 to $199,999 | 43 | 8.7% |
| $200,000+ | 9 | 1.8% |
Family Income by Famaliy Size in Lisbon
4-person families (71 | 14.3%) account for the highest median family income in Lisbon with $115,250 per family, while 2-person families (210 | 42.3%) have the highest median income of $34,375 per family member.
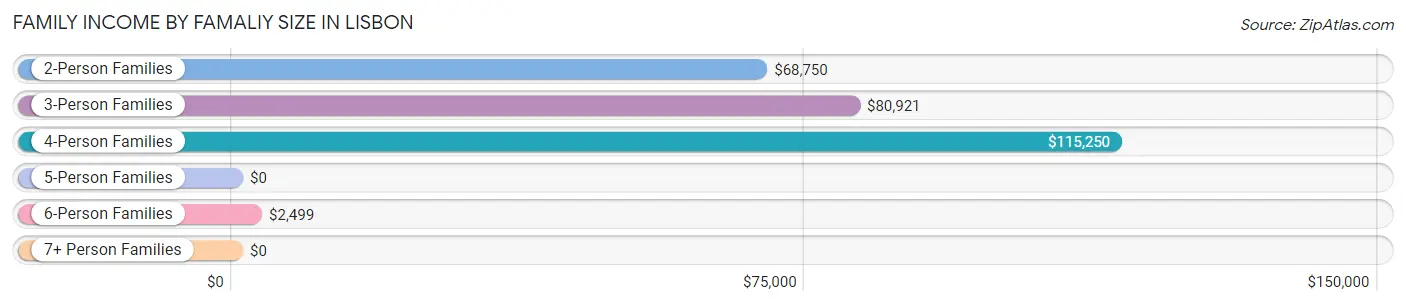
| Income Bracket | # Families | Median Income |
| 2-Person Families | 210 (42.3%) | $68,750 |
| 3-Person Families | 114 (23.0%) | $80,921 |
| 4-Person Families | 71 (14.3%) | $115,250 |
| 5-Person Families | 29 (5.9%) | $0 |
| 6-Person Families | 72 (14.5%) | $2,499 |
| 7+ Person Families | 0 (0.0%) | $0 |
| Total | 496 (100.0%) | $83,810 |
Family Income by Number of Earners in Lisbon
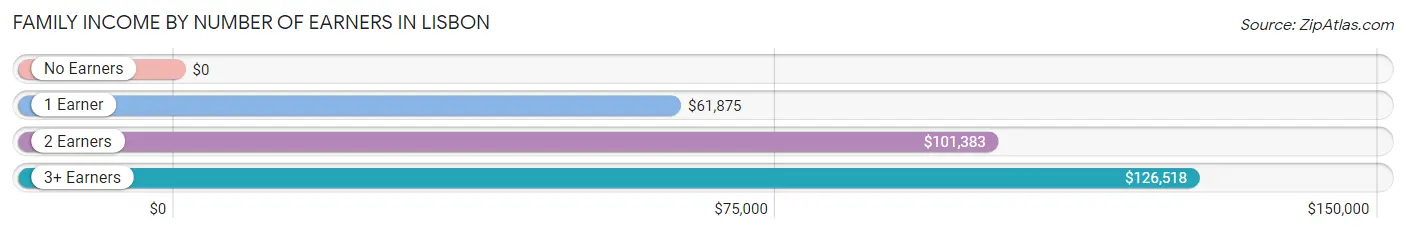
| Number of Earners | # Families | Median Income |
| No Earners | 133 (26.8%) | $0 |
| 1 Earner | 112 (22.6%) | $61,875 |
| 2 Earners | 206 (41.5%) | $101,383 |
| 3+ Earners | 45 (9.1%) | $126,518 |
| Total | 496 (100.0%) | $83,810 |
Household Income in Lisbon
Household Income Brackets in Lisbon
With 197 households falling in the category, the $50,000 to $74,999 income range is the most frequent in Lisbon, accounting for 22.0% of all households. In contrast, only 9 households (1.0%) fall into the $200,000+ income bracket, making it the least populous group.
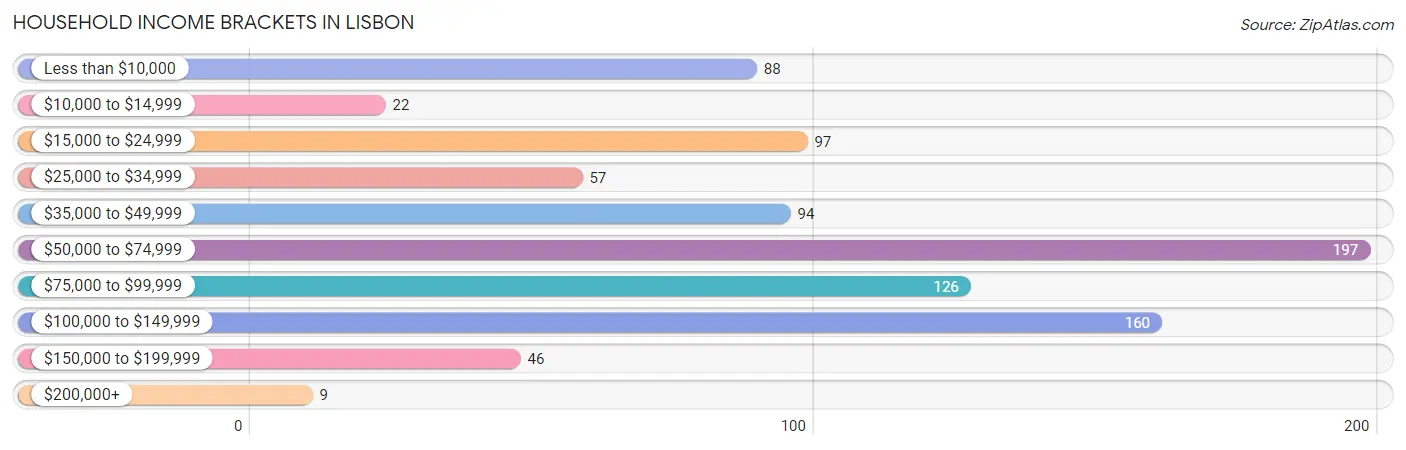
| Income Bracket | # Households | % Households |
| Less than $10,000 | 88 | 9.8% |
| $10,000 to $14,999 | 22 | 2.5% |
| $15,000 to $24,999 | 97 | 10.8% |
| $25,000 to $34,999 | 57 | 6.4% |
| $35,000 to $49,999 | 94 | 10.5% |
| $50,000 to $74,999 | 197 | 22.0% |
| $75,000 to $99,999 | 126 | 14.1% |
| $100,000 to $149,999 | 160 | 17.9% |
| $150,000 to $199,999 | 46 | 5.1% |
| $200,000+ | 9 | 1.0% |
Household Income by Householder Age in Lisbon
The median household income in Lisbon is $61,250, with the highest median household income of $100,078 found in the 45 to 64 years age bracket for the primary householder. A total of 276 households (30.8%) fall into this category. Meanwhile, the 15 to 24 years age bracket for the primary householder has the lowest median household income of $0, with 47 households (5.2%) in this group.
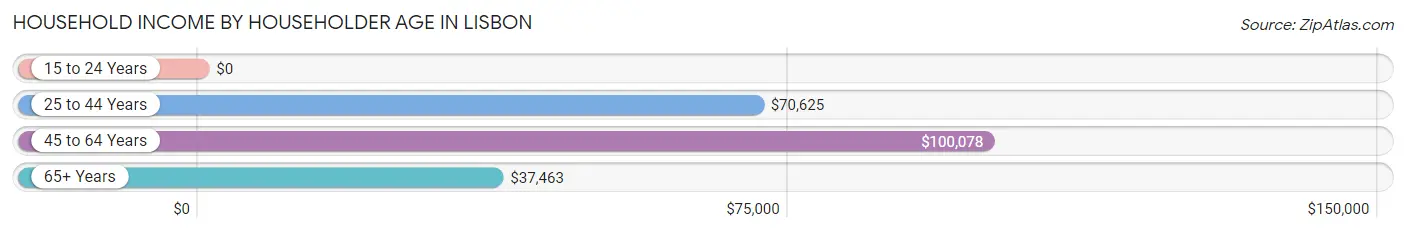
| Income Bracket | # Households | Median Income |
| 15 to 24 Years | 47 (5.2%) | $0 |
| 25 to 44 Years | 262 (29.2%) | $70,625 |
| 45 to 64 Years | 276 (30.8%) | $100,078 |
| 65+ Years | 311 (34.7%) | $37,463 |
| Total | 896 (100.0%) | $61,250 |
Poverty in Lisbon
Income Below Poverty by Sex and Age in Lisbon
With 13.6% poverty level for males and 20.7% for females among the residents of Lisbon, under 5 year old males and 5 year old females are the most vulnerable to poverty, with 35 males (56.5%) and 13 females (100.0%) in their respective age groups living below the poverty level.
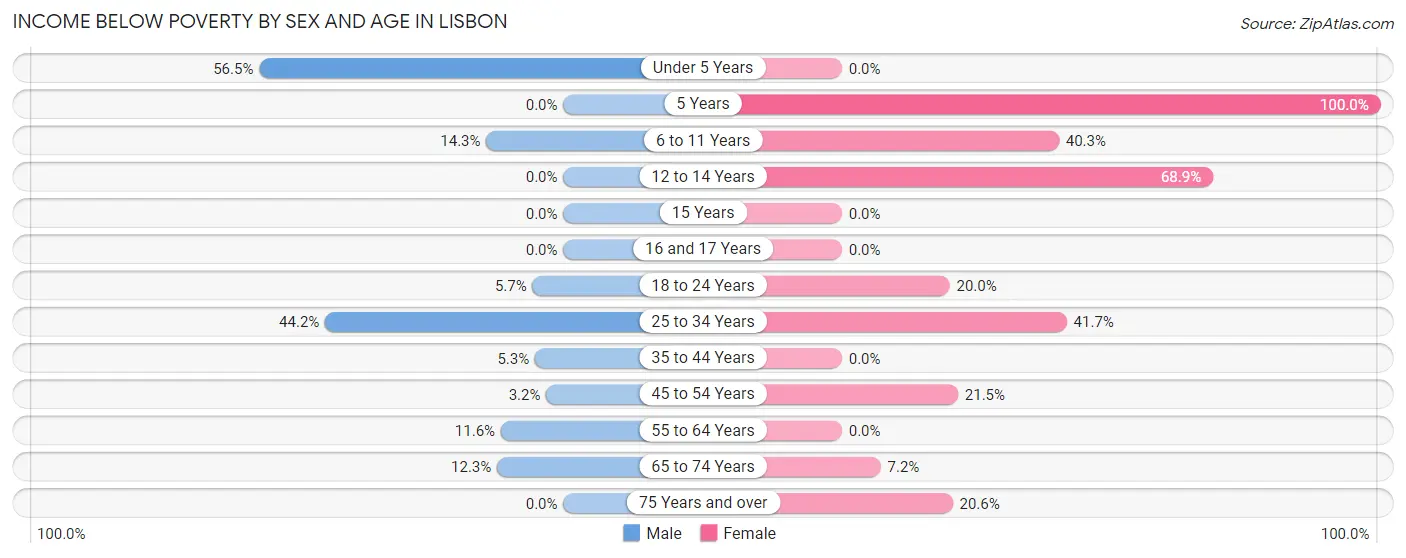
| Age Bracket | Male | Female |
| Under 5 Years | 35 (56.5%) | 0 (0.0%) |
| 5 Years | 0 (0.0%) | 13 (100.0%) |
| 6 to 11 Years | 13 (14.3%) | 60 (40.3%) |
| 12 to 14 Years | 0 (0.0%) | 31 (68.9%) |
| 15 Years | 0 (0.0%) | 0 (0.0%) |
| 16 and 17 Years | 0 (0.0%) | 0 (0.0%) |
| 18 to 24 Years | 8 (5.7%) | 8 (20.0%) |
| 25 to 34 Years | 42 (44.2%) | 48 (41.7%) |
| 35 to 44 Years | 5 (5.3%) | 0 (0.0%) |
| 45 to 54 Years | 4 (3.2%) | 14 (21.5%) |
| 55 to 64 Years | 19 (11.6%) | 0 (0.0%) |
| 65 to 74 Years | 15 (12.3%) | 8 (7.2%) |
| 75 Years and over | 0 (0.0%) | 22 (20.6%) |
| Total | 141 (13.6%) | 204 (20.7%) |
Income Above Poverty by Sex and Age in Lisbon
According to the poverty statistics in Lisbon, males aged 5 years and females aged 15 years are the age groups that are most secure financially, with 100.0% of males and 100.0% of females in these age groups living above the poverty line.
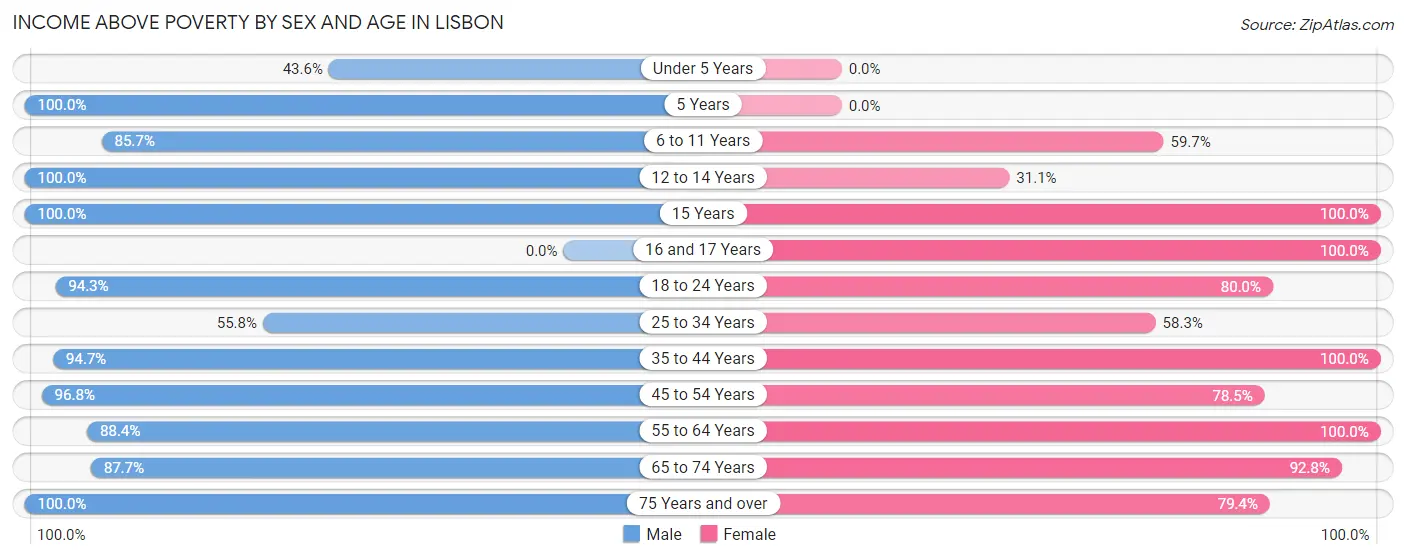
| Age Bracket | Male | Female |
| Under 5 Years | 27 (43.5%) | 0 (0.0%) |
| 5 Years | 16 (100.0%) | 0 (0.0%) |
| 6 to 11 Years | 78 (85.7%) | 89 (59.7%) |
| 12 to 14 Years | 41 (100.0%) | 14 (31.1%) |
| 15 Years | 22 (100.0%) | 6 (100.0%) |
| 16 and 17 Years | 0 (0.0%) | 31 (100.0%) |
| 18 to 24 Years | 132 (94.3%) | 32 (80.0%) |
| 25 to 34 Years | 53 (55.8%) | 67 (58.3%) |
| 35 to 44 Years | 90 (94.7%) | 186 (100.0%) |
| 45 to 54 Years | 122 (96.8%) | 51 (78.5%) |
| 55 to 64 Years | 145 (88.4%) | 119 (100.0%) |
| 65 to 74 Years | 107 (87.7%) | 103 (92.8%) |
| 75 Years and over | 64 (100.0%) | 85 (79.4%) |
| Total | 897 (86.4%) | 783 (79.3%) |
Income Below Poverty Among Married-Couple Families in Lisbon
The poverty statistics for married-couple families in Lisbon show that 11.5% or 47 of the total 410 families live below the poverty line. Families with 3 or 4 children have the highest poverty rate of 61.8%, comprising of 42 families. On the other hand, families with 1 or 2 children have the lowest poverty rate of 0.0%, which includes 0 families.
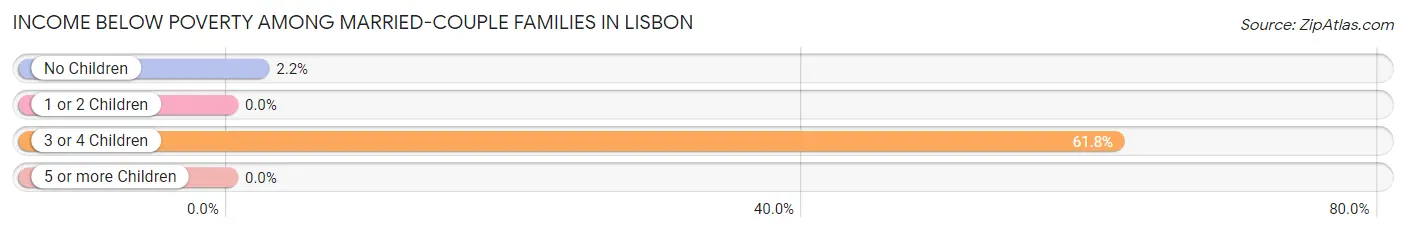
| Children | Above Poverty | Below Poverty |
| No Children | 224 (97.8%) | 5 (2.2%) |
| 1 or 2 Children | 113 (100.0%) | 0 (0.0%) |
| 3 or 4 Children | 26 (38.2%) | 42 (61.8%) |
| 5 or more Children | 0 (0.0%) | 0 (0.0%) |
| Total | 363 (88.5%) | 47 (11.5%) |
Income Below Poverty Among Single-Parent Households in Lisbon
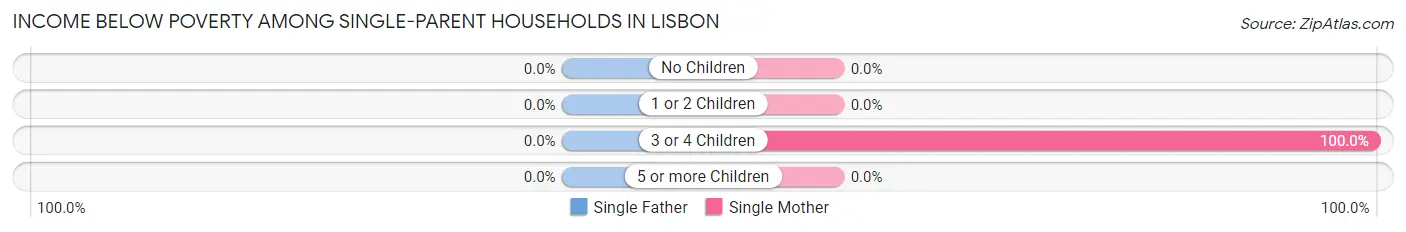
| Children | Single Father | Single Mother |
| No Children | 0 (0.0%) | 0 (0.0%) |
| 1 or 2 Children | 0 (0.0%) | 0 (0.0%) |
| 3 or 4 Children | 0 (0.0%) | 16 (100.0%) |
| 5 or more Children | 0 (0.0%) | 0 (0.0%) |
| Total | 0 (0.0%) | 16 (21.9%) |
Income Below Poverty Among Married-Couple vs Single-Parent Households in Lisbon
The poverty data for Lisbon shows that 47 of the married-couple family households (11.5%) and 16 of the single-parent households (18.6%) are living below the poverty level. Within the married-couple family households, those with 3 or 4 children have the highest poverty rate, with 42 households (61.8%) falling below the poverty line. Among the single-parent households, those with 3 or 4 children have the highest poverty rate, with 16 household (100.0%) living below poverty.
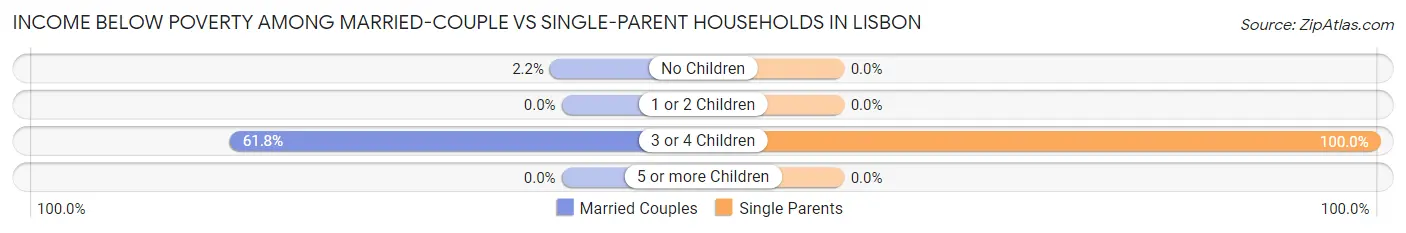
| Children | Married-Couple Families | Single-Parent Households |
| No Children | 5 (2.2%) | 0 (0.0%) |
| 1 or 2 Children | 0 (0.0%) | 0 (0.0%) |
| 3 or 4 Children | 42 (61.8%) | 16 (100.0%) |
| 5 or more Children | 0 (0.0%) | 0 (0.0%) |
| Total | 47 (11.5%) | 16 (18.6%) |
Race in Lisbon
The most populous races in Lisbon are White / Caucasian (1,866 | 86.4%), Two or more Races (160 | 7.4%), and Black / African American (91 | 4.2%).
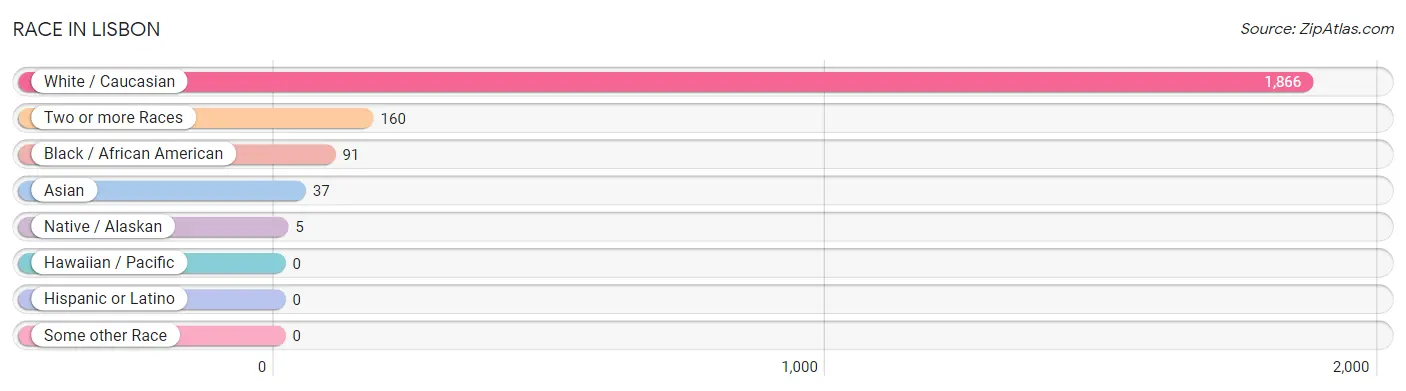
| Race | # Population | % Population |
| Asian | 37 | 1.7% |
| Black / African American | 91 | 4.2% |
| Hawaiian / Pacific | 0 | 0.0% |
| Hispanic or Latino | 0 | 0.0% |
| Native / Alaskan | 5 | 0.2% |
| White / Caucasian | 1,866 | 86.4% |
| Two or more Races | 160 | 7.4% |
| Some other Race | 0 | 0.0% |
| Total | 2,159 | 100.0% |
Ancestry in Lisbon
The most populous ancestries reported in Lisbon are German (863 | 40.0%), Norwegian (735 | 34.0%), French (98 | 4.5%), Indian (Asian) (97 | 4.5%), and Irish (92 | 4.3%), together accounting for 87.3% of all Lisbon residents.
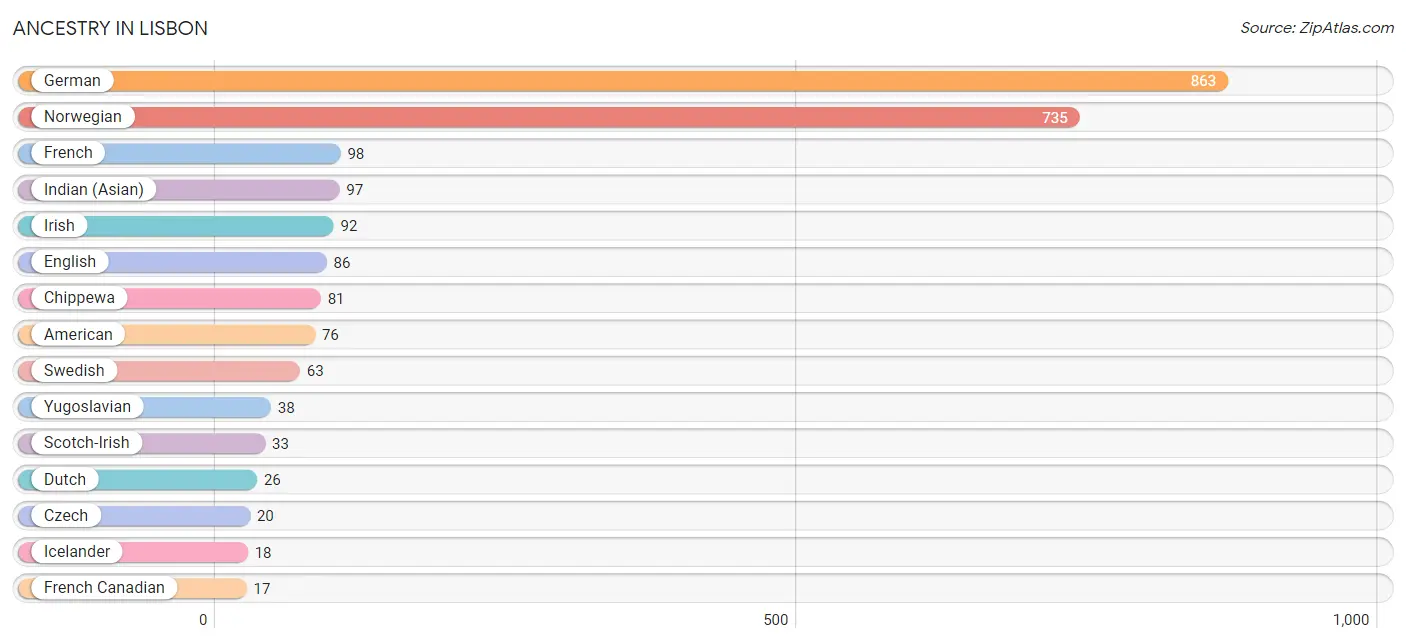
| Ancestry | # Population | % Population |
| American | 76 | 3.5% |
| British | 5 | 0.2% |
| Canadian | 4 | 0.2% |
| Chippewa | 81 | 3.7% |
| Czech | 20 | 0.9% |
| Czechoslovakian | 3 | 0.1% |
| Danish | 10 | 0.5% |
| Dutch | 26 | 1.2% |
| English | 86 | 4.0% |
| French | 98 | 4.5% |
| French Canadian | 17 | 0.8% |
| German | 863 | 40.0% |
| Icelander | 18 | 0.8% |
| Indian (Asian) | 97 | 4.5% |
| Irish | 92 | 4.3% |
| Italian | 4 | 0.2% |
| Kiowa | 5 | 0.2% |
| Norwegian | 735 | 34.0% |
| Polish | 4 | 0.2% |
| Russian | 17 | 0.8% |
| Scandinavian | 8 | 0.4% |
| Scotch-Irish | 33 | 1.5% |
| Scottish | 6 | 0.3% |
| Swedish | 63 | 2.9% |
| Swiss | 5 | 0.2% |
| Welsh | 1 | 0.1% |
| Yugoslavian | 38 | 1.8% | View All 27 Rows |
Immigrants in Lisbon
The most numerous immigrant groups reported in Lisbon came from Eastern Europe (43 | 2.0%), Europe (43 | 2.0%), Bosnia and Herzegovina (38 | 1.8%), Asia (37 | 1.7%), and China (37 | 1.7%), together accounting for 9.2% of all Lisbon residents.
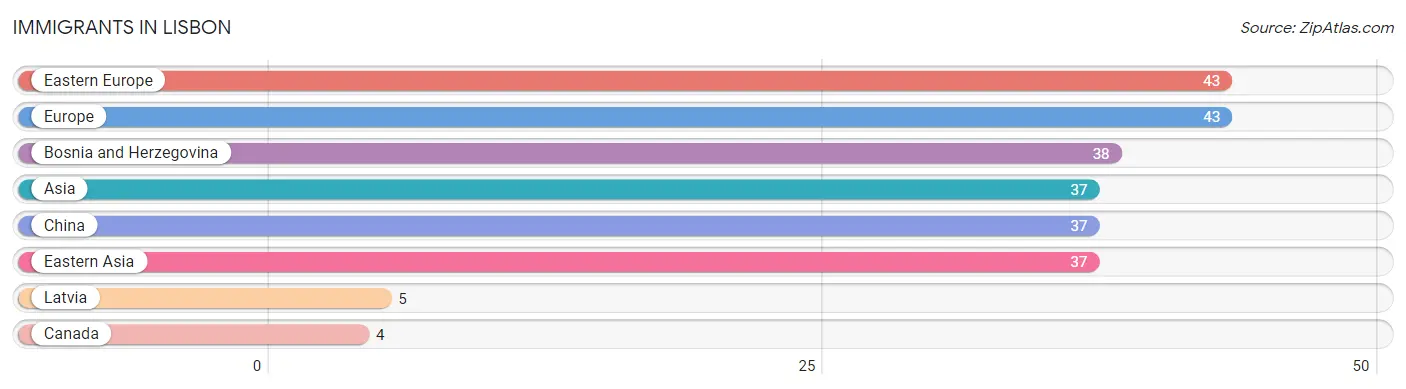
| Immigration Origin | # Population | % Population |
| Asia | 37 | 1.7% |
| Bosnia and Herzegovina | 38 | 1.8% |
| Canada | 4 | 0.2% |
| China | 37 | 1.7% |
| Eastern Asia | 37 | 1.7% |
| Eastern Europe | 43 | 2.0% |
| Europe | 43 | 2.0% |
| Latvia | 5 | 0.2% | View All 8 Rows |
Sex and Age in Lisbon
Sex and Age in Lisbon
The most populous age groups in Lisbon are 15 to 19 Years (128 | 11.8%) for men and 40 to 44 Years (136 | 12.6%) for women.
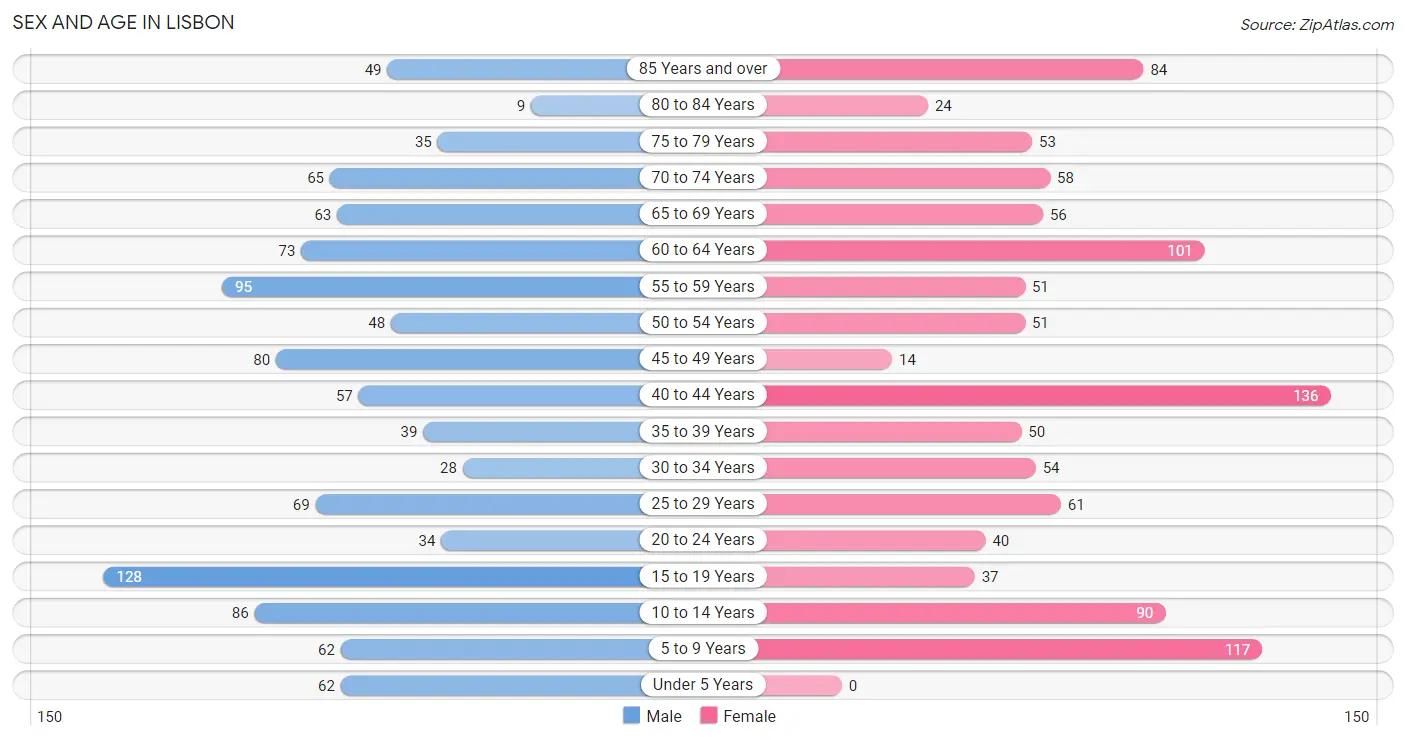
| Age Bracket | Male | Female |
| Under 5 Years | 62 (5.7%) | 0 (0.0%) |
| 5 to 9 Years | 62 (5.7%) | 117 (10.9%) |
| 10 to 14 Years | 86 (8.0%) | 90 (8.4%) |
| 15 to 19 Years | 128 (11.8%) | 37 (3.4%) |
| 20 to 24 Years | 34 (3.1%) | 40 (3.7%) |
| 25 to 29 Years | 69 (6.4%) | 61 (5.7%) |
| 30 to 34 Years | 28 (2.6%) | 54 (5.0%) |
| 35 to 39 Years | 39 (3.6%) | 50 (4.6%) |
| 40 to 44 Years | 57 (5.3%) | 136 (12.6%) |
| 45 to 49 Years | 80 (7.4%) | 14 (1.3%) |
| 50 to 54 Years | 48 (4.4%) | 51 (4.7%) |
| 55 to 59 Years | 95 (8.8%) | 51 (4.7%) |
| 60 to 64 Years | 73 (6.8%) | 101 (9.4%) |
| 65 to 69 Years | 63 (5.8%) | 56 (5.2%) |
| 70 to 74 Years | 65 (6.0%) | 58 (5.4%) |
| 75 to 79 Years | 35 (3.2%) | 53 (4.9%) |
| 80 to 84 Years | 9 (0.8%) | 24 (2.2%) |
| 85 Years and over | 49 (4.5%) | 84 (7.8%) |
| Total | 1,082 (100.0%) | 1,077 (100.0%) |
Families and Households in Lisbon
Median Family Size in Lisbon
The median family size in Lisbon is 3.14 persons per family, with single female/mother families (73 | 14.7%) accounting for the largest median family size of 3.23 persons per family. On the other hand, single male/father families (13 | 2.6%) represent the smallest median family size with 2.38 persons per family.
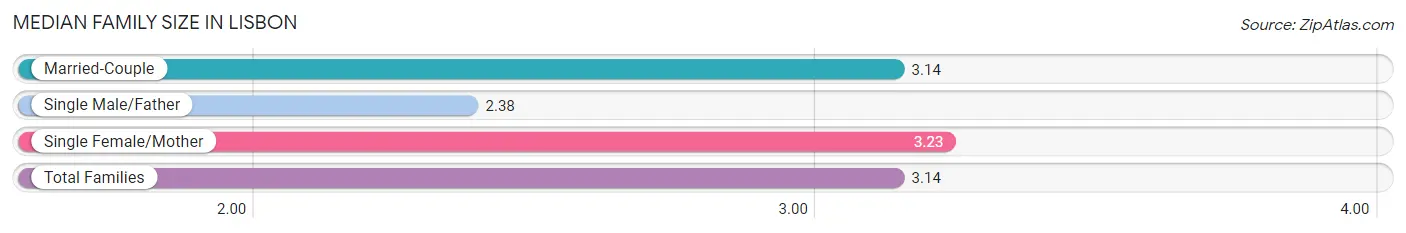
| Family Type | # Families | Family Size |
| Married-Couple | 410 (82.7%) | 3.14 |
| Single Male/Father | 13 (2.6%) | 2.38 |
| Single Female/Mother | 73 (14.7%) | 3.23 |
| Total Families | 496 (100.0%) | 3.14 |
Median Household Size in Lisbon
The median household size in Lisbon is 2.26 persons per household, with single male/father households (13 | 1.5%) accounting for the largest median household size of 3.85 persons per household. non-family households (400 | 44.6%) represent the smallest median household size with 1.05 persons per household.
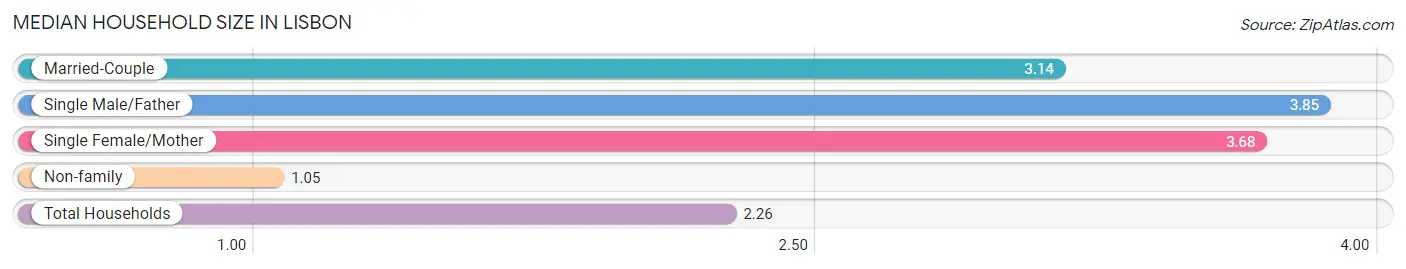
| Household Type | # Households | Household Size |
| Married-Couple | 410 (45.8%) | 3.14 |
| Single Male/Father | 13 (1.5%) | 3.85 |
| Single Female/Mother | 73 (8.2%) | 3.68 |
| Non-family | 400 (44.6%) | 1.05 |
| Total Households | 896 (100.0%) | 2.26 |
Household Size by Marriage Status in Lisbon
Out of a total of 896 households in Lisbon, 496 (55.4%) are family households, while 400 (44.6%) are nonfamily households. The most numerous type of family households are 2-person households, comprising 202, and the most common type of nonfamily households are 1-person households, comprising 384.
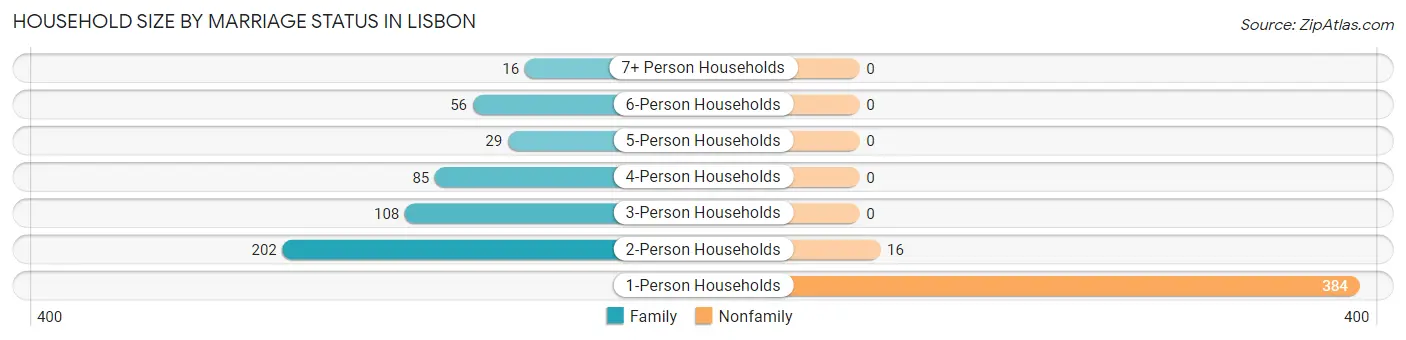
| Household Size | Family Households | Nonfamily Households |
| 1-Person Households | - | 384 (42.9%) |
| 2-Person Households | 202 (22.5%) | 16 (1.8%) |
| 3-Person Households | 108 (12.0%) | 0 (0.0%) |
| 4-Person Households | 85 (9.5%) | 0 (0.0%) |
| 5-Person Households | 29 (3.2%) | 0 (0.0%) |
| 6-Person Households | 56 (6.2%) | 0 (0.0%) |
| 7+ Person Households | 16 (1.8%) | 0 (0.0%) |
| Total | 496 (55.4%) | 400 (44.6%) |
Female Fertility in Lisbon
Fertility by Age in Lisbon
| Age Bracket | Women with Births | Births / 1,000 Women |
| 15 to 19 years | 0 (0.0%) | 0.0 |
| 20 to 34 years | 0 (0.0%) | 0.0 |
| 35 to 50 years | 0 (0.0%) | 0.0 |
| Total | 0 (0.0%) | 0.0 |
Fertility by Age by Marriage Status in Lisbon
| Age Bracket | Married | Unmarried |
| 15 to 19 years | 0 (0.0%) | 0 (0.0%) |
| 20 to 34 years | 0 (0.0%) | 0 (0.0%) |
| 35 to 50 years | 0 (0.0%) | 0 (0.0%) |
| Total | 0 (0.0%) | 0 (0.0%) |
Fertility by Education in Lisbon
| Educational Attainment | Women with Births | Births / 1,000 Women |
| Less than High School | 0 (0.0%) | 0.0 |
| High School Diploma | 0 (0.0%) | 0.0 |
| College or Associate's Degree | 0 (0.0%) | 0.0 |
| Bachelor's Degree | 0 (0.0%) | 0.0 |
| Graduate Degree | 0 (0.0%) | 0.0 |
| Total | 0 (0.0%) | 0.0 |
Fertility by Education by Marriage Status in Lisbon
| Educational Attainment | Married | Unmarried |
| Less than High School | 0 (0.0%) | 0 (0.0%) |
| High School Diploma | 0 (0.0%) | 0 (0.0%) |
| College or Associate's Degree | 0 (0.0%) | 0 (0.0%) |
| Bachelor's Degree | 0 (0.0%) | 0 (0.0%) |
| Graduate Degree | 0 (0.0%) | 0 (0.0%) |
| Total | 0 (0.0%) | 0 (0.0%) |
Employment Characteristics in Lisbon
Employment by Class of Employer in Lisbon
Among the 873 employed individuals in Lisbon, private company employees (591 | 67.7%), state government employees (67 | 7.7%), and federal government employees (58 | 6.6%) make up the most common classes of employment.
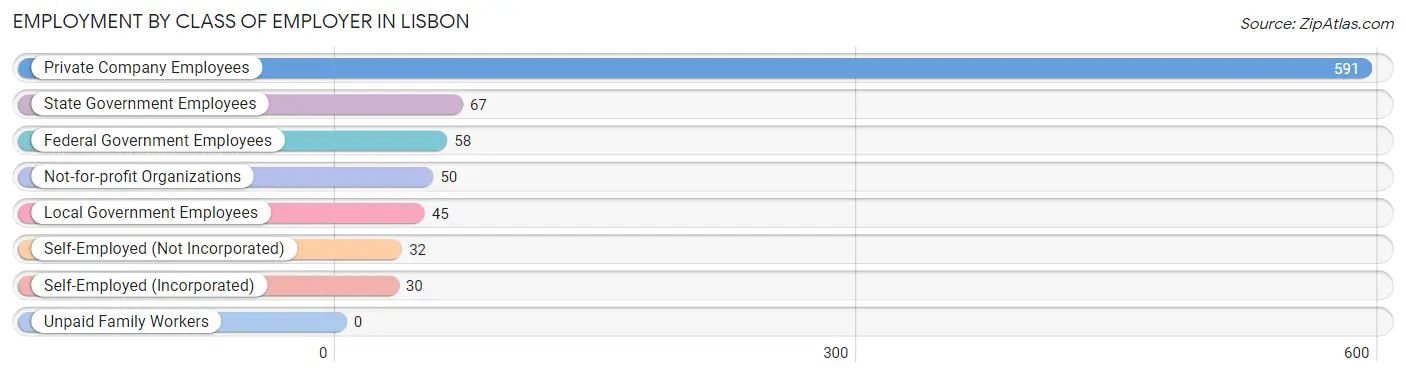
| Employer Class | # Employees | % Employees |
| Private Company Employees | 591 | 67.7% |
| Self-Employed (Incorporated) | 30 | 3.4% |
| Self-Employed (Not Incorporated) | 32 | 3.7% |
| Not-for-profit Organizations | 50 | 5.7% |
| Local Government Employees | 45 | 5.1% |
| State Government Employees | 67 | 7.7% |
| Federal Government Employees | 58 | 6.6% |
| Unpaid Family Workers | 0 | 0.0% |
| Total | 873 | 100.0% |
Employment Status by Age in Lisbon
According to the labor force statistics for Lisbon, out of the total population over 16 years of age (1,714), 54.0% or 926 individuals are in the labor force, with 4.5% or 42 of them unemployed. The age group with the highest labor force participation rate is 20 to 24 years, with 100.0% or 74 individuals in the labor force. Within the labor force, the 25 to 29 years age range has the highest percentage of unemployed individuals, with 36.8% or 42 of them being unemployed.
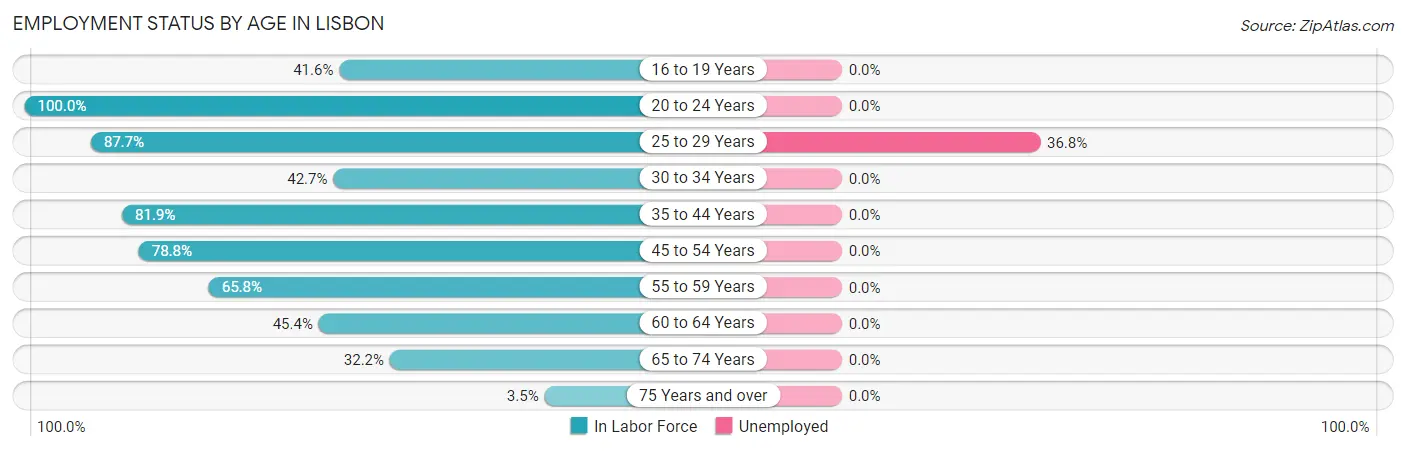
| Age Bracket | In Labor Force | Unemployed |
| 16 to 19 Years | 57 (41.6%) | 0 (0.0%) |
| 20 to 24 Years | 74 (100.0%) | 0 (0.0%) |
| 25 to 29 Years | 114 (87.7%) | 42 (36.8%) |
| 30 to 34 Years | 35 (42.7%) | 0 (0.0%) |
| 35 to 44 Years | 231 (81.9%) | 0 (0.0%) |
| 45 to 54 Years | 152 (78.8%) | 0 (0.0%) |
| 55 to 59 Years | 96 (65.8%) | 0 (0.0%) |
| 60 to 64 Years | 79 (45.4%) | 0 (0.0%) |
| 65 to 74 Years | 78 (32.2%) | 0 (0.0%) |
| 75 Years and over | 9 (3.5%) | 0 (0.0%) |
| Total | 926 (54.0%) | 42 (4.5%) |
Employment Status by Educational Attainment in Lisbon
According to labor force statistics for Lisbon, 70.2% of individuals (707) out of the total population between 25 and 64 years of age (1,007) are in the labor force, with 5.9% or 42 of them being unemployed. The group with the highest labor force participation rate are those with the educational attainment of bachelor's degree or higher, with 81.3% or 195 individuals in the labor force. Within the labor force, individuals with high school diploma education have the highest percentage of unemployment, with 17.8% or 42 of them being unemployed.
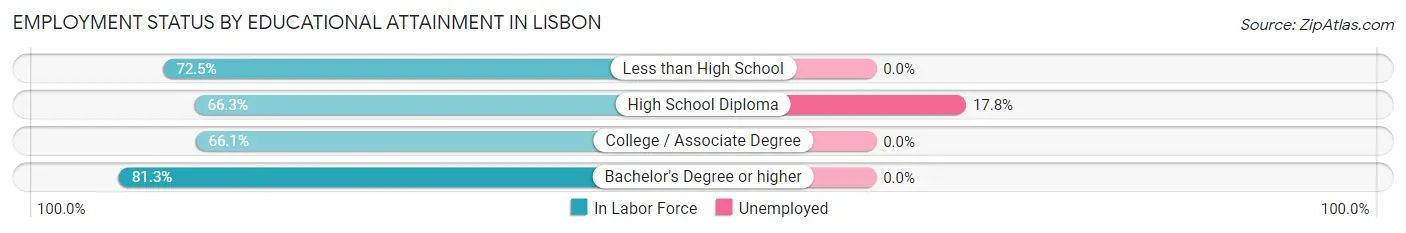
| Educational Attainment | In Labor Force | Unemployed |
| Less than High School | 50 (72.5%) | 0 (0.0%) |
| High School Diploma | 236 (66.3%) | 63 (17.8%) |
| College / Associate Degree | 226 (66.1%) | 0 (0.0%) |
| Bachelor's Degree or higher | 195 (81.3%) | 0 (0.0%) |
| Total | 707 (70.2%) | 59 (5.9%) |
Employment Occupations by Sex in Lisbon
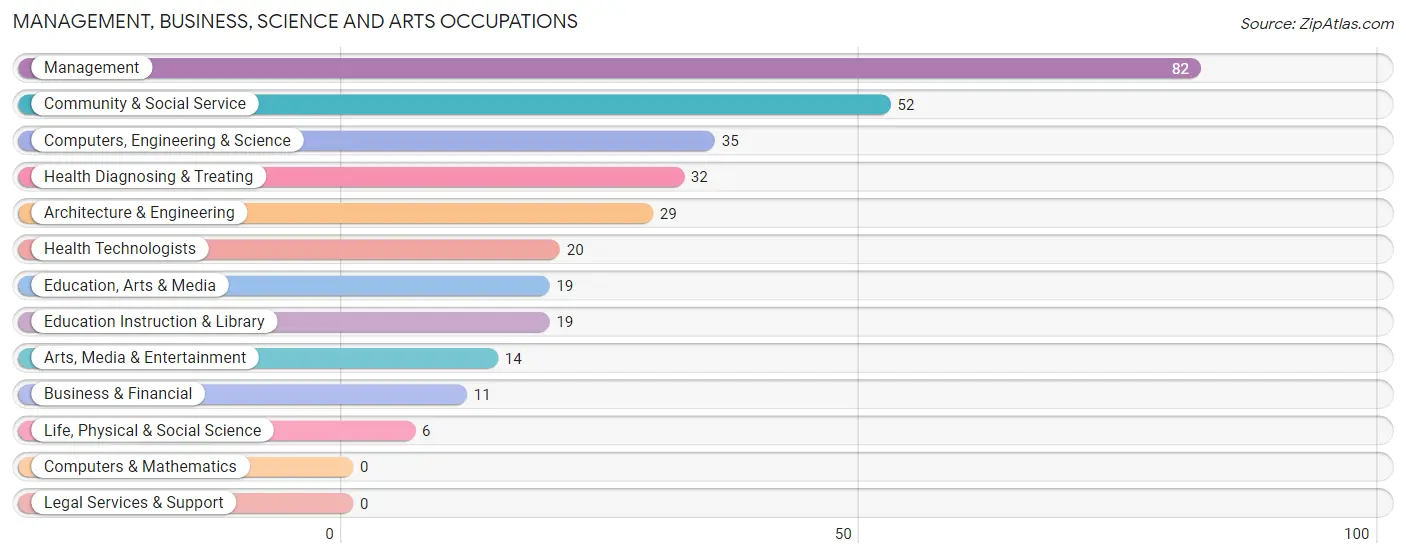
Management, Business, Science and Arts Occupations
The most common Management, Business, Science and Arts occupations in Lisbon are Management (82 | 9.3%), Community & Social Service (52 | 5.9%), Computers, Engineering & Science (35 | 4.0%), Health Diagnosing & Treating (32 | 3.6%), and Architecture & Engineering (29 | 3.3%).
Management, Business, Science and Arts Occupations by Sex
Within the Management, Business, Science and Arts occupations in Lisbon, the most male-oriented occupations are Computers, Engineering & Science (100.0%), Architecture & Engineering (100.0%), and Life, Physical & Social Science (100.0%), while the most female-oriented occupations are Education, Arts & Media (100.0%), Health Diagnosing & Treating (90.6%), and Health Technologists (85.0%).
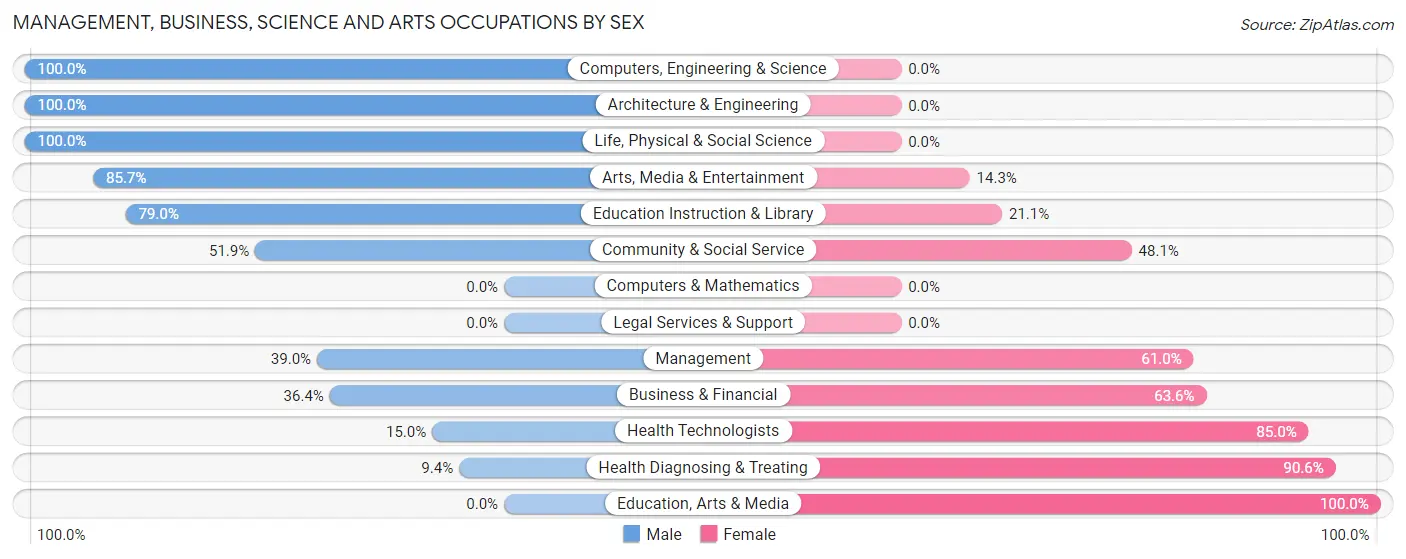
| Occupation | Male | Female |
| Management | 32 (39.0%) | 50 (61.0%) |
| Business & Financial | 4 (36.4%) | 7 (63.6%) |
| Computers, Engineering & Science | 35 (100.0%) | 0 (0.0%) |
| Computers & Mathematics | 0 (0.0%) | 0 (0.0%) |
| Architecture & Engineering | 29 (100.0%) | 0 (0.0%) |
| Life, Physical & Social Science | 6 (100.0%) | 0 (0.0%) |
| Community & Social Service | 27 (51.9%) | 25 (48.1%) |
| Education, Arts & Media | 0 (0.0%) | 19 (100.0%) |
| Legal Services & Support | 0 (0.0%) | 0 (0.0%) |
| Education Instruction & Library | 15 (78.9%) | 4 (21.0%) |
| Arts, Media & Entertainment | 12 (85.7%) | 2 (14.3%) |
| Health Diagnosing & Treating | 3 (9.4%) | 29 (90.6%) |
| Health Technologists | 3 (15.0%) | 17 (85.0%) |
| Total (Category) | 101 (47.6%) | 111 (52.4%) |
| Total (Overall) | 475 (53.8%) | 408 (46.2%) |
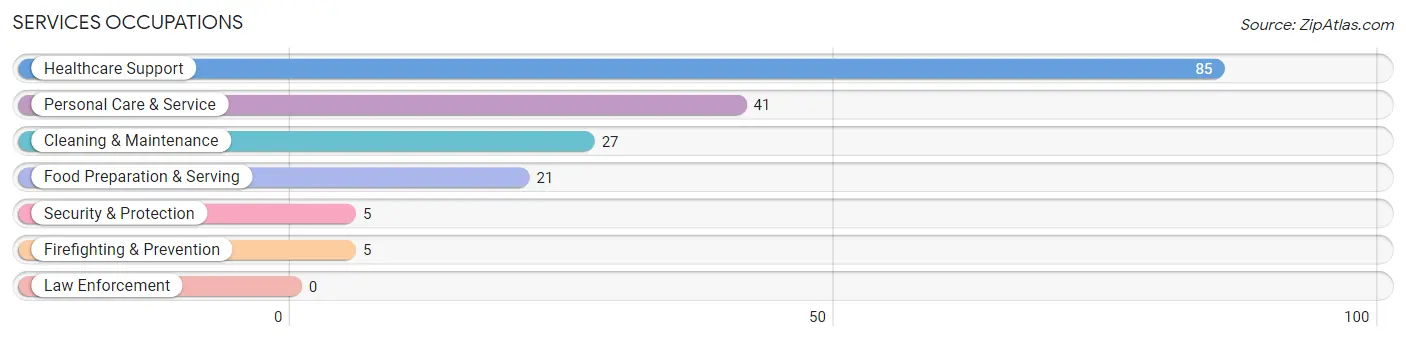
Services Occupations
The most common Services occupations in Lisbon are Healthcare Support (85 | 9.6%), Personal Care & Service (41 | 4.6%), Cleaning & Maintenance (27 | 3.1%), Food Preparation & Serving (21 | 2.4%), and Security & Protection (5 | 0.6%).
Services Occupations by Sex
Within the Services occupations in Lisbon, the most male-oriented occupations are Healthcare Support (29.4%), and Cleaning & Maintenance (25.9%), while the most female-oriented occupations are Security & Protection (100.0%), Firefighting & Prevention (100.0%), and Food Preparation & Serving (100.0%).
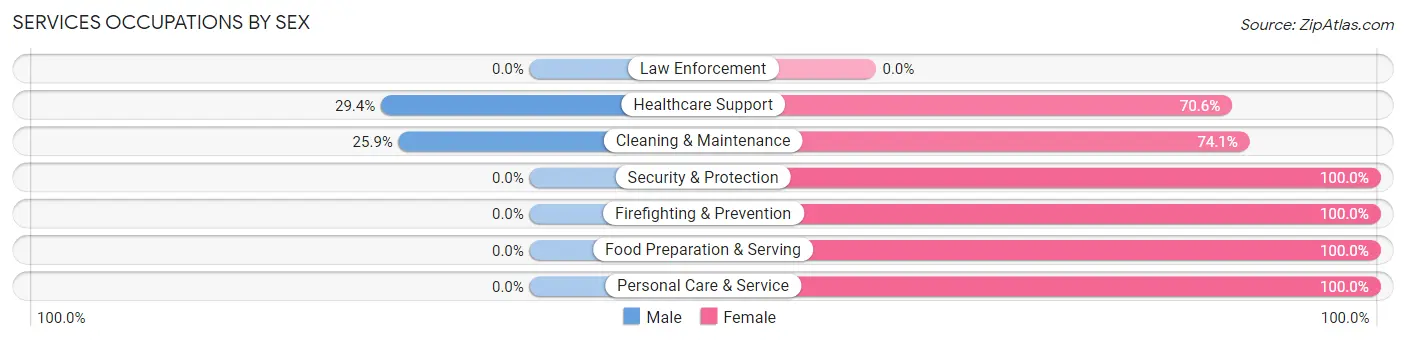
| Occupation | Male | Female |
| Healthcare Support | 25 (29.4%) | 60 (70.6%) |
| Security & Protection | 0 (0.0%) | 5 (100.0%) |
| Firefighting & Prevention | 0 (0.0%) | 5 (100.0%) |
| Law Enforcement | 0 (0.0%) | 0 (0.0%) |
| Food Preparation & Serving | 0 (0.0%) | 21 (100.0%) |
| Cleaning & Maintenance | 7 (25.9%) | 20 (74.1%) |
| Personal Care & Service | 0 (0.0%) | 41 (100.0%) |
| Total (Category) | 32 (17.9%) | 147 (82.1%) |
| Total (Overall) | 475 (53.8%) | 408 (46.2%) |
Sales and Office Occupations
The most common Sales and Office occupations in Lisbon are Office & Administration (80 | 9.1%), and Sales & Related (71 | 8.0%).
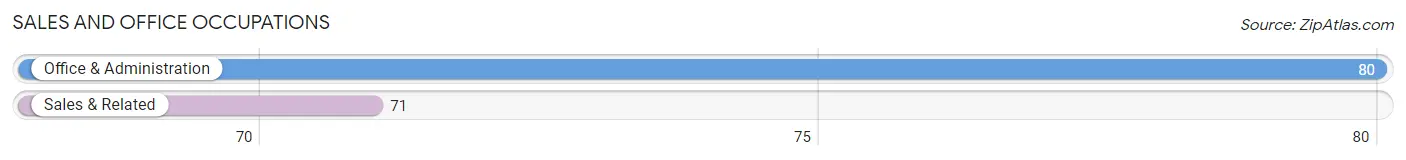
Sales and Office Occupations by Sex
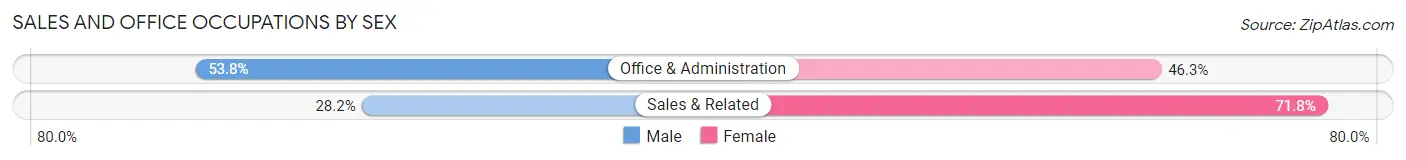
| Occupation | Male | Female |
| Sales & Related | 20 (28.2%) | 51 (71.8%) |
| Office & Administration | 43 (53.7%) | 37 (46.3%) |
| Total (Category) | 63 (41.7%) | 88 (58.3%) |
| Total (Overall) | 475 (53.8%) | 408 (46.2%) |
Natural Resources, Construction and Maintenance Occupations
The most common Natural Resources, Construction and Maintenance occupations in Lisbon are Installation, Maintenance & Repair (58 | 6.6%), Construction & Extraction (20 | 2.3%), and Farming, Fishing & Forestry (7 | 0.8%).
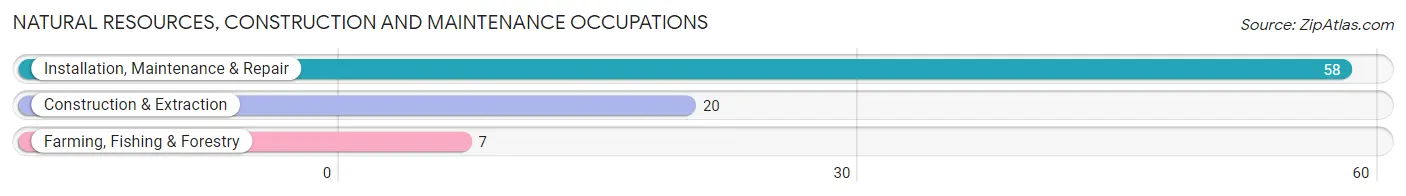
Natural Resources, Construction and Maintenance Occupations by Sex
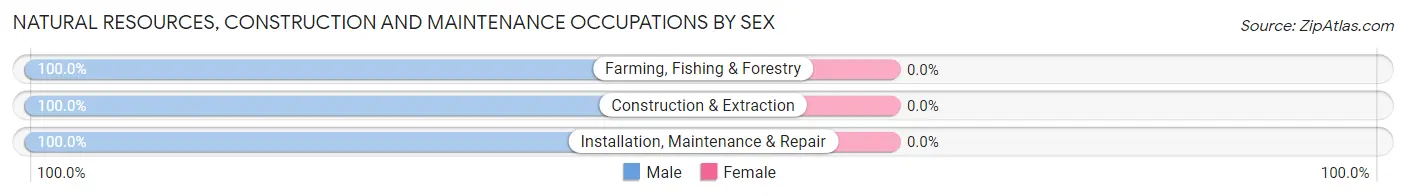
| Occupation | Male | Female |
| Farming, Fishing & Forestry | 7 (100.0%) | 0 (0.0%) |
| Construction & Extraction | 20 (100.0%) | 0 (0.0%) |
| Installation, Maintenance & Repair | 58 (100.0%) | 0 (0.0%) |
| Total (Category) | 85 (100.0%) | 0 (0.0%) |
| Total (Overall) | 475 (53.8%) | 408 (46.2%) |
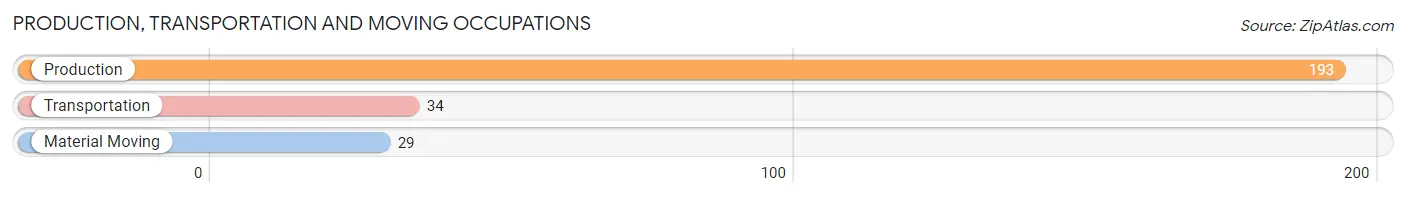
Production, Transportation and Moving Occupations
The most common Production, Transportation and Moving occupations in Lisbon are Production (193 | 21.9%), Transportation (34 | 3.8%), and Material Moving (29 | 3.3%).
Production, Transportation and Moving Occupations by Sex
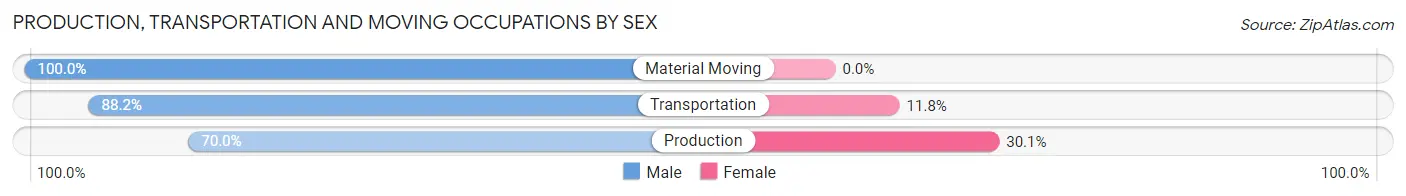
| Occupation | Male | Female |
| Production | 135 (70.0%) | 58 (30.0%) |
| Transportation | 30 (88.2%) | 4 (11.8%) |
| Material Moving | 29 (100.0%) | 0 (0.0%) |
| Total (Category) | 194 (75.8%) | 62 (24.2%) |
| Total (Overall) | 475 (53.8%) | 408 (46.2%) |
Employment Industries by Sex in Lisbon
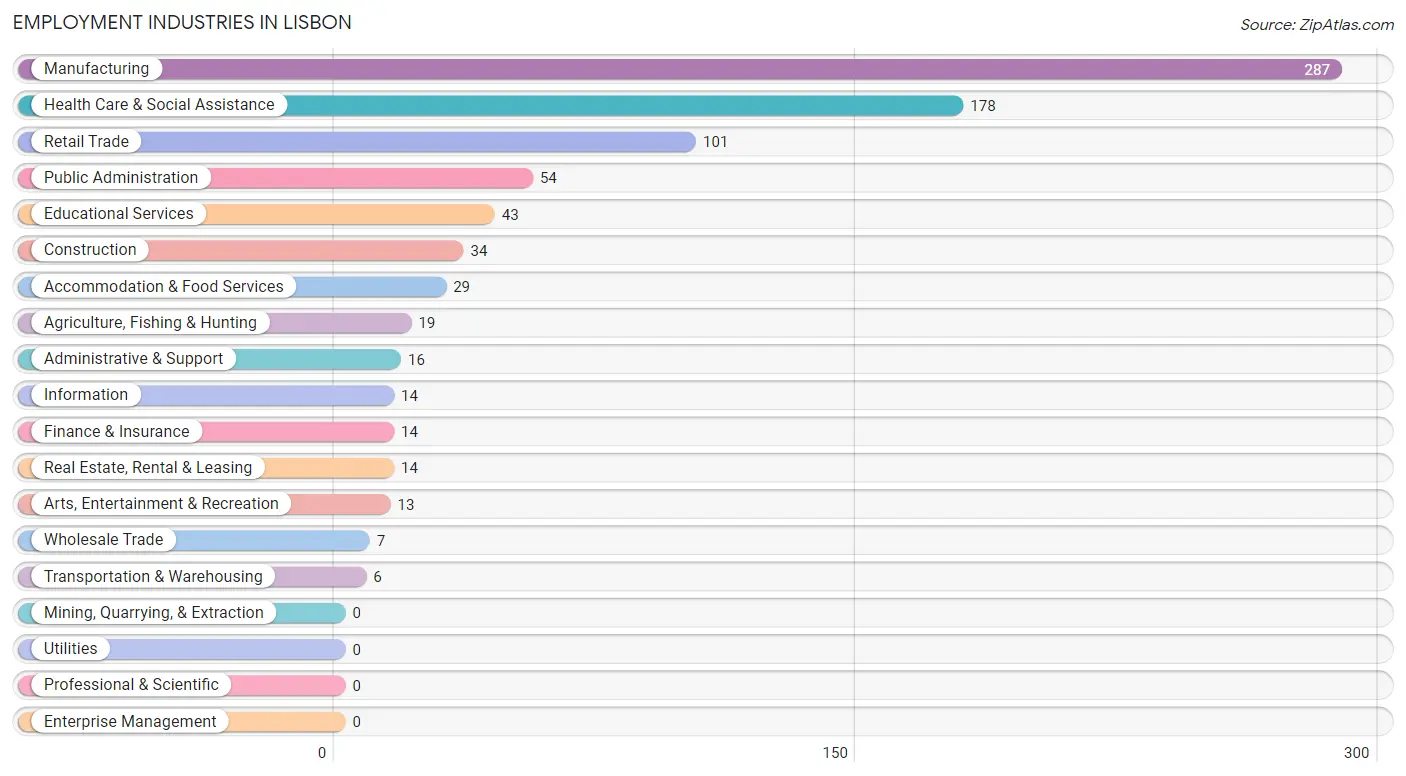
Employment Industries in Lisbon
The major employment industries in Lisbon include Manufacturing (287 | 32.5%), Health Care & Social Assistance (178 | 20.2%), Retail Trade (101 | 11.4%), Public Administration (54 | 6.1%), and Educational Services (43 | 4.9%).
Employment Industries by Sex in Lisbon
The Lisbon industries that see more men than women are Agriculture, Fishing & Hunting (100.0%), Construction (100.0%), and Wholesale Trade (100.0%), whereas the industries that tend to have a higher number of women are Health Care & Social Assistance (84.3%), Retail Trade (74.3%), and Finance & Insurance (71.4%).
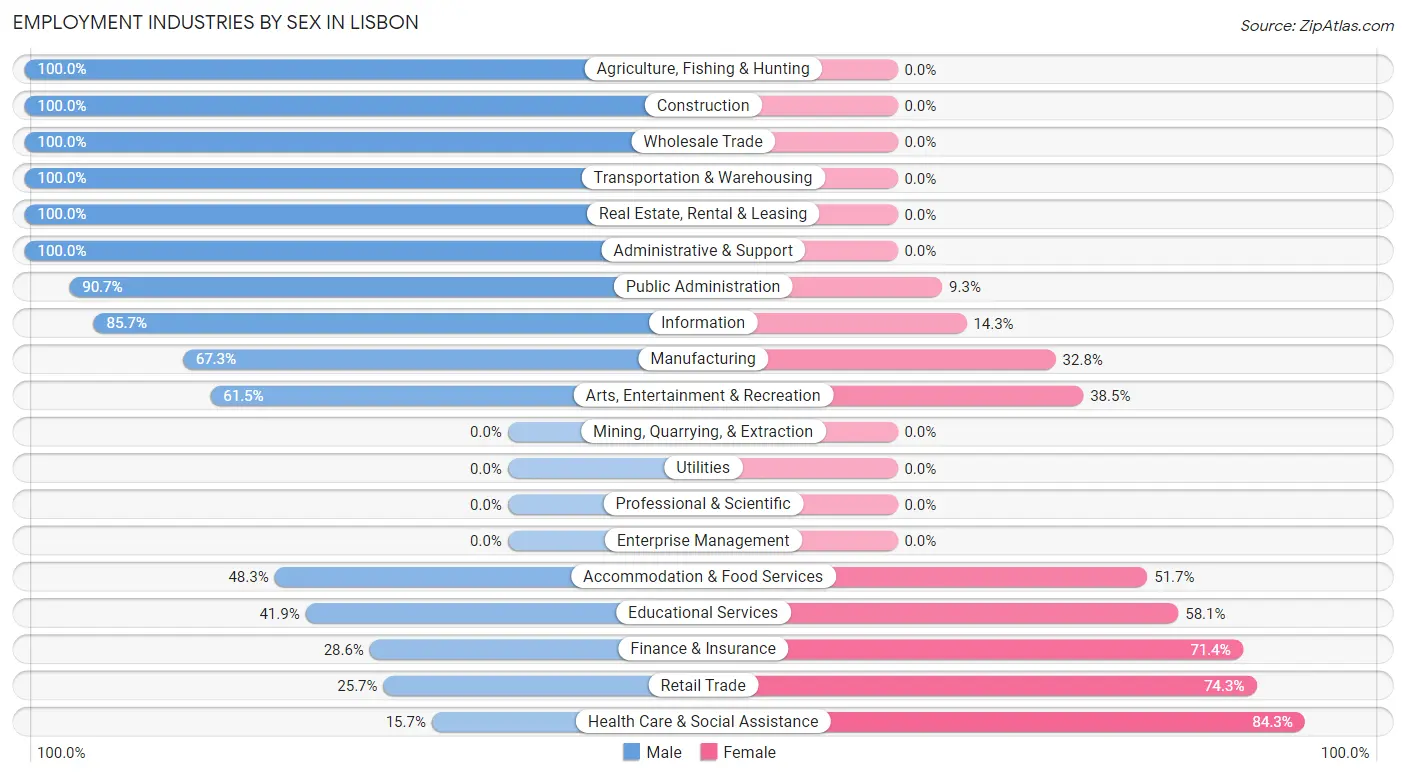
| Industry | Male | Female |
| Agriculture, Fishing & Hunting | 19 (100.0%) | 0 (0.0%) |
| Mining, Quarrying, & Extraction | 0 (0.0%) | 0 (0.0%) |
| Construction | 34 (100.0%) | 0 (0.0%) |
| Manufacturing | 193 (67.2%) | 94 (32.8%) |
| Wholesale Trade | 7 (100.0%) | 0 (0.0%) |
| Retail Trade | 26 (25.7%) | 75 (74.3%) |
| Transportation & Warehousing | 6 (100.0%) | 0 (0.0%) |
| Utilities | 0 (0.0%) | 0 (0.0%) |
| Information | 12 (85.7%) | 2 (14.3%) |
| Finance & Insurance | 4 (28.6%) | 10 (71.4%) |
| Real Estate, Rental & Leasing | 14 (100.0%) | 0 (0.0%) |
| Professional & Scientific | 0 (0.0%) | 0 (0.0%) |
| Enterprise Management | 0 (0.0%) | 0 (0.0%) |
| Administrative & Support | 16 (100.0%) | 0 (0.0%) |
| Educational Services | 18 (41.9%) | 25 (58.1%) |
| Health Care & Social Assistance | 28 (15.7%) | 150 (84.3%) |
| Arts, Entertainment & Recreation | 8 (61.5%) | 5 (38.5%) |
| Accommodation & Food Services | 14 (48.3%) | 15 (51.7%) |
| Public Administration | 49 (90.7%) | 5 (9.3%) |
| Total | 475 (53.8%) | 408 (46.2%) |
Education in Lisbon
School Enrollment in Lisbon
The most common levels of schooling among the 518 students in Lisbon are elementary school (160 | 30.9%), middle school (158 | 30.5%), and high school (140 | 27.0%).
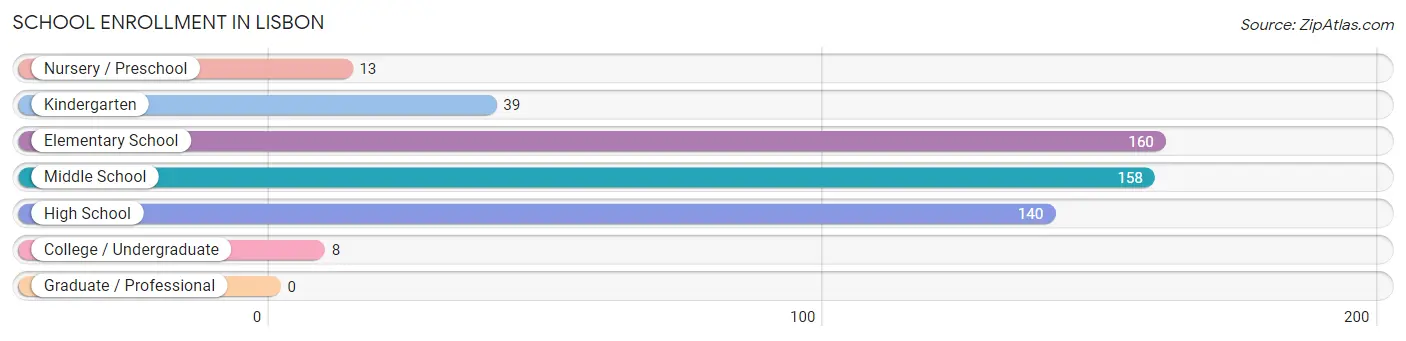
| School Level | # Students | % Students |
| Nursery / Preschool | 13 | 2.5% |
| Kindergarten | 39 | 7.5% |
| Elementary School | 160 | 30.9% |
| Middle School | 158 | 30.5% |
| High School | 140 | 27.0% |
| College / Undergraduate | 8 | 1.5% |
| Graduate / Professional | 0 | 0.0% |
| Total | 518 | 100.0% |
School Enrollment by Age by Funding Source in Lisbon
Out of a total of 518 students who are enrolled in schools in Lisbon, 39 (7.5%) attend a private institution, while the remaining 479 (92.5%) are enrolled in public schools. The age group of 20 to 24 year olds has the highest likelihood of being enrolled in private schools, with 8 (100.0% in the age bracket) enrolled. Conversely, the age group of 5 to 9 year old has the lowest likelihood of being enrolled in a private school, with 172 (100.0% in the age bracket) attending a public institution.
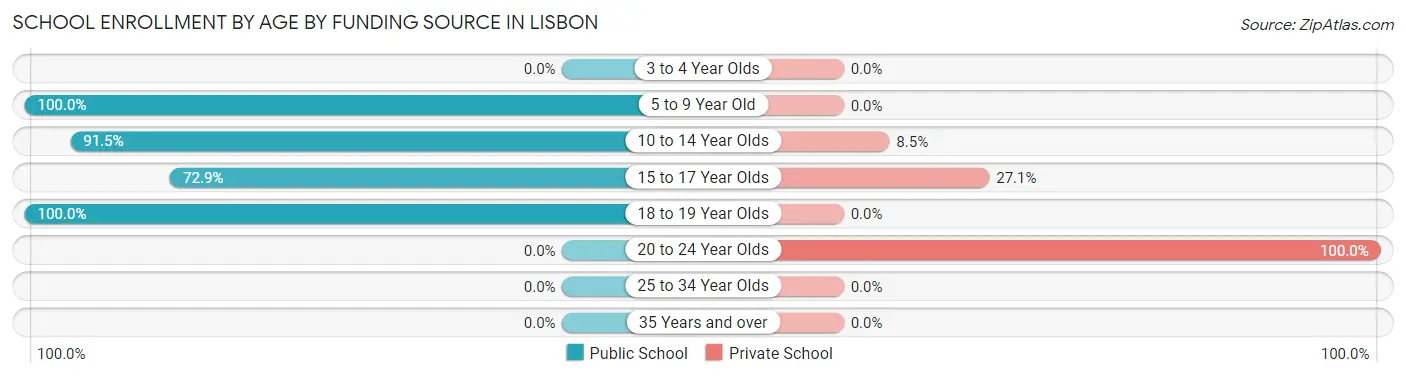
| Age Bracket | Public School | Private School |
| 3 to 4 Year Olds | 0 (0.0%) | 0 (0.0%) |
| 5 to 9 Year Old | 172 (100.0%) | 0 (0.0%) |
| 10 to 14 Year Olds | 161 (91.5%) | 15 (8.5%) |
| 15 to 17 Year Olds | 43 (72.9%) | 16 (27.1%) |
| 18 to 19 Year Olds | 103 (100.0%) | 0 (0.0%) |
| 20 to 24 Year Olds | 0 (0.0%) | 8 (100.0%) |
| 25 to 34 Year Olds | 0 (0.0%) | 0 (0.0%) |
| 35 Years and over | 0 (0.0%) | 0 (0.0%) |
| Total | 479 (92.5%) | 39 (7.5%) |
Educational Attainment by Field of Study in Lisbon
Education (83 | 22.9%), literature & languages (57 | 15.8%), bio, nature & agricultural (45 | 12.4%), liberal arts & history (43 | 11.9%), and science & technology (37 | 10.2%) are the most common fields of study among 362 individuals in Lisbon who have obtained a bachelor's degree or higher.
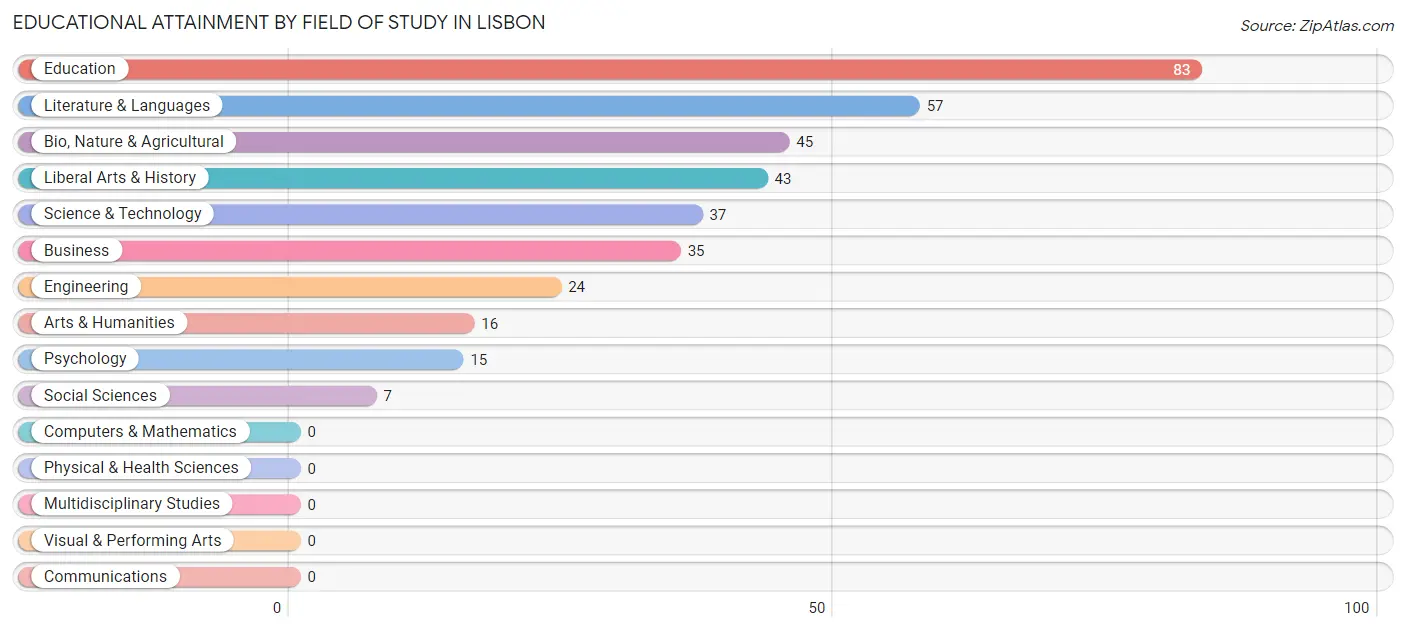
| Field of Study | # Graduates | % Graduates |
| Computers & Mathematics | 0 | 0.0% |
| Bio, Nature & Agricultural | 45 | 12.4% |
| Physical & Health Sciences | 0 | 0.0% |
| Psychology | 15 | 4.1% |
| Social Sciences | 7 | 1.9% |
| Engineering | 24 | 6.6% |
| Multidisciplinary Studies | 0 | 0.0% |
| Science & Technology | 37 | 10.2% |
| Business | 35 | 9.7% |
| Education | 83 | 22.9% |
| Literature & Languages | 57 | 15.8% |
| Liberal Arts & History | 43 | 11.9% |
| Visual & Performing Arts | 0 | 0.0% |
| Communications | 0 | 0.0% |
| Arts & Humanities | 16 | 4.4% |
| Total | 362 | 100.0% |
Transportation & Commute in Lisbon
Vehicle Availability by Sex in Lisbon
The most prevalent vehicle ownership categories in Lisbon are males with 2 vehicles (183, accounting for 39.4%) and females with 2 vehicles (92, making up 44.9%).
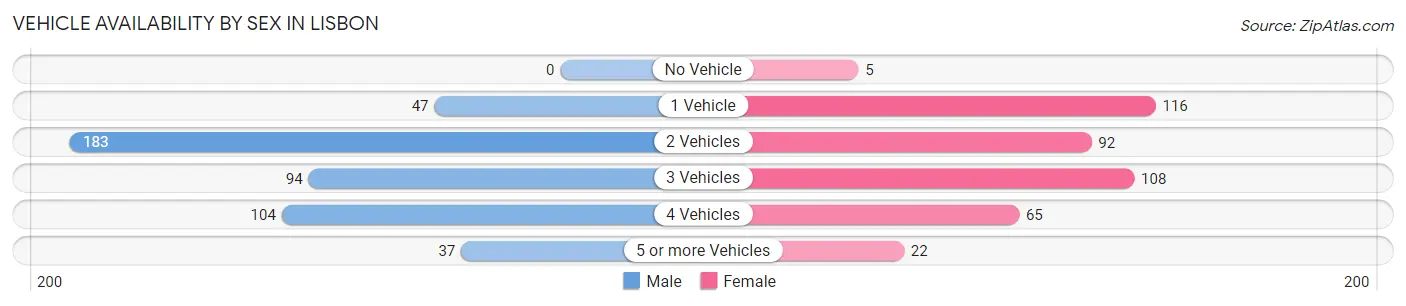
| Vehicles Available | Male | Female |
| No Vehicle | 0 (0.0%) | 5 (1.2%) |
| 1 Vehicle | 47 (10.1%) | 116 (28.4%) |
| 2 Vehicles | 183 (39.4%) | 92 (22.6%) |
| 3 Vehicles | 94 (20.2%) | 108 (26.5%) |
| 4 Vehicles | 104 (22.4%) | 65 (15.9%) |
| 5 or more Vehicles | 37 (8.0%) | 22 (5.4%) |
| Total | 465 (100.0%) | 408 (100.0%) |
Commute Time in Lisbon
The most frequently occuring commute durations in Lisbon are 5 to 9 minutes (234 commuters, 28.5%), 15 to 19 minutes (174 commuters, 21.2%), and 20 to 24 minutes (99 commuters, 12.1%).
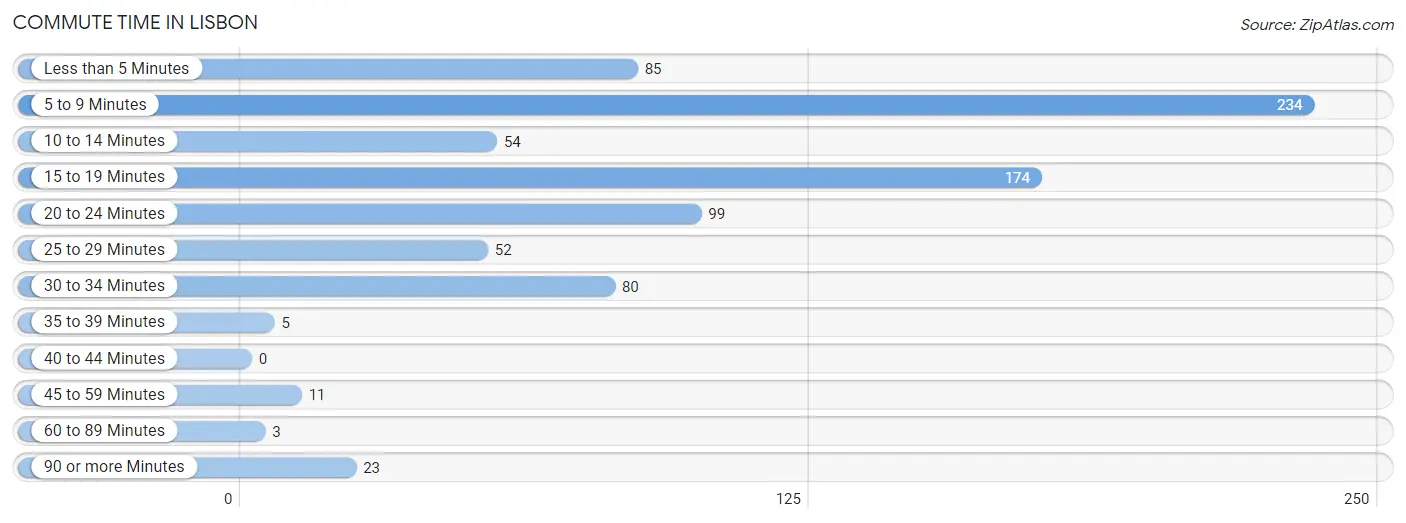
| Commute Time | # Commuters | % Commuters |
| Less than 5 Minutes | 85 | 10.4% |
| 5 to 9 Minutes | 234 | 28.5% |
| 10 to 14 Minutes | 54 | 6.6% |
| 15 to 19 Minutes | 174 | 21.2% |
| 20 to 24 Minutes | 99 | 12.1% |
| 25 to 29 Minutes | 52 | 6.3% |
| 30 to 34 Minutes | 80 | 9.8% |
| 35 to 39 Minutes | 5 | 0.6% |
| 40 to 44 Minutes | 0 | 0.0% |
| 45 to 59 Minutes | 11 | 1.3% |
| 60 to 89 Minutes | 3 | 0.4% |
| 90 or more Minutes | 23 | 2.8% |
Commute Time by Sex in Lisbon
The most common commute times in Lisbon are 5 to 9 minutes (134 commuters, 30.1%) for males and 5 to 9 minutes (100 commuters, 26.7%) for females.
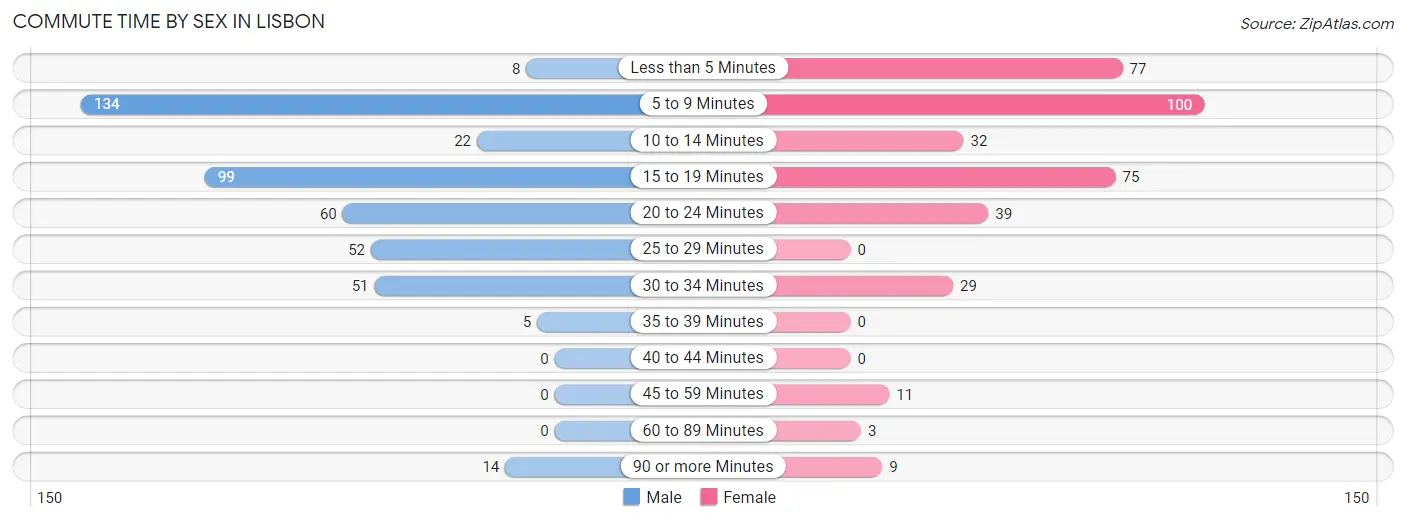
| Commute Time | Male | Female |
| Less than 5 Minutes | 8 (1.8%) | 77 (20.5%) |
| 5 to 9 Minutes | 134 (30.1%) | 100 (26.7%) |
| 10 to 14 Minutes | 22 (4.9%) | 32 (8.5%) |
| 15 to 19 Minutes | 99 (22.3%) | 75 (20.0%) |
| 20 to 24 Minutes | 60 (13.5%) | 39 (10.4%) |
| 25 to 29 Minutes | 52 (11.7%) | 0 (0.0%) |
| 30 to 34 Minutes | 51 (11.5%) | 29 (7.7%) |
| 35 to 39 Minutes | 5 (1.1%) | 0 (0.0%) |
| 40 to 44 Minutes | 0 (0.0%) | 0 (0.0%) |
| 45 to 59 Minutes | 0 (0.0%) | 11 (2.9%) |
| 60 to 89 Minutes | 0 (0.0%) | 3 (0.8%) |
| 90 or more Minutes | 14 (3.2%) | 9 (2.4%) |
Time of Departure to Work by Sex in Lisbon
The most frequent times of departure to work in Lisbon are 4:00 PM to 11:59 PM (74, 16.6%) for males and 7:30 AM to 7:59 AM (79, 21.1%) for females.
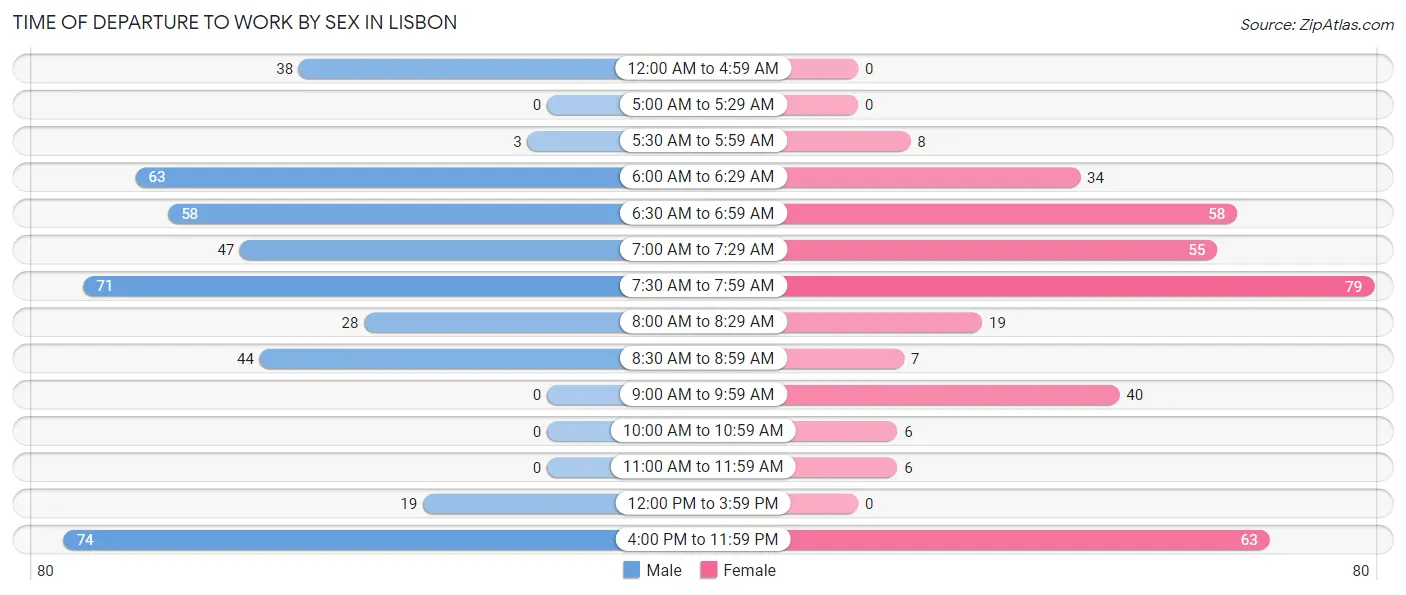
| Time of Departure | Male | Female |
| 12:00 AM to 4:59 AM | 38 (8.5%) | 0 (0.0%) |
| 5:00 AM to 5:29 AM | 0 (0.0%) | 0 (0.0%) |
| 5:30 AM to 5:59 AM | 3 (0.7%) | 8 (2.1%) |
| 6:00 AM to 6:29 AM | 63 (14.2%) | 34 (9.1%) |
| 6:30 AM to 6:59 AM | 58 (13.0%) | 58 (15.5%) |
| 7:00 AM to 7:29 AM | 47 (10.6%) | 55 (14.7%) |
| 7:30 AM to 7:59 AM | 71 (16.0%) | 79 (21.1%) |
| 8:00 AM to 8:29 AM | 28 (6.3%) | 19 (5.1%) |
| 8:30 AM to 8:59 AM | 44 (9.9%) | 7 (1.9%) |
| 9:00 AM to 9:59 AM | 0 (0.0%) | 40 (10.7%) |
| 10:00 AM to 10:59 AM | 0 (0.0%) | 6 (1.6%) |
| 11:00 AM to 11:59 AM | 0 (0.0%) | 6 (1.6%) |
| 12:00 PM to 3:59 PM | 19 (4.3%) | 0 (0.0%) |
| 4:00 PM to 11:59 PM | 74 (16.6%) | 63 (16.8%) |
| Total | 445 (100.0%) | 375 (100.0%) |
Housing Occupancy in Lisbon
Occupancy by Ownership in Lisbon
Of the total 896 dwellings in Lisbon, owner-occupied units account for 527 (58.8%), while renter-occupied units make up 369 (41.2%).
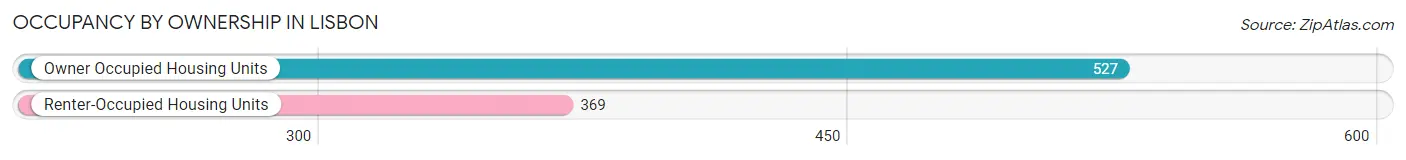
| Occupancy | # Housing Units | % Housing Units |
| Owner Occupied Housing Units | 527 | 58.8% |
| Renter-Occupied Housing Units | 369 | 41.2% |
| Total Occupied Housing Units | 896 | 100.0% |
Occupancy by Household Size in Lisbon
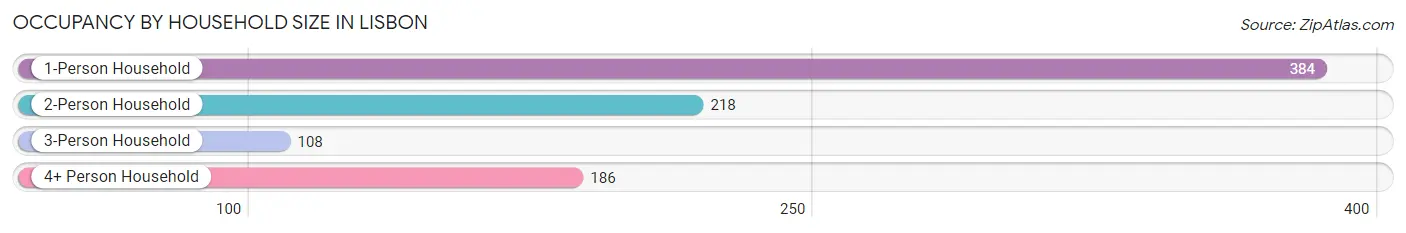
| Household Size | # Housing Units | % Housing Units |
| 1-Person Household | 384 | 42.9% |
| 2-Person Household | 218 | 24.3% |
| 3-Person Household | 108 | 12.0% |
| 4+ Person Household | 186 | 20.8% |
| Total Housing Units | 896 | 100.0% |
Occupancy by Ownership by Household Size in Lisbon
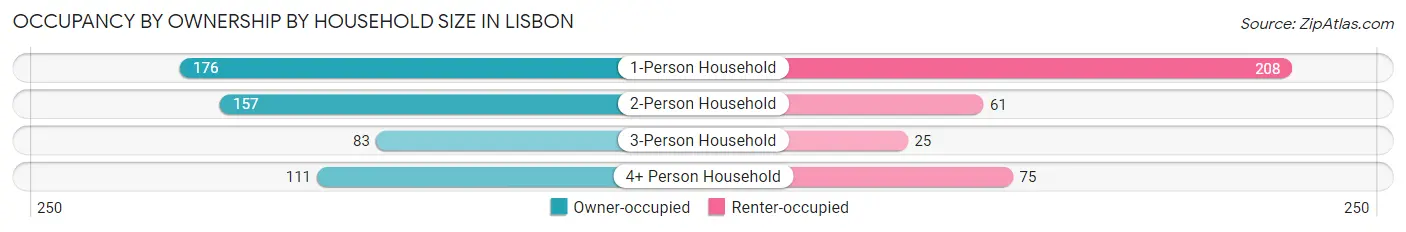
| Household Size | Owner-occupied | Renter-occupied |
| 1-Person Household | 176 (45.8%) | 208 (54.2%) |
| 2-Person Household | 157 (72.0%) | 61 (28.0%) |
| 3-Person Household | 83 (76.8%) | 25 (23.2%) |
| 4+ Person Household | 111 (59.7%) | 75 (40.3%) |
| Total Housing Units | 527 (58.8%) | 369 (41.2%) |
Occupancy by Educational Attainment in Lisbon
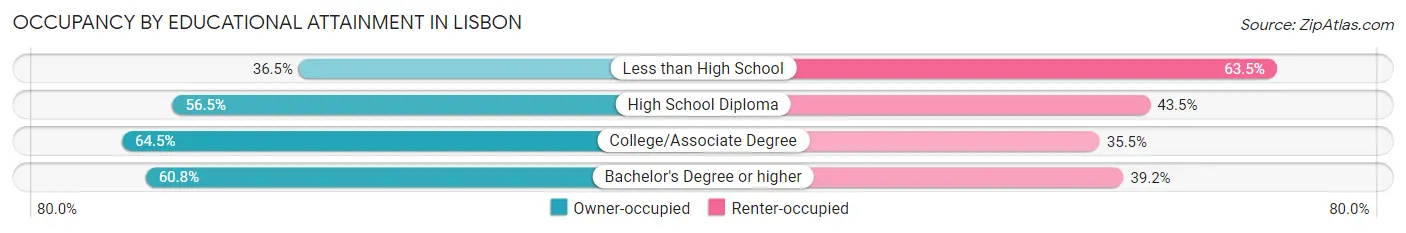
| Household Size | Owner-occupied | Renter-occupied |
| Less than High School | 23 (36.5%) | 40 (63.5%) |
| High School Diploma | 169 (56.5%) | 130 (43.5%) |
| College/Associate Degree | 180 (64.5%) | 99 (35.5%) |
| Bachelor's Degree or higher | 155 (60.8%) | 100 (39.2%) |
Occupancy by Age of Householder in Lisbon
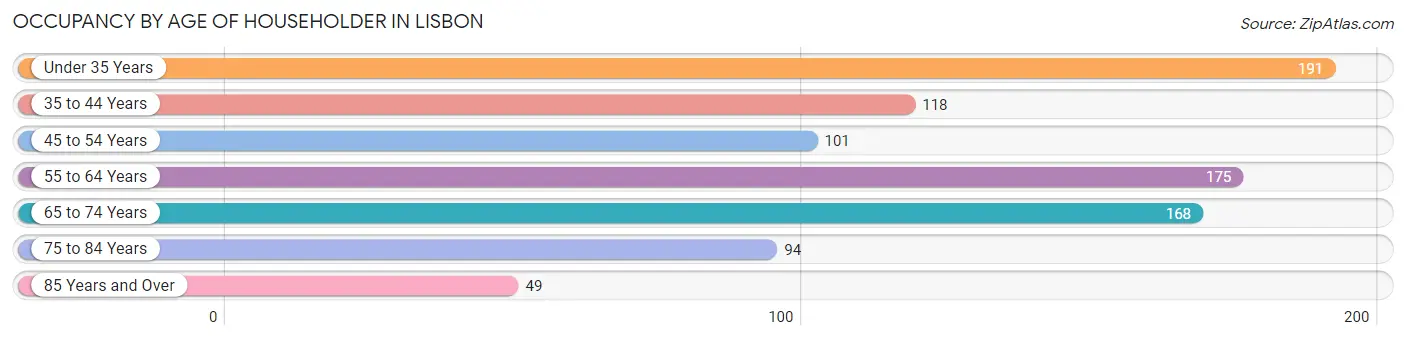
| Age Bracket | # Households | % Households |
| Under 35 Years | 191 | 21.3% |
| 35 to 44 Years | 118 | 13.2% |
| 45 to 54 Years | 101 | 11.3% |
| 55 to 64 Years | 175 | 19.5% |
| 65 to 74 Years | 168 | 18.8% |
| 75 to 84 Years | 94 | 10.5% |
| 85 Years and Over | 49 | 5.5% |
| Total | 896 | 100.0% |
Housing Finances in Lisbon
Median Income by Occupancy in Lisbon
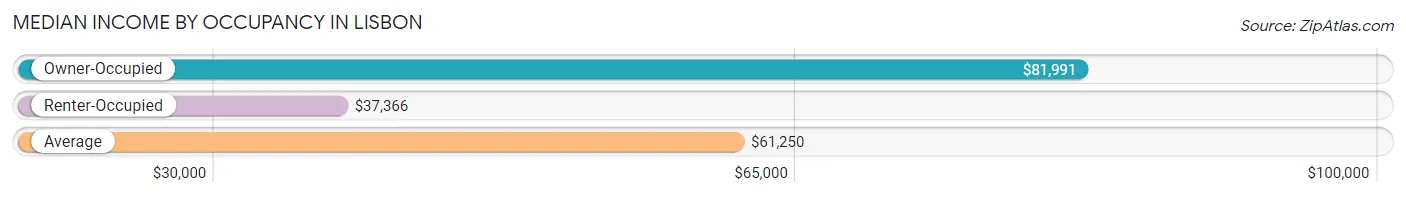
| Occupancy Type | # Households | Median Income |
| Owner-Occupied | 527 (58.8%) | $81,991 |
| Renter-Occupied | 369 (41.2%) | $37,366 |
| Average | 896 (100.0%) | $61,250 |
Occupancy by Householder Income Bracket in Lisbon
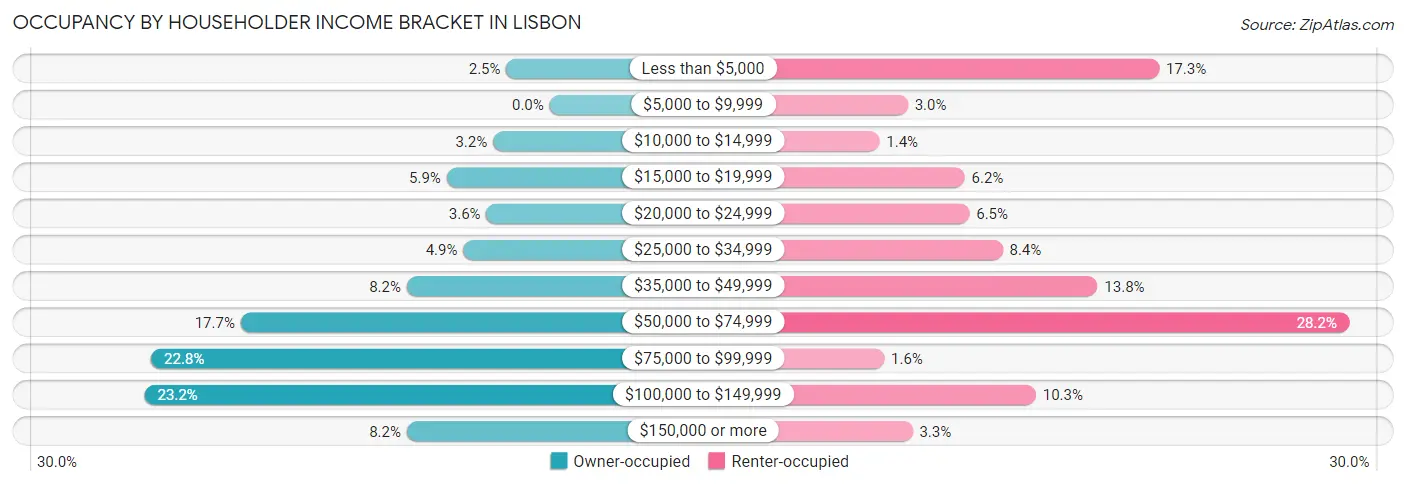
| Income Bracket | Owner-occupied | Renter-occupied |
| Less than $5,000 | 13 (2.5%) | 64 (17.3%) |
| $5,000 to $9,999 | 0 (0.0%) | 11 (3.0%) |
| $10,000 to $14,999 | 17 (3.2%) | 5 (1.4%) |
| $15,000 to $19,999 | 31 (5.9%) | 23 (6.2%) |
| $20,000 to $24,999 | 19 (3.6%) | 24 (6.5%) |
| $25,000 to $34,999 | 26 (4.9%) | 31 (8.4%) |
| $35,000 to $49,999 | 43 (8.2%) | 51 (13.8%) |
| $50,000 to $74,999 | 93 (17.6%) | 104 (28.2%) |
| $75,000 to $99,999 | 120 (22.8%) | 6 (1.6%) |
| $100,000 to $149,999 | 122 (23.2%) | 38 (10.3%) |
| $150,000 or more | 43 (8.2%) | 12 (3.3%) |
| Total | 527 (100.0%) | 369 (100.0%) |
Monthly Housing Cost Tiers in Lisbon
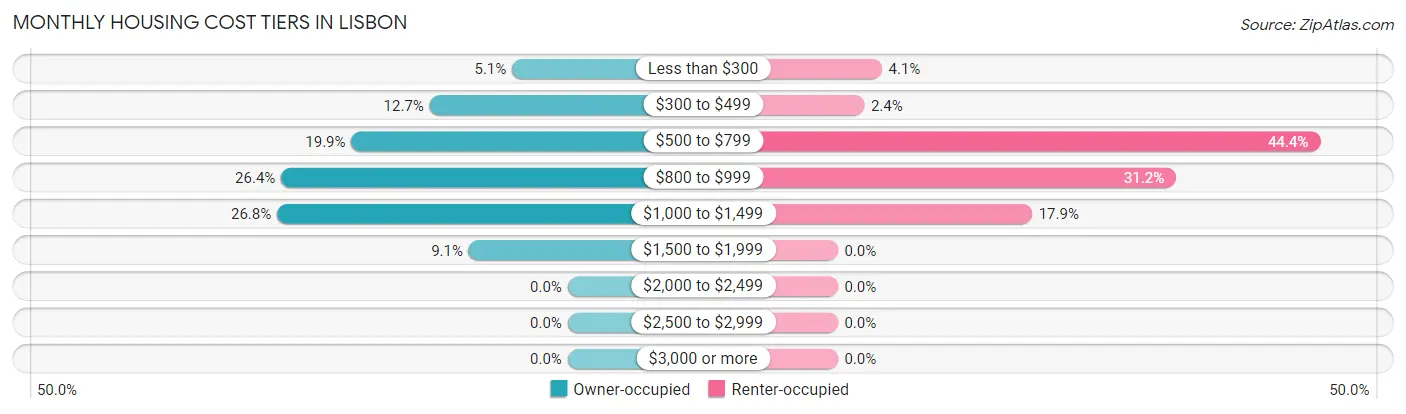
| Monthly Cost | Owner-occupied | Renter-occupied |
| Less than $300 | 27 (5.1%) | 15 (4.1%) |
| $300 to $499 | 67 (12.7%) | 9 (2.4%) |
| $500 to $799 | 105 (19.9%) | 164 (44.4%) |
| $800 to $999 | 139 (26.4%) | 115 (31.2%) |
| $1,000 to $1,499 | 141 (26.8%) | 66 (17.9%) |
| $1,500 to $1,999 | 48 (9.1%) | 0 (0.0%) |
| $2,000 to $2,499 | 0 (0.0%) | 0 (0.0%) |
| $2,500 to $2,999 | 0 (0.0%) | 0 (0.0%) |
| $3,000 or more | 0 (0.0%) | 0 (0.0%) |
| Total | 527 (100.0%) | 369 (100.0%) |
Physical Housing Characteristics in Lisbon
Housing Structures in Lisbon
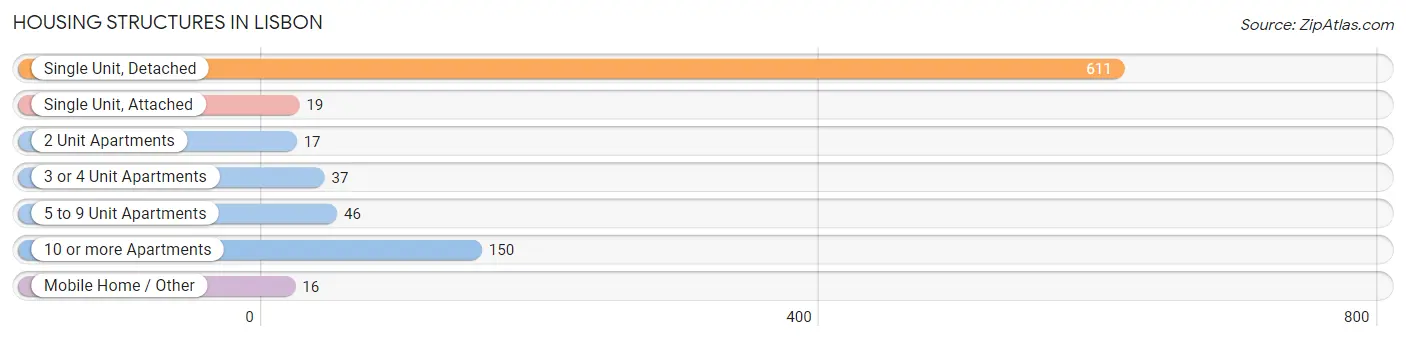
| Structure Type | # Housing Units | % Housing Units |
| Single Unit, Detached | 611 | 68.2% |
| Single Unit, Attached | 19 | 2.1% |
| 2 Unit Apartments | 17 | 1.9% |
| 3 or 4 Unit Apartments | 37 | 4.1% |
| 5 to 9 Unit Apartments | 46 | 5.1% |
| 10 or more Apartments | 150 | 16.7% |
| Mobile Home / Other | 16 | 1.8% |
| Total | 896 | 100.0% |
Housing Structures by Occupancy in Lisbon
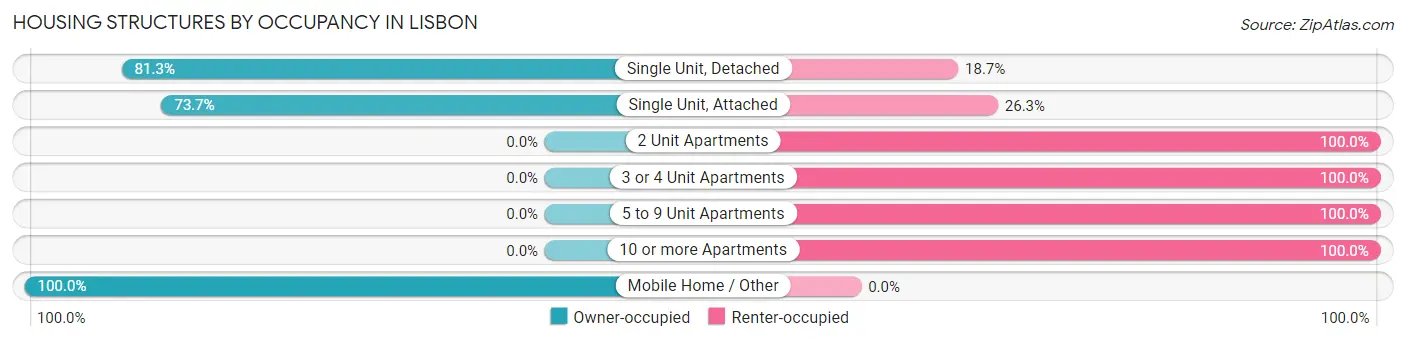
| Structure Type | Owner-occupied | Renter-occupied |
| Single Unit, Detached | 497 (81.3%) | 114 (18.7%) |
| Single Unit, Attached | 14 (73.7%) | 5 (26.3%) |
| 2 Unit Apartments | 0 (0.0%) | 17 (100.0%) |
| 3 or 4 Unit Apartments | 0 (0.0%) | 37 (100.0%) |
| 5 to 9 Unit Apartments | 0 (0.0%) | 46 (100.0%) |
| 10 or more Apartments | 0 (0.0%) | 150 (100.0%) |
| Mobile Home / Other | 16 (100.0%) | 0 (0.0%) |
| Total | 527 (58.8%) | 369 (41.2%) |
Housing Structures by Number of Rooms in Lisbon
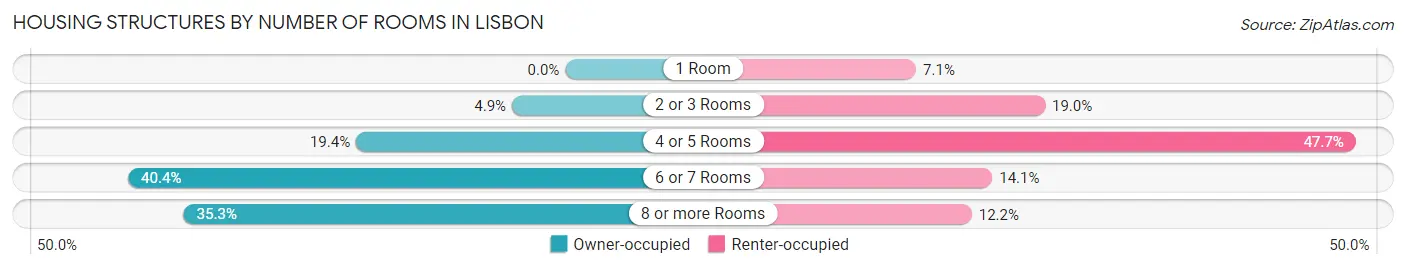
| Number of Rooms | Owner-occupied | Renter-occupied |
| 1 Room | 0 (0.0%) | 26 (7.0%) |
| 2 or 3 Rooms | 26 (4.9%) | 70 (19.0%) |
| 4 or 5 Rooms | 102 (19.4%) | 176 (47.7%) |
| 6 or 7 Rooms | 213 (40.4%) | 52 (14.1%) |
| 8 or more Rooms | 186 (35.3%) | 45 (12.2%) |
| Total | 527 (100.0%) | 369 (100.0%) |
Housing Structure by Heating Type in Lisbon
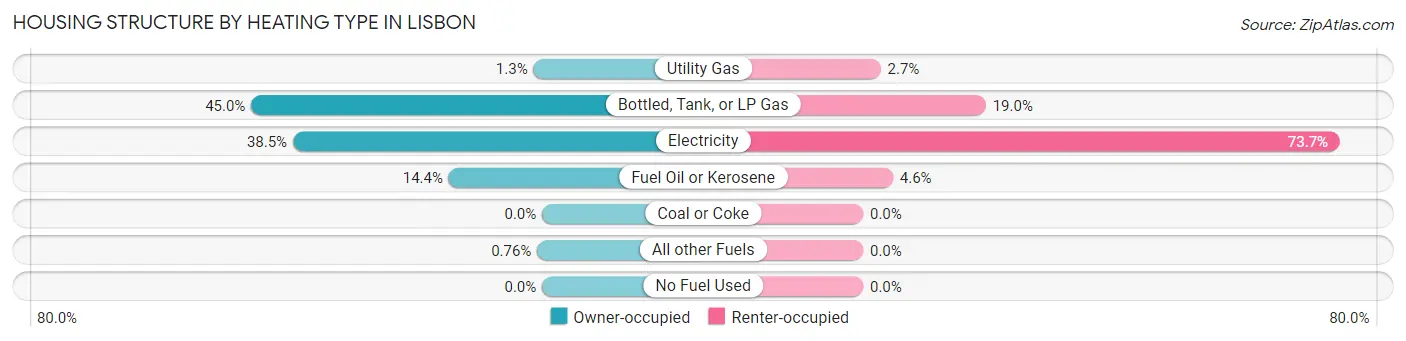
| Heating Type | Owner-occupied | Renter-occupied |
| Utility Gas | 7 (1.3%) | 10 (2.7%) |
| Bottled, Tank, or LP Gas | 237 (45.0%) | 70 (19.0%) |
| Electricity | 203 (38.5%) | 272 (73.7%) |
| Fuel Oil or Kerosene | 76 (14.4%) | 17 (4.6%) |
| Coal or Coke | 0 (0.0%) | 0 (0.0%) |
| All other Fuels | 4 (0.8%) | 0 (0.0%) |
| No Fuel Used | 0 (0.0%) | 0 (0.0%) |
| Total | 527 (100.0%) | 369 (100.0%) |
Household Vehicle Usage in Lisbon
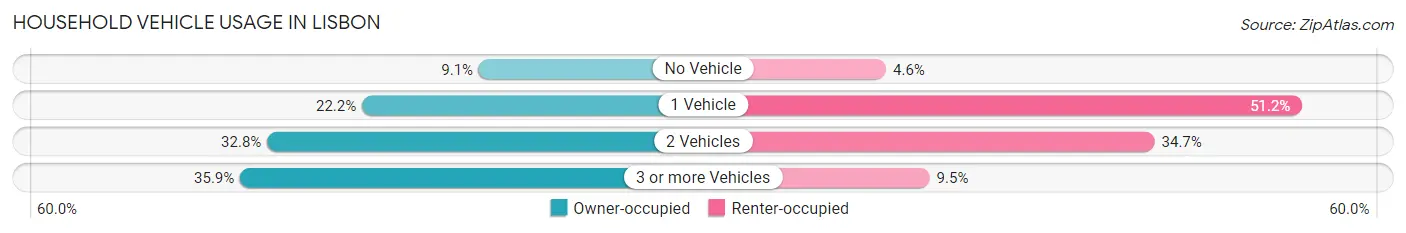
| Vehicles per Household | Owner-occupied | Renter-occupied |
| No Vehicle | 48 (9.1%) | 17 (4.6%) |
| 1 Vehicle | 117 (22.2%) | 189 (51.2%) |
| 2 Vehicles | 173 (32.8%) | 128 (34.7%) |
| 3 or more Vehicles | 189 (35.9%) | 35 (9.5%) |
| Total | 527 (100.0%) | 369 (100.0%) |
Real Estate & Mortgages in Lisbon
Real Estate and Mortgage Overview in Lisbon
| Characteristic | Without Mortgage | With Mortgage |
| Housing Units | 245 | 282 |
| Median Property Value | $167,900 | $113,200 |
| Median Household Income | $64,034 | $26 |
| Monthly Housing Costs | $573 | $0 |
| Real Estate Taxes | $2,063 | $23 |
Property Value by Mortgage Status in Lisbon
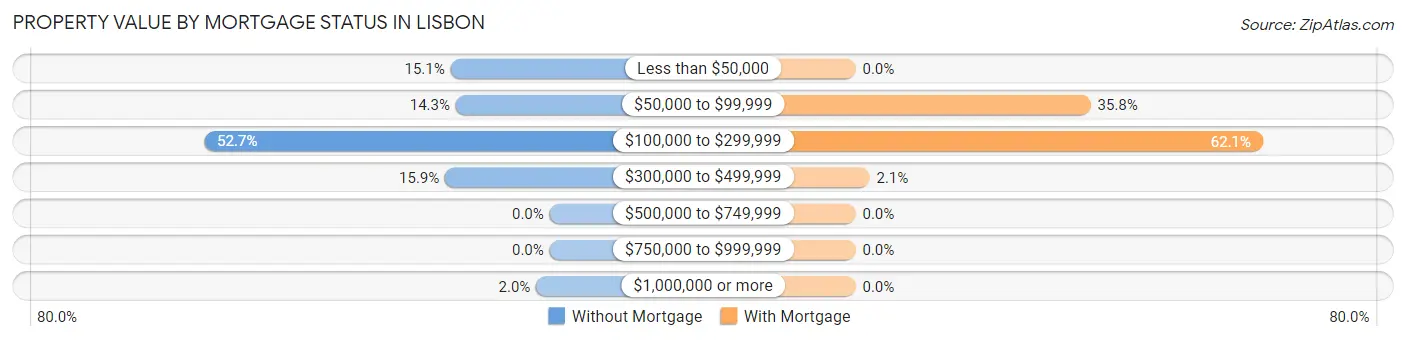
| Property Value | Without Mortgage | With Mortgage |
| Less than $50,000 | 37 (15.1%) | 0 (0.0%) |
| $50,000 to $99,999 | 35 (14.3%) | 101 (35.8%) |
| $100,000 to $299,999 | 129 (52.6%) | 175 (62.1%) |
| $300,000 to $499,999 | 39 (15.9%) | 6 (2.1%) |
| $500,000 to $749,999 | 0 (0.0%) | 0 (0.0%) |
| $750,000 to $999,999 | 0 (0.0%) | 0 (0.0%) |
| $1,000,000 or more | 5 (2.0%) | 0 (0.0%) |
| Total | 245 (100.0%) | 282 (100.0%) |
Household Income by Mortgage Status in Lisbon
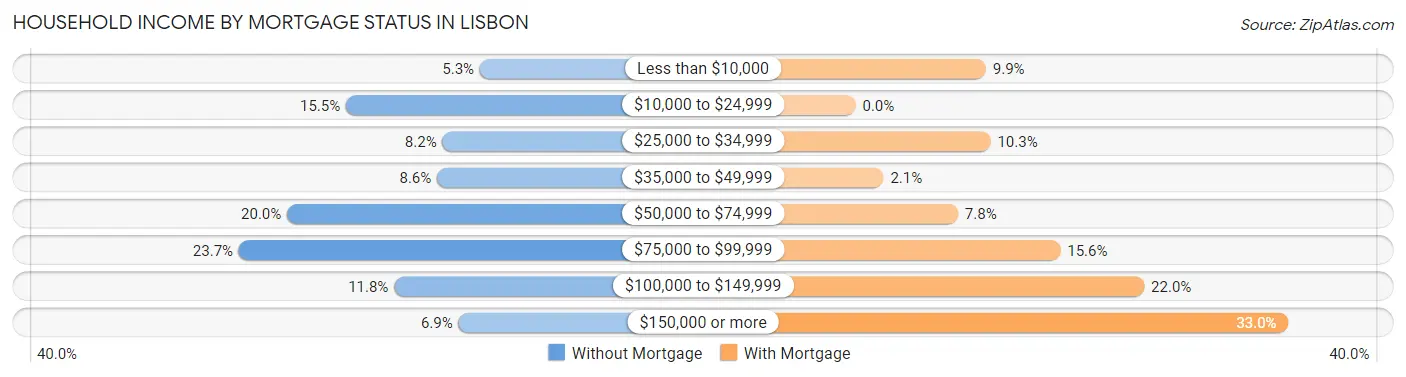
| Household Income | Without Mortgage | With Mortgage |
| Less than $10,000 | 13 (5.3%) | 28 (9.9%) |
| $10,000 to $24,999 | 38 (15.5%) | 0 (0.0%) |
| $25,000 to $34,999 | 20 (8.2%) | 29 (10.3%) |
| $35,000 to $49,999 | 21 (8.6%) | 6 (2.1%) |
| $50,000 to $74,999 | 49 (20.0%) | 22 (7.8%) |
| $75,000 to $99,999 | 58 (23.7%) | 44 (15.6%) |
| $100,000 to $149,999 | 29 (11.8%) | 62 (22.0%) |
| $150,000 or more | 17 (6.9%) | 93 (33.0%) |
| Total | 245 (100.0%) | 282 (100.0%) |
Property Value to Household Income Ratio in Lisbon
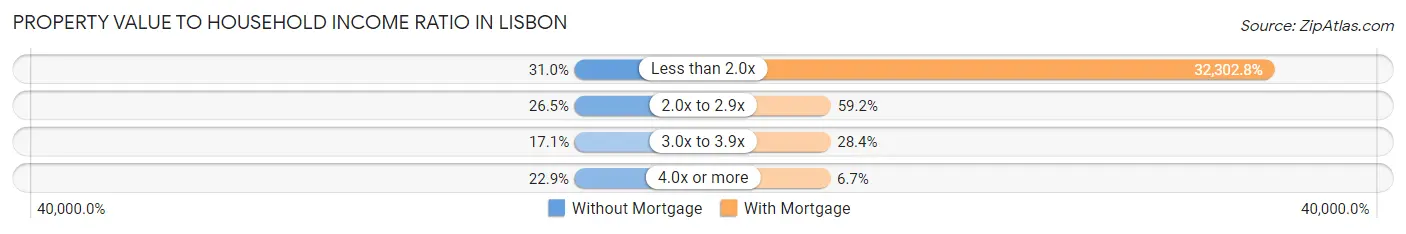
| Value-to-Income Ratio | Without Mortgage | With Mortgage |
| Less than 2.0x | 76 (31.0%) | 91,094 (32,302.8%) |
| 2.0x to 2.9x | 65 (26.5%) | 167 (59.2%) |
| 3.0x to 3.9x | 42 (17.1%) | 80 (28.4%) |
| 4.0x or more | 56 (22.9%) | 19 (6.7%) |
| Total | 245 (100.0%) | 282 (100.0%) |
Real Estate Taxes by Mortgage Status in Lisbon
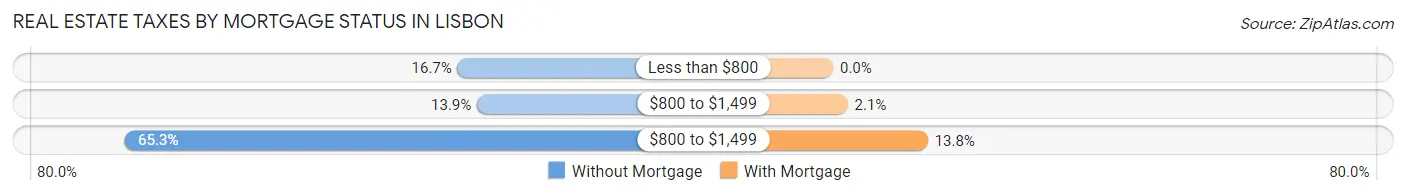
| Property Taxes | Without Mortgage | With Mortgage |
| Less than $800 | 41 (16.7%) | 0 (0.0%) |
| $800 to $1,499 | 34 (13.9%) | 6 (2.1%) |
| $800 to $1,499 | 160 (65.3%) | 39 (13.8%) |
| Total | 245 (100.0%) | 282 (100.0%) |
Health & Disability in Lisbon
Health Insurance Coverage by Age in Lisbon
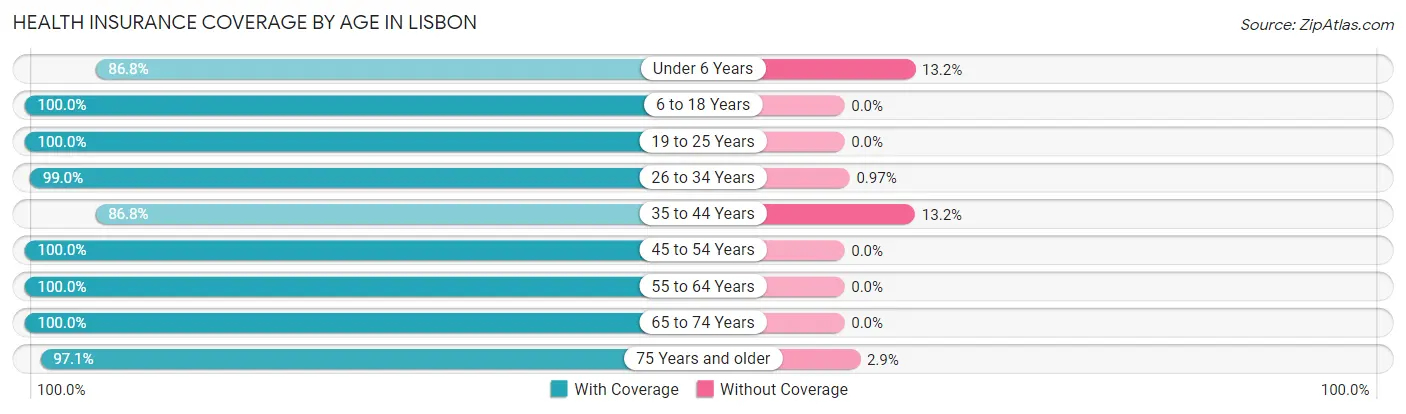
| Age Bracket | With Coverage | Without Coverage |
| Under 6 Years | 79 (86.8%) | 12 (13.2%) |
| 6 to 18 Years | 475 (100.0%) | 0 (0.0%) |
| 19 to 25 Years | 93 (100.0%) | 0 (0.0%) |
| 26 to 34 Years | 205 (99.0%) | 2 (1.0%) |
| 35 to 44 Years | 244 (86.8%) | 37 (13.2%) |
| 45 to 54 Years | 191 (100.0%) | 0 (0.0%) |
| 55 to 64 Years | 283 (100.0%) | 0 (0.0%) |
| 65 to 74 Years | 233 (100.0%) | 0 (0.0%) |
| 75 Years and older | 166 (97.1%) | 5 (2.9%) |
| Total | 1,969 (97.2%) | 56 (2.8%) |
Health Insurance Coverage by Citizenship Status in Lisbon
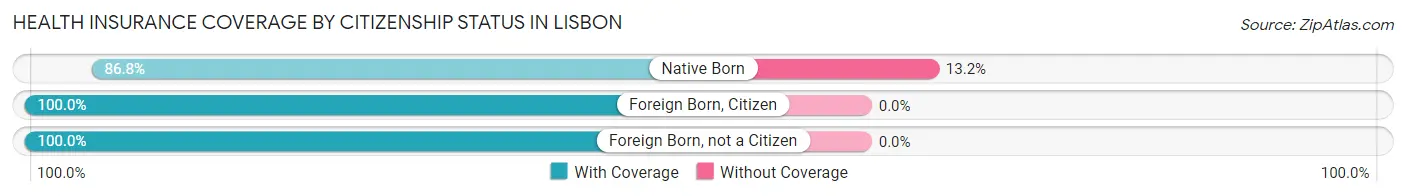
| Citizenship Status | With Coverage | Without Coverage |
| Native Born | 79 (86.8%) | 12 (13.2%) |
| Foreign Born, Citizen | 475 (100.0%) | 0 (0.0%) |
| Foreign Born, not a Citizen | 93 (100.0%) | 0 (0.0%) |
Health Insurance Coverage by Household Income in Lisbon
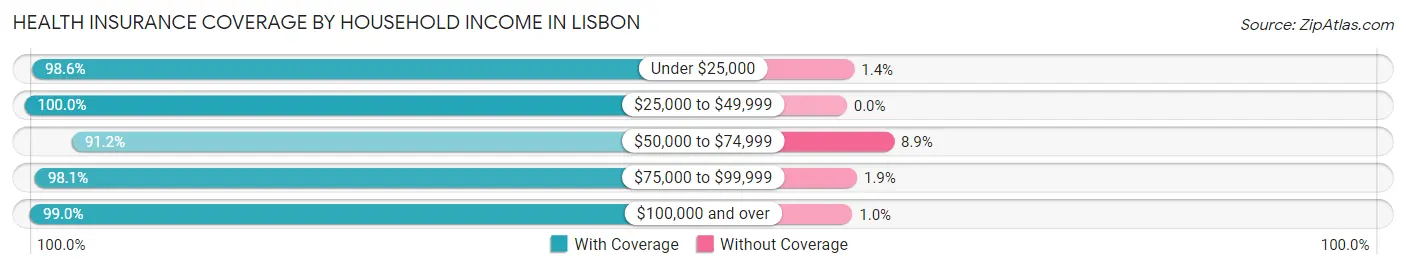
| Household Income | With Coverage | Without Coverage |
| Under $25,000 | 348 (98.6%) | 5 (1.4%) |
| $25,000 to $49,999 | 262 (100.0%) | 0 (0.0%) |
| $50,000 to $74,999 | 381 (91.1%) | 37 (8.8%) |
| $75,000 to $99,999 | 408 (98.1%) | 8 (1.9%) |
| $100,000 and over | 570 (99.0%) | 6 (1.0%) |
Public vs Private Health Insurance Coverage by Age in Lisbon
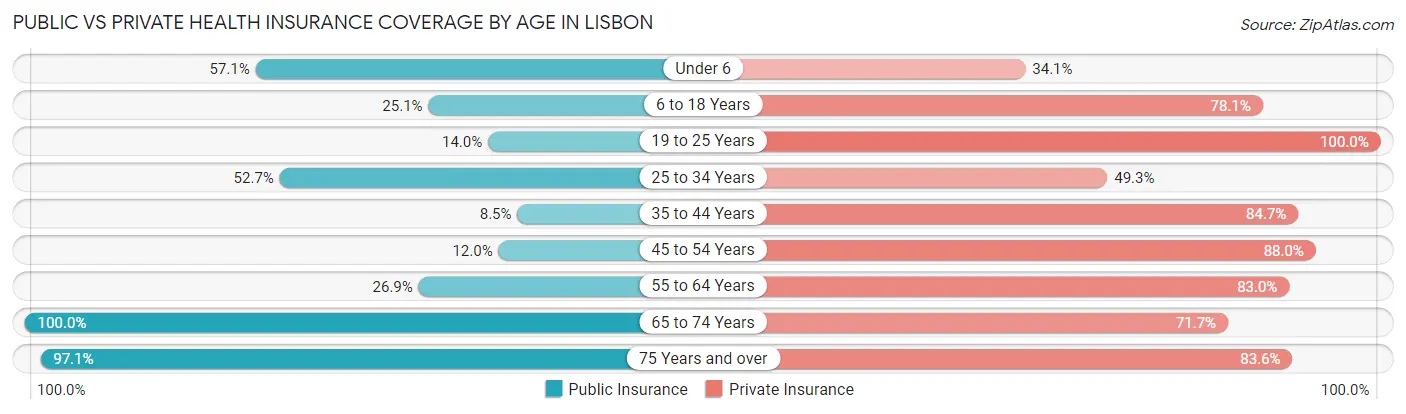
| Age Bracket | Public Insurance | Private Insurance |
| Under 6 | 52 (57.1%) | 31 (34.1%) |
| 6 to 18 Years | 119 (25.1%) | 371 (78.1%) |
| 19 to 25 Years | 13 (14.0%) | 93 (100.0%) |
| 25 to 34 Years | 109 (52.7%) | 102 (49.3%) |
| 35 to 44 Years | 24 (8.5%) | 238 (84.7%) |
| 45 to 54 Years | 23 (12.0%) | 168 (88.0%) |
| 55 to 64 Years | 76 (26.9%) | 235 (83.0%) |
| 65 to 74 Years | 233 (100.0%) | 167 (71.7%) |
| 75 Years and over | 166 (97.1%) | 143 (83.6%) |
| Total | 815 (40.3%) | 1,548 (76.4%) |
Disability Status by Sex by Age in Lisbon
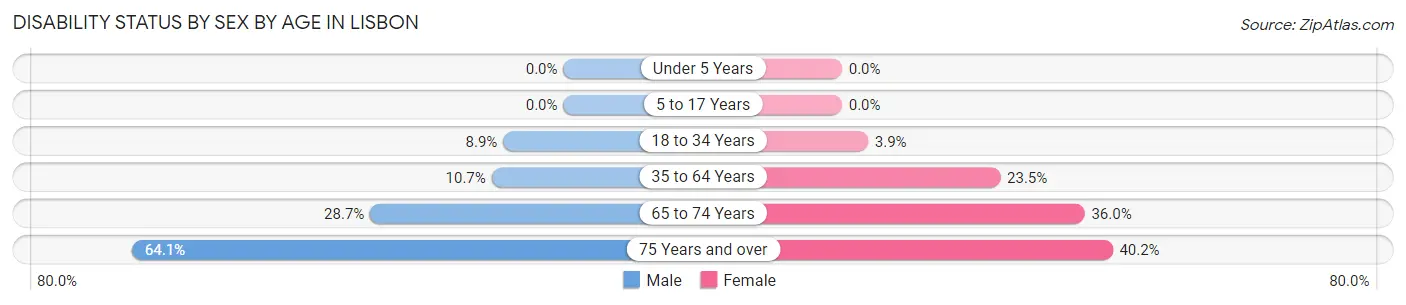
| Age Bracket | Male | Female |
| Under 5 Years | 0 (0.0%) | 0 (0.0%) |
| 5 to 17 Years | 0 (0.0%) | 0 (0.0%) |
| 18 to 34 Years | 21 (8.9%) | 6 (3.9%) |
| 35 to 64 Years | 41 (10.6%) | 87 (23.5%) |
| 65 to 74 Years | 35 (28.7%) | 40 (36.0%) |
| 75 Years and over | 41 (64.1%) | 43 (40.2%) |
Disability Class by Sex by Age in Lisbon
Disability Class: Hearing Difficulty
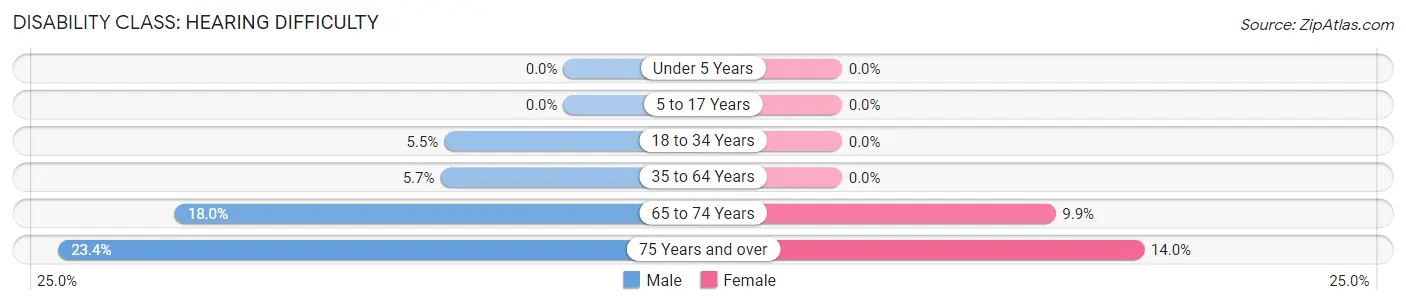
| Age Bracket | Male | Female |
| Under 5 Years | 0 (0.0%) | 0 (0.0%) |
| 5 to 17 Years | 0 (0.0%) | 0 (0.0%) |
| 18 to 34 Years | 13 (5.5%) | 0 (0.0%) |
| 35 to 64 Years | 22 (5.7%) | 0 (0.0%) |
| 65 to 74 Years | 22 (18.0%) | 11 (9.9%) |
| 75 Years and over | 15 (23.4%) | 15 (14.0%) |
Disability Class: Vision Difficulty
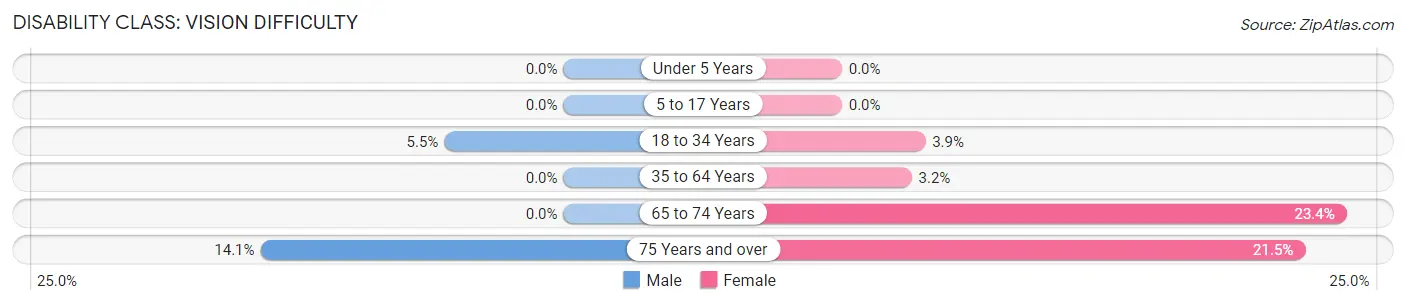
| Age Bracket | Male | Female |
| Under 5 Years | 0 (0.0%) | 0 (0.0%) |
| 5 to 17 Years | 0 (0.0%) | 0 (0.0%) |
| 18 to 34 Years | 13 (5.5%) | 6 (3.9%) |
| 35 to 64 Years | 0 (0.0%) | 12 (3.2%) |
| 65 to 74 Years | 0 (0.0%) | 26 (23.4%) |
| 75 Years and over | 9 (14.1%) | 23 (21.5%) |
Disability Class: Cognitive Difficulty
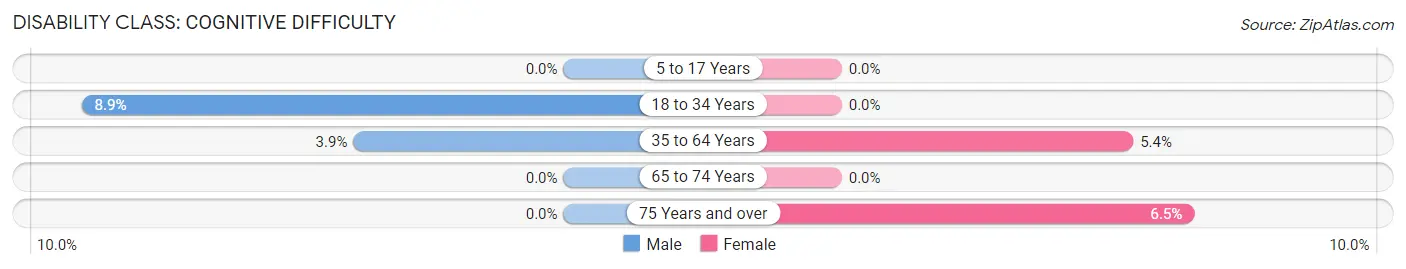
| Age Bracket | Male | Female |
| 5 to 17 Years | 0 (0.0%) | 0 (0.0%) |
| 18 to 34 Years | 21 (8.9%) | 0 (0.0%) |
| 35 to 64 Years | 15 (3.9%) | 20 (5.4%) |
| 65 to 74 Years | 0 (0.0%) | 0 (0.0%) |
| 75 Years and over | 0 (0.0%) | 7 (6.5%) |
Disability Class: Ambulatory Difficulty
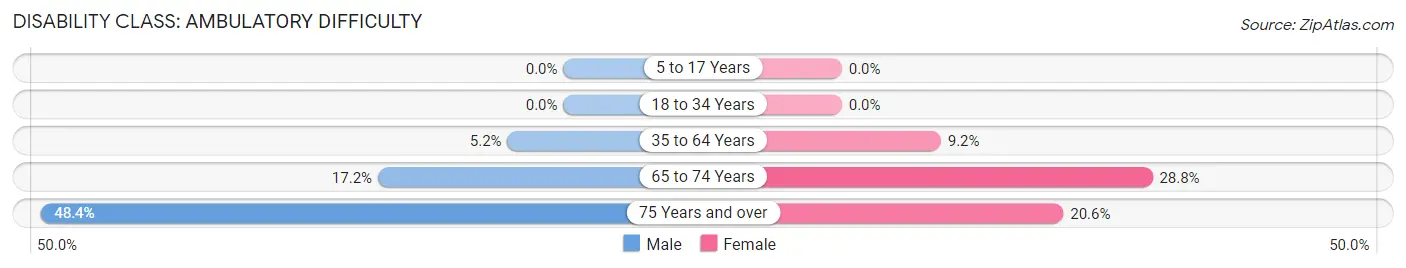
| Age Bracket | Male | Female |
| 5 to 17 Years | 0 (0.0%) | 0 (0.0%) |
| 18 to 34 Years | 0 (0.0%) | 0 (0.0%) |
| 35 to 64 Years | 20 (5.2%) | 34 (9.2%) |
| 65 to 74 Years | 21 (17.2%) | 32 (28.8%) |
| 75 Years and over | 31 (48.4%) | 22 (20.6%) |
Disability Class: Self-Care Difficulty
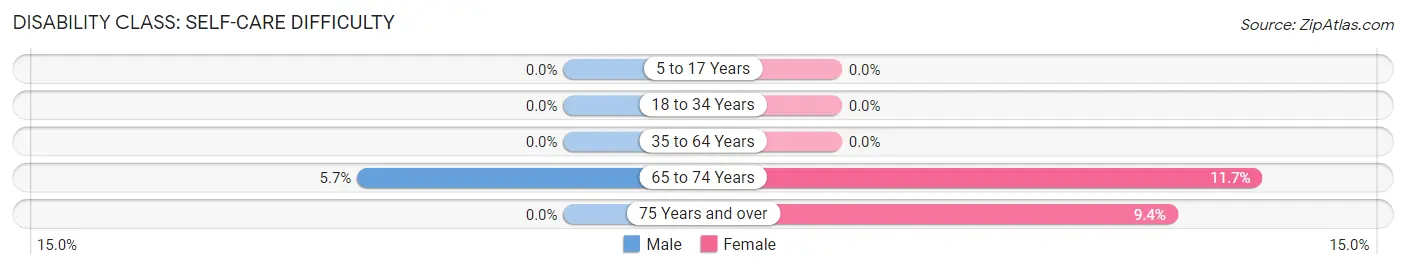
| Age Bracket | Male | Female |
| 5 to 17 Years | 0 (0.0%) | 0 (0.0%) |
| 18 to 34 Years | 0 (0.0%) | 0 (0.0%) |
| 35 to 64 Years | 0 (0.0%) | 0 (0.0%) |
| 65 to 74 Years | 7 (5.7%) | 13 (11.7%) |
| 75 Years and over | 0 (0.0%) | 10 (9.3%) |
Technology Access in Lisbon
Computing Device Access in Lisbon
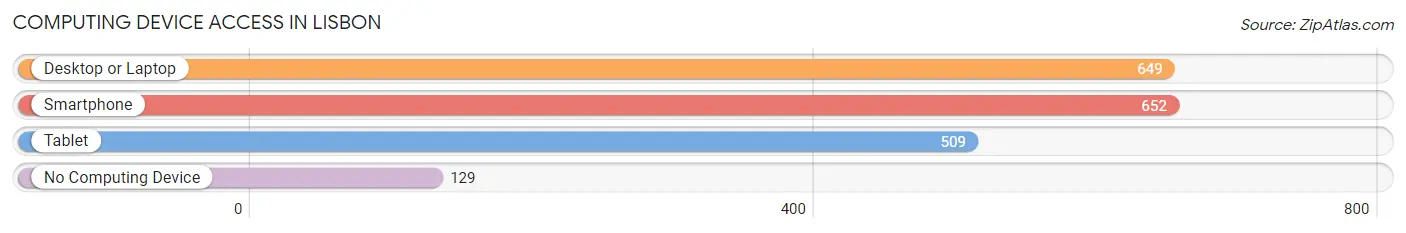
| Device Type | # Households | % Households |
| Desktop or Laptop | 649 | 72.4% |
| Smartphone | 652 | 72.8% |
| Tablet | 509 | 56.8% |
| No Computing Device | 129 | 14.4% |
| Total | 896 | 100.0% |
Internet Access in Lisbon
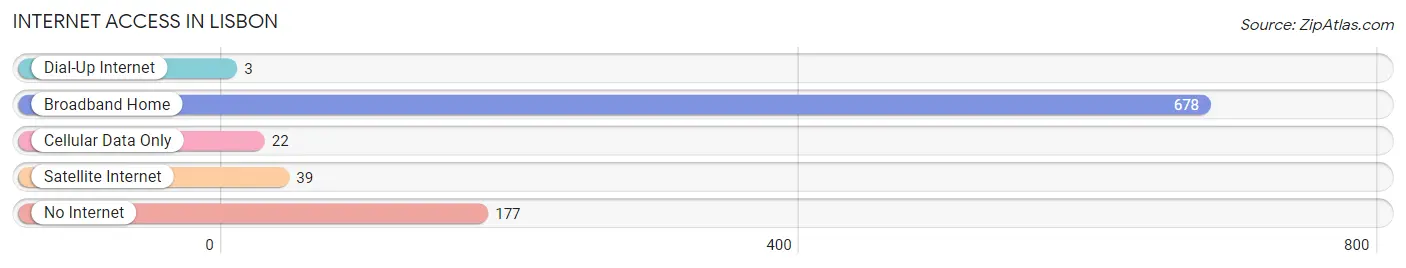
| Internet Type | # Households | % Households |
| Dial-Up Internet | 3 | 0.3% |
| Broadband Home | 678 | 75.7% |
| Cellular Data Only | 22 | 2.5% |
| Satellite Internet | 39 | 4.3% |
| No Internet | 177 | 19.8% |
| Total | 896 | 100.0% |
Lisbon Summary
Lisbon, North Dakota is a small city located in Ransom County, in the southeastern part of the state. It is situated on the Sheyenne River, and is the county seat of Ransom County. The city has a population of 1,521, according to the 2010 census.
History
Lisbon was founded in 1882, when the Northern Pacific Railroad was built through the area. The city was named after Lisbon, Portugal, and was incorporated in 1883. The city was originally a farming community, and the main crops were wheat, oats, and barley. In the early 1900s, the city began to grow, and by 1910, the population had grown to 1,000.
In the 1920s, the city experienced a period of growth, and several new businesses were established. The city also became a center for the oil industry, and several oil wells were drilled in the area. The city also became a center for the lumber industry, and several sawmills were built in the area.
In the 1950s, the city experienced a period of decline, as the oil industry began to decline. The city also experienced a period of population decline, as many people moved away to find work in other areas. However, in the late 1970s, the city began to experience a period of growth, as new businesses were established and the population began to increase.
Geography
Lisbon is located in southeastern North Dakota, in Ransom County. The city is situated on the Sheyenne River, and is located about 40 miles west of Fargo. The city has a total area of 1.3 square miles, all of which is land.
The city has a humid continental climate, with cold winters and hot summers. The average annual temperature is 45 degrees Fahrenheit, and the average annual precipitation is 22 inches.
Economy
The economy of Lisbon is largely based on agriculture and manufacturing. The city is home to several manufacturing companies, including a furniture factory, a plastics factory, and a metal fabrication plant. The city is also home to several agricultural businesses, including a grain elevator, a feed mill, and a dairy.
The city is also home to several retail businesses, including several restaurants, a grocery store, and several clothing stores. The city also has several banks, a post office, and a library.
Demographics
According to the 2010 census, the population of Lisbon was 1,521. The racial makeup of the city was 97.3% White, 0.7% African American, 0.3% Native American, 0.2% Asian, 0.1% Pacific Islander, and 1.4% from other races. The median household income was $41,944, and the median family income was $50,000.
The city has a large number of people who are employed in the manufacturing and agricultural industries. The city also has a large number of people who are employed in the retail and service industries. The city also has a large number of people who are employed in the government sector.
Common Questions
What is Per Capita Income in Lisbon?
Per Capita income in Lisbon is $30,473.
What is the Median Family Income in Lisbon?
Median Family Income in Lisbon is $83,810.
What is the Median Household income in Lisbon?
Median Household Income in Lisbon is $61,250.
What is Income or Wage Gap in Lisbon?
Income or Wage Gap in Lisbon is 42.2%.
Women in Lisbon earn 57.8 cents for every dollar earned by a man.
What is Inequality or Gini Index in Lisbon?
Inequality or Gini Index in Lisbon is 0.43.
What is the Total Population of Lisbon?
Total Population of Lisbon is 2,159.
What is the Total Male Population of Lisbon?
Total Male Population of Lisbon is 1,082.
What is the Total Female Population of Lisbon?
Total Female Population of Lisbon is 1,077.
What is the Ratio of Males per 100 Females in Lisbon?
There are 100.46 Males per 100 Females in Lisbon.
What is the Ratio of Females per 100 Males in Lisbon?
There are 99.54 Females per 100 Males in Lisbon.
What is the Median Population Age in Lisbon?
Median Population Age in Lisbon is 42.5 Years.
What is the Average Family Size in Lisbon
Average Family Size in Lisbon is 3.1 People.
What is the Average Household Size in Lisbon
Average Household Size in Lisbon is 2.3 People.
How Large is the Labor Force in Lisbon?
There are 926 People in the Labor Forcein in Lisbon.
What is the Percentage of People in the Labor Force in Lisbon?
54.0% of People are in the Labor Force in Lisbon.
What is the Unemployment Rate in Lisbon?
Unemployment Rate in Lisbon is 4.5%.