Green Tree borough, PA Map & Demographics
Green Tree borough Overview
$48,814
PER CAPITA INCOME
$109,389
AVG FAMILY INCOME
$86,450
AVG HOUSEHOLD INCOME
6.9%
WAGE / INCOME GAP [ % ]
93.1¢/ $1
WAGE / INCOME GAP [ $ ]
0.42
INEQUALITY / GINI INDEX
4,870
TOTAL POPULATION
2,383
MALE POPULATION
2,487
FEMALE POPULATION
95.82
MALES / 100 FEMALES
104.36
FEMALES / 100 MALES
44.7
MEDIAN AGE
2.7
AVG FAMILY SIZE
2.1
AVG HOUSEHOLD SIZE
2,936
LABOR FORCE [ PEOPLE ]
70.9%
PERCENT IN LABOR FORCE
Income in Green Tree borough
Income Overview in Green Tree borough
Per Capita Income in Green Tree borough is $48,814, while median incomes of families and households are $109,389 and $86,450 respectively.
| Characteristic | Number | Measure |
| Per Capita Income | 4,870 | $48,814 |
| Median Family Income | 1,390 | $109,389 |
| Mean Family Income | 1,390 | $128,586 |
| Median Household Income | 2,334 | $86,450 |
| Mean Household Income | 2,334 | $100,869 |
| Income Deficit | 1,390 | $0 |
| Wage / Income Gap (%) | 4,870 | 6.91% |
| Wage / Income Gap ($) | 4,870 | 93.09¢ per $1 |
| Gini / Inequality Index | 4,870 | 0.42 |
Earnings by Sex in Green Tree borough
Average Earnings in Green Tree borough are $58,161, $54,595 for men and $58,649 for women, a difference of 6.9%.
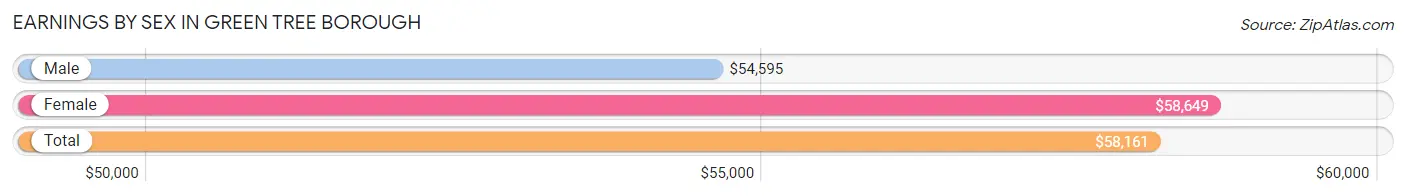
| Sex | Number | Average Earnings |
| Male | 1,534 (50.3%) | $54,595 |
| Female | 1,514 (49.7%) | $58,649 |
| Total | 3,048 (100.0%) | $58,161 |
Earnings by Sex by Income Bracket in Green Tree borough
The most common earnings brackets in Green Tree borough are $100,000+ for men (370 | 24.1%) and $55,000 to $64,999 for women (233 | 15.4%).
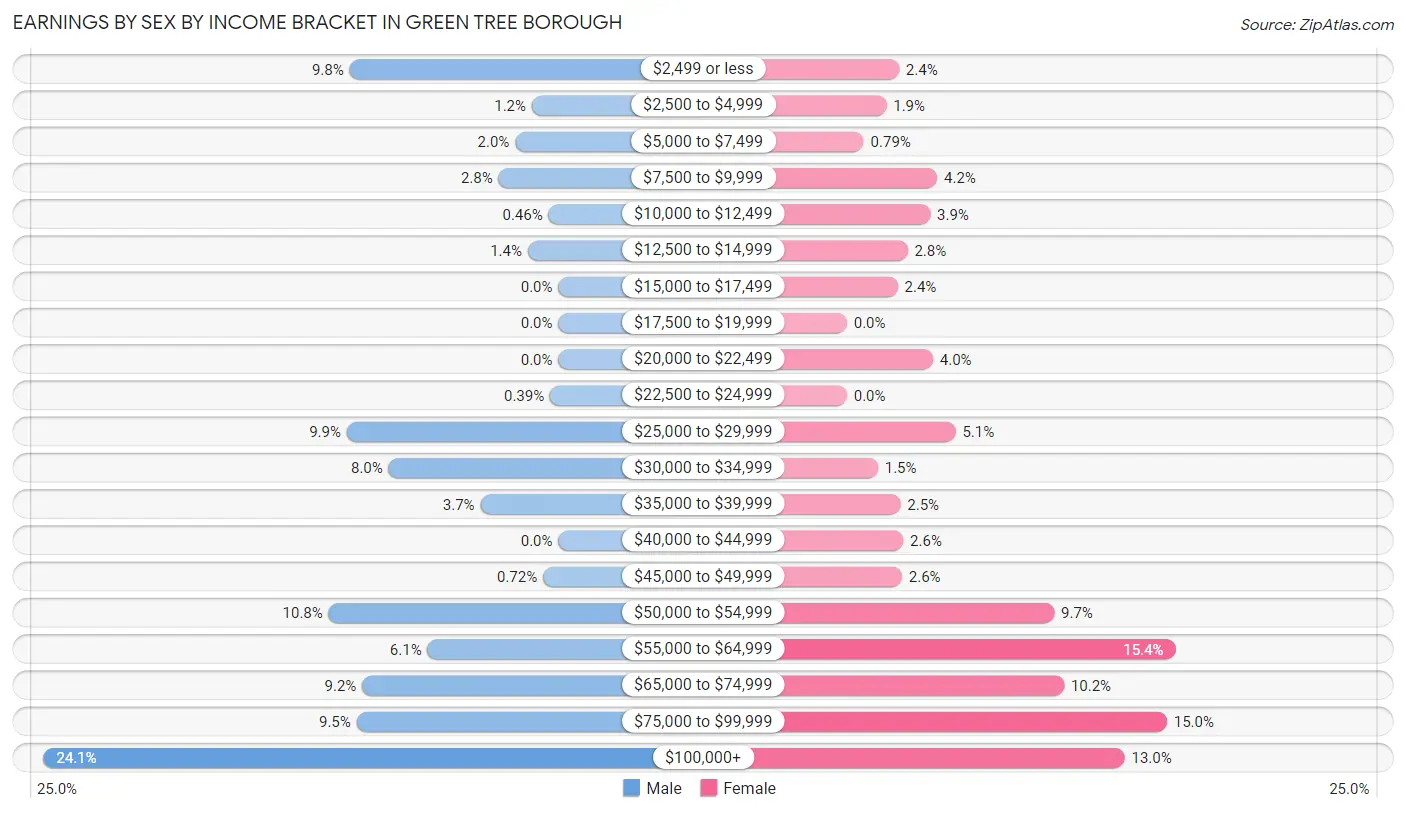
| Income | Male | Female |
| $2,499 or less | 150 (9.8%) | 37 (2.4%) |
| $2,500 to $4,999 | 19 (1.2%) | 28 (1.8%) |
| $5,000 to $7,499 | 31 (2.0%) | 12 (0.8%) |
| $7,500 to $9,999 | 43 (2.8%) | 64 (4.2%) |
| $10,000 to $12,499 | 7 (0.5%) | 59 (3.9%) |
| $12,500 to $14,999 | 22 (1.4%) | 43 (2.8%) |
| $15,000 to $17,499 | 0 (0.0%) | 36 (2.4%) |
| $17,500 to $19,999 | 0 (0.0%) | 0 (0.0%) |
| $20,000 to $22,499 | 0 (0.0%) | 61 (4.0%) |
| $22,500 to $24,999 | 6 (0.4%) | 0 (0.0%) |
| $25,000 to $29,999 | 152 (9.9%) | 77 (5.1%) |
| $30,000 to $34,999 | 122 (8.0%) | 22 (1.5%) |
| $35,000 to $39,999 | 56 (3.6%) | 38 (2.5%) |
| $40,000 to $44,999 | 0 (0.0%) | 40 (2.6%) |
| $45,000 to $49,999 | 11 (0.7%) | 39 (2.6%) |
| $50,000 to $54,999 | 165 (10.8%) | 147 (9.7%) |
| $55,000 to $64,999 | 94 (6.1%) | 233 (15.4%) |
| $65,000 to $74,999 | 141 (9.2%) | 154 (10.2%) |
| $75,000 to $99,999 | 145 (9.5%) | 227 (15.0%) |
| $100,000+ | 370 (24.1%) | 197 (13.0%) |
| Total | 1,534 (100.0%) | 1,514 (100.0%) |
Earnings by Sex by Educational Attainment in Green Tree borough
Average earnings in Green Tree borough are $64,181 for men and $58,793 for women, a difference of 8.4%. Men with an educational attainment of graduate degree enjoy the highest average annual earnings of $97,500, while those with college or associate's degree education earn the least with $32,303. Women with an educational attainment of graduate degree earn the most with the average annual earnings of $63,417, while those with college or associate's degree education have the smallest earnings of $50,224.
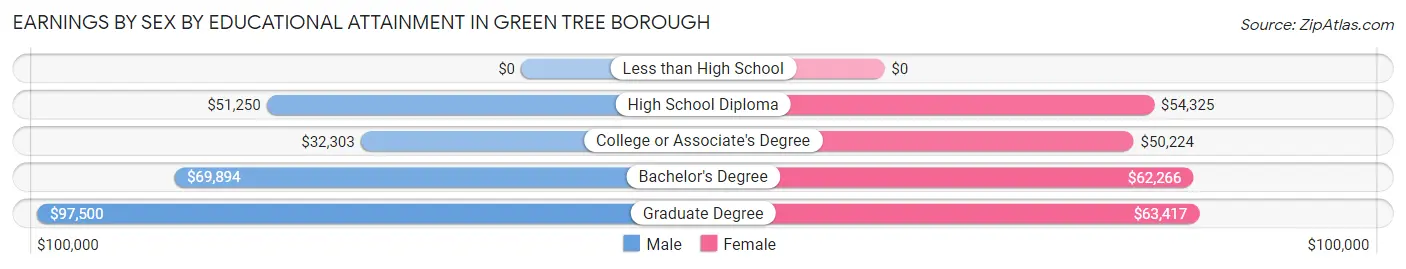
| Educational Attainment | Male Income | Female Income |
| Less than High School | - | - |
| High School Diploma | $51,250 | $54,325 |
| College or Associate's Degree | $32,303 | $50,224 |
| Bachelor's Degree | $69,894 | $62,266 |
| Graduate Degree | $97,500 | $63,417 |
| Total | $64,181 | $58,793 |
Family Income in Green Tree borough
Family Income Brackets in Green Tree borough
According to the Green Tree borough family income data, there are 423 families falling into the $100,000 to $149,999 income range, which is the most common income bracket and makes up 30.4% of all families.
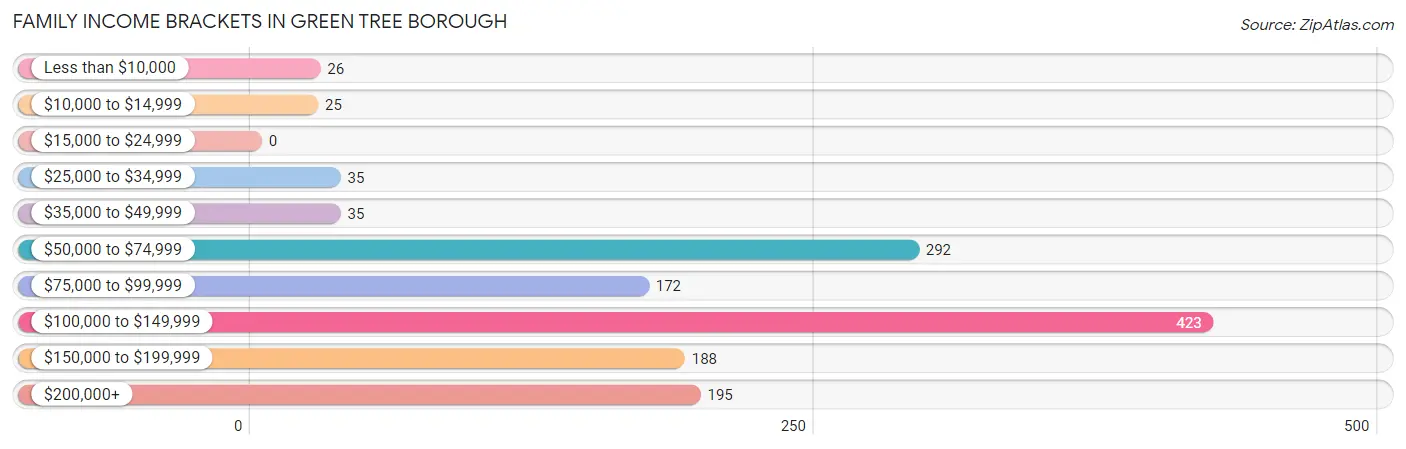
| Income Bracket | # Families | % Families |
| Less than $10,000 | 26 | 1.9% |
| $10,000 to $14,999 | 25 | 1.8% |
| $15,000 to $24,999 | 0 | 0.0% |
| $25,000 to $34,999 | 35 | 2.5% |
| $35,000 to $49,999 | 35 | 2.5% |
| $50,000 to $74,999 | 292 | 21.0% |
| $75,000 to $99,999 | 172 | 12.4% |
| $100,000 to $149,999 | 423 | 30.4% |
| $150,000 to $199,999 | 188 | 13.5% |
| $200,000+ | 195 | 14.0% |
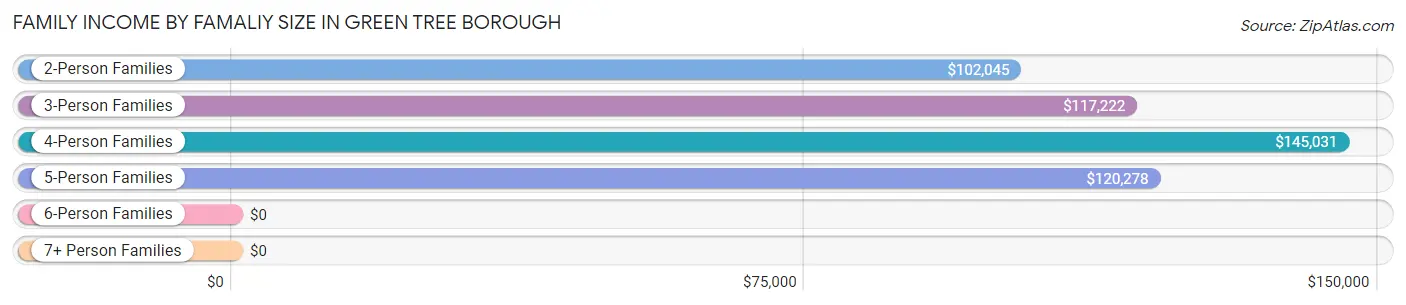
Family Income by Famaliy Size in Green Tree borough
4-person families (141 | 10.1%) account for the highest median family income in Green Tree borough with $145,031 per family, while 2-person families (864 | 62.2%) have the highest median income of $51,022 per family member.
| Income Bracket | # Families | Median Income |
| 2-Person Families | 864 (62.2%) | $102,045 |
| 3-Person Families | 302 (21.7%) | $117,222 |
| 4-Person Families | 141 (10.1%) | $145,031 |
| 5-Person Families | 62 (4.5%) | $120,278 |
| 6-Person Families | 21 (1.5%) | $0 |
| 7+ Person Families | 0 (0.0%) | $0 |
| Total | 1,390 (100.0%) | $109,389 |
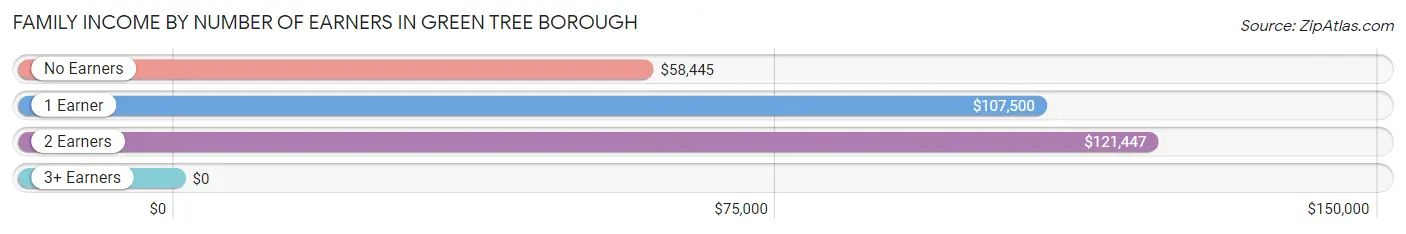
Family Income by Number of Earners in Green Tree borough
| Number of Earners | # Families | Median Income |
| No Earners | 163 (11.7%) | $58,445 |
| 1 Earner | 324 (23.3%) | $107,500 |
| 2 Earners | 832 (59.9%) | $121,447 |
| 3+ Earners | 71 (5.1%) | $0 |
| Total | 1,390 (100.0%) | $109,389 |
Household Income in Green Tree borough
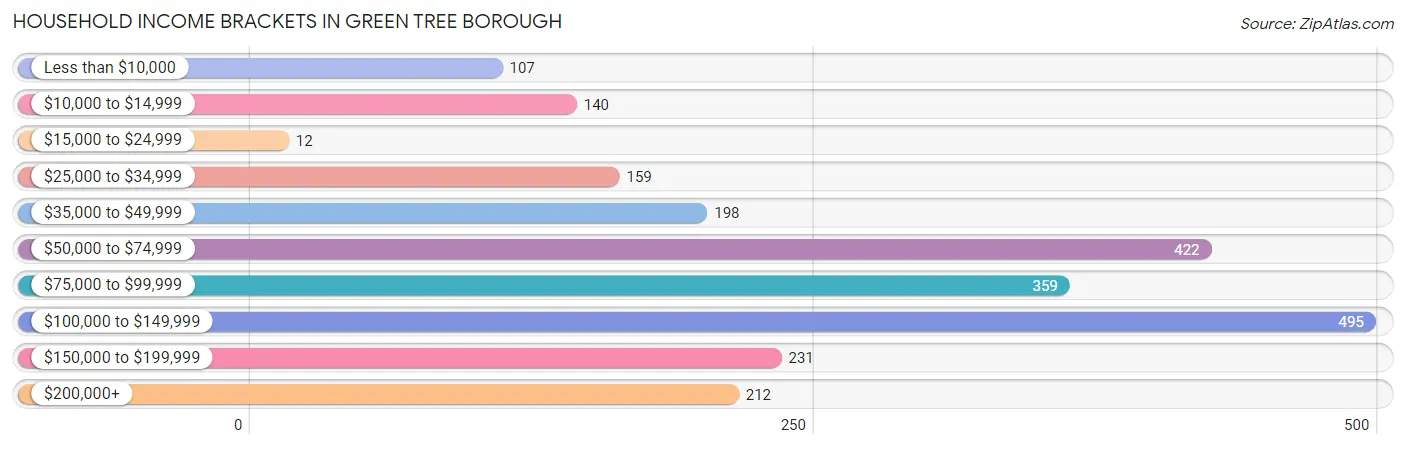
Household Income Brackets in Green Tree borough
With 495 households falling in the category, the $100,000 to $149,999 income range is the most frequent in Green Tree borough, accounting for 21.2% of all households. In contrast, only 12 households (0.5%) fall into the $15,000 to $24,999 income bracket, making it the least populous group.
| Income Bracket | # Households | % Households |
| Less than $10,000 | 107 | 4.6% |
| $10,000 to $14,999 | 140 | 6.0% |
| $15,000 to $24,999 | 12 | 0.5% |
| $25,000 to $34,999 | 159 | 6.8% |
| $35,000 to $49,999 | 198 | 8.5% |
| $50,000 to $74,999 | 422 | 18.1% |
| $75,000 to $99,999 | 359 | 15.4% |
| $100,000 to $149,999 | 495 | 21.2% |
| $150,000 to $199,999 | 231 | 9.9% |
| $200,000+ | 212 | 9.1% |
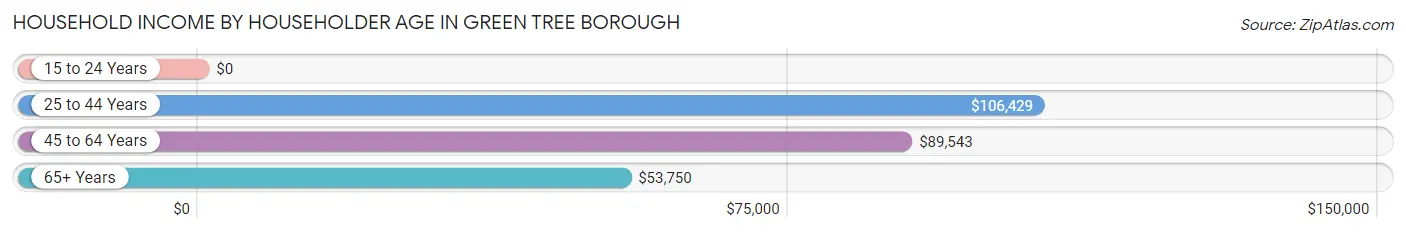
Household Income by Householder Age in Green Tree borough
The median household income in Green Tree borough is $86,450, with the highest median household income of $106,429 found in the 25 to 44 years age bracket for the primary householder. A total of 858 households (36.8%) fall into this category. Meanwhile, the 15 to 24 years age bracket for the primary householder has the lowest median household income of $0, with 15 households (0.6%) in this group.
| Income Bracket | # Households | Median Income |
| 15 to 24 Years | 15 (0.6%) | $0 |
| 25 to 44 Years | 858 (36.8%) | $106,429 |
| 45 to 64 Years | 713 (30.5%) | $89,543 |
| 65+ Years | 748 (32.1%) | $53,750 |
| Total | 2,334 (100.0%) | $86,450 |
Poverty in Green Tree borough
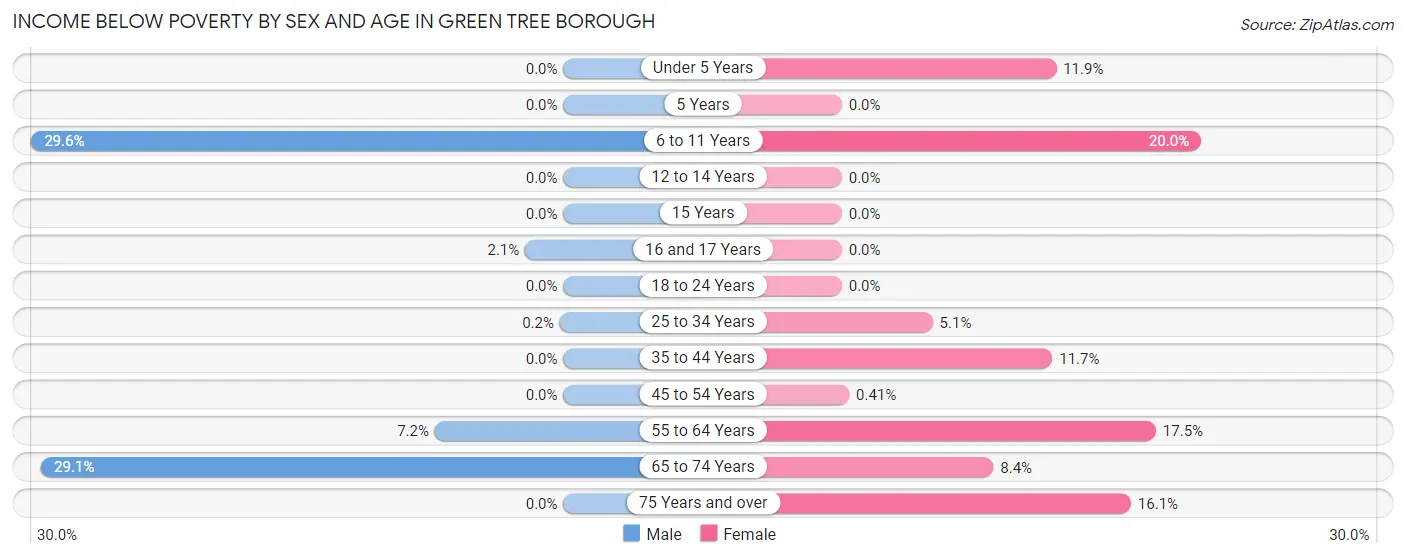
Income Below Poverty by Sex and Age in Green Tree borough
With 6.0% poverty level for males and 10.3% for females among the residents of Green Tree borough, 6 to 11 year old males and 6 to 11 year old females are the most vulnerable to poverty, with 32 males (29.6%) and 17 females (20.0%) in their respective age groups living below the poverty level.
| Age Bracket | Male | Female |
| Under 5 Years | 0 (0.0%) | 16 (11.9%) |
| 5 Years | 0 (0.0%) | 0 (0.0%) |
| 6 to 11 Years | 32 (29.6%) | 17 (20.0%) |
| 12 to 14 Years | 0 (0.0%) | 0 (0.0%) |
| 15 Years | 0 (0.0%) | 0 (0.0%) |
| 16 and 17 Years | 1 (2.1%) | 0 (0.0%) |
| 18 to 24 Years | 0 (0.0%) | 0 (0.0%) |
| 25 to 34 Years | 1 (0.2%) | 17 (5.1%) |
| 35 to 44 Years | 0 (0.0%) | 45 (11.7%) |
| 45 to 54 Years | 0 (0.0%) | 1 (0.4%) |
| 55 to 64 Years | 27 (7.2%) | 74 (17.5%) |
| 65 to 74 Years | 82 (29.1%) | 39 (8.4%) |
| 75 Years and over | 0 (0.0%) | 47 (16.1%) |
| Total | 143 (6.0%) | 256 (10.3%) |
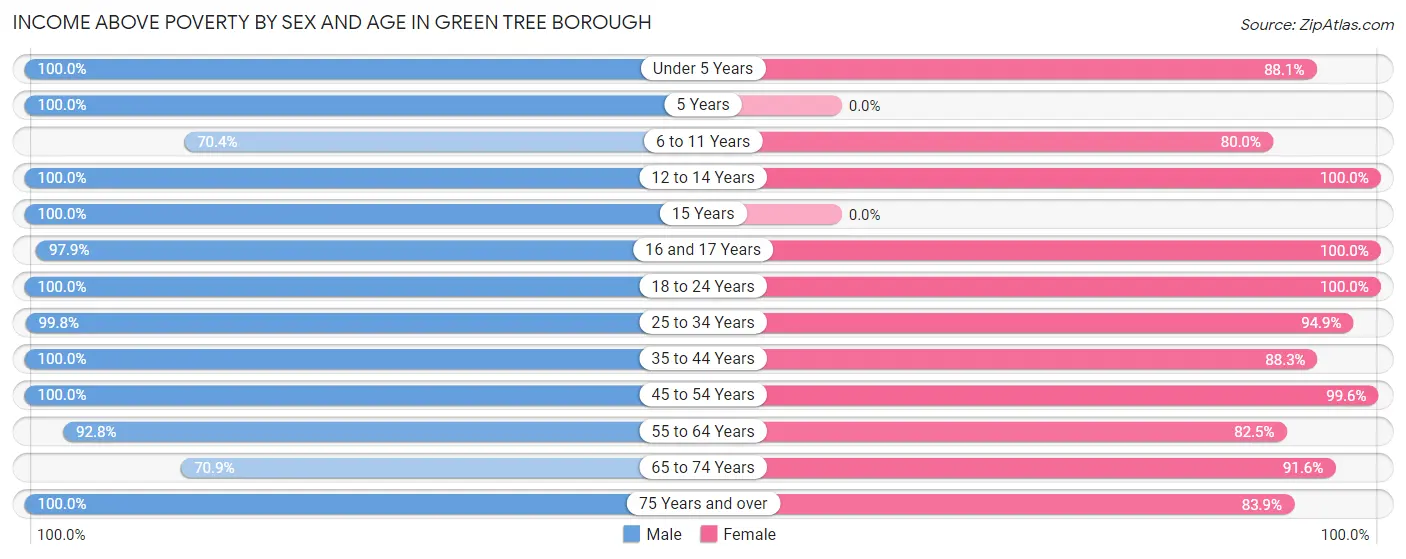
Income Above Poverty by Sex and Age in Green Tree borough
According to the poverty statistics in Green Tree borough, males aged under 5 years and females aged 12 to 14 years are the age groups that are most secure financially, with 100.0% of males and 100.0% of females in these age groups living above the poverty line.
| Age Bracket | Male | Female |
| Under 5 Years | 183 (100.0%) | 118 (88.1%) |
| 5 Years | 30 (100.0%) | 0 (0.0%) |
| 6 to 11 Years | 76 (70.4%) | 68 (80.0%) |
| 12 to 14 Years | 93 (100.0%) | 73 (100.0%) |
| 15 Years | 23 (100.0%) | 0 (0.0%) |
| 16 and 17 Years | 46 (97.9%) | 12 (100.0%) |
| 18 to 24 Years | 140 (100.0%) | 40 (100.0%) |
| 25 to 34 Years | 501 (99.8%) | 319 (94.9%) |
| 35 to 44 Years | 278 (100.0%) | 339 (88.3%) |
| 45 to 54 Years | 191 (100.0%) | 245 (99.6%) |
| 55 to 64 Years | 350 (92.8%) | 349 (82.5%) |
| 65 to 74 Years | 200 (70.9%) | 423 (91.6%) |
| 75 Years and over | 129 (100.0%) | 245 (83.9%) |
| Total | 2,240 (94.0%) | 2,231 (89.7%) |
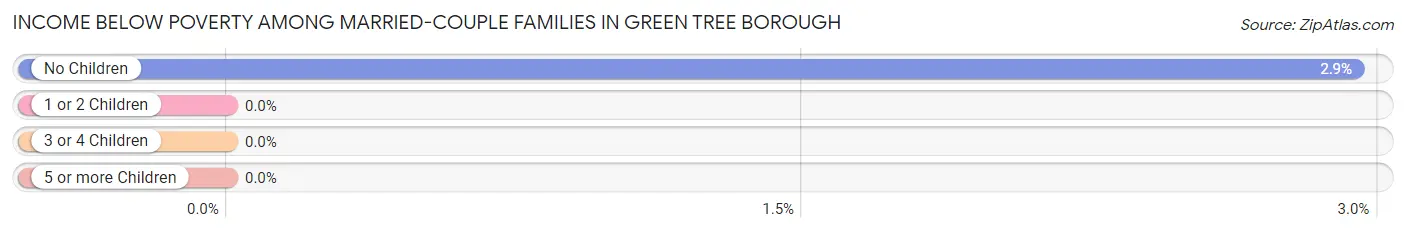
Income Below Poverty Among Married-Couple Families in Green Tree borough
The poverty statistics for married-couple families in Green Tree borough show that 2.1% or 23 of the total 1,114 families live below the poverty line. Families with no children have the highest poverty rate of 2.9%, comprising of 23 families. On the other hand, families with 1 or 2 children have the lowest poverty rate of 0.0%, which includes 0 families.
| Children | Above Poverty | Below Poverty |
| No Children | 760 (97.1%) | 23 (2.9%) |
| 1 or 2 Children | 272 (100.0%) | 0 (0.0%) |
| 3 or 4 Children | 59 (100.0%) | 0 (0.0%) |
| 5 or more Children | 0 (0.0%) | 0 (0.0%) |
| Total | 1,091 (97.9%) | 23 (2.1%) |
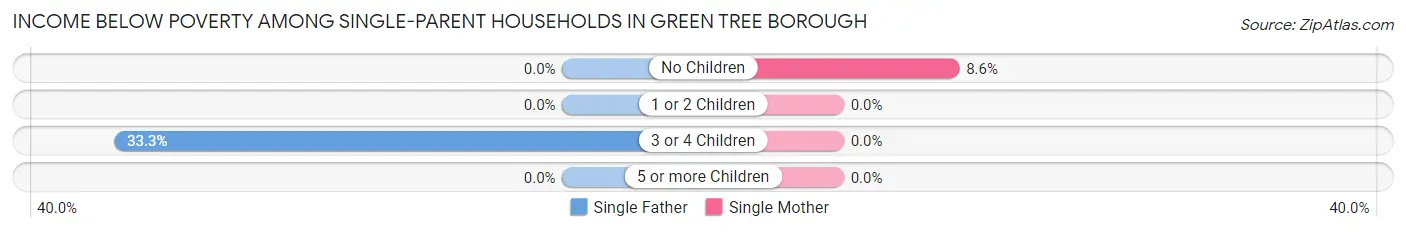
Income Below Poverty Among Single-Parent Households in Green Tree borough
According to the poverty data in Green Tree borough, 15.0% or 15 single-father households and 7.4% or 13 single-mother households are living below the poverty line. Among single-father households, those with 3 or 4 children have the highest poverty rate, with 15 households (33.3%) experiencing poverty. Likewise, among single-mother households, those with no children have the highest poverty rate, with 13 households (8.6%) falling below the poverty line.
| Children | Single Father | Single Mother |
| No Children | 0 (0.0%) | 13 (8.6%) |
| 1 or 2 Children | 0 (0.0%) | 0 (0.0%) |
| 3 or 4 Children | 15 (33.3%) | 0 (0.0%) |
| 5 or more Children | 0 (0.0%) | 0 (0.0%) |
| Total | 15 (15.0%) | 13 (7.4%) |
Income Below Poverty Among Married-Couple vs Single-Parent Households in Green Tree borough
The poverty data for Green Tree borough shows that 23 of the married-couple family households (2.1%) and 28 of the single-parent households (10.1%) are living below the poverty level. Within the married-couple family households, those with no children have the highest poverty rate, with 23 households (2.9%) falling below the poverty line. Among the single-parent households, those with 3 or 4 children have the highest poverty rate, with 15 household (33.3%) living below poverty.
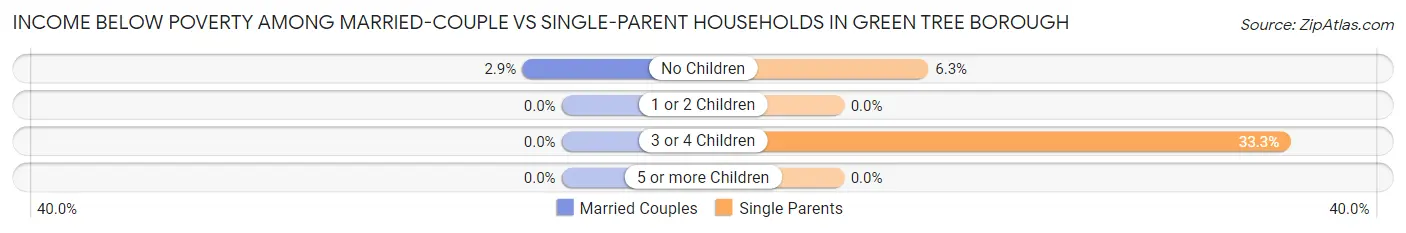
| Children | Married-Couple Families | Single-Parent Households |
| No Children | 23 (2.9%) | 13 (6.3%) |
| 1 or 2 Children | 0 (0.0%) | 0 (0.0%) |
| 3 or 4 Children | 0 (0.0%) | 15 (33.3%) |
| 5 or more Children | 0 (0.0%) | 0 (0.0%) |
| Total | 23 (2.1%) | 28 (10.1%) |
Race in Green Tree borough
The most populous races in Green Tree borough are White / Caucasian (4,408 | 90.5%), Asian (302 | 6.2%), and Two or more Races (150 | 3.1%).

| Race | # Population | % Population |
| Asian | 302 | 6.2% |
| Black / African American | 1 | 0.0% |
| Hawaiian / Pacific | 0 | 0.0% |
| Hispanic or Latino | 26 | 0.5% |
| Native / Alaskan | 0 | 0.0% |
| White / Caucasian | 4,408 | 90.5% |
| Two or more Races | 150 | 3.1% |
| Some other Race | 9 | 0.2% |
| Total | 4,870 | 100.0% |
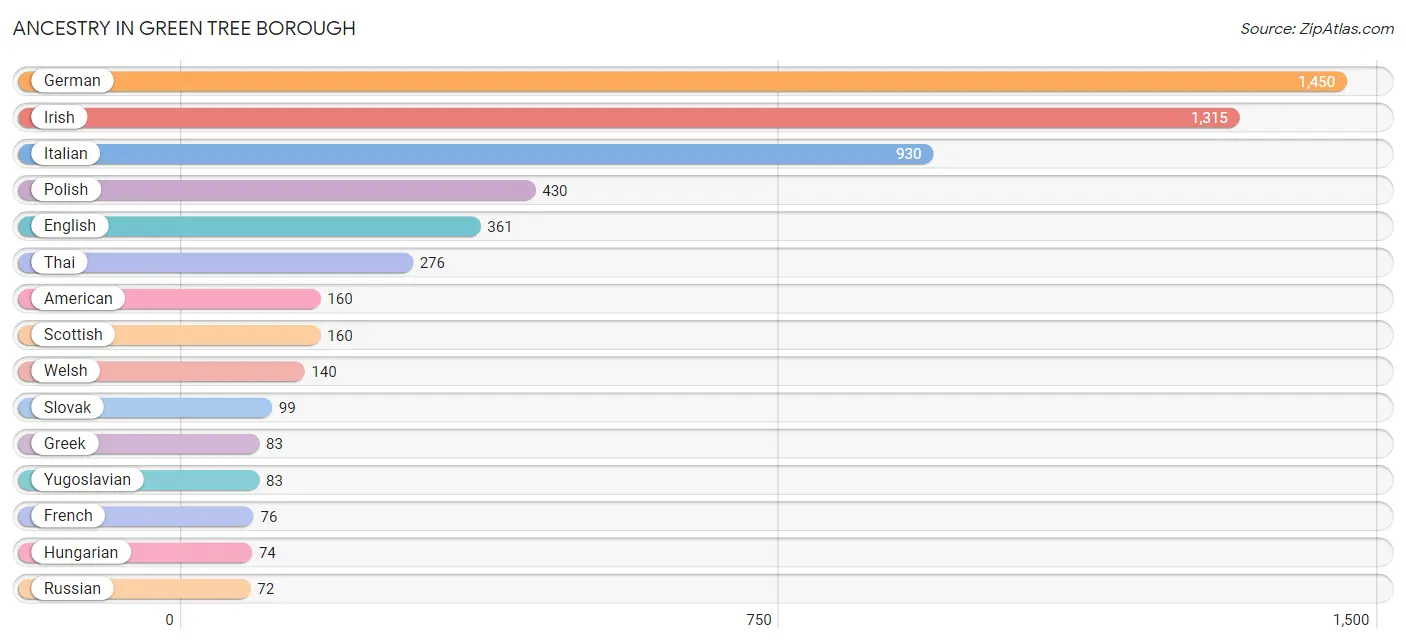
Ancestry in Green Tree borough
The most populous ancestries reported in Green Tree borough are German (1,450 | 29.8%), Irish (1,315 | 27.0%), Italian (930 | 19.1%), Polish (430 | 8.8%), and English (361 | 7.4%), together accounting for 92.1% of all Green Tree borough residents.
| Ancestry | # Population | % Population |
| American | 160 | 3.3% |
| Austrian | 30 | 0.6% |
| Belgian | 6 | 0.1% |
| British | 18 | 0.4% |
| Burmese | 33 | 0.7% |
| Canadian | 47 | 1.0% |
| Croatian | 35 | 0.7% |
| Danish | 30 | 0.6% |
| Dutch | 56 | 1.1% |
| Eastern European | 61 | 1.3% |
| English | 361 | 7.4% |
| European | 42 | 0.9% |
| French | 76 | 1.6% |
| German | 1,450 | 29.8% |
| Greek | 83 | 1.7% |
| Hungarian | 74 | 1.5% |
| Irish | 1,315 | 27.0% |
| Italian | 930 | 19.1% |
| Korean | 19 | 0.4% |
| Lithuanian | 13 | 0.3% |
| Mexican | 26 | 0.5% |
| Norwegian | 36 | 0.7% |
| Pakistani | 7 | 0.1% |
| Pennsylvania German | 13 | 0.3% |
| Polish | 430 | 8.8% |
| Romanian | 16 | 0.3% |
| Russian | 72 | 1.5% |
| Scotch-Irish | 21 | 0.4% |
| Scottish | 160 | 3.3% |
| Serbian | 27 | 0.5% |
| Slovak | 99 | 2.0% |
| Swedish | 24 | 0.5% |
| Swiss | 57 | 1.2% |
| Thai | 276 | 5.7% |
| Ukrainian | 17 | 0.4% |
| Welsh | 140 | 2.9% |
| Yugoslavian | 83 | 1.7% | View All 37 Rows |
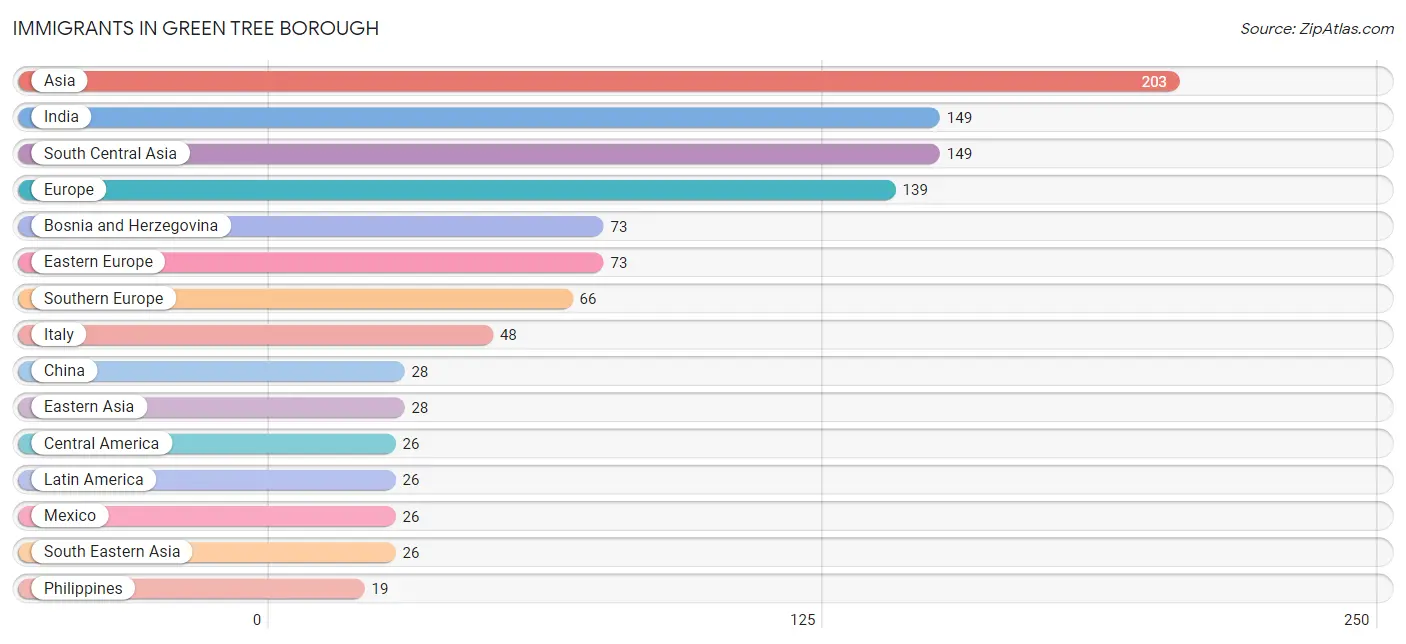
Immigrants in Green Tree borough
The most numerous immigrant groups reported in Green Tree borough came from Asia (203 | 4.2%), India (149 | 3.1%), South Central Asia (149 | 3.1%), Europe (139 | 2.9%), and Bosnia and Herzegovina (73 | 1.5%), together accounting for 14.6% of all Green Tree borough residents.
| Immigration Origin | # Population | % Population |
| Asia | 203 | 4.2% |
| Bosnia and Herzegovina | 73 | 1.5% |
| Central America | 26 | 0.5% |
| China | 28 | 0.6% |
| Eastern Asia | 28 | 0.6% |
| Eastern Europe | 73 | 1.5% |
| Europe | 139 | 2.9% |
| Greece | 18 | 0.4% |
| India | 149 | 3.1% |
| Italy | 48 | 1.0% |
| Latin America | 26 | 0.5% |
| Mexico | 26 | 0.5% |
| Philippines | 19 | 0.4% |
| South Central Asia | 149 | 3.1% |
| South Eastern Asia | 26 | 0.5% |
| Southern Europe | 66 | 1.4% |
| Thailand | 7 | 0.1% | View All 17 Rows |
Sex and Age in Green Tree borough
Sex and Age in Green Tree borough
The most populous age groups in Green Tree borough are 25 to 29 Years (321 | 13.5%) for men and 65 to 69 Years (343 | 13.8%) for women.
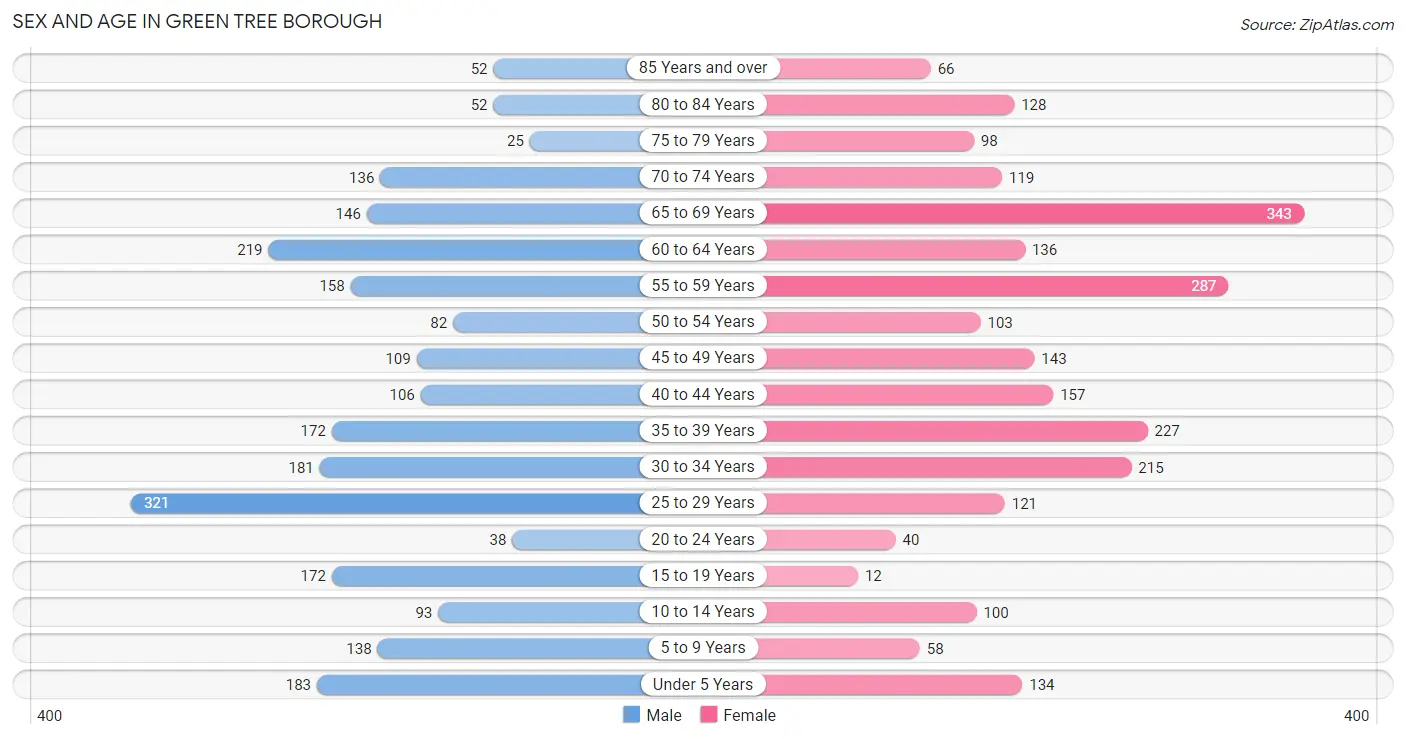
| Age Bracket | Male | Female |
| Under 5 Years | 183 (7.7%) | 134 (5.4%) |
| 5 to 9 Years | 138 (5.8%) | 58 (2.3%) |
| 10 to 14 Years | 93 (3.9%) | 100 (4.0%) |
| 15 to 19 Years | 172 (7.2%) | 12 (0.5%) |
| 20 to 24 Years | 38 (1.6%) | 40 (1.6%) |
| 25 to 29 Years | 321 (13.5%) | 121 (4.9%) |
| 30 to 34 Years | 181 (7.6%) | 215 (8.6%) |
| 35 to 39 Years | 172 (7.2%) | 227 (9.1%) |
| 40 to 44 Years | 106 (4.4%) | 157 (6.3%) |
| 45 to 49 Years | 109 (4.6%) | 143 (5.8%) |
| 50 to 54 Years | 82 (3.4%) | 103 (4.1%) |
| 55 to 59 Years | 158 (6.6%) | 287 (11.5%) |
| 60 to 64 Years | 219 (9.2%) | 136 (5.5%) |
| 65 to 69 Years | 146 (6.1%) | 343 (13.8%) |
| 70 to 74 Years | 136 (5.7%) | 119 (4.8%) |
| 75 to 79 Years | 25 (1.1%) | 98 (3.9%) |
| 80 to 84 Years | 52 (2.2%) | 128 (5.1%) |
| 85 Years and over | 52 (2.2%) | 66 (2.6%) |
| Total | 2,383 (100.0%) | 2,487 (100.0%) |
Families and Households in Green Tree borough
Median Family Size in Green Tree borough
The median family size in Green Tree borough is 2.66 persons per family, with single male/father families (100 | 7.2%) accounting for the largest median family size of 3.42 persons per family. On the other hand, single female/mother families (176 | 12.7%) represent the smallest median family size with 2.16 persons per family.
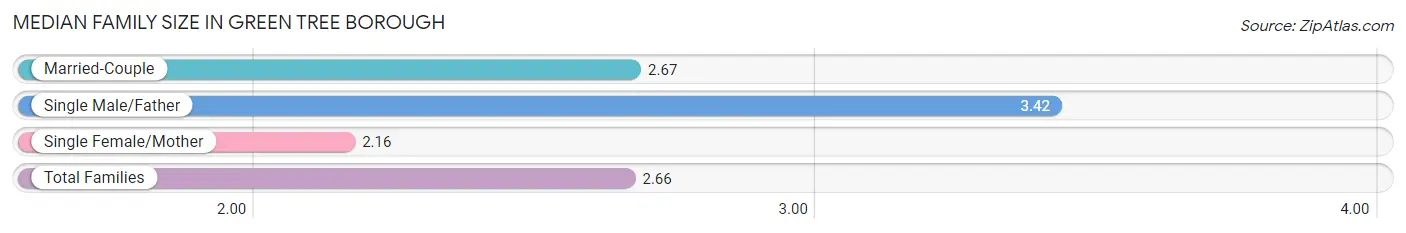
| Family Type | # Families | Family Size |
| Married-Couple | 1,114 (80.1%) | 2.67 |
| Single Male/Father | 100 (7.2%) | 3.42 |
| Single Female/Mother | 176 (12.7%) | 2.16 |
| Total Families | 1,390 (100.0%) | 2.66 |
Median Household Size in Green Tree borough
The median household size in Green Tree borough is 2.08 persons per household, with single male/father households (100 | 4.3%) accounting for the largest median household size of 3.87 persons per household. non-family households (944 | 40.5%) represent the smallest median household size with 1.19 persons per household.
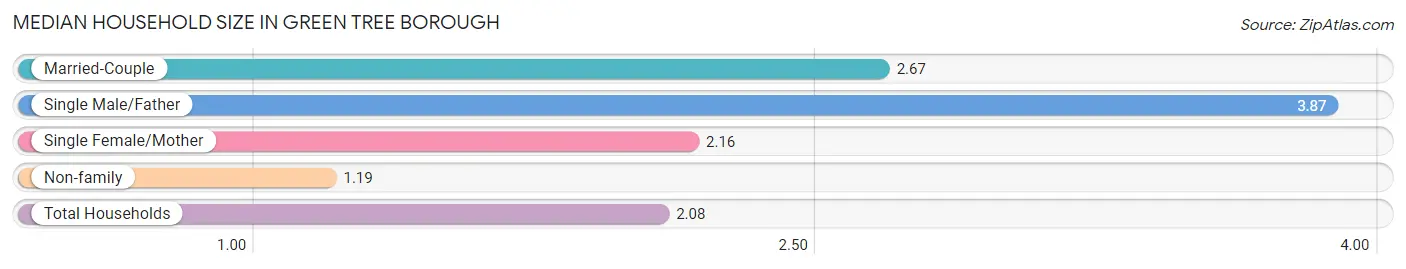
| Household Type | # Households | Household Size |
| Married-Couple | 1,114 (47.7%) | 2.67 |
| Single Male/Father | 100 (4.3%) | 3.87 |
| Single Female/Mother | 176 (7.5%) | 2.16 |
| Non-family | 944 (40.5%) | 1.19 |
| Total Households | 2,334 (100.0%) | 2.08 |
Household Size by Marriage Status in Green Tree borough
Out of a total of 2,334 households in Green Tree borough, 1,390 (59.6%) are family households, while 944 (40.5%) are nonfamily households. The most numerous type of family households are 2-person households, comprising 864, and the most common type of nonfamily households are 1-person households, comprising 781.
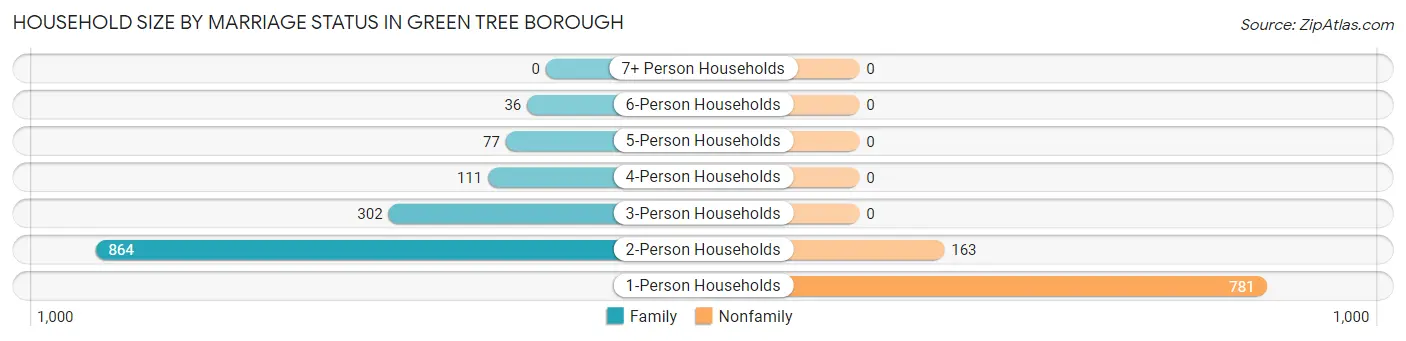
| Household Size | Family Households | Nonfamily Households |
| 1-Person Households | - | 781 (33.5%) |
| 2-Person Households | 864 (37.0%) | 163 (7.0%) |
| 3-Person Households | 302 (12.9%) | 0 (0.0%) |
| 4-Person Households | 111 (4.8%) | 0 (0.0%) |
| 5-Person Households | 77 (3.3%) | 0 (0.0%) |
| 6-Person Households | 36 (1.5%) | 0 (0.0%) |
| 7+ Person Households | 0 (0.0%) | 0 (0.0%) |
| Total | 1,390 (59.6%) | 944 (40.5%) |
Female Fertility in Green Tree borough
Fertility by Age in Green Tree borough
Average fertility rate in Green Tree borough is 58.0 births per 1,000 women. Women in the age bracket of 35 to 50 years have the highest fertility rate with 97.0 births per 1,000 women. Women in the age bracket of 35 to 50 years acount for 100.0% of all women with births.
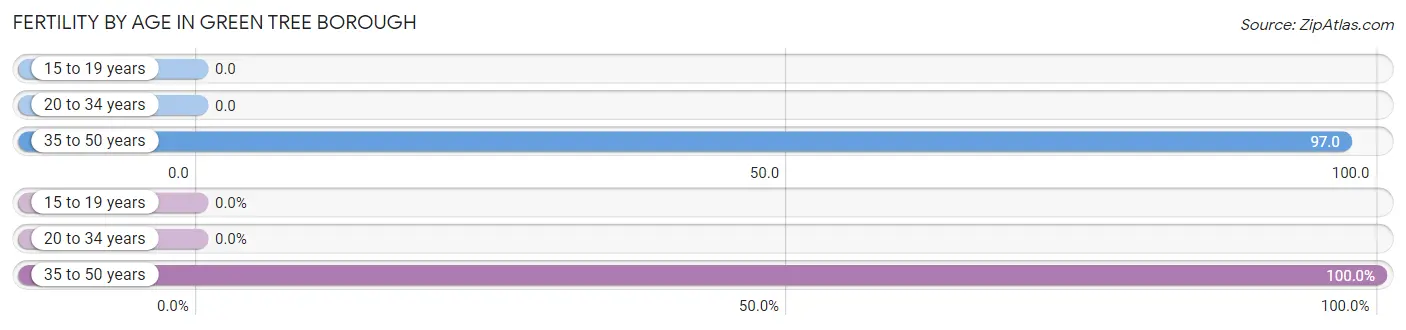
| Age Bracket | Women with Births | Births / 1,000 Women |
| 15 to 19 years | 0 (0.0%) | 0.0 |
| 20 to 34 years | 0 (0.0%) | 0.0 |
| 35 to 50 years | 56 (100.0%) | 97.0 |
| Total | 56 (100.0%) | 58.0 |
Fertility by Age by Marriage Status in Green Tree borough
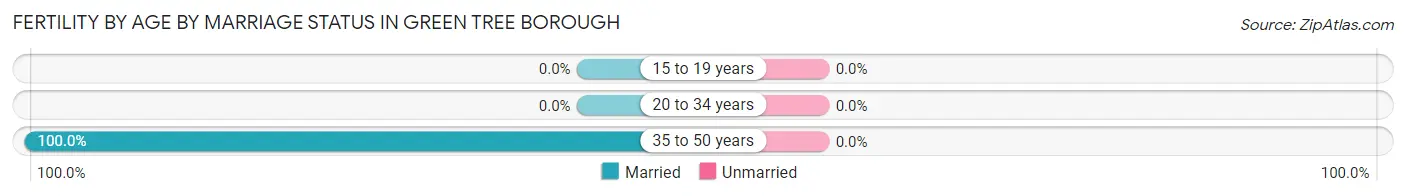
| Age Bracket | Married | Unmarried |
| 15 to 19 years | 0 (0.0%) | 0 (0.0%) |
| 20 to 34 years | 0 (0.0%) | 0 (0.0%) |
| 35 to 50 years | 56 (100.0%) | 0 (0.0%) |
| Total | 56 (100.0%) | 0 (0.0%) |
Fertility by Education in Green Tree borough
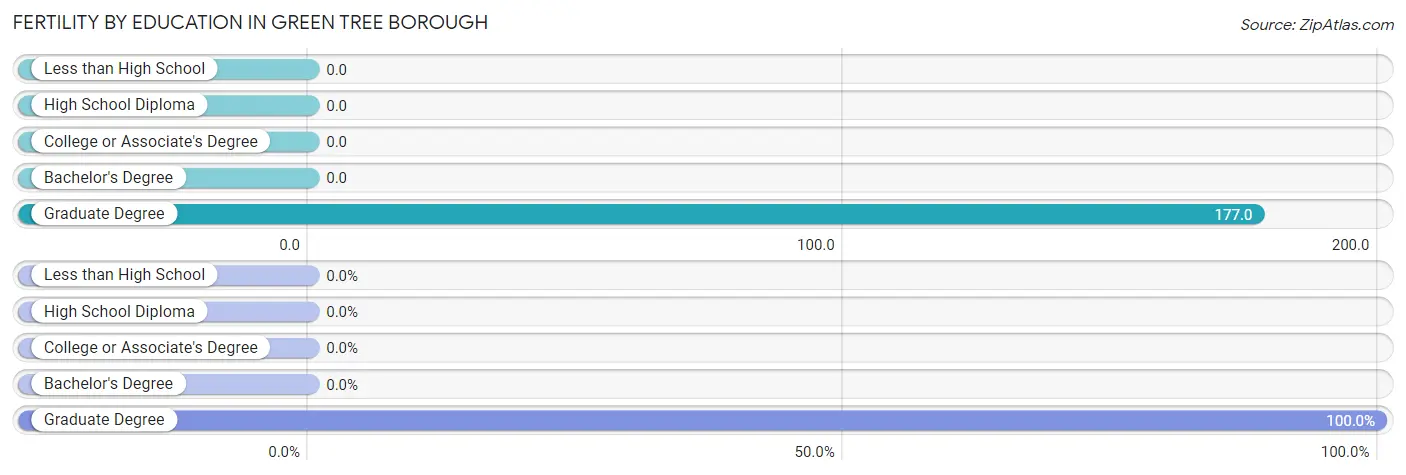
| Educational Attainment | Women with Births | Births / 1,000 Women |
| Less than High School | 0 (0.0%) | 0.0 |
| High School Diploma | 0 (0.0%) | 0.0 |
| College or Associate's Degree | 0 (0.0%) | 0.0 |
| Bachelor's Degree | 0 (0.0%) | 0.0 |
| Graduate Degree | 56 (100.0%) | 177.0 |
| Total | 56 (100.0%) | 58.0 |
Fertility by Education by Marriage Status in Green Tree borough
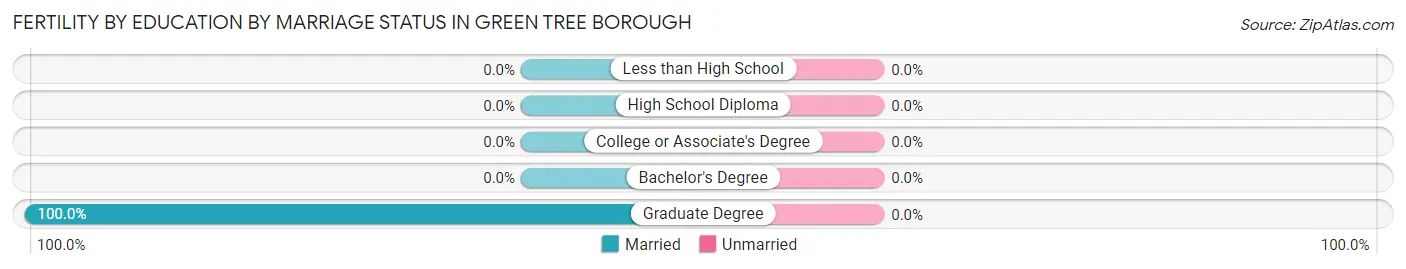
| Educational Attainment | Married | Unmarried |
| Less than High School | 0 (0.0%) | 0 (0.0%) |
| High School Diploma | 0 (0.0%) | 0 (0.0%) |
| College or Associate's Degree | 0 (0.0%) | 0 (0.0%) |
| Bachelor's Degree | 0 (0.0%) | 0 (0.0%) |
| Graduate Degree | 56 (100.0%) | 0 (0.0%) |
| Total | 56 (100.0%) | 0 (0.0%) |
Employment Characteristics in Green Tree borough
Employment by Class of Employer in Green Tree borough
Among the 2,912 employed individuals in Green Tree borough, private company employees (2,117 | 72.7%), not-for-profit organizations (346 | 11.9%), and self-employed (not incorporated) (184 | 6.3%) make up the most common classes of employment.
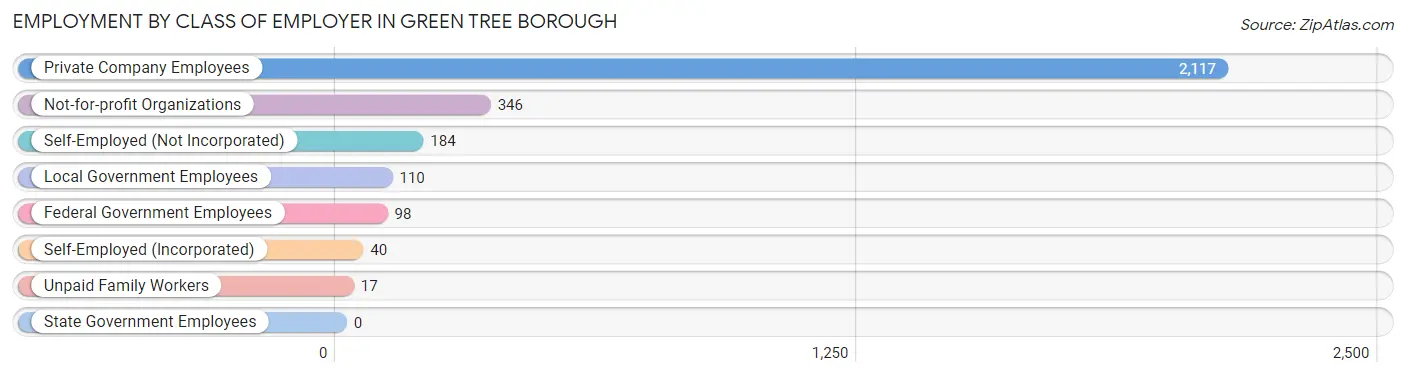
| Employer Class | # Employees | % Employees |
| Private Company Employees | 2,117 | 72.7% |
| Self-Employed (Incorporated) | 40 | 1.4% |
| Self-Employed (Not Incorporated) | 184 | 6.3% |
| Not-for-profit Organizations | 346 | 11.9% |
| Local Government Employees | 110 | 3.8% |
| State Government Employees | 0 | 0.0% |
| Federal Government Employees | 98 | 3.4% |
| Unpaid Family Workers | 17 | 0.6% |
| Total | 2,912 | 100.0% |
Employment Status by Age in Green Tree borough
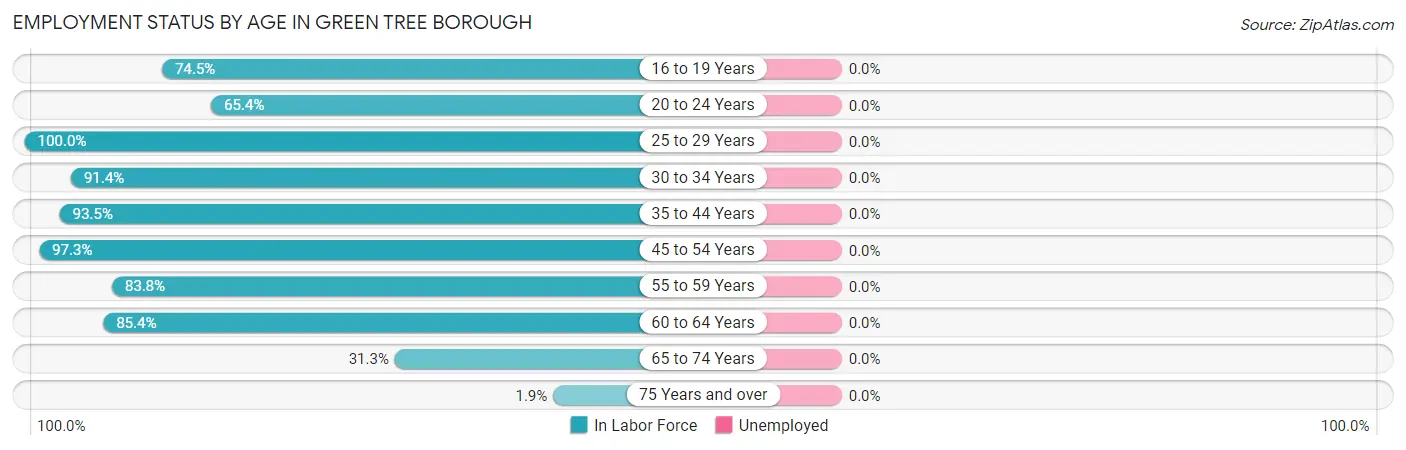
| Age Bracket | In Labor Force | Unemployed |
| 16 to 19 Years | 120 (74.5%) | 0 (0.0%) |
| 20 to 24 Years | 51 (65.4%) | 0 (0.0%) |
| 25 to 29 Years | 442 (100.0%) | 0 (0.0%) |
| 30 to 34 Years | 362 (91.4%) | 0 (0.0%) |
| 35 to 44 Years | 619 (93.5%) | 0 (0.0%) |
| 45 to 54 Years | 425 (97.3%) | 0 (0.0%) |
| 55 to 59 Years | 373 (83.8%) | 0 (0.0%) |
| 60 to 64 Years | 303 (85.4%) | 0 (0.0%) |
| 65 to 74 Years | 233 (31.3%) | 0 (0.0%) |
| 75 Years and over | 8 (1.9%) | 0 (0.0%) |
| Total | 2,936 (70.9%) | 0 (0.0%) |
Employment Status by Educational Attainment in Green Tree borough
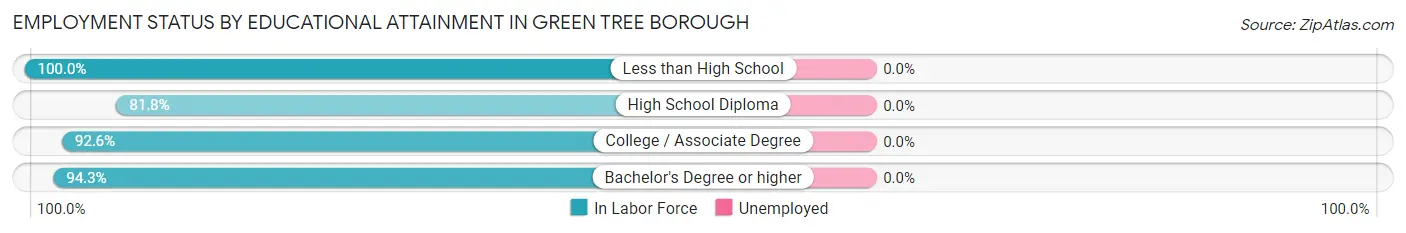
| Educational Attainment | In Labor Force | Unemployed |
| Less than High School | 49 (100.0%) | 0 (0.0%) |
| High School Diploma | 297 (81.8%) | 0 (0.0%) |
| College / Associate Degree | 774 (92.6%) | 0 (0.0%) |
| Bachelor's Degree or higher | 1,404 (94.3%) | 0 (0.0%) |
| Total | 2,524 (92.2%) | 0 (0.0%) |
Employment Occupations by Sex in Green Tree borough
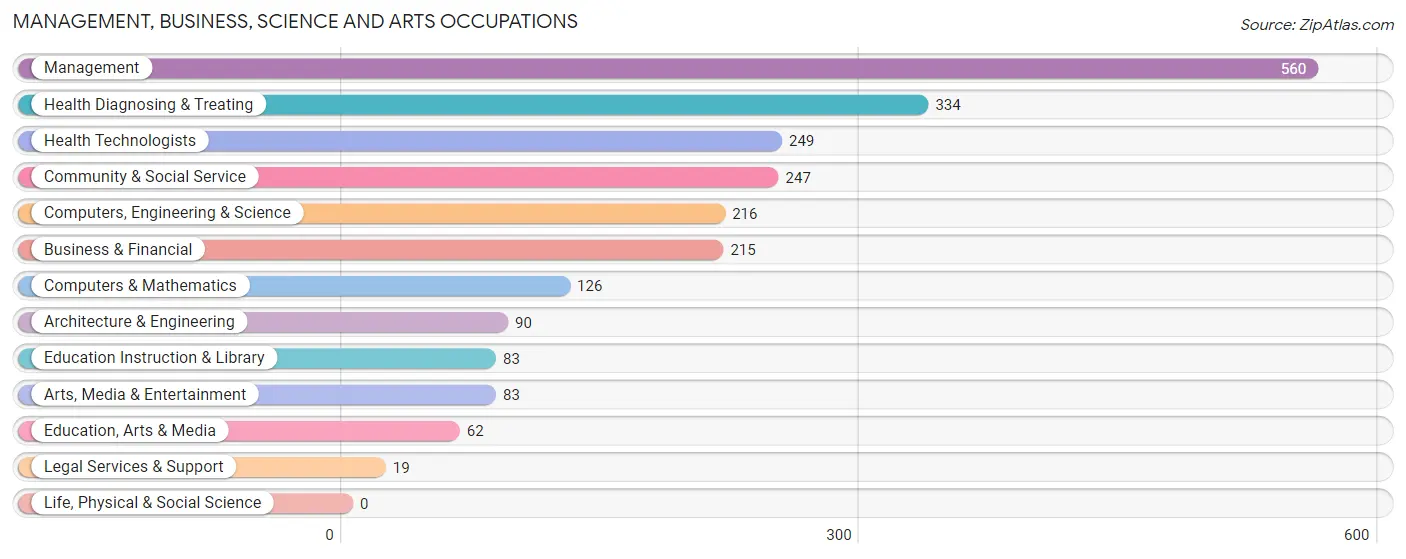
Management, Business, Science and Arts Occupations
The most common Management, Business, Science and Arts occupations in Green Tree borough are Management (560 | 19.4%), Health Diagnosing & Treating (334 | 11.6%), Health Technologists (249 | 8.6%), Community & Social Service (247 | 8.6%), and Computers, Engineering & Science (216 | 7.5%).
Management, Business, Science and Arts Occupations by Sex
Within the Management, Business, Science and Arts occupations in Green Tree borough, the most male-oriented occupations are Architecture & Engineering (100.0%), Computers, Engineering & Science (81.5%), and Computers & Mathematics (68.2%), while the most female-oriented occupations are Legal Services & Support (100.0%), Health Diagnosing & Treating (100.0%), and Health Technologists (100.0%).
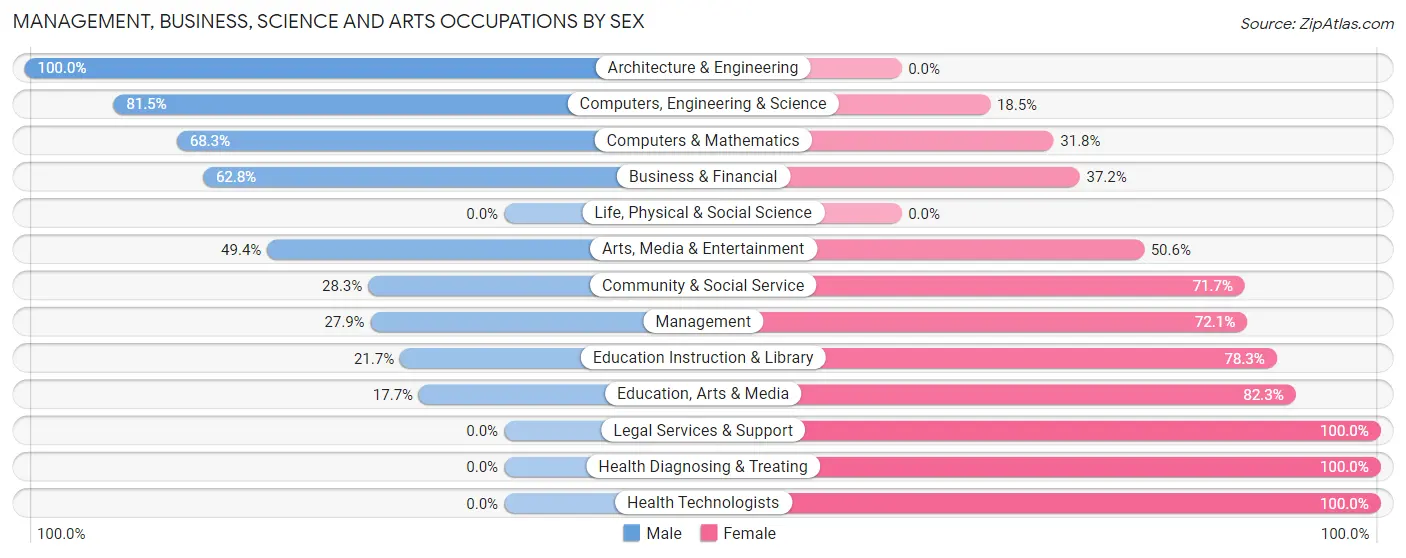
| Occupation | Male | Female |
| Management | 156 (27.9%) | 404 (72.1%) |
| Business & Financial | 135 (62.8%) | 80 (37.2%) |
| Computers, Engineering & Science | 176 (81.5%) | 40 (18.5%) |
| Computers & Mathematics | 86 (68.2%) | 40 (31.8%) |
| Architecture & Engineering | 90 (100.0%) | 0 (0.0%) |
| Life, Physical & Social Science | 0 (0.0%) | 0 (0.0%) |
| Community & Social Service | 70 (28.3%) | 177 (71.7%) |
| Education, Arts & Media | 11 (17.7%) | 51 (82.3%) |
| Legal Services & Support | 0 (0.0%) | 19 (100.0%) |
| Education Instruction & Library | 18 (21.7%) | 65 (78.3%) |
| Arts, Media & Entertainment | 41 (49.4%) | 42 (50.6%) |
| Health Diagnosing & Treating | 0 (0.0%) | 334 (100.0%) |
| Health Technologists | 0 (0.0%) | 249 (100.0%) |
| Total (Category) | 537 (34.2%) | 1,035 (65.8%) |
| Total (Overall) | 1,416 (49.1%) | 1,467 (50.9%) |
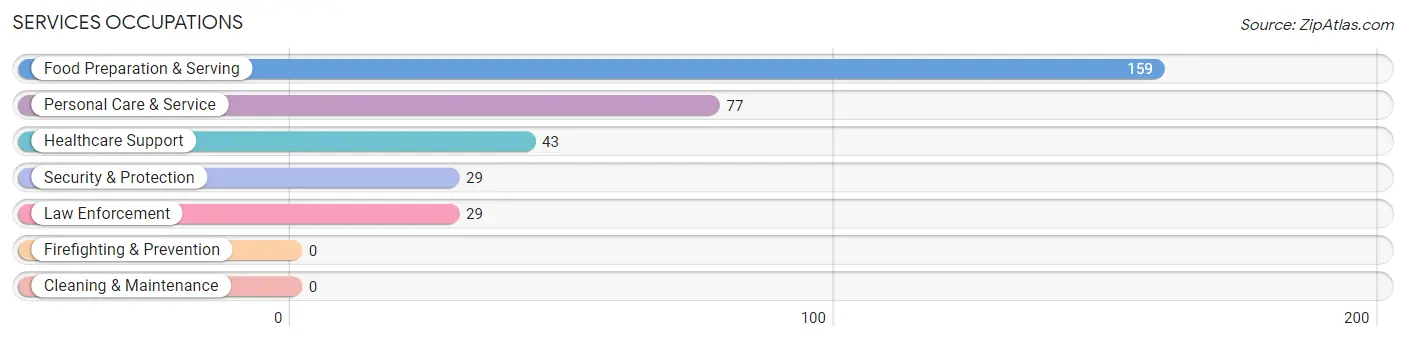
Services Occupations
The most common Services occupations in Green Tree borough are Food Preparation & Serving (159 | 5.5%), Personal Care & Service (77 | 2.7%), Healthcare Support (43 | 1.5%), Security & Protection (29 | 1.0%), and Law Enforcement (29 | 1.0%).
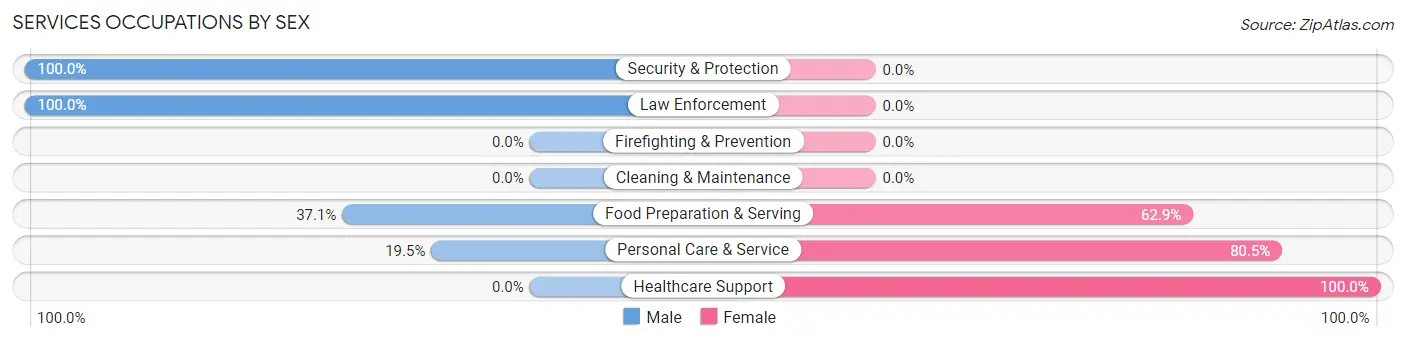
Services Occupations by Sex
Within the Services occupations in Green Tree borough, the most male-oriented occupations are Security & Protection (100.0%), Law Enforcement (100.0%), and Food Preparation & Serving (37.1%), while the most female-oriented occupations are Healthcare Support (100.0%), Personal Care & Service (80.5%), and Food Preparation & Serving (62.9%).
| Occupation | Male | Female |
| Healthcare Support | 0 (0.0%) | 43 (100.0%) |
| Security & Protection | 29 (100.0%) | 0 (0.0%) |
| Firefighting & Prevention | 0 (0.0%) | 0 (0.0%) |
| Law Enforcement | 29 (100.0%) | 0 (0.0%) |
| Food Preparation & Serving | 59 (37.1%) | 100 (62.9%) |
| Cleaning & Maintenance | 0 (0.0%) | 0 (0.0%) |
| Personal Care & Service | 15 (19.5%) | 62 (80.5%) |
| Total (Category) | 103 (33.4%) | 205 (66.6%) |
| Total (Overall) | 1,416 (49.1%) | 1,467 (50.9%) |
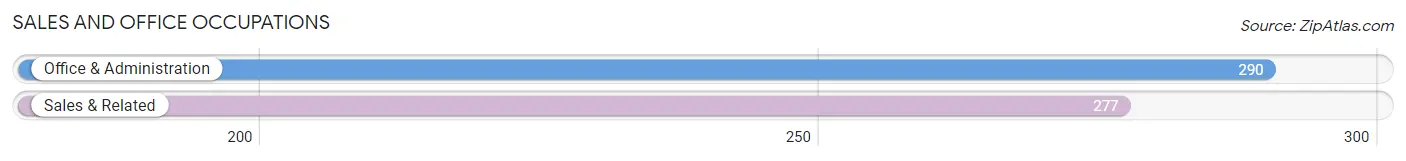
Sales and Office Occupations
The most common Sales and Office occupations in Green Tree borough are Office & Administration (290 | 10.1%), and Sales & Related (277 | 9.6%).
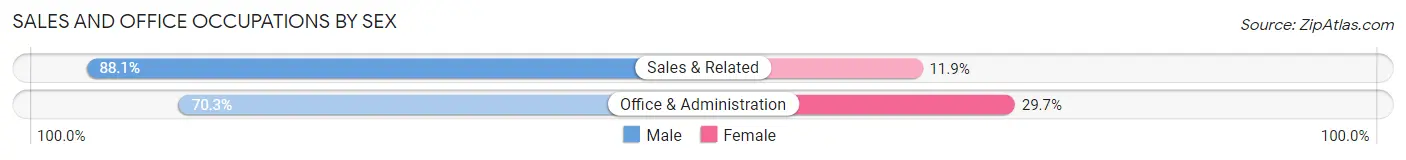
Sales and Office Occupations by Sex
| Occupation | Male | Female |
| Sales & Related | 244 (88.1%) | 33 (11.9%) |
| Office & Administration | 204 (70.3%) | 86 (29.7%) |
| Total (Category) | 448 (79.0%) | 119 (21.0%) |
| Total (Overall) | 1,416 (49.1%) | 1,467 (50.9%) |
Natural Resources, Construction and Maintenance Occupations
The most common Natural Resources, Construction and Maintenance occupations in Green Tree borough are Construction & Extraction (69 | 2.4%), and Installation, Maintenance & Repair (40 | 1.4%).
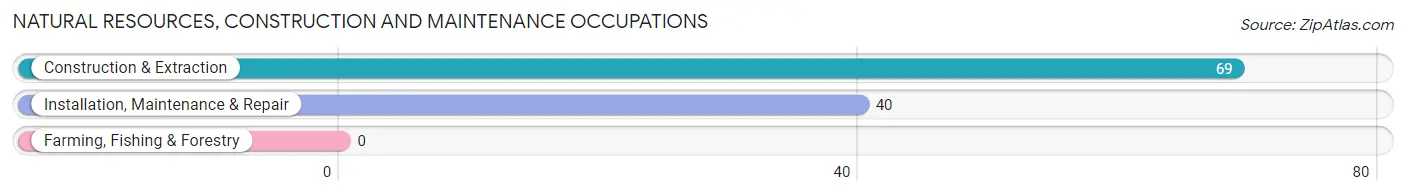
Natural Resources, Construction and Maintenance Occupations by Sex
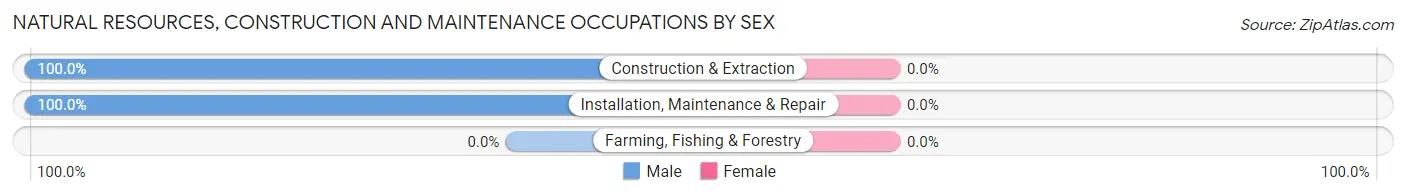
| Occupation | Male | Female |
| Farming, Fishing & Forestry | 0 (0.0%) | 0 (0.0%) |
| Construction & Extraction | 69 (100.0%) | 0 (0.0%) |
| Installation, Maintenance & Repair | 40 (100.0%) | 0 (0.0%) |
| Total (Category) | 109 (100.0%) | 0 (0.0%) |
| Total (Overall) | 1,416 (49.1%) | 1,467 (50.9%) |
Production, Transportation and Moving Occupations
The most common Production, Transportation and Moving occupations in Green Tree borough are Material Moving (165 | 5.7%), Production (112 | 3.9%), and Transportation (50 | 1.7%).
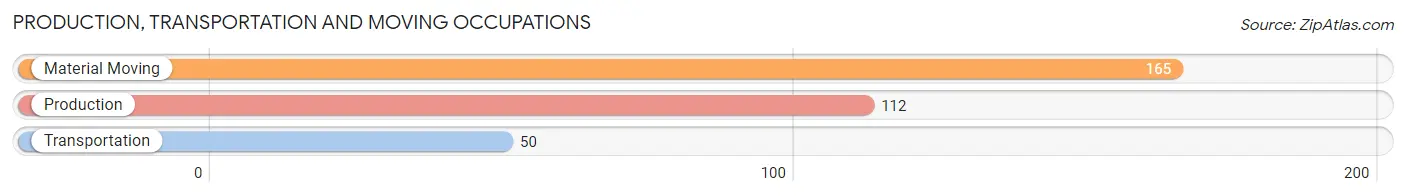
Production, Transportation and Moving Occupations by Sex
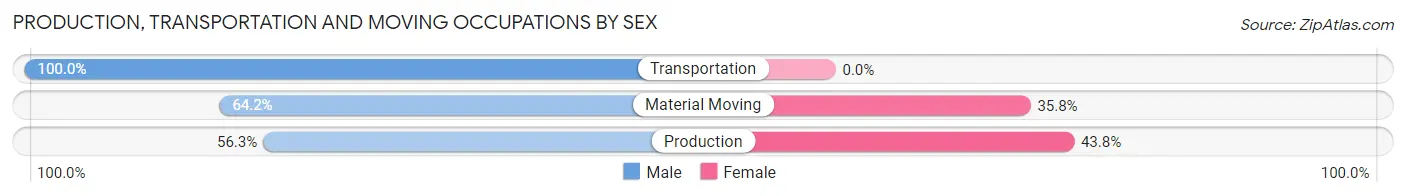
| Occupation | Male | Female |
| Production | 63 (56.2%) | 49 (43.8%) |
| Transportation | 50 (100.0%) | 0 (0.0%) |
| Material Moving | 106 (64.2%) | 59 (35.8%) |
| Total (Category) | 219 (67.0%) | 108 (33.0%) |
| Total (Overall) | 1,416 (49.1%) | 1,467 (50.9%) |
Employment Industries by Sex in Green Tree borough
Employment Industries in Green Tree borough
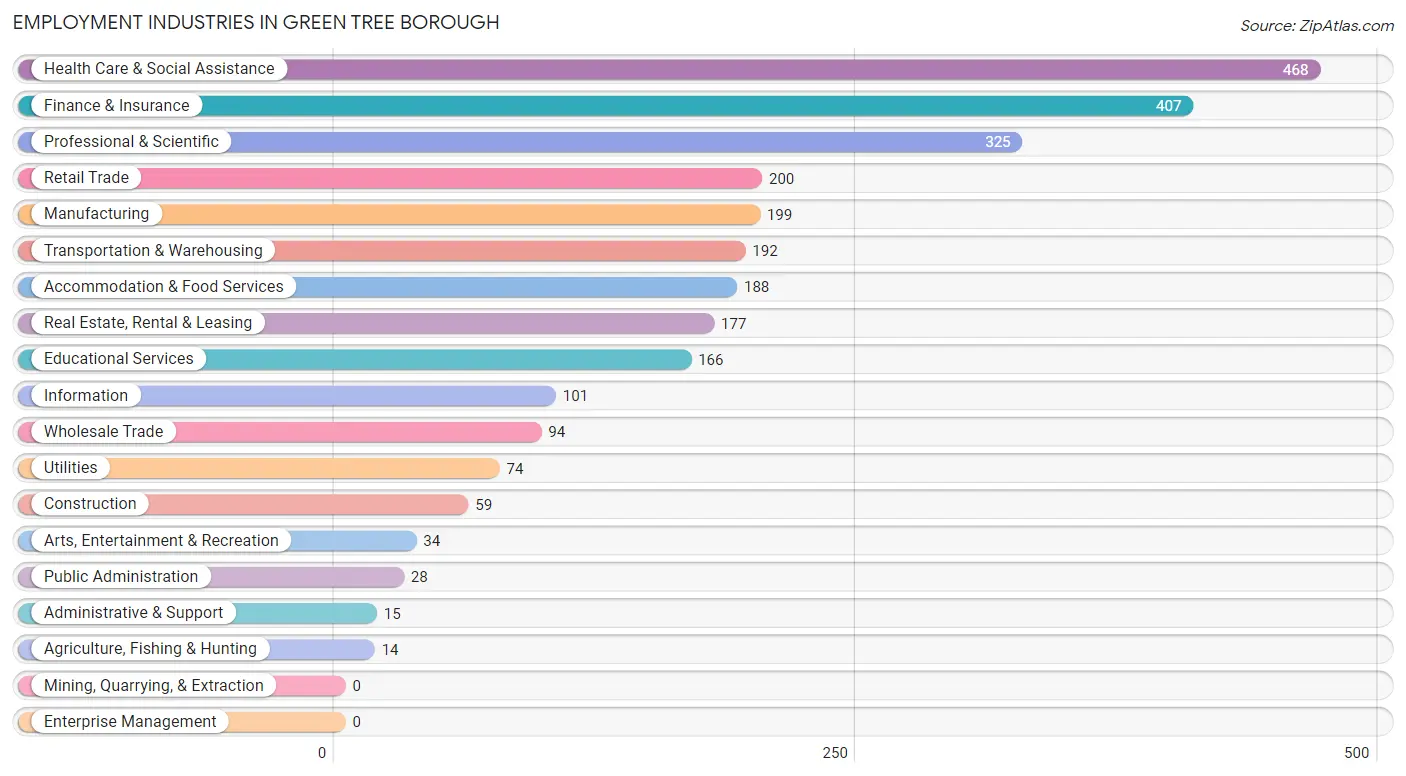
The major employment industries in Green Tree borough include Health Care & Social Assistance (468 | 16.2%), Finance & Insurance (407 | 14.1%), Professional & Scientific (325 | 11.3%), Retail Trade (200 | 6.9%), and Manufacturing (199 | 6.9%).
Employment Industries by Sex in Green Tree borough
The Green Tree borough industries that see more men than women are Agriculture, Fishing & Hunting (100.0%), Construction (100.0%), and Wholesale Trade (100.0%), whereas the industries that tend to have a higher number of women are Health Care & Social Assistance (91.4%), Information (78.2%), and Educational Services (77.1%).
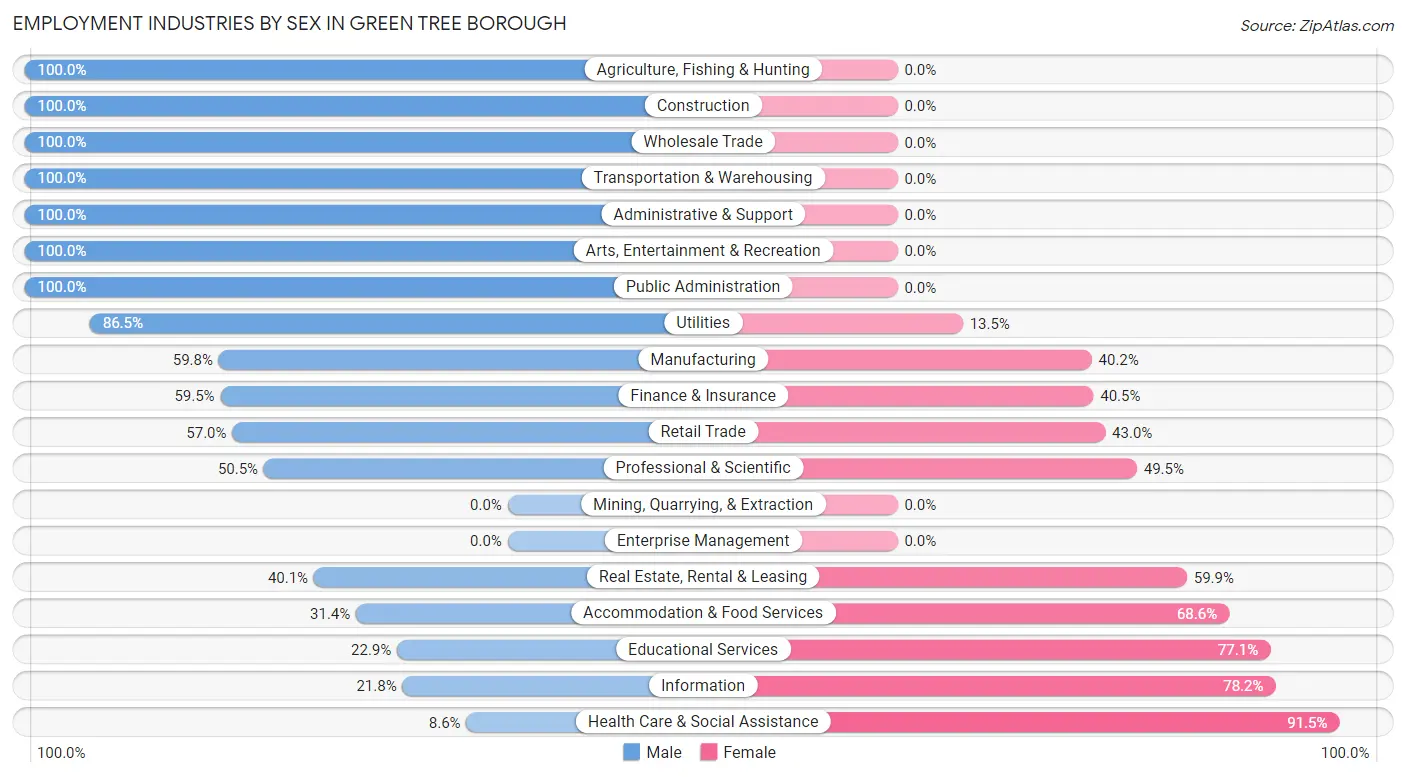
| Industry | Male | Female |
| Agriculture, Fishing & Hunting | 14 (100.0%) | 0 (0.0%) |
| Mining, Quarrying, & Extraction | 0 (0.0%) | 0 (0.0%) |
| Construction | 59 (100.0%) | 0 (0.0%) |
| Manufacturing | 119 (59.8%) | 80 (40.2%) |
| Wholesale Trade | 94 (100.0%) | 0 (0.0%) |
| Retail Trade | 114 (57.0%) | 86 (43.0%) |
| Transportation & Warehousing | 192 (100.0%) | 0 (0.0%) |
| Utilities | 64 (86.5%) | 10 (13.5%) |
| Information | 22 (21.8%) | 79 (78.2%) |
| Finance & Insurance | 242 (59.5%) | 165 (40.5%) |
| Real Estate, Rental & Leasing | 71 (40.1%) | 106 (59.9%) |
| Professional & Scientific | 164 (50.5%) | 161 (49.5%) |
| Enterprise Management | 0 (0.0%) | 0 (0.0%) |
| Administrative & Support | 15 (100.0%) | 0 (0.0%) |
| Educational Services | 38 (22.9%) | 128 (77.1%) |
| Health Care & Social Assistance | 40 (8.6%) | 428 (91.4%) |
| Arts, Entertainment & Recreation | 34 (100.0%) | 0 (0.0%) |
| Accommodation & Food Services | 59 (31.4%) | 129 (68.6%) |
| Public Administration | 28 (100.0%) | 0 (0.0%) |
| Total | 1,416 (49.1%) | 1,467 (50.9%) |
Education in Green Tree borough
School Enrollment in Green Tree borough
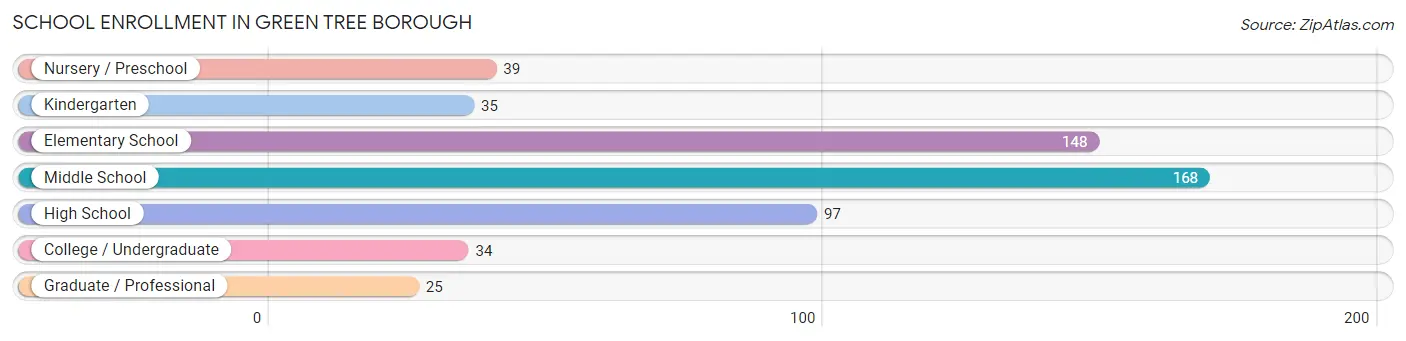
The most common levels of schooling among the 546 students in Green Tree borough are middle school (168 | 30.8%), elementary school (148 | 27.1%), and high school (97 | 17.8%).
| School Level | # Students | % Students |
| Nursery / Preschool | 39 | 7.1% |
| Kindergarten | 35 | 6.4% |
| Elementary School | 148 | 27.1% |
| Middle School | 168 | 30.8% |
| High School | 97 | 17.8% |
| College / Undergraduate | 34 | 6.2% |
| Graduate / Professional | 25 | 4.6% |
| Total | 546 | 100.0% |
School Enrollment by Age by Funding Source in Green Tree borough
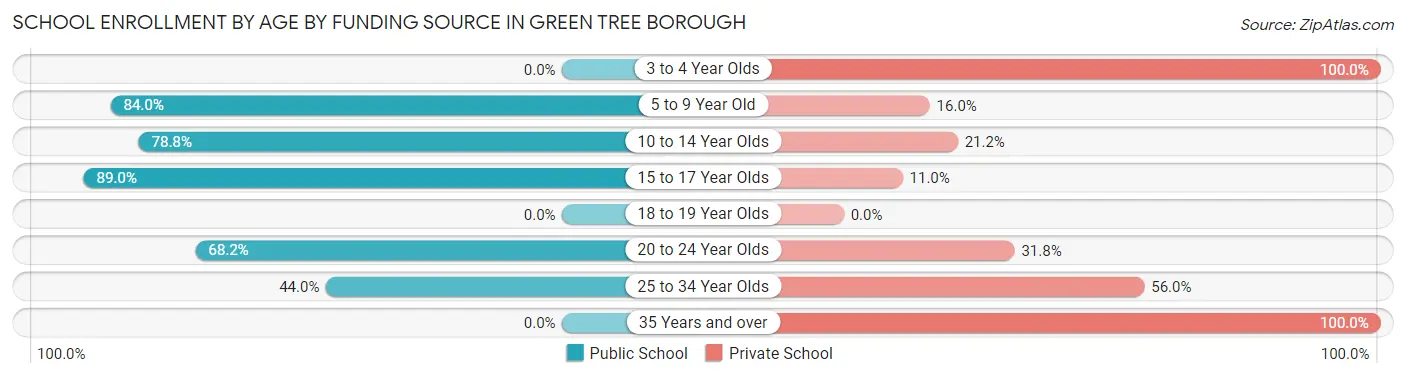
Out of a total of 546 students who are enrolled in schools in Green Tree borough, 143 (26.2%) attend a private institution, while the remaining 403 (73.8%) are enrolled in public schools. The age group of 3 to 4 year olds has the highest likelihood of being enrolled in private schools, with 24 (100.0% in the age bracket) enrolled. Conversely, the age group of 15 to 17 year olds has the lowest likelihood of being enrolled in a private school, with 73 (89.0% in the age bracket) attending a public institution.
| Age Bracket | Public School | Private School |
| 3 to 4 Year Olds | 0 (0.0%) | 24 (100.0%) |
| 5 to 9 Year Old | 152 (84.0%) | 29 (16.0%) |
| 10 to 14 Year Olds | 152 (78.8%) | 41 (21.2%) |
| 15 to 17 Year Olds | 73 (89.0%) | 9 (11.0%) |
| 18 to 19 Year Olds | 0 (0.0%) | 0 (0.0%) |
| 20 to 24 Year Olds | 15 (68.2%) | 7 (31.8%) |
| 25 to 34 Year Olds | 11 (44.0%) | 14 (56.0%) |
| 35 Years and over | 0 (0.0%) | 19 (100.0%) |
| Total | 403 (73.8%) | 143 (26.2%) |
Educational Attainment by Field of Study in Green Tree borough
Business (483 | 23.8%), science & technology (309 | 15.3%), social sciences (209 | 10.3%), education (176 | 8.7%), and literature & languages (166 | 8.2%) are the most common fields of study among 2,025 individuals in Green Tree borough who have obtained a bachelor's degree or higher.
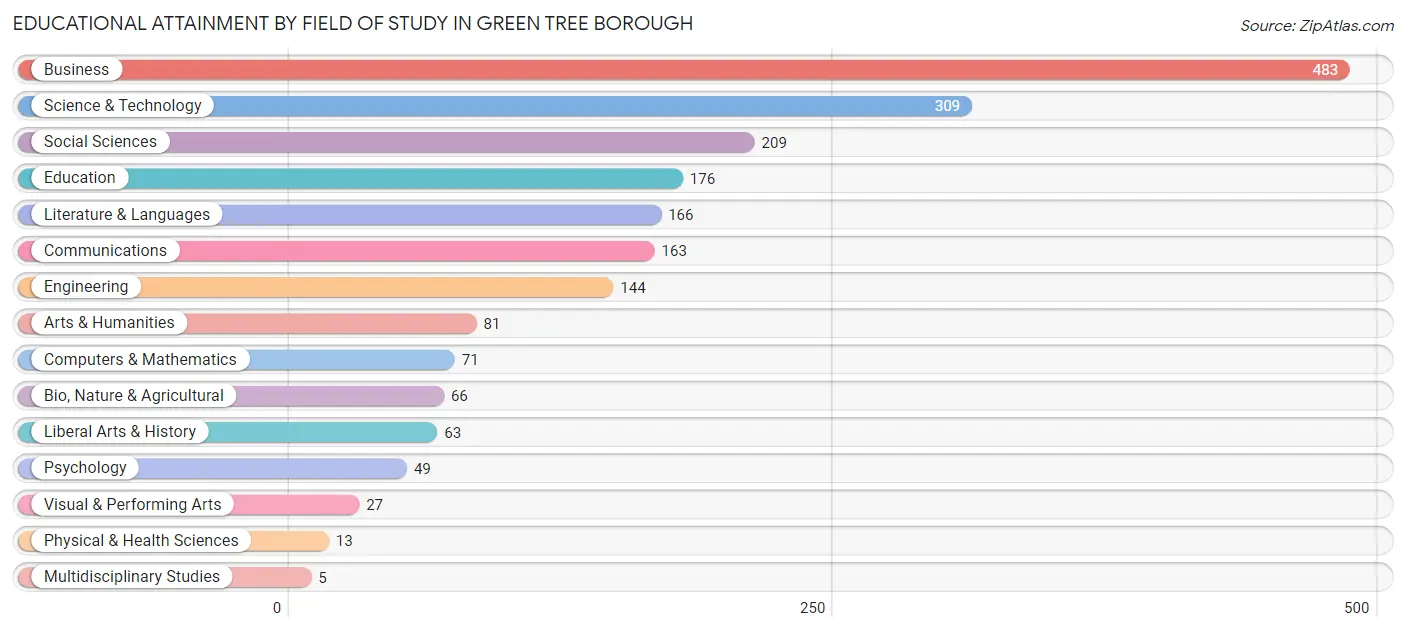
| Field of Study | # Graduates | % Graduates |
| Computers & Mathematics | 71 | 3.5% |
| Bio, Nature & Agricultural | 66 | 3.3% |
| Physical & Health Sciences | 13 | 0.6% |
| Psychology | 49 | 2.4% |
| Social Sciences | 209 | 10.3% |
| Engineering | 144 | 7.1% |
| Multidisciplinary Studies | 5 | 0.3% |
| Science & Technology | 309 | 15.3% |
| Business | 483 | 23.8% |
| Education | 176 | 8.7% |
| Literature & Languages | 166 | 8.2% |
| Liberal Arts & History | 63 | 3.1% |
| Visual & Performing Arts | 27 | 1.3% |
| Communications | 163 | 8.1% |
| Arts & Humanities | 81 | 4.0% |
| Total | 2,025 | 100.0% |
Transportation & Commute in Green Tree borough
Vehicle Availability by Sex in Green Tree borough
The most prevalent vehicle ownership categories in Green Tree borough are males with 2 vehicles (937, accounting for 64.8%) and females with 2 vehicles (740, making up 63.9%).
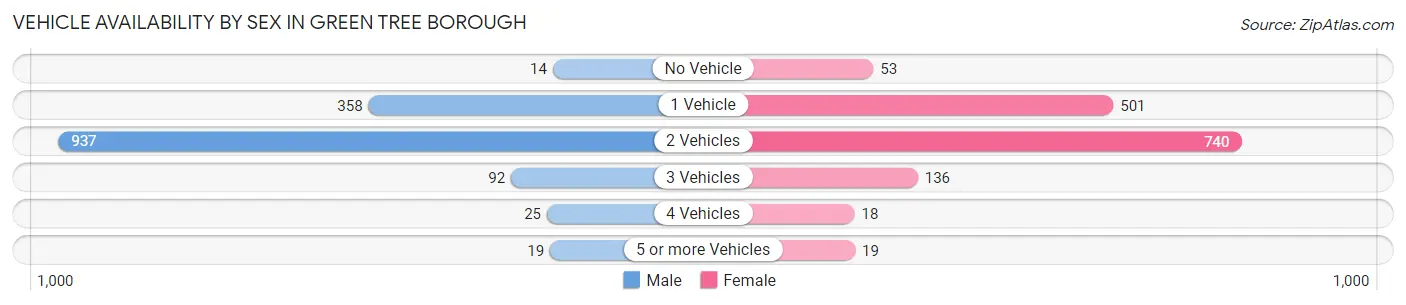
| Vehicles Available | Male | Female |
| No Vehicle | 14 (1.0%) | 53 (3.6%) |
| 1 Vehicle | 358 (24.8%) | 501 (34.2%) |
| 2 Vehicles | 937 (64.8%) | 740 (50.4%) |
| 3 Vehicles | 92 (6.4%) | 136 (9.3%) |
| 4 Vehicles | 25 (1.7%) | 18 (1.2%) |
| 5 or more Vehicles | 19 (1.3%) | 19 (1.3%) |
| Total | 1,445 (100.0%) | 1,467 (100.0%) |
Commute Time in Green Tree borough
The most frequently occuring commute durations in Green Tree borough are 15 to 19 minutes (481 commuters, 21.3%), 30 to 34 minutes (419 commuters, 18.6%), and 20 to 24 minutes (391 commuters, 17.3%).
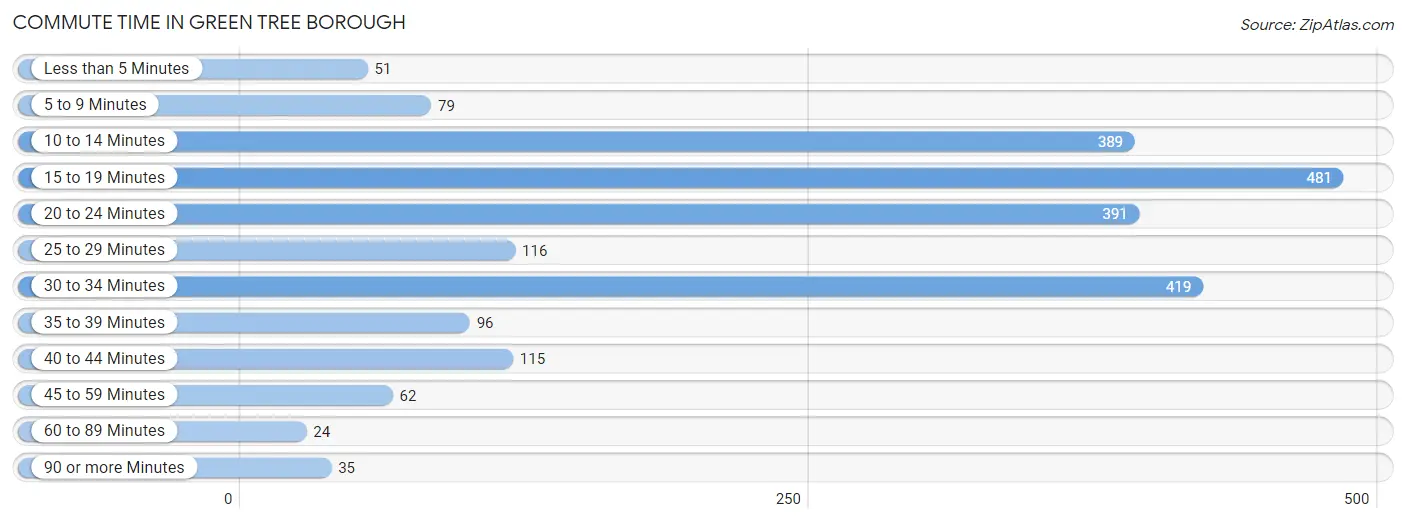
| Commute Time | # Commuters | % Commuters |
| Less than 5 Minutes | 51 | 2.3% |
| 5 to 9 Minutes | 79 | 3.5% |
| 10 to 14 Minutes | 389 | 17.2% |
| 15 to 19 Minutes | 481 | 21.3% |
| 20 to 24 Minutes | 391 | 17.3% |
| 25 to 29 Minutes | 116 | 5.1% |
| 30 to 34 Minutes | 419 | 18.6% |
| 35 to 39 Minutes | 96 | 4.3% |
| 40 to 44 Minutes | 115 | 5.1% |
| 45 to 59 Minutes | 62 | 2.8% |
| 60 to 89 Minutes | 24 | 1.1% |
| 90 or more Minutes | 35 | 1.5% |
Commute Time by Sex in Green Tree borough
The most common commute times in Green Tree borough are 10 to 14 minutes (274 commuters, 22.1%) for males and 20 to 24 minutes (257 commuters, 25.3%) for females.
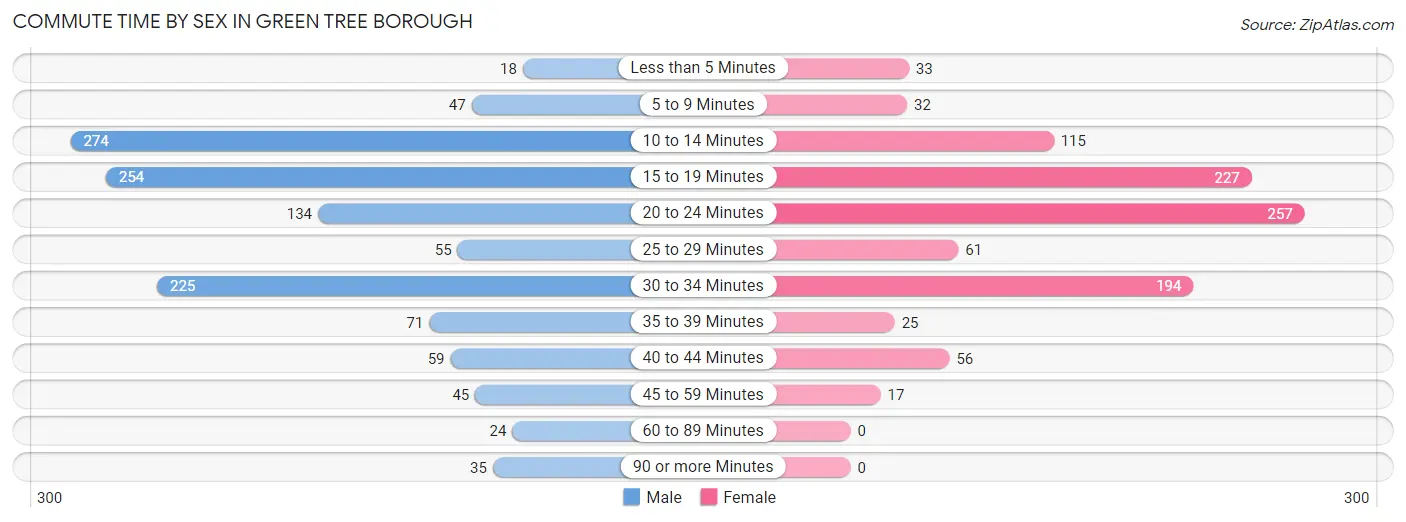
| Commute Time | Male | Female |
| Less than 5 Minutes | 18 (1.5%) | 33 (3.2%) |
| 5 to 9 Minutes | 47 (3.8%) | 32 (3.2%) |
| 10 to 14 Minutes | 274 (22.1%) | 115 (11.3%) |
| 15 to 19 Minutes | 254 (20.5%) | 227 (22.3%) |
| 20 to 24 Minutes | 134 (10.8%) | 257 (25.3%) |
| 25 to 29 Minutes | 55 (4.4%) | 61 (6.0%) |
| 30 to 34 Minutes | 225 (18.1%) | 194 (19.1%) |
| 35 to 39 Minutes | 71 (5.7%) | 25 (2.5%) |
| 40 to 44 Minutes | 59 (4.8%) | 56 (5.5%) |
| 45 to 59 Minutes | 45 (3.6%) | 17 (1.7%) |
| 60 to 89 Minutes | 24 (1.9%) | 0 (0.0%) |
| 90 or more Minutes | 35 (2.8%) | 0 (0.0%) |
Time of Departure to Work by Sex in Green Tree borough
The most frequent times of departure to work in Green Tree borough are 6:00 AM to 6:29 AM (401, 32.3%) for males and 7:00 AM to 7:29 AM (218, 21.4%) for females.
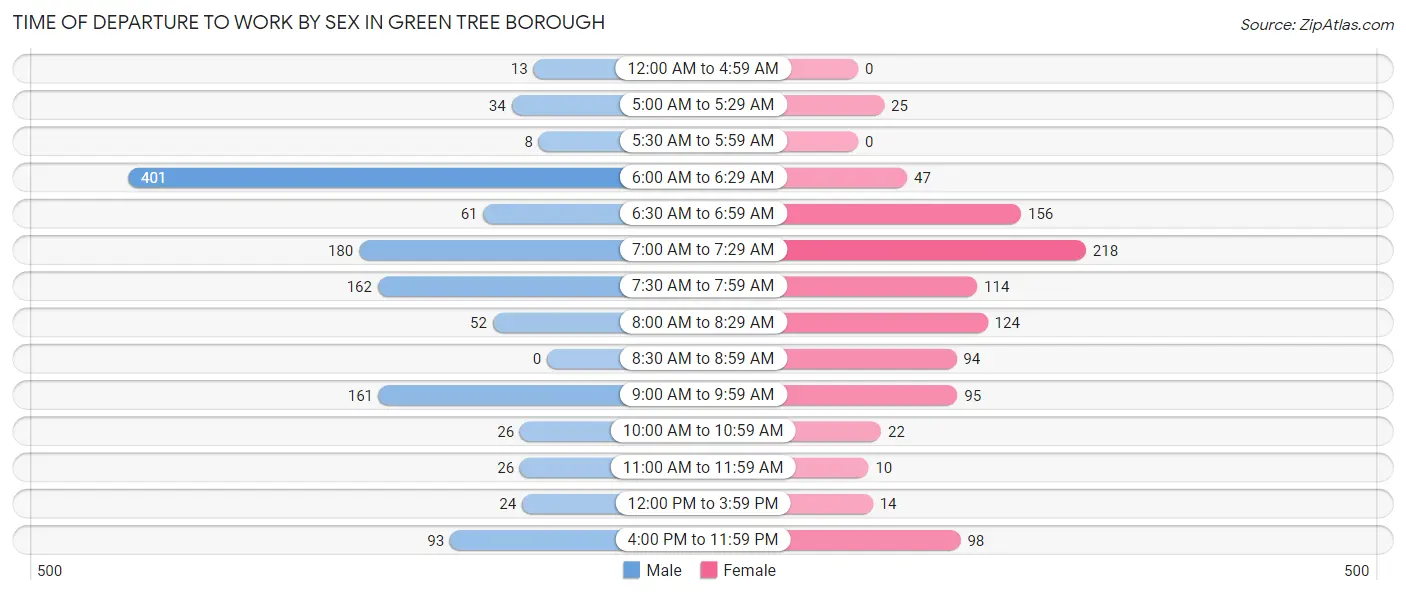
| Time of Departure | Male | Female |
| 12:00 AM to 4:59 AM | 13 (1.1%) | 0 (0.0%) |
| 5:00 AM to 5:29 AM | 34 (2.7%) | 25 (2.5%) |
| 5:30 AM to 5:59 AM | 8 (0.6%) | 0 (0.0%) |
| 6:00 AM to 6:29 AM | 401 (32.3%) | 47 (4.6%) |
| 6:30 AM to 6:59 AM | 61 (4.9%) | 156 (15.3%) |
| 7:00 AM to 7:29 AM | 180 (14.5%) | 218 (21.4%) |
| 7:30 AM to 7:59 AM | 162 (13.1%) | 114 (11.2%) |
| 8:00 AM to 8:29 AM | 52 (4.2%) | 124 (12.2%) |
| 8:30 AM to 8:59 AM | 0 (0.0%) | 94 (9.2%) |
| 9:00 AM to 9:59 AM | 161 (13.0%) | 95 (9.3%) |
| 10:00 AM to 10:59 AM | 26 (2.1%) | 22 (2.2%) |
| 11:00 AM to 11:59 AM | 26 (2.1%) | 10 (1.0%) |
| 12:00 PM to 3:59 PM | 24 (1.9%) | 14 (1.4%) |
| 4:00 PM to 11:59 PM | 93 (7.5%) | 98 (9.6%) |
| Total | 1,241 (100.0%) | 1,017 (100.0%) |
Housing Occupancy in Green Tree borough
Occupancy by Ownership in Green Tree borough
Of the total 2,334 dwellings in Green Tree borough, owner-occupied units account for 1,715 (73.5%), while renter-occupied units make up 619 (26.5%).
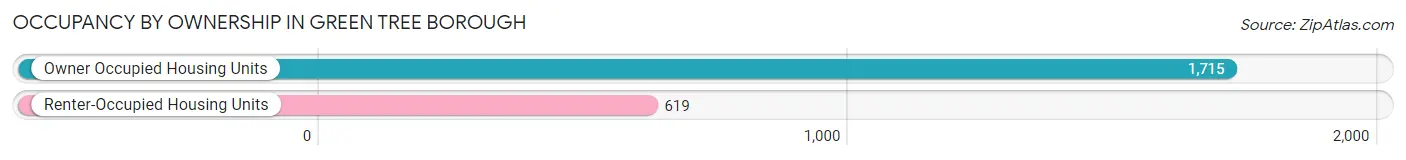
| Occupancy | # Housing Units | % Housing Units |
| Owner Occupied Housing Units | 1,715 | 73.5% |
| Renter-Occupied Housing Units | 619 | 26.5% |
| Total Occupied Housing Units | 2,334 | 100.0% |
Occupancy by Household Size in Green Tree borough
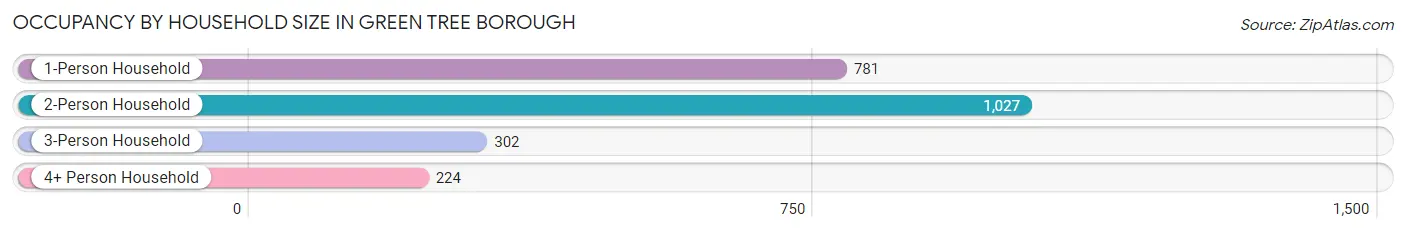
| Household Size | # Housing Units | % Housing Units |
| 1-Person Household | 781 | 33.5% |
| 2-Person Household | 1,027 | 44.0% |
| 3-Person Household | 302 | 12.9% |
| 4+ Person Household | 224 | 9.6% |
| Total Housing Units | 2,334 | 100.0% |
Occupancy by Ownership by Household Size in Green Tree borough
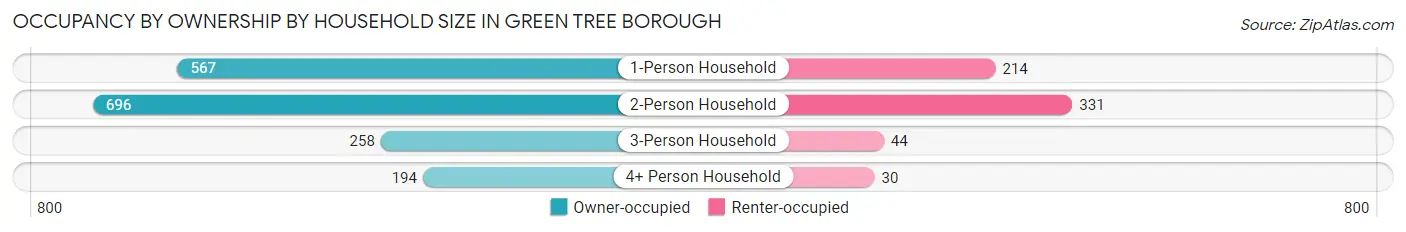
| Household Size | Owner-occupied | Renter-occupied |
| 1-Person Household | 567 (72.6%) | 214 (27.4%) |
| 2-Person Household | 696 (67.8%) | 331 (32.2%) |
| 3-Person Household | 258 (85.4%) | 44 (14.6%) |
| 4+ Person Household | 194 (86.6%) | 30 (13.4%) |
| Total Housing Units | 1,715 (73.5%) | 619 (26.5%) |
Occupancy by Educational Attainment in Green Tree borough
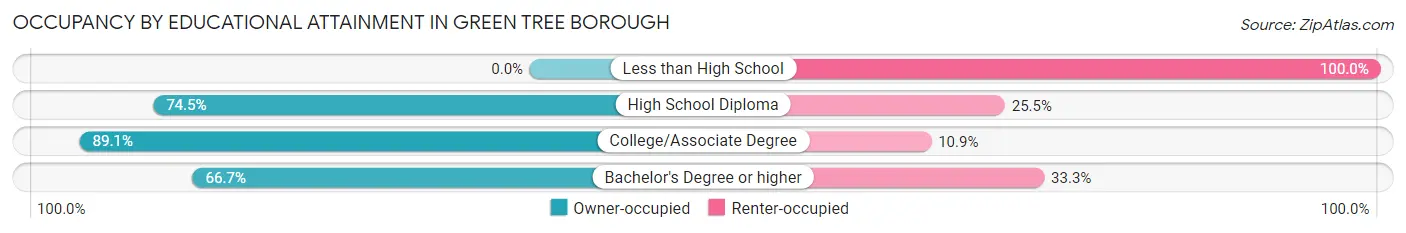
| Household Size | Owner-occupied | Renter-occupied |
| Less than High School | 0 (0.0%) | 39 (100.0%) |
| High School Diploma | 292 (74.5%) | 100 (25.5%) |
| College/Associate Degree | 612 (89.1%) | 75 (10.9%) |
| Bachelor's Degree or higher | 811 (66.7%) | 405 (33.3%) |
Occupancy by Age of Householder in Green Tree borough
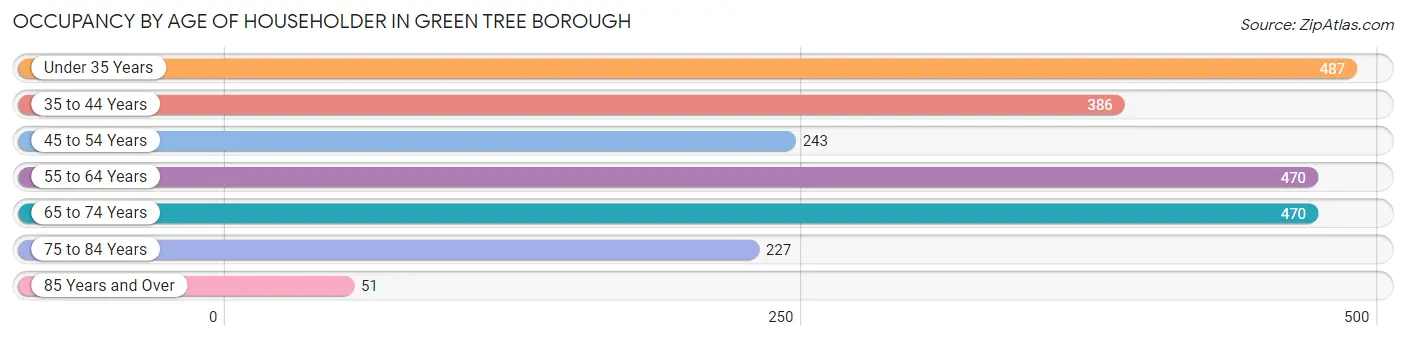
| Age Bracket | # Households | % Households |
| Under 35 Years | 487 | 20.9% |
| 35 to 44 Years | 386 | 16.5% |
| 45 to 54 Years | 243 | 10.4% |
| 55 to 64 Years | 470 | 20.1% |
| 65 to 74 Years | 470 | 20.1% |
| 75 to 84 Years | 227 | 9.7% |
| 85 Years and Over | 51 | 2.2% |
| Total | 2,334 | 100.0% |
Housing Finances in Green Tree borough
Median Income by Occupancy in Green Tree borough
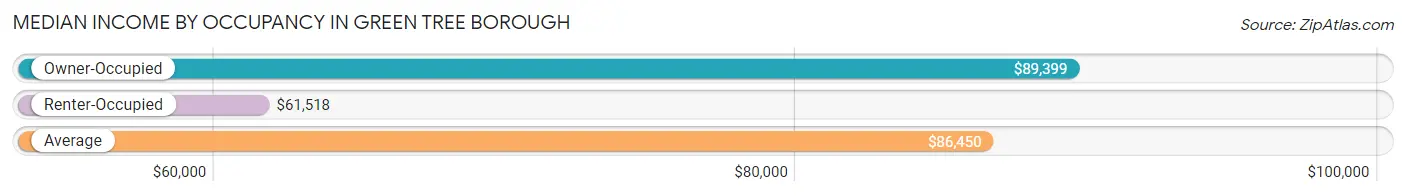
| Occupancy Type | # Households | Median Income |
| Owner-Occupied | 1,715 (73.5%) | $89,399 |
| Renter-Occupied | 619 (26.5%) | $61,518 |
| Average | 2,334 (100.0%) | $86,450 |
Occupancy by Householder Income Bracket in Green Tree borough
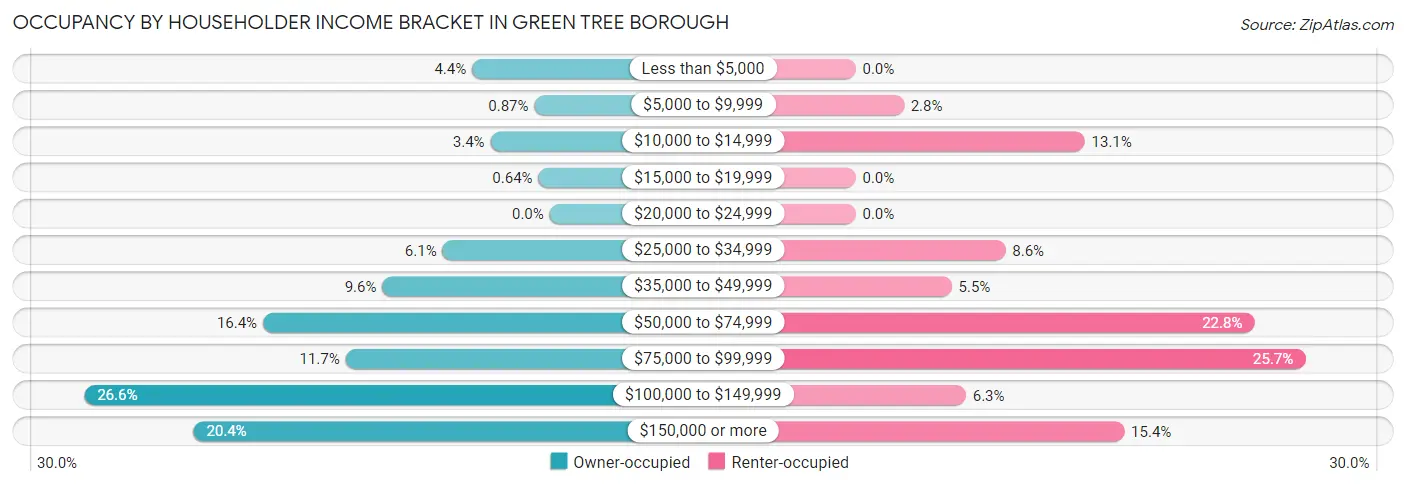
| Income Bracket | Owner-occupied | Renter-occupied |
| Less than $5,000 | 76 (4.4%) | 0 (0.0%) |
| $5,000 to $9,999 | 15 (0.9%) | 17 (2.8%) |
| $10,000 to $14,999 | 58 (3.4%) | 81 (13.1%) |
| $15,000 to $19,999 | 11 (0.6%) | 0 (0.0%) |
| $20,000 to $24,999 | 0 (0.0%) | 0 (0.0%) |
| $25,000 to $34,999 | 105 (6.1%) | 53 (8.6%) |
| $35,000 to $49,999 | 164 (9.6%) | 34 (5.5%) |
| $50,000 to $74,999 | 281 (16.4%) | 141 (22.8%) |
| $75,000 to $99,999 | 200 (11.7%) | 159 (25.7%) |
| $100,000 to $149,999 | 456 (26.6%) | 39 (6.3%) |
| $150,000 or more | 349 (20.3%) | 95 (15.3%) |
| Total | 1,715 (100.0%) | 619 (100.0%) |
Monthly Housing Cost Tiers in Green Tree borough
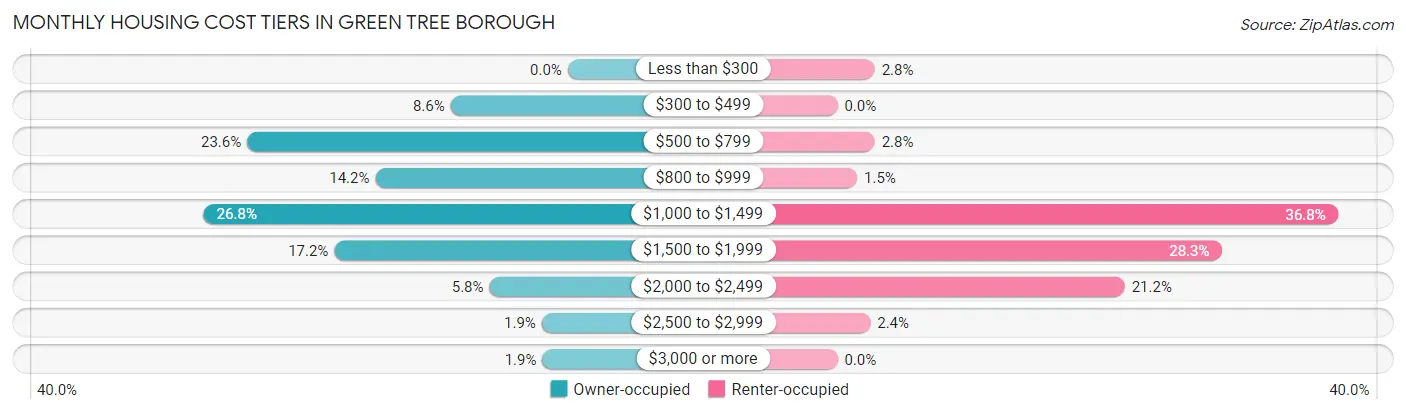
| Monthly Cost | Owner-occupied | Renter-occupied |
| Less than $300 | 0 (0.0%) | 17 (2.8%) |
| $300 to $499 | 148 (8.6%) | 0 (0.0%) |
| $500 to $799 | 405 (23.6%) | 17 (2.8%) |
| $800 to $999 | 243 (14.2%) | 9 (1.5%) |
| $1,000 to $1,499 | 460 (26.8%) | 228 (36.8%) |
| $1,500 to $1,999 | 295 (17.2%) | 175 (28.3%) |
| $2,000 to $2,499 | 99 (5.8%) | 131 (21.2%) |
| $2,500 to $2,999 | 33 (1.9%) | 15 (2.4%) |
| $3,000 or more | 32 (1.9%) | 0 (0.0%) |
| Total | 1,715 (100.0%) | 619 (100.0%) |
Physical Housing Characteristics in Green Tree borough
Housing Structures in Green Tree borough
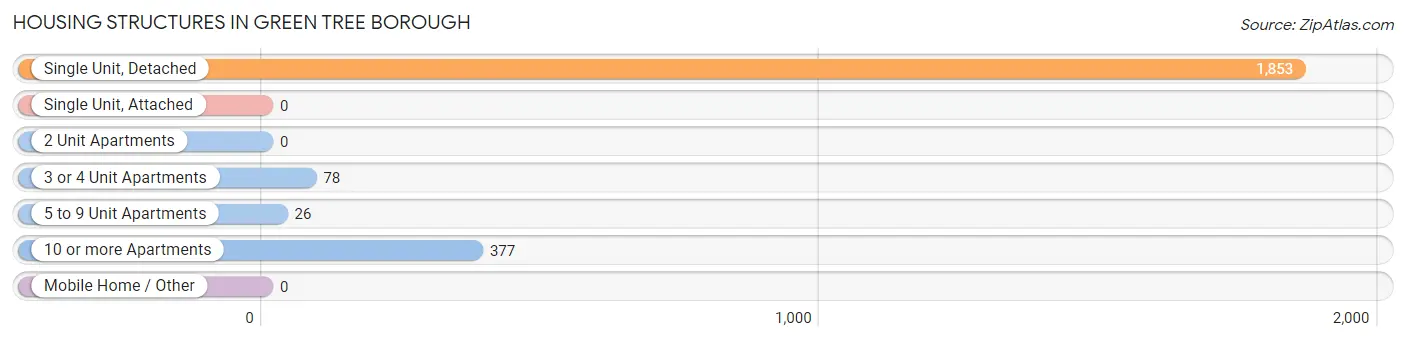
| Structure Type | # Housing Units | % Housing Units |
| Single Unit, Detached | 1,853 | 79.4% |
| Single Unit, Attached | 0 | 0.0% |
| 2 Unit Apartments | 0 | 0.0% |
| 3 or 4 Unit Apartments | 78 | 3.3% |
| 5 to 9 Unit Apartments | 26 | 1.1% |
| 10 or more Apartments | 377 | 16.2% |
| Mobile Home / Other | 0 | 0.0% |
| Total | 2,334 | 100.0% |
Housing Structures by Occupancy in Green Tree borough
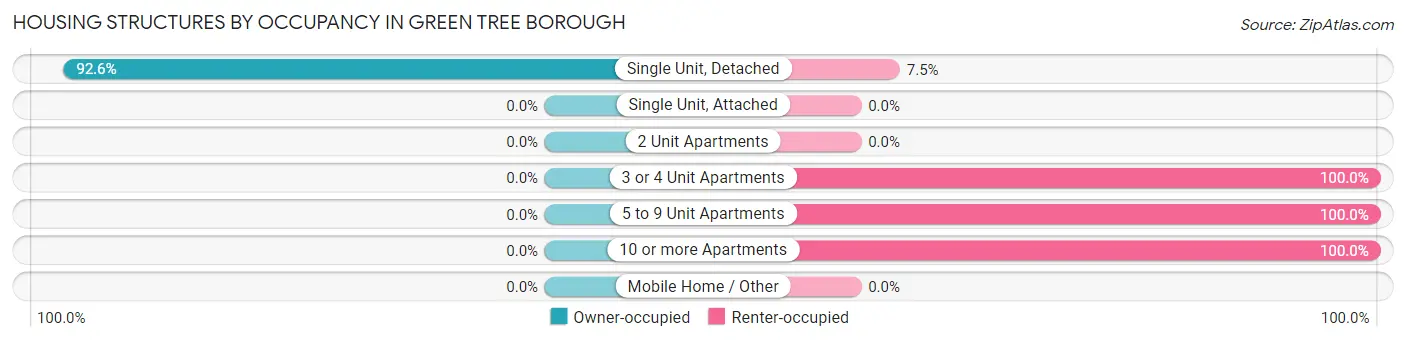
| Structure Type | Owner-occupied | Renter-occupied |
| Single Unit, Detached | 1,715 (92.5%) | 138 (7.4%) |
| Single Unit, Attached | 0 (0.0%) | 0 (0.0%) |
| 2 Unit Apartments | 0 (0.0%) | 0 (0.0%) |
| 3 or 4 Unit Apartments | 0 (0.0%) | 78 (100.0%) |
| 5 to 9 Unit Apartments | 0 (0.0%) | 26 (100.0%) |
| 10 or more Apartments | 0 (0.0%) | 377 (100.0%) |
| Mobile Home / Other | 0 (0.0%) | 0 (0.0%) |
| Total | 1,715 (73.5%) | 619 (26.5%) |
Housing Structures by Number of Rooms in Green Tree borough
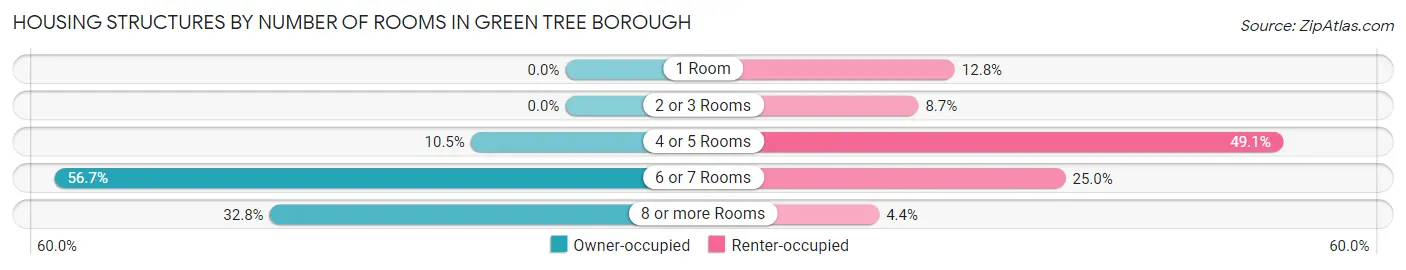
| Number of Rooms | Owner-occupied | Renter-occupied |
| 1 Room | 0 (0.0%) | 79 (12.8%) |
| 2 or 3 Rooms | 0 (0.0%) | 54 (8.7%) |
| 4 or 5 Rooms | 180 (10.5%) | 304 (49.1%) |
| 6 or 7 Rooms | 972 (56.7%) | 155 (25.0%) |
| 8 or more Rooms | 563 (32.8%) | 27 (4.4%) |
| Total | 1,715 (100.0%) | 619 (100.0%) |
Housing Structure by Heating Type in Green Tree borough
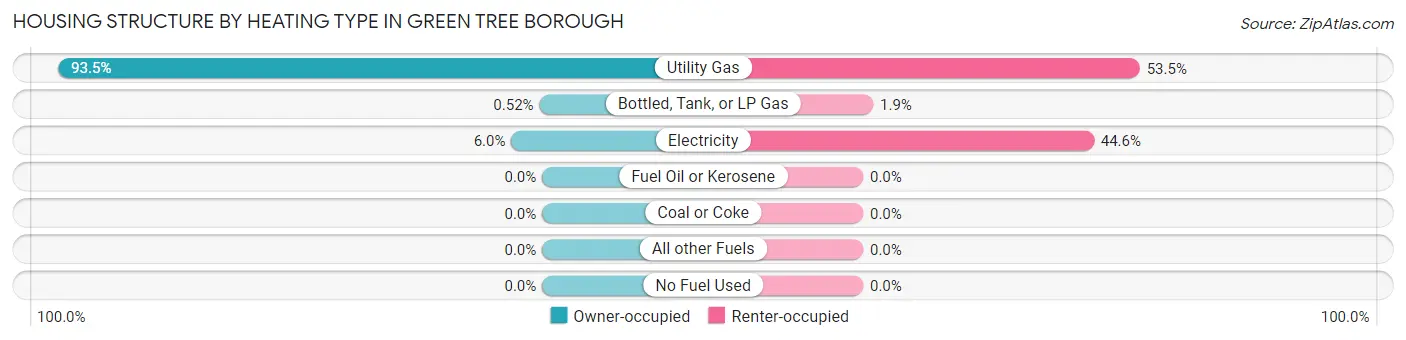
| Heating Type | Owner-occupied | Renter-occupied |
| Utility Gas | 1,604 (93.5%) | 331 (53.5%) |
| Bottled, Tank, or LP Gas | 9 (0.5%) | 12 (1.9%) |
| Electricity | 102 (5.9%) | 276 (44.6%) |
| Fuel Oil or Kerosene | 0 (0.0%) | 0 (0.0%) |
| Coal or Coke | 0 (0.0%) | 0 (0.0%) |
| All other Fuels | 0 (0.0%) | 0 (0.0%) |
| No Fuel Used | 0 (0.0%) | 0 (0.0%) |
| Total | 1,715 (100.0%) | 619 (100.0%) |
Household Vehicle Usage in Green Tree borough
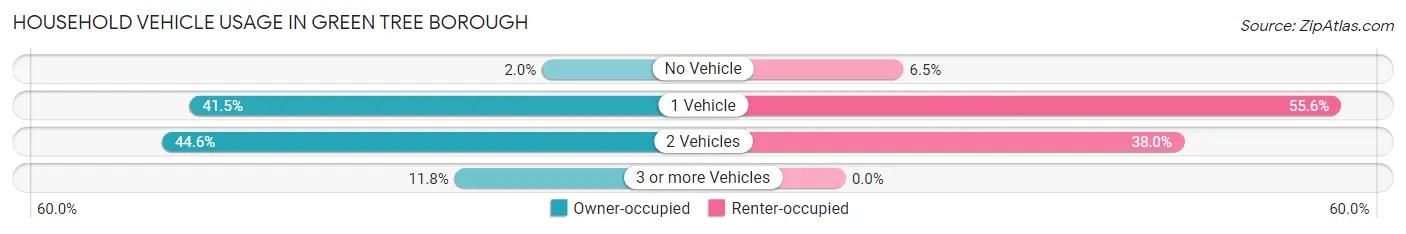
| Vehicles per Household | Owner-occupied | Renter-occupied |
| No Vehicle | 35 (2.0%) | 40 (6.5%) |
| 1 Vehicle | 712 (41.5%) | 344 (55.6%) |
| 2 Vehicles | 765 (44.6%) | 235 (38.0%) |
| 3 or more Vehicles | 203 (11.8%) | 0 (0.0%) |
| Total | 1,715 (100.0%) | 619 (100.0%) |
Real Estate & Mortgages in Green Tree borough
Real Estate and Mortgage Overview in Green Tree borough
| Characteristic | Without Mortgage | With Mortgage |
| Housing Units | 764 | 951 |
| Median Property Value | $228,300 | $231,200 |
| Median Household Income | $68,028 | $242 |
| Monthly Housing Costs | $652 | $32 |
| Real Estate Taxes | $3,464 | $0 |
Property Value by Mortgage Status in Green Tree borough
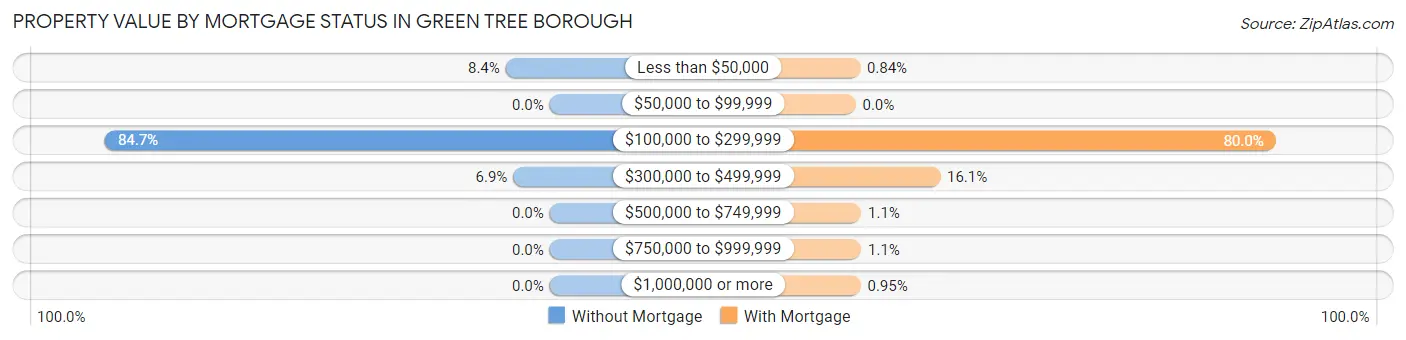
| Property Value | Without Mortgage | With Mortgage |
| Less than $50,000 | 64 (8.4%) | 8 (0.8%) |
| $50,000 to $99,999 | 0 (0.0%) | 0 (0.0%) |
| $100,000 to $299,999 | 647 (84.7%) | 761 (80.0%) |
| $300,000 to $499,999 | 53 (6.9%) | 153 (16.1%) |
| $500,000 to $749,999 | 0 (0.0%) | 10 (1.1%) |
| $750,000 to $999,999 | 0 (0.0%) | 10 (1.1%) |
| $1,000,000 or more | 0 (0.0%) | 9 (0.9%) |
| Total | 764 (100.0%) | 951 (100.0%) |
Household Income by Mortgage Status in Green Tree borough
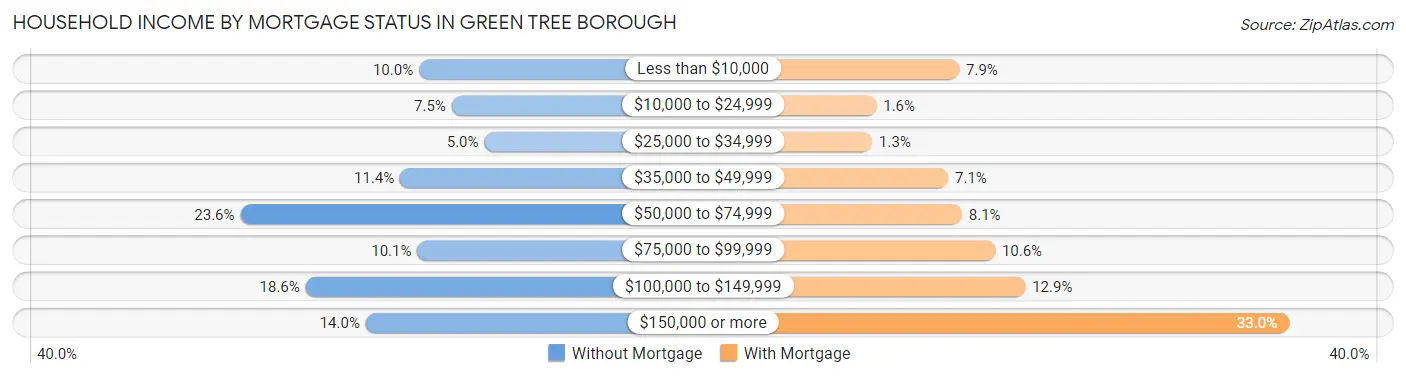
| Household Income | Without Mortgage | With Mortgage |
| Less than $10,000 | 76 (10.0%) | 75 (7.9%) |
| $10,000 to $24,999 | 57 (7.5%) | 15 (1.6%) |
| $25,000 to $34,999 | 38 (5.0%) | 12 (1.3%) |
| $35,000 to $49,999 | 87 (11.4%) | 67 (7.0%) |
| $50,000 to $74,999 | 180 (23.6%) | 77 (8.1%) |
| $75,000 to $99,999 | 77 (10.1%) | 101 (10.6%) |
| $100,000 to $149,999 | 142 (18.6%) | 123 (12.9%) |
| $150,000 or more | 107 (14.0%) | 314 (33.0%) |
| Total | 764 (100.0%) | 951 (100.0%) |
Property Value to Household Income Ratio in Green Tree borough
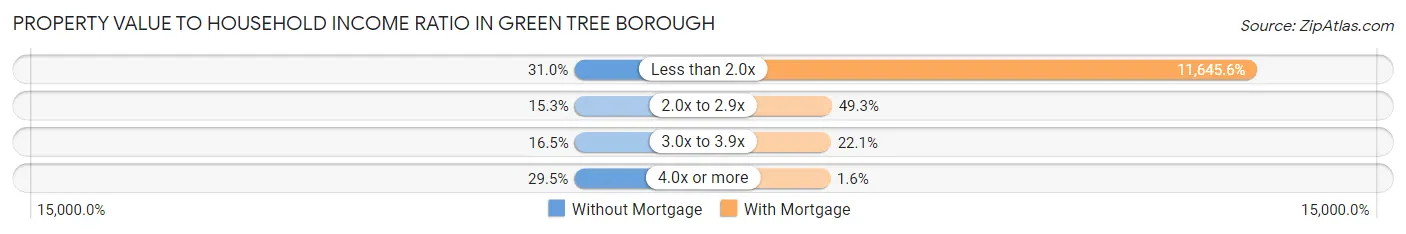
| Value-to-Income Ratio | Without Mortgage | With Mortgage |
| Less than 2.0x | 237 (31.0%) | 110,750 (11,645.6%) |
| 2.0x to 2.9x | 117 (15.3%) | 469 (49.3%) |
| 3.0x to 3.9x | 126 (16.5%) | 210 (22.1%) |
| 4.0x or more | 225 (29.4%) | 15 (1.6%) |
| Total | 764 (100.0%) | 951 (100.0%) |
Real Estate Taxes by Mortgage Status in Green Tree borough
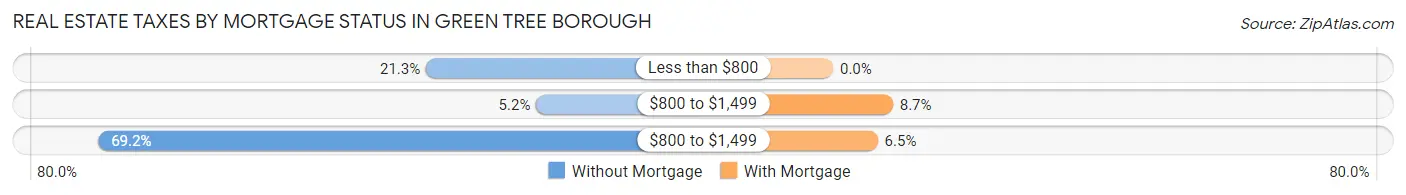
| Property Taxes | Without Mortgage | With Mortgage |
| Less than $800 | 163 (21.3%) | 0 (0.0%) |
| $800 to $1,499 | 40 (5.2%) | 83 (8.7%) |
| $800 to $1,499 | 529 (69.2%) | 62 (6.5%) |
| Total | 764 (100.0%) | 951 (100.0%) |
Health & Disability in Green Tree borough
Health Insurance Coverage by Age in Green Tree borough
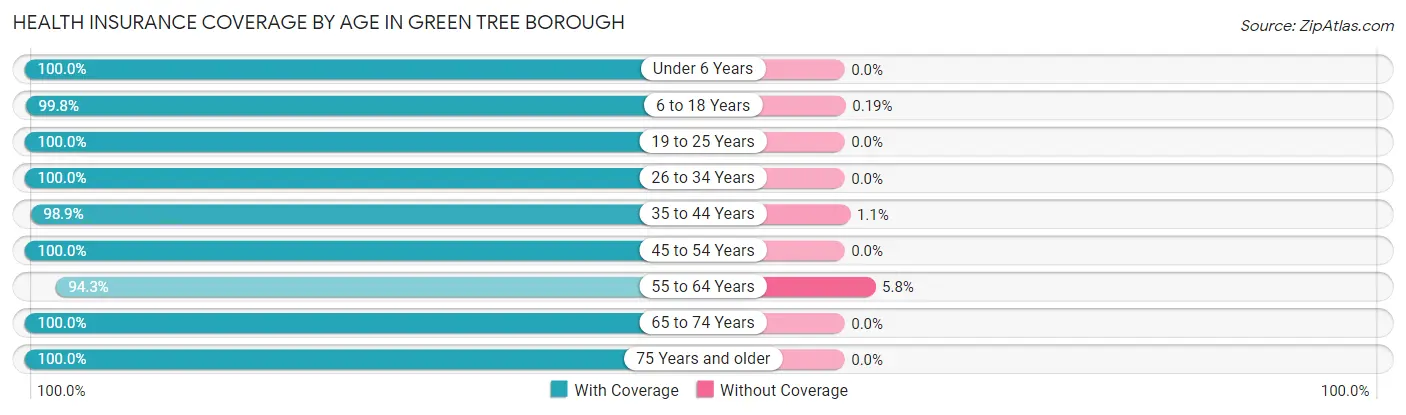
| Age Bracket | With Coverage | Without Coverage |
| Under 6 Years | 347 (100.0%) | 0 (0.0%) |
| 6 to 18 Years | 535 (99.8%) | 1 (0.2%) |
| 19 to 25 Years | 95 (100.0%) | 0 (0.0%) |
| 26 to 34 Years | 775 (100.0%) | 0 (0.0%) |
| 35 to 44 Years | 655 (98.9%) | 7 (1.1%) |
| 45 to 54 Years | 437 (100.0%) | 0 (0.0%) |
| 55 to 64 Years | 754 (94.3%) | 46 (5.8%) |
| 65 to 74 Years | 744 (100.0%) | 0 (0.0%) |
| 75 Years and older | 421 (100.0%) | 0 (0.0%) |
| Total | 4,763 (98.9%) | 54 (1.1%) |
Health Insurance Coverage by Citizenship Status in Green Tree borough
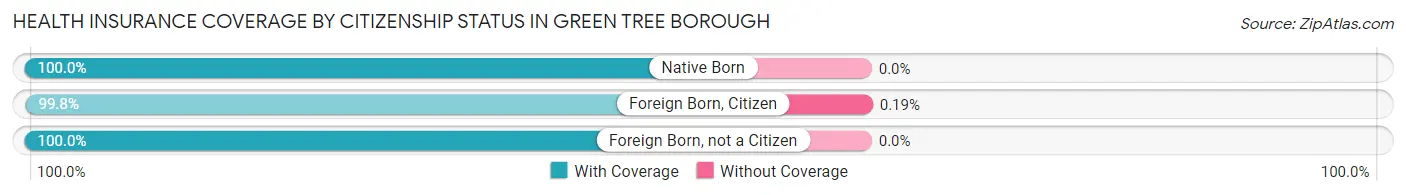
| Citizenship Status | With Coverage | Without Coverage |
| Native Born | 347 (100.0%) | 0 (0.0%) |
| Foreign Born, Citizen | 535 (99.8%) | 1 (0.2%) |
| Foreign Born, not a Citizen | 95 (100.0%) | 0 (0.0%) |
Health Insurance Coverage by Household Income in Green Tree borough
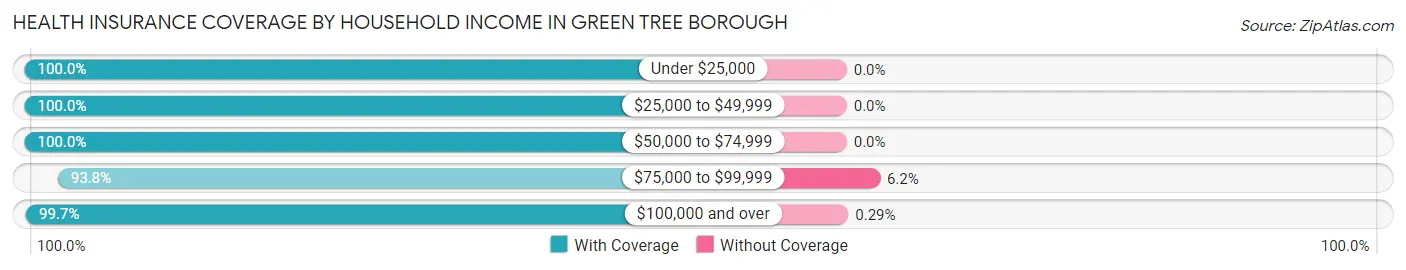
| Household Income | With Coverage | Without Coverage |
| Under $25,000 | 377 (100.0%) | 0 (0.0%) |
| $25,000 to $49,999 | 462 (100.0%) | 0 (0.0%) |
| $50,000 to $74,999 | 799 (100.0%) | 0 (0.0%) |
| $75,000 to $99,999 | 694 (93.8%) | 46 (6.2%) |
| $100,000 and over | 2,427 (99.7%) | 7 (0.3%) |
Public vs Private Health Insurance Coverage by Age in Green Tree borough
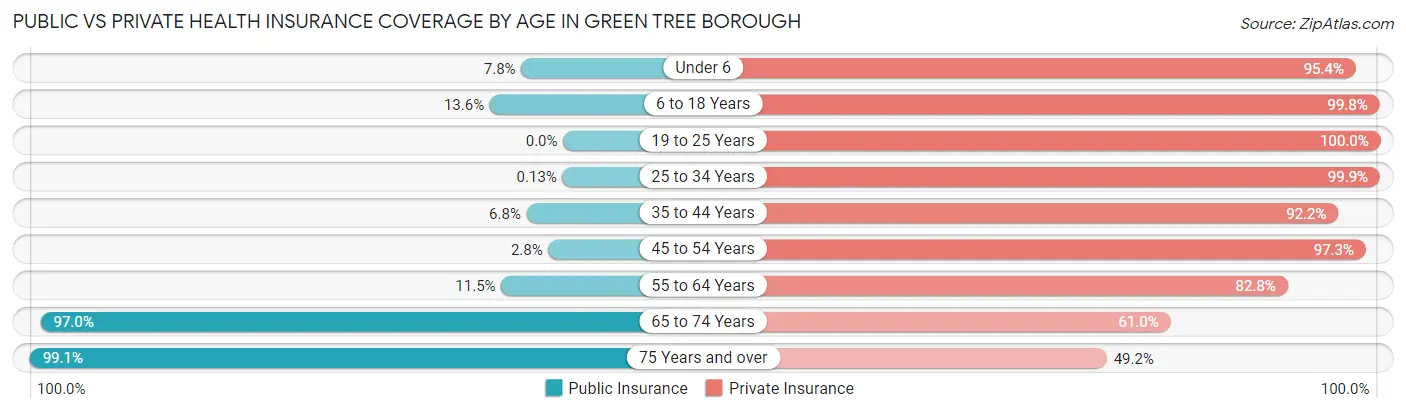
| Age Bracket | Public Insurance | Private Insurance |
| Under 6 | 27 (7.8%) | 331 (95.4%) |
| 6 to 18 Years | 73 (13.6%) | 535 (99.8%) |
| 19 to 25 Years | 0 (0.0%) | 95 (100.0%) |
| 25 to 34 Years | 1 (0.1%) | 774 (99.9%) |
| 35 to 44 Years | 45 (6.8%) | 610 (92.1%) |
| 45 to 54 Years | 12 (2.8%) | 425 (97.3%) |
| 55 to 64 Years | 92 (11.5%) | 662 (82.8%) |
| 65 to 74 Years | 722 (97.0%) | 454 (61.0%) |
| 75 Years and over | 417 (99.1%) | 207 (49.2%) |
| Total | 1,389 (28.8%) | 4,093 (85.0%) |
Disability Status by Sex by Age in Green Tree borough
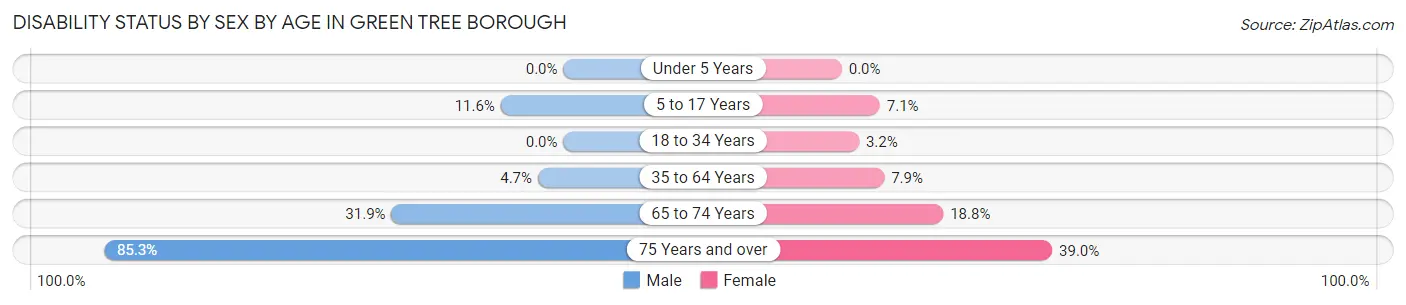
| Age Bracket | Male | Female |
| Under 5 Years | 0 (0.0%) | 0 (0.0%) |
| 5 to 17 Years | 35 (11.6%) | 12 (7.1%) |
| 18 to 34 Years | 0 (0.0%) | 12 (3.2%) |
| 35 to 64 Years | 40 (4.7%) | 83 (7.9%) |
| 65 to 74 Years | 90 (31.9%) | 87 (18.8%) |
| 75 Years and over | 110 (85.3%) | 114 (39.0%) |
Disability Class by Sex by Age in Green Tree borough
Disability Class: Hearing Difficulty
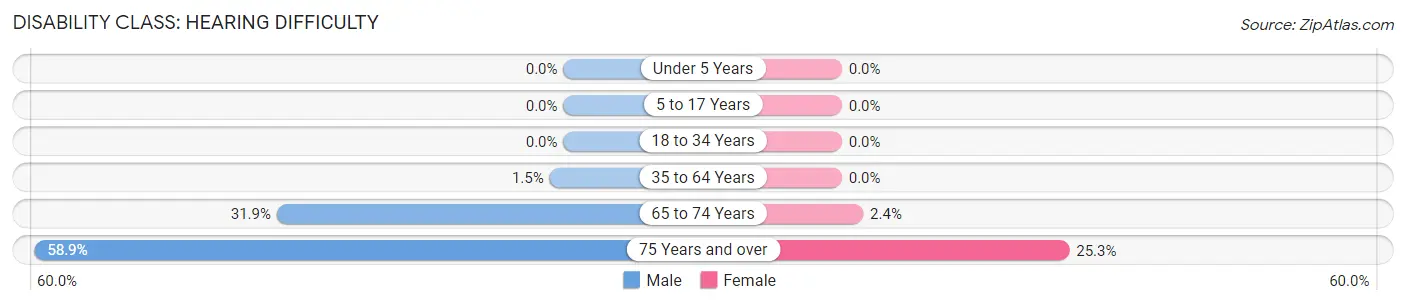
| Age Bracket | Male | Female |
| Under 5 Years | 0 (0.0%) | 0 (0.0%) |
| 5 to 17 Years | 0 (0.0%) | 0 (0.0%) |
| 18 to 34 Years | 0 (0.0%) | 0 (0.0%) |
| 35 to 64 Years | 13 (1.5%) | 0 (0.0%) |
| 65 to 74 Years | 90 (31.9%) | 11 (2.4%) |
| 75 Years and over | 76 (58.9%) | 74 (25.3%) |
Disability Class: Vision Difficulty
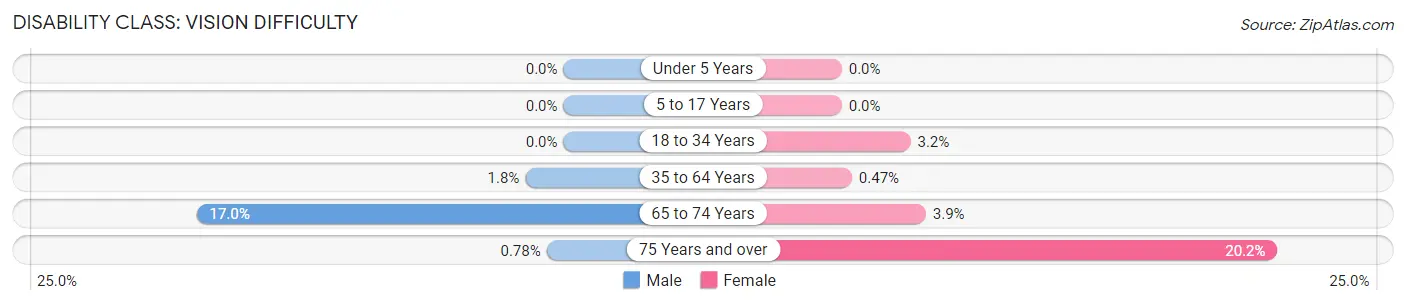
| Age Bracket | Male | Female |
| Under 5 Years | 0 (0.0%) | 0 (0.0%) |
| 5 to 17 Years | 0 (0.0%) | 0 (0.0%) |
| 18 to 34 Years | 0 (0.0%) | 12 (3.2%) |
| 35 to 64 Years | 15 (1.8%) | 5 (0.5%) |
| 65 to 74 Years | 48 (17.0%) | 18 (3.9%) |
| 75 Years and over | 1 (0.8%) | 59 (20.2%) |
Disability Class: Cognitive Difficulty
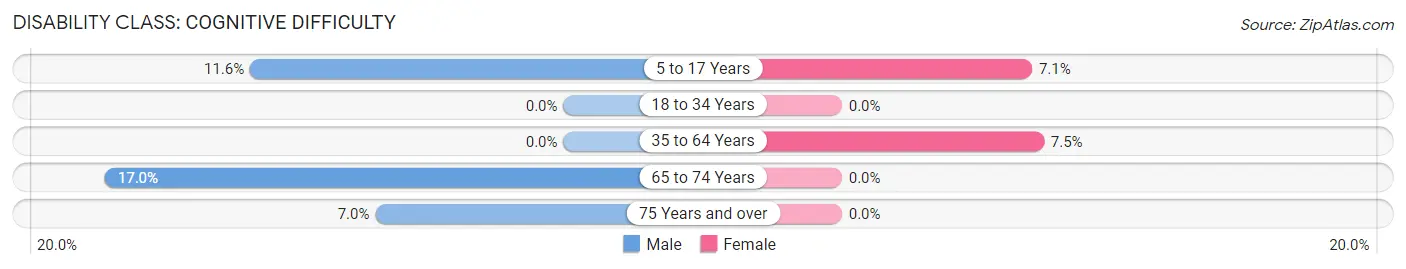
| Age Bracket | Male | Female |
| 5 to 17 Years | 35 (11.6%) | 12 (7.1%) |
| 18 to 34 Years | 0 (0.0%) | 0 (0.0%) |
| 35 to 64 Years | 0 (0.0%) | 79 (7.5%) |
| 65 to 74 Years | 48 (17.0%) | 0 (0.0%) |
| 75 Years and over | 9 (7.0%) | 0 (0.0%) |
Disability Class: Ambulatory Difficulty
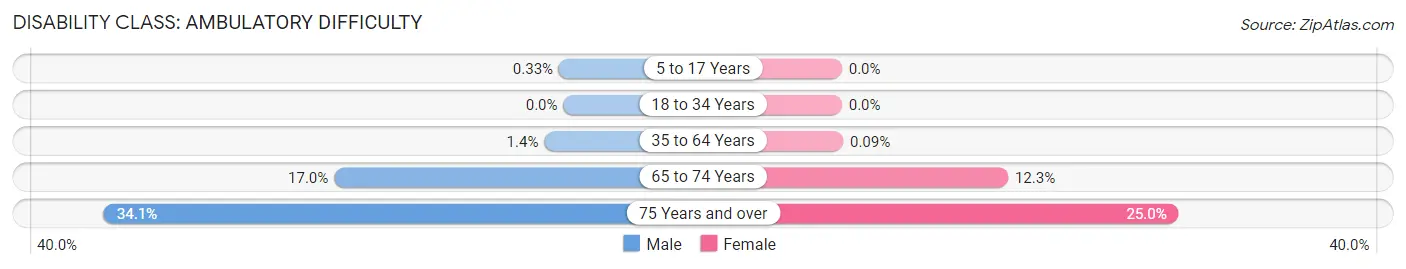
| Age Bracket | Male | Female |
| 5 to 17 Years | 1 (0.3%) | 0 (0.0%) |
| 18 to 34 Years | 0 (0.0%) | 0 (0.0%) |
| 35 to 64 Years | 12 (1.4%) | 1 (0.1%) |
| 65 to 74 Years | 48 (17.0%) | 57 (12.3%) |
| 75 Years and over | 44 (34.1%) | 73 (25.0%) |
Disability Class: Self-Care Difficulty
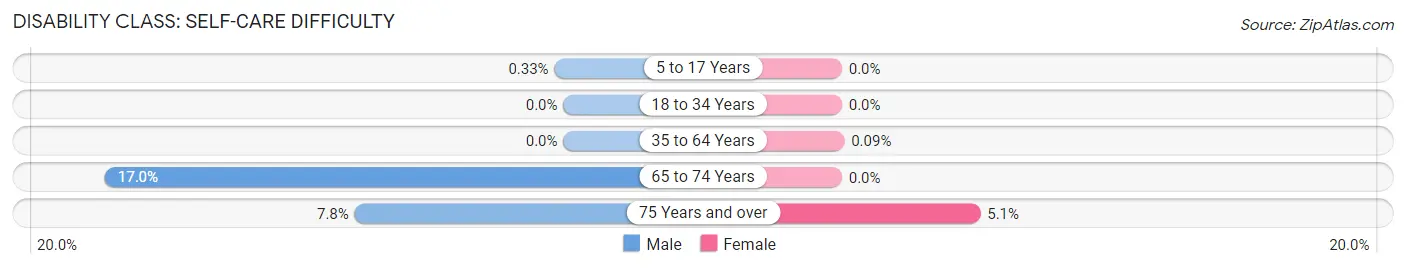
| Age Bracket | Male | Female |
| 5 to 17 Years | 1 (0.3%) | 0 (0.0%) |
| 18 to 34 Years | 0 (0.0%) | 0 (0.0%) |
| 35 to 64 Years | 0 (0.0%) | 1 (0.1%) |
| 65 to 74 Years | 48 (17.0%) | 0 (0.0%) |
| 75 Years and over | 10 (7.7%) | 15 (5.1%) |
Technology Access in Green Tree borough
Computing Device Access in Green Tree borough
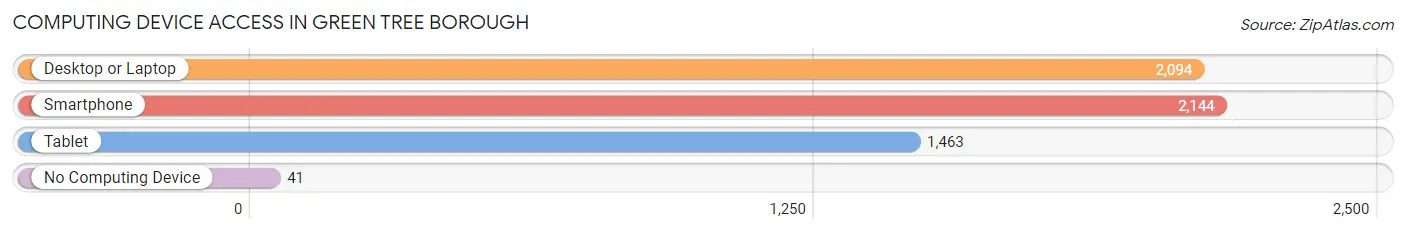
| Device Type | # Households | % Households |
| Desktop or Laptop | 2,094 | 89.7% |
| Smartphone | 2,144 | 91.9% |
| Tablet | 1,463 | 62.7% |
| No Computing Device | 41 | 1.8% |
| Total | 2,334 | 100.0% |
Internet Access in Green Tree borough
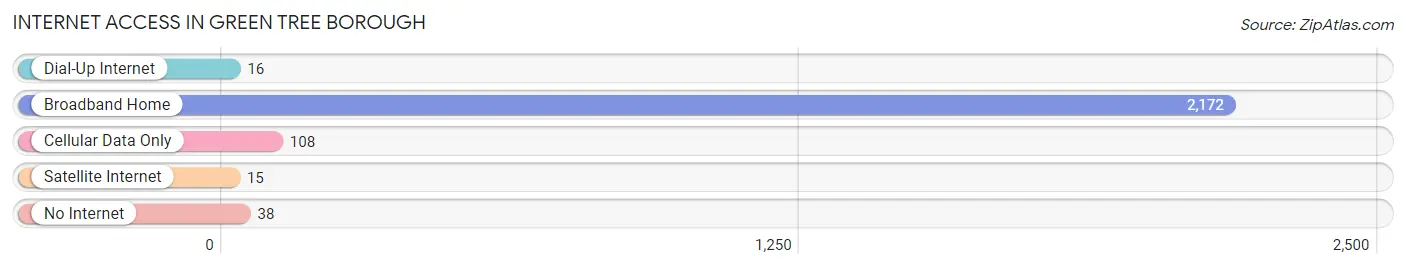
| Internet Type | # Households | % Households |
| Dial-Up Internet | 16 | 0.7% |
| Broadband Home | 2,172 | 93.1% |
| Cellular Data Only | 108 | 4.6% |
| Satellite Internet | 15 | 0.6% |
| No Internet | 38 | 1.6% |
| Total | 2,334 | 100.0% |
Green Tree borough Summary
Green Tree Borough is a small borough located in Allegheny County, Pennsylvania. It is situated along the Allegheny River, just south of Pittsburgh. The borough was incorporated in 1867 and is home to approximately 4,500 people.
Geography
Green Tree Borough is located in the southwestern corner of Allegheny County, Pennsylvania. It is bordered by the city of Pittsburgh to the north, the borough of Dormont to the east, the borough of Mt. Lebanon to the south, and the borough of Rosslyn Farms to the west. The borough is situated along the Allegheny River, and is home to several parks and recreational areas, including the Green Tree Park, which is located along the river.
The borough has a total area of 1.2 square miles, all of which is land. The terrain is mostly flat, with some hills in the northern part of the borough. The climate is humid continental, with hot summers and cold winters.
Economy
Green Tree Borough has a diverse economy, with a mix of retail, manufacturing, and service industries. The largest employers in the borough are the University of Pittsburgh Medical Center, UPMC Presbyterian, and the Allegheny County Airport. Other major employers include the Green Tree Country Club, the Green Tree Golf Course, and the Green Tree Shopping Center.
The median household income in Green Tree Borough is $50,845, and the median home value is $164,400. The unemployment rate is 4.2%, which is lower than the national average.
Demographics
As of the 2010 census, there were 4,432 people, 1,845 households, and 1,093 families residing in the borough. The population density was 3,637.2 people per square mile. The racial makeup of the borough was 94.2% White, 2.2% African American, 0.2% Native American, 1.2% Asian, 0.1% Pacific Islander, 0.7% from other races, and 1.2% from two or more races. Hispanic or Latino of any race were 2.2% of the population.
The median age in the borough was 43.2 years. 22.2% of residents were under the age of 18; 6.2% were between the ages of 18 and 24; 24.2% were from 25 to 44; 28.2% were from 45 to 64; and 19.2% were 65 years of age or older. The gender makeup of the borough was 48.2% male and 51.8% female.
Education
Green Tree Borough is served by the Allegheny County Public Schools system. The borough is home to two elementary schools, Green Tree Elementary School and Dormont Elementary School. There is also one middle school, Green Tree Middle School, and one high school, Dormont High School.
Conclusion
Green Tree Borough is a small borough located in Allegheny County, Pennsylvania. It is situated along the Allegheny River, just south of Pittsburgh. The borough was incorporated in 1867 and is home to approximately 4,500 people. The borough has a diverse economy, with a mix of retail, manufacturing, and service industries. The population is mostly white, with a small percentage of African Americans, Asians, and other races. The borough is served by the Allegheny County Public Schools system, and is home to two elementary schools, one middle school, and one high school.
Common Questions
What is Per Capita Income in Green Tree borough?
Per Capita income in Green Tree borough is $48,814.
What is the Median Family Income in Green Tree borough?
Median Family Income in Green Tree borough is $109,389.
What is the Median Household income in Green Tree borough?
Median Household Income in Green Tree borough is $86,450.
What is Income or Wage Gap in Green Tree borough?
Income or Wage Gap in Green Tree borough is 6.9%.
Women in Green Tree borough earn 93.1 cents for every dollar earned by a man.
What is Inequality or Gini Index in Green Tree borough?
Inequality or Gini Index in Green Tree borough is 0.42.
What is the Total Population of Green Tree borough?
Total Population of Green Tree borough is 4,870.
What is the Total Male Population of Green Tree borough?
Total Male Population of Green Tree borough is 2,383.
What is the Total Female Population of Green Tree borough?
Total Female Population of Green Tree borough is 2,487.
What is the Ratio of Males per 100 Females in Green Tree borough?
There are 95.82 Males per 100 Females in Green Tree borough.
What is the Ratio of Females per 100 Males in Green Tree borough?
There are 104.36 Females per 100 Males in Green Tree borough.
What is the Median Population Age in Green Tree borough?
Median Population Age in Green Tree borough is 44.7 Years.
What is the Average Family Size in Green Tree borough
Average Family Size in Green Tree borough is 2.7 People.
What is the Average Household Size in Green Tree borough
Average Household Size in Green Tree borough is 2.1 People.
How Large is the Labor Force in Green Tree borough?
There are 2,936 People in the Labor Forcein in Green Tree borough.
What is the Percentage of People in the Labor Force in Green Tree borough?
70.9% of People are in the Labor Force in Green Tree borough.