Enola, PA Map & Demographics
Enola Map
Enola Overview
$35,360
PER CAPITA INCOME
$76,291
AVG FAMILY INCOME
$65,517
AVG HOUSEHOLD INCOME
26.9%
WAGE / INCOME GAP [ % ]
73.1¢/ $1
WAGE / INCOME GAP [ $ ]
0.37
INEQUALITY / GINI INDEX
5,986
TOTAL POPULATION
3,154
MALE POPULATION
2,832
FEMALE POPULATION
111.37
MALES / 100 FEMALES
89.79
FEMALES / 100 MALES
35.8
MEDIAN AGE
3.2
AVG FAMILY SIZE
2.2
AVG HOUSEHOLD SIZE
3,861
LABOR FORCE [ PEOPLE ]
75.7%
PERCENT IN LABOR FORCE
6.8%
UNEMPLOYMENT RATE
Enola Zip Codes
Enola Area Codes
Income in Enola
Income Overview in Enola
Per Capita Income in Enola is $35,360, while median incomes of families and households are $76,291 and $65,517 respectively.
| Characteristic | Number | Measure |
| Per Capita Income | 5,986 | $35,360 |
| Median Family Income | 1,217 | $76,291 |
| Mean Family Income | 1,217 | $92,192 |
| Median Household Income | 2,610 | $65,517 |
| Mean Household Income | 2,610 | $75,768 |
| Income Deficit | 1,217 | $0 |
| Wage / Income Gap (%) | 5,986 | 26.88% |
| Wage / Income Gap ($) | 5,986 | 73.12¢ per $1 |
| Gini / Inequality Index | 5,986 | 0.37 |
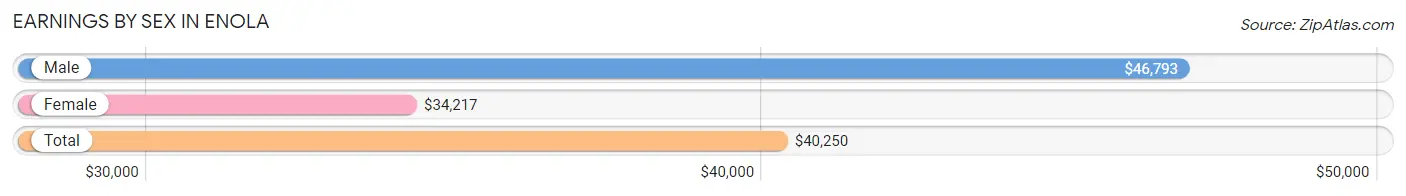
Earnings by Sex in Enola
Average Earnings in Enola are $40,250, $46,793 for men and $34,217 for women, a difference of 26.9%.
| Sex | Number | Average Earnings |
| Male | 2,036 (53.1%) | $46,793 |
| Female | 1,797 (46.9%) | $34,217 |
| Total | 3,833 (100.0%) | $40,250 |
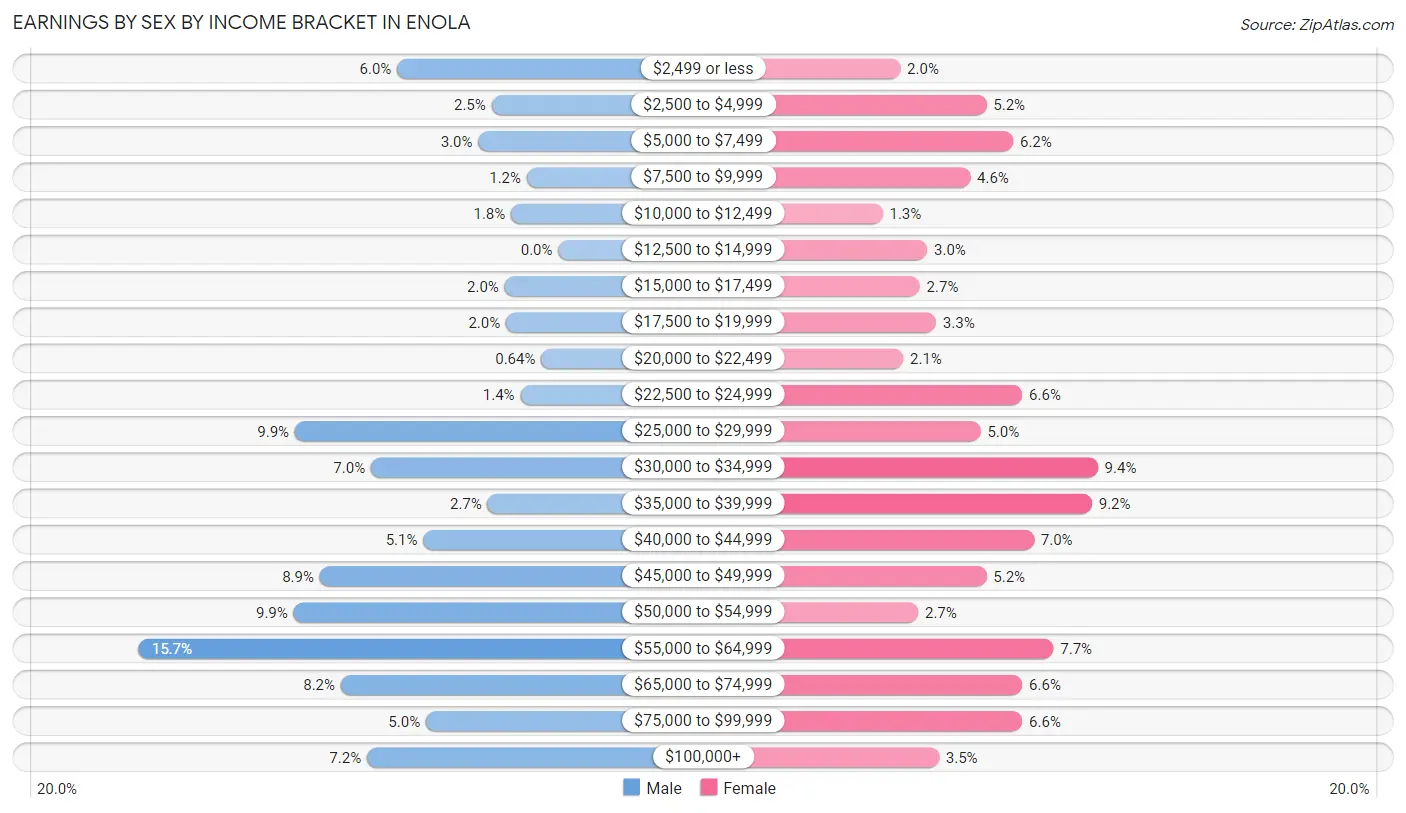
Earnings by Sex by Income Bracket in Enola
The most common earnings brackets in Enola are $55,000 to $64,999 for men (320 | 15.7%) and $30,000 to $34,999 for women (169 | 9.4%).
| Income | Male | Female |
| $2,499 or less | 123 (6.0%) | 36 (2.0%) |
| $2,500 to $4,999 | 51 (2.5%) | 94 (5.2%) |
| $5,000 to $7,499 | 61 (3.0%) | 112 (6.2%) |
| $7,500 to $9,999 | 24 (1.2%) | 83 (4.6%) |
| $10,000 to $12,499 | 36 (1.8%) | 24 (1.3%) |
| $12,500 to $14,999 | 0 (0.0%) | 54 (3.0%) |
| $15,000 to $17,499 | 41 (2.0%) | 49 (2.7%) |
| $17,500 to $19,999 | 40 (2.0%) | 60 (3.3%) |
| $20,000 to $22,499 | 13 (0.6%) | 38 (2.1%) |
| $22,500 to $24,999 | 29 (1.4%) | 118 (6.6%) |
| $25,000 to $29,999 | 201 (9.9%) | 90 (5.0%) |
| $30,000 to $34,999 | 143 (7.0%) | 169 (9.4%) |
| $35,000 to $39,999 | 54 (2.6%) | 165 (9.2%) |
| $40,000 to $44,999 | 103 (5.1%) | 126 (7.0%) |
| $45,000 to $49,999 | 182 (8.9%) | 94 (5.2%) |
| $50,000 to $54,999 | 202 (9.9%) | 48 (2.7%) |
| $55,000 to $64,999 | 320 (15.7%) | 139 (7.7%) |
| $65,000 to $74,999 | 166 (8.2%) | 118 (6.6%) |
| $75,000 to $99,999 | 101 (5.0%) | 118 (6.6%) |
| $100,000+ | 146 (7.2%) | 62 (3.5%) |
| Total | 2,036 (100.0%) | 1,797 (100.0%) |
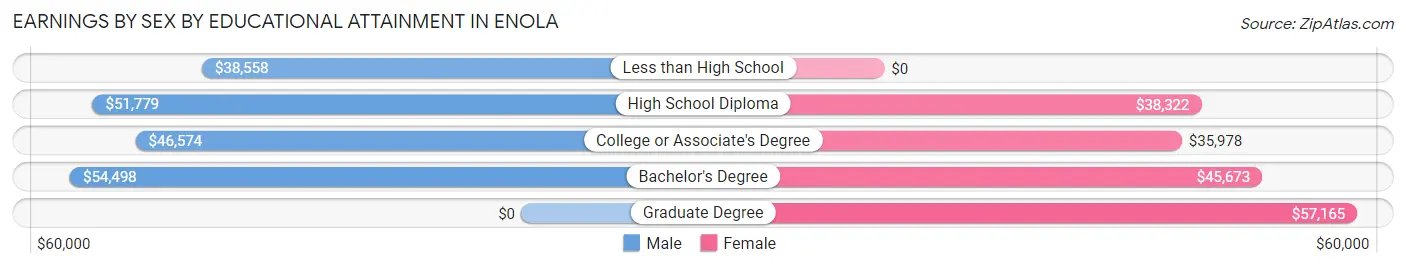
Earnings by Sex by Educational Attainment in Enola
Average earnings in Enola are $53,318 for men and $39,893 for women, a difference of 25.2%. Men with an educational attainment of bachelor's degree enjoy the highest average annual earnings of $54,498, while those with less than high school education earn the least with $38,558. Women with an educational attainment of graduate degree earn the most with the average annual earnings of $57,165, while those with college or associate's degree education have the smallest earnings of $35,978.
| Educational Attainment | Male Income | Female Income |
| Less than High School | $38,558 | $0 |
| High School Diploma | $51,779 | $38,322 |
| College or Associate's Degree | $46,574 | $35,978 |
| Bachelor's Degree | $54,498 | $45,673 |
| Graduate Degree | - | - |
| Total | $53,318 | $39,893 |
Family Income in Enola
Family Income Brackets in Enola
According to the Enola family income data, there are 288 families falling into the $100,000 to $149,999 income range, which is the most common income bracket and makes up 23.7% of all families.
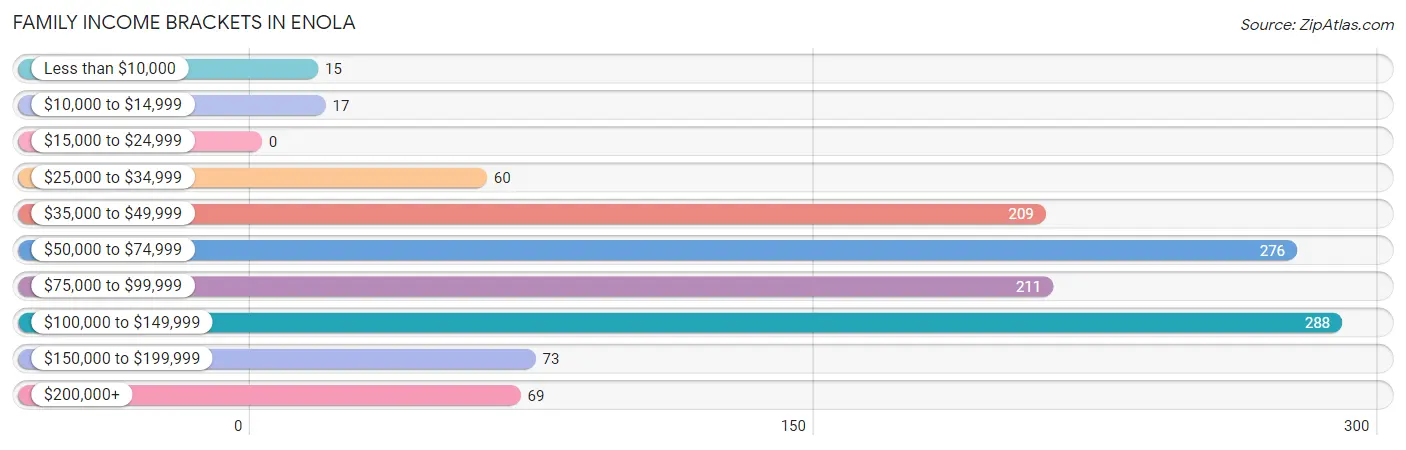
| Income Bracket | # Families | % Families |
| Less than $10,000 | 15 | 1.2% |
| $10,000 to $14,999 | 17 | 1.4% |
| $15,000 to $24,999 | 0 | 0.0% |
| $25,000 to $34,999 | 60 | 4.9% |
| $35,000 to $49,999 | 209 | 17.2% |
| $50,000 to $74,999 | 276 | 22.7% |
| $75,000 to $99,999 | 211 | 17.3% |
| $100,000 to $149,999 | 288 | 23.7% |
| $150,000 to $199,999 | 73 | 6.0% |
| $200,000+ | 69 | 5.7% |
Family Income by Famaliy Size in Enola
4-person families (239 | 19.6%) account for the highest median family income in Enola with $106,348 per family, while 4-person families (239 | 19.6%) have the highest median income of $26,587 per family member.
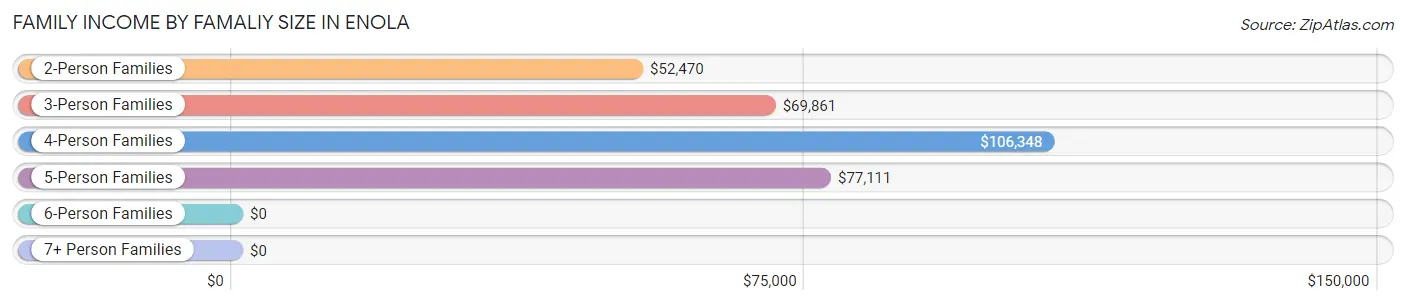
| Income Bracket | # Families | Median Income |
| 2-Person Families | 543 (44.6%) | $52,470 |
| 3-Person Families | 290 (23.8%) | $69,861 |
| 4-Person Families | 239 (19.6%) | $106,348 |
| 5-Person Families | 145 (11.9%) | $77,111 |
| 6-Person Families | 0 (0.0%) | $0 |
| 7+ Person Families | 0 (0.0%) | $0 |
| Total | 1,217 (100.0%) | $76,291 |
Family Income by Number of Earners in Enola
The median family income in Enola is $76,291, with families comprising 3+ earners (193) having the highest median family income of $106,740, while families with no earners (195) have the lowest median family income of $35,777, accounting for 15.9% and 16.0% of families, respectively.
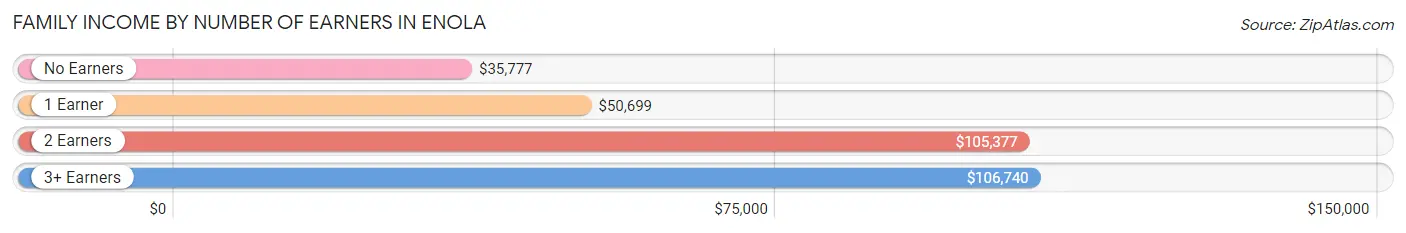
| Number of Earners | # Families | Median Income |
| No Earners | 195 (16.0%) | $35,777 |
| 1 Earner | 281 (23.1%) | $50,699 |
| 2 Earners | 548 (45.0%) | $105,377 |
| 3+ Earners | 193 (15.9%) | $106,740 |
| Total | 1,217 (100.0%) | $76,291 |
Household Income in Enola
Household Income Brackets in Enola
With 718 households falling in the category, the $50,000 to $74,999 income range is the most frequent in Enola, accounting for 27.5% of all households. In contrast, only 44 households (1.7%) fall into the $15,000 to $24,999 income bracket, making it the least populous group.
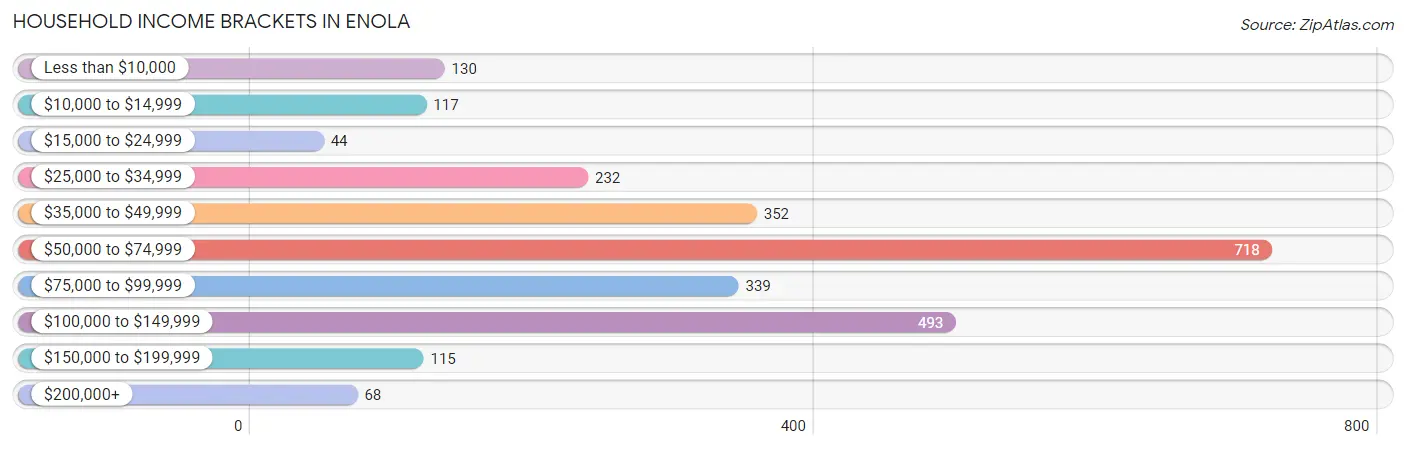
| Income Bracket | # Households | % Households |
| Less than $10,000 | 130 | 5.0% |
| $10,000 to $14,999 | 117 | 4.5% |
| $15,000 to $24,999 | 44 | 1.7% |
| $25,000 to $34,999 | 232 | 8.9% |
| $35,000 to $49,999 | 352 | 13.5% |
| $50,000 to $74,999 | 718 | 27.5% |
| $75,000 to $99,999 | 339 | 13.0% |
| $100,000 to $149,999 | 493 | 18.9% |
| $150,000 to $199,999 | 115 | 4.4% |
| $200,000+ | 68 | 2.6% |
Household Income by Householder Age in Enola
The median household income in Enola is $65,517, with the highest median household income of $76,967 found in the 45 to 64 years age bracket for the primary householder. A total of 838 households (32.1%) fall into this category. Meanwhile, the 15 to 24 years age bracket for the primary householder has the lowest median household income of $0, with 98 households (3.7%) in this group.
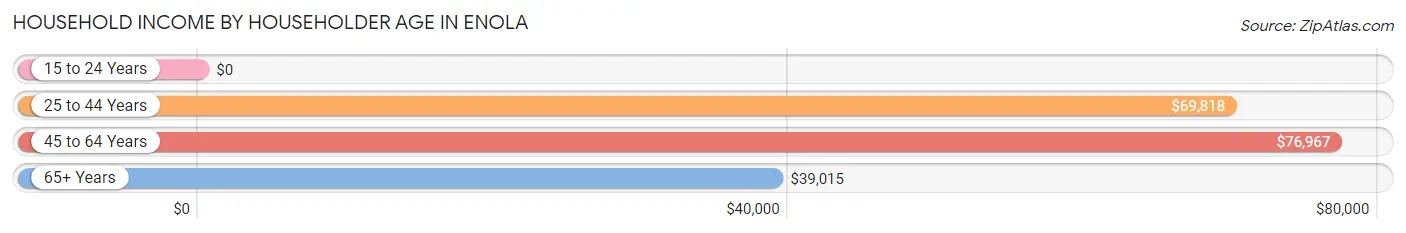
| Income Bracket | # Households | Median Income |
| 15 to 24 Years | 98 (3.7%) | $0 |
| 25 to 44 Years | 1,124 (43.1%) | $69,818 |
| 45 to 64 Years | 838 (32.1%) | $76,967 |
| 65+ Years | 550 (21.1%) | $39,015 |
| Total | 2,610 (100.0%) | $65,517 |
Poverty in Enola
Income Below Poverty by Sex and Age in Enola
With 4.9% poverty level for males and 10.0% for females among the residents of Enola, 65 to 74 year old males and 16 and 17 year old females are the most vulnerable to poverty, with 60 males (19.3%) and 16 females (100.0%) in their respective age groups living below the poverty level.
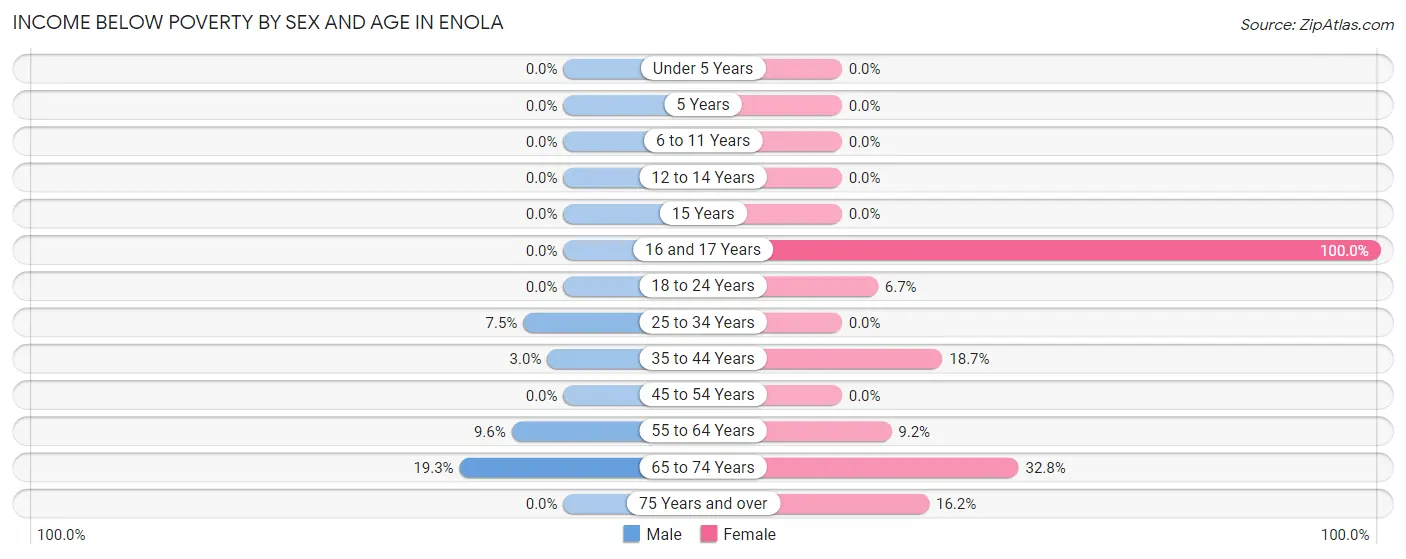
| Age Bracket | Male | Female |
| Under 5 Years | 0 (0.0%) | 0 (0.0%) |
| 5 Years | 0 (0.0%) | 0 (0.0%) |
| 6 to 11 Years | 0 (0.0%) | 0 (0.0%) |
| 12 to 14 Years | 0 (0.0%) | 0 (0.0%) |
| 15 Years | 0 (0.0%) | 0 (0.0%) |
| 16 and 17 Years | 0 (0.0%) | 16 (100.0%) |
| 18 to 24 Years | 0 (0.0%) | 16 (6.7%) |
| 25 to 34 Years | 47 (7.5%) | 0 (0.0%) |
| 35 to 44 Years | 8 (3.0%) | 90 (18.7%) |
| 45 to 54 Years | 0 (0.0%) | 0 (0.0%) |
| 55 to 64 Years | 32 (9.6%) | 31 (9.2%) |
| 65 to 74 Years | 60 (19.3%) | 84 (32.8%) |
| 75 Years and over | 0 (0.0%) | 29 (16.2%) |
| Total | 147 (4.9%) | 266 (10.0%) |
Income Above Poverty by Sex and Age in Enola
According to the poverty statistics in Enola, males aged under 5 years and females aged under 5 years are the age groups that are most secure financially, with 100.0% of males and 100.0% of females in these age groups living above the poverty line.
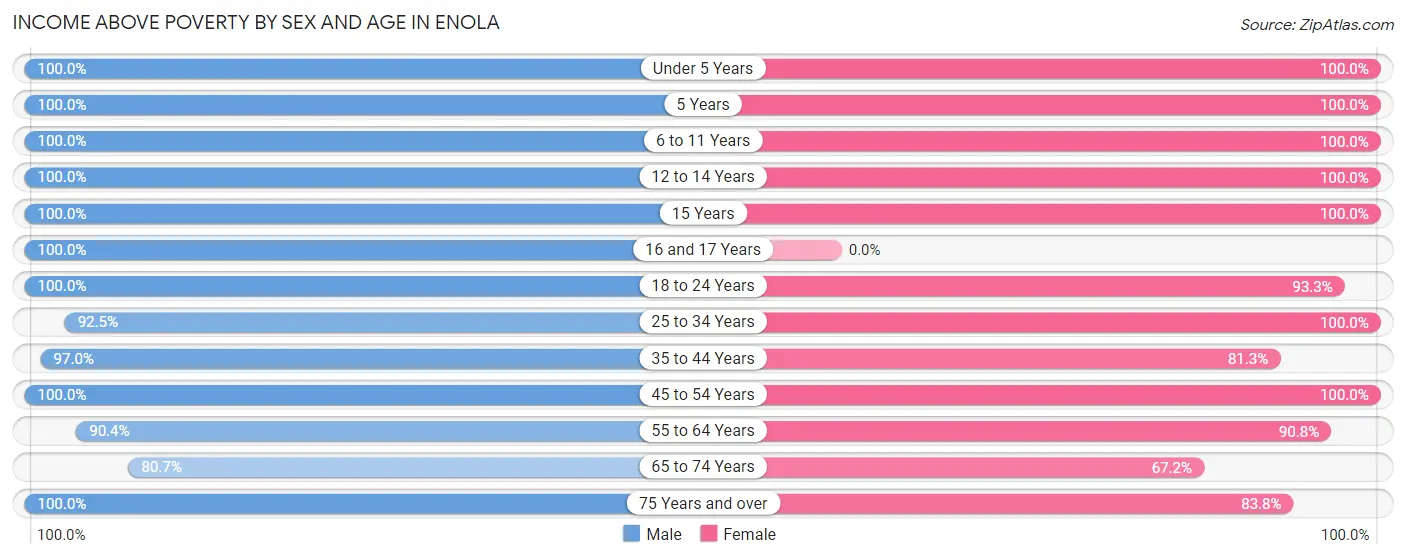
| Age Bracket | Male | Female |
| Under 5 Years | 101 (100.0%) | 118 (100.0%) |
| 5 Years | 47 (100.0%) | 11 (100.0%) |
| 6 to 11 Years | 171 (100.0%) | 108 (100.0%) |
| 12 to 14 Years | 137 (100.0%) | 75 (100.0%) |
| 15 Years | 41 (100.0%) | 77 (100.0%) |
| 16 and 17 Years | 11 (100.0%) | 0 (0.0%) |
| 18 to 24 Years | 402 (100.0%) | 223 (93.3%) |
| 25 to 34 Years | 583 (92.5%) | 428 (100.0%) |
| 35 to 44 Years | 260 (97.0%) | 392 (81.3%) |
| 45 to 54 Years | 421 (100.0%) | 348 (100.0%) |
| 55 to 64 Years | 301 (90.4%) | 306 (90.8%) |
| 65 to 74 Years | 251 (80.7%) | 172 (67.2%) |
| 75 Years and over | 156 (100.0%) | 150 (83.8%) |
| Total | 2,882 (95.2%) | 2,408 (90.0%) |
Income Below Poverty Among Married-Couple Families in Enola
The poverty statistics for married-couple families in Enola show that 3.3% or 32 of the total 978 families live below the poverty line. Families with no children have the highest poverty rate of 6.3%, comprising of 32 families. On the other hand, families with 1 or 2 children have the lowest poverty rate of 0.0%, which includes 0 families.
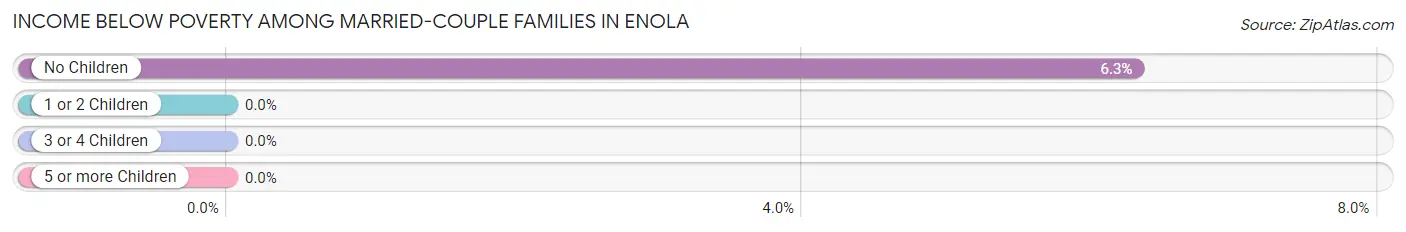
| Children | Above Poverty | Below Poverty |
| No Children | 475 (93.7%) | 32 (6.3%) |
| 1 or 2 Children | 424 (100.0%) | 0 (0.0%) |
| 3 or 4 Children | 47 (100.0%) | 0 (0.0%) |
| 5 or more Children | 0 (0.0%) | 0 (0.0%) |
| Total | 946 (96.7%) | 32 (3.3%) |
Income Below Poverty Among Single-Parent Households in Enola
| Children | Single Father | Single Mother |
| No Children | 0 (0.0%) | 0 (0.0%) |
| 1 or 2 Children | 0 (0.0%) | 0 (0.0%) |
| 3 or 4 Children | 0 (0.0%) | 0 (0.0%) |
| 5 or more Children | 0 (0.0%) | 0 (0.0%) |
| Total | 0 (0.0%) | 0 (0.0%) |
Income Below Poverty Among Married-Couple vs Single-Parent Households in Enola
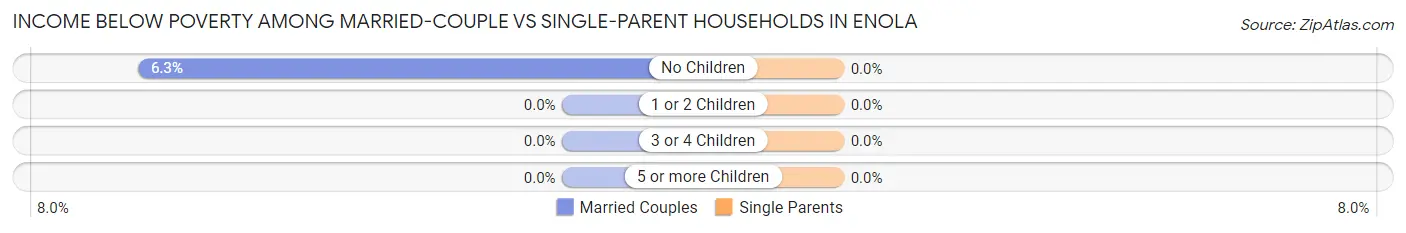
| Children | Married-Couple Families | Single-Parent Households |
| No Children | 32 (6.3%) | 0 (0.0%) |
| 1 or 2 Children | 0 (0.0%) | 0 (0.0%) |
| 3 or 4 Children | 0 (0.0%) | 0 (0.0%) |
| 5 or more Children | 0 (0.0%) | 0 (0.0%) |
| Total | 32 (3.3%) | 0 (0.0%) |
Race in Enola
The most populous races in Enola are White / Caucasian (4,929 | 82.3%), Black / African American (616 | 10.3%), and Hispanic or Latino (504 | 8.4%).
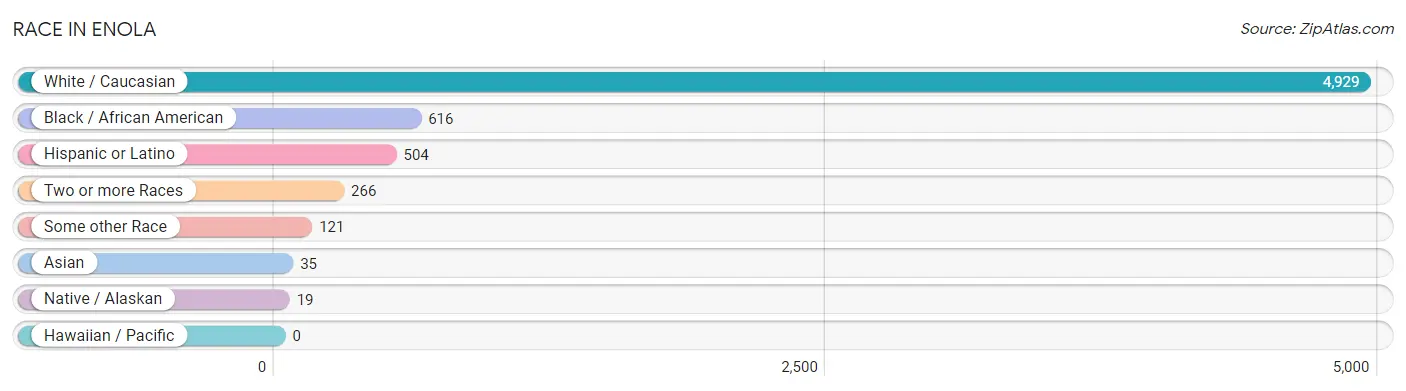
| Race | # Population | % Population |
| Asian | 35 | 0.6% |
| Black / African American | 616 | 10.3% |
| Hawaiian / Pacific | 0 | 0.0% |
| Hispanic or Latino | 504 | 8.4% |
| Native / Alaskan | 19 | 0.3% |
| White / Caucasian | 4,929 | 82.3% |
| Two or more Races | 266 | 4.4% |
| Some other Race | 121 | 2.0% |
| Total | 5,986 | 100.0% |
Ancestry in Enola
The most populous ancestries reported in Enola are German (1,663 | 27.8%), Irish (928 | 15.5%), American (561 | 9.4%), Italian (480 | 8.0%), and English (359 | 6.0%), together accounting for 66.7% of all Enola residents.
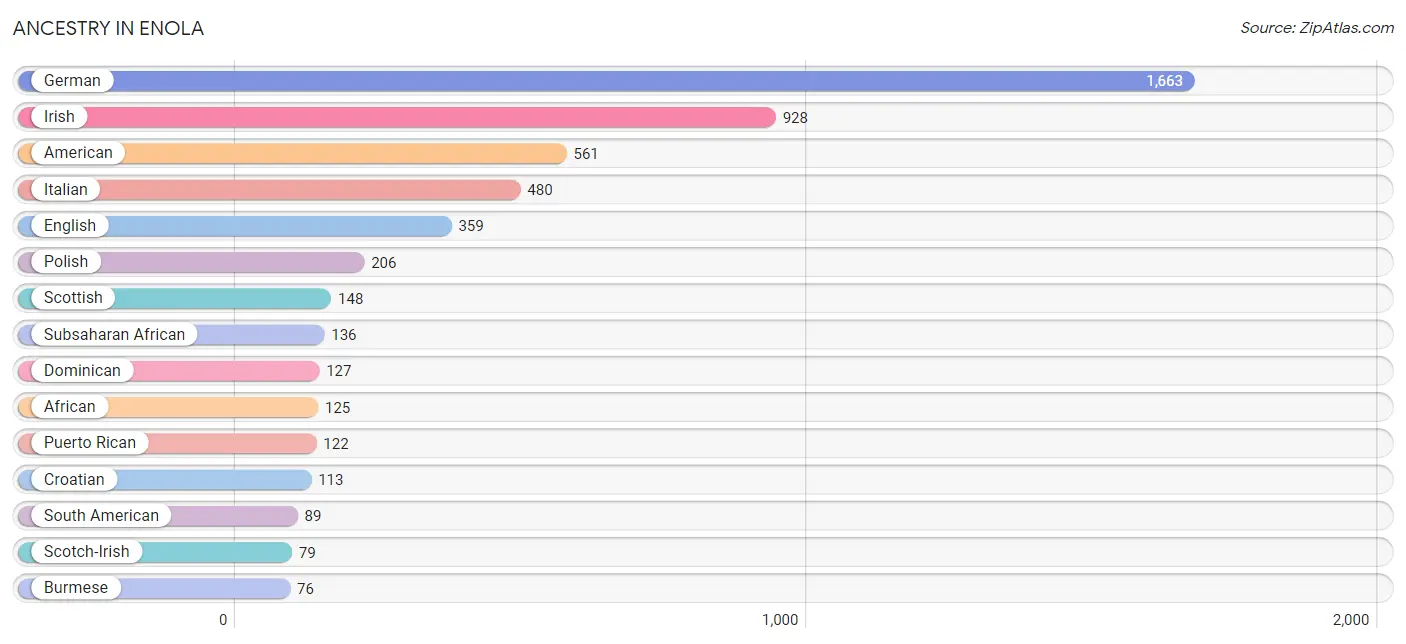
| Ancestry | # Population | % Population |
| African | 125 | 2.1% |
| American | 561 | 9.4% |
| Arab | 19 | 0.3% |
| Austrian | 11 | 0.2% |
| Brazilian | 26 | 0.4% |
| British | 13 | 0.2% |
| Burmese | 76 | 1.3% |
| Central American | 31 | 0.5% |
| Central American Indian | 19 | 0.3% |
| Cherokee | 52 | 0.9% |
| Chilean | 52 | 0.9% |
| Croatian | 113 | 1.9% |
| Dominican | 127 | 2.1% |
| English | 359 | 6.0% |
| European | 47 | 0.8% |
| Filipino | 33 | 0.5% |
| French | 66 | 1.1% |
| German | 1,663 | 27.8% |
| Greek | 2 | 0.0% |
| Guatemalan | 19 | 0.3% |
| Honduran | 3 | 0.1% |
| Hungarian | 25 | 0.4% |
| Indian (Asian) | 7 | 0.1% |
| Irish | 928 | 15.5% |
| Italian | 480 | 8.0% |
| Jamaican | 47 | 0.8% |
| Korean | 5 | 0.1% |
| Lebanese | 5 | 0.1% |
| Liberian | 5 | 0.1% |
| Lithuanian | 57 | 0.9% |
| Moroccan | 14 | 0.2% |
| Norwegian | 12 | 0.2% |
| Pakistani | 7 | 0.1% |
| Pennsylvania German | 69 | 1.1% |
| Peruvian | 37 | 0.6% |
| Polish | 206 | 3.4% |
| Puerto Rican | 122 | 2.0% |
| Salvadoran | 9 | 0.2% |
| Scotch-Irish | 79 | 1.3% |
| Scottish | 148 | 2.5% |
| Serbian | 34 | 0.6% |
| Slovak | 10 | 0.2% |
| South American | 89 | 1.5% |
| Subsaharan African | 136 | 2.3% |
| Swedish | 9 | 0.2% |
| Swiss | 13 | 0.2% |
| Thai | 6 | 0.1% |
| Ukrainian | 14 | 0.2% |
| Welsh | 24 | 0.4% |
| Yugoslavian | 34 | 0.6% | View All 50 Rows |
Immigrants in Enola
The most numerous immigrant groups reported in Enola came from Africa (149 | 2.5%), Latin America (139 | 2.3%), Eastern Africa (130 | 2.2%), South America (106 | 1.8%), and Bosnia and Herzegovina (55 | 0.9%), together accounting for 9.7% of all Enola residents.
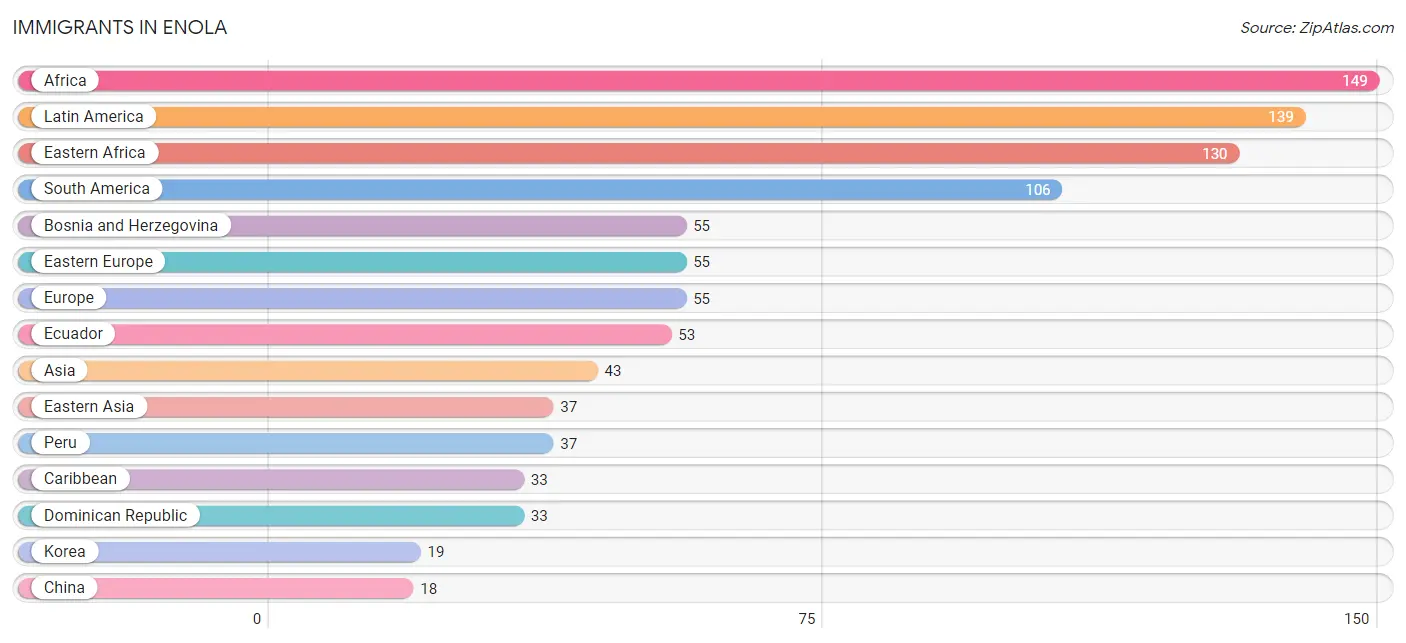
| Immigration Origin | # Population | % Population |
| Africa | 149 | 2.5% |
| Asia | 43 | 0.7% |
| Bosnia and Herzegovina | 55 | 0.9% |
| Brazil | 16 | 0.3% |
| Caribbean | 33 | 0.5% |
| China | 18 | 0.3% |
| Dominican Republic | 33 | 0.5% |
| Eastern Africa | 130 | 2.2% |
| Eastern Asia | 37 | 0.6% |
| Eastern Europe | 55 | 0.9% |
| Ecuador | 53 | 0.9% |
| Europe | 55 | 0.9% |
| India | 6 | 0.1% |
| Korea | 19 | 0.3% |
| Latin America | 139 | 2.3% |
| Liberia | 5 | 0.1% |
| Morocco | 14 | 0.2% |
| Northern Africa | 14 | 0.2% |
| Peru | 37 | 0.6% |
| South America | 106 | 1.8% |
| South Central Asia | 6 | 0.1% |
| Taiwan | 11 | 0.2% |
| Western Africa | 5 | 0.1% | View All 23 Rows |
Sex and Age in Enola
Sex and Age in Enola
The most populous age groups in Enola are 30 to 34 Years (338 | 10.7%) for men and 20 to 24 Years (288 | 10.2%) for women.
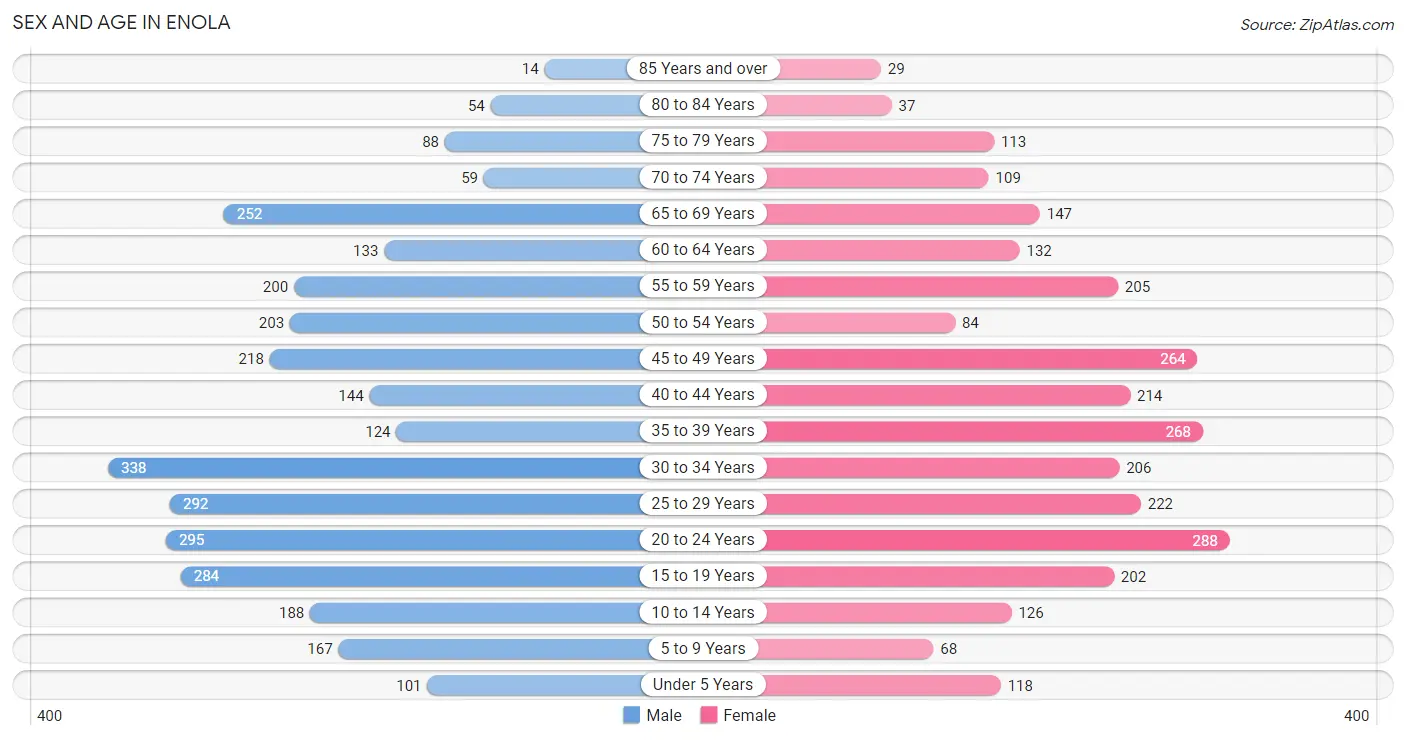
| Age Bracket | Male | Female |
| Under 5 Years | 101 (3.2%) | 118 (4.2%) |
| 5 to 9 Years | 167 (5.3%) | 68 (2.4%) |
| 10 to 14 Years | 188 (6.0%) | 126 (4.4%) |
| 15 to 19 Years | 284 (9.0%) | 202 (7.1%) |
| 20 to 24 Years | 295 (9.3%) | 288 (10.2%) |
| 25 to 29 Years | 292 (9.3%) | 222 (7.8%) |
| 30 to 34 Years | 338 (10.7%) | 206 (7.3%) |
| 35 to 39 Years | 124 (3.9%) | 268 (9.5%) |
| 40 to 44 Years | 144 (4.6%) | 214 (7.6%) |
| 45 to 49 Years | 218 (6.9%) | 264 (9.3%) |
| 50 to 54 Years | 203 (6.4%) | 84 (3.0%) |
| 55 to 59 Years | 200 (6.3%) | 205 (7.2%) |
| 60 to 64 Years | 133 (4.2%) | 132 (4.7%) |
| 65 to 69 Years | 252 (8.0%) | 147 (5.2%) |
| 70 to 74 Years | 59 (1.9%) | 109 (3.8%) |
| 75 to 79 Years | 88 (2.8%) | 113 (4.0%) |
| 80 to 84 Years | 54 (1.7%) | 37 (1.3%) |
| 85 Years and over | 14 (0.4%) | 29 (1.0%) |
| Total | 3,154 (100.0%) | 2,832 (100.0%) |
Families and Households in Enola
Median Family Size in Enola
The median family size in Enola is 3.16 persons per family, with single female/mother families (164 | 13.5%) accounting for the largest median family size of 3.18 persons per family. On the other hand, single male/father families (75 | 6.2%) represent the smallest median family size with 3.11 persons per family.
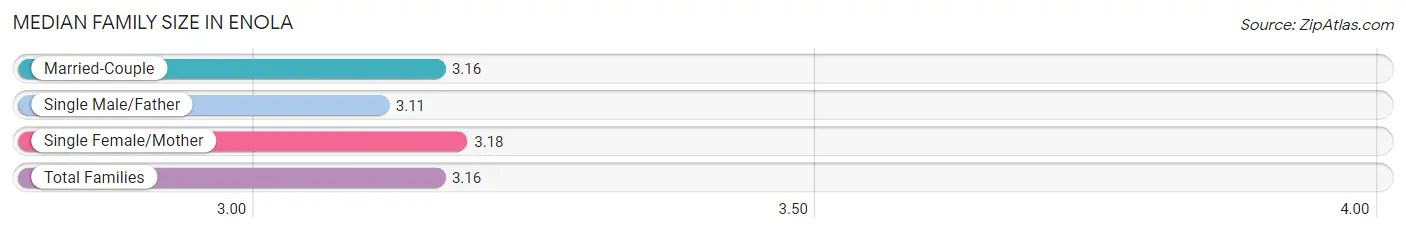
| Family Type | # Families | Family Size |
| Married-Couple | 978 (80.4%) | 3.16 |
| Single Male/Father | 75 (6.2%) | 3.11 |
| Single Female/Mother | 164 (13.5%) | 3.18 |
| Total Families | 1,217 (100.0%) | 3.16 |
Median Household Size in Enola
The median household size in Enola is 2.19 persons per household, with single male/father households (75 | 2.9%) accounting for the largest median household size of 3.75 persons per household. non-family households (1,393 | 53.4%) represent the smallest median household size with 1.28 persons per household.
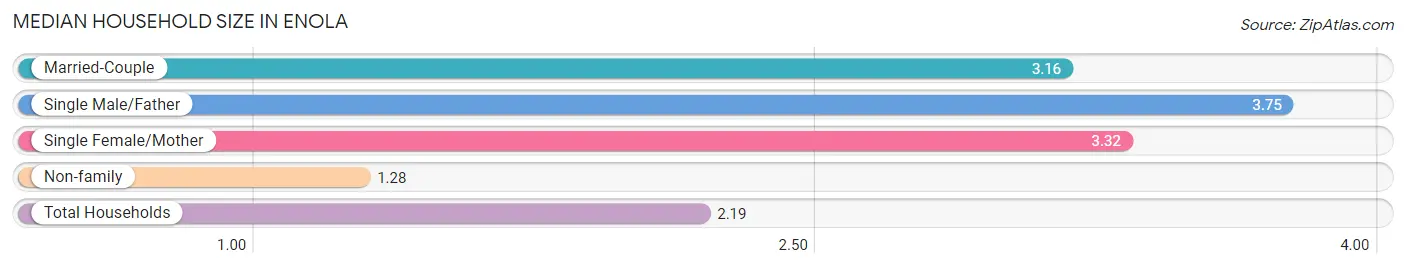
| Household Type | # Households | Household Size |
| Married-Couple | 978 (37.5%) | 3.16 |
| Single Male/Father | 75 (2.9%) | 3.75 |
| Single Female/Mother | 164 (6.3%) | 3.32 |
| Non-family | 1,393 (53.4%) | 1.28 |
| Total Households | 2,610 (100.0%) | 2.19 |
Household Size by Marriage Status in Enola
Out of a total of 2,610 households in Enola, 1,217 (46.6%) are family households, while 1,393 (53.4%) are nonfamily households. The most numerous type of family households are 2-person households, comprising 510, and the most common type of nonfamily households are 1-person households, comprising 1,073.
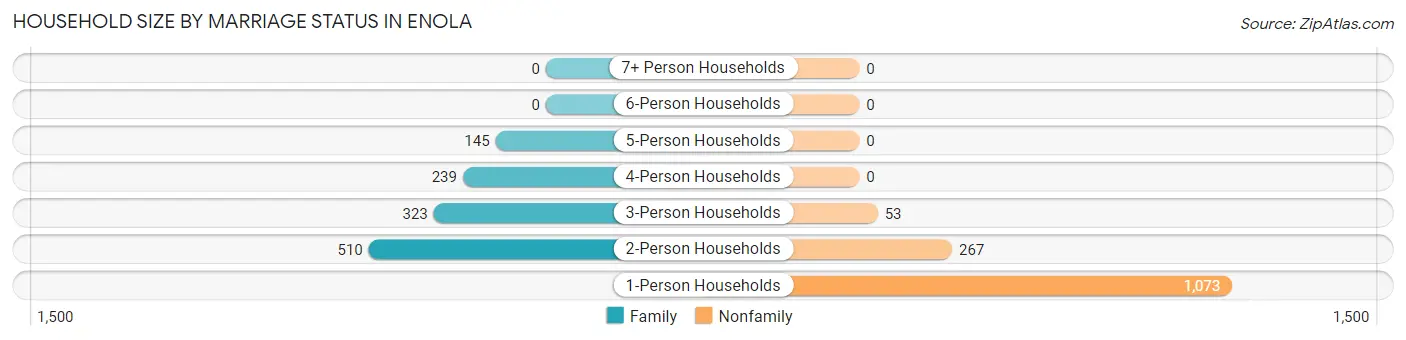
| Household Size | Family Households | Nonfamily Households |
| 1-Person Households | - | 1,073 (41.1%) |
| 2-Person Households | 510 (19.5%) | 267 (10.2%) |
| 3-Person Households | 323 (12.4%) | 53 (2.0%) |
| 4-Person Households | 239 (9.2%) | 0 (0.0%) |
| 5-Person Households | 145 (5.6%) | 0 (0.0%) |
| 6-Person Households | 0 (0.0%) | 0 (0.0%) |
| 7+ Person Households | 0 (0.0%) | 0 (0.0%) |
| Total | 1,217 (46.6%) | 1,393 (53.4%) |
Female Fertility in Enola
Fertility by Age in Enola
Average fertility rate in Enola is 37.0 births per 1,000 women. Women in the age bracket of 20 to 34 years have the highest fertility rate with 87.0 births per 1,000 women. Women in the age bracket of 20 to 34 years acount for 100.0% of all women with births.
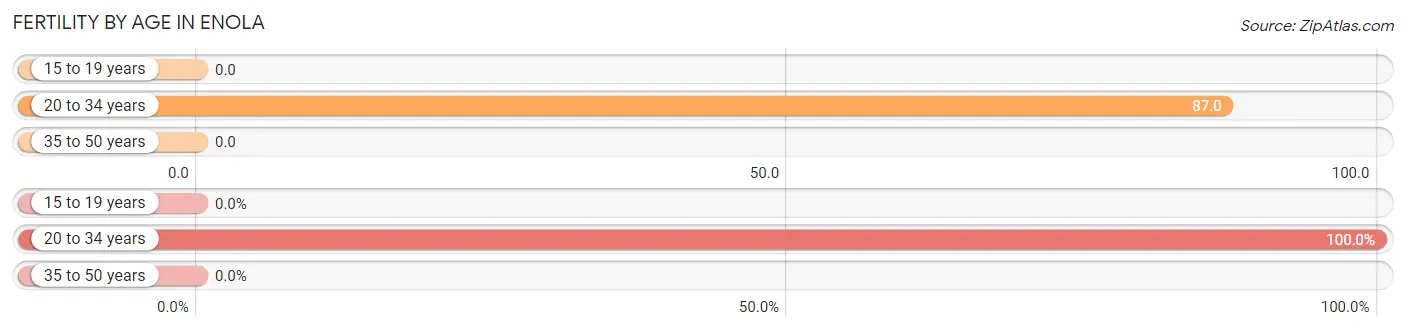
| Age Bracket | Women with Births | Births / 1,000 Women |
| 15 to 19 years | 0 (0.0%) | 0.0 |
| 20 to 34 years | 62 (100.0%) | 87.0 |
| 35 to 50 years | 0 (0.0%) | 0.0 |
| Total | 62 (100.0%) | 37.0 |
Fertility by Age by Marriage Status in Enola
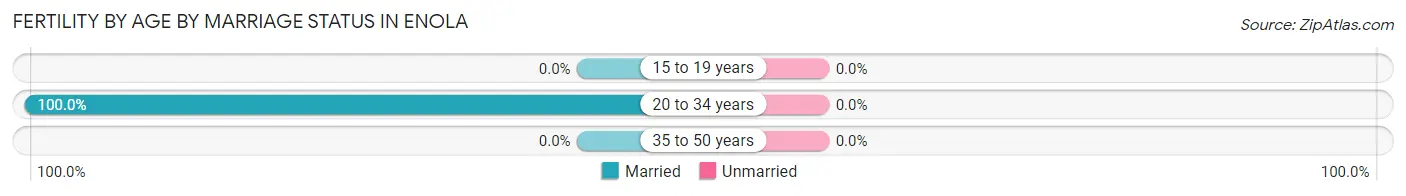
| Age Bracket | Married | Unmarried |
| 15 to 19 years | 0 (0.0%) | 0 (0.0%) |
| 20 to 34 years | 62 (100.0%) | 0 (0.0%) |
| 35 to 50 years | 0 (0.0%) | 0 (0.0%) |
| Total | 62 (100.0%) | 0 (0.0%) |
Fertility by Education in Enola
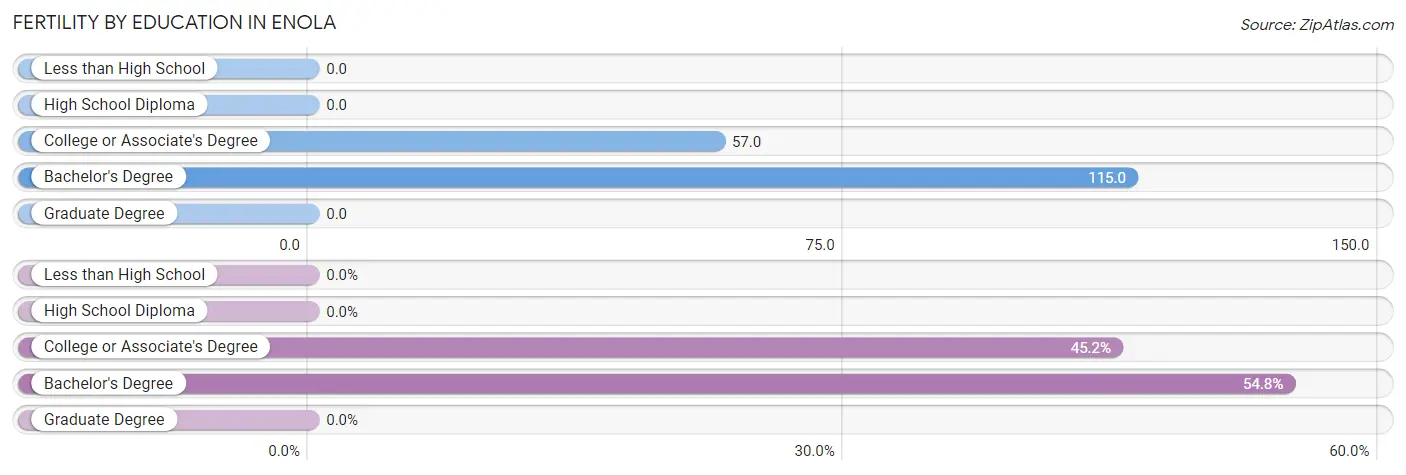
| Educational Attainment | Women with Births | Births / 1,000 Women |
| Less than High School | 0 (0.0%) | 0.0 |
| High School Diploma | 0 (0.0%) | 0.0 |
| College or Associate's Degree | 28 (45.2%) | 57.0 |
| Bachelor's Degree | 34 (54.8%) | 115.0 |
| Graduate Degree | 0 (0.0%) | 0.0 |
| Total | 62 (100.0%) | 37.0 |
Fertility by Education by Marriage Status in Enola
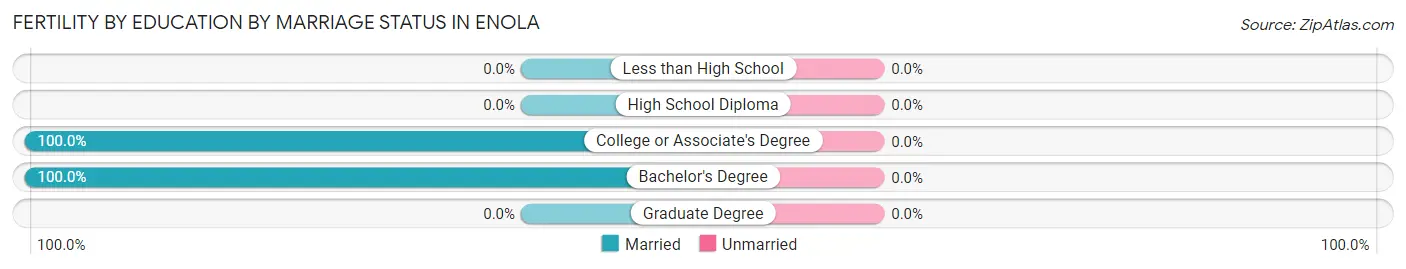
| Educational Attainment | Married | Unmarried |
| Less than High School | 0 (0.0%) | 0 (0.0%) |
| High School Diploma | 0 (0.0%) | 0 (0.0%) |
| College or Associate's Degree | 28 (100.0%) | 0 (0.0%) |
| Bachelor's Degree | 34 (100.0%) | 0 (0.0%) |
| Graduate Degree | 0 (0.0%) | 0 (0.0%) |
| Total | 62 (100.0%) | 0 (0.0%) |
Employment Characteristics in Enola
Employment by Class of Employer in Enola
Among the 3,543 employed individuals in Enola, private company employees (2,840 | 80.2%), state government employees (288 | 8.1%), and not-for-profit organizations (202 | 5.7%) make up the most common classes of employment.
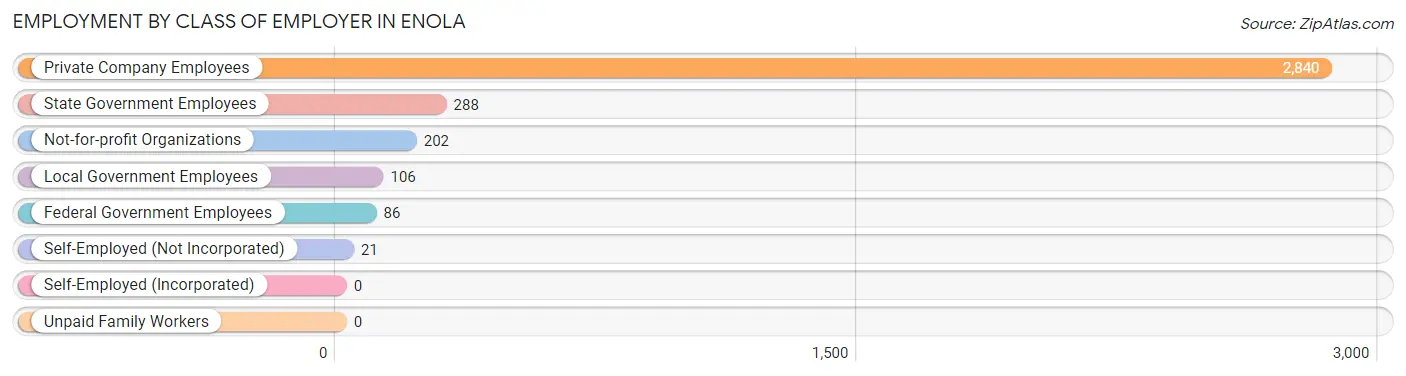
| Employer Class | # Employees | % Employees |
| Private Company Employees | 2,840 | 80.2% |
| Self-Employed (Incorporated) | 0 | 0.0% |
| Self-Employed (Not Incorporated) | 21 | 0.6% |
| Not-for-profit Organizations | 202 | 5.7% |
| Local Government Employees | 106 | 3.0% |
| State Government Employees | 288 | 8.1% |
| Federal Government Employees | 86 | 2.4% |
| Unpaid Family Workers | 0 | 0.0% |
| Total | 3,543 | 100.0% |
Employment Status by Age in Enola
According to the labor force statistics for Enola, out of the total population over 16 years of age (5,100), 75.7% or 3,861 individuals are in the labor force, with 6.8% or 263 of them unemployed. The age group with the highest labor force participation rate is 35 to 44 years, with 100.0% or 750 individuals in the labor force. Within the labor force, the 16 to 19 years age range has the highest percentage of unemployed individuals, with 23.0% or 43 of them being unemployed.
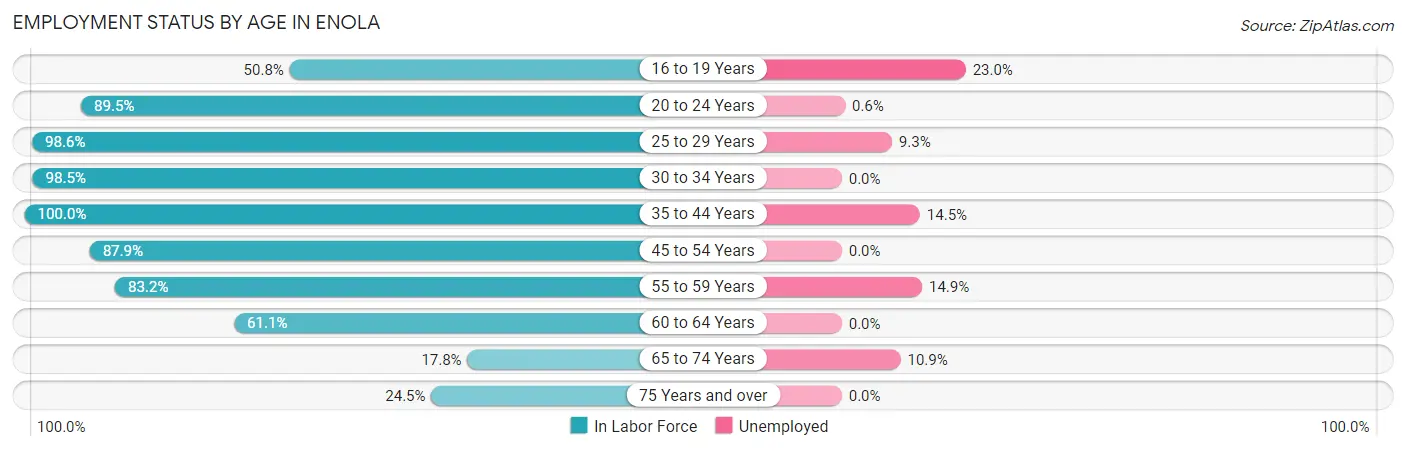
| Age Bracket | In Labor Force | Unemployed |
| 16 to 19 Years | 187 (50.8%) | 43 (23.0%) |
| 20 to 24 Years | 522 (89.5%) | 3 (0.6%) |
| 25 to 29 Years | 507 (98.6%) | 47 (9.3%) |
| 30 to 34 Years | 536 (98.5%) | 0 (0.0%) |
| 35 to 44 Years | 750 (100.0%) | 109 (14.5%) |
| 45 to 54 Years | 676 (87.9%) | 0 (0.0%) |
| 55 to 59 Years | 337 (83.2%) | 50 (14.9%) |
| 60 to 64 Years | 162 (61.1%) | 0 (0.0%) |
| 65 to 74 Years | 101 (17.8%) | 11 (10.9%) |
| 75 Years and over | 82 (24.5%) | 0 (0.0%) |
| Total | 3,861 (75.7%) | 263 (6.8%) |
Employment Status by Educational Attainment in Enola
According to labor force statistics for Enola, 91.4% of individuals (2,968) out of the total population between 25 and 64 years of age (3,247) are in the labor force, with 6.9% or 205 of them being unemployed. The group with the highest labor force participation rate are those with the educational attainment of bachelor's degree or higher, with 95.2% or 1,111 individuals in the labor force. Within the labor force, individuals with high school diploma education have the highest percentage of unemployment, with 13.9% or 157 of them being unemployed.
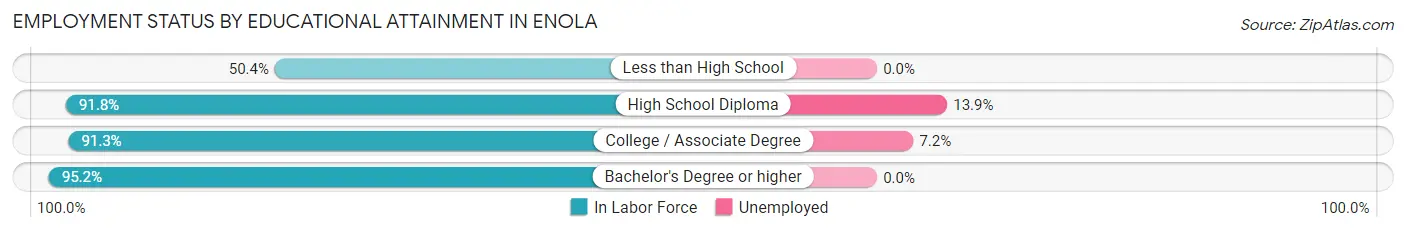
| Educational Attainment | In Labor Force | Unemployed |
| Less than High School | 60 (50.4%) | 0 (0.0%) |
| High School Diploma | 1,133 (91.8%) | 172 (13.9%) |
| College / Associate Degree | 664 (91.3%) | 52 (7.2%) |
| Bachelor's Degree or higher | 1,111 (95.2%) | 0 (0.0%) |
| Total | 2,968 (91.4%) | 224 (6.9%) |
Employment Occupations by Sex in Enola
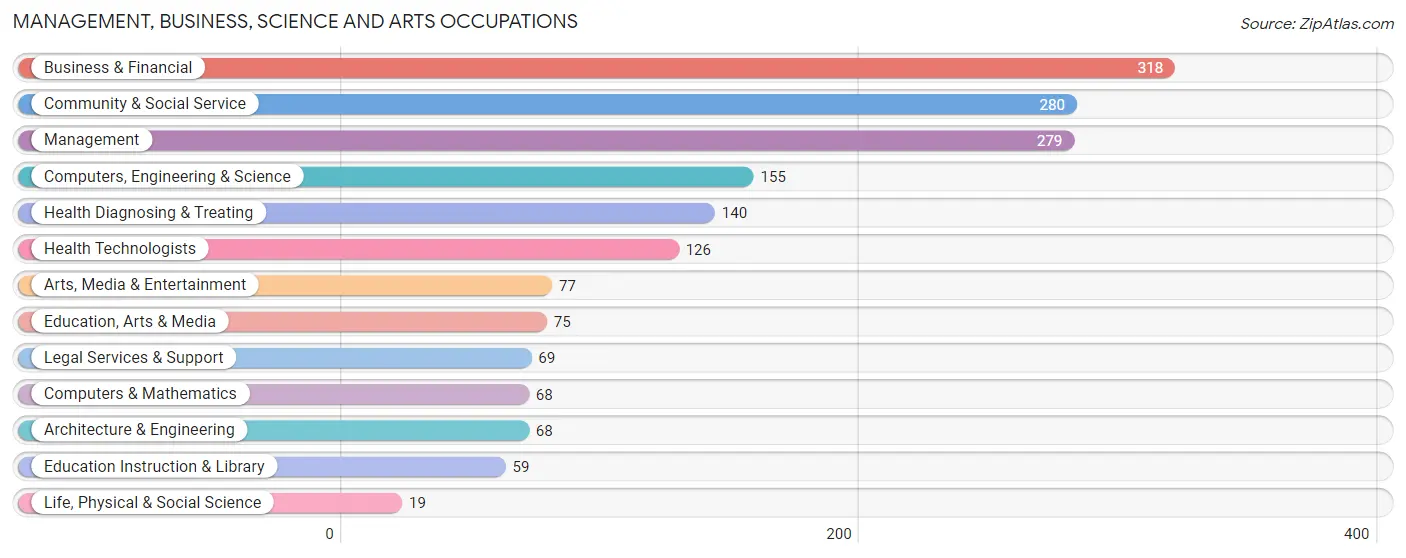
Management, Business, Science and Arts Occupations
The most common Management, Business, Science and Arts occupations in Enola are Business & Financial (318 | 9.0%), Community & Social Service (280 | 7.9%), Management (279 | 7.9%), Computers, Engineering & Science (155 | 4.4%), and Health Diagnosing & Treating (140 | 3.9%).
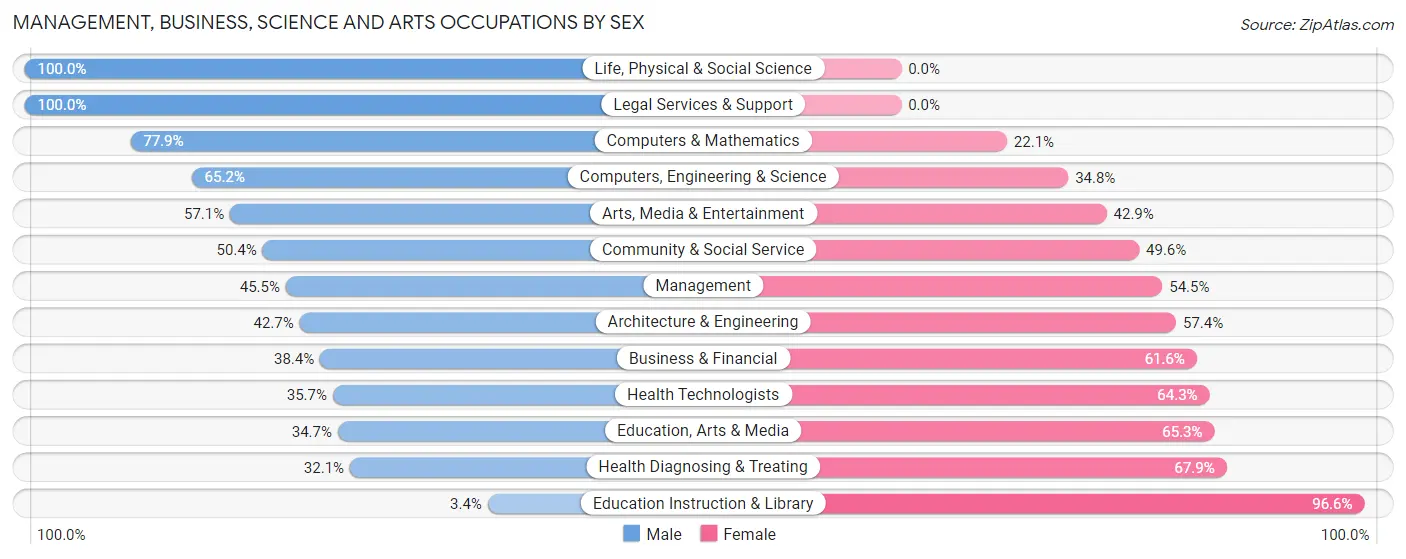
Management, Business, Science and Arts Occupations by Sex
Within the Management, Business, Science and Arts occupations in Enola, the most male-oriented occupations are Life, Physical & Social Science (100.0%), Legal Services & Support (100.0%), and Computers & Mathematics (77.9%), while the most female-oriented occupations are Education Instruction & Library (96.6%), Health Diagnosing & Treating (67.9%), and Education, Arts & Media (65.3%).
| Occupation | Male | Female |
| Management | 127 (45.5%) | 152 (54.5%) |
| Business & Financial | 122 (38.4%) | 196 (61.6%) |
| Computers, Engineering & Science | 101 (65.2%) | 54 (34.8%) |
| Computers & Mathematics | 53 (77.9%) | 15 (22.1%) |
| Architecture & Engineering | 29 (42.6%) | 39 (57.4%) |
| Life, Physical & Social Science | 19 (100.0%) | 0 (0.0%) |
| Community & Social Service | 141 (50.4%) | 139 (49.6%) |
| Education, Arts & Media | 26 (34.7%) | 49 (65.3%) |
| Legal Services & Support | 69 (100.0%) | 0 (0.0%) |
| Education Instruction & Library | 2 (3.4%) | 57 (96.6%) |
| Arts, Media & Entertainment | 44 (57.1%) | 33 (42.9%) |
| Health Diagnosing & Treating | 45 (32.1%) | 95 (67.9%) |
| Health Technologists | 45 (35.7%) | 81 (64.3%) |
| Total (Category) | 536 (45.7%) | 636 (54.3%) |
| Total (Overall) | 1,800 (50.7%) | 1,751 (49.3%) |
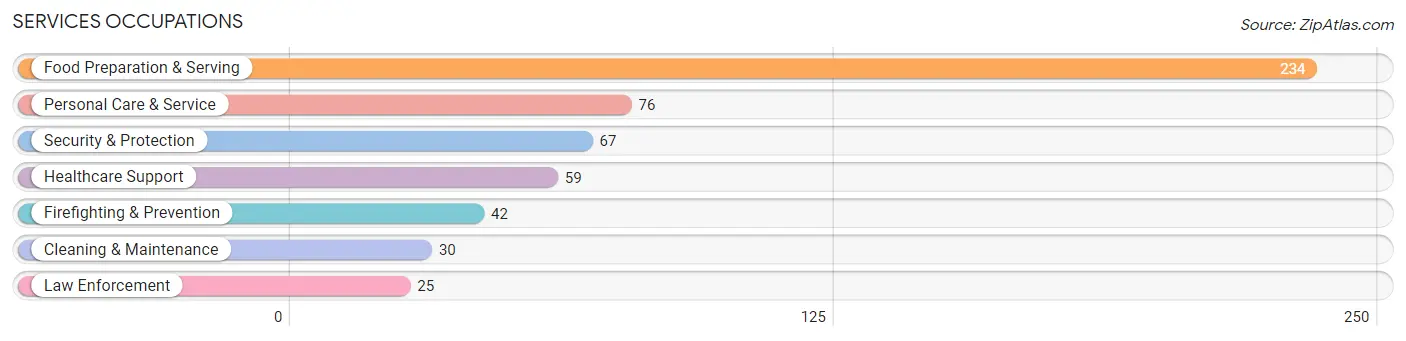
Services Occupations
The most common Services occupations in Enola are Food Preparation & Serving (234 | 6.6%), Personal Care & Service (76 | 2.1%), Security & Protection (67 | 1.9%), Healthcare Support (59 | 1.7%), and Firefighting & Prevention (42 | 1.2%).
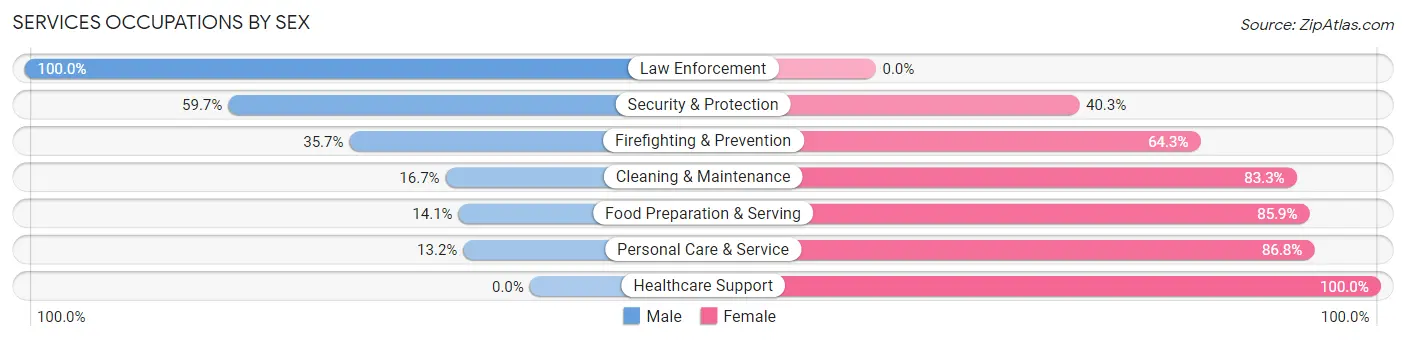
Services Occupations by Sex
Within the Services occupations in Enola, the most male-oriented occupations are Law Enforcement (100.0%), Security & Protection (59.7%), and Firefighting & Prevention (35.7%), while the most female-oriented occupations are Healthcare Support (100.0%), Personal Care & Service (86.8%), and Food Preparation & Serving (85.9%).
| Occupation | Male | Female |
| Healthcare Support | 0 (0.0%) | 59 (100.0%) |
| Security & Protection | 40 (59.7%) | 27 (40.3%) |
| Firefighting & Prevention | 15 (35.7%) | 27 (64.3%) |
| Law Enforcement | 25 (100.0%) | 0 (0.0%) |
| Food Preparation & Serving | 33 (14.1%) | 201 (85.9%) |
| Cleaning & Maintenance | 5 (16.7%) | 25 (83.3%) |
| Personal Care & Service | 10 (13.2%) | 66 (86.8%) |
| Total (Category) | 88 (18.9%) | 378 (81.1%) |
| Total (Overall) | 1,800 (50.7%) | 1,751 (49.3%) |
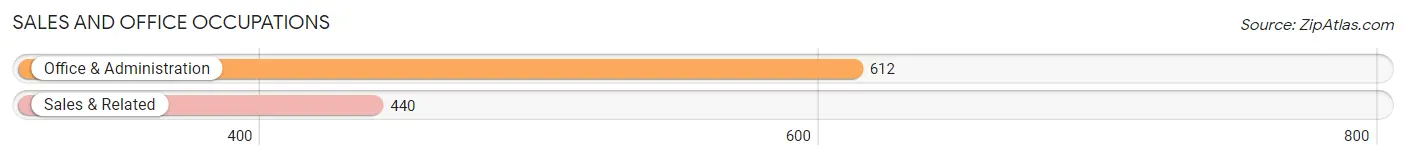
Sales and Office Occupations
The most common Sales and Office occupations in Enola are Office & Administration (612 | 17.2%), and Sales & Related (440 | 12.4%).
Sales and Office Occupations by Sex
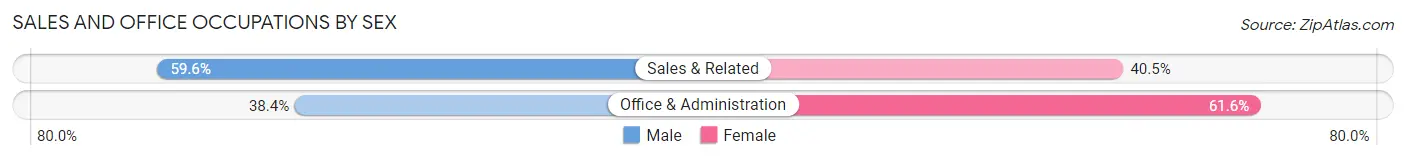
| Occupation | Male | Female |
| Sales & Related | 262 (59.6%) | 178 (40.5%) |
| Office & Administration | 235 (38.4%) | 377 (61.6%) |
| Total (Category) | 497 (47.2%) | 555 (52.8%) |
| Total (Overall) | 1,800 (50.7%) | 1,751 (49.3%) |
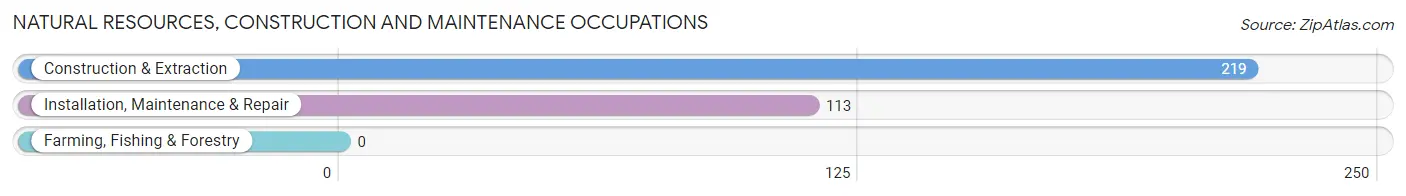
Natural Resources, Construction and Maintenance Occupations
The most common Natural Resources, Construction and Maintenance occupations in Enola are Construction & Extraction (219 | 6.2%), and Installation, Maintenance & Repair (113 | 3.2%).
Natural Resources, Construction and Maintenance Occupations by Sex
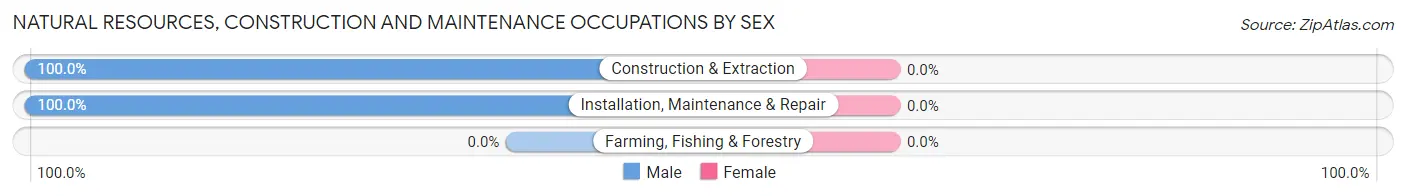
| Occupation | Male | Female |
| Farming, Fishing & Forestry | 0 (0.0%) | 0 (0.0%) |
| Construction & Extraction | 219 (100.0%) | 0 (0.0%) |
| Installation, Maintenance & Repair | 113 (100.0%) | 0 (0.0%) |
| Total (Category) | 332 (100.0%) | 0 (0.0%) |
| Total (Overall) | 1,800 (50.7%) | 1,751 (49.3%) |
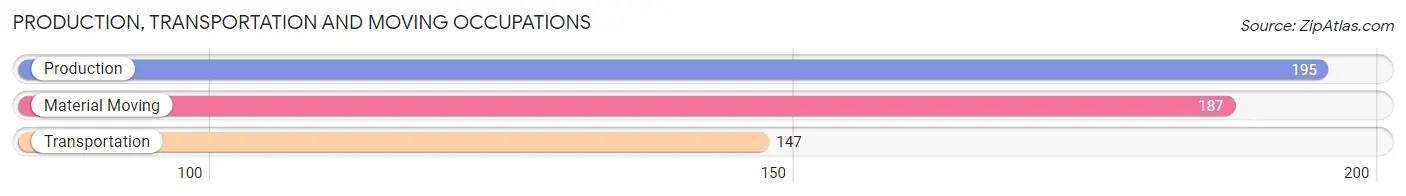
Production, Transportation and Moving Occupations
The most common Production, Transportation and Moving occupations in Enola are Production (195 | 5.5%), Material Moving (187 | 5.3%), and Transportation (147 | 4.1%).
Production, Transportation and Moving Occupations by Sex
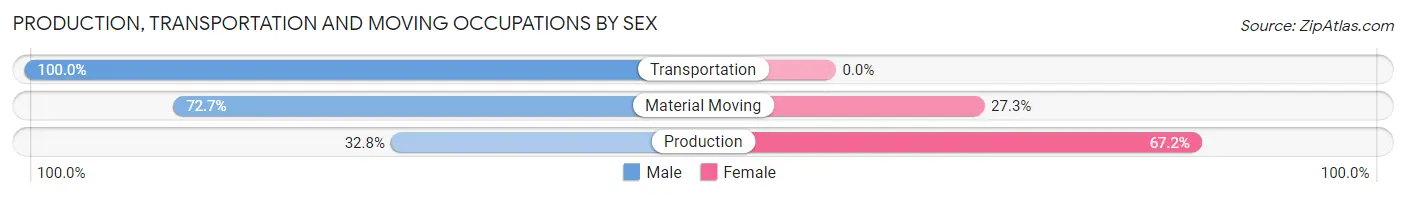
| Occupation | Male | Female |
| Production | 64 (32.8%) | 131 (67.2%) |
| Transportation | 147 (100.0%) | 0 (0.0%) |
| Material Moving | 136 (72.7%) | 51 (27.3%) |
| Total (Category) | 347 (65.6%) | 182 (34.4%) |
| Total (Overall) | 1,800 (50.7%) | 1,751 (49.3%) |
Employment Industries by Sex in Enola
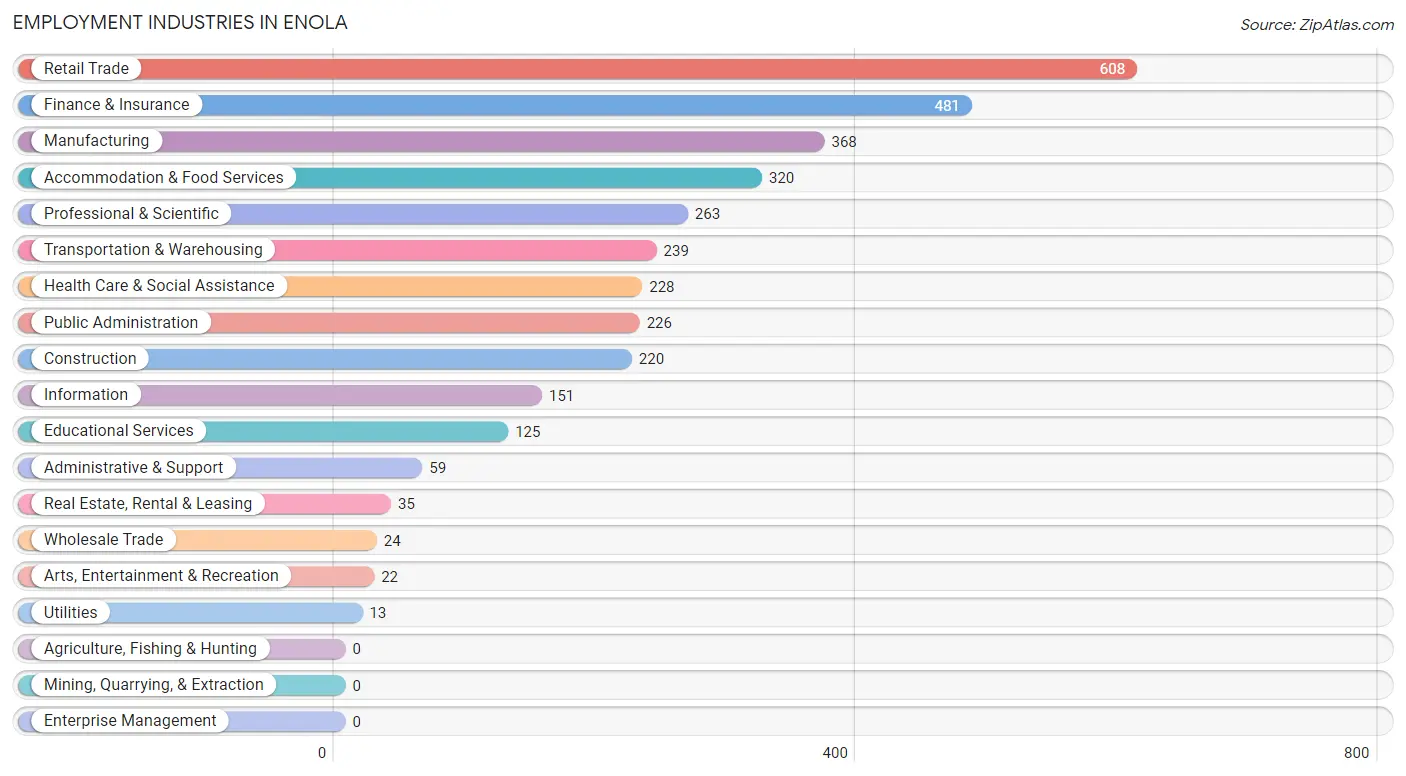
Employment Industries in Enola
The major employment industries in Enola include Retail Trade (608 | 17.1%), Finance & Insurance (481 | 13.6%), Manufacturing (368 | 10.4%), Accommodation & Food Services (320 | 9.0%), and Professional & Scientific (263 | 7.4%).
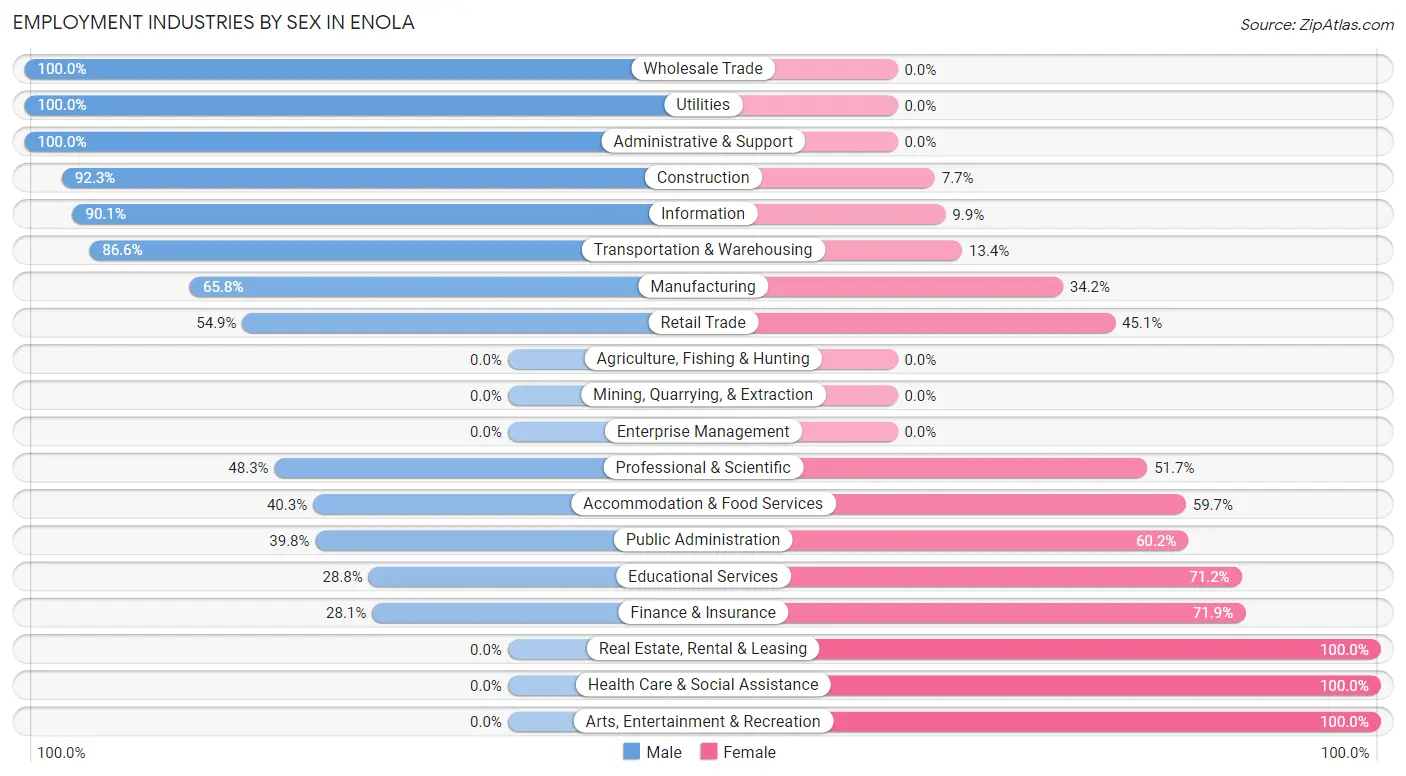
Employment Industries by Sex in Enola
The Enola industries that see more men than women are Wholesale Trade (100.0%), Utilities (100.0%), and Administrative & Support (100.0%), whereas the industries that tend to have a higher number of women are Real Estate, Rental & Leasing (100.0%), Health Care & Social Assistance (100.0%), and Arts, Entertainment & Recreation (100.0%).
| Industry | Male | Female |
| Agriculture, Fishing & Hunting | 0 (0.0%) | 0 (0.0%) |
| Mining, Quarrying, & Extraction | 0 (0.0%) | 0 (0.0%) |
| Construction | 203 (92.3%) | 17 (7.7%) |
| Manufacturing | 242 (65.8%) | 126 (34.2%) |
| Wholesale Trade | 24 (100.0%) | 0 (0.0%) |
| Retail Trade | 334 (54.9%) | 274 (45.1%) |
| Transportation & Warehousing | 207 (86.6%) | 32 (13.4%) |
| Utilities | 13 (100.0%) | 0 (0.0%) |
| Information | 136 (90.1%) | 15 (9.9%) |
| Finance & Insurance | 135 (28.1%) | 346 (71.9%) |
| Real Estate, Rental & Leasing | 0 (0.0%) | 35 (100.0%) |
| Professional & Scientific | 127 (48.3%) | 136 (51.7%) |
| Enterprise Management | 0 (0.0%) | 0 (0.0%) |
| Administrative & Support | 59 (100.0%) | 0 (0.0%) |
| Educational Services | 36 (28.8%) | 89 (71.2%) |
| Health Care & Social Assistance | 0 (0.0%) | 228 (100.0%) |
| Arts, Entertainment & Recreation | 0 (0.0%) | 22 (100.0%) |
| Accommodation & Food Services | 129 (40.3%) | 191 (59.7%) |
| Public Administration | 90 (39.8%) | 136 (60.2%) |
| Total | 1,800 (50.7%) | 1,751 (49.3%) |
Education in Enola
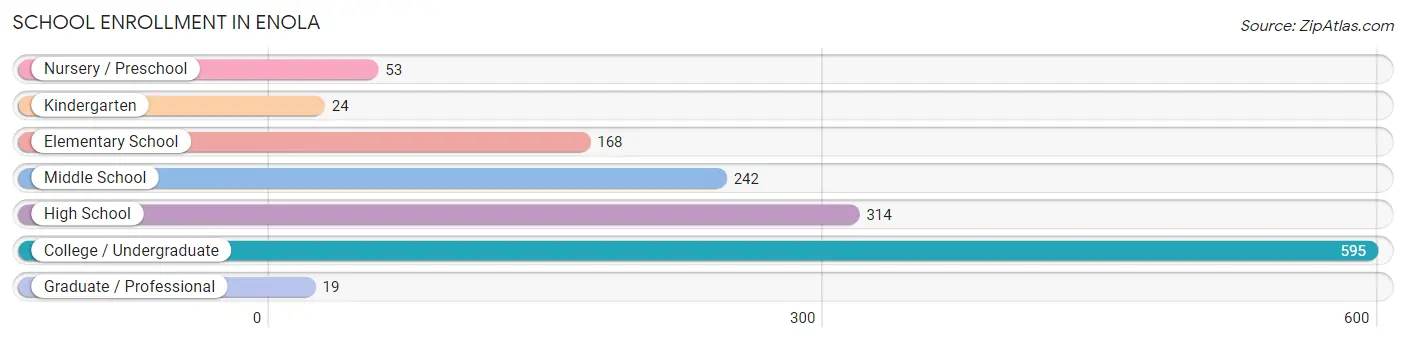
School Enrollment in Enola
The most common levels of schooling among the 1,415 students in Enola are college / undergraduate (595 | 42.0%), high school (314 | 22.2%), and middle school (242 | 17.1%).
| School Level | # Students | % Students |
| Nursery / Preschool | 53 | 3.7% |
| Kindergarten | 24 | 1.7% |
| Elementary School | 168 | 11.9% |
| Middle School | 242 | 17.1% |
| High School | 314 | 22.2% |
| College / Undergraduate | 595 | 42.0% |
| Graduate / Professional | 19 | 1.3% |
| Total | 1,415 | 100.0% |
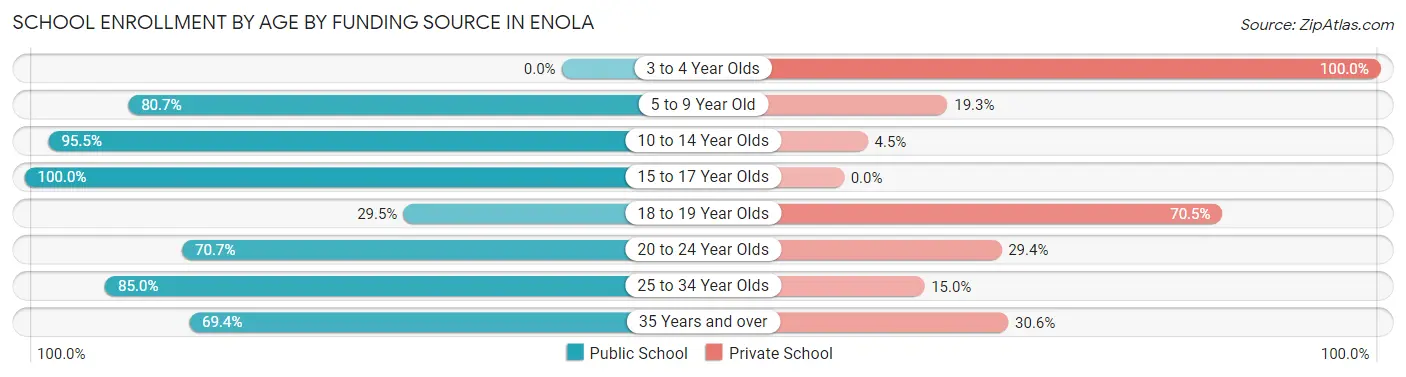
School Enrollment by Age by Funding Source in Enola
Out of a total of 1,415 students who are enrolled in schools in Enola, 374 (26.4%) attend a private institution, while the remaining 1,041 (73.6%) are enrolled in public schools. The age group of 3 to 4 year olds has the highest likelihood of being enrolled in private schools, with 8 (100.0% in the age bracket) enrolled. Conversely, the age group of 15 to 17 year olds has the lowest likelihood of being enrolled in a private school, with 145 (100.0% in the age bracket) attending a public institution.
| Age Bracket | Public School | Private School |
| 3 to 4 Year Olds | 0 (0.0%) | 8 (100.0%) |
| 5 to 9 Year Old | 188 (80.7%) | 45 (19.3%) |
| 10 to 14 Year Olds | 300 (95.5%) | 14 (4.5%) |
| 15 to 17 Year Olds | 145 (100.0%) | 0 (0.0%) |
| 18 to 19 Year Olds | 74 (29.5%) | 177 (70.5%) |
| 20 to 24 Year Olds | 207 (70.7%) | 86 (29.3%) |
| 25 to 34 Year Olds | 51 (85.0%) | 9 (15.0%) |
| 35 Years and over | 77 (69.4%) | 34 (30.6%) |
| Total | 1,041 (73.6%) | 374 (26.4%) |
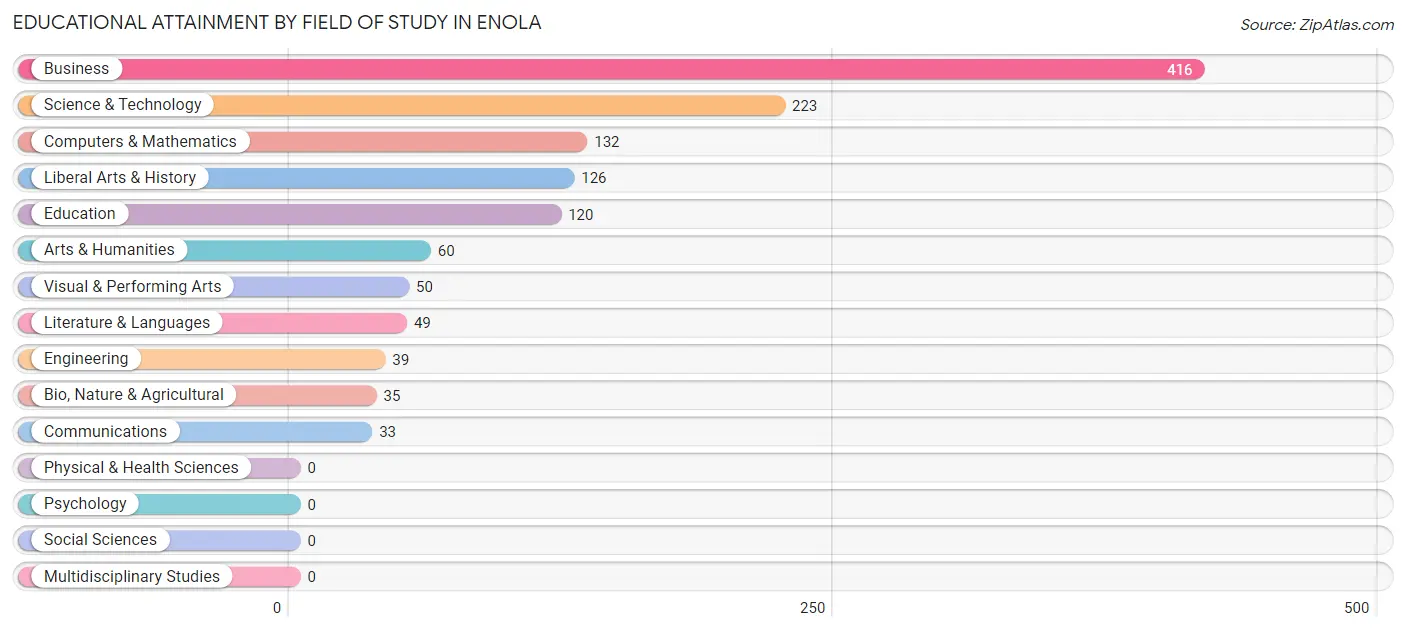
Educational Attainment by Field of Study in Enola
Business (416 | 32.4%), science & technology (223 | 17.4%), computers & mathematics (132 | 10.3%), liberal arts & history (126 | 9.8%), and education (120 | 9.3%) are the most common fields of study among 1,283 individuals in Enola who have obtained a bachelor's degree or higher.
| Field of Study | # Graduates | % Graduates |
| Computers & Mathematics | 132 | 10.3% |
| Bio, Nature & Agricultural | 35 | 2.7% |
| Physical & Health Sciences | 0 | 0.0% |
| Psychology | 0 | 0.0% |
| Social Sciences | 0 | 0.0% |
| Engineering | 39 | 3.0% |
| Multidisciplinary Studies | 0 | 0.0% |
| Science & Technology | 223 | 17.4% |
| Business | 416 | 32.4% |
| Education | 120 | 9.3% |
| Literature & Languages | 49 | 3.8% |
| Liberal Arts & History | 126 | 9.8% |
| Visual & Performing Arts | 50 | 3.9% |
| Communications | 33 | 2.6% |
| Arts & Humanities | 60 | 4.7% |
| Total | 1,283 | 100.0% |
Transportation & Commute in Enola
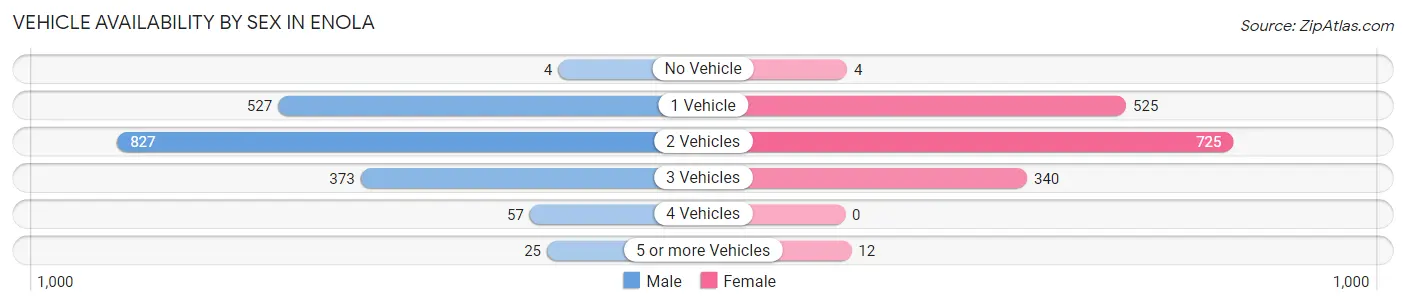
Vehicle Availability by Sex in Enola
The most prevalent vehicle ownership categories in Enola are males with 2 vehicles (827, accounting for 45.6%) and females with 2 vehicles (725, making up 51.5%).
| Vehicles Available | Male | Female |
| No Vehicle | 4 (0.2%) | 4 (0.3%) |
| 1 Vehicle | 527 (29.1%) | 525 (32.7%) |
| 2 Vehicles | 827 (45.6%) | 725 (45.1%) |
| 3 Vehicles | 373 (20.6%) | 340 (21.2%) |
| 4 Vehicles | 57 (3.1%) | 0 (0.0%) |
| 5 or more Vehicles | 25 (1.4%) | 12 (0.7%) |
| Total | 1,813 (100.0%) | 1,606 (100.0%) |
Commute Time in Enola
The most frequently occuring commute durations in Enola are 15 to 19 minutes (957 commuters, 29.6%), 20 to 24 minutes (662 commuters, 20.5%), and 10 to 14 minutes (628 commuters, 19.4%).
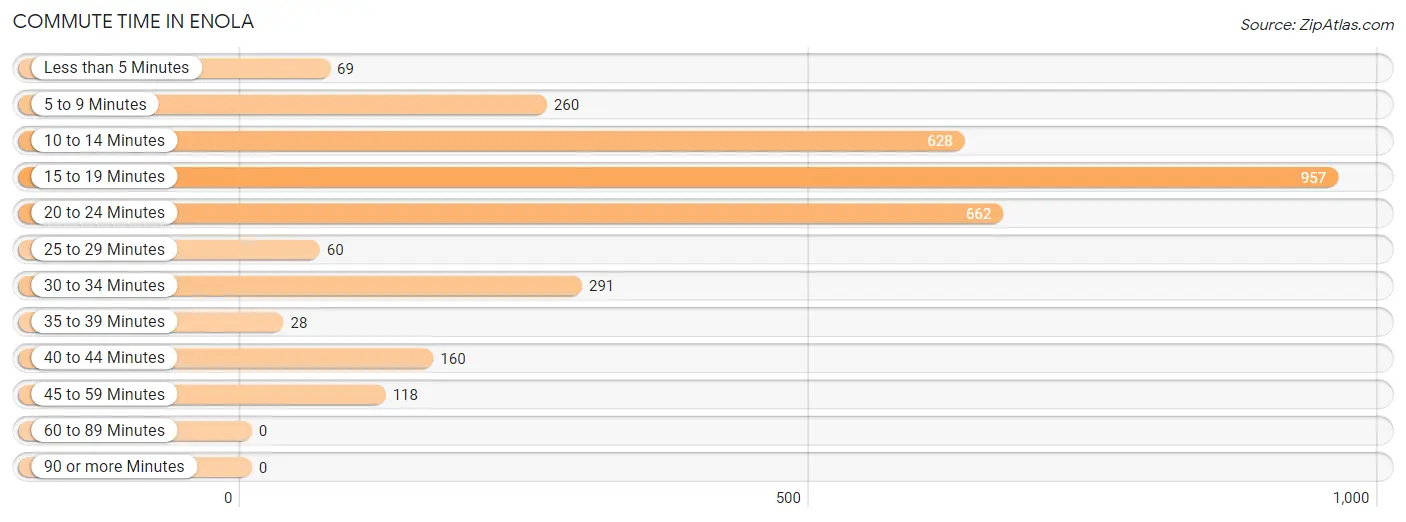
| Commute Time | # Commuters | % Commuters |
| Less than 5 Minutes | 69 | 2.1% |
| 5 to 9 Minutes | 260 | 8.0% |
| 10 to 14 Minutes | 628 | 19.4% |
| 15 to 19 Minutes | 957 | 29.6% |
| 20 to 24 Minutes | 662 | 20.5% |
| 25 to 29 Minutes | 60 | 1.9% |
| 30 to 34 Minutes | 291 | 9.0% |
| 35 to 39 Minutes | 28 | 0.9% |
| 40 to 44 Minutes | 160 | 5.0% |
| 45 to 59 Minutes | 118 | 3.6% |
| 60 to 89 Minutes | 0 | 0.0% |
| 90 or more Minutes | 0 | 0.0% |
Commute Time by Sex in Enola
The most common commute times in Enola are 15 to 19 minutes (489 commuters, 29.1%) for males and 15 to 19 minutes (468 commuters, 30.1%) for females.
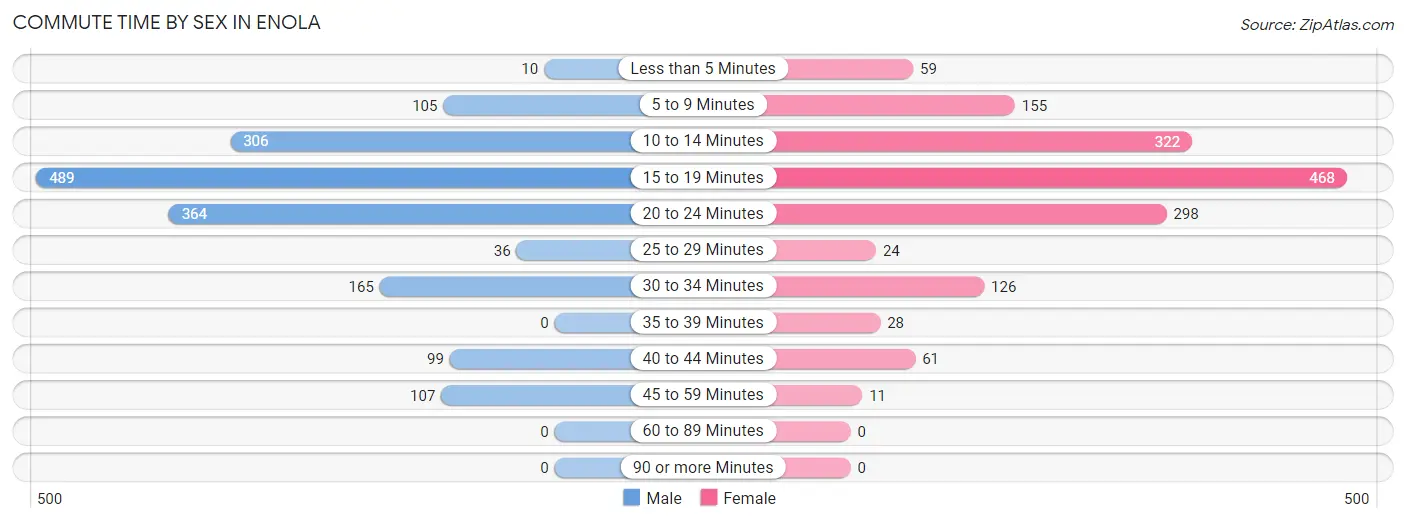
| Commute Time | Male | Female |
| Less than 5 Minutes | 10 (0.6%) | 59 (3.8%) |
| 5 to 9 Minutes | 105 (6.2%) | 155 (10.0%) |
| 10 to 14 Minutes | 306 (18.2%) | 322 (20.7%) |
| 15 to 19 Minutes | 489 (29.1%) | 468 (30.1%) |
| 20 to 24 Minutes | 364 (21.6%) | 298 (19.2%) |
| 25 to 29 Minutes | 36 (2.1%) | 24 (1.5%) |
| 30 to 34 Minutes | 165 (9.8%) | 126 (8.1%) |
| 35 to 39 Minutes | 0 (0.0%) | 28 (1.8%) |
| 40 to 44 Minutes | 99 (5.9%) | 61 (3.9%) |
| 45 to 59 Minutes | 107 (6.4%) | 11 (0.7%) |
| 60 to 89 Minutes | 0 (0.0%) | 0 (0.0%) |
| 90 or more Minutes | 0 (0.0%) | 0 (0.0%) |
Time of Departure to Work by Sex in Enola
The most frequent times of departure to work in Enola are 12:00 PM to 3:59 PM (215, 12.8%) for males and 7:30 AM to 7:59 AM (411, 26.5%) for females.
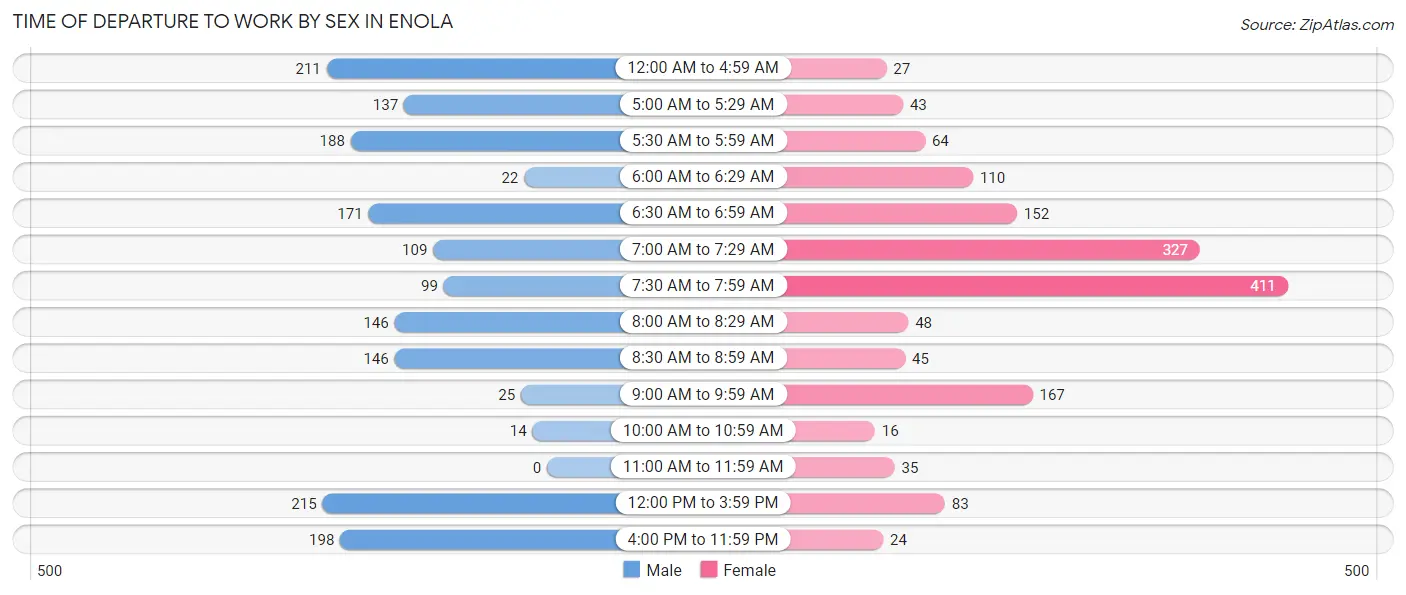
| Time of Departure | Male | Female |
| 12:00 AM to 4:59 AM | 211 (12.6%) | 27 (1.7%) |
| 5:00 AM to 5:29 AM | 137 (8.2%) | 43 (2.8%) |
| 5:30 AM to 5:59 AM | 188 (11.2%) | 64 (4.1%) |
| 6:00 AM to 6:29 AM | 22 (1.3%) | 110 (7.1%) |
| 6:30 AM to 6:59 AM | 171 (10.2%) | 152 (9.8%) |
| 7:00 AM to 7:29 AM | 109 (6.5%) | 327 (21.1%) |
| 7:30 AM to 7:59 AM | 99 (5.9%) | 411 (26.5%) |
| 8:00 AM to 8:29 AM | 146 (8.7%) | 48 (3.1%) |
| 8:30 AM to 8:59 AM | 146 (8.7%) | 45 (2.9%) |
| 9:00 AM to 9:59 AM | 25 (1.5%) | 167 (10.8%) |
| 10:00 AM to 10:59 AM | 14 (0.8%) | 16 (1.0%) |
| 11:00 AM to 11:59 AM | 0 (0.0%) | 35 (2.3%) |
| 12:00 PM to 3:59 PM | 215 (12.8%) | 83 (5.3%) |
| 4:00 PM to 11:59 PM | 198 (11.8%) | 24 (1.5%) |
| Total | 1,681 (100.0%) | 1,552 (100.0%) |
Housing Occupancy in Enola
Occupancy by Ownership in Enola
Of the total 2,610 dwellings in Enola, owner-occupied units account for 1,376 (52.7%), while renter-occupied units make up 1,234 (47.3%).
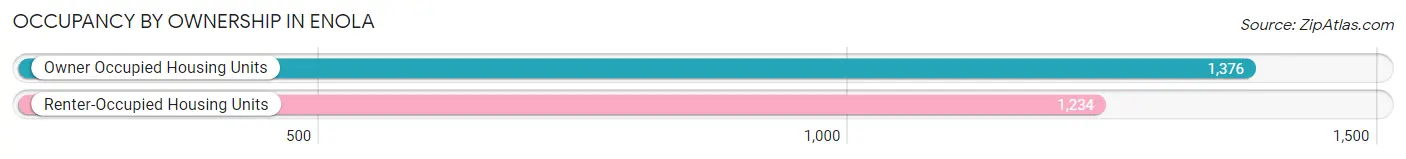
| Occupancy | # Housing Units | % Housing Units |
| Owner Occupied Housing Units | 1,376 | 52.7% |
| Renter-Occupied Housing Units | 1,234 | 47.3% |
| Total Occupied Housing Units | 2,610 | 100.0% |
Occupancy by Household Size in Enola
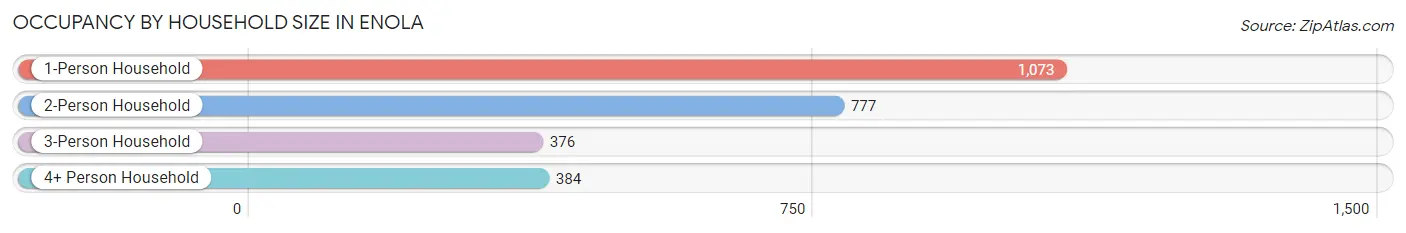
| Household Size | # Housing Units | % Housing Units |
| 1-Person Household | 1,073 | 41.1% |
| 2-Person Household | 777 | 29.8% |
| 3-Person Household | 376 | 14.4% |
| 4+ Person Household | 384 | 14.7% |
| Total Housing Units | 2,610 | 100.0% |
Occupancy by Ownership by Household Size in Enola
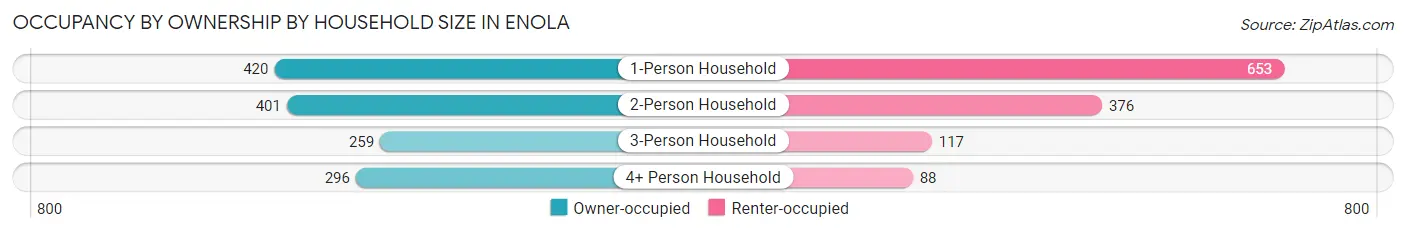
| Household Size | Owner-occupied | Renter-occupied |
| 1-Person Household | 420 (39.1%) | 653 (60.9%) |
| 2-Person Household | 401 (51.6%) | 376 (48.4%) |
| 3-Person Household | 259 (68.9%) | 117 (31.1%) |
| 4+ Person Household | 296 (77.1%) | 88 (22.9%) |
| Total Housing Units | 1,376 (52.7%) | 1,234 (47.3%) |
Occupancy by Educational Attainment in Enola
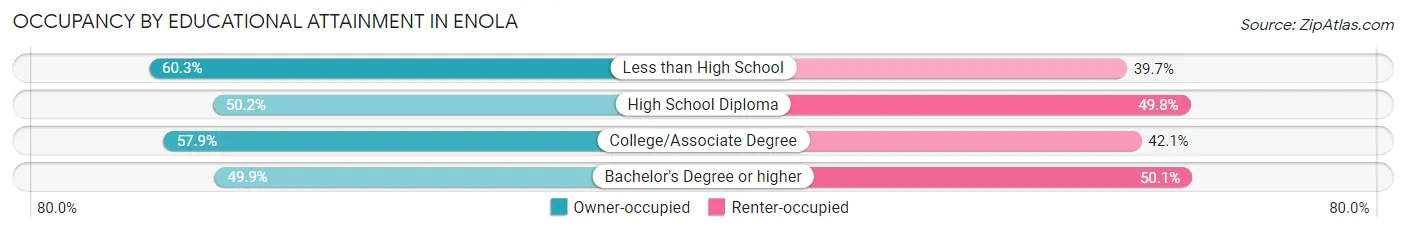
| Household Size | Owner-occupied | Renter-occupied |
| Less than High School | 91 (60.3%) | 60 (39.7%) |
| High School Diploma | 471 (50.2%) | 468 (49.8%) |
| College/Associate Degree | 402 (57.9%) | 292 (42.1%) |
| Bachelor's Degree or higher | 412 (49.9%) | 414 (50.1%) |
Occupancy by Age of Householder in Enola
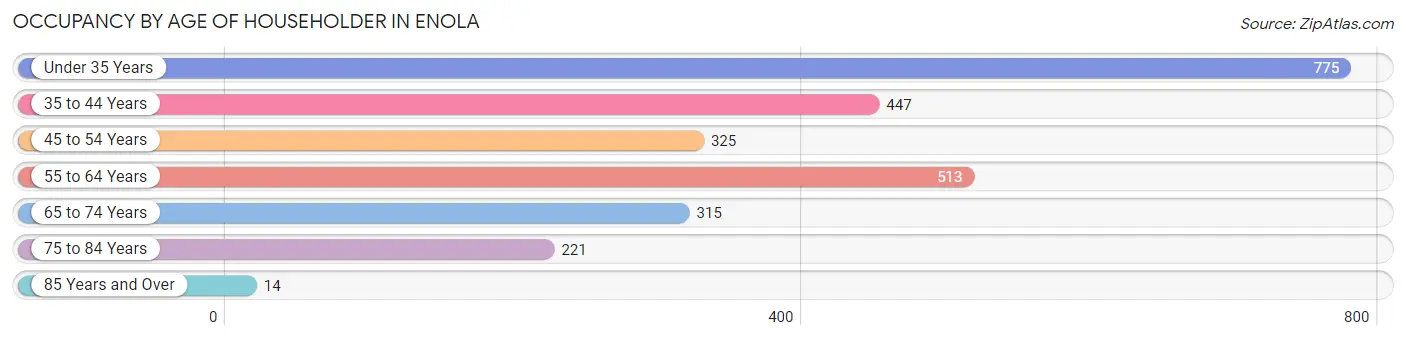
| Age Bracket | # Households | % Households |
| Under 35 Years | 775 | 29.7% |
| 35 to 44 Years | 447 | 17.1% |
| 45 to 54 Years | 325 | 12.4% |
| 55 to 64 Years | 513 | 19.7% |
| 65 to 74 Years | 315 | 12.1% |
| 75 to 84 Years | 221 | 8.5% |
| 85 Years and Over | 14 | 0.5% |
| Total | 2,610 | 100.0% |
Housing Finances in Enola
Median Income by Occupancy in Enola
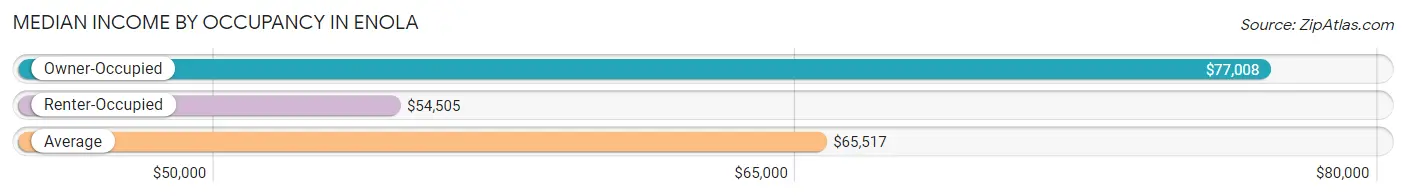
| Occupancy Type | # Households | Median Income |
| Owner-Occupied | 1,376 (52.7%) | $77,008 |
| Renter-Occupied | 1,234 (47.3%) | $54,505 |
| Average | 2,610 (100.0%) | $65,517 |
Occupancy by Householder Income Bracket in Enola

| Income Bracket | Owner-occupied | Renter-occupied |
| Less than $5,000 | 0 (0.0%) | 46 (3.7%) |
| $5,000 to $9,999 | 32 (2.3%) | 53 (4.3%) |
| $10,000 to $14,999 | 17 (1.2%) | 101 (8.2%) |
| $15,000 to $19,999 | 15 (1.1%) | 0 (0.0%) |
| $20,000 to $24,999 | 15 (1.1%) | 14 (1.1%) |
| $25,000 to $34,999 | 139 (10.1%) | 93 (7.5%) |
| $35,000 to $49,999 | 190 (13.8%) | 163 (13.2%) |
| $50,000 to $74,999 | 231 (16.8%) | 486 (39.4%) |
| $75,000 to $99,999 | 275 (20.0%) | 65 (5.3%) |
| $100,000 to $149,999 | 338 (24.6%) | 154 (12.5%) |
| $150,000 or more | 124 (9.0%) | 59 (4.8%) |
| Total | 1,376 (100.0%) | 1,234 (100.0%) |
Monthly Housing Cost Tiers in Enola
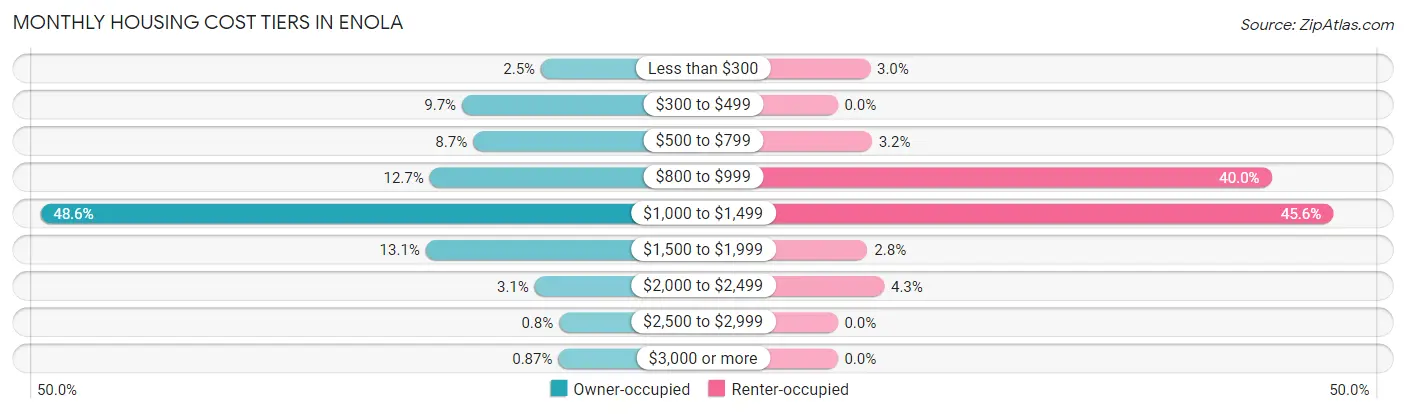
| Monthly Cost | Owner-occupied | Renter-occupied |
| Less than $300 | 34 (2.5%) | 37 (3.0%) |
| $300 to $499 | 134 (9.7%) | 0 (0.0%) |
| $500 to $799 | 120 (8.7%) | 39 (3.2%) |
| $800 to $999 | 175 (12.7%) | 493 (40.0%) |
| $1,000 to $1,499 | 668 (48.5%) | 563 (45.6%) |
| $1,500 to $1,999 | 180 (13.1%) | 34 (2.8%) |
| $2,000 to $2,499 | 42 (3.0%) | 53 (4.3%) |
| $2,500 to $2,999 | 11 (0.8%) | 0 (0.0%) |
| $3,000 or more | 12 (0.9%) | 0 (0.0%) |
| Total | 1,376 (100.0%) | 1,234 (100.0%) |
Physical Housing Characteristics in Enola
Housing Structures in Enola
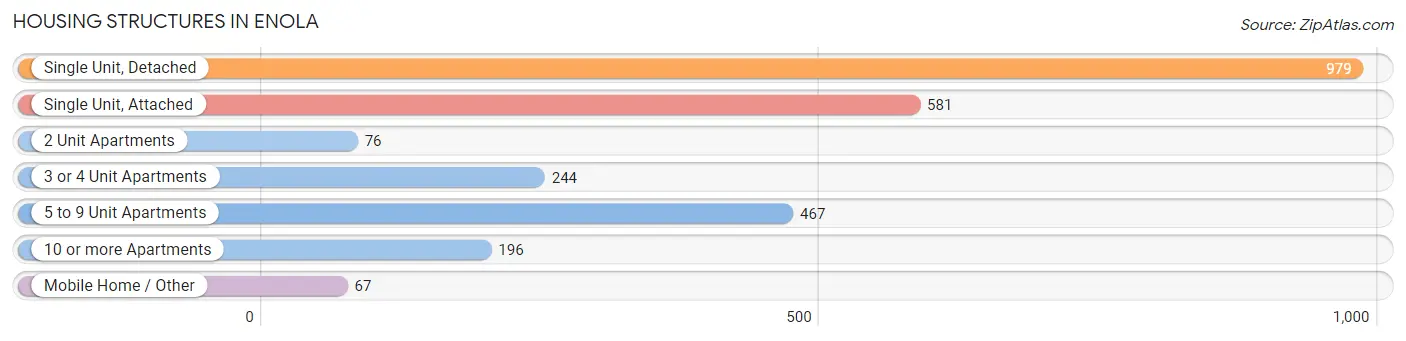
| Structure Type | # Housing Units | % Housing Units |
| Single Unit, Detached | 979 | 37.5% |
| Single Unit, Attached | 581 | 22.3% |
| 2 Unit Apartments | 76 | 2.9% |
| 3 or 4 Unit Apartments | 244 | 9.3% |
| 5 to 9 Unit Apartments | 467 | 17.9% |
| 10 or more Apartments | 196 | 7.5% |
| Mobile Home / Other | 67 | 2.6% |
| Total | 2,610 | 100.0% |
Housing Structures by Occupancy in Enola
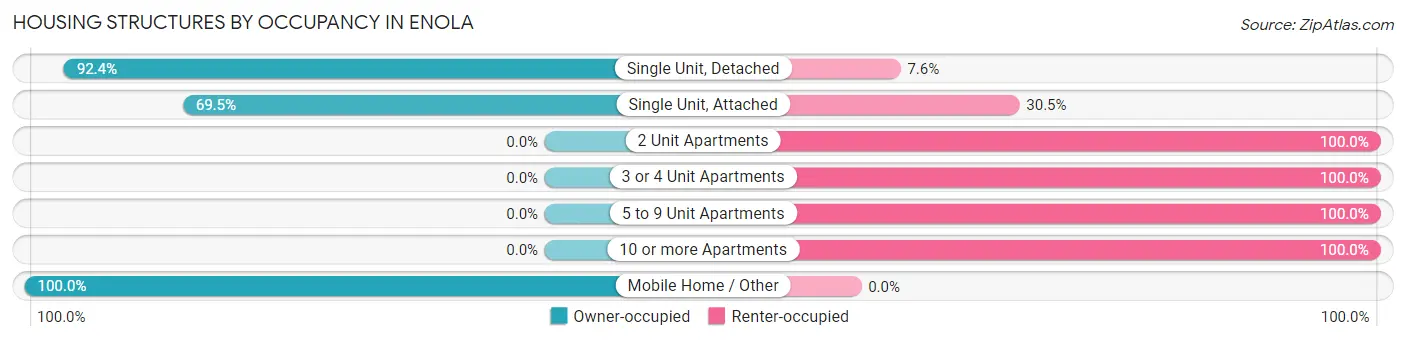
| Structure Type | Owner-occupied | Renter-occupied |
| Single Unit, Detached | 905 (92.4%) | 74 (7.6%) |
| Single Unit, Attached | 404 (69.5%) | 177 (30.5%) |
| 2 Unit Apartments | 0 (0.0%) | 76 (100.0%) |
| 3 or 4 Unit Apartments | 0 (0.0%) | 244 (100.0%) |
| 5 to 9 Unit Apartments | 0 (0.0%) | 467 (100.0%) |
| 10 or more Apartments | 0 (0.0%) | 196 (100.0%) |
| Mobile Home / Other | 67 (100.0%) | 0 (0.0%) |
| Total | 1,376 (52.7%) | 1,234 (47.3%) |
Housing Structures by Number of Rooms in Enola
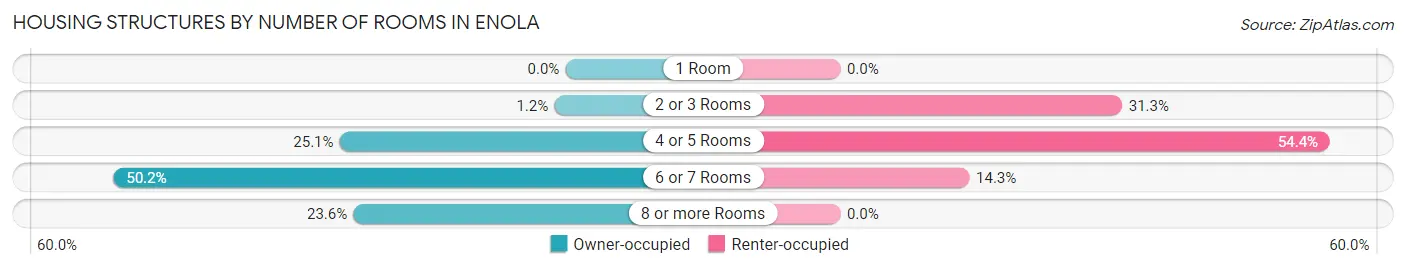
| Number of Rooms | Owner-occupied | Renter-occupied |
| 1 Room | 0 (0.0%) | 0 (0.0%) |
| 2 or 3 Rooms | 17 (1.2%) | 386 (31.3%) |
| 4 or 5 Rooms | 345 (25.1%) | 671 (54.4%) |
| 6 or 7 Rooms | 690 (50.1%) | 177 (14.3%) |
| 8 or more Rooms | 324 (23.5%) | 0 (0.0%) |
| Total | 1,376 (100.0%) | 1,234 (100.0%) |
Housing Structure by Heating Type in Enola
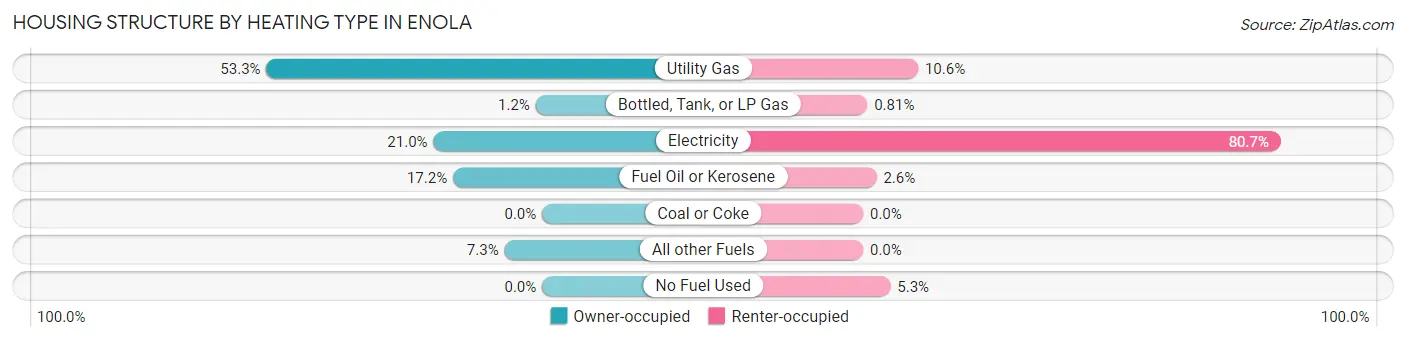
| Heating Type | Owner-occupied | Renter-occupied |
| Utility Gas | 733 (53.3%) | 131 (10.6%) |
| Bottled, Tank, or LP Gas | 17 (1.2%) | 10 (0.8%) |
| Electricity | 289 (21.0%) | 996 (80.7%) |
| Fuel Oil or Kerosene | 237 (17.2%) | 32 (2.6%) |
| Coal or Coke | 0 (0.0%) | 0 (0.0%) |
| All other Fuels | 100 (7.3%) | 0 (0.0%) |
| No Fuel Used | 0 (0.0%) | 65 (5.3%) |
| Total | 1,376 (100.0%) | 1,234 (100.0%) |
Household Vehicle Usage in Enola
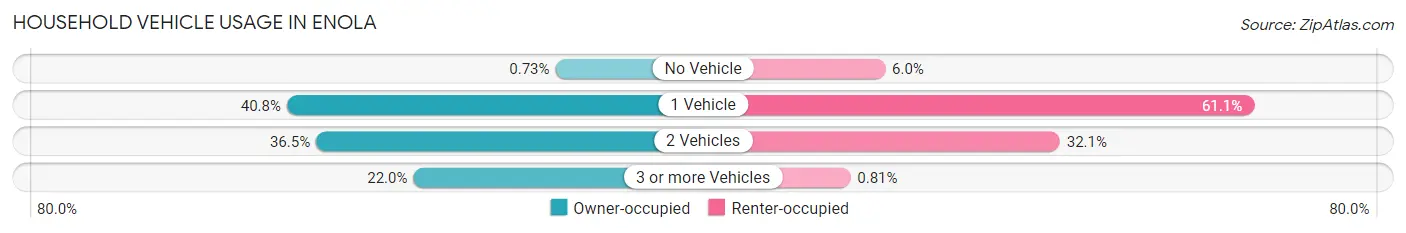
| Vehicles per Household | Owner-occupied | Renter-occupied |
| No Vehicle | 10 (0.7%) | 74 (6.0%) |
| 1 Vehicle | 562 (40.8%) | 754 (61.1%) |
| 2 Vehicles | 502 (36.5%) | 396 (32.1%) |
| 3 or more Vehicles | 302 (22.0%) | 10 (0.8%) |
| Total | 1,376 (100.0%) | 1,234 (100.0%) |
Real Estate & Mortgages in Enola
Real Estate and Mortgage Overview in Enola
| Characteristic | Without Mortgage | With Mortgage |
| Housing Units | 280 | 1,096 |
| Median Property Value | $155,800 | $162,500 |
| Median Household Income | $52,206 | $114 |
| Monthly Housing Costs | $460 | $12 |
| Real Estate Taxes | $1,946 | $0 |
Property Value by Mortgage Status in Enola
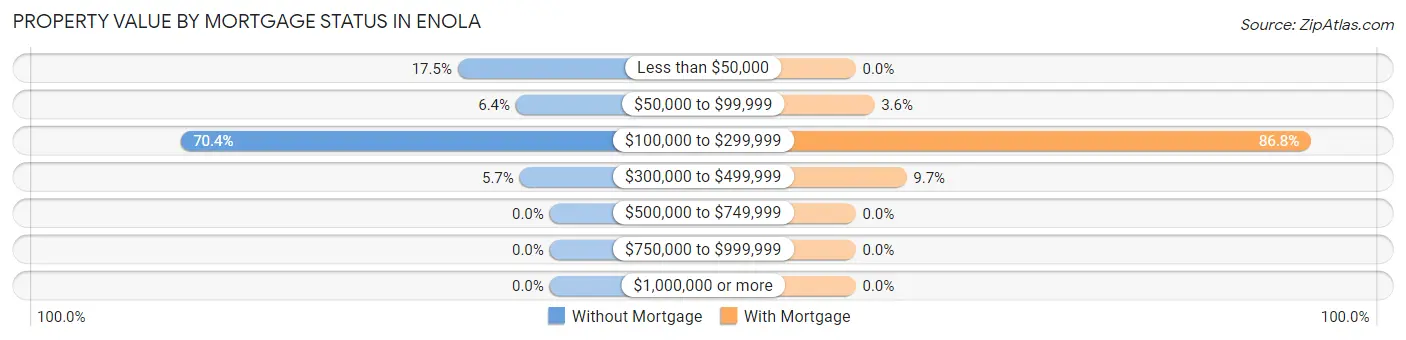
| Property Value | Without Mortgage | With Mortgage |
| Less than $50,000 | 49 (17.5%) | 0 (0.0%) |
| $50,000 to $99,999 | 18 (6.4%) | 39 (3.6%) |
| $100,000 to $299,999 | 197 (70.4%) | 951 (86.8%) |
| $300,000 to $499,999 | 16 (5.7%) | 106 (9.7%) |
| $500,000 to $749,999 | 0 (0.0%) | 0 (0.0%) |
| $750,000 to $999,999 | 0 (0.0%) | 0 (0.0%) |
| $1,000,000 or more | 0 (0.0%) | 0 (0.0%) |
| Total | 280 (100.0%) | 1,096 (100.0%) |
Household Income by Mortgage Status in Enola
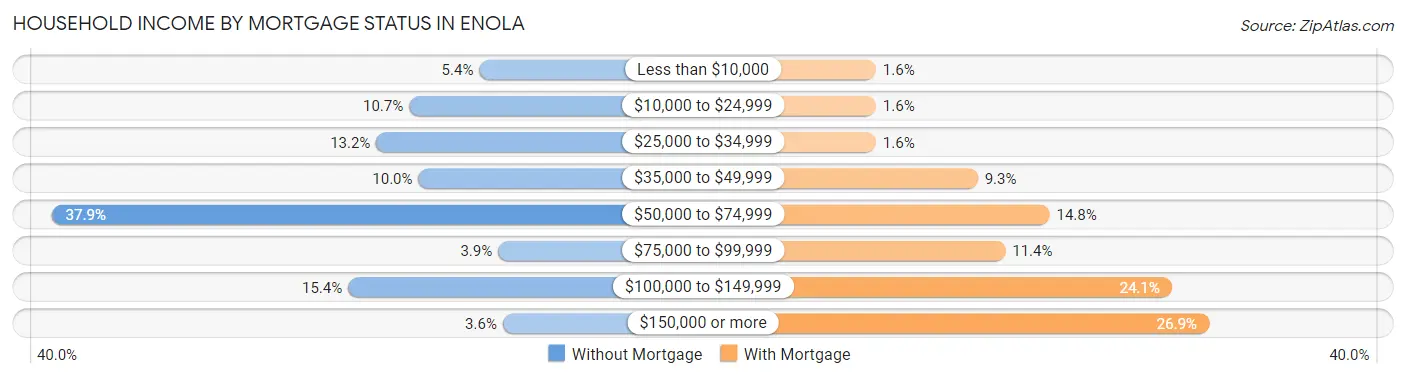
| Household Income | Without Mortgage | With Mortgage |
| Less than $10,000 | 15 (5.4%) | 17 (1.5%) |
| $10,000 to $24,999 | 30 (10.7%) | 17 (1.5%) |
| $25,000 to $34,999 | 37 (13.2%) | 17 (1.5%) |
| $35,000 to $49,999 | 28 (10.0%) | 102 (9.3%) |
| $50,000 to $74,999 | 106 (37.9%) | 162 (14.8%) |
| $75,000 to $99,999 | 11 (3.9%) | 125 (11.4%) |
| $100,000 to $149,999 | 43 (15.4%) | 264 (24.1%) |
| $150,000 or more | 10 (3.6%) | 295 (26.9%) |
| Total | 280 (100.0%) | 1,096 (100.0%) |
Property Value to Household Income Ratio in Enola
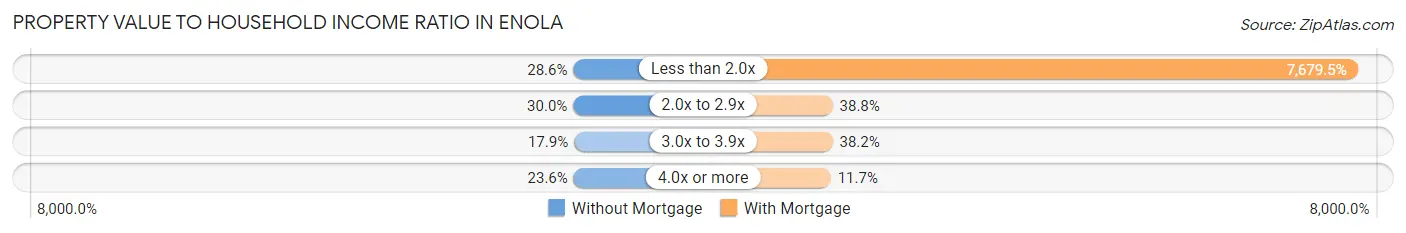
| Value-to-Income Ratio | Without Mortgage | With Mortgage |
| Less than 2.0x | 80 (28.6%) | 84,167 (7,679.5%) |
| 2.0x to 2.9x | 84 (30.0%) | 425 (38.8%) |
| 3.0x to 3.9x | 50 (17.9%) | 419 (38.2%) |
| 4.0x or more | 66 (23.6%) | 128 (11.7%) |
| Total | 280 (100.0%) | 1,096 (100.0%) |
Real Estate Taxes by Mortgage Status in Enola
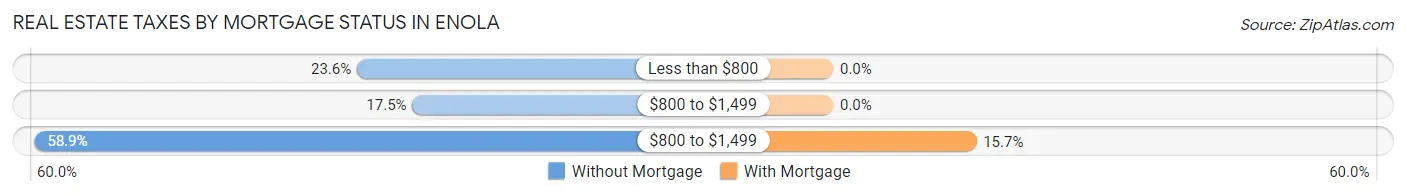
| Property Taxes | Without Mortgage | With Mortgage |
| Less than $800 | 66 (23.6%) | 0 (0.0%) |
| $800 to $1,499 | 49 (17.5%) | 0 (0.0%) |
| $800 to $1,499 | 165 (58.9%) | 172 (15.7%) |
| Total | 280 (100.0%) | 1,096 (100.0%) |
Health & Disability in Enola
Health Insurance Coverage by Age in Enola
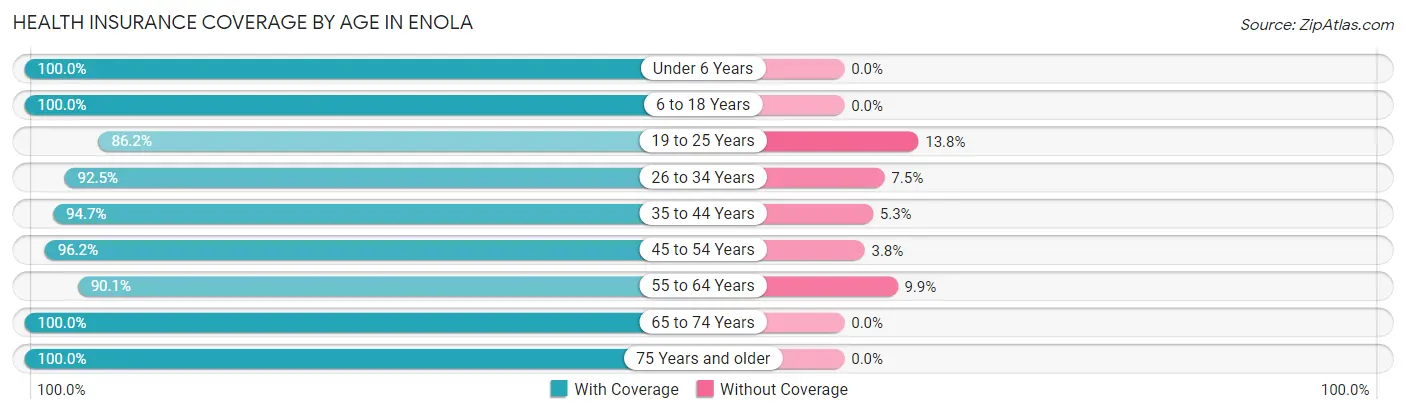
| Age Bracket | With Coverage | Without Coverage |
| Under 6 Years | 277 (100.0%) | 0 (0.0%) |
| 6 to 18 Years | 737 (100.0%) | 0 (0.0%) |
| 19 to 25 Years | 843 (86.2%) | 135 (13.8%) |
| 26 to 34 Years | 804 (92.5%) | 65 (7.5%) |
| 35 to 44 Years | 710 (94.7%) | 40 (5.3%) |
| 45 to 54 Years | 740 (96.2%) | 29 (3.8%) |
| 55 to 64 Years | 591 (90.1%) | 65 (9.9%) |
| 65 to 74 Years | 567 (100.0%) | 0 (0.0%) |
| 75 Years and older | 335 (100.0%) | 0 (0.0%) |
| Total | 5,604 (94.4%) | 334 (5.6%) |
Health Insurance Coverage by Citizenship Status in Enola
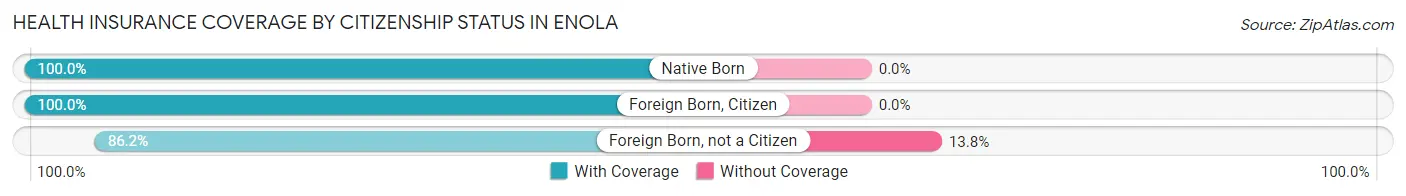
| Citizenship Status | With Coverage | Without Coverage |
| Native Born | 277 (100.0%) | 0 (0.0%) |
| Foreign Born, Citizen | 737 (100.0%) | 0 (0.0%) |
| Foreign Born, not a Citizen | 843 (86.2%) | 135 (13.8%) |
Health Insurance Coverage by Household Income in Enola
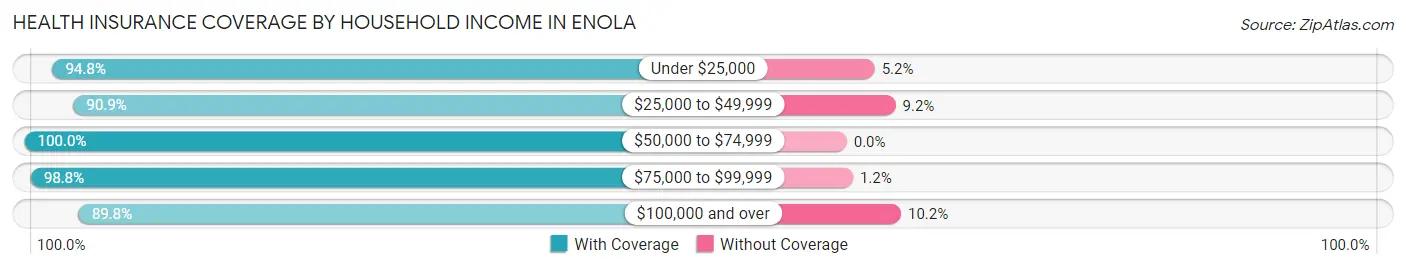
| Household Income | With Coverage | Without Coverage |
| Under $25,000 | 308 (94.8%) | 17 (5.2%) |
| $25,000 to $49,999 | 874 (90.8%) | 88 (9.1%) |
| $50,000 to $74,999 | 1,356 (100.0%) | 0 (0.0%) |
| $75,000 to $99,999 | 1,021 (98.8%) | 12 (1.2%) |
| $100,000 and over | 1,778 (89.8%) | 201 (10.2%) |
Public vs Private Health Insurance Coverage by Age in Enola
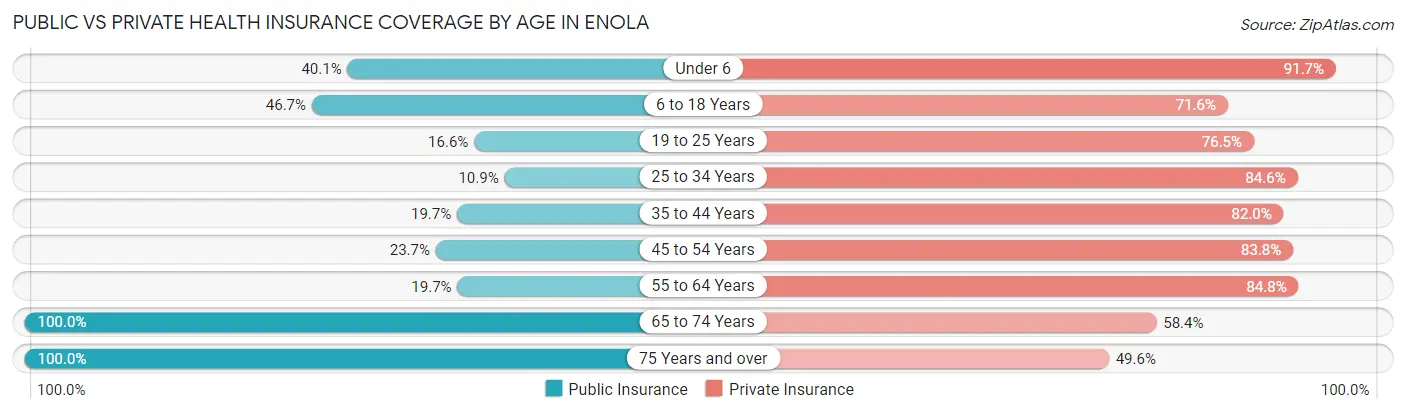
| Age Bracket | Public Insurance | Private Insurance |
| Under 6 | 111 (40.1%) | 254 (91.7%) |
| 6 to 18 Years | 344 (46.7%) | 528 (71.6%) |
| 19 to 25 Years | 162 (16.6%) | 748 (76.5%) |
| 25 to 34 Years | 95 (10.9%) | 735 (84.6%) |
| 35 to 44 Years | 148 (19.7%) | 615 (82.0%) |
| 45 to 54 Years | 182 (23.7%) | 644 (83.8%) |
| 55 to 64 Years | 129 (19.7%) | 556 (84.8%) |
| 65 to 74 Years | 567 (100.0%) | 331 (58.4%) |
| 75 Years and over | 335 (100.0%) | 166 (49.5%) |
| Total | 2,073 (34.9%) | 4,577 (77.1%) |
Disability Status by Sex by Age in Enola
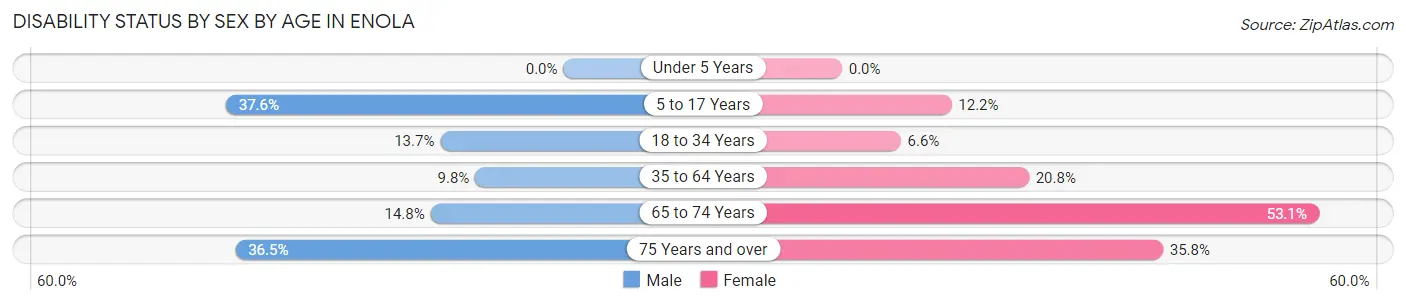
| Age Bracket | Male | Female |
| Under 5 Years | 0 (0.0%) | 0 (0.0%) |
| 5 to 17 Years | 153 (37.6%) | 35 (12.2%) |
| 18 to 34 Years | 154 (13.7%) | 54 (6.6%) |
| 35 to 64 Years | 99 (9.8%) | 243 (20.8%) |
| 65 to 74 Years | 46 (14.8%) | 136 (53.1%) |
| 75 Years and over | 57 (36.5%) | 64 (35.7%) |
Disability Class by Sex by Age in Enola
Disability Class: Hearing Difficulty
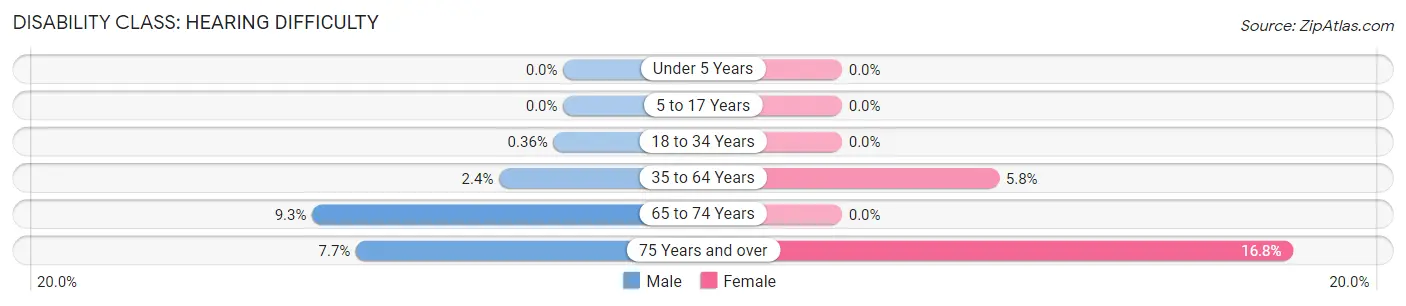
| Age Bracket | Male | Female |
| Under 5 Years | 0 (0.0%) | 0 (0.0%) |
| 5 to 17 Years | 0 (0.0%) | 0 (0.0%) |
| 18 to 34 Years | 4 (0.4%) | 0 (0.0%) |
| 35 to 64 Years | 24 (2.4%) | 68 (5.8%) |
| 65 to 74 Years | 29 (9.3%) | 0 (0.0%) |
| 75 Years and over | 12 (7.7%) | 30 (16.8%) |
Disability Class: Vision Difficulty
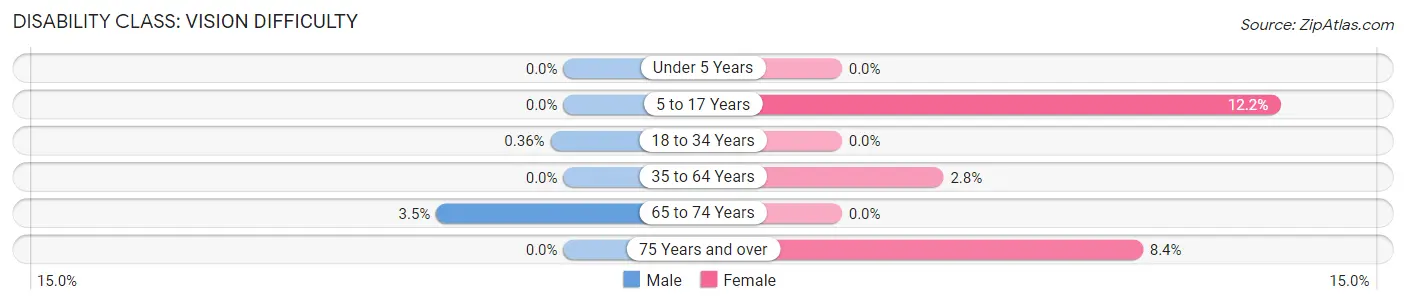
| Age Bracket | Male | Female |
| Under 5 Years | 0 (0.0%) | 0 (0.0%) |
| 5 to 17 Years | 0 (0.0%) | 35 (12.2%) |
| 18 to 34 Years | 4 (0.4%) | 0 (0.0%) |
| 35 to 64 Years | 0 (0.0%) | 33 (2.8%) |
| 65 to 74 Years | 11 (3.5%) | 0 (0.0%) |
| 75 Years and over | 0 (0.0%) | 15 (8.4%) |
Disability Class: Cognitive Difficulty
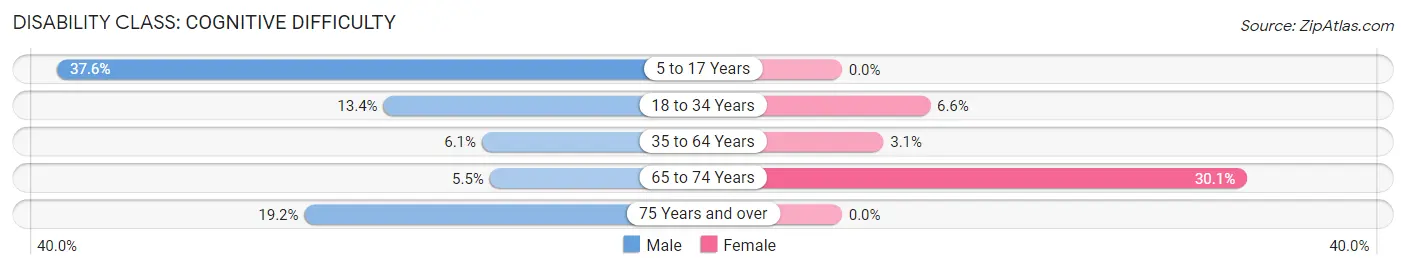
| Age Bracket | Male | Female |
| 5 to 17 Years | 153 (37.6%) | 0 (0.0%) |
| 18 to 34 Years | 150 (13.4%) | 54 (6.6%) |
| 35 to 64 Years | 61 (6.0%) | 36 (3.1%) |
| 65 to 74 Years | 17 (5.5%) | 77 (30.1%) |
| 75 Years and over | 30 (19.2%) | 0 (0.0%) |
Disability Class: Ambulatory Difficulty
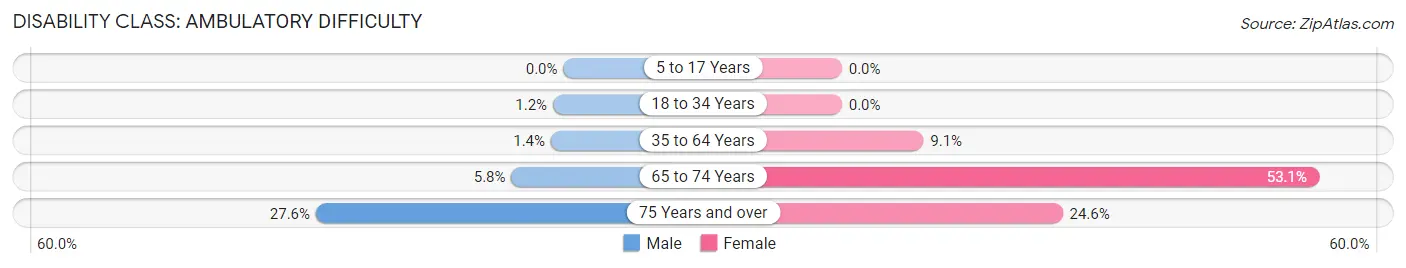
| Age Bracket | Male | Female |
| 5 to 17 Years | 0 (0.0%) | 0 (0.0%) |
| 18 to 34 Years | 13 (1.2%) | 0 (0.0%) |
| 35 to 64 Years | 14 (1.4%) | 106 (9.1%) |
| 65 to 74 Years | 18 (5.8%) | 136 (53.1%) |
| 75 Years and over | 43 (27.6%) | 44 (24.6%) |
Disability Class: Self-Care Difficulty
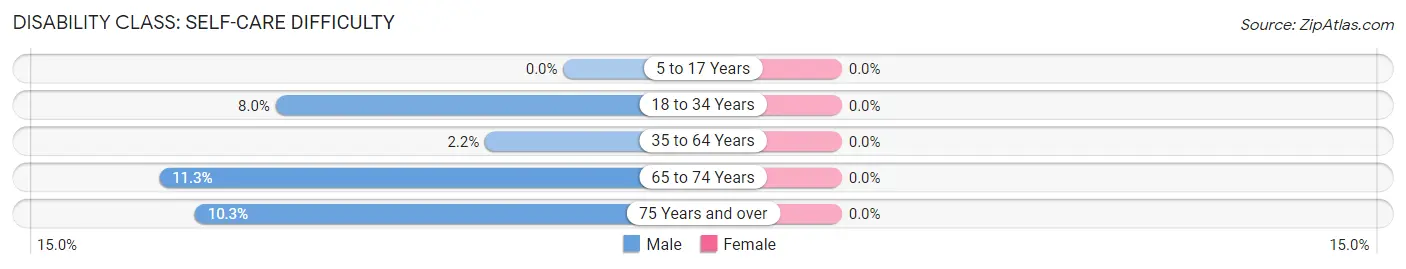
| Age Bracket | Male | Female |
| 5 to 17 Years | 0 (0.0%) | 0 (0.0%) |
| 18 to 34 Years | 90 (8.0%) | 0 (0.0%) |
| 35 to 64 Years | 22 (2.2%) | 0 (0.0%) |
| 65 to 74 Years | 35 (11.3%) | 0 (0.0%) |
| 75 Years and over | 16 (10.3%) | 0 (0.0%) |
Technology Access in Enola
Computing Device Access in Enola
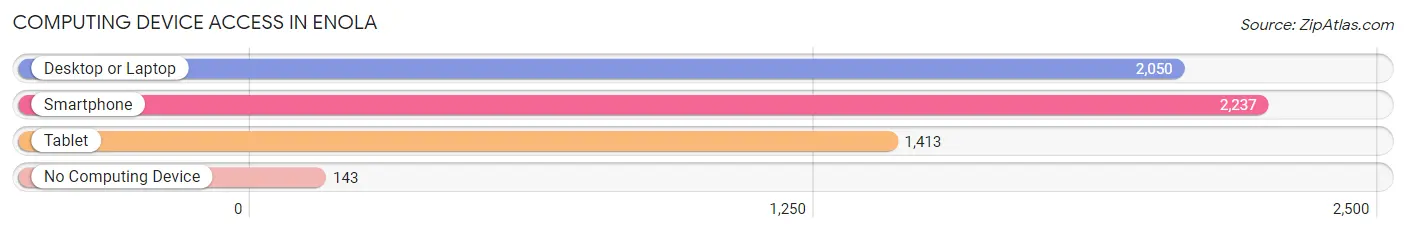
| Device Type | # Households | % Households |
| Desktop or Laptop | 2,050 | 78.5% |
| Smartphone | 2,237 | 85.7% |
| Tablet | 1,413 | 54.1% |
| No Computing Device | 143 | 5.5% |
| Total | 2,610 | 100.0% |
Internet Access in Enola
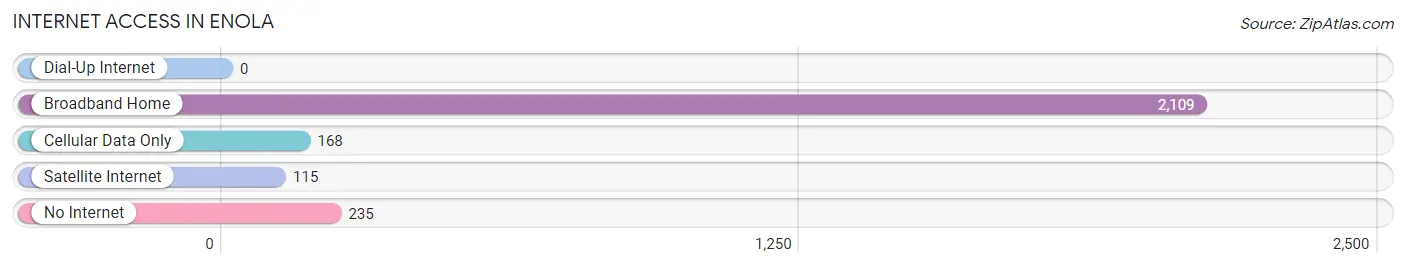
| Internet Type | # Households | % Households |
| Dial-Up Internet | 0 | 0.0% |
| Broadband Home | 2,109 | 80.8% |
| Cellular Data Only | 168 | 6.4% |
| Satellite Internet | 115 | 4.4% |
| No Internet | 235 | 9.0% |
| Total | 2,610 | 100.0% |
Enola Summary
Enola, Pennsylvania is a small borough located in Cumberland County, Pennsylvania. It is situated along the Susquehanna River, just north of the state capital of Harrisburg. The population of Enola was 4,717 at the 2010 census.
History
Enola was first settled in 1790 by a group of German immigrants. The town was originally known as “Enola’s Town”, named after the daughter of one of the settlers. The town was officially incorporated in 1891.
During the 19th century, Enola was a major hub for the Pennsylvania Railroad. The railroad was the primary means of transportation for the town, and it was also the main source of employment for the residents. The railroad was also responsible for the growth of the town, as it brought in new businesses and industries.
In the early 20th century, Enola was a popular tourist destination. The town was known for its scenic views of the Susquehanna River and its many parks and recreational areas.
Geography
Enola is located in Cumberland County, Pennsylvania. It is situated along the Susquehanna River, just north of the state capital of Harrisburg. The town is bordered by East Pennsboro Township to the north, Hampden Township to the east, and Lower Allen Township to the south.
The terrain of Enola is mostly flat, with some rolling hills. The town is located in the Appalachian Mountains, and the Susquehanna River runs through the center of town.
Economy
The economy of Enola is largely based on the service industry. The town is home to several restaurants, retail stores, and other businesses. The town is also home to a number of manufacturing companies, including a paper mill and a plastics factory.
The town is also home to a number of government offices, including the Cumberland County Courthouse and the Enola Post Office.
Demographics
As of the 2010 census, the population of Enola was 4,717. The racial makeup of the town was 94.3% White, 2.2% African American, 0.3% Native American, 0.7% Asian, 0.1% Pacific Islander, and 2.4% from other races. Hispanic or Latino of any race were 2.7% of the population.
The median household income in Enola was $45,945, and the median family income was $54,945. The per capita income for the town was $21,945. About 8.3% of families and 10.2% of the population were below the poverty line, including 14.2% of those under age 18 and 6.2% of those age 65 or over.
Enola is a small town with a rich history and a diverse population. The town is home to a number of businesses and industries, and it is a popular tourist destination. The town is also home to a number of government offices, making it an important part of the local economy.
Common Questions
What is Per Capita Income in Enola?
Per Capita income in Enola is $35,360.
What is the Median Family Income in Enola?
Median Family Income in Enola is $76,291.
What is the Median Household income in Enola?
Median Household Income in Enola is $65,517.
What is Income or Wage Gap in Enola?
Income or Wage Gap in Enola is 26.9%.
Women in Enola earn 73.1 cents for every dollar earned by a man.
What is Inequality or Gini Index in Enola?
Inequality or Gini Index in Enola is 0.37.
What is the Total Population of Enola?
Total Population of Enola is 5,986.
What is the Total Male Population of Enola?
Total Male Population of Enola is 3,154.
What is the Total Female Population of Enola?
Total Female Population of Enola is 2,832.
What is the Ratio of Males per 100 Females in Enola?
There are 111.37 Males per 100 Females in Enola.
What is the Ratio of Females per 100 Males in Enola?
There are 89.79 Females per 100 Males in Enola.
What is the Median Population Age in Enola?
Median Population Age in Enola is 35.8 Years.
What is the Average Family Size in Enola
Average Family Size in Enola is 3.2 People.
What is the Average Household Size in Enola
Average Household Size in Enola is 2.2 People.
How Large is the Labor Force in Enola?
There are 3,861 People in the Labor Forcein in Enola.
What is the Percentage of People in the Labor Force in Enola?
75.7% of People are in the Labor Force in Enola.
What is the Unemployment Rate in Enola?
Unemployment Rate in Enola is 6.8%.