Sycamore, IL Map & Demographics
Sycamore Map
Sycamore Overview
$39,364
PER CAPITA INCOME
$101,778
AVG FAMILY INCOME
$80,785
AVG HOUSEHOLD INCOME
36.3%
WAGE / INCOME GAP [ % ]
63.7¢/ $1
WAGE / INCOME GAP [ $ ]
$8,383
FAMILY INCOME DEFICIT
0.39
INEQUALITY / GINI INDEX
18,171
TOTAL POPULATION
8,478
MALE POPULATION
9,693
FEMALE POPULATION
87.47
MALES / 100 FEMALES
114.33
FEMALES / 100 MALES
37.9
MEDIAN AGE
3.0
AVG FAMILY SIZE
2.4
AVG HOUSEHOLD SIZE
9,924
LABOR FORCE [ PEOPLE ]
69.5%
PERCENT IN LABOR FORCE
3.2%
UNEMPLOYMENT RATE
Sycamore Zip Codes
Sycamore Area Codes
Income in Sycamore
Income Overview in Sycamore
Per Capita Income in Sycamore is $39,364, while median incomes of families and households are $101,778 and $80,785 respectively.
| Characteristic | Number | Measure |
| Per Capita Income | 18,171 | $39,364 |
| Median Family Income | 4,853 | $101,778 |
| Mean Family Income | 4,853 | $113,453 |
| Median Household Income | 7,397 | $80,785 |
| Mean Household Income | 7,397 | $96,421 |
| Income Deficit | 4,853 | $8,383 |
| Wage / Income Gap (%) | 18,171 | 36.26% |
| Wage / Income Gap ($) | 18,171 | 63.74¢ per $1 |
| Gini / Inequality Index | 18,171 | 0.39 |
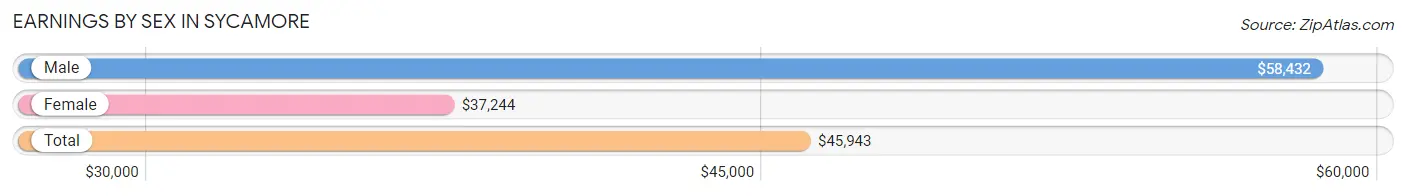
Earnings by Sex in Sycamore
Average Earnings in Sycamore are $45,943, $58,432 for men and $37,244 for women, a difference of 36.3%.
| Sex | Number | Average Earnings |
| Male | 4,785 (46.8%) | $58,432 |
| Female | 5,450 (53.2%) | $37,244 |
| Total | 10,235 (100.0%) | $45,943 |
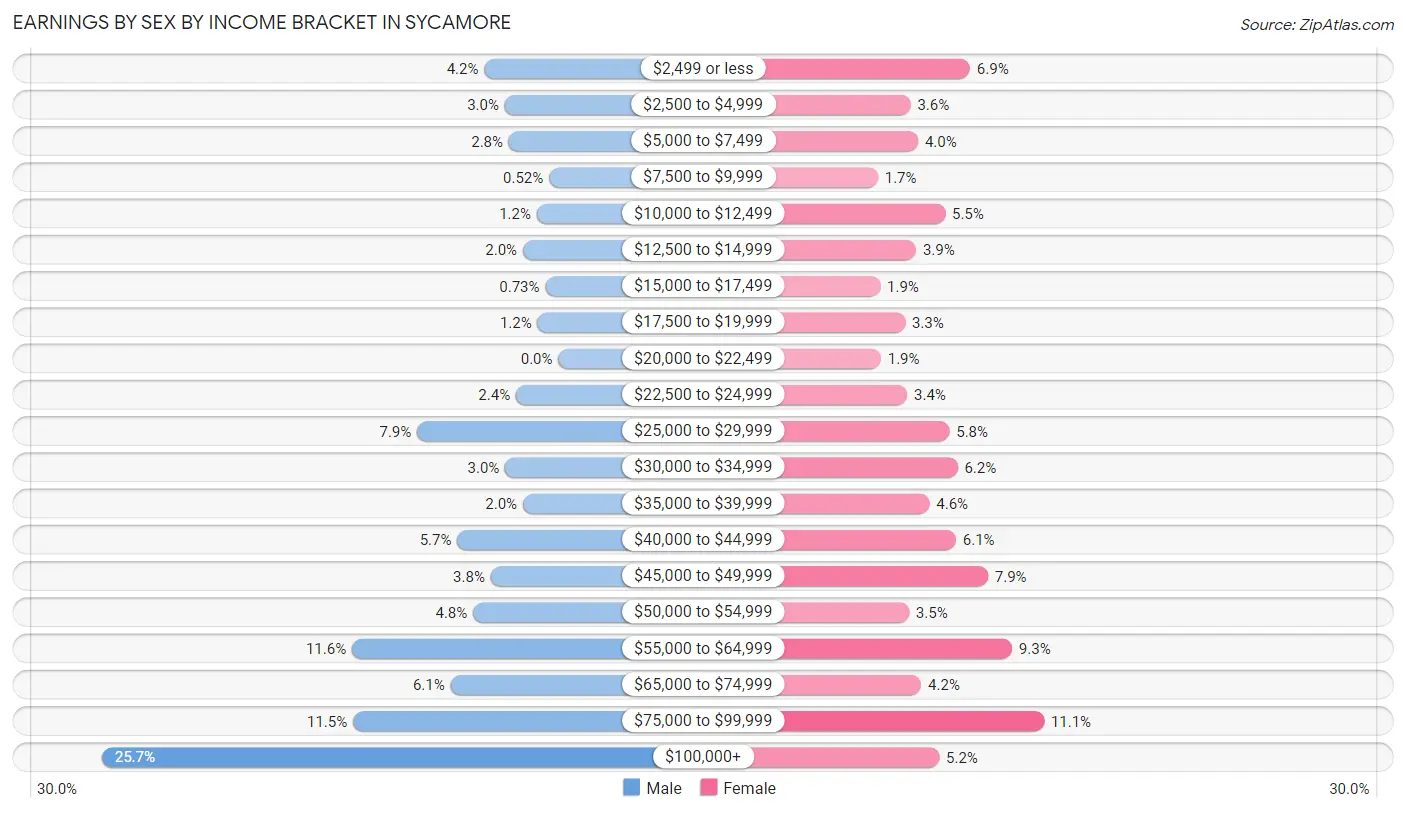
Earnings by Sex by Income Bracket in Sycamore
The most common earnings brackets in Sycamore are $100,000+ for men (1,228 | 25.7%) and $75,000 to $99,999 for women (604 | 11.1%).
| Income | Male | Female |
| $2,499 or less | 199 (4.2%) | 377 (6.9%) |
| $2,500 to $4,999 | 144 (3.0%) | 195 (3.6%) |
| $5,000 to $7,499 | 133 (2.8%) | 218 (4.0%) |
| $7,500 to $9,999 | 25 (0.5%) | 95 (1.7%) |
| $10,000 to $12,499 | 58 (1.2%) | 301 (5.5%) |
| $12,500 to $14,999 | 95 (2.0%) | 212 (3.9%) |
| $15,000 to $17,499 | 35 (0.7%) | 102 (1.9%) |
| $17,500 to $19,999 | 56 (1.2%) | 178 (3.3%) |
| $20,000 to $22,499 | 0 (0.0%) | 104 (1.9%) |
| $22,500 to $24,999 | 114 (2.4%) | 185 (3.4%) |
| $25,000 to $29,999 | 380 (7.9%) | 314 (5.8%) |
| $30,000 to $34,999 | 143 (3.0%) | 339 (6.2%) |
| $35,000 to $39,999 | 95 (2.0%) | 253 (4.6%) |
| $40,000 to $44,999 | 272 (5.7%) | 334 (6.1%) |
| $45,000 to $49,999 | 182 (3.8%) | 432 (7.9%) |
| $50,000 to $54,999 | 229 (4.8%) | 190 (3.5%) |
| $55,000 to $64,999 | 555 (11.6%) | 506 (9.3%) |
| $65,000 to $74,999 | 290 (6.1%) | 228 (4.2%) |
| $75,000 to $99,999 | 552 (11.5%) | 604 (11.1%) |
| $100,000+ | 1,228 (25.7%) | 283 (5.2%) |
| Total | 4,785 (100.0%) | 5,450 (100.0%) |
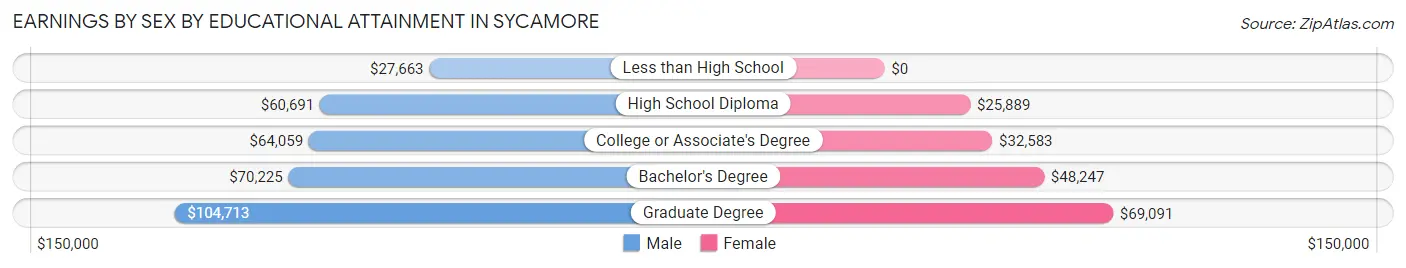
Earnings by Sex by Educational Attainment in Sycamore
Average earnings in Sycamore are $66,493 for men and $44,492 for women, a difference of 33.1%. Men with an educational attainment of graduate degree enjoy the highest average annual earnings of $104,713, while those with less than high school education earn the least with $27,663. Women with an educational attainment of graduate degree earn the most with the average annual earnings of $69,091, while those with high school diploma education have the smallest earnings of $25,889.
| Educational Attainment | Male Income | Female Income |
| Less than High School | $27,663 | $0 |
| High School Diploma | $60,691 | $25,889 |
| College or Associate's Degree | $64,059 | $32,583 |
| Bachelor's Degree | $70,225 | $48,247 |
| Graduate Degree | $104,713 | $69,091 |
| Total | $66,493 | $44,492 |
Family Income in Sycamore
Family Income Brackets in Sycamore
According to the Sycamore family income data, there are 1,233 families falling into the $100,000 to $149,999 income range, which is the most common income bracket and makes up 25.4% of all families. Conversely, the $10,000 to $14,999 income bracket is the least frequent group with only 63 families (1.3%) belonging to this category.
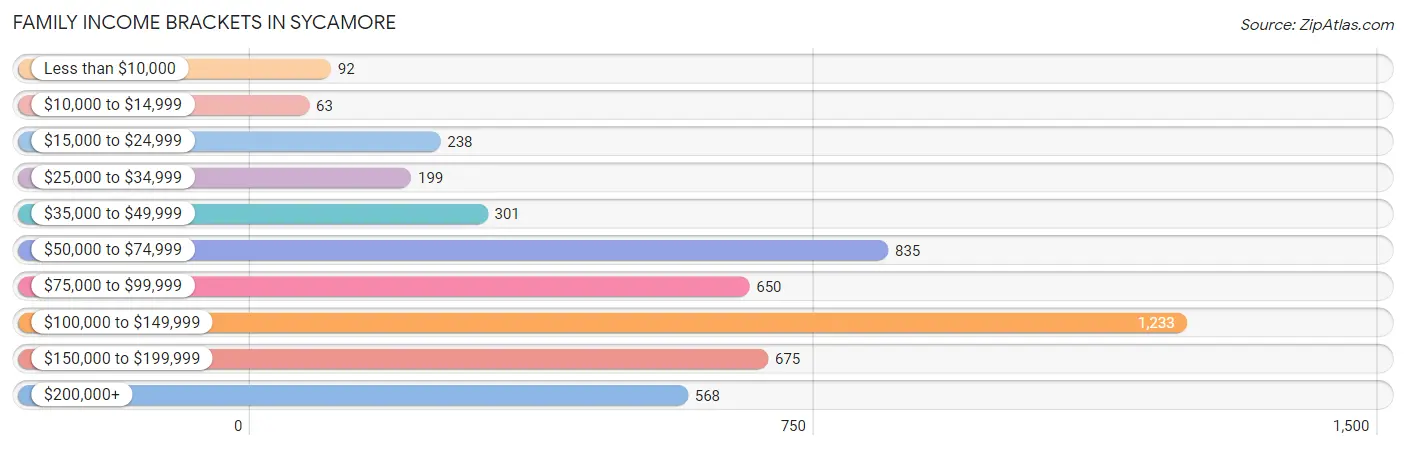
| Income Bracket | # Families | % Families |
| Less than $10,000 | 92 | 1.9% |
| $10,000 to $14,999 | 63 | 1.3% |
| $15,000 to $24,999 | 238 | 4.9% |
| $25,000 to $34,999 | 199 | 4.1% |
| $35,000 to $49,999 | 301 | 6.2% |
| $50,000 to $74,999 | 835 | 17.2% |
| $75,000 to $99,999 | 650 | 13.4% |
| $100,000 to $149,999 | 1,233 | 25.4% |
| $150,000 to $199,999 | 675 | 13.9% |
| $200,000+ | 568 | 11.7% |
Family Income by Famaliy Size in Sycamore
4-person families (667 | 13.7%) account for the highest median family income in Sycamore with $144,013 per family, while 2-person families (2,561 | 52.8%) have the highest median income of $41,062 per family member.
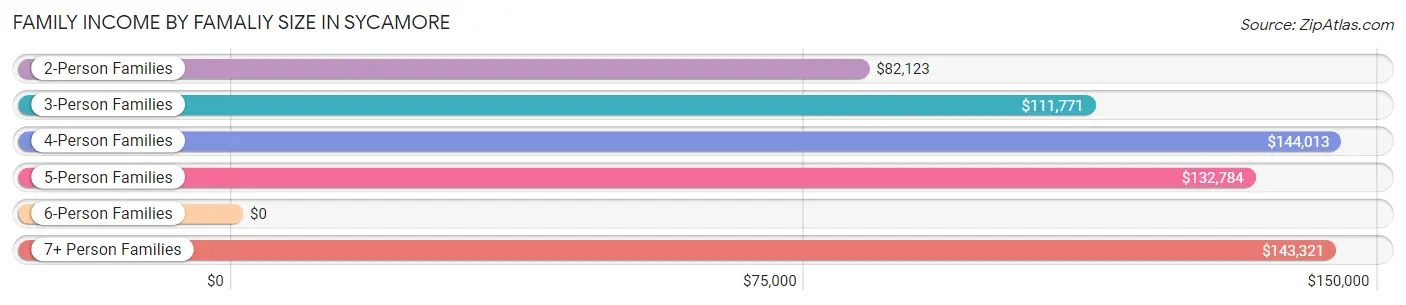
| Income Bracket | # Families | Median Income |
| 2-Person Families | 2,561 (52.8%) | $82,123 |
| 3-Person Families | 1,015 (20.9%) | $111,771 |
| 4-Person Families | 667 (13.7%) | $144,013 |
| 5-Person Families | 468 (9.6%) | $132,784 |
| 6-Person Families | 52 (1.1%) | $0 |
| 7+ Person Families | 90 (1.8%) | $143,321 |
| Total | 4,853 (100.0%) | $101,778 |
Family Income by Number of Earners in Sycamore
The median family income in Sycamore is $101,778, with families comprising 3+ earners (549) having the highest median family income of $160,568, while families with no earners (833) have the lowest median family income of $54,397, accounting for 11.3% and 17.2% of families, respectively.
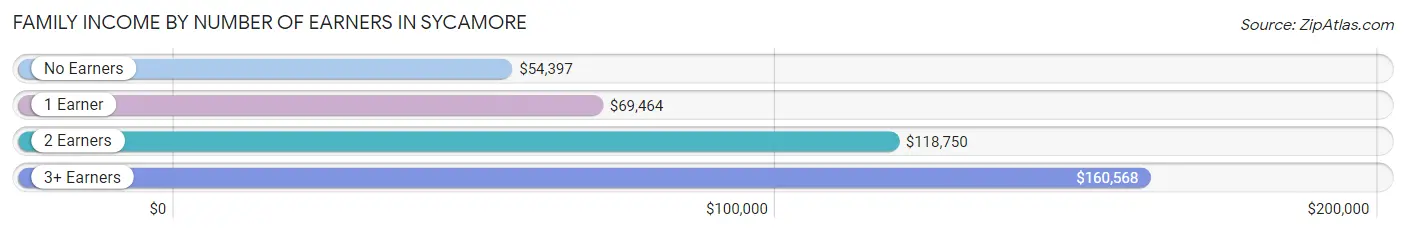
| Number of Earners | # Families | Median Income |
| No Earners | 833 (17.2%) | $54,397 |
| 1 Earner | 1,258 (25.9%) | $69,464 |
| 2 Earners | 2,213 (45.6%) | $118,750 |
| 3+ Earners | 549 (11.3%) | $160,568 |
| Total | 4,853 (100.0%) | $101,778 |
Household Income in Sycamore
Household Income Brackets in Sycamore
With 1,487 households falling in the category, the $100,000 to $149,999 income range is the most frequent in Sycamore, accounting for 20.1% of all households. In contrast, only 141 households (1.9%) fall into the less than $10,000 income bracket, making it the least populous group.
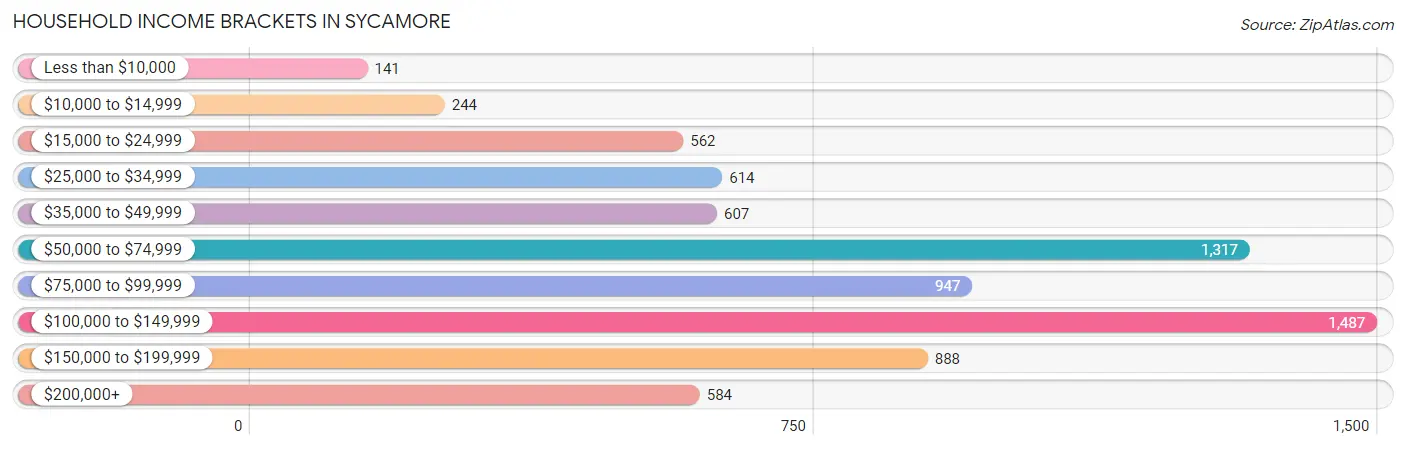
| Income Bracket | # Households | % Households |
| Less than $10,000 | 141 | 1.9% |
| $10,000 to $14,999 | 244 | 3.3% |
| $15,000 to $24,999 | 562 | 7.6% |
| $25,000 to $34,999 | 614 | 8.3% |
| $35,000 to $49,999 | 607 | 8.2% |
| $50,000 to $74,999 | 1,317 | 17.8% |
| $75,000 to $99,999 | 947 | 12.8% |
| $100,000 to $149,999 | 1,487 | 20.1% |
| $150,000 to $199,999 | 888 | 12.0% |
| $200,000+ | 584 | 7.9% |
Household Income by Householder Age in Sycamore
The median household income in Sycamore is $80,785, with the highest median household income of $107,161 found in the 45 to 64 years age bracket for the primary householder. A total of 2,545 households (34.4%) fall into this category. Meanwhile, the 15 to 24 years age bracket for the primary householder has the lowest median household income of $0, with 434 households (5.9%) in this group.
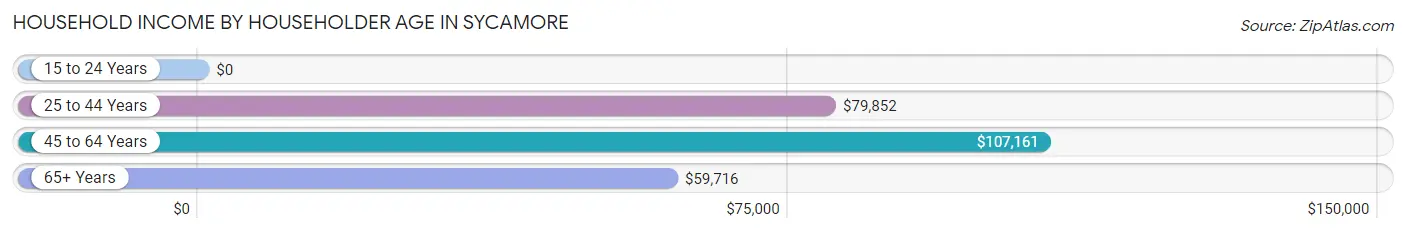
| Income Bracket | # Households | Median Income |
| 15 to 24 Years | 434 (5.9%) | $0 |
| 25 to 44 Years | 2,671 (36.1%) | $79,852 |
| 45 to 64 Years | 2,545 (34.4%) | $107,161 |
| 65+ Years | 1,747 (23.6%) | $59,716 |
| Total | 7,397 (100.0%) | $80,785 |
Poverty in Sycamore
Income Below Poverty by Sex and Age in Sycamore
With 7.9% poverty level for males and 7.7% for females among the residents of Sycamore, 65 to 74 year old males and 16 and 17 year old females are the most vulnerable to poverty, with 166 males (24.7%) and 53 females (24.1%) in their respective age groups living below the poverty level.
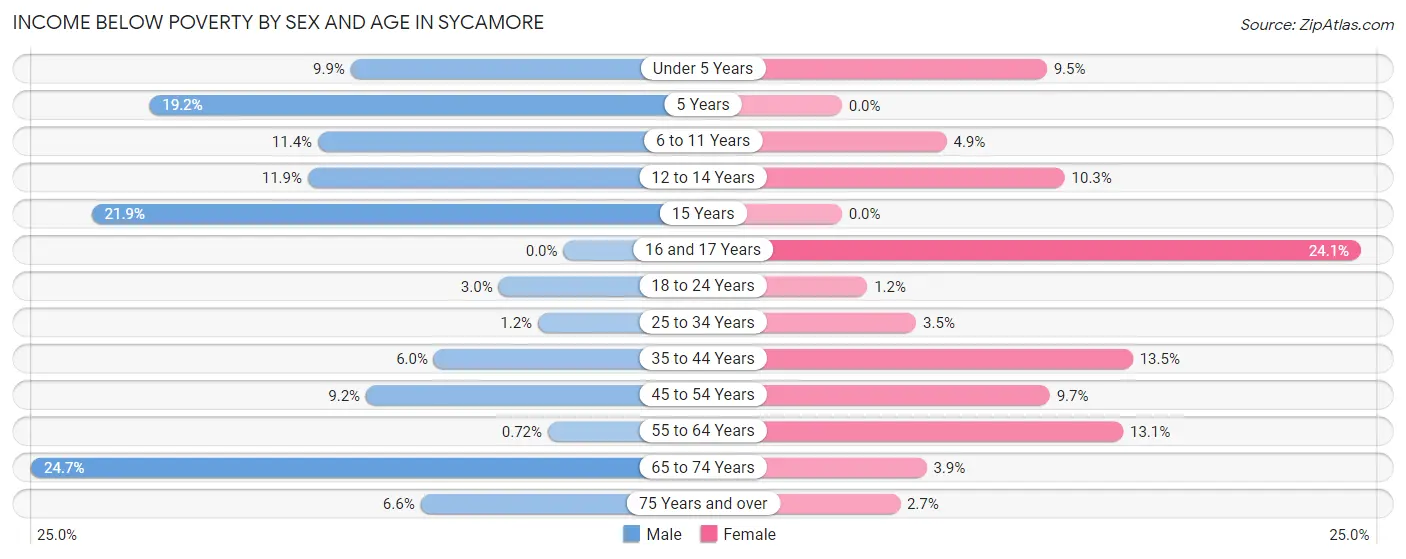
| Age Bracket | Male | Female |
| Under 5 Years | 53 (9.9%) | 39 (9.5%) |
| 5 Years | 29 (19.2%) | 0 (0.0%) |
| 6 to 11 Years | 81 (11.4%) | 44 (4.9%) |
| 12 to 14 Years | 37 (11.9%) | 42 (10.3%) |
| 15 Years | 51 (21.9%) | 0 (0.0%) |
| 16 and 17 Years | 0 (0.0%) | 53 (24.1%) |
| 18 to 24 Years | 25 (3.0%) | 12 (1.2%) |
| 25 to 34 Years | 10 (1.2%) | 44 (3.5%) |
| 35 to 44 Years | 67 (6.0%) | 184 (13.5%) |
| 45 to 54 Years | 99 (9.2%) | 113 (9.7%) |
| 55 to 64 Years | 8 (0.7%) | 160 (13.1%) |
| 65 to 74 Years | 166 (24.7%) | 35 (3.9%) |
| 75 Years and over | 36 (6.6%) | 15 (2.7%) |
| Total | 662 (7.9%) | 741 (7.7%) |
Income Above Poverty by Sex and Age in Sycamore
According to the poverty statistics in Sycamore, males aged 16 and 17 years and females aged 5 years are the age groups that are most secure financially, with 100.0% of males and 100.0% of females in these age groups living above the poverty line.
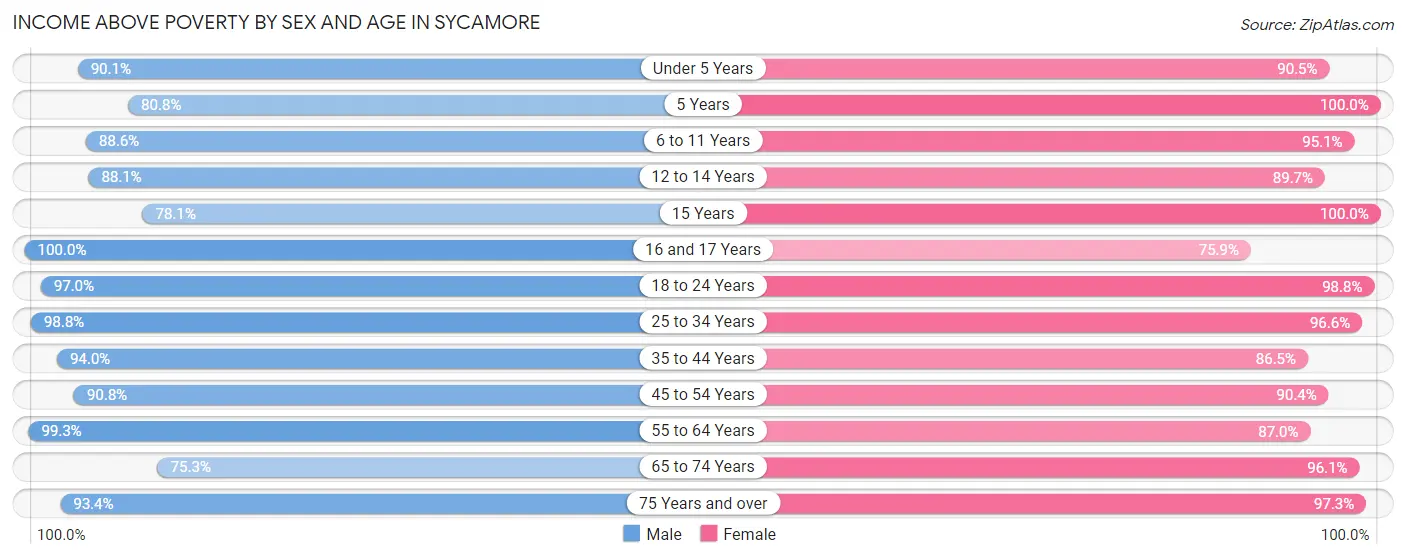
| Age Bracket | Male | Female |
| Under 5 Years | 484 (90.1%) | 371 (90.5%) |
| 5 Years | 122 (80.8%) | 39 (100.0%) |
| 6 to 11 Years | 630 (88.6%) | 862 (95.1%) |
| 12 to 14 Years | 275 (88.1%) | 364 (89.7%) |
| 15 Years | 182 (78.1%) | 174 (100.0%) |
| 16 and 17 Years | 239 (100.0%) | 167 (75.9%) |
| 18 to 24 Years | 805 (97.0%) | 1,002 (98.8%) |
| 25 to 34 Years | 837 (98.8%) | 1,233 (96.6%) |
| 35 to 44 Years | 1,047 (94.0%) | 1,179 (86.5%) |
| 45 to 54 Years | 982 (90.8%) | 1,058 (90.3%) |
| 55 to 64 Years | 1,108 (99.3%) | 1,066 (87.0%) |
| 65 to 74 Years | 506 (75.3%) | 856 (96.1%) |
| 75 Years and over | 507 (93.4%) | 540 (97.3%) |
| Total | 7,724 (92.1%) | 8,911 (92.3%) |
Income Below Poverty Among Married-Couple Families in Sycamore
The poverty statistics for married-couple families in Sycamore show that 5.4% or 196 of the total 3,631 families live below the poverty line. Families with 3 or 4 children have the highest poverty rate of 8.4%, comprising of 29 families. On the other hand, families with 1 or 2 children have the lowest poverty rate of 0.0%, which includes 0 families.
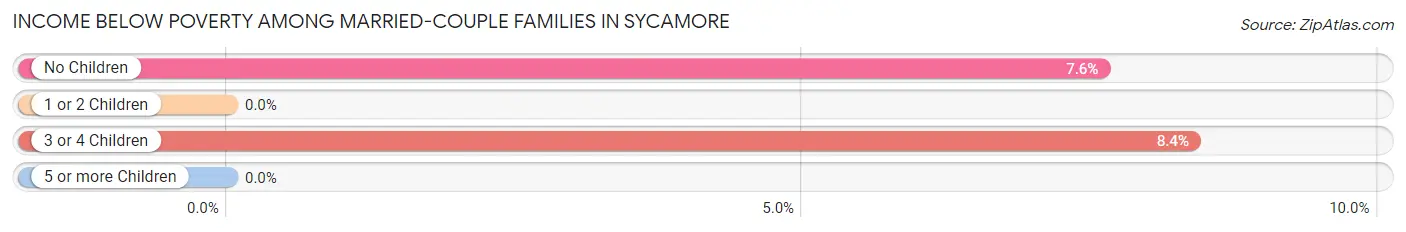
| Children | Above Poverty | Below Poverty |
| No Children | 2,032 (92.4%) | 167 (7.6%) |
| 1 or 2 Children | 1,070 (100.0%) | 0 (0.0%) |
| 3 or 4 Children | 317 (91.6%) | 29 (8.4%) |
| 5 or more Children | 16 (100.0%) | 0 (0.0%) |
| Total | 3,435 (94.6%) | 196 (5.4%) |
Income Below Poverty Among Single-Parent Households in Sycamore
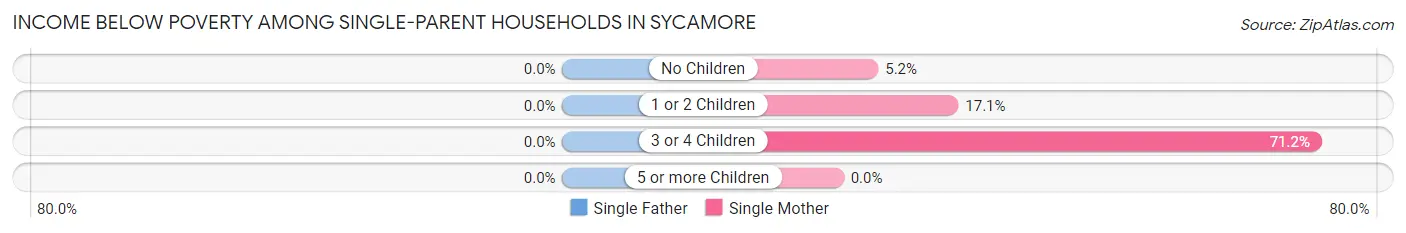
| Children | Single Father | Single Mother |
| No Children | 0 (0.0%) | 16 (5.2%) |
| 1 or 2 Children | 0 (0.0%) | 102 (17.1%) |
| 3 or 4 Children | 0 (0.0%) | 52 (71.2%) |
| 5 or more Children | 0 (0.0%) | 0 (0.0%) |
| Total | 0 (0.0%) | 170 (17.3%) |
Income Below Poverty Among Married-Couple vs Single-Parent Households in Sycamore
The poverty data for Sycamore shows that 196 of the married-couple family households (5.4%) and 170 of the single-parent households (13.9%) are living below the poverty level. Within the married-couple family households, those with 3 or 4 children have the highest poverty rate, with 29 households (8.4%) falling below the poverty line. Among the single-parent households, those with 3 or 4 children have the highest poverty rate, with 52 household (41.6%) living below poverty.
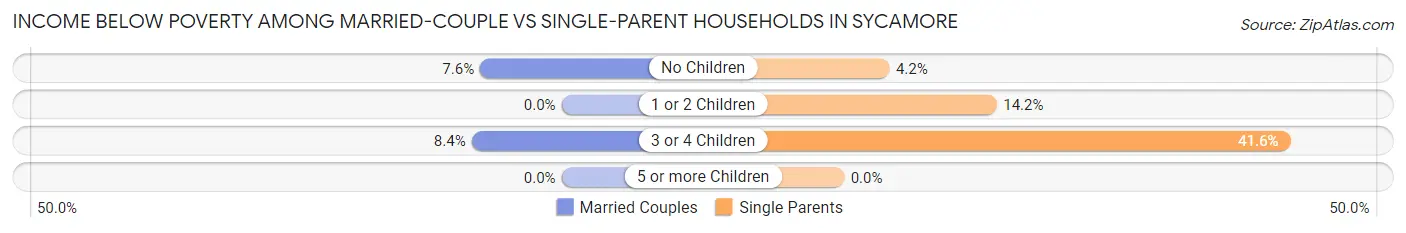
| Children | Married-Couple Families | Single-Parent Households |
| No Children | 167 (7.6%) | 16 (4.2%) |
| 1 or 2 Children | 0 (0.0%) | 102 (14.2%) |
| 3 or 4 Children | 29 (8.4%) | 52 (41.6%) |
| 5 or more Children | 0 (0.0%) | 0 (0.0%) |
| Total | 196 (5.4%) | 170 (13.9%) |
Race in Sycamore
The most populous races in Sycamore are White / Caucasian (16,311 | 89.8%), Hispanic or Latino (1,615 | 8.9%), and Two or more Races (666 | 3.7%).
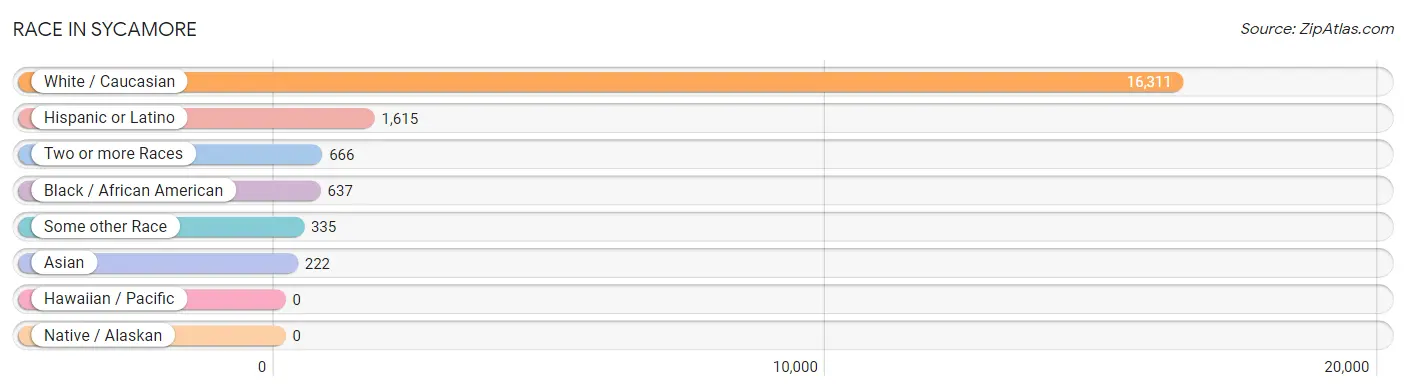
| Race | # Population | % Population |
| Asian | 222 | 1.2% |
| Black / African American | 637 | 3.5% |
| Hawaiian / Pacific | 0 | 0.0% |
| Hispanic or Latino | 1,615 | 8.9% |
| Native / Alaskan | 0 | 0.0% |
| White / Caucasian | 16,311 | 89.8% |
| Two or more Races | 666 | 3.7% |
| Some other Race | 335 | 1.8% |
| Total | 18,171 | 100.0% |
Ancestry in Sycamore
The most populous ancestries reported in Sycamore are German (5,096 | 28.0%), Irish (2,678 | 14.7%), English (1,935 | 10.6%), Italian (1,786 | 9.8%), and Swedish (1,295 | 7.1%), together accounting for 70.4% of all Sycamore residents.
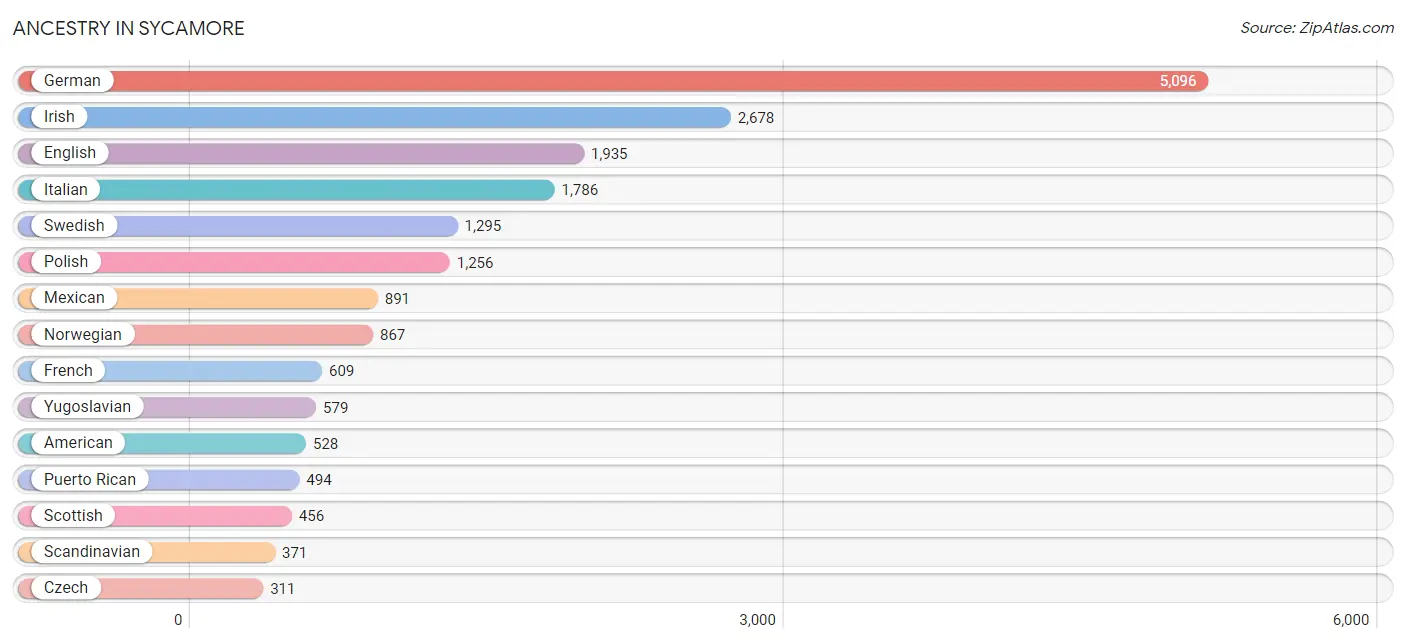
| Ancestry | # Population | % Population |
| African | 50 | 0.3% |
| American | 528 | 2.9% |
| Armenian | 11 | 0.1% |
| Assyrian / Chaldean / Syriac | 19 | 0.1% |
| Austrian | 90 | 0.5% |
| Belgian | 27 | 0.2% |
| Bhutanese | 1 | 0.0% |
| British | 49 | 0.3% |
| Bulgarian | 35 | 0.2% |
| Burmese | 59 | 0.3% |
| Cherokee | 45 | 0.3% |
| Colombian | 77 | 0.4% |
| Croatian | 36 | 0.2% |
| Czech | 311 | 1.7% |
| Czechoslovakian | 79 | 0.4% |
| Danish | 217 | 1.2% |
| Dutch | 124 | 0.7% |
| Eastern European | 28 | 0.2% |
| English | 1,935 | 10.6% |
| European | 273 | 1.5% |
| Finnish | 116 | 0.6% |
| French | 609 | 3.4% |
| French Canadian | 124 | 0.7% |
| German | 5,096 | 28.0% |
| Greek | 311 | 1.7% |
| Hungarian | 77 | 0.4% |
| Indian (Asian) | 122 | 0.7% |
| Irish | 2,678 | 14.7% |
| Iroquois | 11 | 0.1% |
| Israeli | 2 | 0.0% |
| Italian | 1,786 | 9.8% |
| Jamaican | 7 | 0.0% |
| Japanese | 14 | 0.1% |
| Lithuanian | 156 | 0.9% |
| Luxembourger | 9 | 0.1% |
| Malaysian | 11 | 0.1% |
| Mexican | 891 | 4.9% |
| Native Hawaiian | 1 | 0.0% |
| Northern European | 77 | 0.4% |
| Norwegian | 867 | 4.8% |
| Pennsylvania German | 8 | 0.0% |
| Polish | 1,256 | 6.9% |
| Portuguese | 21 | 0.1% |
| Puerto Rican | 494 | 2.7% |
| Romanian | 36 | 0.2% |
| Russian | 62 | 0.3% |
| Scandinavian | 371 | 2.0% |
| Scotch-Irish | 116 | 0.6% |
| Scottish | 456 | 2.5% |
| Serbian | 75 | 0.4% |
| Slovak | 35 | 0.2% |
| South American | 77 | 0.4% |
| Spaniard | 118 | 0.6% |
| Spanish | 32 | 0.2% |
| Subsaharan African | 50 | 0.3% |
| Swedish | 1,295 | 7.1% |
| Thai | 89 | 0.5% |
| Turkish | 43 | 0.2% |
| Ukrainian | 310 | 1.7% |
| Welsh | 58 | 0.3% |
| Yugoslavian | 579 | 3.2% | View All 61 Rows |
Immigrants in Sycamore
The most numerous immigrant groups reported in Sycamore came from Latin America (354 | 1.9%), Europe (297 | 1.6%), Central America (286 | 1.6%), Mexico (286 | 1.6%), and Eastern Europe (246 | 1.3%), together accounting for 8.1% of all Sycamore residents.
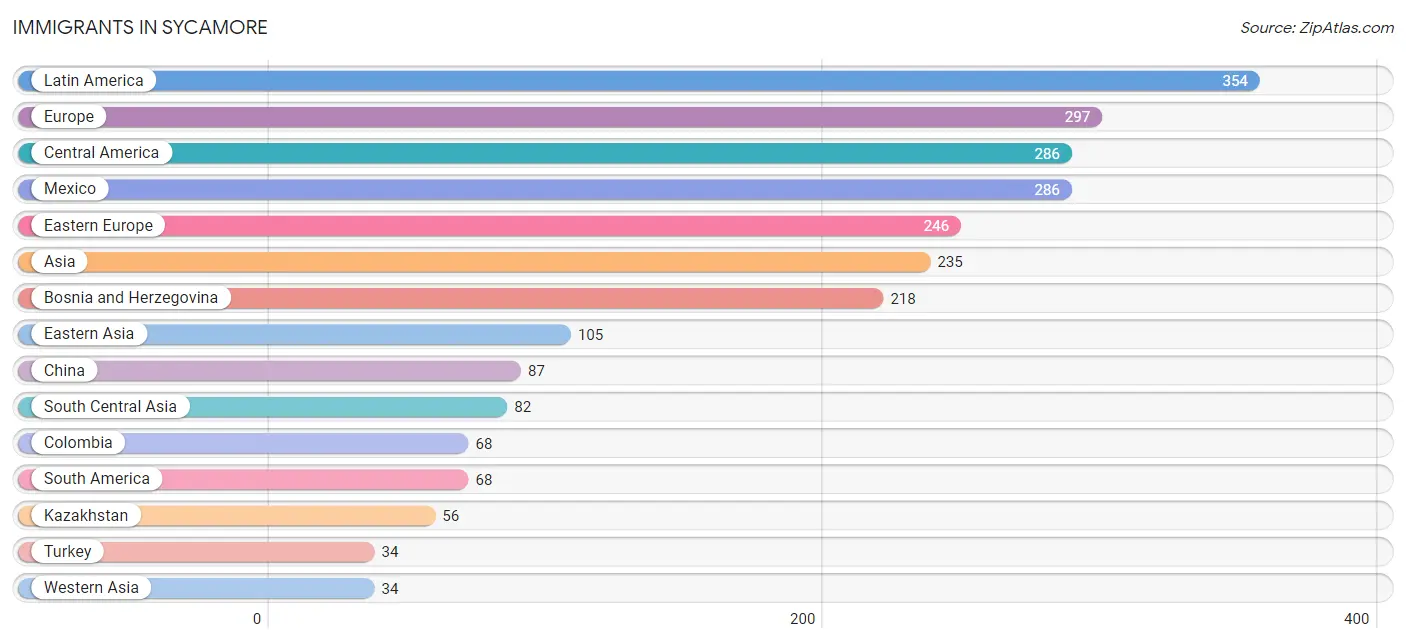
| Immigration Origin | # Population | % Population |
| Asia | 235 | 1.3% |
| Bosnia and Herzegovina | 218 | 1.2% |
| Bulgaria | 8 | 0.0% |
| Canada | 8 | 0.0% |
| Central America | 286 | 1.6% |
| China | 87 | 0.5% |
| Colombia | 68 | 0.4% |
| Eastern Asia | 105 | 0.6% |
| Eastern Europe | 246 | 1.3% |
| Europe | 297 | 1.6% |
| Germany | 3 | 0.0% |
| Hong Kong | 10 | 0.1% |
| India | 26 | 0.1% |
| Japan | 1 | 0.0% |
| Kazakhstan | 56 | 0.3% |
| Korea | 17 | 0.1% |
| Latin America | 354 | 1.9% |
| Mexico | 286 | 1.6% |
| Northern Europe | 16 | 0.1% |
| Norway | 16 | 0.1% |
| South America | 68 | 0.4% |
| South Central Asia | 82 | 0.4% |
| South Eastern Asia | 14 | 0.1% |
| Southern Europe | 32 | 0.2% |
| Spain | 32 | 0.2% |
| Turkey | 34 | 0.2% |
| Ukraine | 20 | 0.1% |
| Vietnam | 14 | 0.1% |
| Western Asia | 34 | 0.2% |
| Western Europe | 3 | 0.0% | View All 30 Rows |
Sex and Age in Sycamore
Sex and Age in Sycamore
The most populous age groups in Sycamore are 15 to 19 Years (777 | 9.2%) for men and 40 to 44 Years (751 | 7.7%) for women.
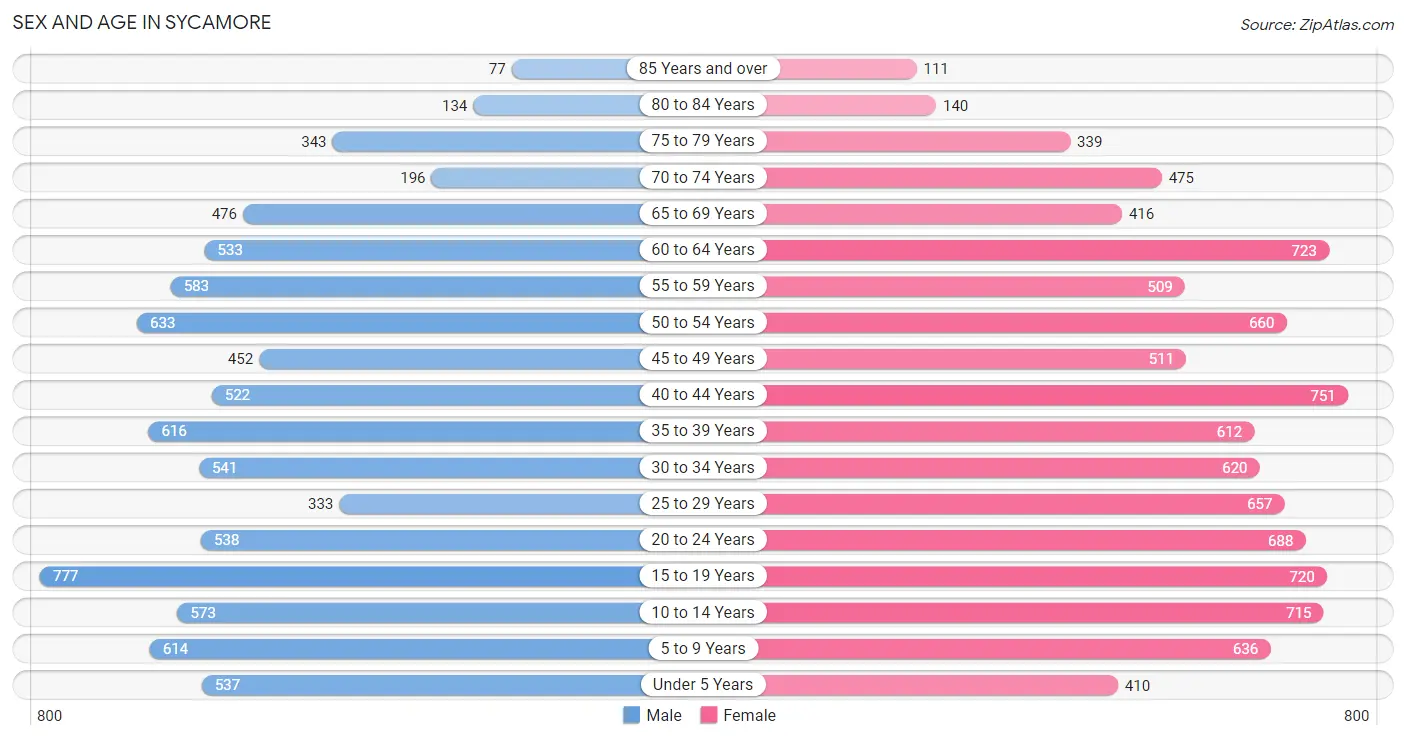
| Age Bracket | Male | Female |
| Under 5 Years | 537 (6.3%) | 410 (4.2%) |
| 5 to 9 Years | 614 (7.2%) | 636 (6.6%) |
| 10 to 14 Years | 573 (6.8%) | 715 (7.4%) |
| 15 to 19 Years | 777 (9.2%) | 720 (7.4%) |
| 20 to 24 Years | 538 (6.4%) | 688 (7.1%) |
| 25 to 29 Years | 333 (3.9%) | 657 (6.8%) |
| 30 to 34 Years | 541 (6.4%) | 620 (6.4%) |
| 35 to 39 Years | 616 (7.3%) | 612 (6.3%) |
| 40 to 44 Years | 522 (6.2%) | 751 (7.7%) |
| 45 to 49 Years | 452 (5.3%) | 511 (5.3%) |
| 50 to 54 Years | 633 (7.5%) | 660 (6.8%) |
| 55 to 59 Years | 583 (6.9%) | 509 (5.2%) |
| 60 to 64 Years | 533 (6.3%) | 723 (7.5%) |
| 65 to 69 Years | 476 (5.6%) | 416 (4.3%) |
| 70 to 74 Years | 196 (2.3%) | 475 (4.9%) |
| 75 to 79 Years | 343 (4.1%) | 339 (3.5%) |
| 80 to 84 Years | 134 (1.6%) | 140 (1.4%) |
| 85 Years and over | 77 (0.9%) | 111 (1.1%) |
| Total | 8,478 (100.0%) | 9,693 (100.0%) |
Families and Households in Sycamore
Median Family Size in Sycamore
The median family size in Sycamore is 3.01 persons per family, with married-couple families (3,631 | 74.8%) accounting for the largest median family size of 3.08 persons per family. On the other hand, single female/mother families (980 | 20.2%) represent the smallest median family size with 2.74 persons per family.
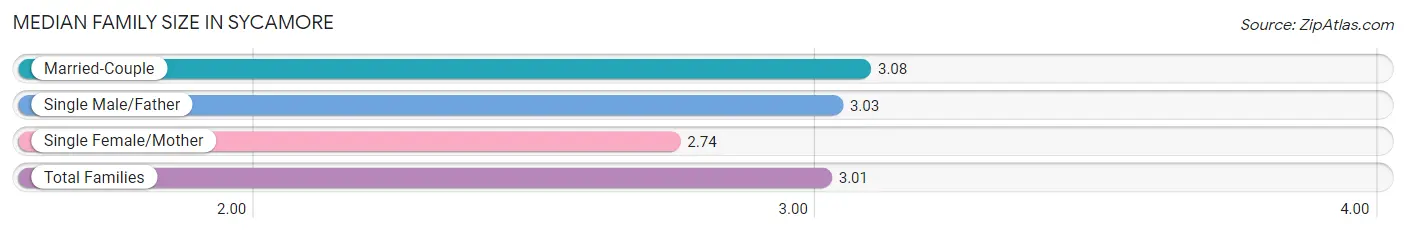
| Family Type | # Families | Family Size |
| Married-Couple | 3,631 (74.8%) | 3.08 |
| Single Male/Father | 242 (5.0%) | 3.03 |
| Single Female/Mother | 980 (20.2%) | 2.74 |
| Total Families | 4,853 (100.0%) | 3.01 |
Median Household Size in Sycamore
The median household size in Sycamore is 2.43 persons per household, with single male/father households (242 | 3.3%) accounting for the largest median household size of 3.36 persons per household. non-family households (2,544 | 34.4%) represent the smallest median household size with 1.21 persons per household.
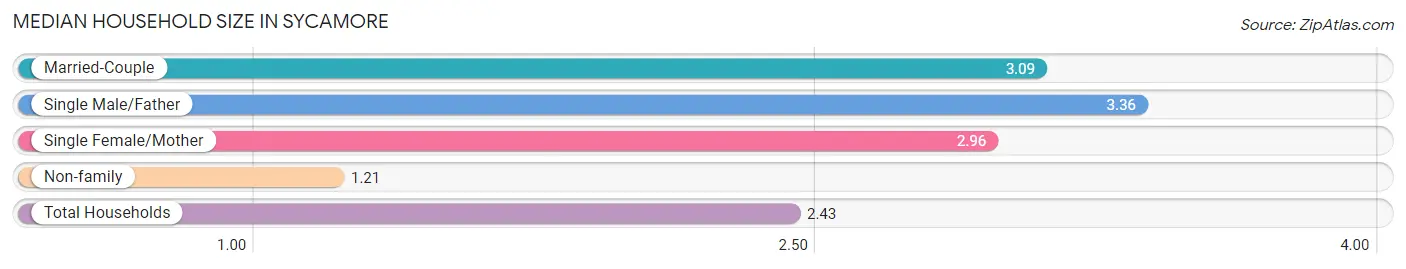
| Household Type | # Households | Household Size |
| Married-Couple | 3,631 (49.1%) | 3.09 |
| Single Male/Father | 242 (3.3%) | 3.36 |
| Single Female/Mother | 980 (13.3%) | 2.96 |
| Non-family | 2,544 (34.4%) | 1.21 |
| Total Households | 7,397 (100.0%) | 2.43 |
Household Size by Marriage Status in Sycamore
Out of a total of 7,397 households in Sycamore, 4,853 (65.6%) are family households, while 2,544 (34.4%) are nonfamily households. The most numerous type of family households are 2-person households, comprising 2,389, and the most common type of nonfamily households are 1-person households, comprising 1,977.
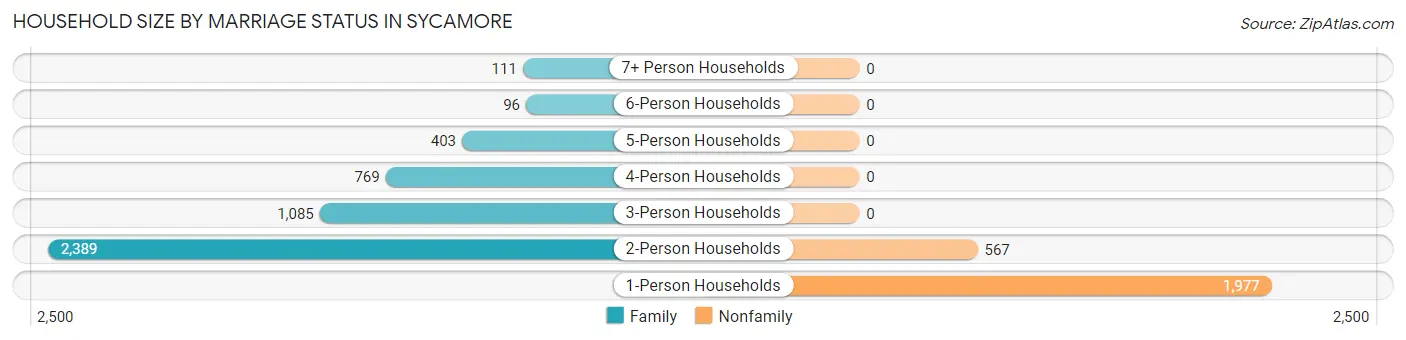
| Household Size | Family Households | Nonfamily Households |
| 1-Person Households | - | 1,977 (26.7%) |
| 2-Person Households | 2,389 (32.3%) | 567 (7.7%) |
| 3-Person Households | 1,085 (14.7%) | 0 (0.0%) |
| 4-Person Households | 769 (10.4%) | 0 (0.0%) |
| 5-Person Households | 403 (5.4%) | 0 (0.0%) |
| 6-Person Households | 96 (1.3%) | 0 (0.0%) |
| 7+ Person Households | 111 (1.5%) | 0 (0.0%) |
| Total | 4,853 (65.6%) | 2,544 (34.4%) |
Female Fertility in Sycamore
Fertility by Age in Sycamore
Average fertility rate in Sycamore is 41.0 births per 1,000 women. Women in the age bracket of 20 to 34 years have the highest fertility rate with 60.0 births per 1,000 women. Women in the age bracket of 20 to 34 years acount for 61.1% of all women with births.
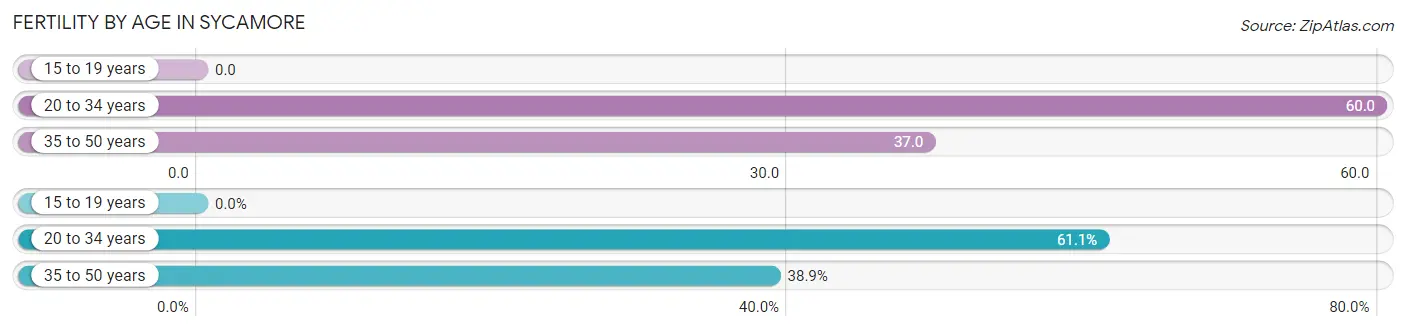
| Age Bracket | Women with Births | Births / 1,000 Women |
| 15 to 19 years | 0 (0.0%) | 0.0 |
| 20 to 34 years | 118 (61.1%) | 60.0 |
| 35 to 50 years | 75 (38.9%) | 37.0 |
| Total | 193 (100.0%) | 41.0 |
Fertility by Age by Marriage Status in Sycamore
93.3% of women with births (193) in Sycamore are married. The highest percentage of unmarried women with births falls into 35 to 50 years age bracket with 17.3% of them unmarried at the time of birth, while the lowest percentage of unmarried women with births belong to 20 to 34 years age bracket with 0.0% of them unmarried.
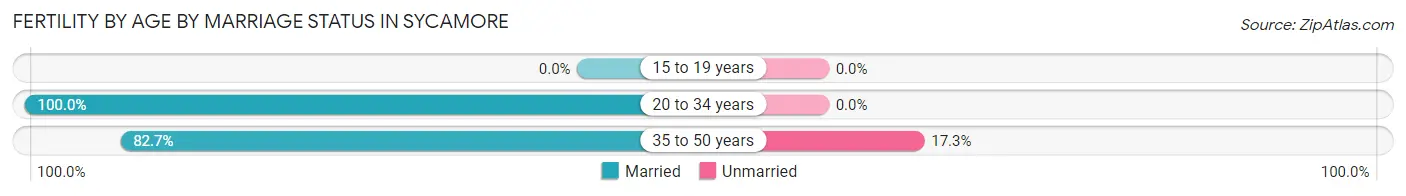
| Age Bracket | Married | Unmarried |
| 15 to 19 years | 0 (0.0%) | 0 (0.0%) |
| 20 to 34 years | 118 (100.0%) | 0 (0.0%) |
| 35 to 50 years | 62 (82.7%) | 13 (17.3%) |
| Total | 180 (93.3%) | 13 (6.7%) |
Fertility by Education in Sycamore
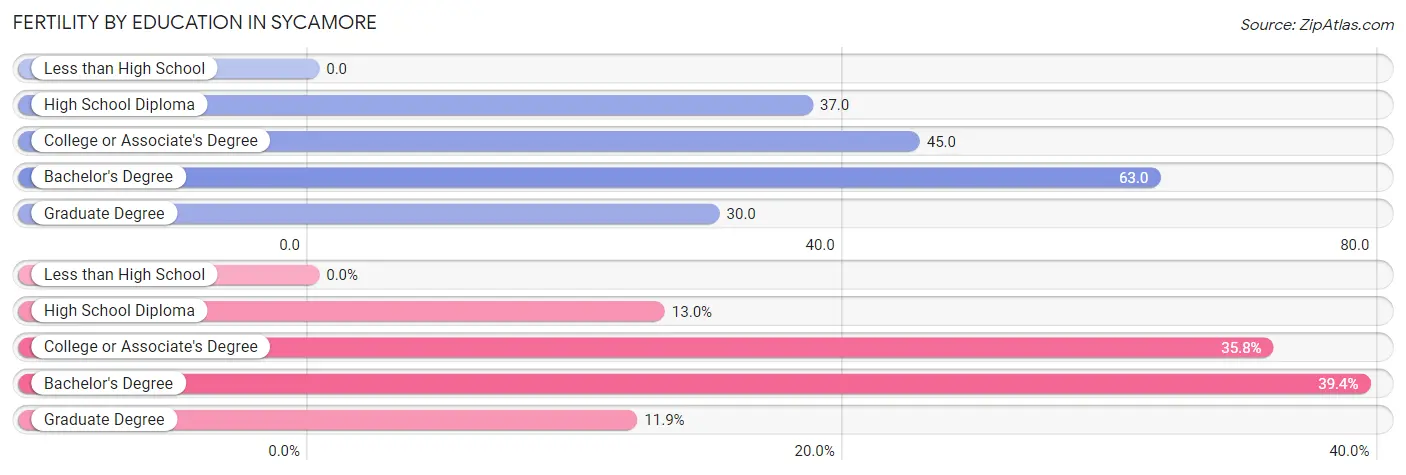
| Educational Attainment | Women with Births | Births / 1,000 Women |
| Less than High School | 0 (0.0%) | 0.0 |
| High School Diploma | 25 (13.0%) | 37.0 |
| College or Associate's Degree | 69 (35.7%) | 45.0 |
| Bachelor's Degree | 76 (39.4%) | 63.0 |
| Graduate Degree | 23 (11.9%) | 30.0 |
| Total | 193 (100.0%) | 41.0 |
Fertility by Education by Marriage Status in Sycamore
6.7% of women with births in Sycamore are unmarried. Women with the educational attainment of high school diploma are most likely to be married with 100.0% of them married at childbirth, while women with the educational attainment of bachelor's degree are least likely to be married with 17.1% of them unmarried at childbirth.
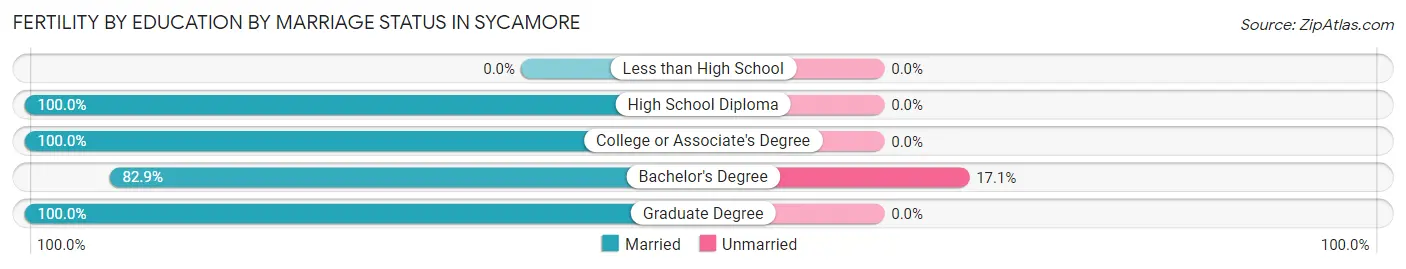
| Educational Attainment | Married | Unmarried |
| Less than High School | 0 (0.0%) | 0 (0.0%) |
| High School Diploma | 25 (100.0%) | 0 (0.0%) |
| College or Associate's Degree | 69 (100.0%) | 0 (0.0%) |
| Bachelor's Degree | 63 (82.9%) | 13 (17.1%) |
| Graduate Degree | 23 (100.0%) | 0 (0.0%) |
| Total | 180 (93.3%) | 13 (6.7%) |
Employment Characteristics in Sycamore
Employment by Class of Employer in Sycamore
Among the 9,531 employed individuals in Sycamore, private company employees (6,348 | 66.6%), local government employees (1,040 | 10.9%), and not-for-profit organizations (714 | 7.5%) make up the most common classes of employment.
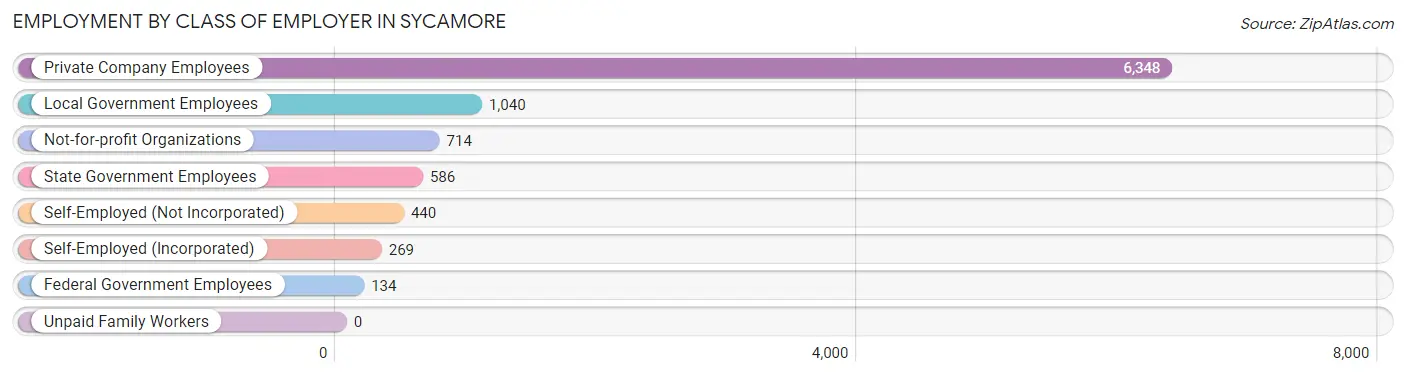
| Employer Class | # Employees | % Employees |
| Private Company Employees | 6,348 | 66.6% |
| Self-Employed (Incorporated) | 269 | 2.8% |
| Self-Employed (Not Incorporated) | 440 | 4.6% |
| Not-for-profit Organizations | 714 | 7.5% |
| Local Government Employees | 1,040 | 10.9% |
| State Government Employees | 586 | 6.1% |
| Federal Government Employees | 134 | 1.4% |
| Unpaid Family Workers | 0 | 0.0% |
| Total | 9,531 | 100.0% |
Employment Status by Age in Sycamore
According to the labor force statistics for Sycamore, out of the total population over 16 years of age (14,279), 69.5% or 9,924 individuals are in the labor force, with 3.2% or 318 of them unemployed. The age group with the highest labor force participation rate is 25 to 29 years, with 92.4% or 915 individuals in the labor force. Within the labor force, the 75 years and over age range has the highest percentage of unemployed individuals, with 9.3% or 9 of them being unemployed.
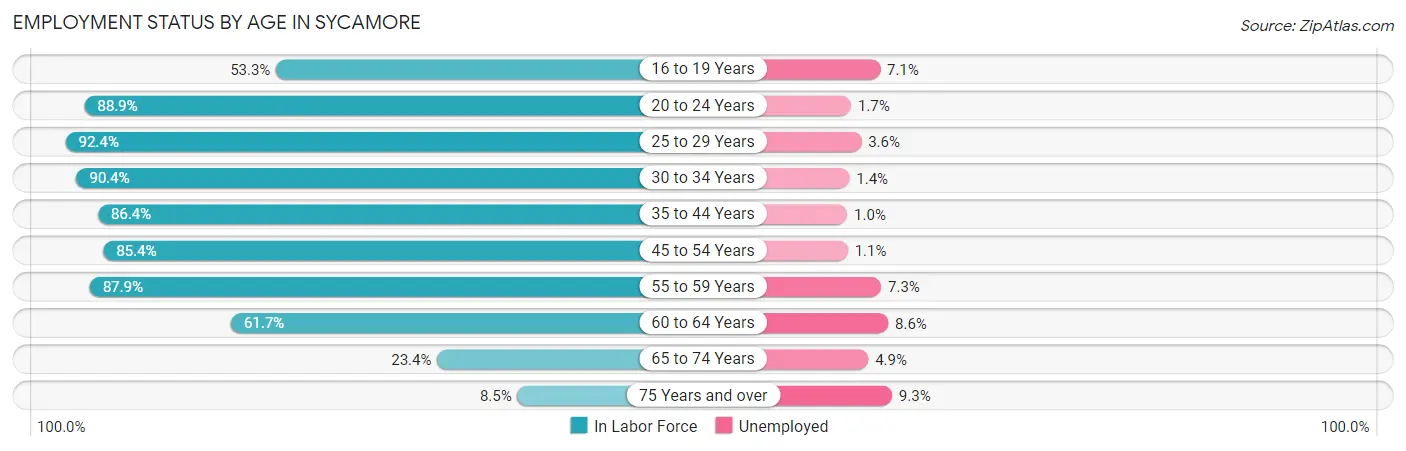
| Age Bracket | In Labor Force | Unemployed |
| 16 to 19 Years | 581 (53.3%) | 41 (7.1%) |
| 20 to 24 Years | 1,090 (88.9%) | 19 (1.7%) |
| 25 to 29 Years | 915 (92.4%) | 33 (3.6%) |
| 30 to 34 Years | 1,050 (90.4%) | 15 (1.4%) |
| 35 to 44 Years | 2,161 (86.4%) | 22 (1.0%) |
| 45 to 54 Years | 1,927 (85.4%) | 21 (1.1%) |
| 55 to 59 Years | 960 (87.9%) | 70 (7.3%) |
| 60 to 64 Years | 775 (61.7%) | 67 (8.6%) |
| 65 to 74 Years | 366 (23.4%) | 18 (4.9%) |
| 75 Years and over | 97 (8.5%) | 9 (9.3%) |
| Total | 9,924 (69.5%) | 318 (3.2%) |
Employment Status by Educational Attainment in Sycamore
According to labor force statistics for Sycamore, 84.1% of individuals (7,784) out of the total population between 25 and 64 years of age (9,256) are in the labor force, with 2.9% or 226 of them being unemployed. The group with the highest labor force participation rate are those with the educational attainment of bachelor's degree or higher, with 86.9% or 3,651 individuals in the labor force. Within the labor force, individuals with less than high school education have the highest percentage of unemployment, with 10.5% or 24 of them being unemployed.
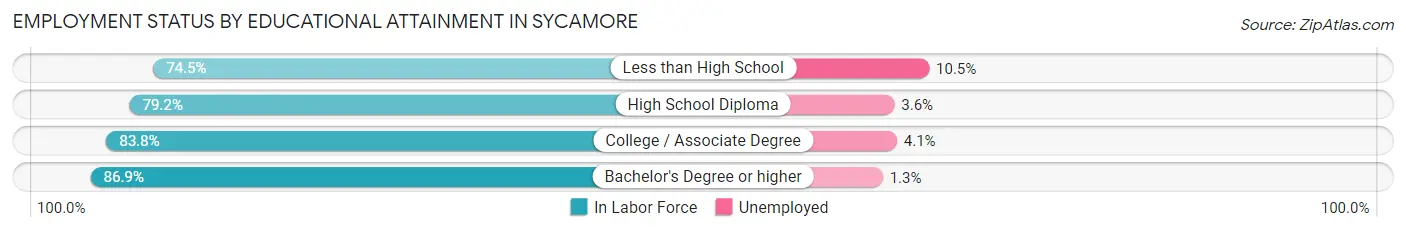
| Educational Attainment | In Labor Force | Unemployed |
| Less than High School | 228 (74.5%) | 32 (10.5%) |
| High School Diploma | 1,243 (79.2%) | 56 (3.6%) |
| College / Associate Degree | 2,665 (83.8%) | 130 (4.1%) |
| Bachelor's Degree or higher | 3,651 (86.9%) | 55 (1.3%) |
| Total | 7,784 (84.1%) | 268 (2.9%) |
Employment Occupations by Sex in Sycamore
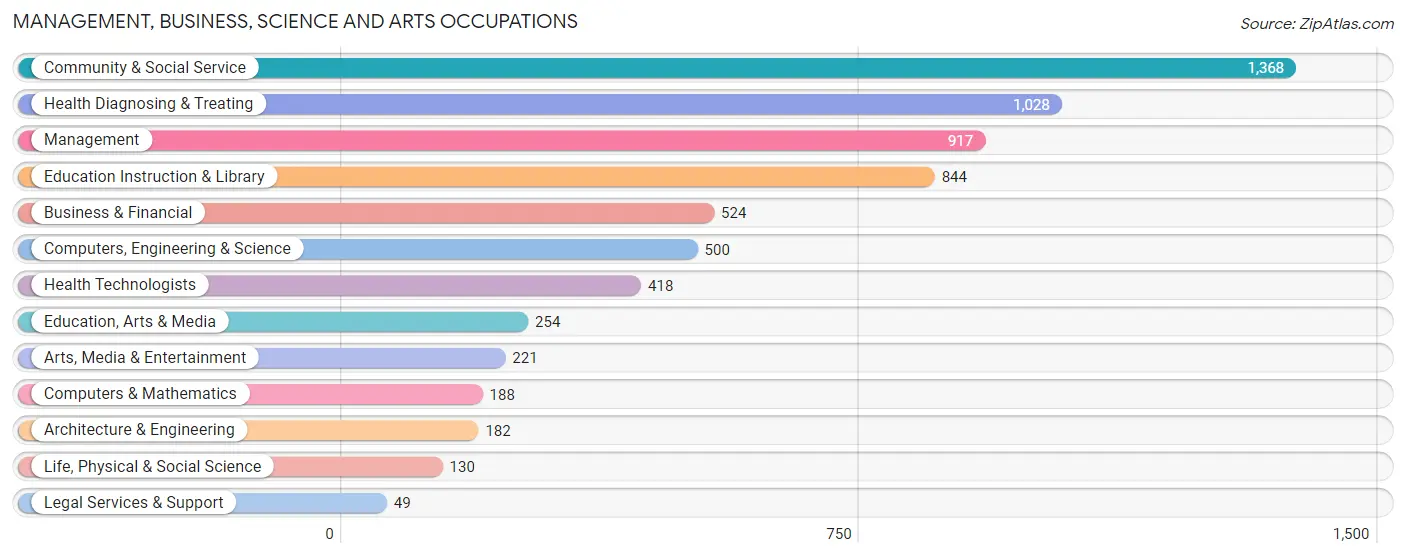
Management, Business, Science and Arts Occupations
The most common Management, Business, Science and Arts occupations in Sycamore are Community & Social Service (1,368 | 14.3%), Health Diagnosing & Treating (1,028 | 10.7%), Management (917 | 9.6%), Education Instruction & Library (844 | 8.8%), and Business & Financial (524 | 5.5%).
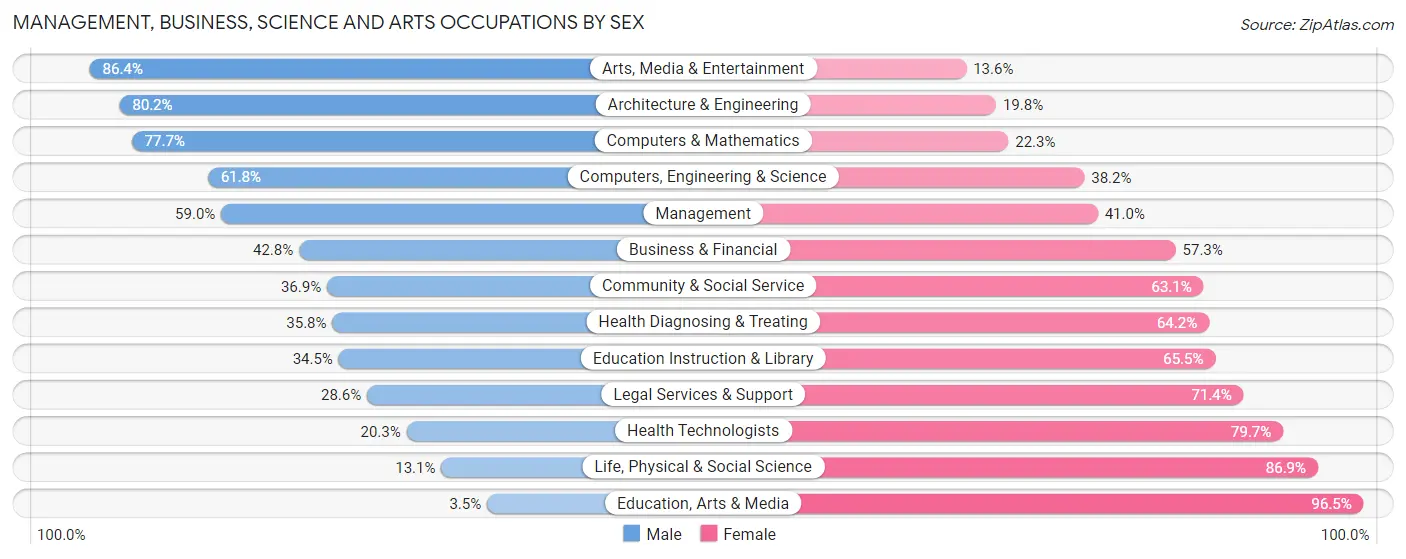
Management, Business, Science and Arts Occupations by Sex
Within the Management, Business, Science and Arts occupations in Sycamore, the most male-oriented occupations are Arts, Media & Entertainment (86.4%), Architecture & Engineering (80.2%), and Computers & Mathematics (77.7%), while the most female-oriented occupations are Education, Arts & Media (96.5%), Life, Physical & Social Science (86.9%), and Health Technologists (79.7%).
| Occupation | Male | Female |
| Management | 541 (59.0%) | 376 (41.0%) |
| Business & Financial | 224 (42.7%) | 300 (57.3%) |
| Computers, Engineering & Science | 309 (61.8%) | 191 (38.2%) |
| Computers & Mathematics | 146 (77.7%) | 42 (22.3%) |
| Architecture & Engineering | 146 (80.2%) | 36 (19.8%) |
| Life, Physical & Social Science | 17 (13.1%) | 113 (86.9%) |
| Community & Social Service | 505 (36.9%) | 863 (63.1%) |
| Education, Arts & Media | 9 (3.5%) | 245 (96.5%) |
| Legal Services & Support | 14 (28.6%) | 35 (71.4%) |
| Education Instruction & Library | 291 (34.5%) | 553 (65.5%) |
| Arts, Media & Entertainment | 191 (86.4%) | 30 (13.6%) |
| Health Diagnosing & Treating | 368 (35.8%) | 660 (64.2%) |
| Health Technologists | 85 (20.3%) | 333 (79.7%) |
| Total (Category) | 1,947 (44.9%) | 2,390 (55.1%) |
| Total (Overall) | 4,506 (47.1%) | 5,062 (52.9%) |
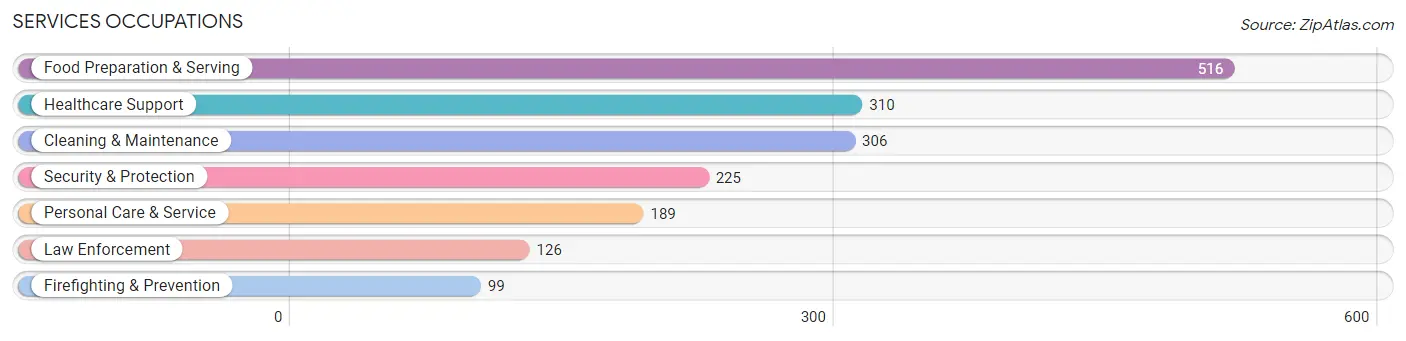
Services Occupations
The most common Services occupations in Sycamore are Food Preparation & Serving (516 | 5.4%), Healthcare Support (310 | 3.2%), Cleaning & Maintenance (306 | 3.2%), Security & Protection (225 | 2.4%), and Personal Care & Service (189 | 2.0%).
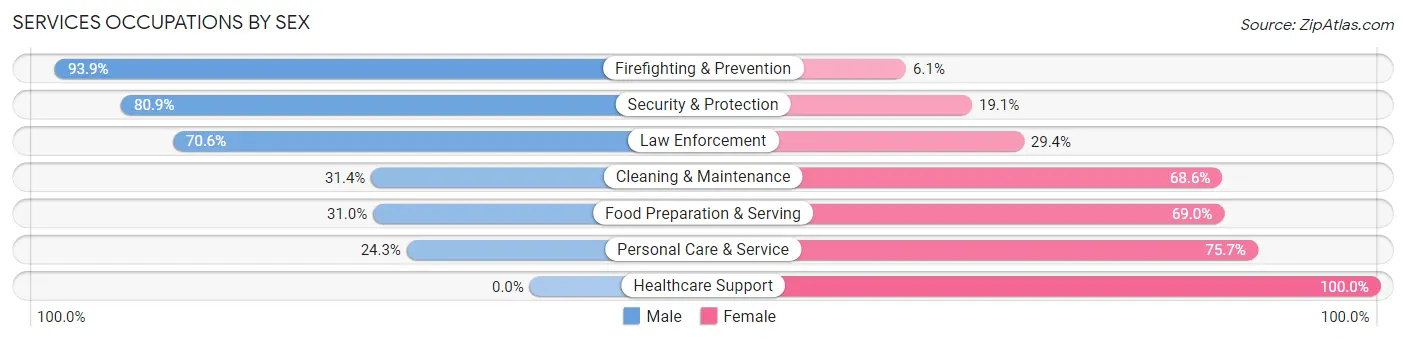
Services Occupations by Sex
Within the Services occupations in Sycamore, the most male-oriented occupations are Firefighting & Prevention (93.9%), Security & Protection (80.9%), and Law Enforcement (70.6%), while the most female-oriented occupations are Healthcare Support (100.0%), Personal Care & Service (75.7%), and Food Preparation & Serving (69.0%).
| Occupation | Male | Female |
| Healthcare Support | 0 (0.0%) | 310 (100.0%) |
| Security & Protection | 182 (80.9%) | 43 (19.1%) |
| Firefighting & Prevention | 93 (93.9%) | 6 (6.1%) |
| Law Enforcement | 89 (70.6%) | 37 (29.4%) |
| Food Preparation & Serving | 160 (31.0%) | 356 (69.0%) |
| Cleaning & Maintenance | 96 (31.4%) | 210 (68.6%) |
| Personal Care & Service | 46 (24.3%) | 143 (75.7%) |
| Total (Category) | 484 (31.3%) | 1,062 (68.7%) |
| Total (Overall) | 4,506 (47.1%) | 5,062 (52.9%) |
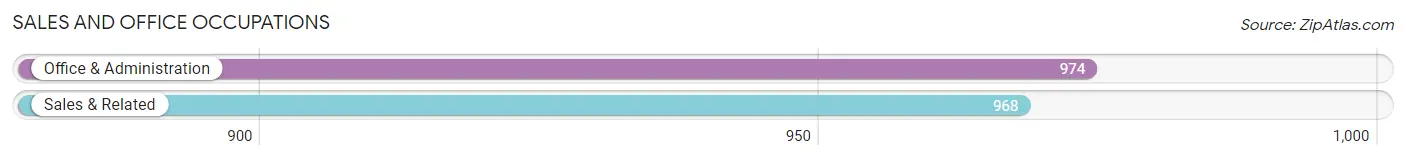
Sales and Office Occupations
The most common Sales and Office occupations in Sycamore are Office & Administration (974 | 10.2%), and Sales & Related (968 | 10.1%).
Sales and Office Occupations by Sex
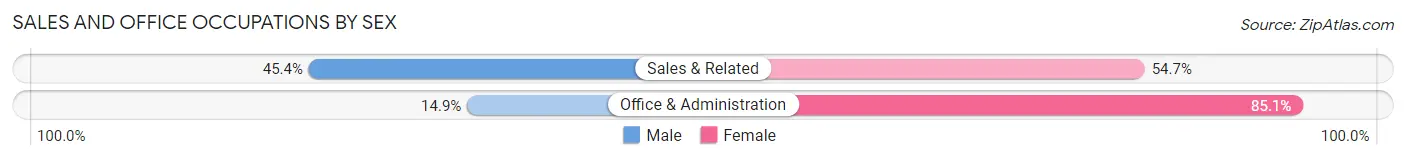
| Occupation | Male | Female |
| Sales & Related | 439 (45.4%) | 529 (54.6%) |
| Office & Administration | 145 (14.9%) | 829 (85.1%) |
| Total (Category) | 584 (30.1%) | 1,358 (69.9%) |
| Total (Overall) | 4,506 (47.1%) | 5,062 (52.9%) |
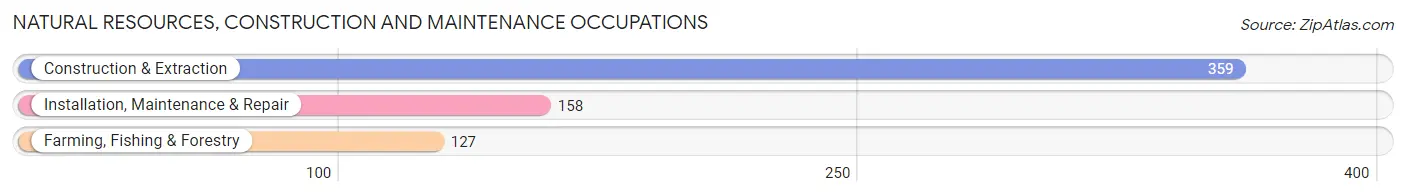
Natural Resources, Construction and Maintenance Occupations
The most common Natural Resources, Construction and Maintenance occupations in Sycamore are Construction & Extraction (359 | 3.7%), Installation, Maintenance & Repair (158 | 1.7%), and Farming, Fishing & Forestry (127 | 1.3%).
Natural Resources, Construction and Maintenance Occupations by Sex
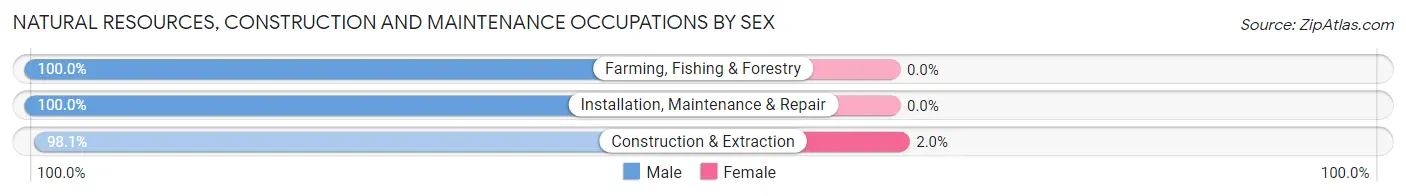
| Occupation | Male | Female |
| Farming, Fishing & Forestry | 127 (100.0%) | 0 (0.0%) |
| Construction & Extraction | 352 (98.1%) | 7 (1.9%) |
| Installation, Maintenance & Repair | 158 (100.0%) | 0 (0.0%) |
| Total (Category) | 637 (98.9%) | 7 (1.1%) |
| Total (Overall) | 4,506 (47.1%) | 5,062 (52.9%) |
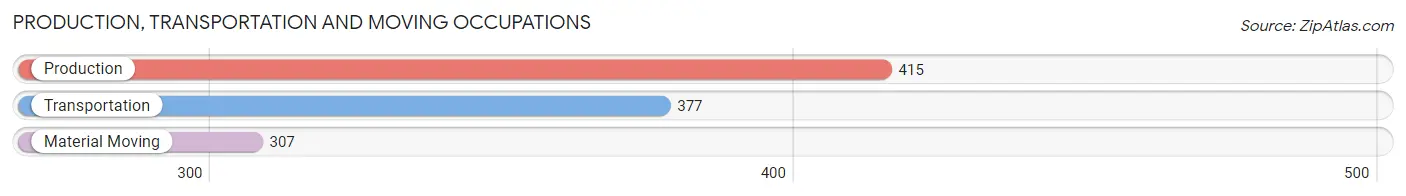
Production, Transportation and Moving Occupations
The most common Production, Transportation and Moving occupations in Sycamore are Production (415 | 4.3%), Transportation (377 | 3.9%), and Material Moving (307 | 3.2%).
Production, Transportation and Moving Occupations by Sex
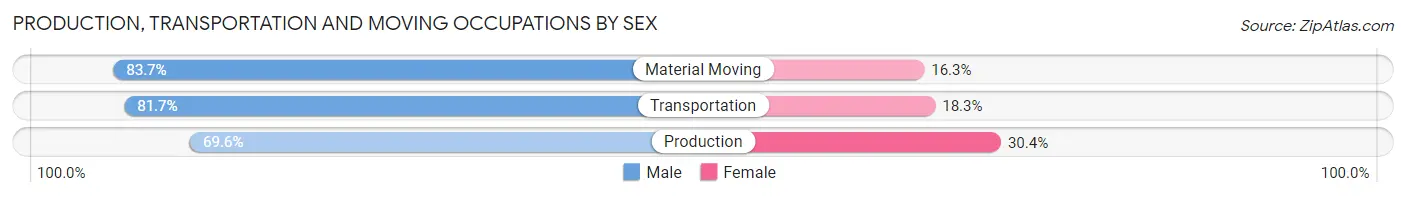
| Occupation | Male | Female |
| Production | 289 (69.6%) | 126 (30.4%) |
| Transportation | 308 (81.7%) | 69 (18.3%) |
| Material Moving | 257 (83.7%) | 50 (16.3%) |
| Total (Category) | 854 (77.7%) | 245 (22.3%) |
| Total (Overall) | 4,506 (47.1%) | 5,062 (52.9%) |
Employment Industries by Sex in Sycamore
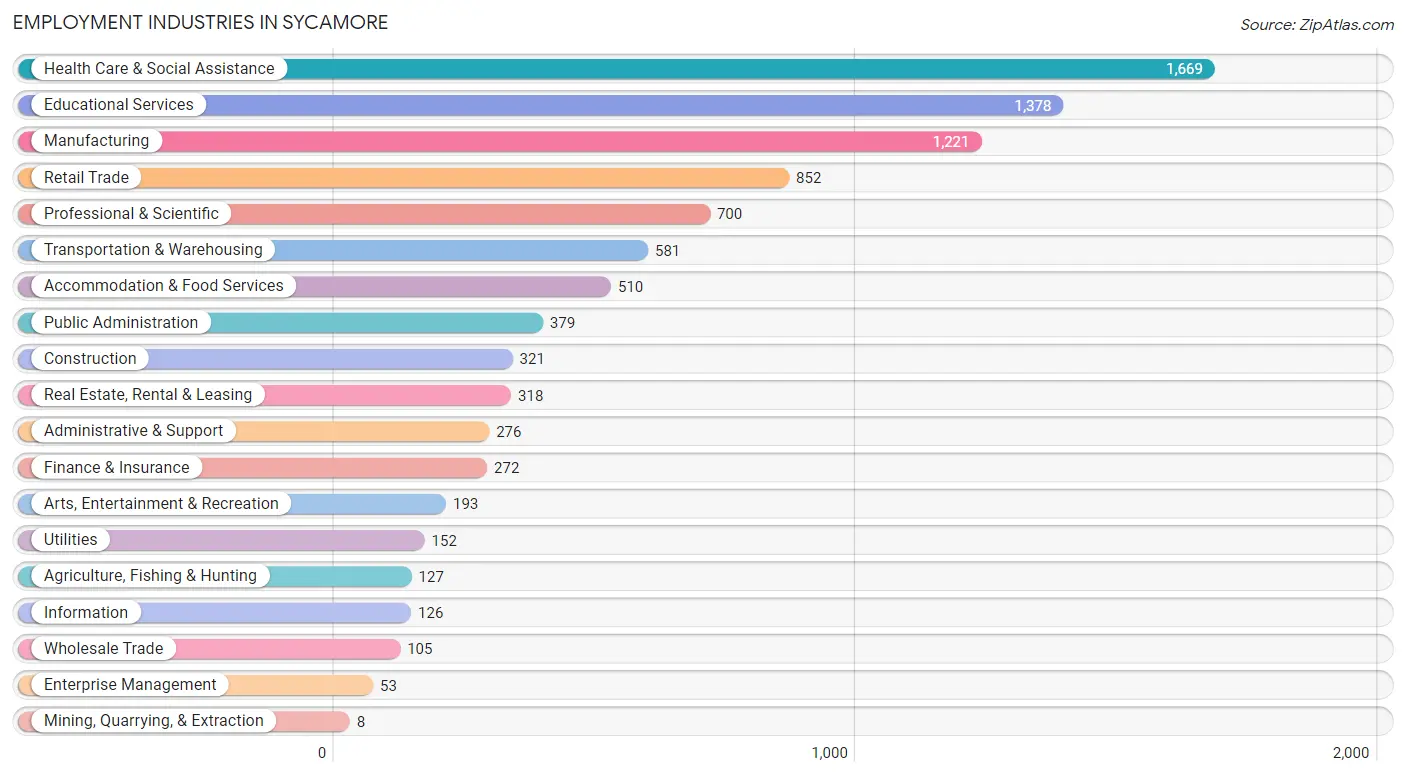
Employment Industries in Sycamore
The major employment industries in Sycamore include Health Care & Social Assistance (1,669 | 17.4%), Educational Services (1,378 | 14.4%), Manufacturing (1,221 | 12.8%), Retail Trade (852 | 8.9%), and Professional & Scientific (700 | 7.3%).
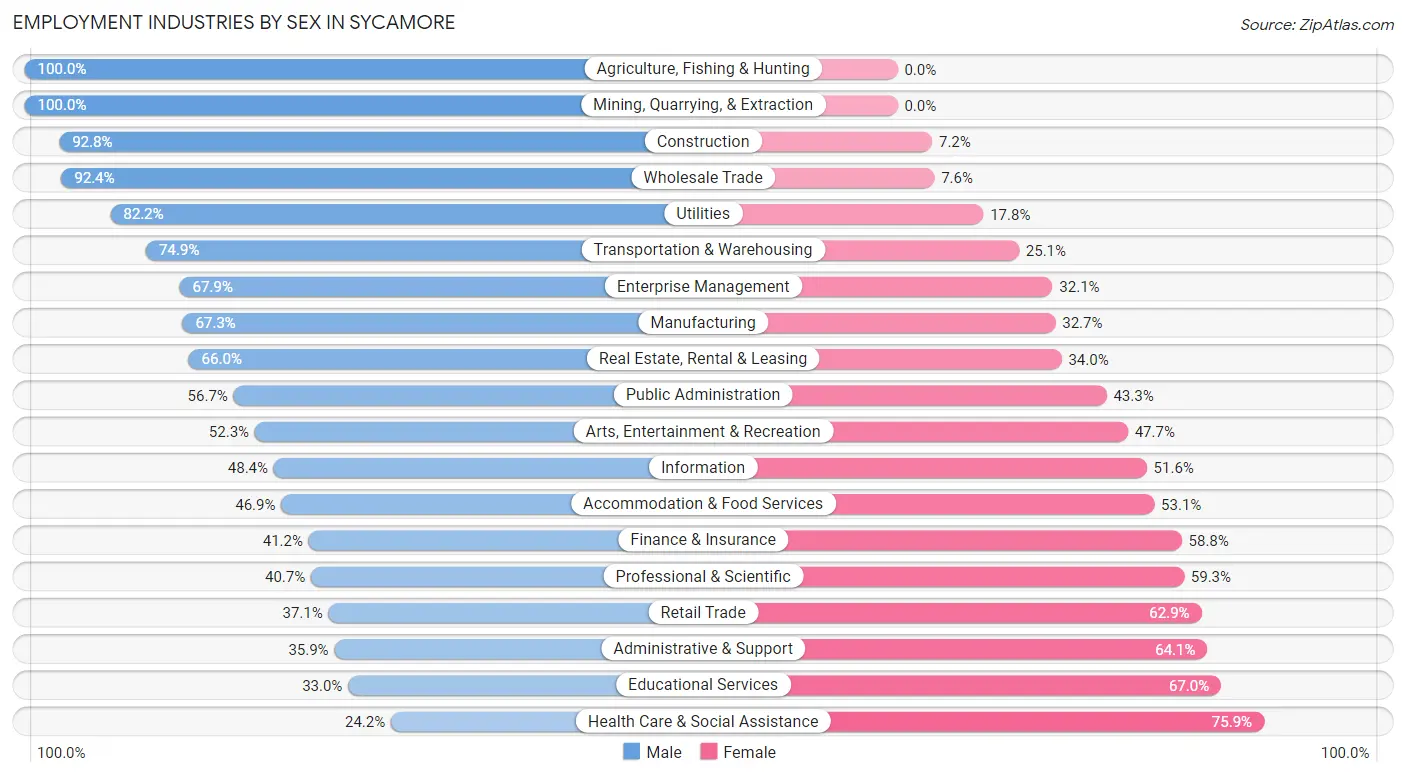
Employment Industries by Sex in Sycamore
The Sycamore industries that see more men than women are Agriculture, Fishing & Hunting (100.0%), Mining, Quarrying, & Extraction (100.0%), and Construction (92.8%), whereas the industries that tend to have a higher number of women are Health Care & Social Assistance (75.8%), Educational Services (67.0%), and Administrative & Support (64.1%).
| Industry | Male | Female |
| Agriculture, Fishing & Hunting | 127 (100.0%) | 0 (0.0%) |
| Mining, Quarrying, & Extraction | 8 (100.0%) | 0 (0.0%) |
| Construction | 298 (92.8%) | 23 (7.2%) |
| Manufacturing | 822 (67.3%) | 399 (32.7%) |
| Wholesale Trade | 97 (92.4%) | 8 (7.6%) |
| Retail Trade | 316 (37.1%) | 536 (62.9%) |
| Transportation & Warehousing | 435 (74.9%) | 146 (25.1%) |
| Utilities | 125 (82.2%) | 27 (17.8%) |
| Information | 61 (48.4%) | 65 (51.6%) |
| Finance & Insurance | 112 (41.2%) | 160 (58.8%) |
| Real Estate, Rental & Leasing | 210 (66.0%) | 108 (34.0%) |
| Professional & Scientific | 285 (40.7%) | 415 (59.3%) |
| Enterprise Management | 36 (67.9%) | 17 (32.1%) |
| Administrative & Support | 99 (35.9%) | 177 (64.1%) |
| Educational Services | 455 (33.0%) | 923 (67.0%) |
| Health Care & Social Assistance | 403 (24.1%) | 1,266 (75.8%) |
| Arts, Entertainment & Recreation | 101 (52.3%) | 92 (47.7%) |
| Accommodation & Food Services | 239 (46.9%) | 271 (53.1%) |
| Public Administration | 215 (56.7%) | 164 (43.3%) |
| Total | 4,506 (47.1%) | 5,062 (52.9%) |
Education in Sycamore
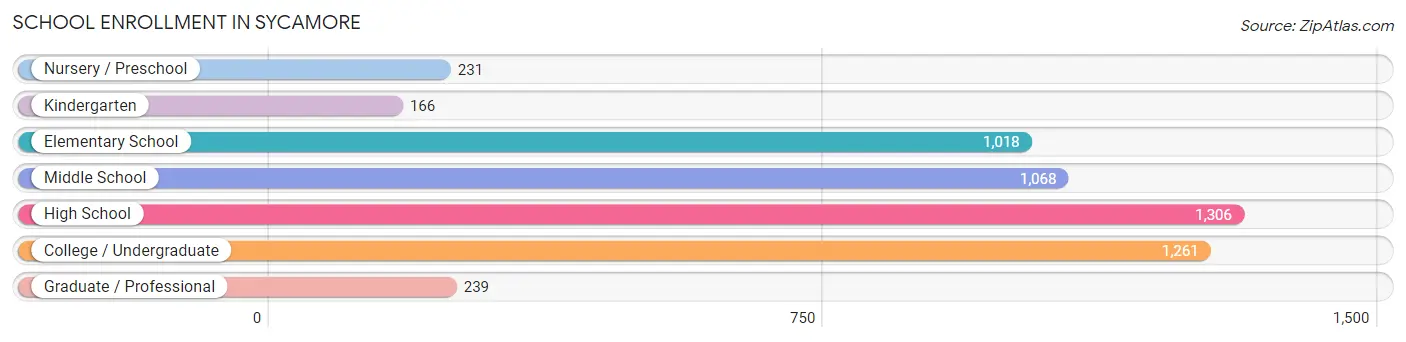
School Enrollment in Sycamore
The most common levels of schooling among the 5,289 students in Sycamore are high school (1,306 | 24.7%), college / undergraduate (1,261 | 23.8%), and middle school (1,068 | 20.2%).
| School Level | # Students | % Students |
| Nursery / Preschool | 231 | 4.4% |
| Kindergarten | 166 | 3.1% |
| Elementary School | 1,018 | 19.3% |
| Middle School | 1,068 | 20.2% |
| High School | 1,306 | 24.7% |
| College / Undergraduate | 1,261 | 23.8% |
| Graduate / Professional | 239 | 4.5% |
| Total | 5,289 | 100.0% |
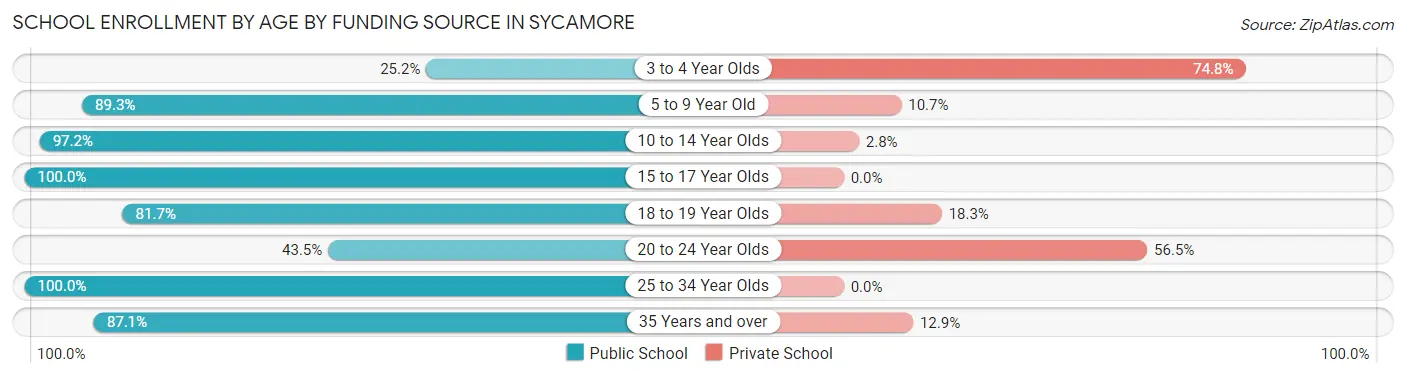
School Enrollment by Age by Funding Source in Sycamore
Out of a total of 5,289 students who are enrolled in schools in Sycamore, 762 (14.4%) attend a private institution, while the remaining 4,527 (85.6%) are enrolled in public schools. The age group of 3 to 4 year olds has the highest likelihood of being enrolled in private schools, with 98 (74.8% in the age bracket) enrolled. Conversely, the age group of 15 to 17 year olds has the lowest likelihood of being enrolled in a private school, with 866 (100.0% in the age bracket) attending a public institution.
| Age Bracket | Public School | Private School |
| 3 to 4 Year Olds | 33 (25.2%) | 98 (74.8%) |
| 5 to 9 Year Old | 1,106 (89.3%) | 133 (10.7%) |
| 10 to 14 Year Olds | 1,242 (97.2%) | 36 (2.8%) |
| 15 to 17 Year Olds | 866 (100.0%) | 0 (0.0%) |
| 18 to 19 Year Olds | 461 (81.7%) | 103 (18.3%) |
| 20 to 24 Year Olds | 273 (43.5%) | 355 (56.5%) |
| 25 to 34 Year Olds | 281 (100.0%) | 0 (0.0%) |
| 35 Years and over | 263 (87.1%) | 39 (12.9%) |
| Total | 4,527 (85.6%) | 762 (14.4%) |
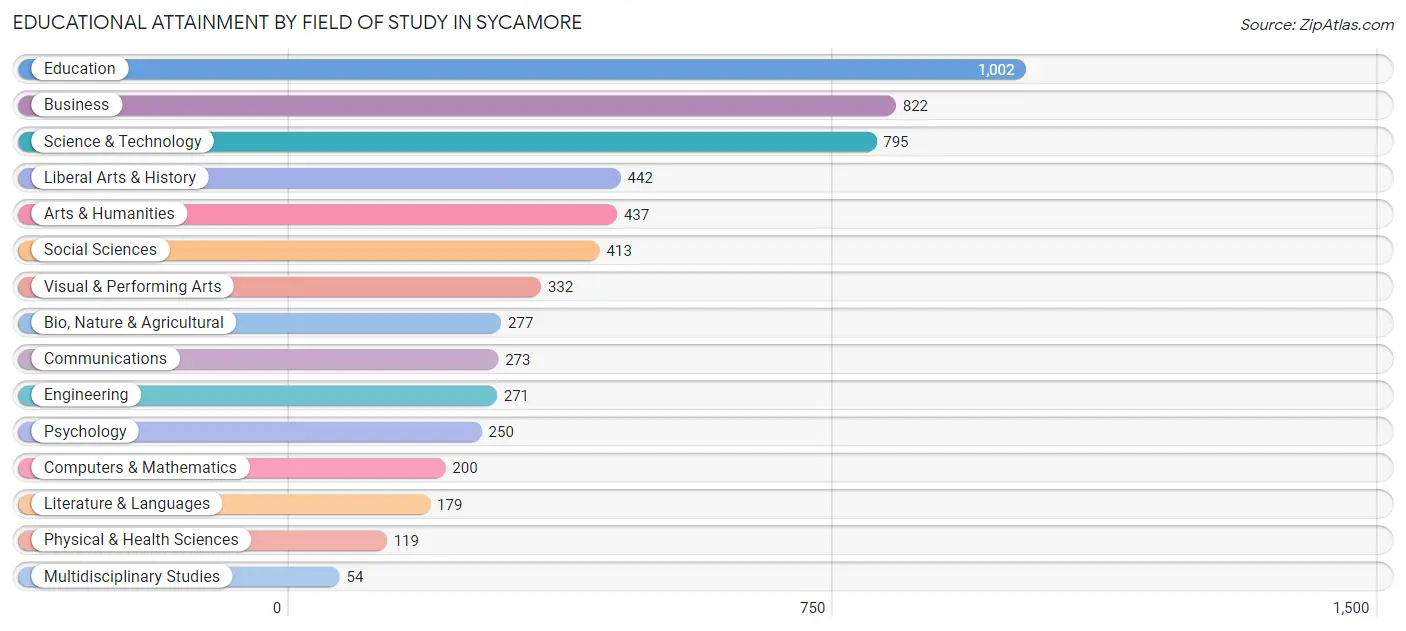
Educational Attainment by Field of Study in Sycamore
Education (1,002 | 17.1%), business (822 | 14.0%), science & technology (795 | 13.6%), liberal arts & history (442 | 7.5%), and arts & humanities (437 | 7.4%) are the most common fields of study among 5,866 individuals in Sycamore who have obtained a bachelor's degree or higher.
| Field of Study | # Graduates | % Graduates |
| Computers & Mathematics | 200 | 3.4% |
| Bio, Nature & Agricultural | 277 | 4.7% |
| Physical & Health Sciences | 119 | 2.0% |
| Psychology | 250 | 4.3% |
| Social Sciences | 413 | 7.0% |
| Engineering | 271 | 4.6% |
| Multidisciplinary Studies | 54 | 0.9% |
| Science & Technology | 795 | 13.6% |
| Business | 822 | 14.0% |
| Education | 1,002 | 17.1% |
| Literature & Languages | 179 | 3.0% |
| Liberal Arts & History | 442 | 7.5% |
| Visual & Performing Arts | 332 | 5.7% |
| Communications | 273 | 4.6% |
| Arts & Humanities | 437 | 7.4% |
| Total | 5,866 | 100.0% |
Transportation & Commute in Sycamore
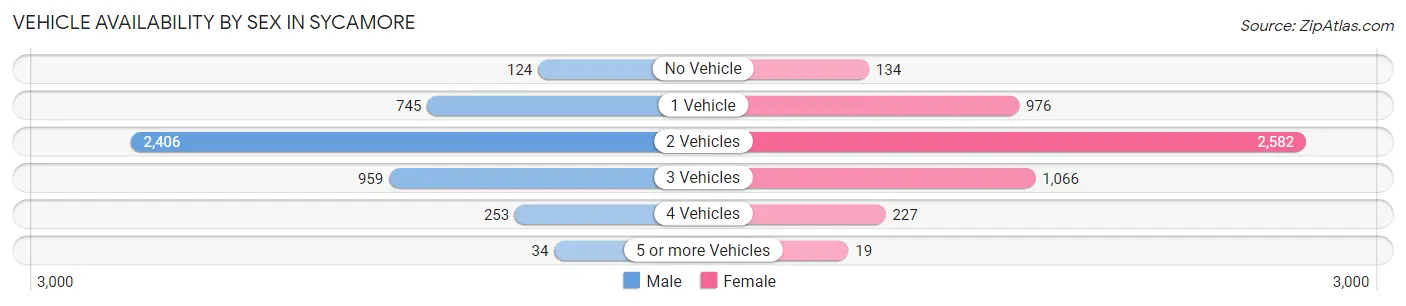
Vehicle Availability by Sex in Sycamore
The most prevalent vehicle ownership categories in Sycamore are males with 2 vehicles (2,406, accounting for 53.2%) and females with 2 vehicles (2,582, making up 48.1%).
| Vehicles Available | Male | Female |
| No Vehicle | 124 (2.7%) | 134 (2.7%) |
| 1 Vehicle | 745 (16.5%) | 976 (19.5%) |
| 2 Vehicles | 2,406 (53.2%) | 2,582 (51.6%) |
| 3 Vehicles | 959 (21.2%) | 1,066 (21.3%) |
| 4 Vehicles | 253 (5.6%) | 227 (4.5%) |
| 5 or more Vehicles | 34 (0.7%) | 19 (0.4%) |
| Total | 4,521 (100.0%) | 5,004 (100.0%) |
Commute Time in Sycamore
The most frequently occuring commute durations in Sycamore are 10 to 14 minutes (1,535 commuters, 17.8%), 5 to 9 minutes (1,306 commuters, 15.1%), and 15 to 19 minutes (1,109 commuters, 12.8%).
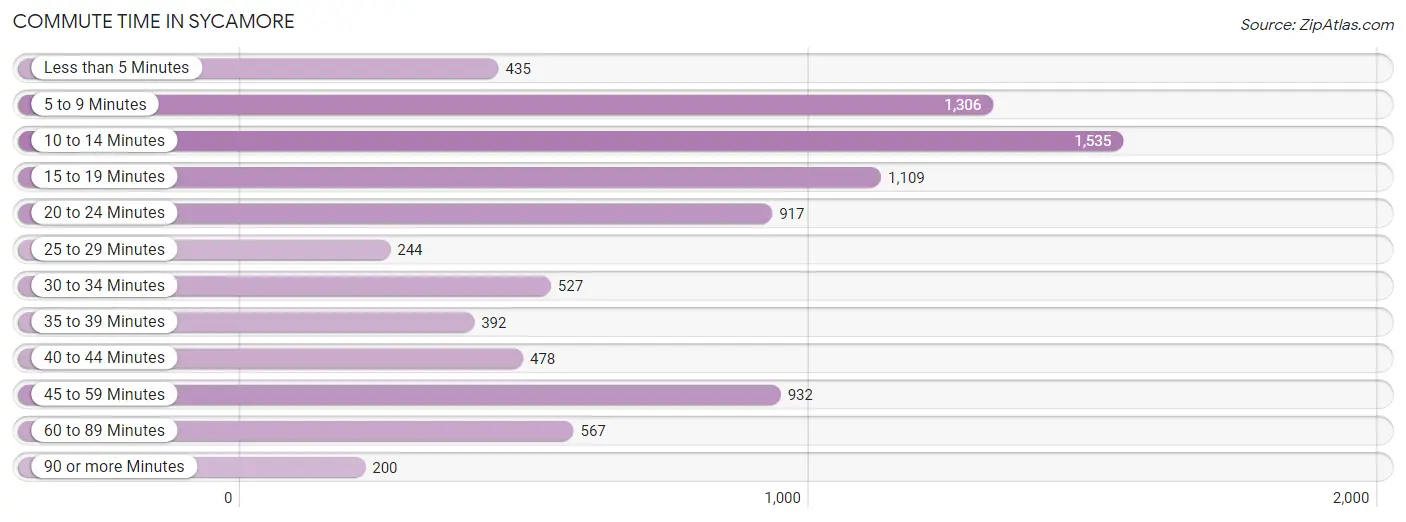
| Commute Time | # Commuters | % Commuters |
| Less than 5 Minutes | 435 | 5.0% |
| 5 to 9 Minutes | 1,306 | 15.1% |
| 10 to 14 Minutes | 1,535 | 17.8% |
| 15 to 19 Minutes | 1,109 | 12.8% |
| 20 to 24 Minutes | 917 | 10.6% |
| 25 to 29 Minutes | 244 | 2.8% |
| 30 to 34 Minutes | 527 | 6.1% |
| 35 to 39 Minutes | 392 | 4.5% |
| 40 to 44 Minutes | 478 | 5.5% |
| 45 to 59 Minutes | 932 | 10.8% |
| 60 to 89 Minutes | 567 | 6.6% |
| 90 or more Minutes | 200 | 2.3% |
Commute Time by Sex in Sycamore
The most common commute times in Sycamore are 45 to 59 minutes (628 commuters, 15.1%) for males and 10 to 14 minutes (984 commuters, 22.0%) for females.
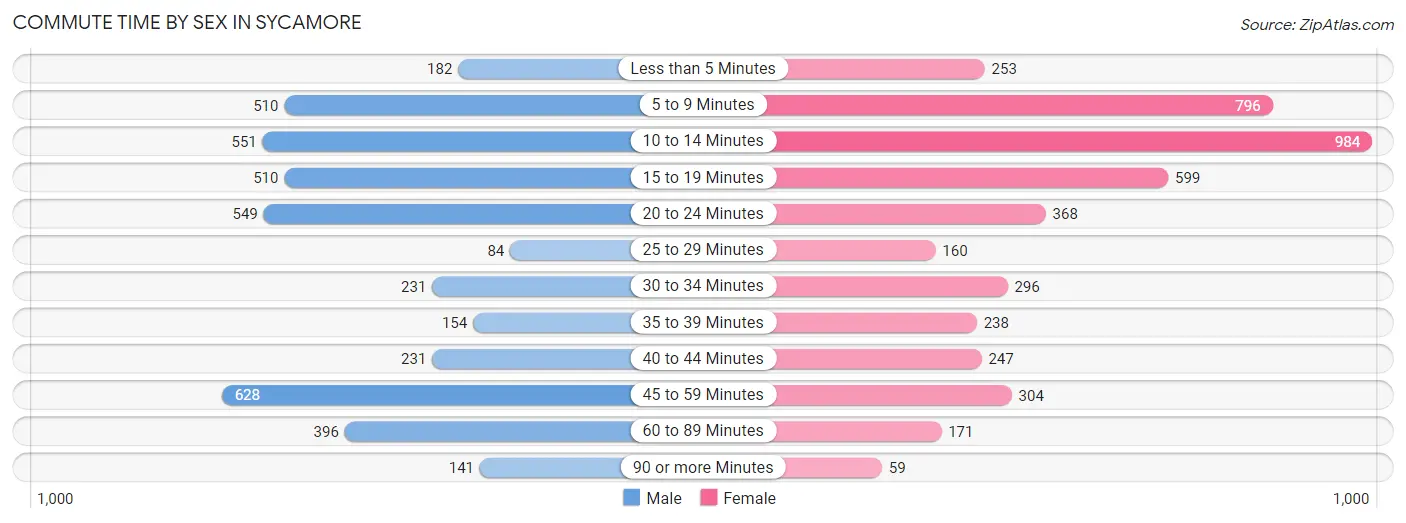
| Commute Time | Male | Female |
| Less than 5 Minutes | 182 (4.4%) | 253 (5.7%) |
| 5 to 9 Minutes | 510 (12.2%) | 796 (17.8%) |
| 10 to 14 Minutes | 551 (13.2%) | 984 (22.0%) |
| 15 to 19 Minutes | 510 (12.2%) | 599 (13.4%) |
| 20 to 24 Minutes | 549 (13.2%) | 368 (8.2%) |
| 25 to 29 Minutes | 84 (2.0%) | 160 (3.6%) |
| 30 to 34 Minutes | 231 (5.5%) | 296 (6.6%) |
| 35 to 39 Minutes | 154 (3.7%) | 238 (5.3%) |
| 40 to 44 Minutes | 231 (5.5%) | 247 (5.5%) |
| 45 to 59 Minutes | 628 (15.1%) | 304 (6.8%) |
| 60 to 89 Minutes | 396 (9.5%) | 171 (3.8%) |
| 90 or more Minutes | 141 (3.4%) | 59 (1.3%) |
Time of Departure to Work by Sex in Sycamore
The most frequent times of departure to work in Sycamore are 8:00 AM to 8:29 AM (652, 15.7%) for males and 7:30 AM to 7:59 AM (875, 19.6%) for females.
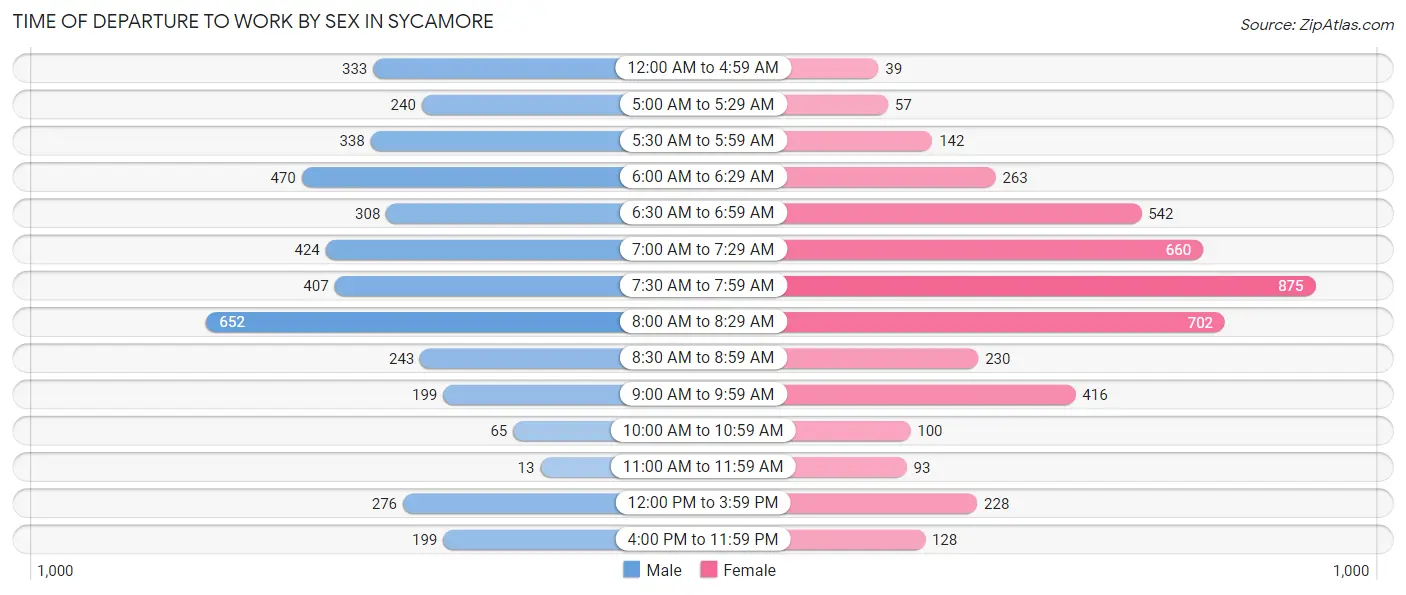
| Time of Departure | Male | Female |
| 12:00 AM to 4:59 AM | 333 (8.0%) | 39 (0.9%) |
| 5:00 AM to 5:29 AM | 240 (5.8%) | 57 (1.3%) |
| 5:30 AM to 5:59 AM | 338 (8.1%) | 142 (3.2%) |
| 6:00 AM to 6:29 AM | 470 (11.3%) | 263 (5.9%) |
| 6:30 AM to 6:59 AM | 308 (7.4%) | 542 (12.1%) |
| 7:00 AM to 7:29 AM | 424 (10.2%) | 660 (14.7%) |
| 7:30 AM to 7:59 AM | 407 (9.8%) | 875 (19.6%) |
| 8:00 AM to 8:29 AM | 652 (15.7%) | 702 (15.7%) |
| 8:30 AM to 8:59 AM | 243 (5.8%) | 230 (5.1%) |
| 9:00 AM to 9:59 AM | 199 (4.8%) | 416 (9.3%) |
| 10:00 AM to 10:59 AM | 65 (1.6%) | 100 (2.2%) |
| 11:00 AM to 11:59 AM | 13 (0.3%) | 93 (2.1%) |
| 12:00 PM to 3:59 PM | 276 (6.6%) | 228 (5.1%) |
| 4:00 PM to 11:59 PM | 199 (4.8%) | 128 (2.9%) |
| Total | 4,167 (100.0%) | 4,475 (100.0%) |
Housing Occupancy in Sycamore
Occupancy by Ownership in Sycamore
Of the total 7,397 dwellings in Sycamore, owner-occupied units account for 5,205 (70.4%), while renter-occupied units make up 2,192 (29.6%).
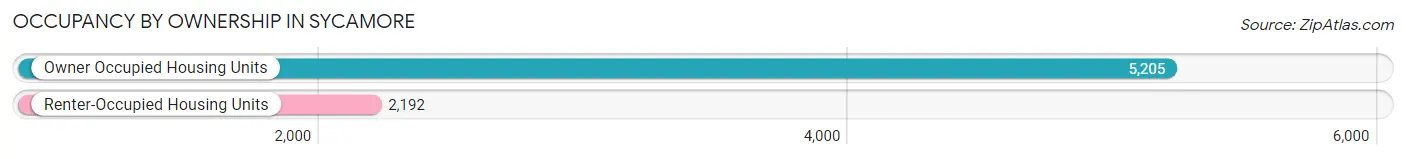
| Occupancy | # Housing Units | % Housing Units |
| Owner Occupied Housing Units | 5,205 | 70.4% |
| Renter-Occupied Housing Units | 2,192 | 29.6% |
| Total Occupied Housing Units | 7,397 | 100.0% |
Occupancy by Household Size in Sycamore
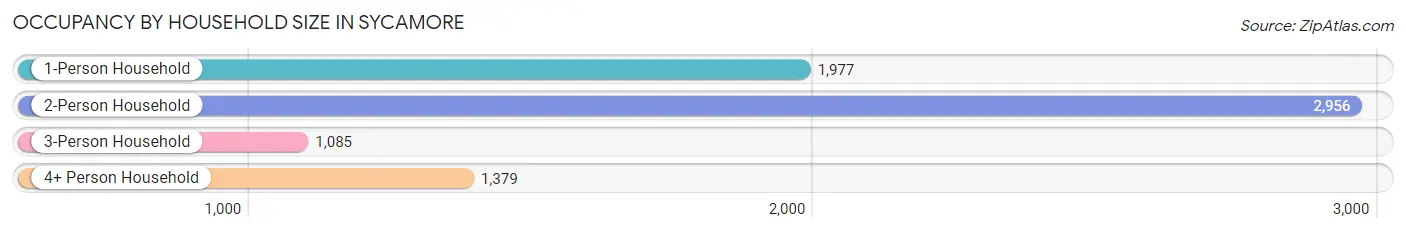
| Household Size | # Housing Units | % Housing Units |
| 1-Person Household | 1,977 | 26.7% |
| 2-Person Household | 2,956 | 40.0% |
| 3-Person Household | 1,085 | 14.7% |
| 4+ Person Household | 1,379 | 18.6% |
| Total Housing Units | 7,397 | 100.0% |
Occupancy by Ownership by Household Size in Sycamore
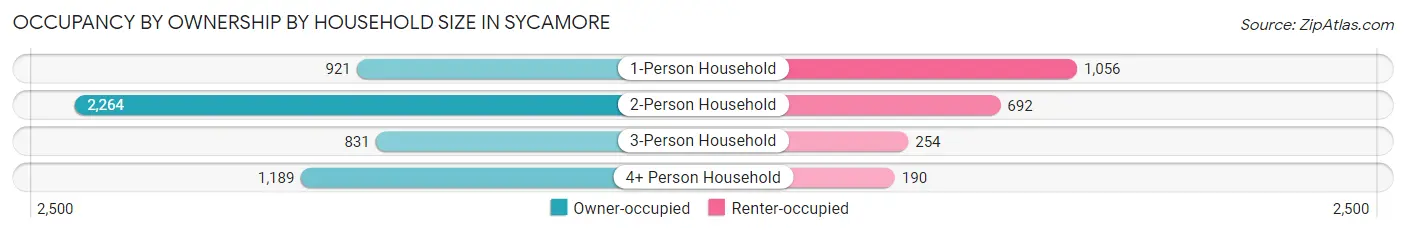
| Household Size | Owner-occupied | Renter-occupied |
| 1-Person Household | 921 (46.6%) | 1,056 (53.4%) |
| 2-Person Household | 2,264 (76.6%) | 692 (23.4%) |
| 3-Person Household | 831 (76.6%) | 254 (23.4%) |
| 4+ Person Household | 1,189 (86.2%) | 190 (13.8%) |
| Total Housing Units | 5,205 (70.4%) | 2,192 (29.6%) |
Occupancy by Educational Attainment in Sycamore
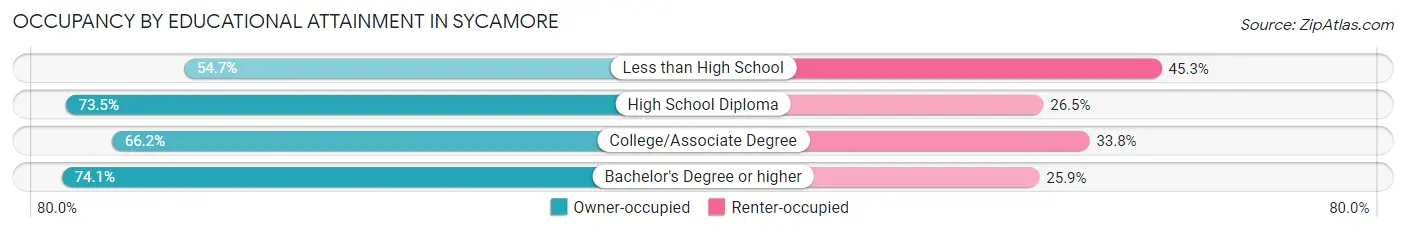
| Household Size | Owner-occupied | Renter-occupied |
| Less than High School | 116 (54.7%) | 96 (45.3%) |
| High School Diploma | 743 (73.5%) | 268 (26.5%) |
| College/Associate Degree | 1,917 (66.2%) | 980 (33.8%) |
| Bachelor's Degree or higher | 2,429 (74.1%) | 848 (25.9%) |
Occupancy by Age of Householder in Sycamore
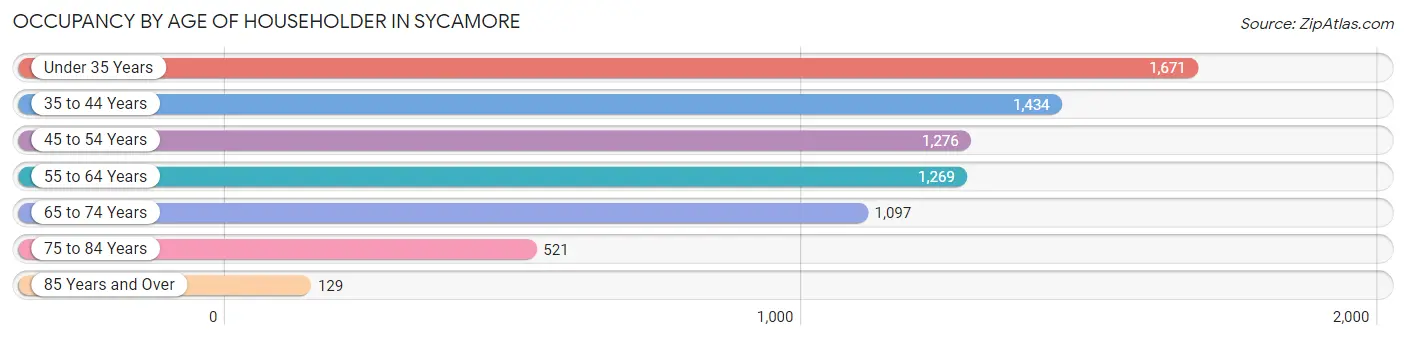
| Age Bracket | # Households | % Households |
| Under 35 Years | 1,671 | 22.6% |
| 35 to 44 Years | 1,434 | 19.4% |
| 45 to 54 Years | 1,276 | 17.2% |
| 55 to 64 Years | 1,269 | 17.2% |
| 65 to 74 Years | 1,097 | 14.8% |
| 75 to 84 Years | 521 | 7.0% |
| 85 Years and Over | 129 | 1.7% |
| Total | 7,397 | 100.0% |
Housing Finances in Sycamore
Median Income by Occupancy in Sycamore
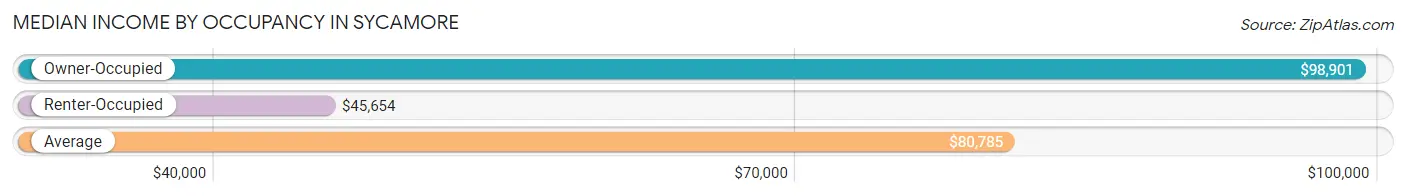
| Occupancy Type | # Households | Median Income |
| Owner-Occupied | 5,205 (70.4%) | $98,901 |
| Renter-Occupied | 2,192 (29.6%) | $45,654 |
| Average | 7,397 (100.0%) | $80,785 |
Occupancy by Householder Income Bracket in Sycamore
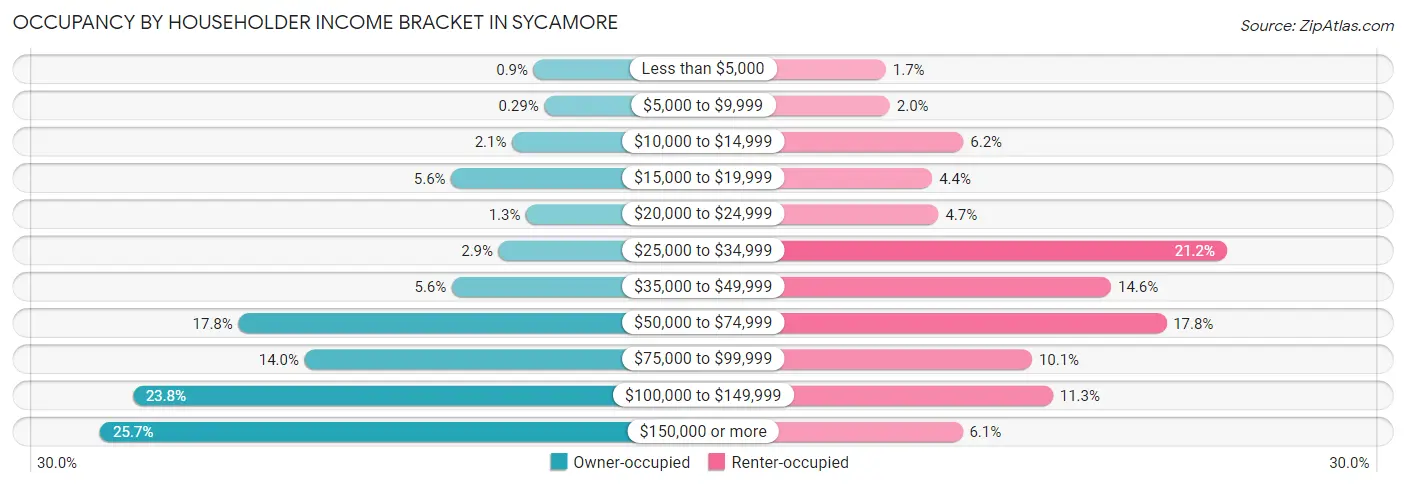
| Income Bracket | Owner-occupied | Renter-occupied |
| Less than $5,000 | 47 (0.9%) | 38 (1.7%) |
| $5,000 to $9,999 | 15 (0.3%) | 43 (2.0%) |
| $10,000 to $14,999 | 111 (2.1%) | 135 (6.2%) |
| $15,000 to $19,999 | 292 (5.6%) | 96 (4.4%) |
| $20,000 to $24,999 | 69 (1.3%) | 104 (4.7%) |
| $25,000 to $34,999 | 151 (2.9%) | 465 (21.2%) |
| $35,000 to $49,999 | 290 (5.6%) | 320 (14.6%) |
| $50,000 to $74,999 | 925 (17.8%) | 389 (17.7%) |
| $75,000 to $99,999 | 728 (14.0%) | 221 (10.1%) |
| $100,000 to $149,999 | 1,240 (23.8%) | 247 (11.3%) |
| $150,000 or more | 1,337 (25.7%) | 134 (6.1%) |
| Total | 5,205 (100.0%) | 2,192 (100.0%) |
Monthly Housing Cost Tiers in Sycamore
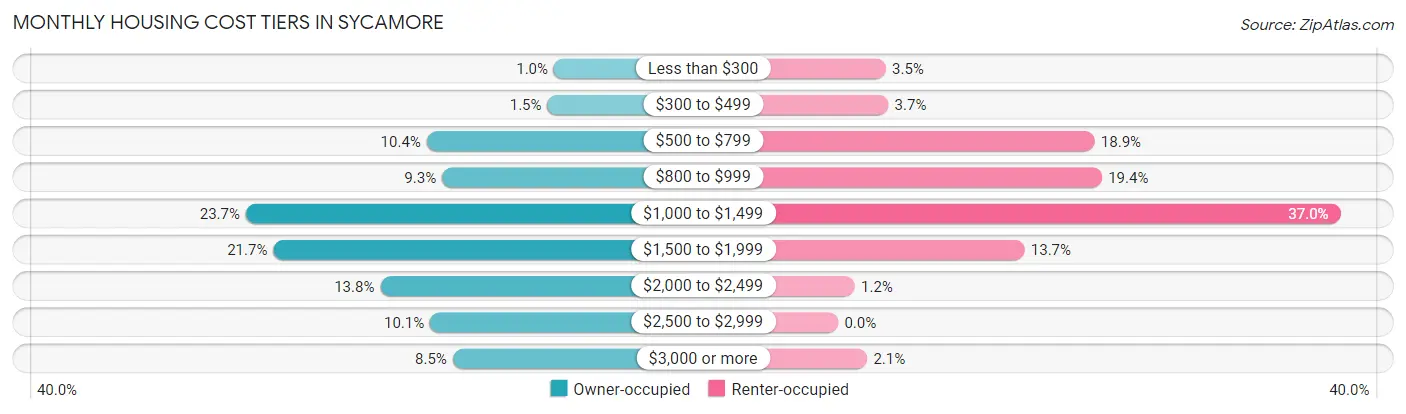
| Monthly Cost | Owner-occupied | Renter-occupied |
| Less than $300 | 53 (1.0%) | 77 (3.5%) |
| $300 to $499 | 78 (1.5%) | 81 (3.7%) |
| $500 to $799 | 541 (10.4%) | 414 (18.9%) |
| $800 to $999 | 482 (9.3%) | 426 (19.4%) |
| $1,000 to $1,499 | 1,234 (23.7%) | 812 (37.0%) |
| $1,500 to $1,999 | 1,129 (21.7%) | 301 (13.7%) |
| $2,000 to $2,499 | 719 (13.8%) | 27 (1.2%) |
| $2,500 to $2,999 | 528 (10.1%) | 0 (0.0%) |
| $3,000 or more | 441 (8.5%) | 47 (2.1%) |
| Total | 5,205 (100.0%) | 2,192 (100.0%) |
Physical Housing Characteristics in Sycamore
Housing Structures in Sycamore
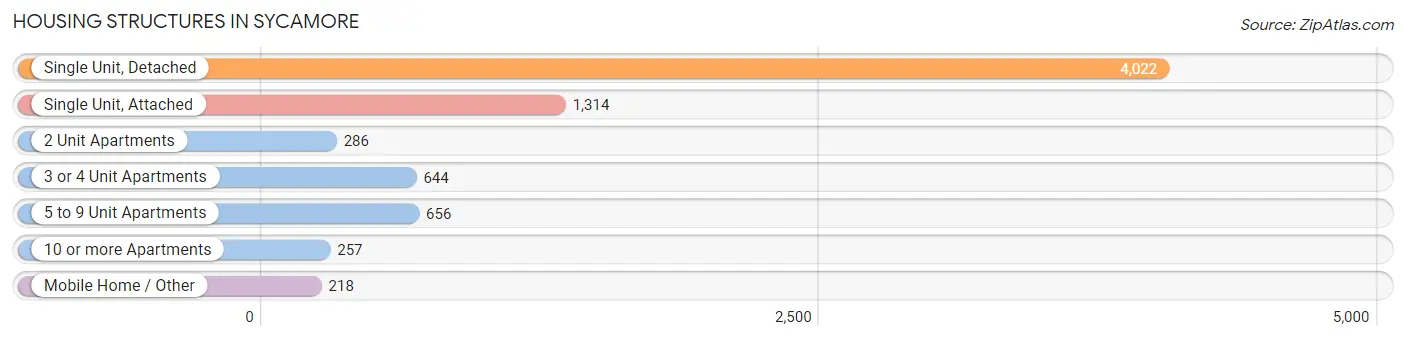
| Structure Type | # Housing Units | % Housing Units |
| Single Unit, Detached | 4,022 | 54.4% |
| Single Unit, Attached | 1,314 | 17.8% |
| 2 Unit Apartments | 286 | 3.9% |
| 3 or 4 Unit Apartments | 644 | 8.7% |
| 5 to 9 Unit Apartments | 656 | 8.9% |
| 10 or more Apartments | 257 | 3.5% |
| Mobile Home / Other | 218 | 2.9% |
| Total | 7,397 | 100.0% |
Housing Structures by Occupancy in Sycamore
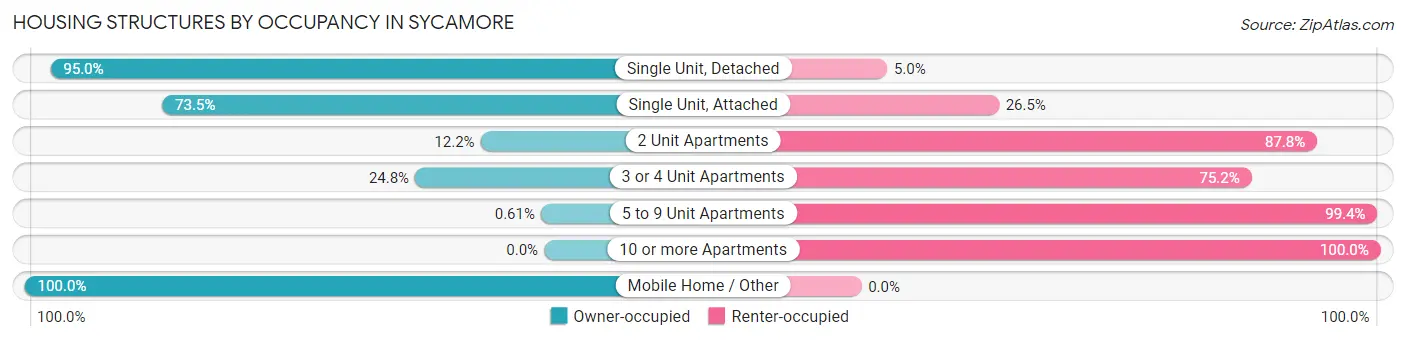
| Structure Type | Owner-occupied | Renter-occupied |
| Single Unit, Detached | 3,822 (95.0%) | 200 (5.0%) |
| Single Unit, Attached | 966 (73.5%) | 348 (26.5%) |
| 2 Unit Apartments | 35 (12.2%) | 251 (87.8%) |
| 3 or 4 Unit Apartments | 160 (24.8%) | 484 (75.2%) |
| 5 to 9 Unit Apartments | 4 (0.6%) | 652 (99.4%) |
| 10 or more Apartments | 0 (0.0%) | 257 (100.0%) |
| Mobile Home / Other | 218 (100.0%) | 0 (0.0%) |
| Total | 5,205 (70.4%) | 2,192 (29.6%) |
Housing Structures by Number of Rooms in Sycamore
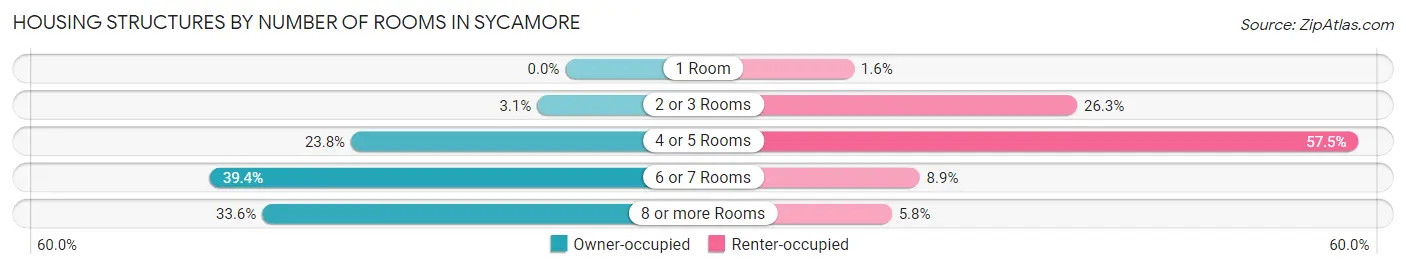
| Number of Rooms | Owner-occupied | Renter-occupied |
| 1 Room | 0 (0.0%) | 34 (1.5%) |
| 2 or 3 Rooms | 163 (3.1%) | 577 (26.3%) |
| 4 or 5 Rooms | 1,238 (23.8%) | 1,261 (57.5%) |
| 6 or 7 Rooms | 2,053 (39.4%) | 194 (8.8%) |
| 8 or more Rooms | 1,751 (33.6%) | 126 (5.8%) |
| Total | 5,205 (100.0%) | 2,192 (100.0%) |
Housing Structure by Heating Type in Sycamore
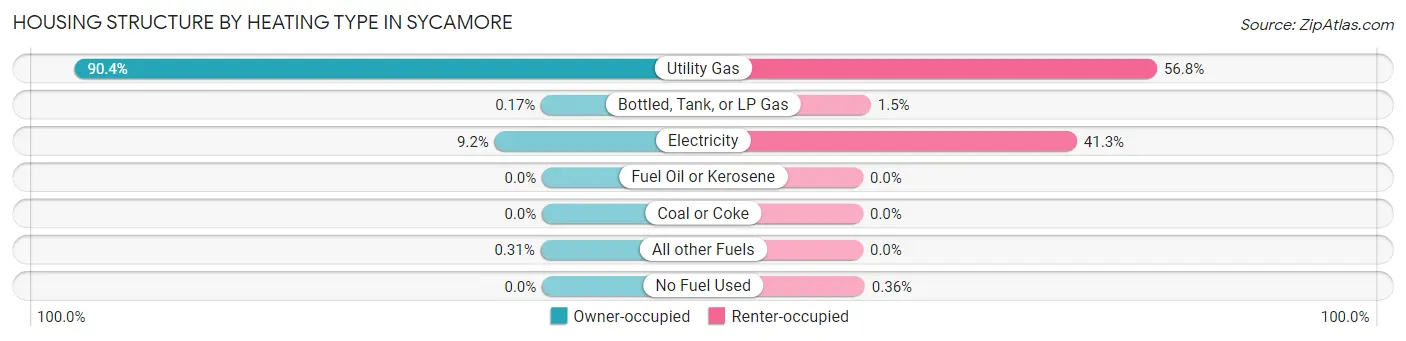
| Heating Type | Owner-occupied | Renter-occupied |
| Utility Gas | 4,703 (90.4%) | 1,245 (56.8%) |
| Bottled, Tank, or LP Gas | 9 (0.2%) | 33 (1.5%) |
| Electricity | 477 (9.2%) | 906 (41.3%) |
| Fuel Oil or Kerosene | 0 (0.0%) | 0 (0.0%) |
| Coal or Coke | 0 (0.0%) | 0 (0.0%) |
| All other Fuels | 16 (0.3%) | 0 (0.0%) |
| No Fuel Used | 0 (0.0%) | 8 (0.4%) |
| Total | 5,205 (100.0%) | 2,192 (100.0%) |
Household Vehicle Usage in Sycamore
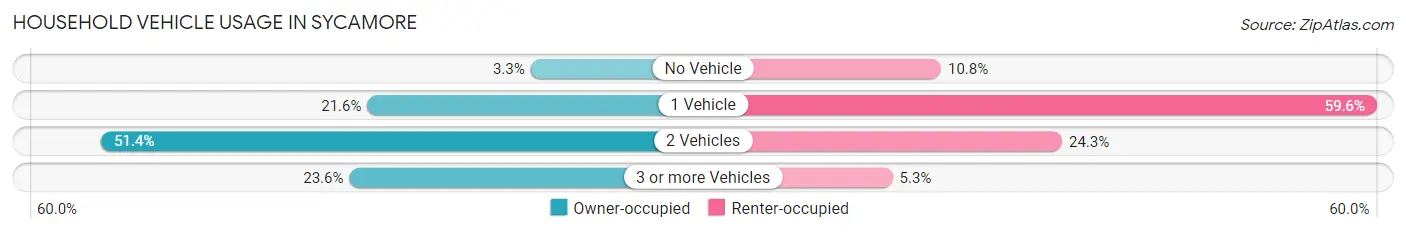
| Vehicles per Household | Owner-occupied | Renter-occupied |
| No Vehicle | 173 (3.3%) | 236 (10.8%) |
| 1 Vehicle | 1,125 (21.6%) | 1,306 (59.6%) |
| 2 Vehicles | 2,677 (51.4%) | 533 (24.3%) |
| 3 or more Vehicles | 1,230 (23.6%) | 117 (5.3%) |
| Total | 5,205 (100.0%) | 2,192 (100.0%) |
Real Estate & Mortgages in Sycamore
Real Estate and Mortgage Overview in Sycamore
| Characteristic | Without Mortgage | With Mortgage |
| Housing Units | 1,239 | 3,966 |
| Median Property Value | $217,900 | $255,300 |
| Median Household Income | $70,469 | $1,164 |
| Monthly Housing Costs | $807 | $441 |
| Real Estate Taxes | $4,932 | $194 |
Property Value by Mortgage Status in Sycamore
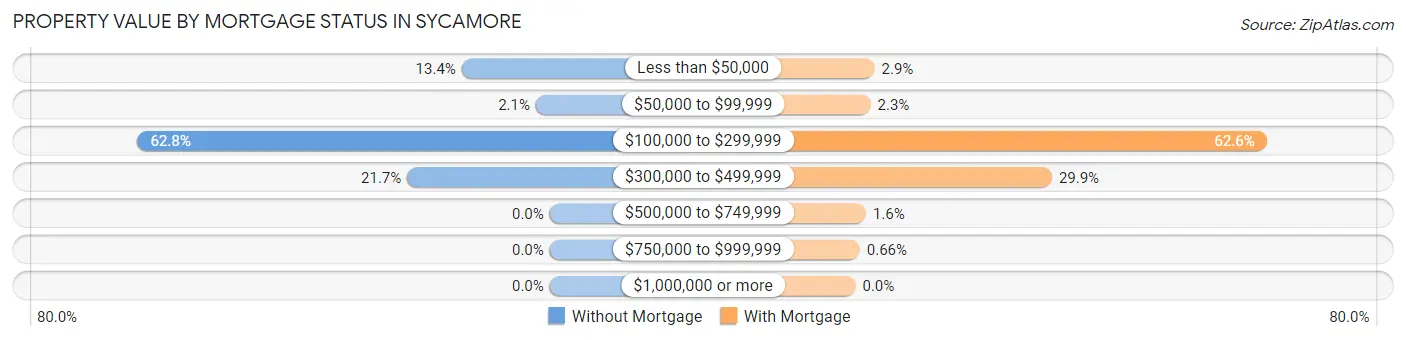
| Property Value | Without Mortgage | With Mortgage |
| Less than $50,000 | 166 (13.4%) | 115 (2.9%) |
| $50,000 to $99,999 | 26 (2.1%) | 91 (2.3%) |
| $100,000 to $299,999 | 778 (62.8%) | 2,484 (62.6%) |
| $300,000 to $499,999 | 269 (21.7%) | 1,187 (29.9%) |
| $500,000 to $749,999 | 0 (0.0%) | 63 (1.6%) |
| $750,000 to $999,999 | 0 (0.0%) | 26 (0.7%) |
| $1,000,000 or more | 0 (0.0%) | 0 (0.0%) |
| Total | 1,239 (100.0%) | 3,966 (100.0%) |
Household Income by Mortgage Status in Sycamore
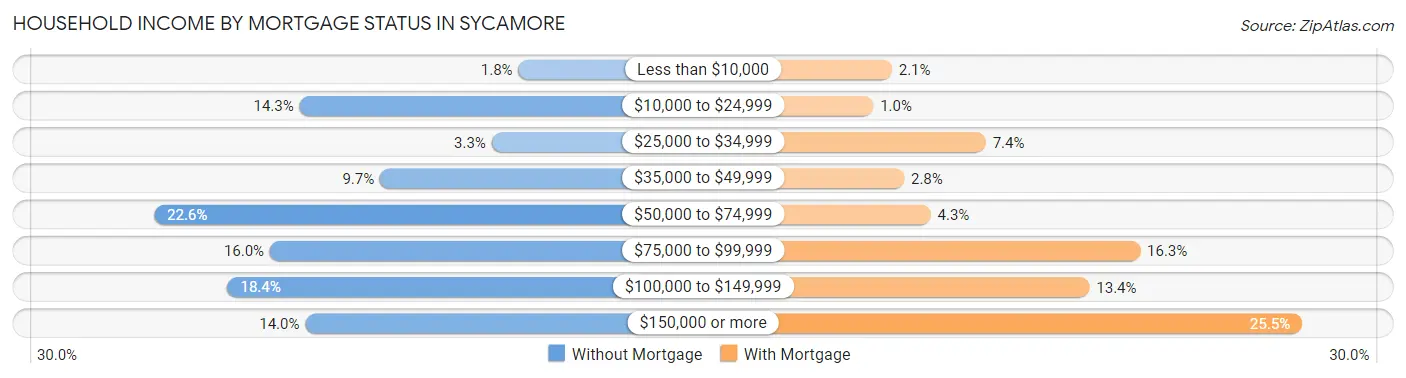
| Household Income | Without Mortgage | With Mortgage |
| Less than $10,000 | 22 (1.8%) | 82 (2.1%) |
| $10,000 to $24,999 | 177 (14.3%) | 40 (1.0%) |
| $25,000 to $34,999 | 41 (3.3%) | 295 (7.4%) |
| $35,000 to $49,999 | 120 (9.7%) | 110 (2.8%) |
| $50,000 to $74,999 | 280 (22.6%) | 170 (4.3%) |
| $75,000 to $99,999 | 198 (16.0%) | 645 (16.3%) |
| $100,000 to $149,999 | 228 (18.4%) | 530 (13.4%) |
| $150,000 or more | 173 (14.0%) | 1,012 (25.5%) |
| Total | 1,239 (100.0%) | 3,966 (100.0%) |
Property Value to Household Income Ratio in Sycamore
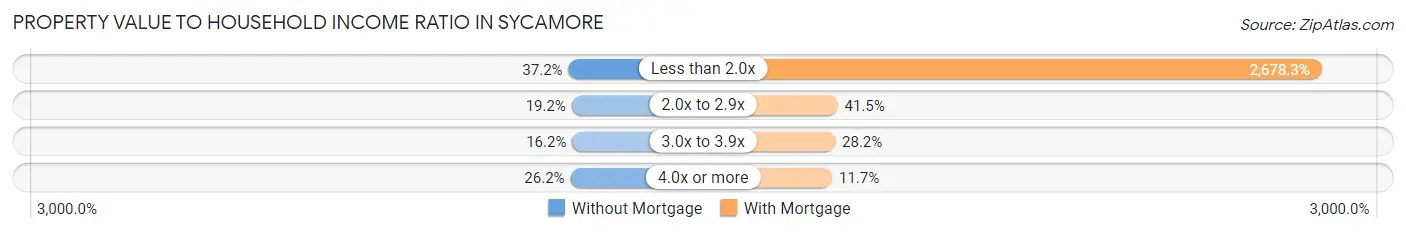
| Value-to-Income Ratio | Without Mortgage | With Mortgage |
| Less than 2.0x | 461 (37.2%) | 106,221 (2,678.3%) |
| 2.0x to 2.9x | 238 (19.2%) | 1,644 (41.4%) |
| 3.0x to 3.9x | 201 (16.2%) | 1,117 (28.2%) |
| 4.0x or more | 325 (26.2%) | 465 (11.7%) |
| Total | 1,239 (100.0%) | 3,966 (100.0%) |
Real Estate Taxes by Mortgage Status in Sycamore
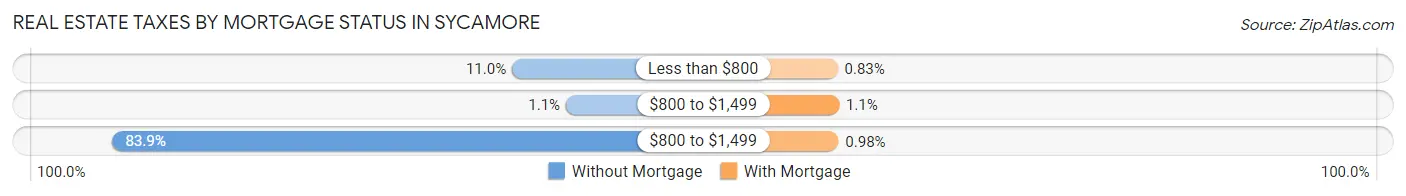
| Property Taxes | Without Mortgage | With Mortgage |
| Less than $800 | 136 (11.0%) | 33 (0.8%) |
| $800 to $1,499 | 14 (1.1%) | 43 (1.1%) |
| $800 to $1,499 | 1,040 (83.9%) | 39 (1.0%) |
| Total | 1,239 (100.0%) | 3,966 (100.0%) |
Health & Disability in Sycamore
Health Insurance Coverage by Age in Sycamore
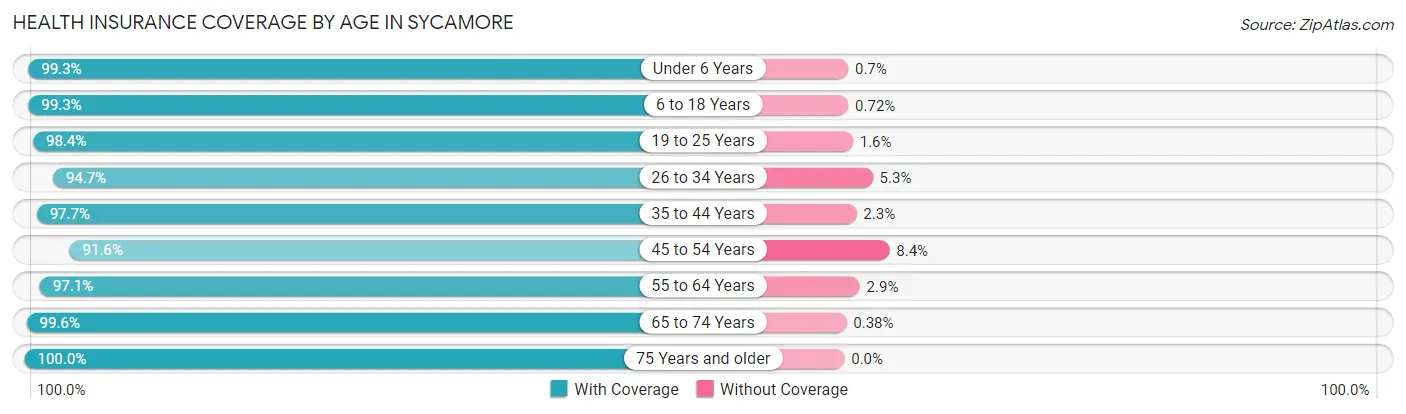
| Age Bracket | With Coverage | Without Coverage |
| Under 6 Years | 1,129 (99.3%) | 8 (0.7%) |
| 6 to 18 Years | 3,598 (99.3%) | 26 (0.7%) |
| 19 to 25 Years | 1,492 (98.4%) | 24 (1.6%) |
| 26 to 34 Years | 1,934 (94.7%) | 108 (5.3%) |
| 35 to 44 Years | 2,421 (97.7%) | 56 (2.3%) |
| 45 to 54 Years | 2,029 (91.6%) | 186 (8.4%) |
| 55 to 64 Years | 2,275 (97.1%) | 67 (2.9%) |
| 65 to 74 Years | 1,557 (99.6%) | 6 (0.4%) |
| 75 Years and older | 1,098 (100.0%) | 0 (0.0%) |
| Total | 17,533 (97.3%) | 481 (2.7%) |
Health Insurance Coverage by Citizenship Status in Sycamore
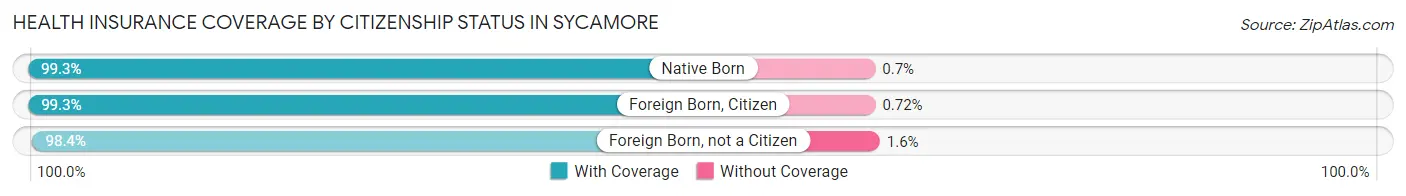
| Citizenship Status | With Coverage | Without Coverage |
| Native Born | 1,129 (99.3%) | 8 (0.7%) |
| Foreign Born, Citizen | 3,598 (99.3%) | 26 (0.7%) |
| Foreign Born, not a Citizen | 1,492 (98.4%) | 24 (1.6%) |
Health Insurance Coverage by Household Income in Sycamore
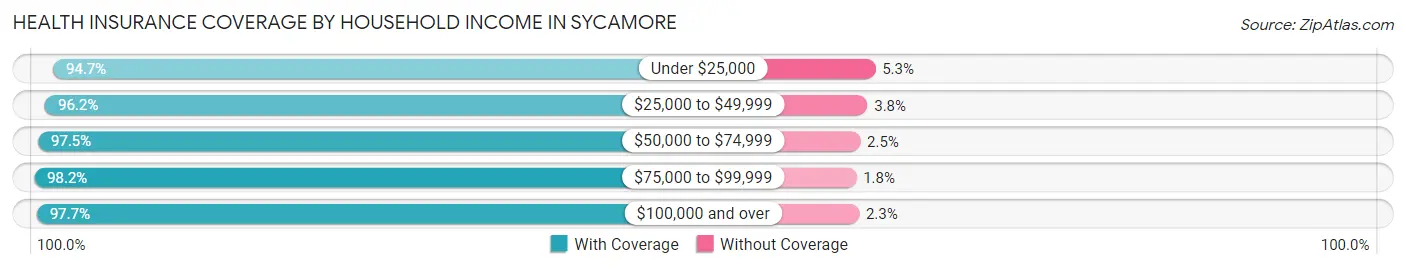
| Household Income | With Coverage | Without Coverage |
| Under $25,000 | 1,459 (94.7%) | 82 (5.3%) |
| $25,000 to $49,999 | 1,804 (96.2%) | 72 (3.8%) |
| $50,000 to $74,999 | 2,898 (97.5%) | 74 (2.5%) |
| $75,000 to $99,999 | 2,237 (98.2%) | 40 (1.8%) |
| $100,000 and over | 9,096 (97.7%) | 212 (2.3%) |
Public vs Private Health Insurance Coverage by Age in Sycamore
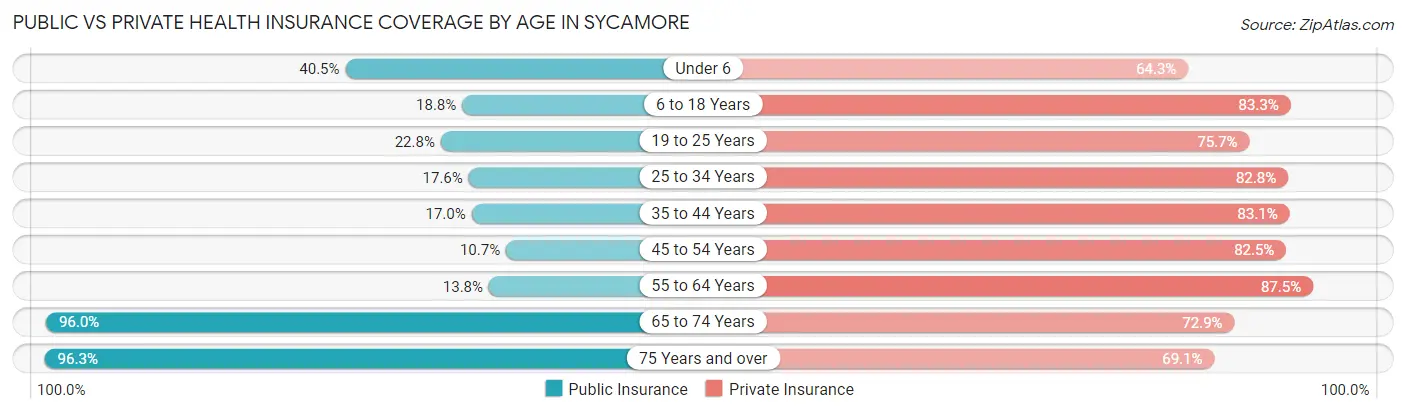
| Age Bracket | Public Insurance | Private Insurance |
| Under 6 | 460 (40.5%) | 731 (64.3%) |
| 6 to 18 Years | 681 (18.8%) | 3,019 (83.3%) |
| 19 to 25 Years | 345 (22.8%) | 1,147 (75.7%) |
| 25 to 34 Years | 359 (17.6%) | 1,691 (82.8%) |
| 35 to 44 Years | 422 (17.0%) | 2,059 (83.1%) |
| 45 to 54 Years | 236 (10.6%) | 1,827 (82.5%) |
| 55 to 64 Years | 324 (13.8%) | 2,048 (87.5%) |
| 65 to 74 Years | 1,501 (96.0%) | 1,139 (72.9%) |
| 75 Years and over | 1,057 (96.3%) | 759 (69.1%) |
| Total | 5,385 (29.9%) | 14,420 (80.0%) |
Disability Status by Sex by Age in Sycamore
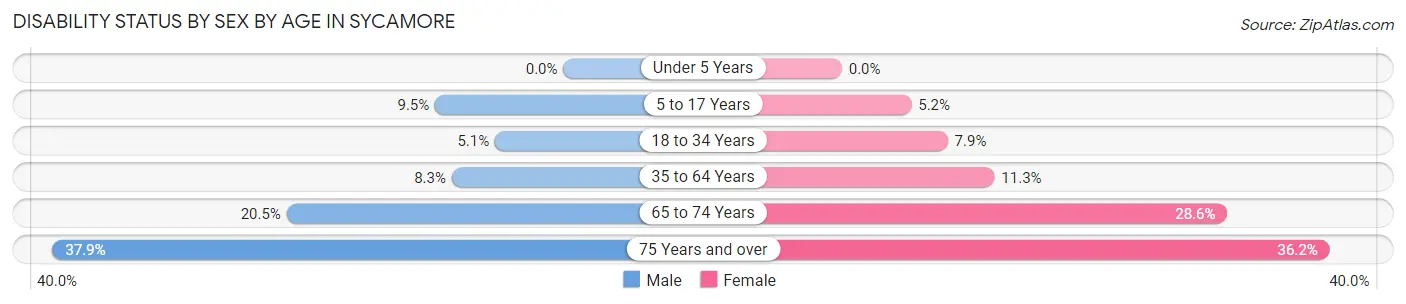
| Age Bracket | Male | Female |
| Under 5 Years | 0 (0.0%) | 0 (0.0%) |
| 5 to 17 Years | 158 (9.5%) | 90 (5.2%) |
| 18 to 34 Years | 85 (5.1%) | 180 (7.9%) |
| 35 to 64 Years | 271 (8.3%) | 426 (11.3%) |
| 65 to 74 Years | 138 (20.5%) | 255 (28.6%) |
| 75 Years and over | 206 (37.9%) | 201 (36.2%) |
Disability Class by Sex by Age in Sycamore
Disability Class: Hearing Difficulty
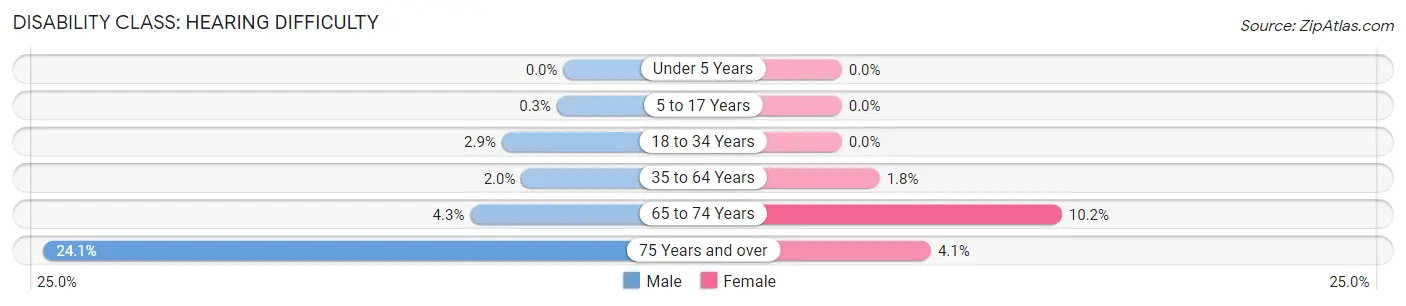
| Age Bracket | Male | Female |
| Under 5 Years | 0 (0.0%) | 0 (0.0%) |
| 5 to 17 Years | 5 (0.3%) | 0 (0.0%) |
| 18 to 34 Years | 48 (2.9%) | 0 (0.0%) |
| 35 to 64 Years | 64 (1.9%) | 66 (1.8%) |
| 65 to 74 Years | 29 (4.3%) | 91 (10.2%) |
| 75 Years and over | 131 (24.1%) | 23 (4.1%) |
Disability Class: Vision Difficulty
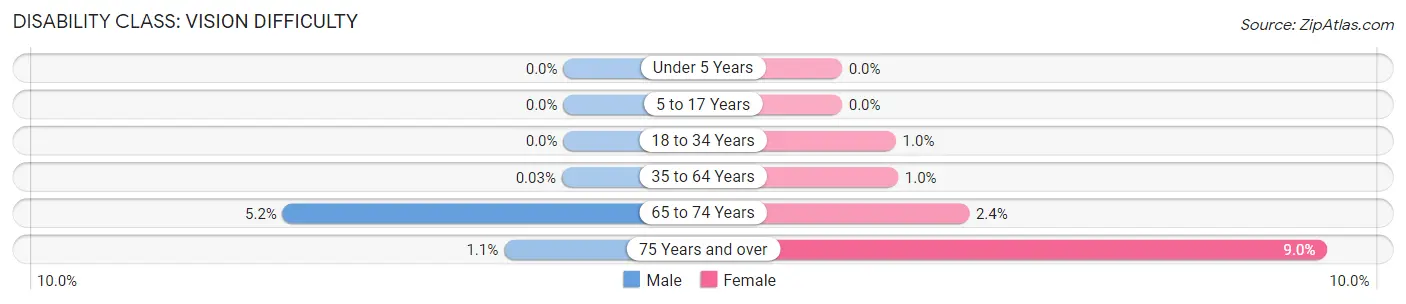
| Age Bracket | Male | Female |
| Under 5 Years | 0 (0.0%) | 0 (0.0%) |
| 5 to 17 Years | 0 (0.0%) | 0 (0.0%) |
| 18 to 34 Years | 0 (0.0%) | 23 (1.0%) |
| 35 to 64 Years | 1 (0.0%) | 39 (1.0%) |
| 65 to 74 Years | 35 (5.2%) | 21 (2.4%) |
| 75 Years and over | 6 (1.1%) | 50 (9.0%) |
Disability Class: Cognitive Difficulty
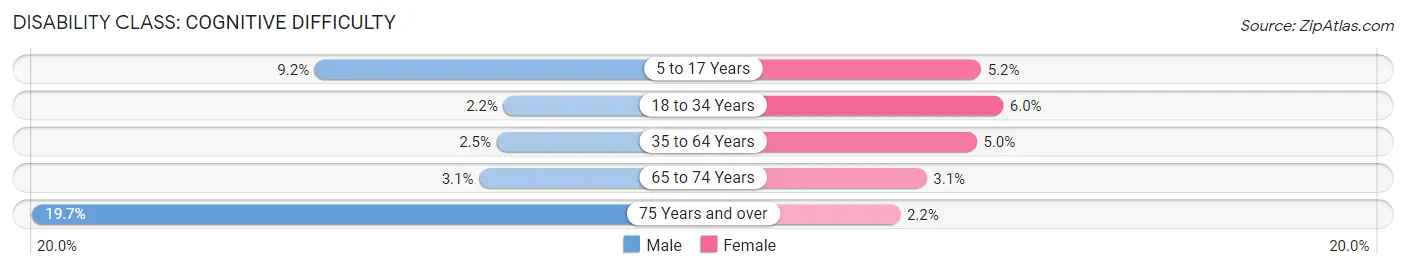
| Age Bracket | Male | Female |
| 5 to 17 Years | 153 (9.2%) | 90 (5.2%) |
| 18 to 34 Years | 37 (2.2%) | 137 (6.0%) |
| 35 to 64 Years | 81 (2.5%) | 188 (5.0%) |
| 65 to 74 Years | 21 (3.1%) | 28 (3.1%) |
| 75 Years and over | 107 (19.7%) | 12 (2.2%) |
Disability Class: Ambulatory Difficulty
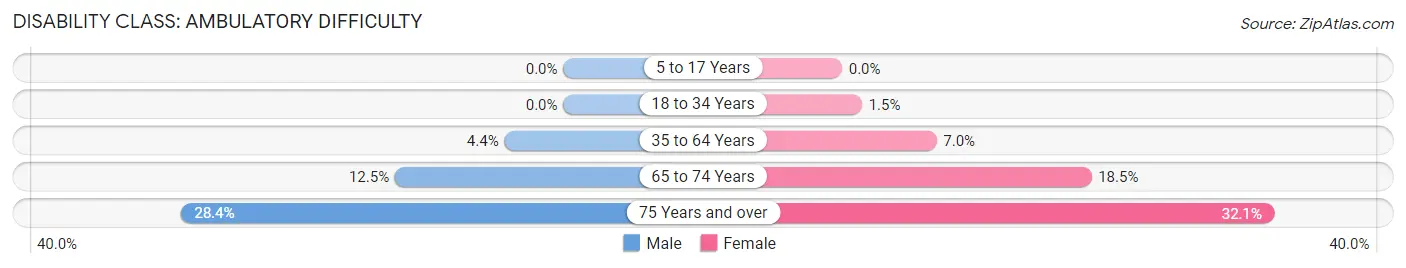
| Age Bracket | Male | Female |
| 5 to 17 Years | 0 (0.0%) | 0 (0.0%) |
| 18 to 34 Years | 0 (0.0%) | 34 (1.5%) |
| 35 to 64 Years | 143 (4.4%) | 264 (7.0%) |
| 65 to 74 Years | 84 (12.5%) | 165 (18.5%) |
| 75 Years and over | 154 (28.4%) | 178 (32.1%) |
Disability Class: Self-Care Difficulty
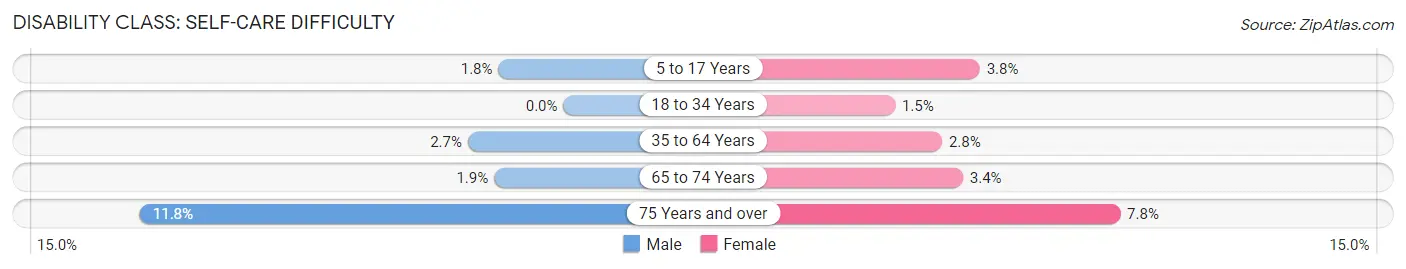
| Age Bracket | Male | Female |
| 5 to 17 Years | 30 (1.8%) | 67 (3.8%) |
| 18 to 34 Years | 0 (0.0%) | 34 (1.5%) |
| 35 to 64 Years | 87 (2.7%) | 105 (2.8%) |
| 65 to 74 Years | 13 (1.9%) | 30 (3.4%) |
| 75 Years and over | 64 (11.8%) | 43 (7.7%) |
Technology Access in Sycamore
Computing Device Access in Sycamore
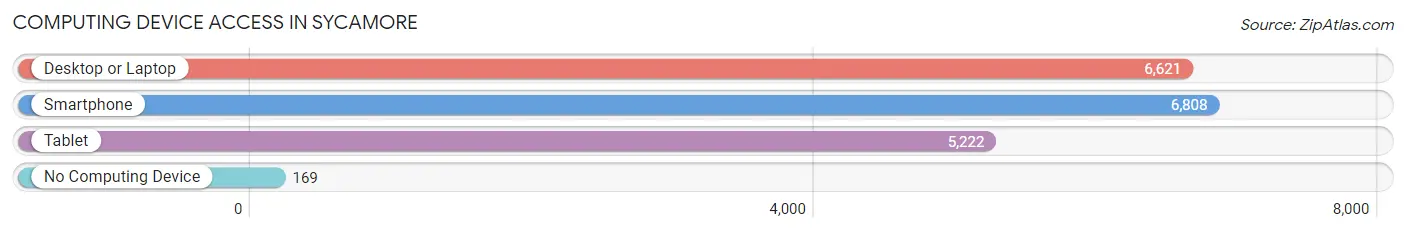
| Device Type | # Households | % Households |
| Desktop or Laptop | 6,621 | 89.5% |
| Smartphone | 6,808 | 92.0% |
| Tablet | 5,222 | 70.6% |
| No Computing Device | 169 | 2.3% |
| Total | 7,397 | 100.0% |
Internet Access in Sycamore
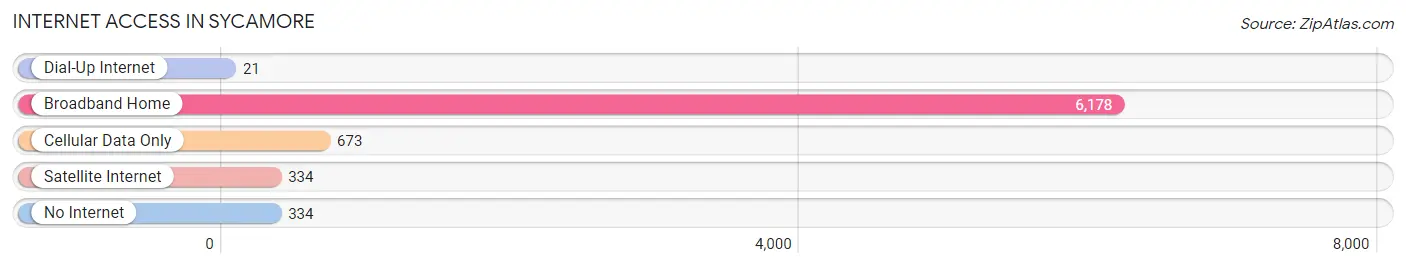
| Internet Type | # Households | % Households |
| Dial-Up Internet | 21 | 0.3% |
| Broadband Home | 6,178 | 83.5% |
| Cellular Data Only | 673 | 9.1% |
| Satellite Internet | 334 | 4.5% |
| No Internet | 334 | 4.5% |
| Total | 7,397 | 100.0% |
Sycamore Summary
Sycamore, Illinois is a small city located in DeKalb County, Illinois, about 50 miles west of Chicago. The city is part of the Chicago metropolitan area and is home to a population of 17,519 people as of the 2010 census. The city is known for its historic downtown area, which is home to a variety of shops, restaurants, and other businesses.
History
Sycamore was first settled in 1835 by the Dr. Pierce and his family. The city was originally known as “Pierce’s Grove” and was later renamed to Sycamore in 1837. The name was chosen due to the abundance of sycamore trees in the area. The city was officially incorporated in 1858.
In the late 19th century, Sycamore was a major center for the production of farm equipment. The city was home to the DeKalb Agricultural Works, which was the largest manufacturer of farm equipment in the world at the time. The company was eventually bought out by International Harvester in 1902.
In the early 20th century, Sycamore was a major center for the production of furniture. The city was home to the Sycamore Furniture Company, which was the largest furniture manufacturer in the world at the time. The company was eventually bought out by the Simmons Company in the 1950s.
Geography
Sycamore is located in northern Illinois, about 50 miles west of Chicago. The city is situated in the Kishwaukee River Valley, which is part of the larger Rock River Valley. The city is surrounded by rolling hills and is home to a variety of parks and recreational areas.
The climate in Sycamore is classified as humid continental, with hot summers and cold winters. The average temperature in the summer is around 75 degrees Fahrenheit, while the average temperature in the winter is around 25 degrees Fahrenheit.
Economy
Sycamore’s economy is largely based on manufacturing and agriculture. The city is home to a variety of manufacturing companies, including the Sycamore Furniture Company, the DeKalb Agricultural Works, and the International Harvester Company. The city is also home to a variety of agricultural businesses, including dairy farms, grain farms, and vegetable farms.
The city is also home to a variety of retail businesses, including a variety of shops, restaurants, and other businesses. The city is also home to a variety of medical and educational institutions, including Kishwaukee Community College and Northern Illinois University.
Demographics
As of the 2010 census, Sycamore had a population of 17,519 people. The racial makeup of the city was 87.3% White, 5.3% African American, 0.4% Native American, 1.7% Asian, 0.1% Pacific Islander, 2.7% from other races, and 2.5% from two or more races. Hispanic or Latino of any race were 6.3% of the population.
The median household income in Sycamore was $50,945, and the median family income was $62,917. The per capita income in the city was $25,945. About 8.3% of the population was below the poverty line.
Common Questions
What is Per Capita Income in Sycamore?
Per Capita income in Sycamore is $39,364.
What is the Median Family Income in Sycamore?
Median Family Income in Sycamore is $101,778.
What is the Median Household income in Sycamore?
Median Household Income in Sycamore is $80,785.
What is Income or Wage Gap in Sycamore?
Income or Wage Gap in Sycamore is 36.3%.
Women in Sycamore earn 63.7 cents for every dollar earned by a man.
What is Family Income Deficit in Sycamore?
Family Income Deficit in Sycamore is $8,383.
Families that are below poverty line in Sycamore earn $8,383 less on average than the poverty threshold level.
What is Inequality or Gini Index in Sycamore?
Inequality or Gini Index in Sycamore is 0.39.
What is the Total Population of Sycamore?
Total Population of Sycamore is 18,171.
What is the Total Male Population of Sycamore?
Total Male Population of Sycamore is 8,478.
What is the Total Female Population of Sycamore?
Total Female Population of Sycamore is 9,693.
What is the Ratio of Males per 100 Females in Sycamore?
There are 87.47 Males per 100 Females in Sycamore.
What is the Ratio of Females per 100 Males in Sycamore?
There are 114.33 Females per 100 Males in Sycamore.
What is the Median Population Age in Sycamore?
Median Population Age in Sycamore is 37.9 Years.
What is the Average Family Size in Sycamore
Average Family Size in Sycamore is 3.0 People.
What is the Average Household Size in Sycamore
Average Household Size in Sycamore is 2.4 People.
How Large is the Labor Force in Sycamore?
There are 9,924 People in the Labor Forcein in Sycamore.
What is the Percentage of People in the Labor Force in Sycamore?
69.5% of People are in the Labor Force in Sycamore.
What is the Unemployment Rate in Sycamore?
Unemployment Rate in Sycamore is 3.2%.