Butler, WI Map & Demographics
Butler Map
Butler Overview
$33,224
PER CAPITA INCOME
$101,667
AVG FAMILY INCOME
$53,051
AVG HOUSEHOLD INCOME
26.9%
WAGE / INCOME GAP [ % ]
73.1¢/ $1
WAGE / INCOME GAP [ $ ]
$4,841
FAMILY INCOME DEFICIT
0.38
INEQUALITY / GINI INDEX
1,906
TOTAL POPULATION
944
MALE POPULATION
962
FEMALE POPULATION
98.13
MALES / 100 FEMALES
101.91
FEMALES / 100 MALES
45.1
MEDIAN AGE
3.1
AVG FAMILY SIZE
2.2
AVG HOUSEHOLD SIZE
1,162
LABOR FORCE [ PEOPLE ]
71.0%
PERCENT IN LABOR FORCE
3.2%
UNEMPLOYMENT RATE
Butler Zip Codes
Butler Area Codes
Income in Butler
Income Overview in Butler
Per Capita Income in Butler is $33,224, while median incomes of families and households are $101,667 and $53,051 respectively.
| Characteristic | Number | Measure |
| Per Capita Income | 1,906 | $33,224 |
| Median Family Income | 400 | $101,667 |
| Mean Family Income | 400 | $94,635 |
| Median Household Income | 863 | $53,051 |
| Mean Household Income | 863 | $69,270 |
| Income Deficit | 400 | $4,841 |
| Wage / Income Gap (%) | 1,906 | 26.94% |
| Wage / Income Gap ($) | 1,906 | 73.06¢ per $1 |
| Gini / Inequality Index | 1,906 | 0.38 |
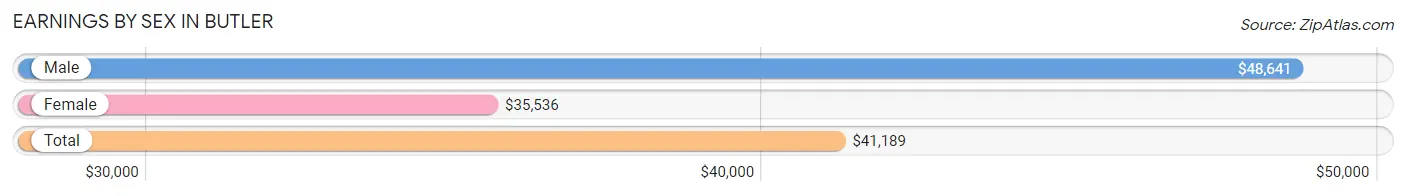
Earnings by Sex in Butler
Average Earnings in Butler are $41,189, $48,641 for men and $35,536 for women, a difference of 26.9%.
| Sex | Number | Average Earnings |
| Male | 645 (54.3%) | $48,641 |
| Female | 543 (45.7%) | $35,536 |
| Total | 1,188 (100.0%) | $41,189 |
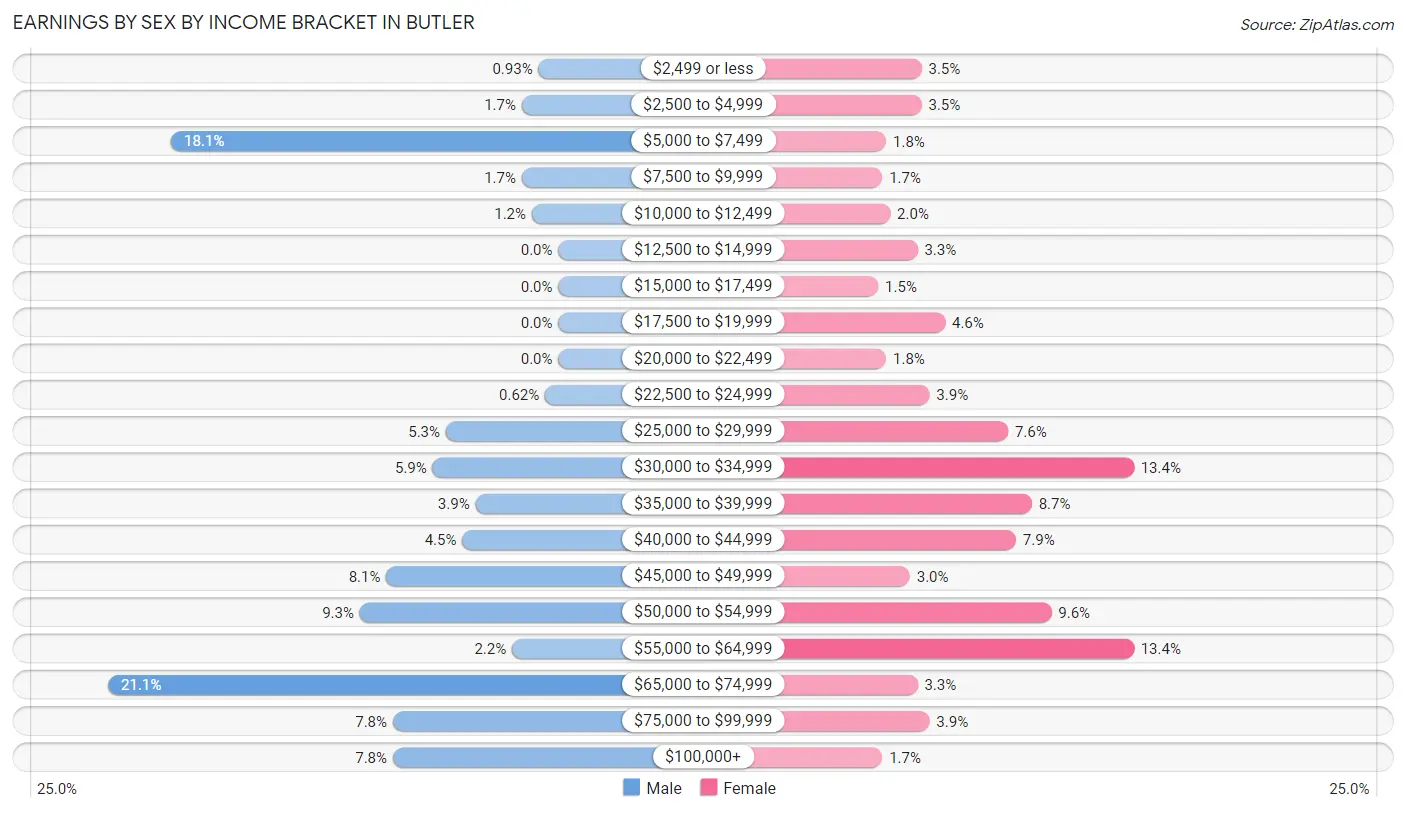
Earnings by Sex by Income Bracket in Butler
The most common earnings brackets in Butler are $65,000 to $74,999 for men (136 | 21.1%) and $30,000 to $34,999 for women (73 | 13.4%).
| Income | Male | Female |
| $2,499 or less | 6 (0.9%) | 19 (3.5%) |
| $2,500 to $4,999 | 11 (1.7%) | 19 (3.5%) |
| $5,000 to $7,499 | 117 (18.1%) | 10 (1.8%) |
| $7,500 to $9,999 | 11 (1.7%) | 9 (1.7%) |
| $10,000 to $12,499 | 8 (1.2%) | 11 (2.0%) |
| $12,500 to $14,999 | 0 (0.0%) | 18 (3.3%) |
| $15,000 to $17,499 | 0 (0.0%) | 8 (1.5%) |
| $17,500 to $19,999 | 0 (0.0%) | 25 (4.6%) |
| $20,000 to $22,499 | 0 (0.0%) | 10 (1.8%) |
| $22,500 to $24,999 | 4 (0.6%) | 21 (3.9%) |
| $25,000 to $29,999 | 34 (5.3%) | 41 (7.5%) |
| $30,000 to $34,999 | 38 (5.9%) | 73 (13.4%) |
| $35,000 to $39,999 | 25 (3.9%) | 47 (8.7%) |
| $40,000 to $44,999 | 29 (4.5%) | 43 (7.9%) |
| $45,000 to $49,999 | 52 (8.1%) | 16 (2.9%) |
| $50,000 to $54,999 | 60 (9.3%) | 52 (9.6%) |
| $55,000 to $64,999 | 14 (2.2%) | 73 (13.4%) |
| $65,000 to $74,999 | 136 (21.1%) | 18 (3.3%) |
| $75,000 to $99,999 | 50 (7.7%) | 21 (3.9%) |
| $100,000+ | 50 (7.7%) | 9 (1.7%) |
| Total | 645 (100.0%) | 543 (100.0%) |
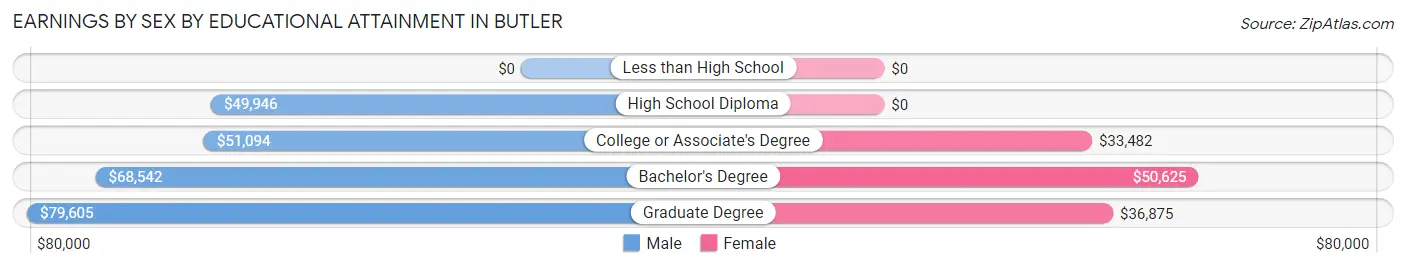
Earnings by Sex by Educational Attainment in Butler
Average earnings in Butler are $54,167 for men and $37,143 for women, a difference of 31.4%. Men with an educational attainment of graduate degree enjoy the highest average annual earnings of $79,605, while those with high school diploma education earn the least with $49,946. Women with an educational attainment of bachelor's degree earn the most with the average annual earnings of $50,625, while those with college or associate's degree education have the smallest earnings of $33,482.
| Educational Attainment | Male Income | Female Income |
| Less than High School | - | - |
| High School Diploma | $49,946 | $0 |
| College or Associate's Degree | $51,094 | $33,482 |
| Bachelor's Degree | $68,542 | $50,625 |
| Graduate Degree | $79,605 | $36,875 |
| Total | $54,167 | $37,143 |
Family Income in Butler
Family Income Brackets in Butler
According to the Butler family income data, there are 175 families falling into the $100,000 to $149,999 income range, which is the most common income bracket and makes up 43.8% of all families.
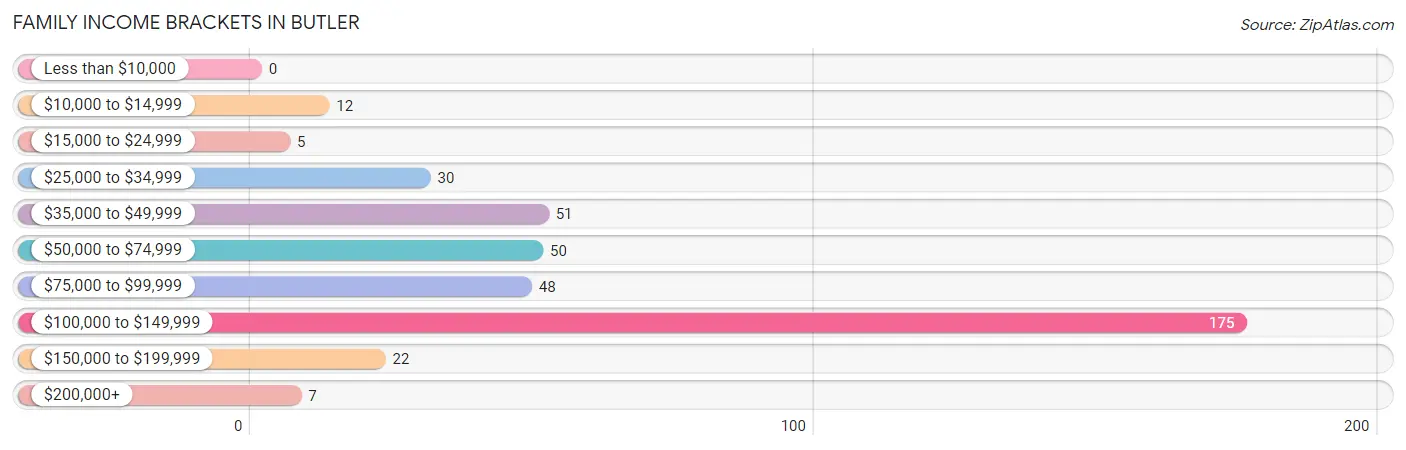
| Income Bracket | # Families | % Families |
| Less than $10,000 | 0 | 0.0% |
| $10,000 to $14,999 | 12 | 3.0% |
| $15,000 to $24,999 | 5 | 1.3% |
| $25,000 to $34,999 | 30 | 7.5% |
| $35,000 to $49,999 | 51 | 12.8% |
| $50,000 to $74,999 | 50 | 12.5% |
| $75,000 to $99,999 | 48 | 12.0% |
| $100,000 to $149,999 | 175 | 43.8% |
| $150,000 to $199,999 | 22 | 5.5% |
| $200,000+ | 7 | 1.8% |
Family Income by Famaliy Size in Butler
4-person families (95 | 23.7%) account for the highest median family income in Butler with $136,144 per family, while 2-person families (200 | 50.0%) have the highest median income of $34,688 per family member.
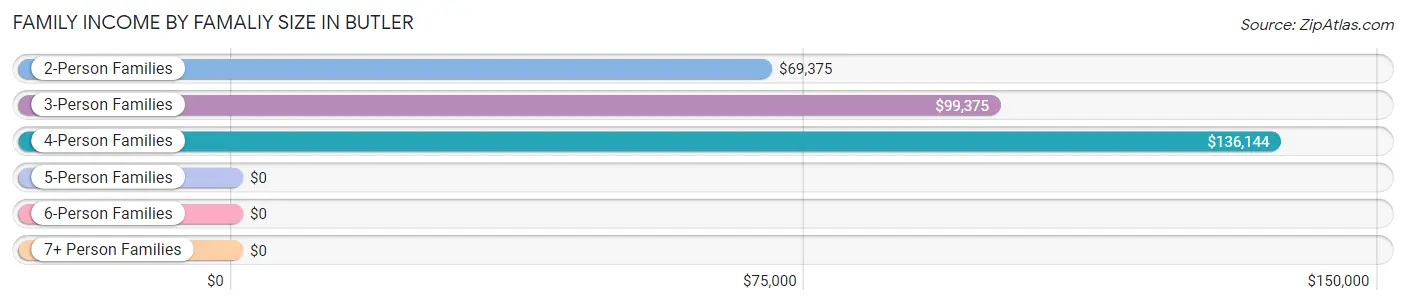
| Income Bracket | # Families | Median Income |
| 2-Person Families | 200 (50.0%) | $69,375 |
| 3-Person Families | 93 (23.3%) | $99,375 |
| 4-Person Families | 95 (23.7%) | $136,144 |
| 5-Person Families | 9 (2.2%) | $0 |
| 6-Person Families | 3 (0.7%) | $0 |
| 7+ Person Families | 0 (0.0%) | $0 |
| Total | 400 (100.0%) | $101,667 |
Family Income by Number of Earners in Butler
The median family income in Butler is $101,667, with families comprising 3+ earners (73) having the highest median family income of $135,824, while families with no earners (30) have the lowest median family income of $50,833, accounting for 18.2% and 7.5% of families, respectively.
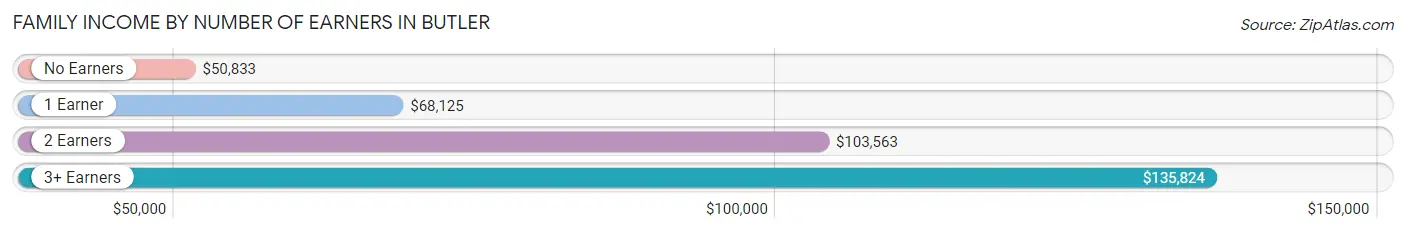
| Number of Earners | # Families | Median Income |
| No Earners | 30 (7.5%) | $50,833 |
| 1 Earner | 132 (33.0%) | $68,125 |
| 2 Earners | 165 (41.2%) | $103,563 |
| 3+ Earners | 73 (18.2%) | $135,824 |
| Total | 400 (100.0%) | $101,667 |
Household Income in Butler
Household Income Brackets in Butler
With 207 households falling in the category, the $100,000 to $149,999 income range is the most frequent in Butler, accounting for 24.0% of all households. In contrast, only 7 households (0.8%) fall into the $200,000+ income bracket, making it the least populous group.
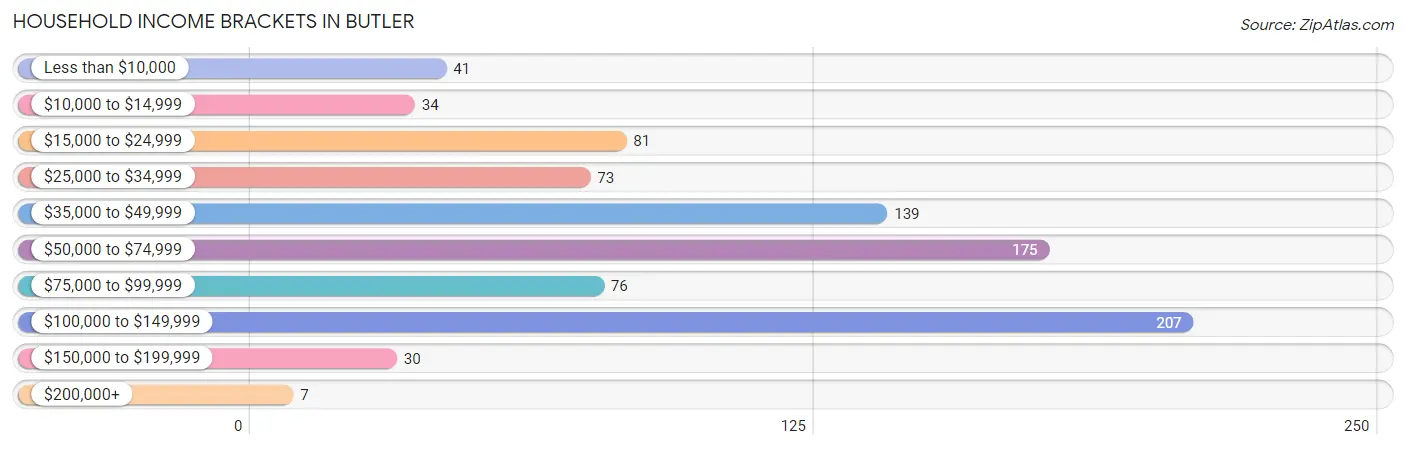
| Income Bracket | # Households | % Households |
| Less than $10,000 | 41 | 4.8% |
| $10,000 to $14,999 | 34 | 3.9% |
| $15,000 to $24,999 | 81 | 9.4% |
| $25,000 to $34,999 | 73 | 8.5% |
| $35,000 to $49,999 | 139 | 16.1% |
| $50,000 to $74,999 | 175 | 20.3% |
| $75,000 to $99,999 | 76 | 8.8% |
| $100,000 to $149,999 | 207 | 24.0% |
| $150,000 to $199,999 | 30 | 3.5% |
| $200,000+ | 7 | 0.8% |
Household Income by Householder Age in Butler
The median household income in Butler is $53,051, with the highest median household income of $83,583 found in the 25 to 44 years age bracket for the primary householder. A total of 241 households (27.9%) fall into this category. Meanwhile, the 15 to 24 years age bracket for the primary householder has the lowest median household income of $0, with 30 households (3.5%) in this group.
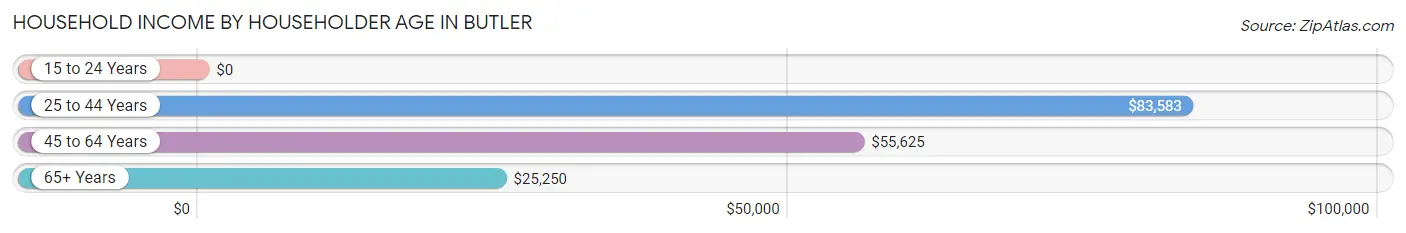
| Income Bracket | # Households | Median Income |
| 15 to 24 Years | 30 (3.5%) | $0 |
| 25 to 44 Years | 241 (27.9%) | $83,583 |
| 45 to 64 Years | 340 (39.4%) | $55,625 |
| 65+ Years | 252 (29.2%) | $25,250 |
| Total | 863 (100.0%) | $53,051 |
Poverty in Butler
Income Below Poverty by Sex and Age in Butler
With 5.4% poverty level for males and 13.1% for females among the residents of Butler, 65 to 74 year old males and 45 to 54 year old females are the most vulnerable to poverty, with 10 males (17.9%) and 55 females (27.2%) in their respective age groups living below the poverty level.
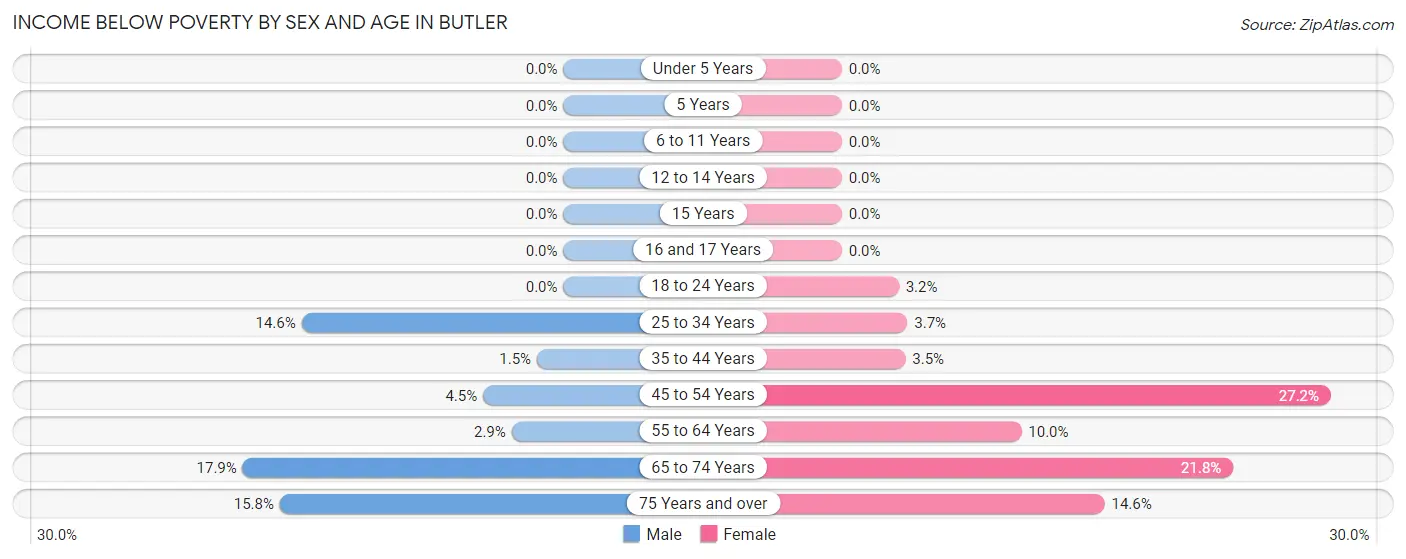
| Age Bracket | Male | Female |
| Under 5 Years | 0 (0.0%) | 0 (0.0%) |
| 5 Years | 0 (0.0%) | 0 (0.0%) |
| 6 to 11 Years | 0 (0.0%) | 0 (0.0%) |
| 12 to 14 Years | 0 (0.0%) | 0 (0.0%) |
| 15 Years | 0 (0.0%) | 0 (0.0%) |
| 16 and 17 Years | 0 (0.0%) | 0 (0.0%) |
| 18 to 24 Years | 0 (0.0%) | 2 (3.2%) |
| 25 to 34 Years | 21 (14.6%) | 5 (3.6%) |
| 35 to 44 Years | 1 (1.5%) | 4 (3.5%) |
| 45 to 54 Years | 8 (4.5%) | 55 (27.2%) |
| 55 to 64 Years | 4 (2.9%) | 11 (10.0%) |
| 65 to 74 Years | 10 (17.9%) | 34 (21.8%) |
| 75 Years and over | 6 (15.8%) | 12 (14.6%) |
| Total | 50 (5.4%) | 123 (13.1%) |
Income Above Poverty by Sex and Age in Butler
According to the poverty statistics in Butler, males aged under 5 years and females aged under 5 years are the age groups that are most secure financially, with 100.0% of males and 100.0% of females in these age groups living above the poverty line.
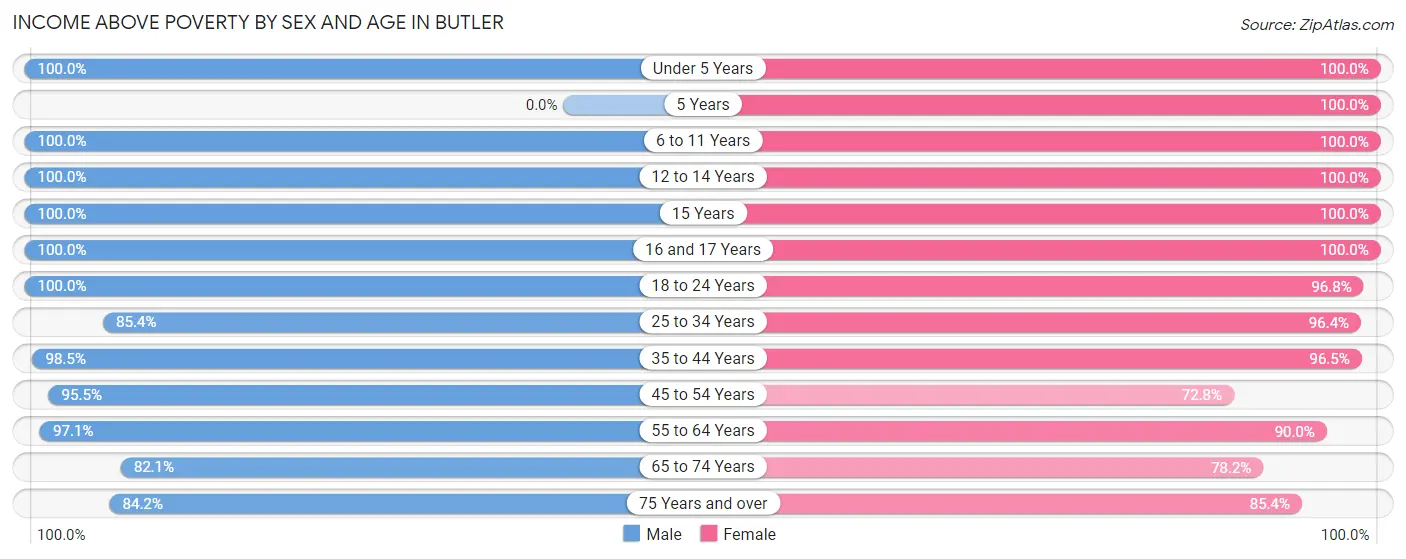
| Age Bracket | Male | Female |
| Under 5 Years | 14 (100.0%) | 48 (100.0%) |
| 5 Years | 0 (0.0%) | 3 (100.0%) |
| 6 to 11 Years | 108 (100.0%) | 7 (100.0%) |
| 12 to 14 Years | 29 (100.0%) | 13 (100.0%) |
| 15 Years | 2 (100.0%) | 3 (100.0%) |
| 16 and 17 Years | 14 (100.0%) | 4 (100.0%) |
| 18 to 24 Years | 132 (100.0%) | 61 (96.8%) |
| 25 to 34 Years | 123 (85.4%) | 132 (96.4%) |
| 35 to 44 Years | 67 (98.5%) | 109 (96.5%) |
| 45 to 54 Years | 171 (95.5%) | 147 (72.8%) |
| 55 to 64 Years | 135 (97.1%) | 99 (90.0%) |
| 65 to 74 Years | 46 (82.1%) | 122 (78.2%) |
| 75 Years and over | 32 (84.2%) | 70 (85.4%) |
| Total | 873 (94.6%) | 818 (86.9%) |
Income Below Poverty Among Married-Couple Families in Butler
The poverty statistics for married-couple families in Butler show that 5.5% or 17 of the total 311 families live below the poverty line. Families with no children have the highest poverty rate of 9.7%, comprising of 17 families. On the other hand, families with 1 or 2 children have the lowest poverty rate of 0.0%, which includes 0 families.
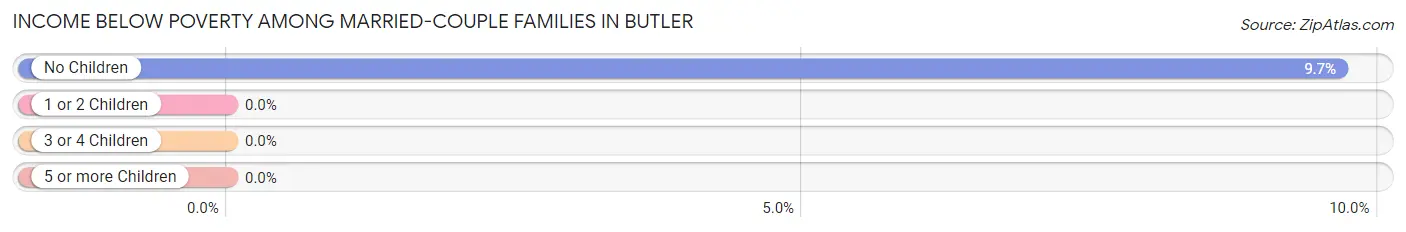
| Children | Above Poverty | Below Poverty |
| No Children | 159 (90.3%) | 17 (9.7%) |
| 1 or 2 Children | 123 (100.0%) | 0 (0.0%) |
| 3 or 4 Children | 12 (100.0%) | 0 (0.0%) |
| 5 or more Children | 0 (0.0%) | 0 (0.0%) |
| Total | 294 (94.5%) | 17 (5.5%) |
Income Below Poverty Among Single-Parent Households in Butler
| Children | Single Father | Single Mother |
| No Children | 0 (0.0%) | 0 (0.0%) |
| 1 or 2 Children | 0 (0.0%) | 0 (0.0%) |
| 3 or 4 Children | 0 (0.0%) | 0 (0.0%) |
| 5 or more Children | 0 (0.0%) | 0 (0.0%) |
| Total | 0 (0.0%) | 0 (0.0%) |
Income Below Poverty Among Married-Couple vs Single-Parent Households in Butler
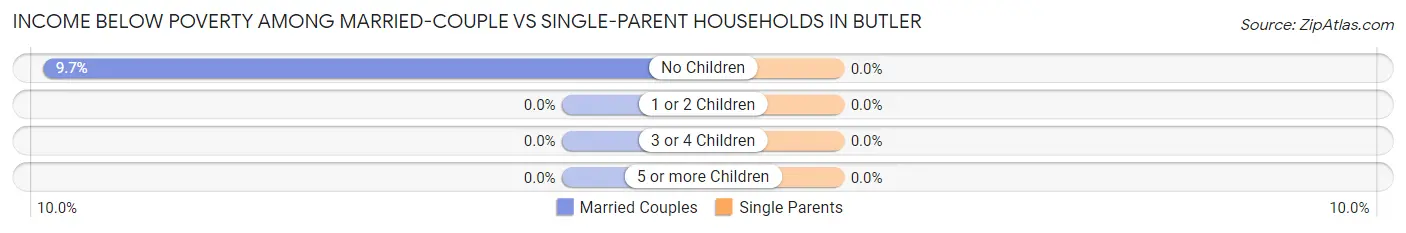
| Children | Married-Couple Families | Single-Parent Households |
| No Children | 17 (9.7%) | 0 (0.0%) |
| 1 or 2 Children | 0 (0.0%) | 0 (0.0%) |
| 3 or 4 Children | 0 (0.0%) | 0 (0.0%) |
| 5 or more Children | 0 (0.0%) | 0 (0.0%) |
| Total | 17 (5.5%) | 0 (0.0%) |
Race in Butler
The most populous races in Butler are White / Caucasian (1,625 | 85.3%), Black / African American (118 | 6.2%), and Asian (88 | 4.6%).
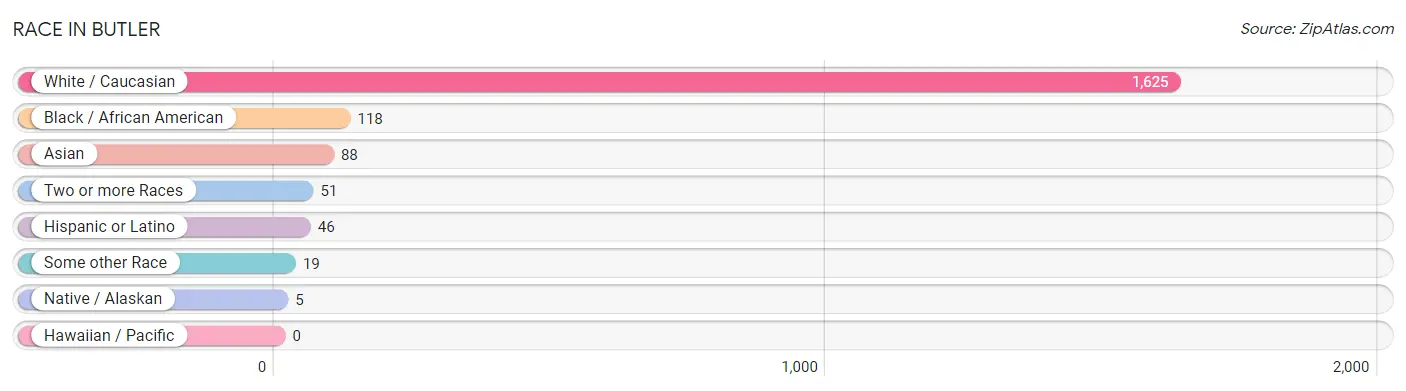
| Race | # Population | % Population |
| Asian | 88 | 4.6% |
| Black / African American | 118 | 6.2% |
| Hawaiian / Pacific | 0 | 0.0% |
| Hispanic or Latino | 46 | 2.4% |
| Native / Alaskan | 5 | 0.3% |
| White / Caucasian | 1,625 | 85.3% |
| Two or more Races | 51 | 2.7% |
| Some other Race | 19 | 1.0% |
| Total | 1,906 | 100.0% |
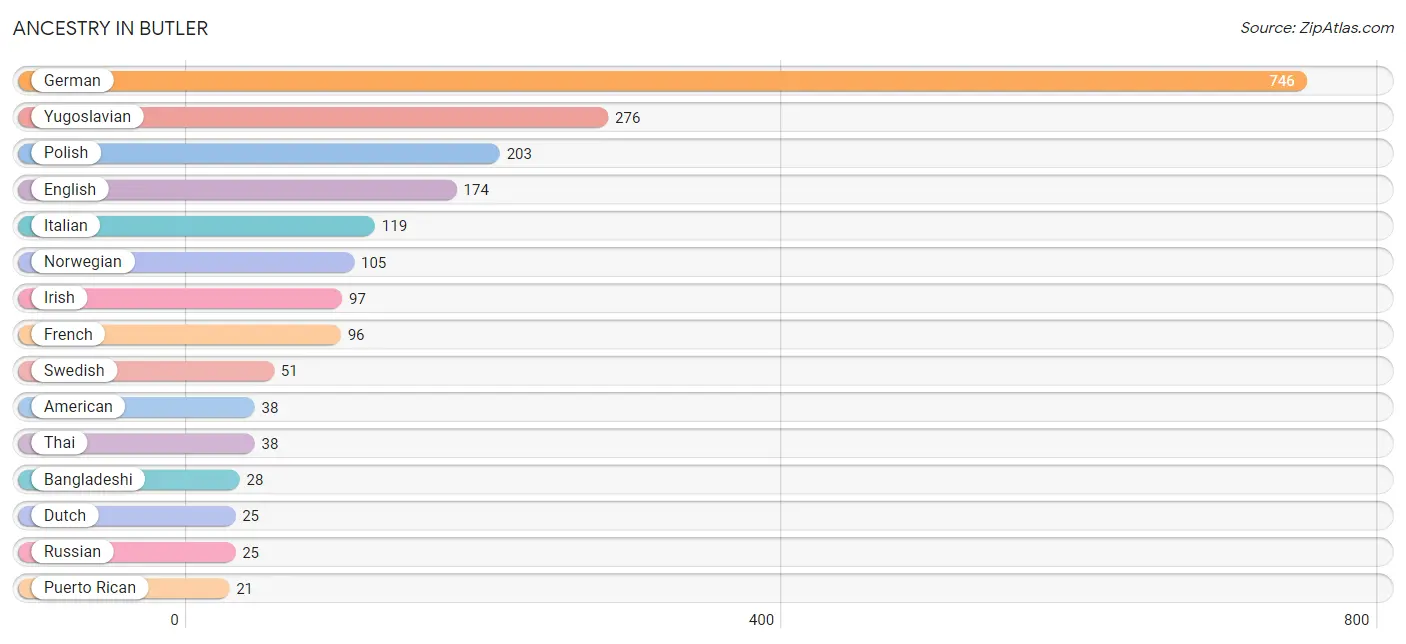
Ancestry in Butler
The most populous ancestries reported in Butler are German (746 | 39.1%), Yugoslavian (276 | 14.5%), Polish (203 | 10.6%), English (174 | 9.1%), and Italian (119 | 6.2%), together accounting for 79.6% of all Butler residents.
| Ancestry | # Population | % Population |
| African | 9 | 0.5% |
| American | 38 | 2.0% |
| Argentinean | 6 | 0.3% |
| Austrian | 10 | 0.5% |
| Bangladeshi | 28 | 1.5% |
| Belgian | 20 | 1.1% |
| Czech | 4 | 0.2% |
| Danish | 10 | 0.5% |
| Dutch | 25 | 1.3% |
| English | 174 | 9.1% |
| European | 8 | 0.4% |
| Finnish | 11 | 0.6% |
| French | 96 | 5.0% |
| German | 746 | 39.1% |
| Indian (Asian) | 18 | 0.9% |
| Irish | 97 | 5.1% |
| Iroquois | 2 | 0.1% |
| Italian | 119 | 6.2% |
| Korean | 4 | 0.2% |
| Luxembourger | 11 | 0.6% |
| Norwegian | 105 | 5.5% |
| Polish | 203 | 10.6% |
| Puerto Rican | 21 | 1.1% |
| Russian | 25 | 1.3% |
| Scotch-Irish | 13 | 0.7% |
| Serbian | 14 | 0.7% |
| Slavic | 21 | 1.1% |
| South American | 6 | 0.3% |
| Sri Lankan | 14 | 0.7% |
| Subsaharan African | 9 | 0.5% |
| Swedish | 51 | 2.7% |
| Swiss | 11 | 0.6% |
| Thai | 38 | 2.0% |
| Welsh | 8 | 0.4% |
| Yugoslavian | 276 | 14.5% | View All 35 Rows |
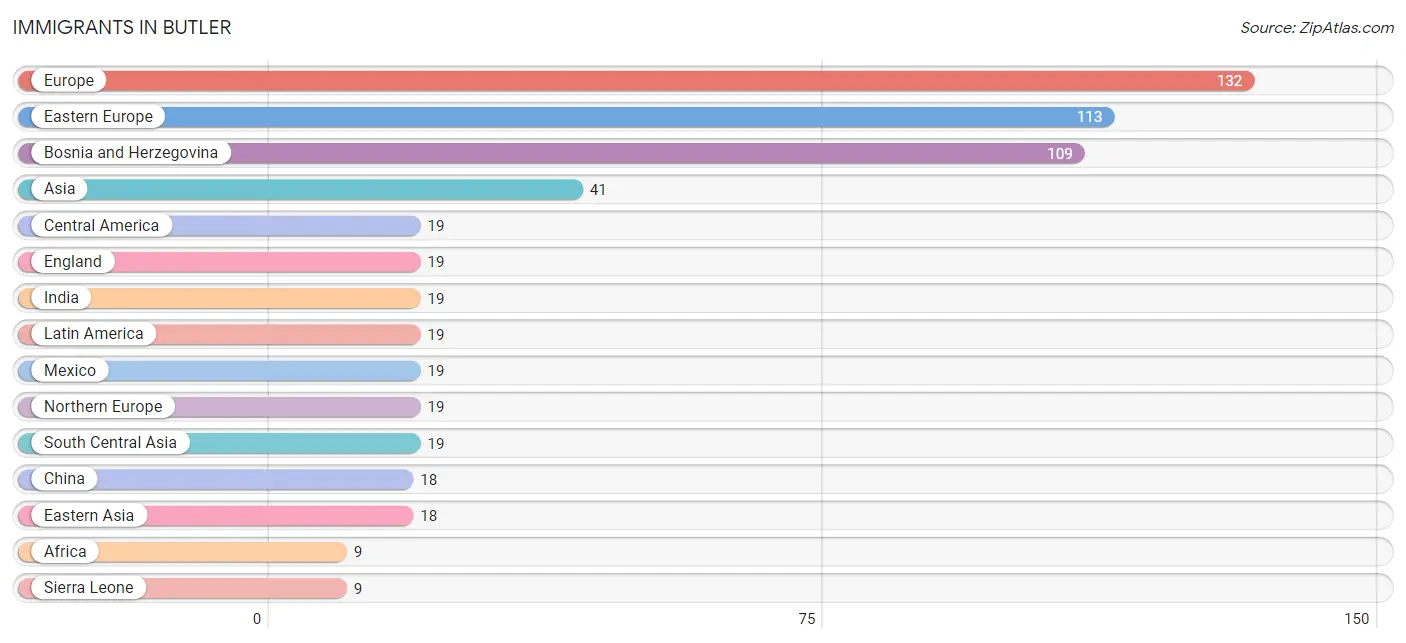
Immigrants in Butler
The most numerous immigrant groups reported in Butler came from Europe (132 | 6.9%), Eastern Europe (113 | 5.9%), Bosnia and Herzegovina (109 | 5.7%), Asia (41 | 2.1%), and Central America (19 | 1.0%), together accounting for 21.7% of all Butler residents.
| Immigration Origin | # Population | % Population |
| Africa | 9 | 0.5% |
| Asia | 41 | 2.1% |
| Bosnia and Herzegovina | 109 | 5.7% |
| Canada | 5 | 0.3% |
| Central America | 19 | 1.0% |
| China | 18 | 0.9% |
| Eastern Asia | 18 | 0.9% |
| Eastern Europe | 113 | 5.9% |
| England | 19 | 1.0% |
| Europe | 132 | 6.9% |
| India | 19 | 1.0% |
| Latin America | 19 | 1.0% |
| Mexico | 19 | 1.0% |
| Northern Europe | 19 | 1.0% |
| Philippines | 4 | 0.2% |
| Poland | 4 | 0.2% |
| Sierra Leone | 9 | 0.5% |
| South Central Asia | 19 | 1.0% |
| South Eastern Asia | 4 | 0.2% |
| Western Africa | 9 | 0.5% | View All 20 Rows |
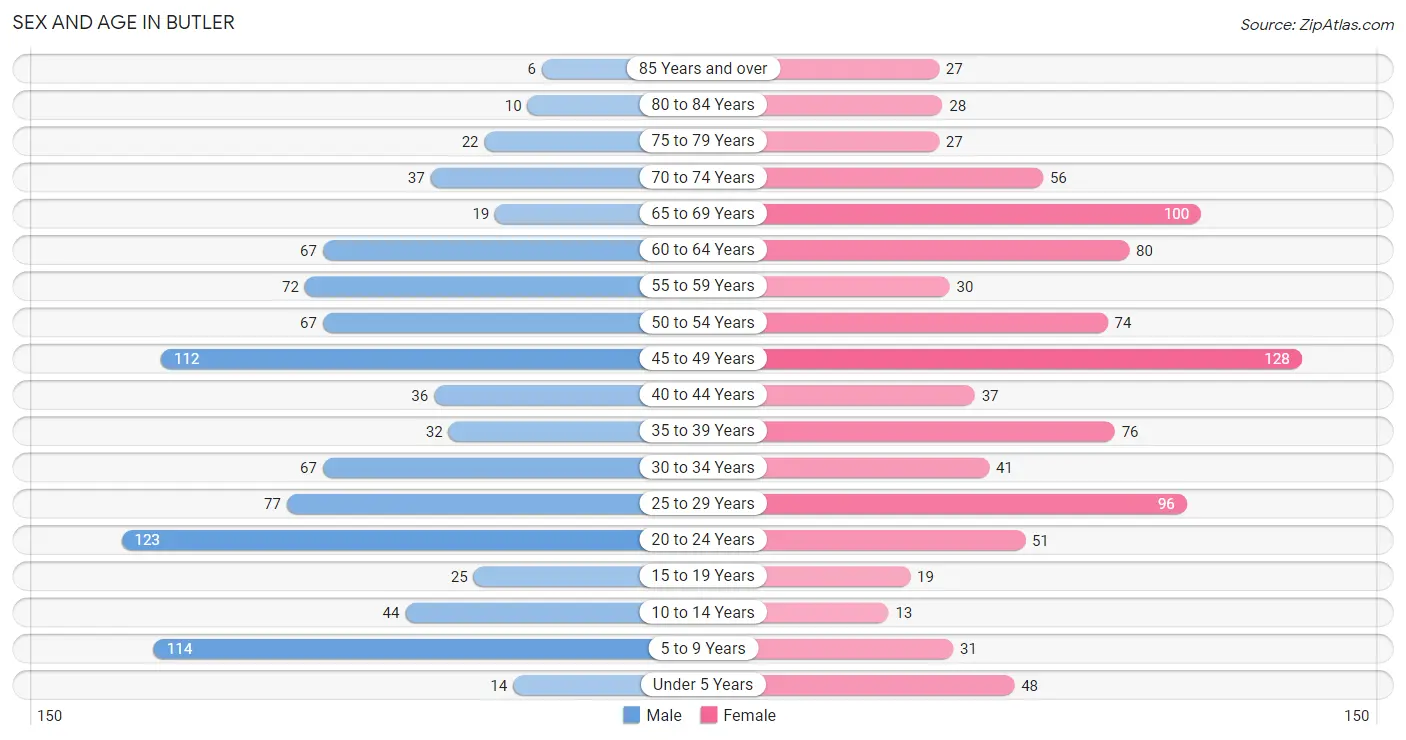
Sex and Age in Butler
Sex and Age in Butler
The most populous age groups in Butler are 20 to 24 Years (123 | 13.0%) for men and 45 to 49 Years (128 | 13.3%) for women.
| Age Bracket | Male | Female |
| Under 5 Years | 14 (1.5%) | 48 (5.0%) |
| 5 to 9 Years | 114 (12.1%) | 31 (3.2%) |
| 10 to 14 Years | 44 (4.7%) | 13 (1.3%) |
| 15 to 19 Years | 25 (2.6%) | 19 (2.0%) |
| 20 to 24 Years | 123 (13.0%) | 51 (5.3%) |
| 25 to 29 Years | 77 (8.2%) | 96 (10.0%) |
| 30 to 34 Years | 67 (7.1%) | 41 (4.3%) |
| 35 to 39 Years | 32 (3.4%) | 76 (7.9%) |
| 40 to 44 Years | 36 (3.8%) | 37 (3.8%) |
| 45 to 49 Years | 112 (11.9%) | 128 (13.3%) |
| 50 to 54 Years | 67 (7.1%) | 74 (7.7%) |
| 55 to 59 Years | 72 (7.6%) | 30 (3.1%) |
| 60 to 64 Years | 67 (7.1%) | 80 (8.3%) |
| 65 to 69 Years | 19 (2.0%) | 100 (10.4%) |
| 70 to 74 Years | 37 (3.9%) | 56 (5.8%) |
| 75 to 79 Years | 22 (2.3%) | 27 (2.8%) |
| 80 to 84 Years | 10 (1.1%) | 28 (2.9%) |
| 85 Years and over | 6 (0.6%) | 27 (2.8%) |
| Total | 944 (100.0%) | 962 (100.0%) |
Families and Households in Butler
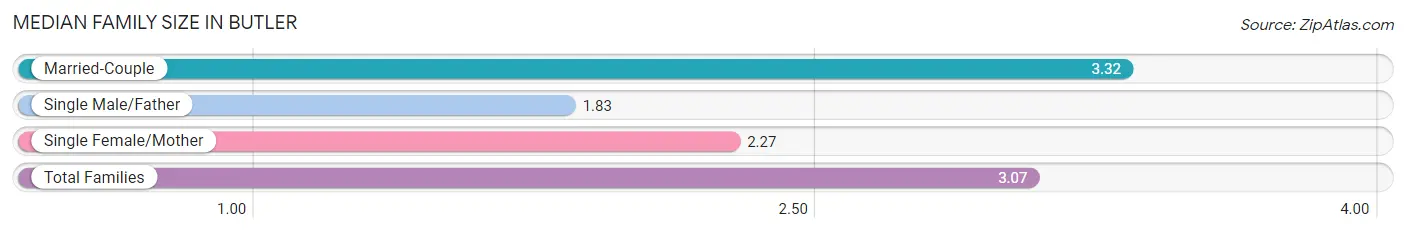
Median Family Size in Butler
The median family size in Butler is 3.07 persons per family, with married-couple families (311 | 77.7%) accounting for the largest median family size of 3.32 persons per family. On the other hand, single male/father families (12 | 3.0%) represent the smallest median family size with 1.83 persons per family.
| Family Type | # Families | Family Size |
| Married-Couple | 311 (77.7%) | 3.32 |
| Single Male/Father | 12 (3.0%) | 1.83 |
| Single Female/Mother | 77 (19.3%) | 2.27 |
| Total Families | 400 (100.0%) | 3.07 |
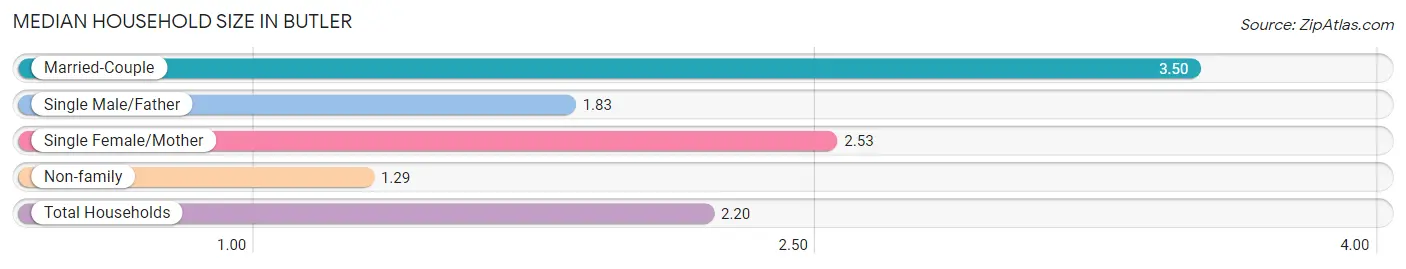
Median Household Size in Butler
The median household size in Butler is 2.20 persons per household, with married-couple households (311 | 36.0%) accounting for the largest median household size of 3.5 persons per household. non-family households (463 | 53.6%) represent the smallest median household size with 1.29 persons per household.
| Household Type | # Households | Household Size |
| Married-Couple | 311 (36.0%) | 3.50 |
| Single Male/Father | 12 (1.4%) | 1.83 |
| Single Female/Mother | 77 (8.9%) | 2.53 |
| Non-family | 463 (53.6%) | 1.29 |
| Total Households | 863 (100.0%) | 2.20 |
Household Size by Marriage Status in Butler
Out of a total of 863 households in Butler, 400 (46.4%) are family households, while 463 (53.6%) are nonfamily households. The most numerous type of family households are 2-person households, comprising 162, and the most common type of nonfamily households are 1-person households, comprising 350.
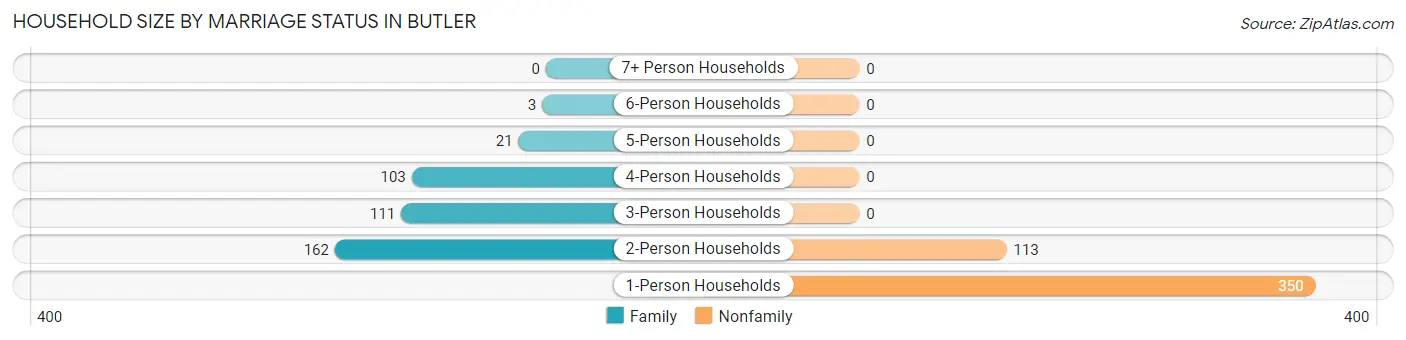
| Household Size | Family Households | Nonfamily Households |
| 1-Person Households | - | 350 (40.6%) |
| 2-Person Households | 162 (18.8%) | 113 (13.1%) |
| 3-Person Households | 111 (12.9%) | 0 (0.0%) |
| 4-Person Households | 103 (11.9%) | 0 (0.0%) |
| 5-Person Households | 21 (2.4%) | 0 (0.0%) |
| 6-Person Households | 3 (0.4%) | 0 (0.0%) |
| 7+ Person Households | 0 (0.0%) | 0 (0.0%) |
| Total | 400 (46.4%) | 463 (53.6%) |
Female Fertility in Butler
Fertility by Age in Butler
Average fertility rate in Butler is 50.0 births per 1,000 women. Women in the age bracket of 20 to 34 years have the highest fertility rate with 122.0 births per 1,000 women. Women in the age bracket of 20 to 34 years acount for 100.0% of all women with births.
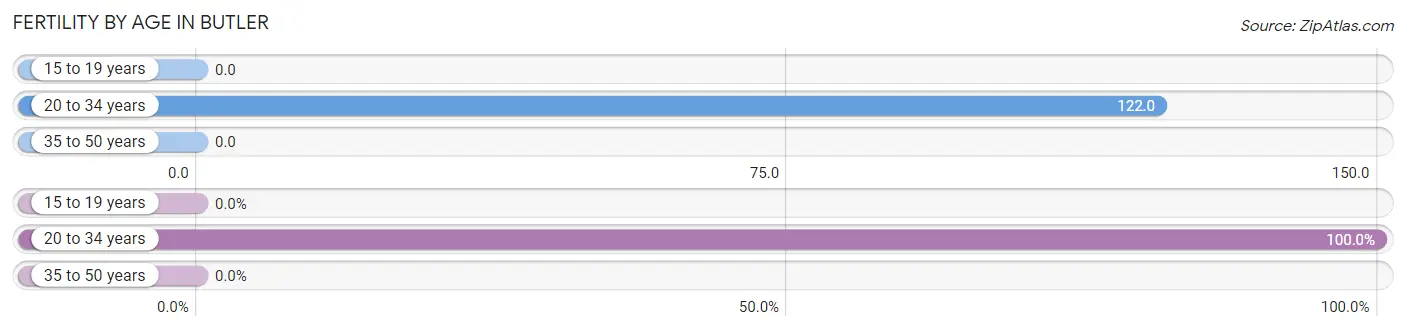
| Age Bracket | Women with Births | Births / 1,000 Women |
| 15 to 19 years | 0 (0.0%) | 0.0 |
| 20 to 34 years | 23 (100.0%) | 122.0 |
| 35 to 50 years | 0 (0.0%) | 0.0 |
| Total | 23 (100.0%) | 50.0 |
Fertility by Age by Marriage Status in Butler
21.7% of women with births (23) in Butler are married. The highest percentage of unmarried women with births falls into 20 to 34 years age bracket with 78.3% of them unmarried at the time of birth, while the lowest percentage of unmarried women with births belong to 20 to 34 years age bracket with 78.3% of them unmarried.
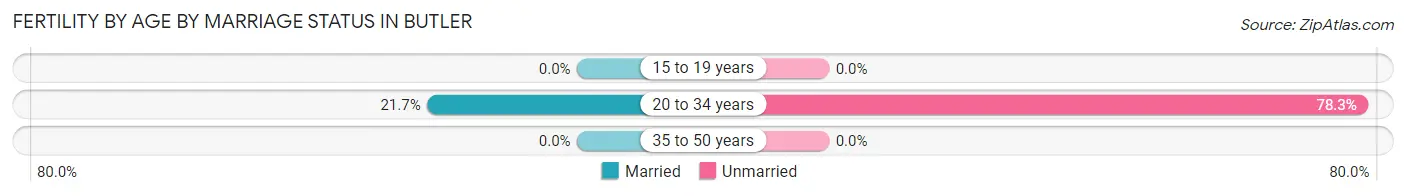
| Age Bracket | Married | Unmarried |
| 15 to 19 years | 0 (0.0%) | 0 (0.0%) |
| 20 to 34 years | 5 (21.7%) | 18 (78.3%) |
| 35 to 50 years | 0 (0.0%) | 0 (0.0%) |
| Total | 5 (21.7%) | 18 (78.3%) |
Fertility by Education in Butler
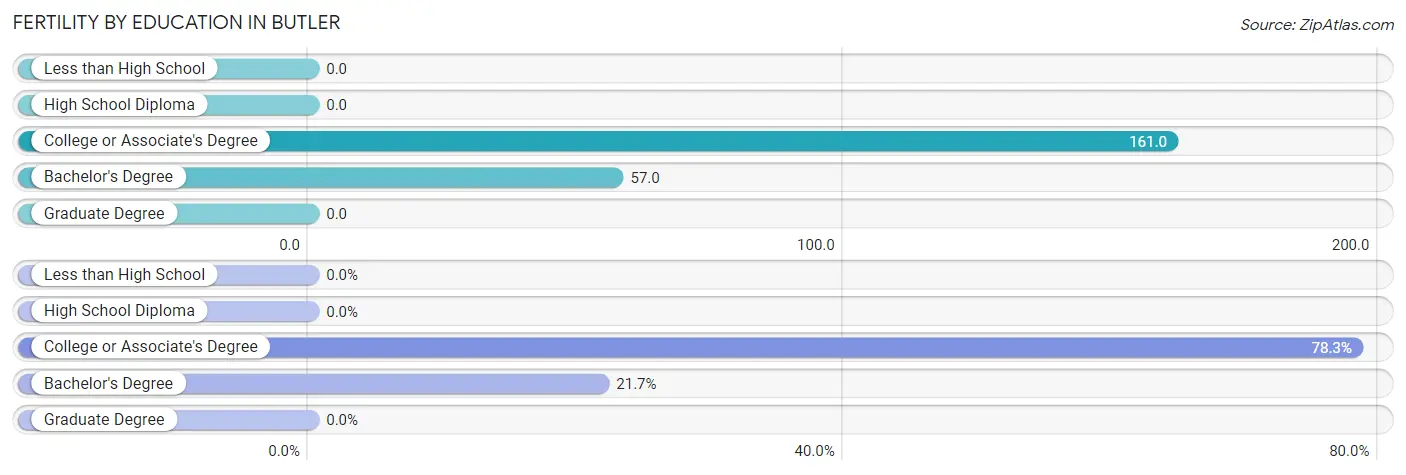
| Educational Attainment | Women with Births | Births / 1,000 Women |
| Less than High School | 0 (0.0%) | 0.0 |
| High School Diploma | 0 (0.0%) | 0.0 |
| College or Associate's Degree | 18 (78.3%) | 161.0 |
| Bachelor's Degree | 5 (21.7%) | 57.0 |
| Graduate Degree | 0 (0.0%) | 0.0 |
| Total | 23 (100.0%) | 50.0 |
Fertility by Education by Marriage Status in Butler
78.3% of women with births in Butler are unmarried. Women with the educational attainment of bachelor's degree are most likely to be married with 100.0% of them married at childbirth, while women with the educational attainment of college or associate's degree are least likely to be married with 100.0% of them unmarried at childbirth.
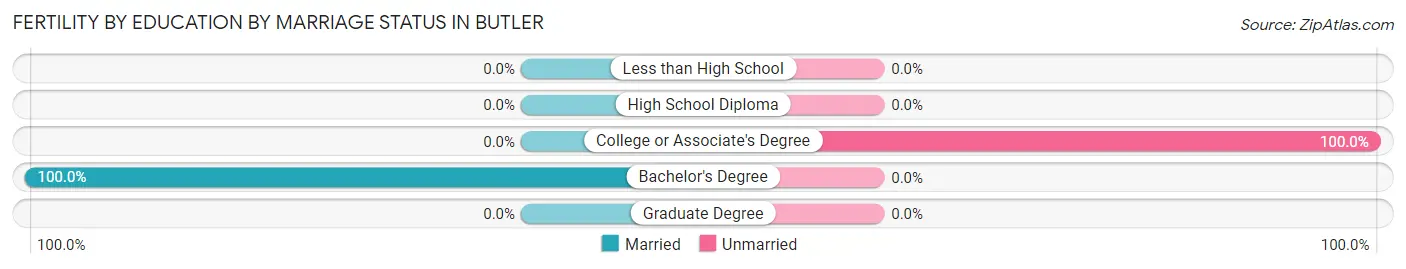
| Educational Attainment | Married | Unmarried |
| Less than High School | 0 (0.0%) | 0 (0.0%) |
| High School Diploma | 0 (0.0%) | 0 (0.0%) |
| College or Associate's Degree | 0 (0.0%) | 18 (100.0%) |
| Bachelor's Degree | 5 (100.0%) | 0 (0.0%) |
| Graduate Degree | 0 (0.0%) | 0 (0.0%) |
| Total | 5 (21.7%) | 18 (78.3%) |
Employment Characteristics in Butler
Employment by Class of Employer in Butler
Among the 1,120 employed individuals in Butler, private company employees (924 | 82.5%), not-for-profit organizations (82 | 7.3%), and self-employed (incorporated) (42 | 3.7%) make up the most common classes of employment.
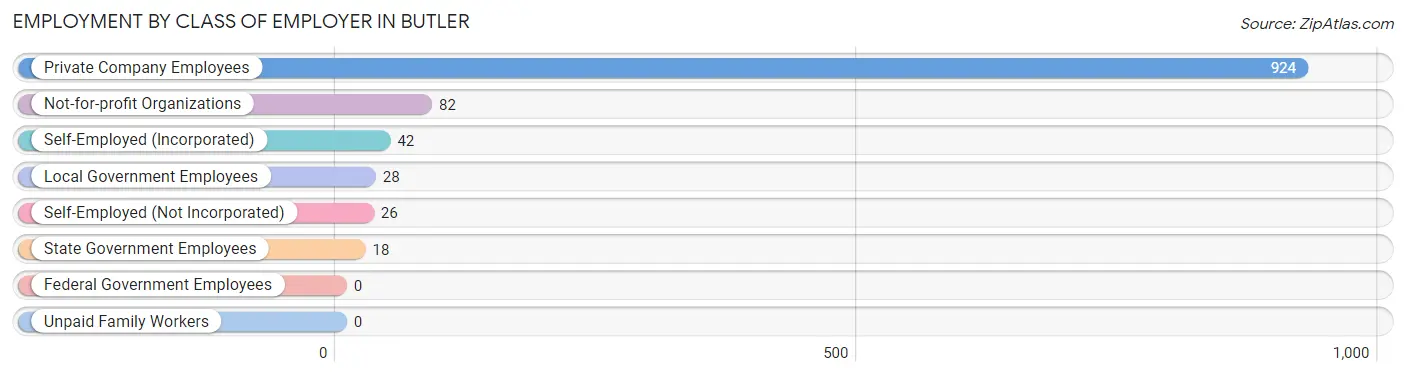
| Employer Class | # Employees | % Employees |
| Private Company Employees | 924 | 82.5% |
| Self-Employed (Incorporated) | 42 | 3.7% |
| Self-Employed (Not Incorporated) | 26 | 2.3% |
| Not-for-profit Organizations | 82 | 7.3% |
| Local Government Employees | 28 | 2.5% |
| State Government Employees | 18 | 1.6% |
| Federal Government Employees | 0 | 0.0% |
| Unpaid Family Workers | 0 | 0.0% |
| Total | 1,120 | 100.0% |
Employment Status by Age in Butler
According to the labor force statistics for Butler, out of the total population over 16 years of age (1,637), 71.0% or 1,162 individuals are in the labor force, with 3.2% or 37 of them unemployed. The age group with the highest labor force participation rate is 30 to 34 years, with 93.5% or 101 individuals in the labor force. Within the labor force, the 45 to 54 years age range has the highest percentage of unemployed individuals, with 7.5% or 23 of them being unemployed.
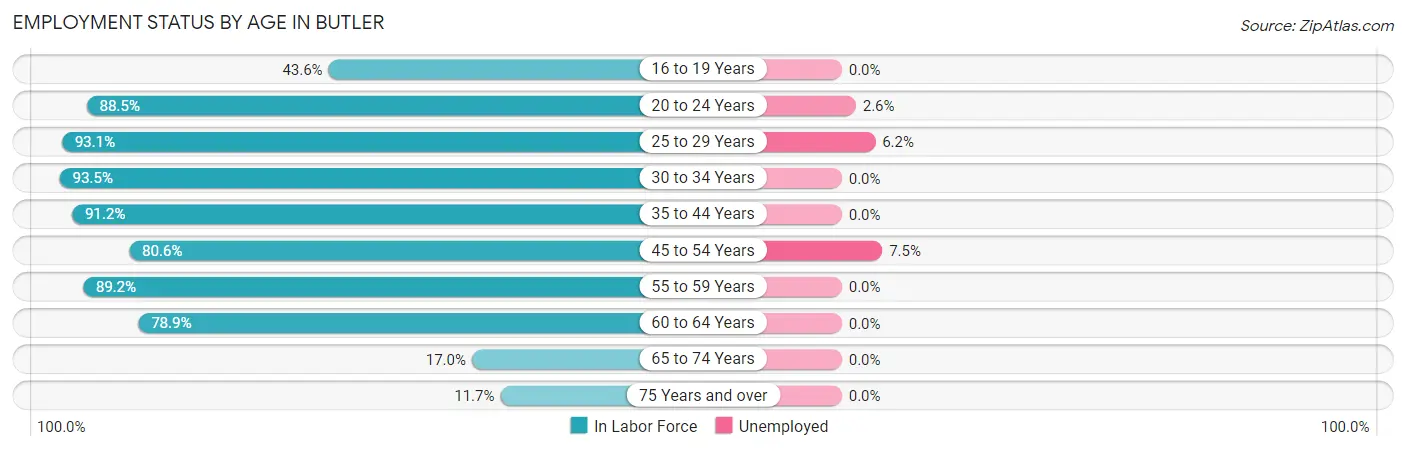
| Age Bracket | In Labor Force | Unemployed |
| 16 to 19 Years | 17 (43.6%) | 0 (0.0%) |
| 20 to 24 Years | 154 (88.5%) | 4 (2.6%) |
| 25 to 29 Years | 161 (93.1%) | 10 (6.2%) |
| 30 to 34 Years | 101 (93.5%) | 0 (0.0%) |
| 35 to 44 Years | 165 (91.2%) | 0 (0.0%) |
| 45 to 54 Years | 307 (80.6%) | 23 (7.5%) |
| 55 to 59 Years | 91 (89.2%) | 0 (0.0%) |
| 60 to 64 Years | 116 (78.9%) | 0 (0.0%) |
| 65 to 74 Years | 36 (17.0%) | 0 (0.0%) |
| 75 Years and over | 14 (11.7%) | 0 (0.0%) |
| Total | 1,162 (71.0%) | 37 (3.2%) |
Employment Status by Educational Attainment in Butler
According to labor force statistics for Butler, 86.2% of individuals (941) out of the total population between 25 and 64 years of age (1,092) are in the labor force, with 3.5% or 33 of them being unemployed. The group with the highest labor force participation rate are those with the educational attainment of bachelor's degree or higher, with 96.1% or 346 individuals in the labor force. Within the labor force, individuals with college / associate degree education have the highest percentage of unemployment, with 9.4% or 28 of them being unemployed.
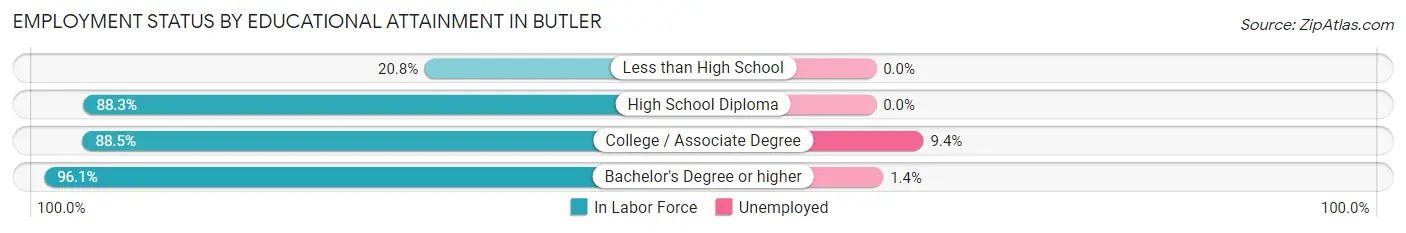
| Educational Attainment | In Labor Force | Unemployed |
| Less than High School | 16 (20.8%) | 0 (0.0%) |
| High School Diploma | 280 (88.3%) | 0 (0.0%) |
| College / Associate Degree | 299 (88.5%) | 32 (9.4%) |
| Bachelor's Degree or higher | 346 (96.1%) | 5 (1.4%) |
| Total | 941 (86.2%) | 38 (3.5%) |
Employment Occupations by Sex in Butler
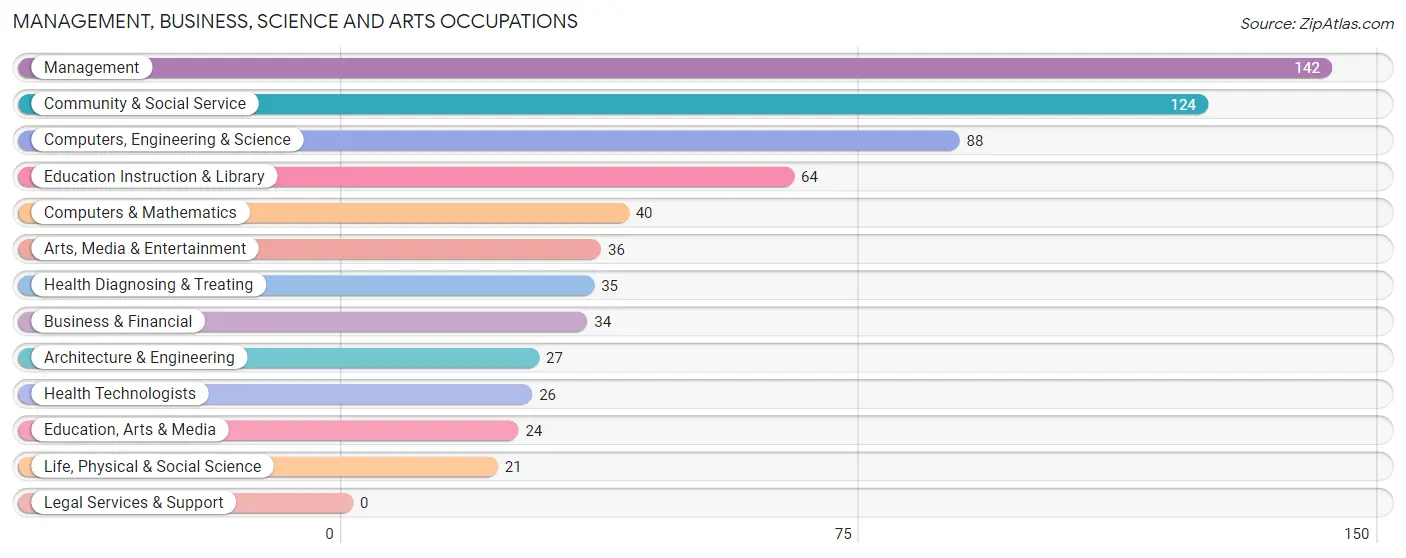
Management, Business, Science and Arts Occupations
The most common Management, Business, Science and Arts occupations in Butler are Management (142 | 12.6%), Community & Social Service (124 | 11.0%), Computers, Engineering & Science (88 | 7.8%), Education Instruction & Library (64 | 5.7%), and Computers & Mathematics (40 | 3.6%).
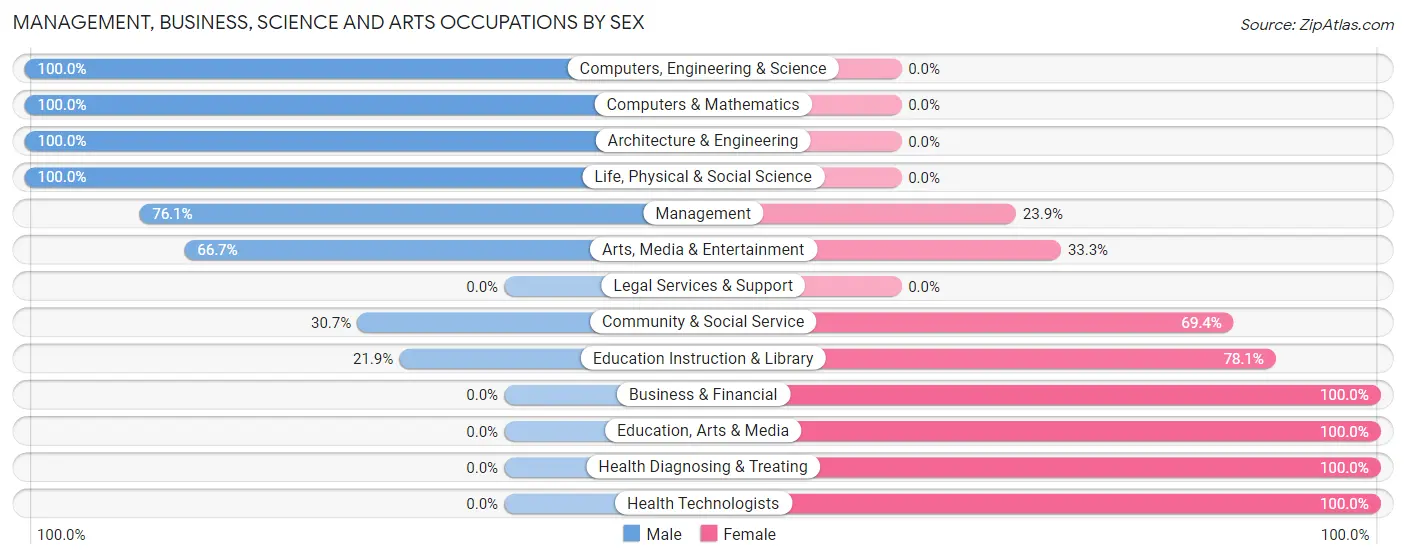
Management, Business, Science and Arts Occupations by Sex
Within the Management, Business, Science and Arts occupations in Butler, the most male-oriented occupations are Computers, Engineering & Science (100.0%), Computers & Mathematics (100.0%), and Architecture & Engineering (100.0%), while the most female-oriented occupations are Business & Financial (100.0%), Education, Arts & Media (100.0%), and Health Diagnosing & Treating (100.0%).
| Occupation | Male | Female |
| Management | 108 (76.1%) | 34 (23.9%) |
| Business & Financial | 0 (0.0%) | 34 (100.0%) |
| Computers, Engineering & Science | 88 (100.0%) | 0 (0.0%) |
| Computers & Mathematics | 40 (100.0%) | 0 (0.0%) |
| Architecture & Engineering | 27 (100.0%) | 0 (0.0%) |
| Life, Physical & Social Science | 21 (100.0%) | 0 (0.0%) |
| Community & Social Service | 38 (30.6%) | 86 (69.4%) |
| Education, Arts & Media | 0 (0.0%) | 24 (100.0%) |
| Legal Services & Support | 0 (0.0%) | 0 (0.0%) |
| Education Instruction & Library | 14 (21.9%) | 50 (78.1%) |
| Arts, Media & Entertainment | 24 (66.7%) | 12 (33.3%) |
| Health Diagnosing & Treating | 0 (0.0%) | 35 (100.0%) |
| Health Technologists | 0 (0.0%) | 26 (100.0%) |
| Total (Category) | 234 (55.3%) | 189 (44.7%) |
| Total (Overall) | 597 (53.1%) | 528 (46.9%) |
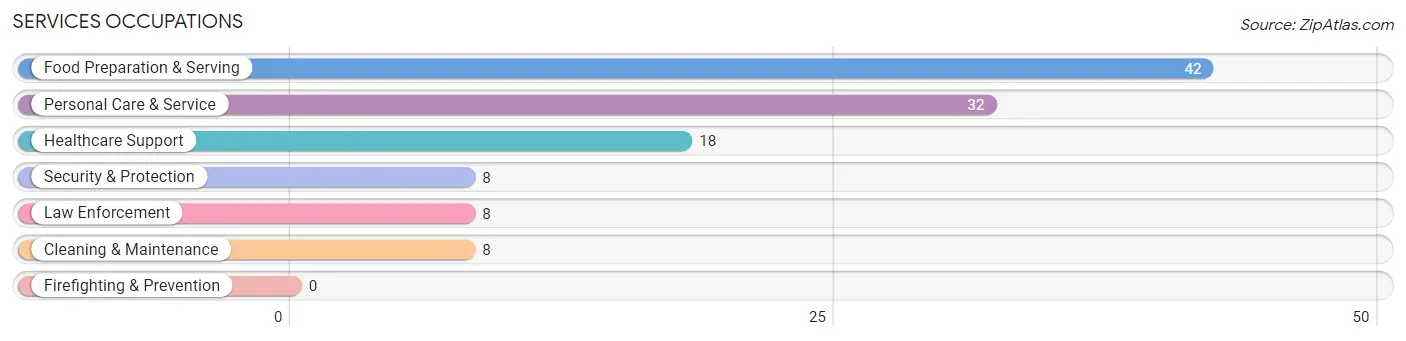
Services Occupations
The most common Services occupations in Butler are Food Preparation & Serving (42 | 3.7%), Personal Care & Service (32 | 2.8%), Healthcare Support (18 | 1.6%), Security & Protection (8 | 0.7%), and Law Enforcement (8 | 0.7%).
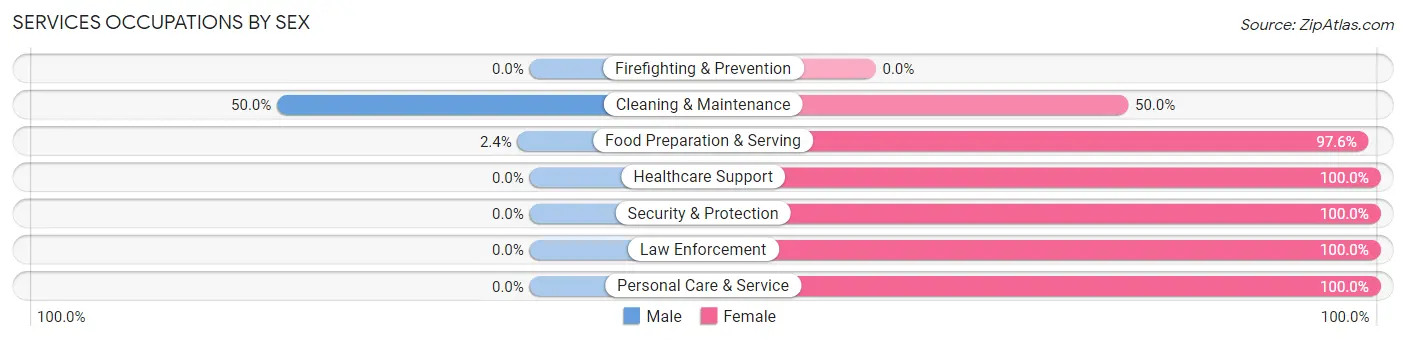
Services Occupations by Sex
Within the Services occupations in Butler, the most male-oriented occupations are Cleaning & Maintenance (50.0%), and Food Preparation & Serving (2.4%), while the most female-oriented occupations are Healthcare Support (100.0%), Security & Protection (100.0%), and Law Enforcement (100.0%).
| Occupation | Male | Female |
| Healthcare Support | 0 (0.0%) | 18 (100.0%) |
| Security & Protection | 0 (0.0%) | 8 (100.0%) |
| Firefighting & Prevention | 0 (0.0%) | 0 (0.0%) |
| Law Enforcement | 0 (0.0%) | 8 (100.0%) |
| Food Preparation & Serving | 1 (2.4%) | 41 (97.6%) |
| Cleaning & Maintenance | 4 (50.0%) | 4 (50.0%) |
| Personal Care & Service | 0 (0.0%) | 32 (100.0%) |
| Total (Category) | 5 (4.6%) | 103 (95.4%) |
| Total (Overall) | 597 (53.1%) | 528 (46.9%) |
Sales and Office Occupations
The most common Sales and Office occupations in Butler are Office & Administration (148 | 13.2%), and Sales & Related (103 | 9.2%).
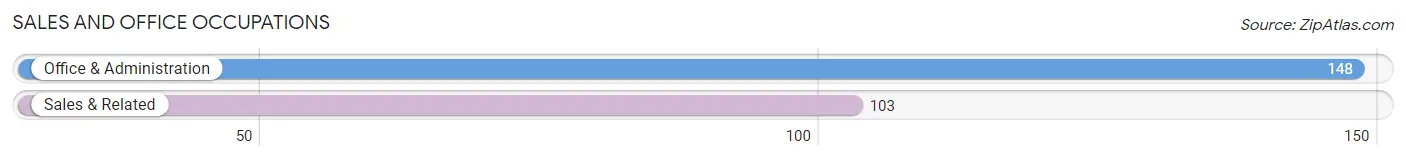
Sales and Office Occupations by Sex
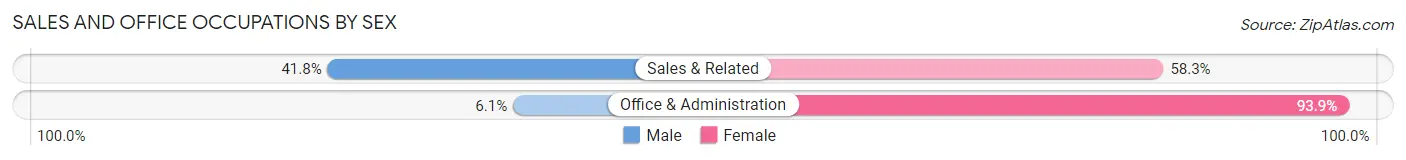
| Occupation | Male | Female |
| Sales & Related | 43 (41.7%) | 60 (58.3%) |
| Office & Administration | 9 (6.1%) | 139 (93.9%) |
| Total (Category) | 52 (20.7%) | 199 (79.3%) |
| Total (Overall) | 597 (53.1%) | 528 (46.9%) |
Natural Resources, Construction and Maintenance Occupations
The most common Natural Resources, Construction and Maintenance occupations in Butler are , and Construction & Extraction (152 | 13.5%).
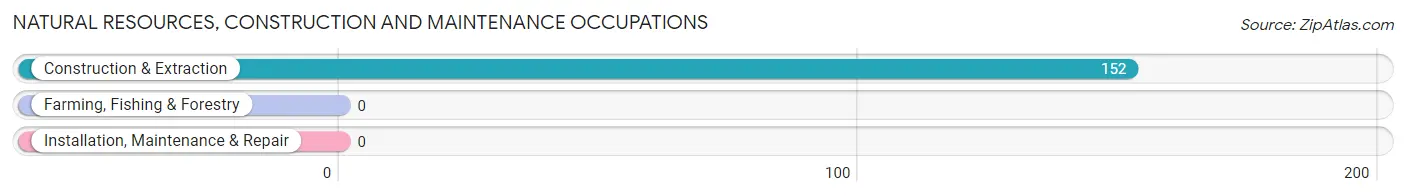
Natural Resources, Construction and Maintenance Occupations by Sex
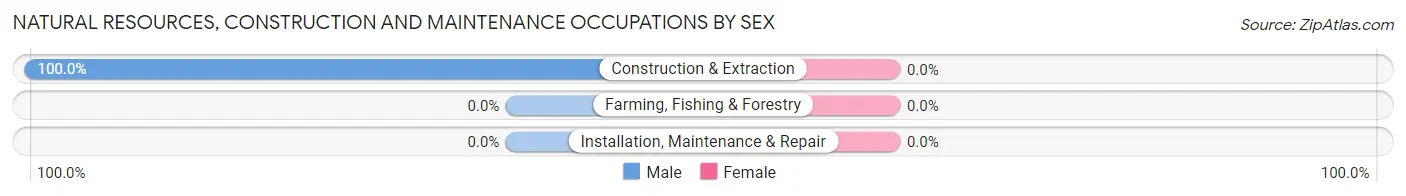
| Occupation | Male | Female |
| Farming, Fishing & Forestry | 0 (0.0%) | 0 (0.0%) |
| Construction & Extraction | 152 (100.0%) | 0 (0.0%) |
| Installation, Maintenance & Repair | 0 (0.0%) | 0 (0.0%) |
| Total (Category) | 152 (100.0%) | 0 (0.0%) |
| Total (Overall) | 597 (53.1%) | 528 (46.9%) |
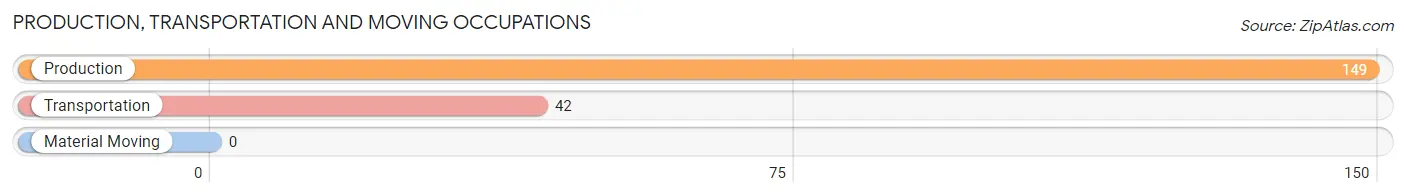
Production, Transportation and Moving Occupations
The most common Production, Transportation and Moving occupations in Butler are Production (149 | 13.2%), and Transportation (42 | 3.7%).
Production, Transportation and Moving Occupations by Sex
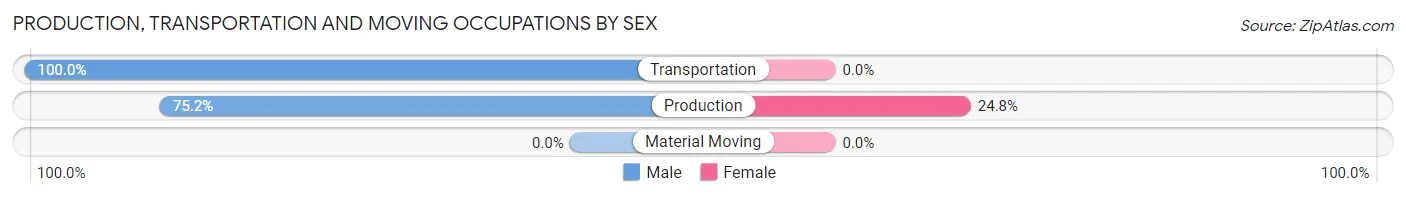
| Occupation | Male | Female |
| Production | 112 (75.2%) | 37 (24.8%) |
| Transportation | 42 (100.0%) | 0 (0.0%) |
| Material Moving | 0 (0.0%) | 0 (0.0%) |
| Total (Category) | 154 (80.6%) | 37 (19.4%) |
| Total (Overall) | 597 (53.1%) | 528 (46.9%) |
Employment Industries by Sex in Butler
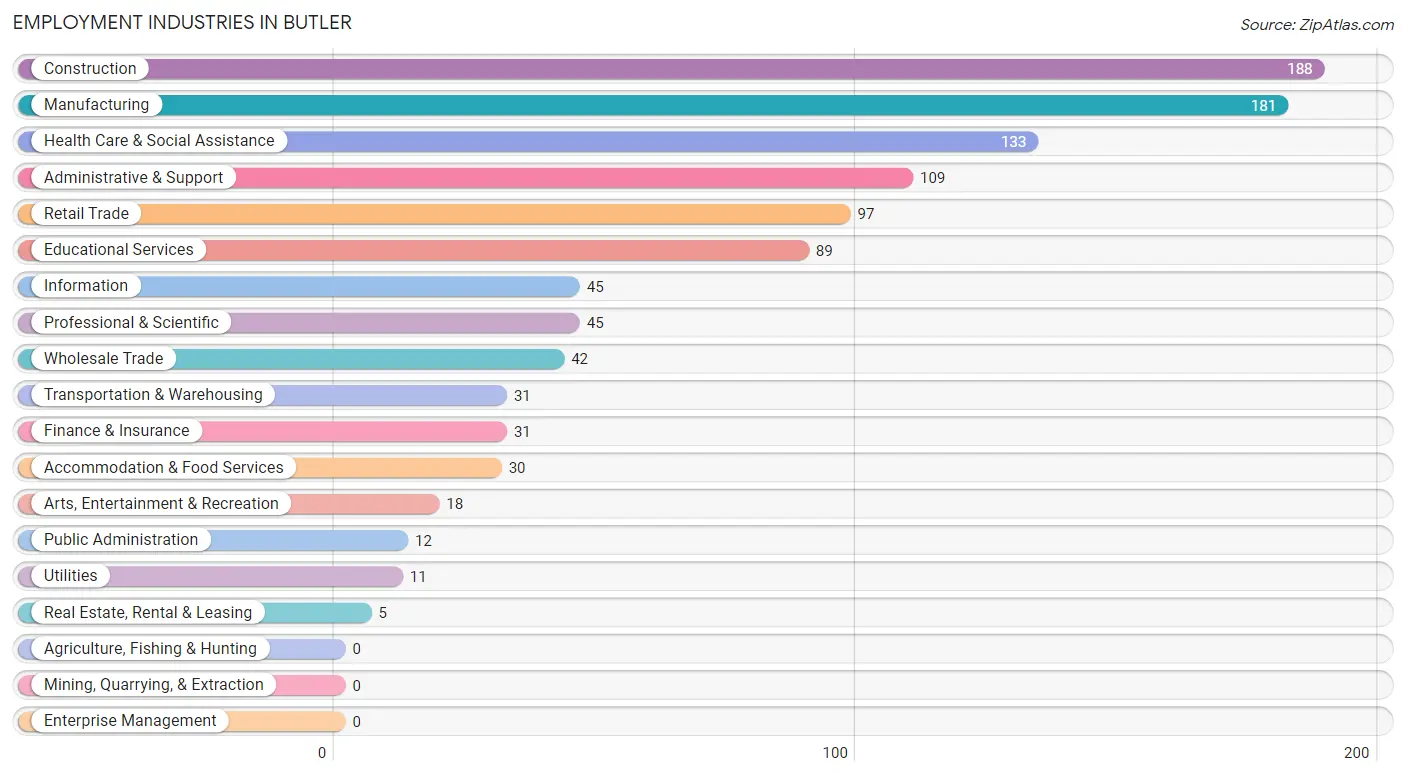
Employment Industries in Butler
The major employment industries in Butler include Construction (188 | 16.7%), Manufacturing (181 | 16.1%), Health Care & Social Assistance (133 | 11.8%), Administrative & Support (109 | 9.7%), and Retail Trade (97 | 8.6%).
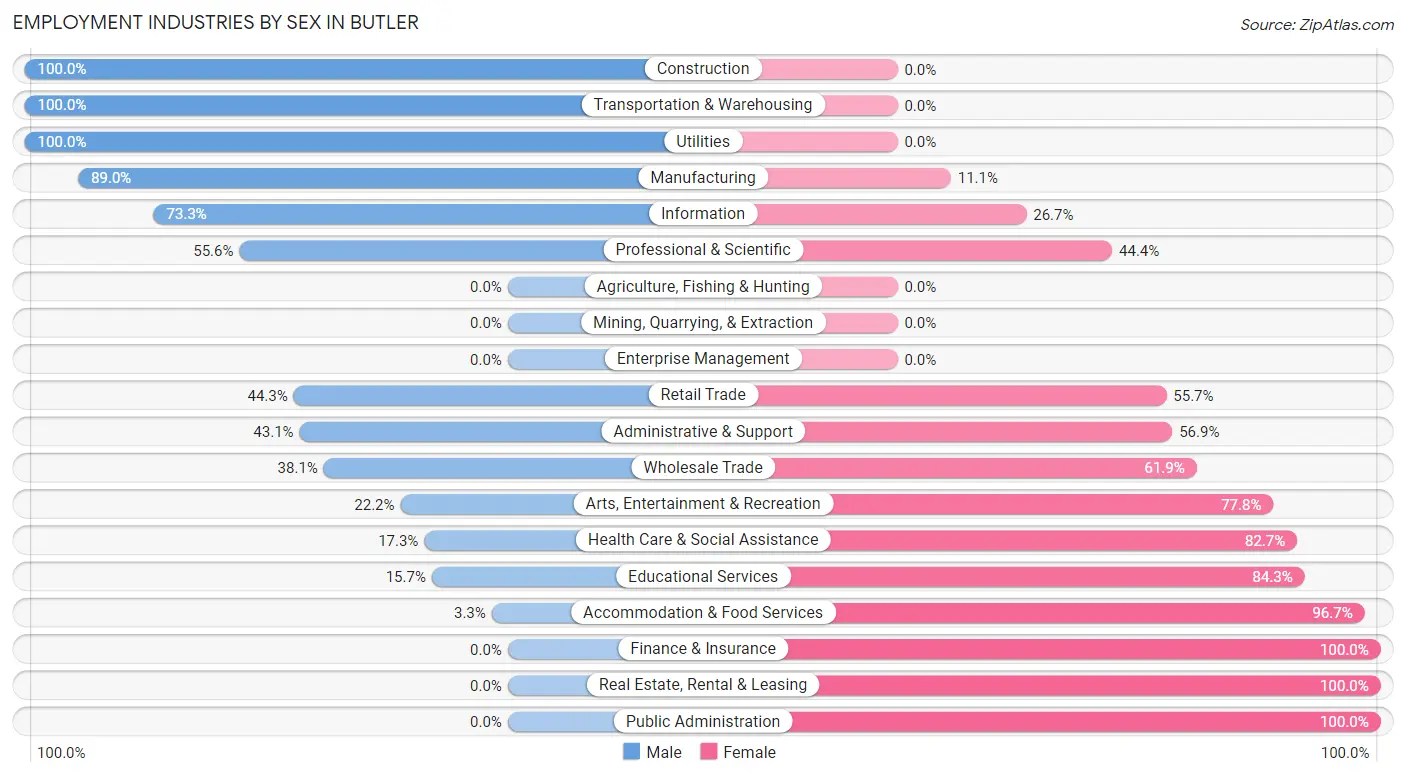
Employment Industries by Sex in Butler
The Butler industries that see more men than women are Construction (100.0%), Transportation & Warehousing (100.0%), and Utilities (100.0%), whereas the industries that tend to have a higher number of women are Finance & Insurance (100.0%), Real Estate, Rental & Leasing (100.0%), and Public Administration (100.0%).
| Industry | Male | Female |
| Agriculture, Fishing & Hunting | 0 (0.0%) | 0 (0.0%) |
| Mining, Quarrying, & Extraction | 0 (0.0%) | 0 (0.0%) |
| Construction | 188 (100.0%) | 0 (0.0%) |
| Manufacturing | 161 (88.9%) | 20 (11.1%) |
| Wholesale Trade | 16 (38.1%) | 26 (61.9%) |
| Retail Trade | 43 (44.3%) | 54 (55.7%) |
| Transportation & Warehousing | 31 (100.0%) | 0 (0.0%) |
| Utilities | 11 (100.0%) | 0 (0.0%) |
| Information | 33 (73.3%) | 12 (26.7%) |
| Finance & Insurance | 0 (0.0%) | 31 (100.0%) |
| Real Estate, Rental & Leasing | 0 (0.0%) | 5 (100.0%) |
| Professional & Scientific | 25 (55.6%) | 20 (44.4%) |
| Enterprise Management | 0 (0.0%) | 0 (0.0%) |
| Administrative & Support | 47 (43.1%) | 62 (56.9%) |
| Educational Services | 14 (15.7%) | 75 (84.3%) |
| Health Care & Social Assistance | 23 (17.3%) | 110 (82.7%) |
| Arts, Entertainment & Recreation | 4 (22.2%) | 14 (77.8%) |
| Accommodation & Food Services | 1 (3.3%) | 29 (96.7%) |
| Public Administration | 0 (0.0%) | 12 (100.0%) |
| Total | 597 (53.1%) | 528 (46.9%) |
Education in Butler
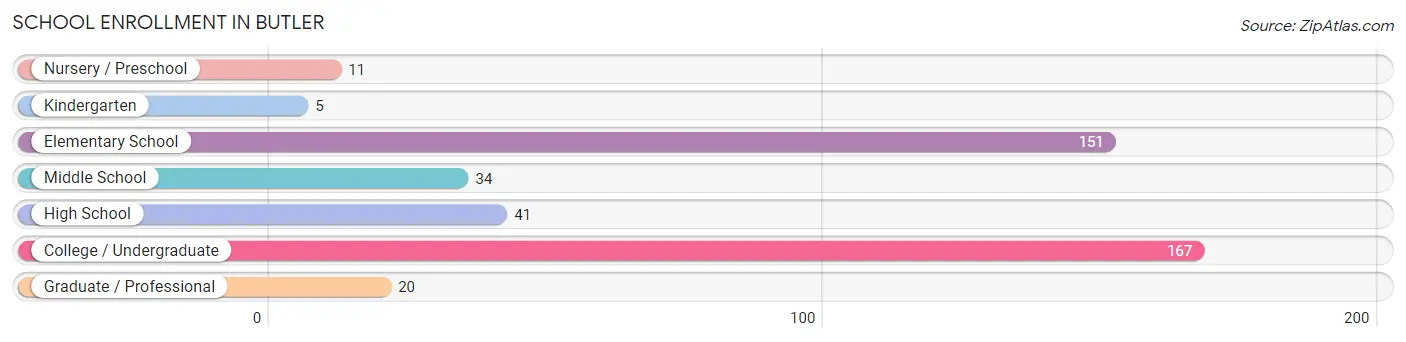
School Enrollment in Butler
The most common levels of schooling among the 429 students in Butler are college / undergraduate (167 | 38.9%), elementary school (151 | 35.2%), and high school (41 | 9.6%).
| School Level | # Students | % Students |
| Nursery / Preschool | 11 | 2.6% |
| Kindergarten | 5 | 1.2% |
| Elementary School | 151 | 35.2% |
| Middle School | 34 | 7.9% |
| High School | 41 | 9.6% |
| College / Undergraduate | 167 | 38.9% |
| Graduate / Professional | 20 | 4.7% |
| Total | 429 | 100.0% |
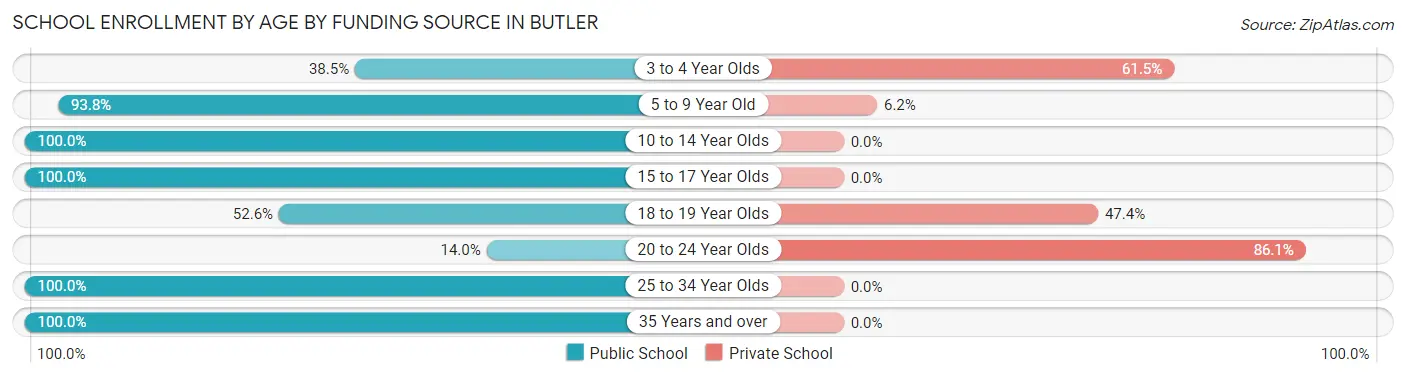
School Enrollment by Age by Funding Source in Butler
Out of a total of 429 students who are enrolled in schools in Butler, 137 (31.9%) attend a private institution, while the remaining 292 (68.1%) are enrolled in public schools. The age group of 20 to 24 year olds has the highest likelihood of being enrolled in private schools, with 111 (86.1% in the age bracket) enrolled. Conversely, the age group of 10 to 14 year olds has the lowest likelihood of being enrolled in a private school, with 57 (100.0% in the age bracket) attending a public institution.
| Age Bracket | Public School | Private School |
| 3 to 4 Year Olds | 5 (38.5%) | 8 (61.5%) |
| 5 to 9 Year Old | 136 (93.8%) | 9 (6.2%) |
| 10 to 14 Year Olds | 57 (100.0%) | 0 (0.0%) |
| 15 to 17 Year Olds | 23 (100.0%) | 0 (0.0%) |
| 18 to 19 Year Olds | 10 (52.6%) | 9 (47.4%) |
| 20 to 24 Year Olds | 18 (14.0%) | 111 (86.1%) |
| 25 to 34 Year Olds | 18 (100.0%) | 0 (0.0%) |
| 35 Years and over | 25 (100.0%) | 0 (0.0%) |
| Total | 292 (68.1%) | 137 (31.9%) |
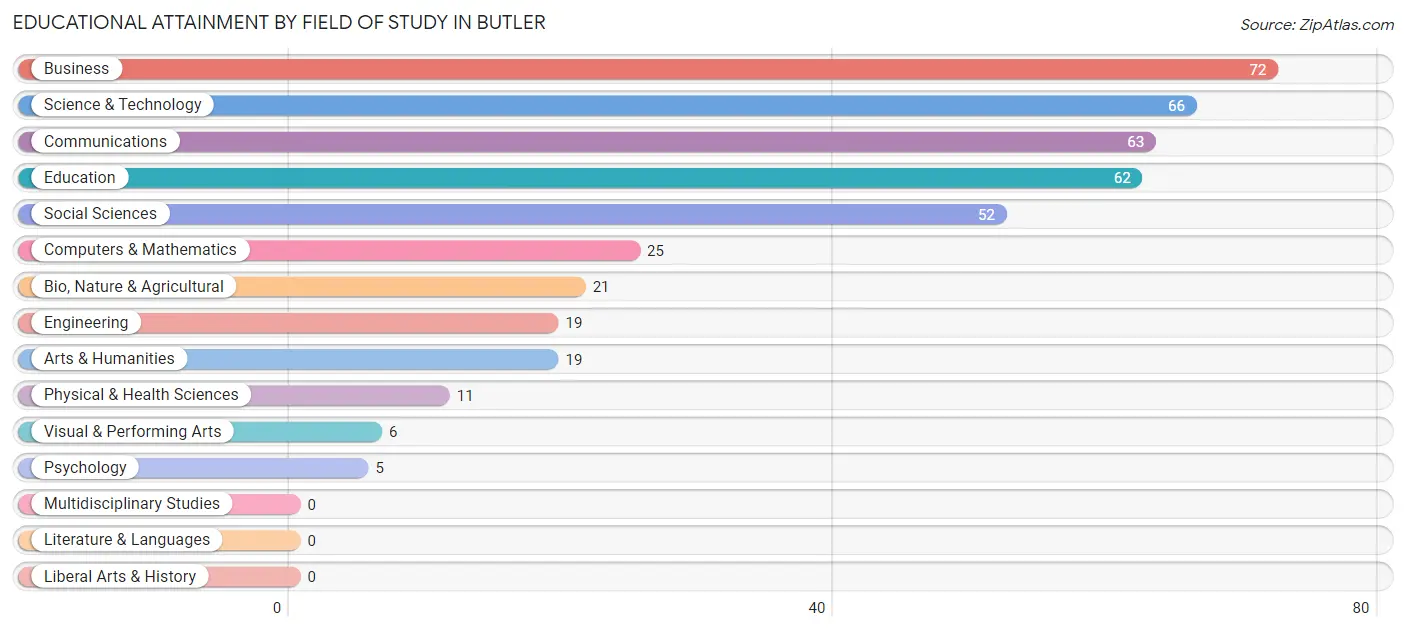
Educational Attainment by Field of Study in Butler
Business (72 | 17.1%), science & technology (66 | 15.7%), communications (63 | 15.0%), education (62 | 14.7%), and social sciences (52 | 12.3%) are the most common fields of study among 421 individuals in Butler who have obtained a bachelor's degree or higher.
| Field of Study | # Graduates | % Graduates |
| Computers & Mathematics | 25 | 5.9% |
| Bio, Nature & Agricultural | 21 | 5.0% |
| Physical & Health Sciences | 11 | 2.6% |
| Psychology | 5 | 1.2% |
| Social Sciences | 52 | 12.3% |
| Engineering | 19 | 4.5% |
| Multidisciplinary Studies | 0 | 0.0% |
| Science & Technology | 66 | 15.7% |
| Business | 72 | 17.1% |
| Education | 62 | 14.7% |
| Literature & Languages | 0 | 0.0% |
| Liberal Arts & History | 0 | 0.0% |
| Visual & Performing Arts | 6 | 1.4% |
| Communications | 63 | 15.0% |
| Arts & Humanities | 19 | 4.5% |
| Total | 421 | 100.0% |
Transportation & Commute in Butler
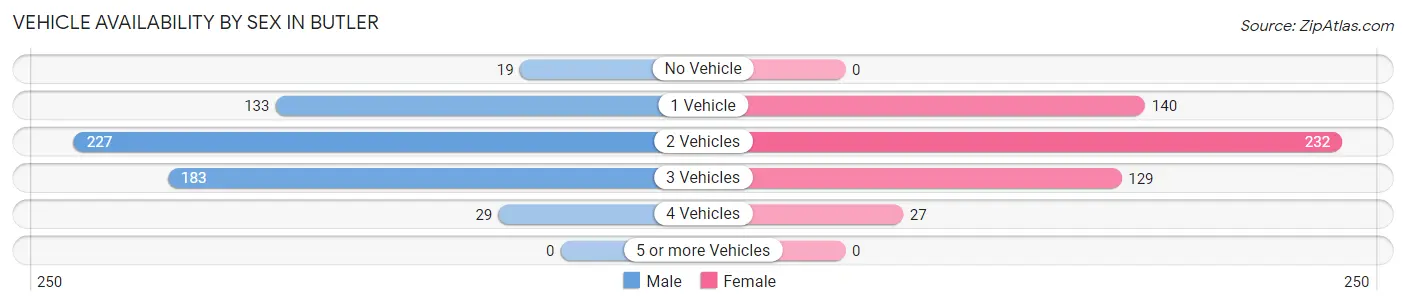
Vehicle Availability by Sex in Butler
The most prevalent vehicle ownership categories in Butler are males with 2 vehicles (227, accounting for 38.4%) and females with 2 vehicles (232, making up 43.0%).
| Vehicles Available | Male | Female |
| No Vehicle | 19 (3.2%) | 0 (0.0%) |
| 1 Vehicle | 133 (22.5%) | 140 (26.5%) |
| 2 Vehicles | 227 (38.4%) | 232 (43.9%) |
| 3 Vehicles | 183 (31.0%) | 129 (24.4%) |
| 4 Vehicles | 29 (4.9%) | 27 (5.1%) |
| 5 or more Vehicles | 0 (0.0%) | 0 (0.0%) |
| Total | 591 (100.0%) | 528 (100.0%) |
Commute Time in Butler
The most frequently occuring commute durations in Butler are 20 to 24 minutes (333 commuters, 31.4%), 10 to 14 minutes (159 commuters, 15.0%), and 15 to 19 minutes (153 commuters, 14.4%).
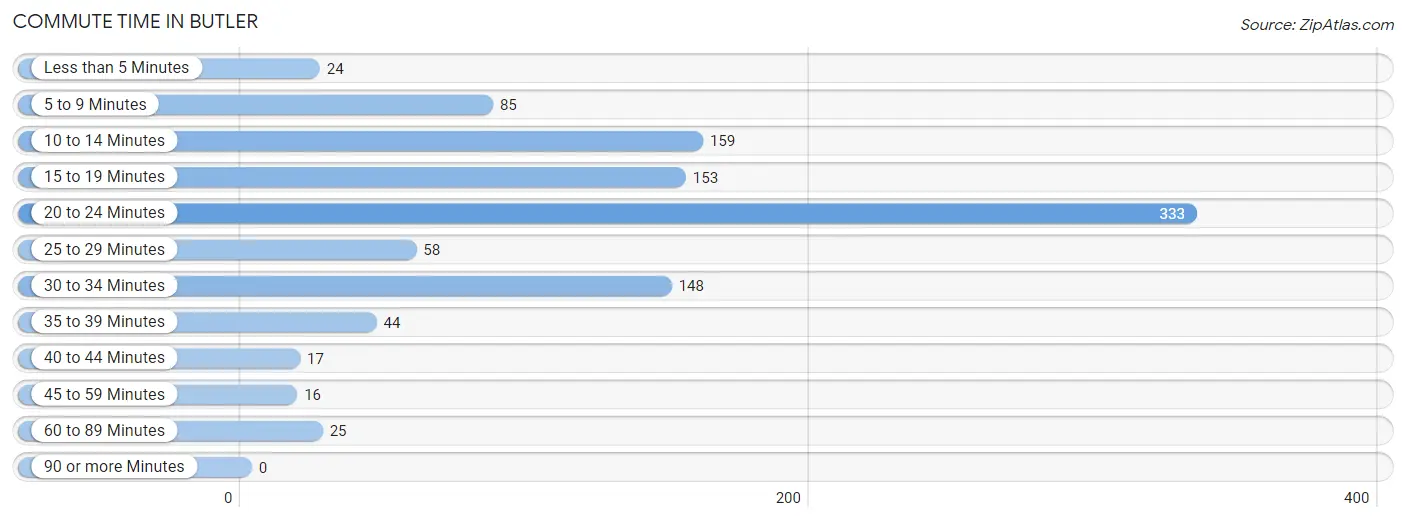
| Commute Time | # Commuters | % Commuters |
| Less than 5 Minutes | 24 | 2.3% |
| 5 to 9 Minutes | 85 | 8.0% |
| 10 to 14 Minutes | 159 | 15.0% |
| 15 to 19 Minutes | 153 | 14.4% |
| 20 to 24 Minutes | 333 | 31.4% |
| 25 to 29 Minutes | 58 | 5.5% |
| 30 to 34 Minutes | 148 | 13.9% |
| 35 to 39 Minutes | 44 | 4.1% |
| 40 to 44 Minutes | 17 | 1.6% |
| 45 to 59 Minutes | 16 | 1.5% |
| 60 to 89 Minutes | 25 | 2.4% |
| 90 or more Minutes | 0 | 0.0% |
Commute Time by Sex in Butler
The most common commute times in Butler are 20 to 24 minutes (210 commuters, 36.1%) for males and 20 to 24 minutes (123 commuters, 25.6%) for females.
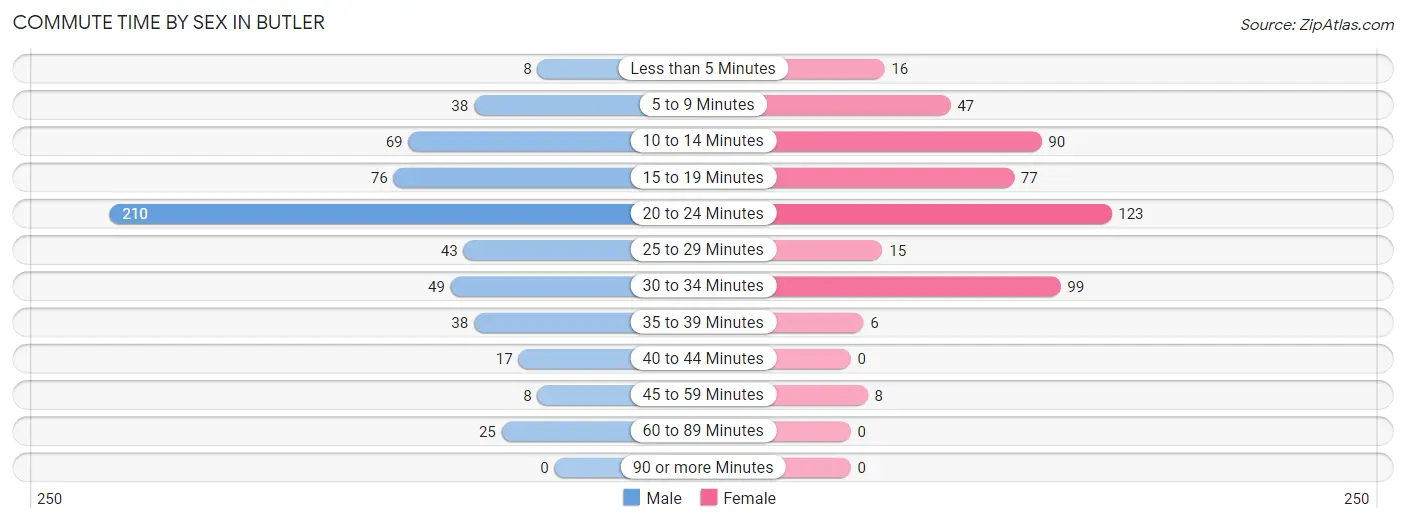
| Commute Time | Male | Female |
| Less than 5 Minutes | 8 (1.4%) | 16 (3.3%) |
| 5 to 9 Minutes | 38 (6.5%) | 47 (9.8%) |
| 10 to 14 Minutes | 69 (11.9%) | 90 (18.7%) |
| 15 to 19 Minutes | 76 (13.1%) | 77 (16.0%) |
| 20 to 24 Minutes | 210 (36.1%) | 123 (25.6%) |
| 25 to 29 Minutes | 43 (7.4%) | 15 (3.1%) |
| 30 to 34 Minutes | 49 (8.4%) | 99 (20.6%) |
| 35 to 39 Minutes | 38 (6.5%) | 6 (1.3%) |
| 40 to 44 Minutes | 17 (2.9%) | 0 (0.0%) |
| 45 to 59 Minutes | 8 (1.4%) | 8 (1.7%) |
| 60 to 89 Minutes | 25 (4.3%) | 0 (0.0%) |
| 90 or more Minutes | 0 (0.0%) | 0 (0.0%) |
Time of Departure to Work by Sex in Butler
The most frequent times of departure to work in Butler are 9:00 AM to 9:59 AM (127, 21.9%) for males and 6:30 AM to 6:59 AM (105, 21.8%) for females.
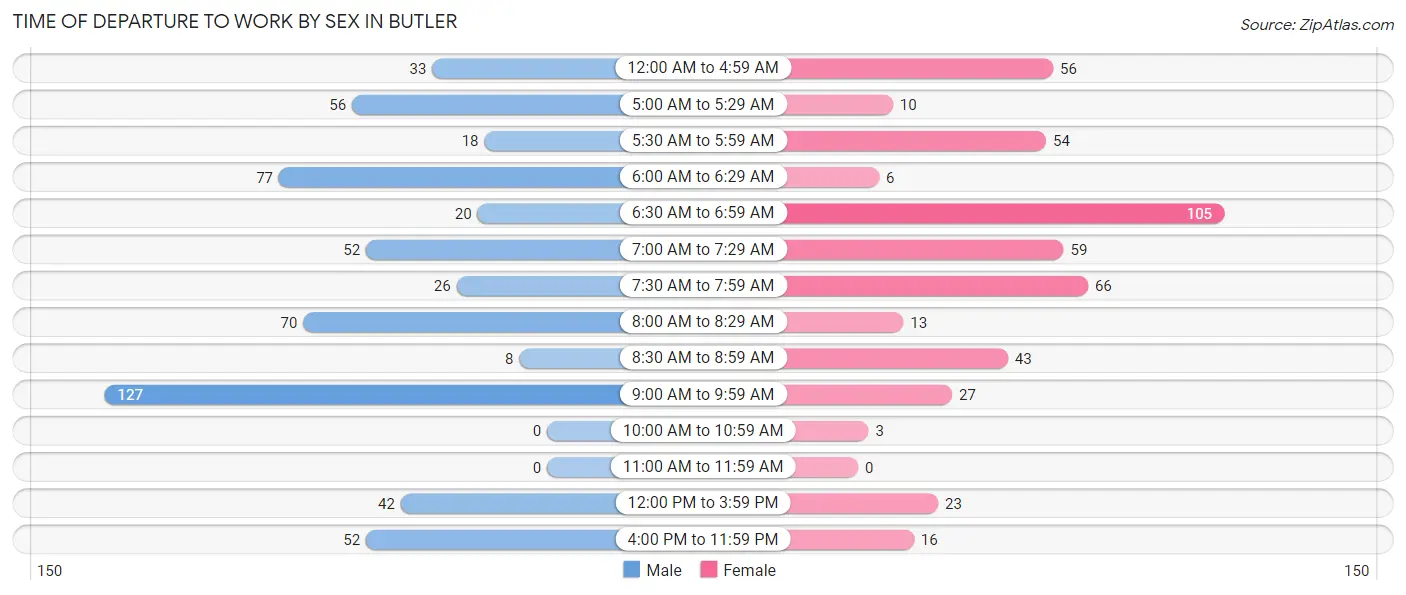
| Time of Departure | Male | Female |
| 12:00 AM to 4:59 AM | 33 (5.7%) | 56 (11.6%) |
| 5:00 AM to 5:29 AM | 56 (9.6%) | 10 (2.1%) |
| 5:30 AM to 5:59 AM | 18 (3.1%) | 54 (11.2%) |
| 6:00 AM to 6:29 AM | 77 (13.3%) | 6 (1.3%) |
| 6:30 AM to 6:59 AM | 20 (3.4%) | 105 (21.8%) |
| 7:00 AM to 7:29 AM | 52 (8.9%) | 59 (12.3%) |
| 7:30 AM to 7:59 AM | 26 (4.5%) | 66 (13.7%) |
| 8:00 AM to 8:29 AM | 70 (12.0%) | 13 (2.7%) |
| 8:30 AM to 8:59 AM | 8 (1.4%) | 43 (8.9%) |
| 9:00 AM to 9:59 AM | 127 (21.9%) | 27 (5.6%) |
| 10:00 AM to 10:59 AM | 0 (0.0%) | 3 (0.6%) |
| 11:00 AM to 11:59 AM | 0 (0.0%) | 0 (0.0%) |
| 12:00 PM to 3:59 PM | 42 (7.2%) | 23 (4.8%) |
| 4:00 PM to 11:59 PM | 52 (8.9%) | 16 (3.3%) |
| Total | 581 (100.0%) | 481 (100.0%) |
Housing Occupancy in Butler
Occupancy by Ownership in Butler
Of the total 863 dwellings in Butler, owner-occupied units account for 354 (41.0%), while renter-occupied units make up 509 (59.0%).
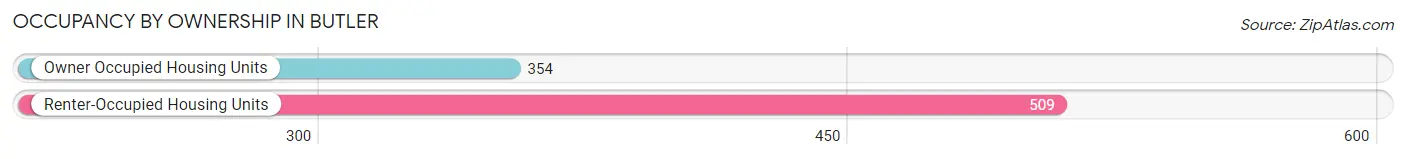
| Occupancy | # Housing Units | % Housing Units |
| Owner Occupied Housing Units | 354 | 41.0% |
| Renter-Occupied Housing Units | 509 | 59.0% |
| Total Occupied Housing Units | 863 | 100.0% |
Occupancy by Household Size in Butler
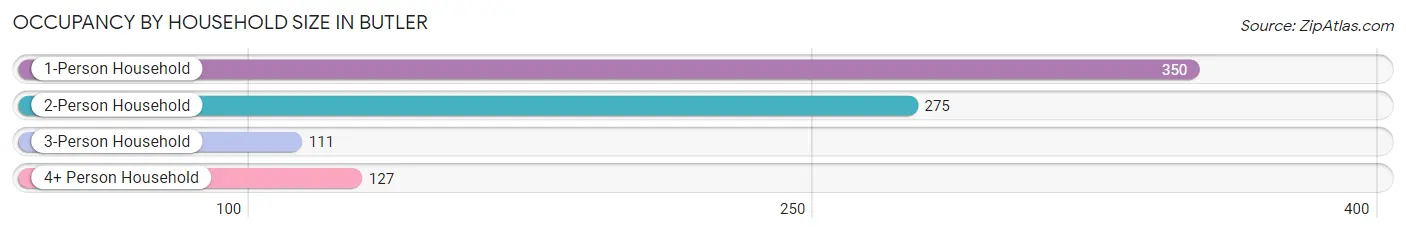
| Household Size | # Housing Units | % Housing Units |
| 1-Person Household | 350 | 40.6% |
| 2-Person Household | 275 | 31.9% |
| 3-Person Household | 111 | 12.9% |
| 4+ Person Household | 127 | 14.7% |
| Total Housing Units | 863 | 100.0% |
Occupancy by Ownership by Household Size in Butler
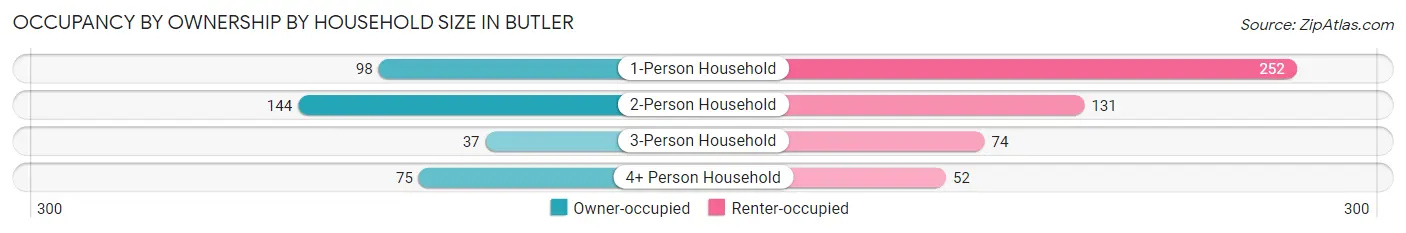
| Household Size | Owner-occupied | Renter-occupied |
| 1-Person Household | 98 (28.0%) | 252 (72.0%) |
| 2-Person Household | 144 (52.4%) | 131 (47.6%) |
| 3-Person Household | 37 (33.3%) | 74 (66.7%) |
| 4+ Person Household | 75 (59.1%) | 52 (40.9%) |
| Total Housing Units | 354 (41.0%) | 509 (59.0%) |
Occupancy by Educational Attainment in Butler
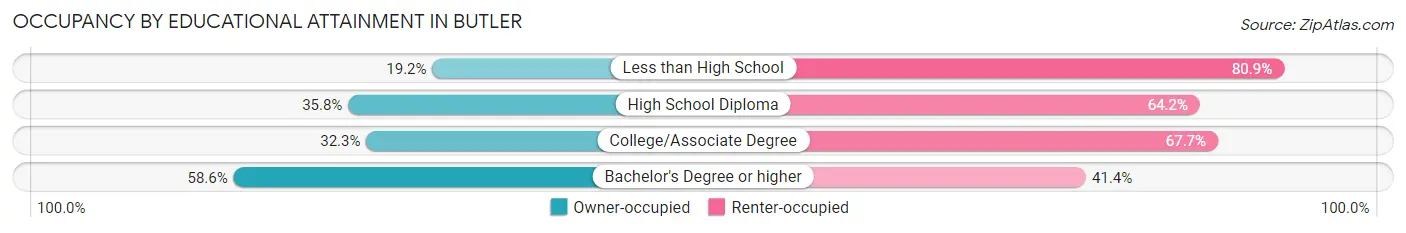
| Household Size | Owner-occupied | Renter-occupied |
| Less than High School | 9 (19.2%) | 38 (80.8%) |
| High School Diploma | 81 (35.8%) | 145 (64.2%) |
| College/Associate Degree | 100 (32.3%) | 210 (67.7%) |
| Bachelor's Degree or higher | 164 (58.6%) | 116 (41.4%) |
Occupancy by Age of Householder in Butler
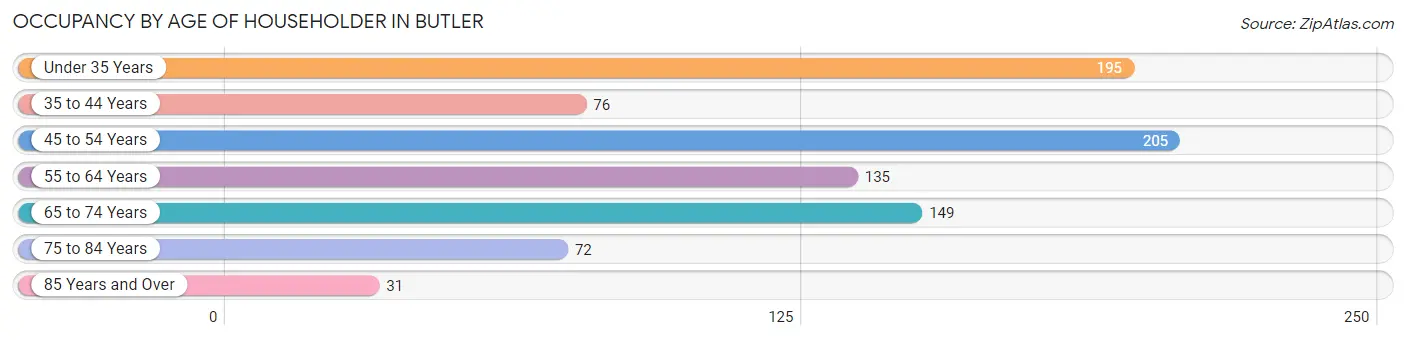
| Age Bracket | # Households | % Households |
| Under 35 Years | 195 | 22.6% |
| 35 to 44 Years | 76 | 8.8% |
| 45 to 54 Years | 205 | 23.7% |
| 55 to 64 Years | 135 | 15.6% |
| 65 to 74 Years | 149 | 17.3% |
| 75 to 84 Years | 72 | 8.3% |
| 85 Years and Over | 31 | 3.6% |
| Total | 863 | 100.0% |
Housing Finances in Butler
Median Income by Occupancy in Butler
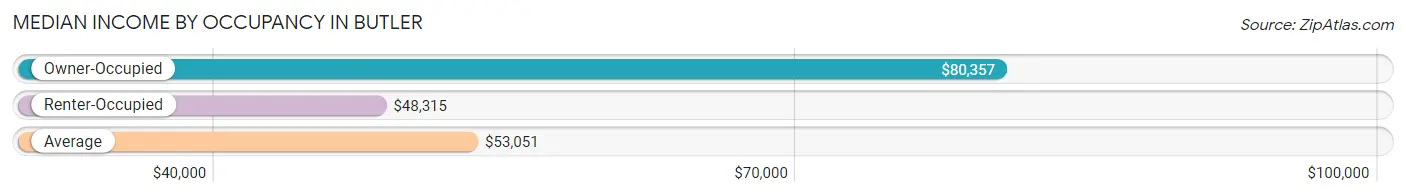
| Occupancy Type | # Households | Median Income |
| Owner-Occupied | 354 (41.0%) | $80,357 |
| Renter-Occupied | 509 (59.0%) | $48,315 |
| Average | 863 (100.0%) | $53,051 |
Occupancy by Householder Income Bracket in Butler
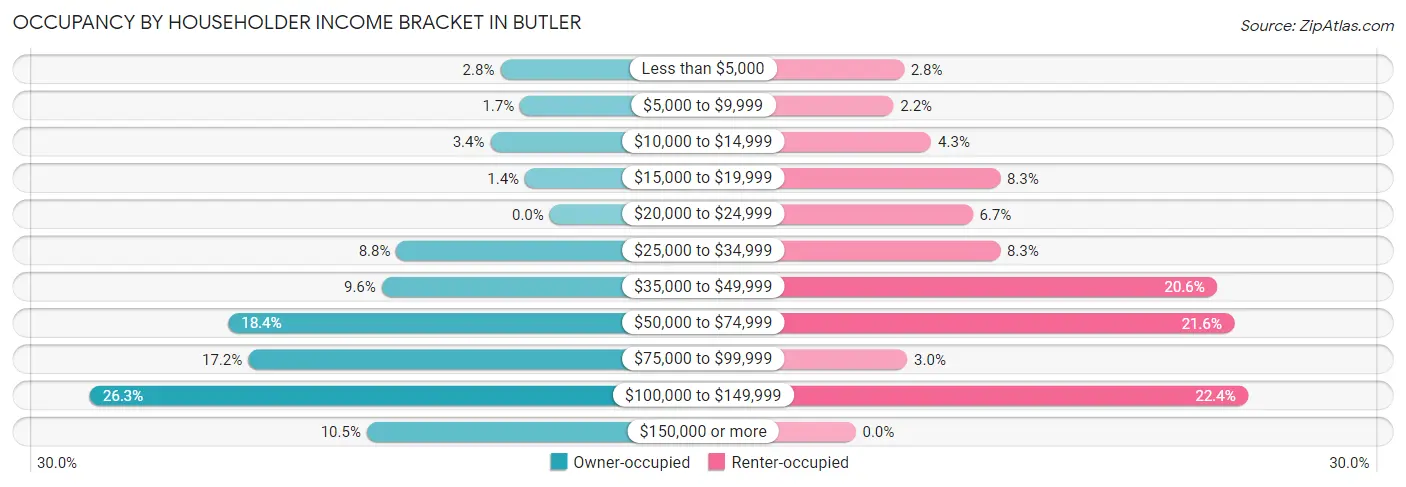
| Income Bracket | Owner-occupied | Renter-occupied |
| Less than $5,000 | 10 (2.8%) | 14 (2.8%) |
| $5,000 to $9,999 | 6 (1.7%) | 11 (2.2%) |
| $10,000 to $14,999 | 12 (3.4%) | 22 (4.3%) |
| $15,000 to $19,999 | 5 (1.4%) | 42 (8.3%) |
| $20,000 to $24,999 | 0 (0.0%) | 34 (6.7%) |
| $25,000 to $34,999 | 31 (8.8%) | 42 (8.3%) |
| $35,000 to $49,999 | 34 (9.6%) | 105 (20.6%) |
| $50,000 to $74,999 | 65 (18.4%) | 110 (21.6%) |
| $75,000 to $99,999 | 61 (17.2%) | 15 (2.9%) |
| $100,000 to $149,999 | 93 (26.3%) | 114 (22.4%) |
| $150,000 or more | 37 (10.4%) | 0 (0.0%) |
| Total | 354 (100.0%) | 509 (100.0%) |
Monthly Housing Cost Tiers in Butler
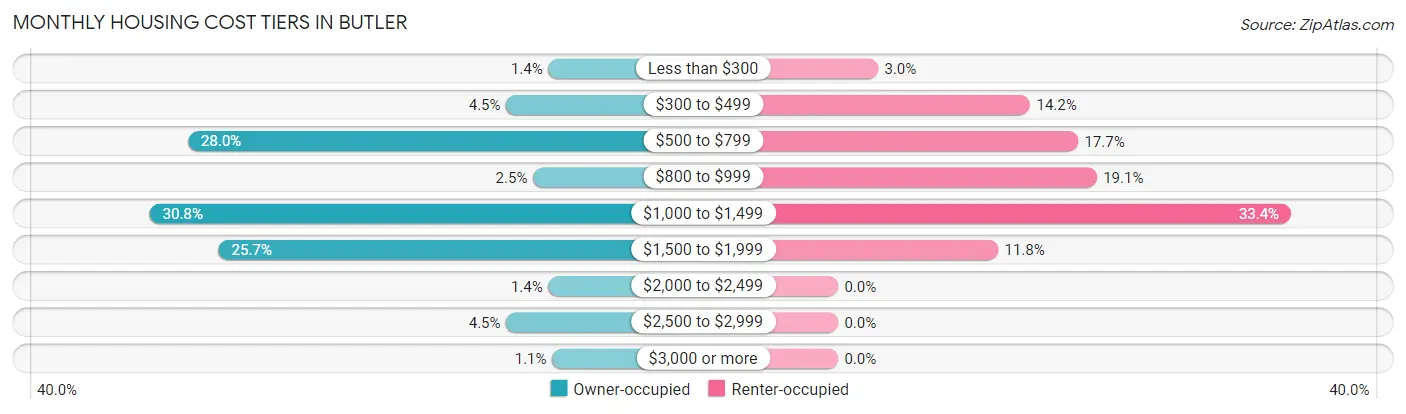
| Monthly Cost | Owner-occupied | Renter-occupied |
| Less than $300 | 5 (1.4%) | 15 (2.9%) |
| $300 to $499 | 16 (4.5%) | 72 (14.1%) |
| $500 to $799 | 99 (28.0%) | 90 (17.7%) |
| $800 to $999 | 9 (2.5%) | 97 (19.1%) |
| $1,000 to $1,499 | 109 (30.8%) | 170 (33.4%) |
| $1,500 to $1,999 | 91 (25.7%) | 60 (11.8%) |
| $2,000 to $2,499 | 5 (1.4%) | 0 (0.0%) |
| $2,500 to $2,999 | 16 (4.5%) | 0 (0.0%) |
| $3,000 or more | 4 (1.1%) | 0 (0.0%) |
| Total | 354 (100.0%) | 509 (100.0%) |
Physical Housing Characteristics in Butler
Housing Structures in Butler
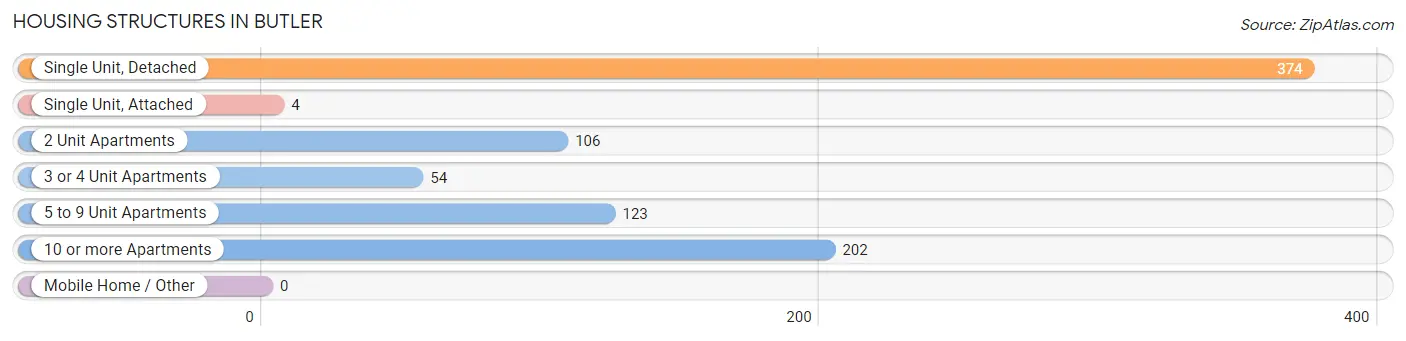
| Structure Type | # Housing Units | % Housing Units |
| Single Unit, Detached | 374 | 43.3% |
| Single Unit, Attached | 4 | 0.5% |
| 2 Unit Apartments | 106 | 12.3% |
| 3 or 4 Unit Apartments | 54 | 6.3% |
| 5 to 9 Unit Apartments | 123 | 14.2% |
| 10 or more Apartments | 202 | 23.4% |
| Mobile Home / Other | 0 | 0.0% |
| Total | 863 | 100.0% |
Housing Structures by Occupancy in Butler
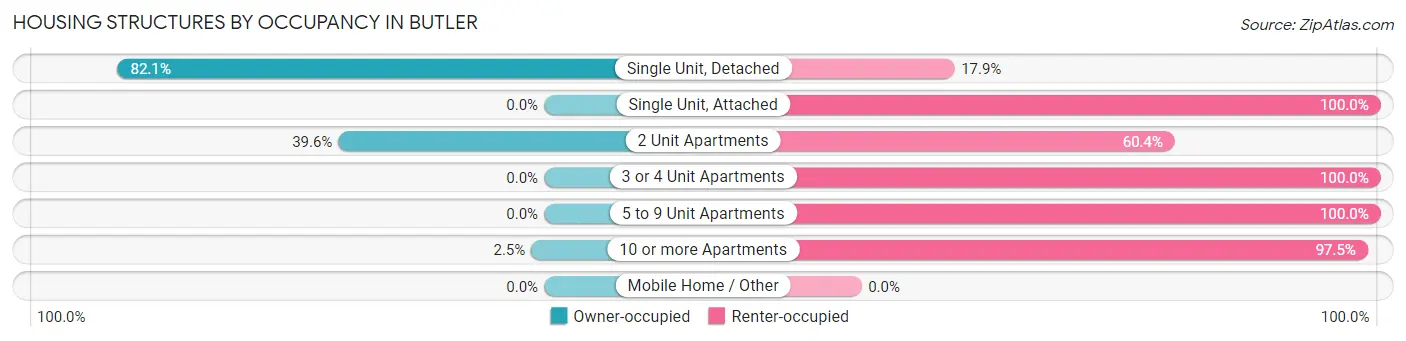
| Structure Type | Owner-occupied | Renter-occupied |
| Single Unit, Detached | 307 (82.1%) | 67 (17.9%) |
| Single Unit, Attached | 0 (0.0%) | 4 (100.0%) |
| 2 Unit Apartments | 42 (39.6%) | 64 (60.4%) |
| 3 or 4 Unit Apartments | 0 (0.0%) | 54 (100.0%) |
| 5 to 9 Unit Apartments | 0 (0.0%) | 123 (100.0%) |
| 10 or more Apartments | 5 (2.5%) | 197 (97.5%) |
| Mobile Home / Other | 0 (0.0%) | 0 (0.0%) |
| Total | 354 (41.0%) | 509 (59.0%) |
Housing Structures by Number of Rooms in Butler
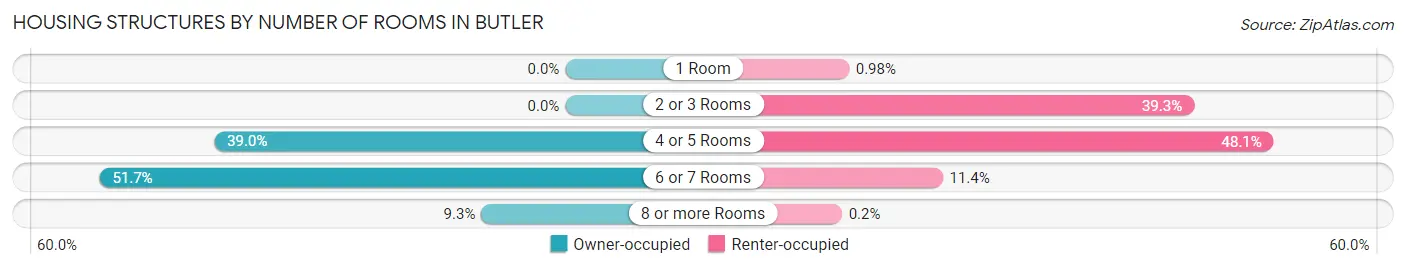
| Number of Rooms | Owner-occupied | Renter-occupied |
| 1 Room | 0 (0.0%) | 5 (1.0%) |
| 2 or 3 Rooms | 0 (0.0%) | 200 (39.3%) |
| 4 or 5 Rooms | 138 (39.0%) | 245 (48.1%) |
| 6 or 7 Rooms | 183 (51.7%) | 58 (11.4%) |
| 8 or more Rooms | 33 (9.3%) | 1 (0.2%) |
| Total | 354 (100.0%) | 509 (100.0%) |
Housing Structure by Heating Type in Butler
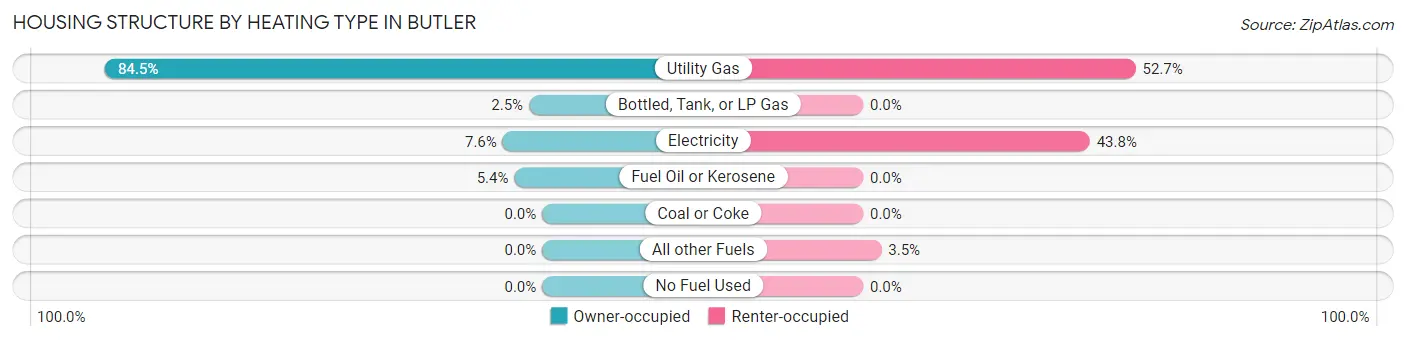
| Heating Type | Owner-occupied | Renter-occupied |
| Utility Gas | 299 (84.5%) | 268 (52.6%) |
| Bottled, Tank, or LP Gas | 9 (2.5%) | 0 (0.0%) |
| Electricity | 27 (7.6%) | 223 (43.8%) |
| Fuel Oil or Kerosene | 19 (5.4%) | 0 (0.0%) |
| Coal or Coke | 0 (0.0%) | 0 (0.0%) |
| All other Fuels | 0 (0.0%) | 18 (3.5%) |
| No Fuel Used | 0 (0.0%) | 0 (0.0%) |
| Total | 354 (100.0%) | 509 (100.0%) |
Household Vehicle Usage in Butler
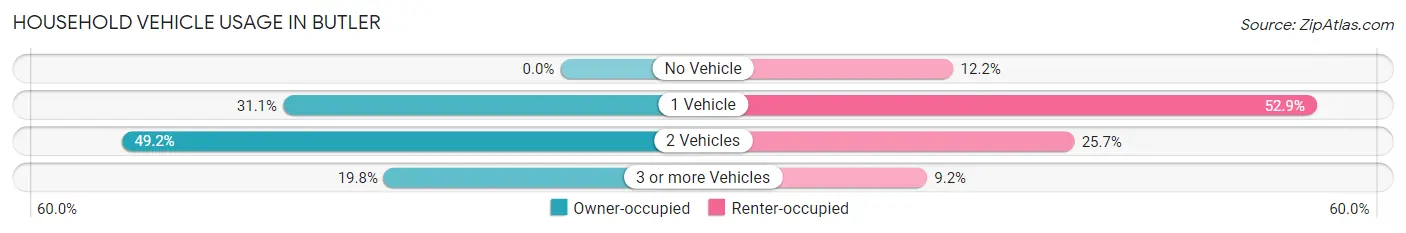
| Vehicles per Household | Owner-occupied | Renter-occupied |
| No Vehicle | 0 (0.0%) | 62 (12.2%) |
| 1 Vehicle | 110 (31.1%) | 269 (52.8%) |
| 2 Vehicles | 174 (49.1%) | 131 (25.7%) |
| 3 or more Vehicles | 70 (19.8%) | 47 (9.2%) |
| Total | 354 (100.0%) | 509 (100.0%) |
Real Estate & Mortgages in Butler
Real Estate and Mortgage Overview in Butler
| Characteristic | Without Mortgage | With Mortgage |
| Housing Units | 107 | 247 |
| Median Property Value | $207,300 | $199,700 |
| Median Household Income | $91,250 | $23 |
| Monthly Housing Costs | $606 | $4 |
| Real Estate Taxes | $3,579 | $4 |
Property Value by Mortgage Status in Butler
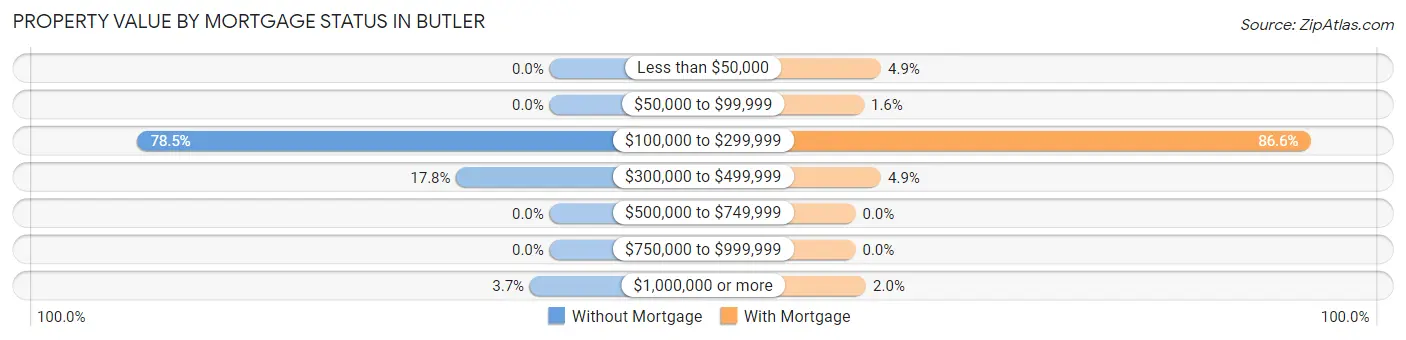
| Property Value | Without Mortgage | With Mortgage |
| Less than $50,000 | 0 (0.0%) | 12 (4.9%) |
| $50,000 to $99,999 | 0 (0.0%) | 4 (1.6%) |
| $100,000 to $299,999 | 84 (78.5%) | 214 (86.6%) |
| $300,000 to $499,999 | 19 (17.8%) | 12 (4.9%) |
| $500,000 to $749,999 | 0 (0.0%) | 0 (0.0%) |
| $750,000 to $999,999 | 0 (0.0%) | 0 (0.0%) |
| $1,000,000 or more | 4 (3.7%) | 5 (2.0%) |
| Total | 107 (100.0%) | 247 (100.0%) |
Household Income by Mortgage Status in Butler
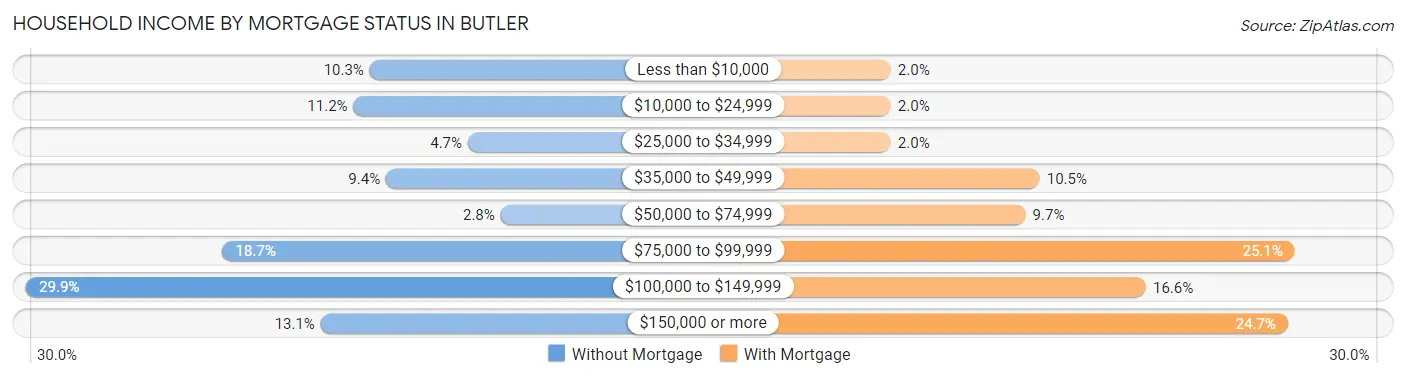
| Household Income | Without Mortgage | With Mortgage |
| Less than $10,000 | 11 (10.3%) | 5 (2.0%) |
| $10,000 to $24,999 | 12 (11.2%) | 5 (2.0%) |
| $25,000 to $34,999 | 5 (4.7%) | 5 (2.0%) |
| $35,000 to $49,999 | 10 (9.3%) | 26 (10.5%) |
| $50,000 to $74,999 | 3 (2.8%) | 24 (9.7%) |
| $75,000 to $99,999 | 20 (18.7%) | 62 (25.1%) |
| $100,000 to $149,999 | 32 (29.9%) | 41 (16.6%) |
| $150,000 or more | 14 (13.1%) | 61 (24.7%) |
| Total | 107 (100.0%) | 247 (100.0%) |
Property Value to Household Income Ratio in Butler
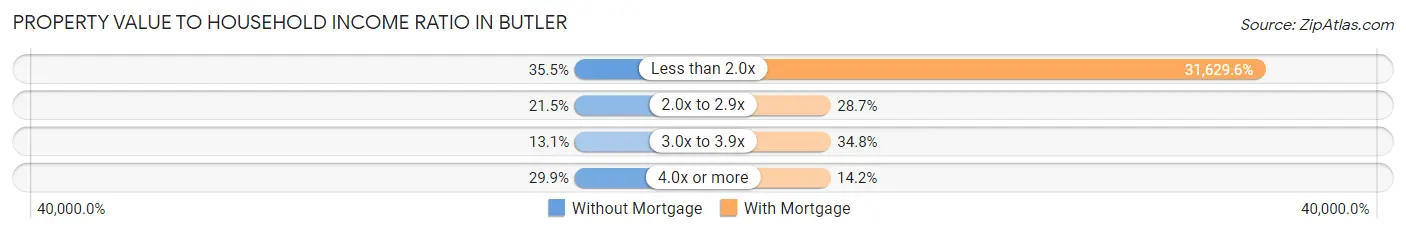
| Value-to-Income Ratio | Without Mortgage | With Mortgage |
| Less than 2.0x | 38 (35.5%) | 78,125 (31,629.6%) |
| 2.0x to 2.9x | 23 (21.5%) | 71 (28.7%) |
| 3.0x to 3.9x | 14 (13.1%) | 86 (34.8%) |
| 4.0x or more | 32 (29.9%) | 35 (14.2%) |
| Total | 107 (100.0%) | 247 (100.0%) |
Real Estate Taxes by Mortgage Status in Butler
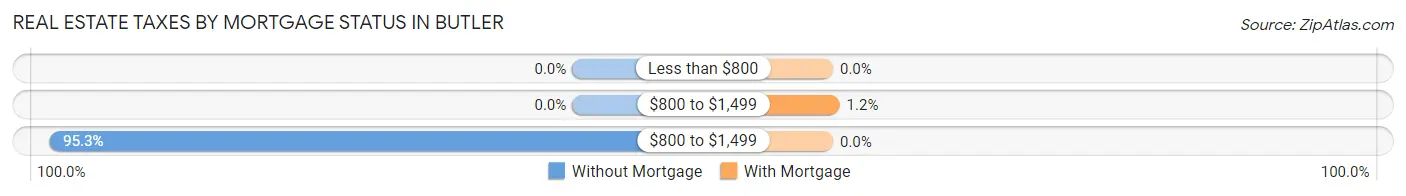
| Property Taxes | Without Mortgage | With Mortgage |
| Less than $800 | 0 (0.0%) | 0 (0.0%) |
| $800 to $1,499 | 0 (0.0%) | 3 (1.2%) |
| $800 to $1,499 | 102 (95.3%) | 0 (0.0%) |
| Total | 107 (100.0%) | 247 (100.0%) |
Health & Disability in Butler
Health Insurance Coverage by Age in Butler
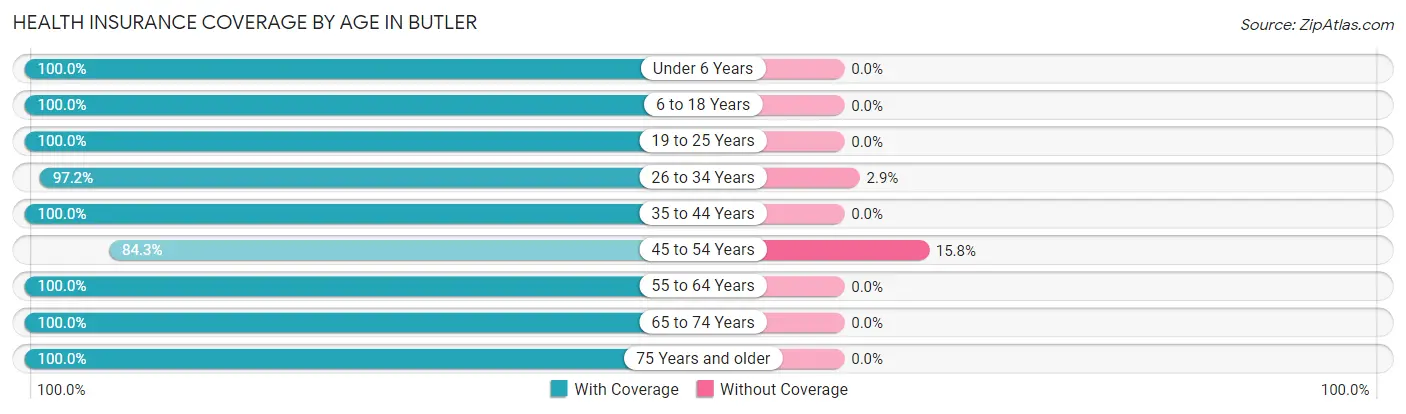
| Age Bracket | With Coverage | Without Coverage |
| Under 6 Years | 65 (100.0%) | 0 (0.0%) |
| 6 to 18 Years | 241 (100.0%) | 0 (0.0%) |
| 19 to 25 Years | 211 (100.0%) | 0 (0.0%) |
| 26 to 34 Years | 239 (97.2%) | 7 (2.9%) |
| 35 to 44 Years | 181 (100.0%) | 0 (0.0%) |
| 45 to 54 Years | 321 (84.3%) | 60 (15.8%) |
| 55 to 64 Years | 249 (100.0%) | 0 (0.0%) |
| 65 to 74 Years | 212 (100.0%) | 0 (0.0%) |
| 75 Years and older | 120 (100.0%) | 0 (0.0%) |
| Total | 1,839 (96.5%) | 67 (3.5%) |
Health Insurance Coverage by Citizenship Status in Butler
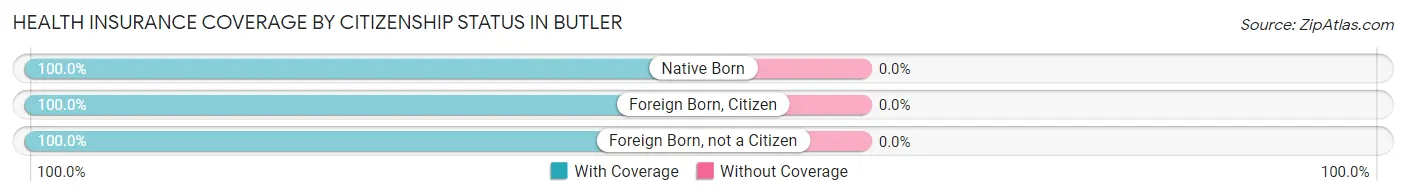
| Citizenship Status | With Coverage | Without Coverage |
| Native Born | 65 (100.0%) | 0 (0.0%) |
| Foreign Born, Citizen | 241 (100.0%) | 0 (0.0%) |
| Foreign Born, not a Citizen | 211 (100.0%) | 0 (0.0%) |
Health Insurance Coverage by Household Income in Butler
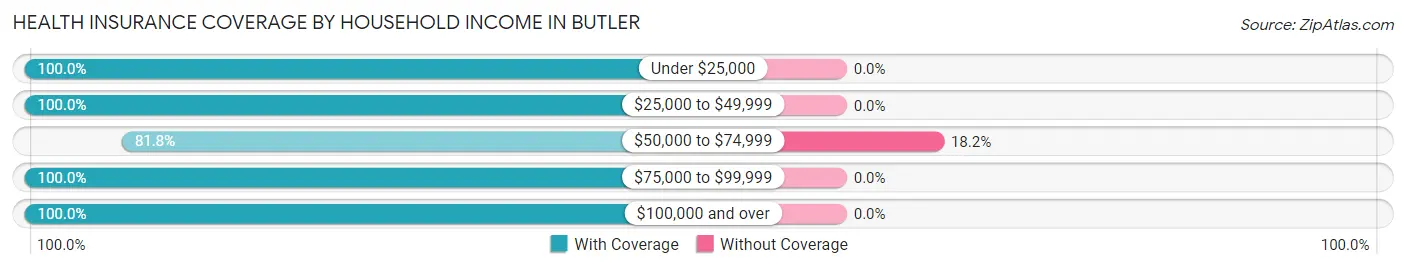
| Household Income | With Coverage | Without Coverage |
| Under $25,000 | 175 (100.0%) | 0 (0.0%) |
| $25,000 to $49,999 | 307 (100.0%) | 0 (0.0%) |
| $50,000 to $74,999 | 301 (81.8%) | 67 (18.2%) |
| $75,000 to $99,999 | 211 (100.0%) | 0 (0.0%) |
| $100,000 and over | 838 (100.0%) | 0 (0.0%) |
Public vs Private Health Insurance Coverage by Age in Butler
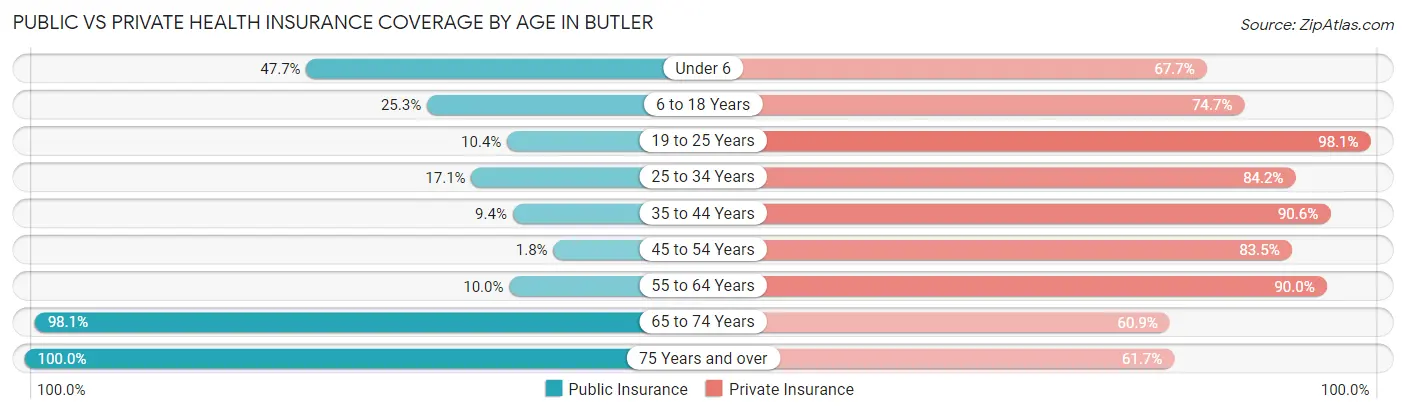
| Age Bracket | Public Insurance | Private Insurance |
| Under 6 | 31 (47.7%) | 44 (67.7%) |
| 6 to 18 Years | 61 (25.3%) | 180 (74.7%) |
| 19 to 25 Years | 22 (10.4%) | 207 (98.1%) |
| 25 to 34 Years | 42 (17.1%) | 207 (84.2%) |
| 35 to 44 Years | 17 (9.4%) | 164 (90.6%) |
| 45 to 54 Years | 7 (1.8%) | 318 (83.5%) |
| 55 to 64 Years | 25 (10.0%) | 224 (90.0%) |
| 65 to 74 Years | 208 (98.1%) | 129 (60.9%) |
| 75 Years and over | 120 (100.0%) | 74 (61.7%) |
| Total | 533 (28.0%) | 1,547 (81.2%) |
Disability Status by Sex by Age in Butler
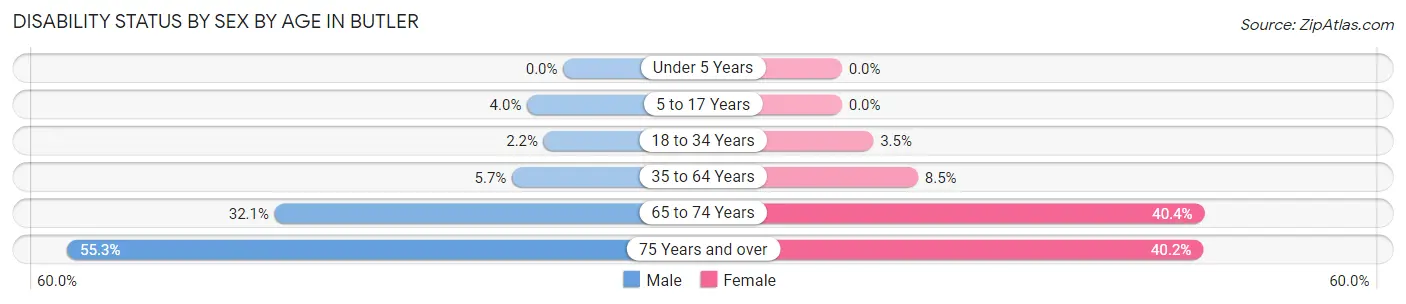
| Age Bracket | Male | Female |
| Under 5 Years | 0 (0.0%) | 0 (0.0%) |
| 5 to 17 Years | 7 (4.0%) | 0 (0.0%) |
| 18 to 34 Years | 6 (2.2%) | 7 (3.5%) |
| 35 to 64 Years | 22 (5.7%) | 36 (8.5%) |
| 65 to 74 Years | 18 (32.1%) | 63 (40.4%) |
| 75 Years and over | 21 (55.3%) | 33 (40.2%) |
Disability Class by Sex by Age in Butler
Disability Class: Hearing Difficulty
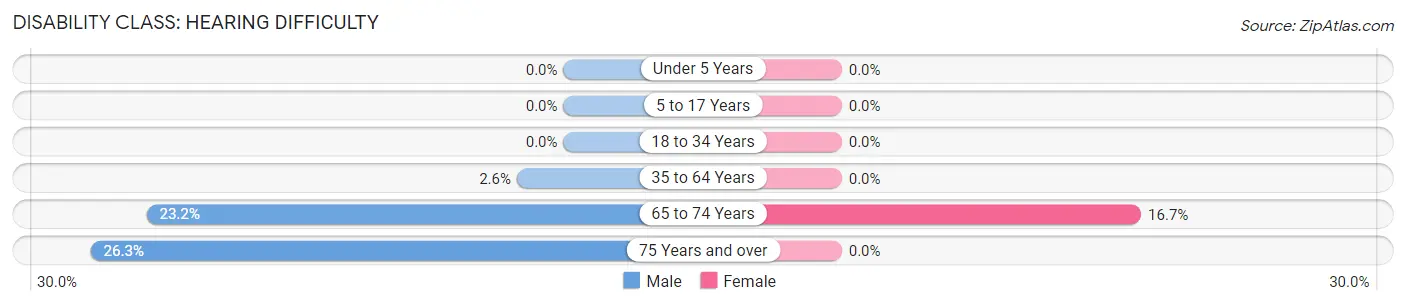
| Age Bracket | Male | Female |
| Under 5 Years | 0 (0.0%) | 0 (0.0%) |
| 5 to 17 Years | 0 (0.0%) | 0 (0.0%) |
| 18 to 34 Years | 0 (0.0%) | 0 (0.0%) |
| 35 to 64 Years | 10 (2.6%) | 0 (0.0%) |
| 65 to 74 Years | 13 (23.2%) | 26 (16.7%) |
| 75 Years and over | 10 (26.3%) | 0 (0.0%) |
Disability Class: Vision Difficulty
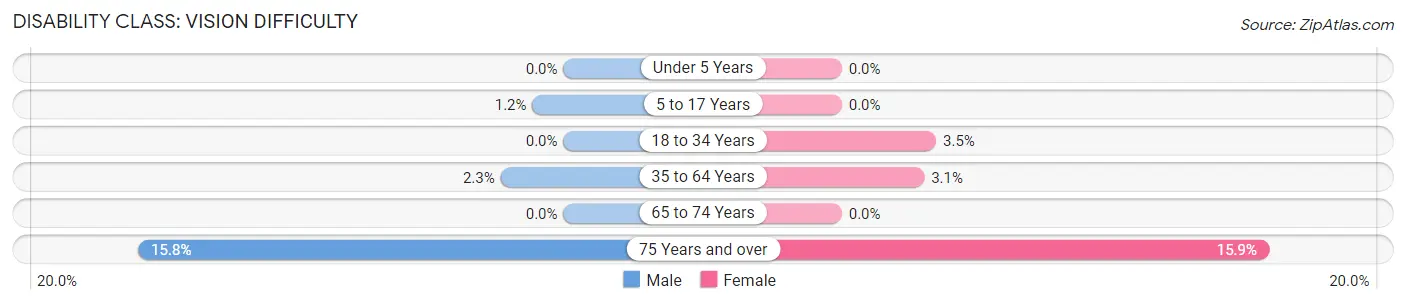
| Age Bracket | Male | Female |
| Under 5 Years | 0 (0.0%) | 0 (0.0%) |
| 5 to 17 Years | 2 (1.1%) | 0 (0.0%) |
| 18 to 34 Years | 0 (0.0%) | 7 (3.5%) |
| 35 to 64 Years | 9 (2.3%) | 13 (3.1%) |
| 65 to 74 Years | 0 (0.0%) | 0 (0.0%) |
| 75 Years and over | 6 (15.8%) | 13 (15.9%) |
Disability Class: Cognitive Difficulty
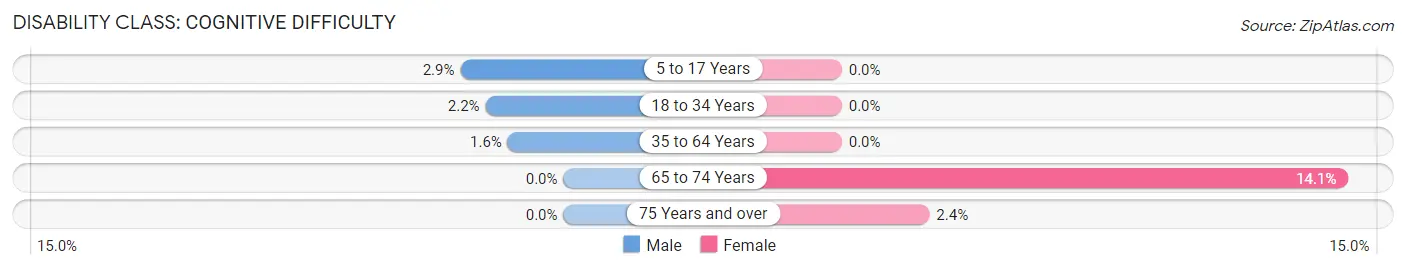
| Age Bracket | Male | Female |
| 5 to 17 Years | 5 (2.9%) | 0 (0.0%) |
| 18 to 34 Years | 6 (2.2%) | 0 (0.0%) |
| 35 to 64 Years | 6 (1.5%) | 0 (0.0%) |
| 65 to 74 Years | 0 (0.0%) | 22 (14.1%) |
| 75 Years and over | 0 (0.0%) | 2 (2.4%) |
Disability Class: Ambulatory Difficulty
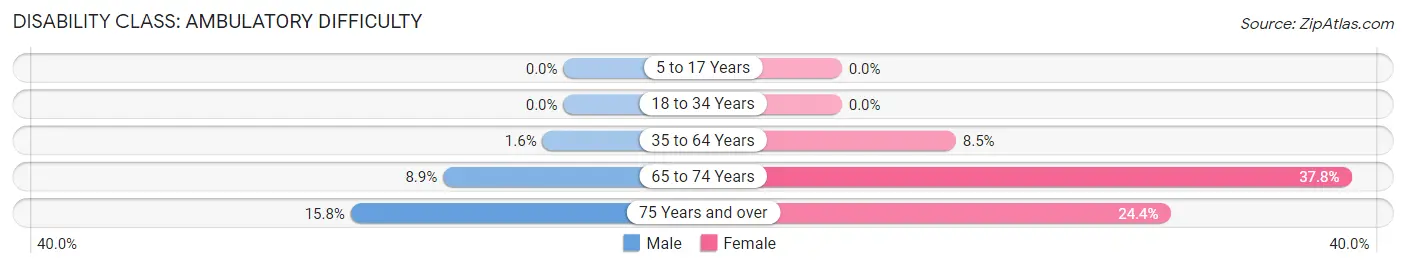
| Age Bracket | Male | Female |
| 5 to 17 Years | 0 (0.0%) | 0 (0.0%) |
| 18 to 34 Years | 0 (0.0%) | 0 (0.0%) |
| 35 to 64 Years | 6 (1.5%) | 36 (8.5%) |
| 65 to 74 Years | 5 (8.9%) | 59 (37.8%) |
| 75 Years and over | 6 (15.8%) | 20 (24.4%) |
Disability Class: Self-Care Difficulty
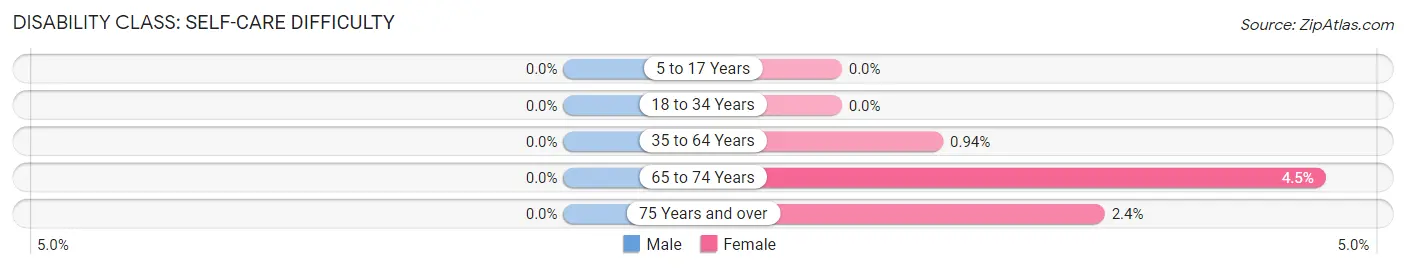
| Age Bracket | Male | Female |
| 5 to 17 Years | 0 (0.0%) | 0 (0.0%) |
| 18 to 34 Years | 0 (0.0%) | 0 (0.0%) |
| 35 to 64 Years | 0 (0.0%) | 4 (0.9%) |
| 65 to 74 Years | 0 (0.0%) | 7 (4.5%) |
| 75 Years and over | 0 (0.0%) | 2 (2.4%) |
Technology Access in Butler
Computing Device Access in Butler
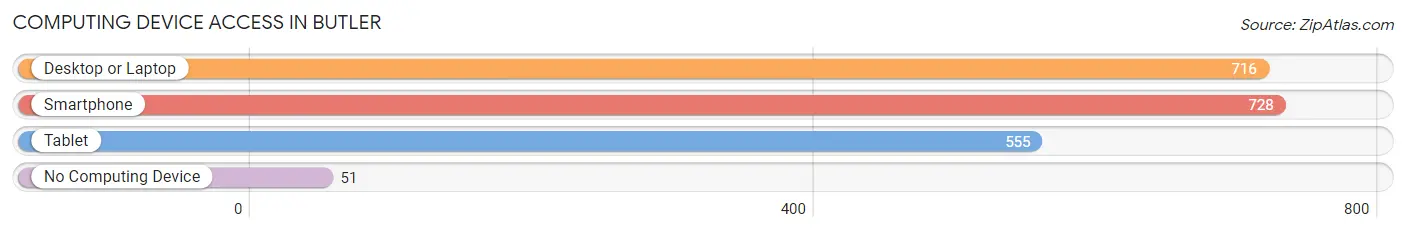
| Device Type | # Households | % Households |
| Desktop or Laptop | 716 | 83.0% |
| Smartphone | 728 | 84.4% |
| Tablet | 555 | 64.3% |
| No Computing Device | 51 | 5.9% |
| Total | 863 | 100.0% |
Internet Access in Butler
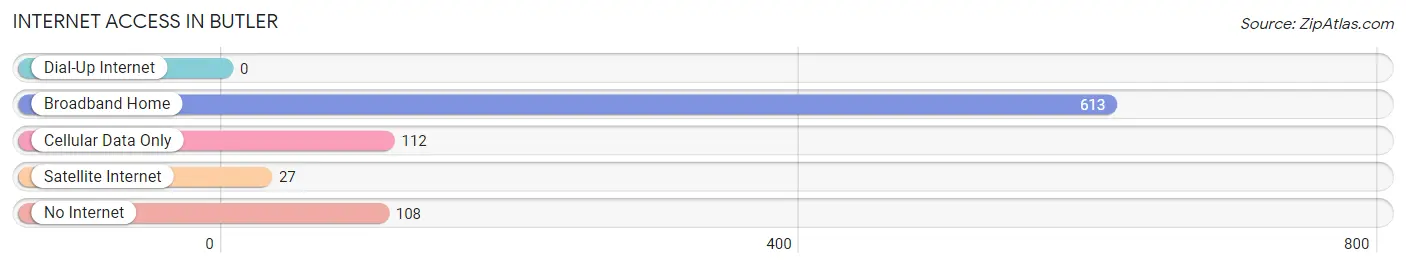
| Internet Type | # Households | % Households |
| Dial-Up Internet | 0 | 0.0% |
| Broadband Home | 613 | 71.0% |
| Cellular Data Only | 112 | 13.0% |
| Satellite Internet | 27 | 3.1% |
| No Internet | 108 | 12.5% |
| Total | 863 | 100.0% |
Butler Summary
Butler, Wisconsin is a small village located in Waukesha County, Wisconsin. It is situated on the western edge of the Milwaukee metropolitan area, approximately 20 miles west of downtown Milwaukee. The village has a population of approximately 2,500 people and covers an area of 1.2 square miles.
History
The area that is now Butler was first settled in the early 1840s by German immigrants. The village was originally known as “Butler’s Corners” and was named after the Butler family, who were among the first settlers. The village was officially incorporated in 1892.
In the early 20th century, Butler was a thriving agricultural community. The village was home to several dairy farms, as well as a number of small businesses. The village also had a train station, which was used to transport goods and passengers to and from Milwaukee.
Geography
Butler is located in southeastern Wisconsin, approximately 20 miles west of downtown Milwaukee. The village is situated on the western edge of the Milwaukee metropolitan area. The village is bordered by the towns of Brookfield, Menomonee Falls, and Wauwatosa.
The village is situated on a rolling landscape, with an elevation of 830 feet above sea level. The village is located in the Kettle Moraine region of Wisconsin, which is characterized by rolling hills and glacial lakes. The village is located near several small lakes, including Lake Five, Lake Koshkonong, and Lake Nagawicka.
Economy
Butler’s economy is largely based on agriculture and manufacturing. The village is home to several dairy farms, as well as a number of small businesses. The village also has a number of light industrial businesses, including a plastics manufacturer and a metal fabrication shop.
The village is also home to a number of retail businesses, including a grocery store, a hardware store, and a number of restaurants. The village also has a number of professional services, including a bank, a post office, and a library.
Demographics
As of the 2010 census, the village of Butler had a population of 2,500 people. The population is predominantly white (96.2%), with a small percentage of African Americans (1.2%) and Hispanics (1.6%). The median household income is $50,000, and the median age is 43.
The village is served by the Waukesha County School District, which includes two elementary schools, one middle school, and one high school. The village also has a number of private schools, including a Catholic school and a Lutheran school.
Conclusion
Butler, Wisconsin is a small village located in Waukesha County, Wisconsin. It is situated on the western edge of the Milwaukee metropolitan area, approximately 20 miles west of downtown Milwaukee. The village has a population of approximately 2,500 people and covers an area of 1.2 square miles. The village’s economy is largely based on agriculture and manufacturing, and the village is served by the Waukesha County School District. The village is predominantly white, with a small percentage of African Americans and Hispanics.
Common Questions
What is Per Capita Income in Butler?
Per Capita income in Butler is $33,224.
What is the Median Family Income in Butler?
Median Family Income in Butler is $101,667.
What is the Median Household income in Butler?
Median Household Income in Butler is $53,051.
What is Income or Wage Gap in Butler?
Income or Wage Gap in Butler is 26.9%.
Women in Butler earn 73.1 cents for every dollar earned by a man.
What is Family Income Deficit in Butler?
Family Income Deficit in Butler is $4,841.
Families that are below poverty line in Butler earn $4,841 less on average than the poverty threshold level.
What is Inequality or Gini Index in Butler?
Inequality or Gini Index in Butler is 0.38.
What is the Total Population of Butler?
Total Population of Butler is 1,906.
What is the Total Male Population of Butler?
Total Male Population of Butler is 944.
What is the Total Female Population of Butler?
Total Female Population of Butler is 962.
What is the Ratio of Males per 100 Females in Butler?
There are 98.13 Males per 100 Females in Butler.
What is the Ratio of Females per 100 Males in Butler?
There are 101.91 Females per 100 Males in Butler.
What is the Median Population Age in Butler?
Median Population Age in Butler is 45.1 Years.
What is the Average Family Size in Butler
Average Family Size in Butler is 3.1 People.
What is the Average Household Size in Butler
Average Household Size in Butler is 2.2 People.
How Large is the Labor Force in Butler?
There are 1,162 People in the Labor Forcein in Butler.
What is the Percentage of People in the Labor Force in Butler?
71.0% of People are in the Labor Force in Butler.
What is the Unemployment Rate in Butler?
Unemployment Rate in Butler is 3.2%.