Warren, TX Map & Demographics
Warren Map
Warren Overview
$22,037
PER CAPITA INCOME
$66,477
AVG FAMILY INCOME
$66,250
AVG HOUSEHOLD INCOME
0.31
INEQUALITY / GINI INDEX
731
TOTAL POPULATION
451
MALE POPULATION
280
FEMALE POPULATION
161.07
MALES / 100 FEMALES
62.08
FEMALES / 100 MALES
45.8
MEDIAN AGE
3.8
AVG FAMILY SIZE
3.2
AVG HOUSEHOLD SIZE
305
LABOR FORCE [ PEOPLE ]
48.0%
PERCENT IN LABOR FORCE
12.8%
UNEMPLOYMENT RATE
Warren Zip Codes
Warren Area Codes
Income in Warren
Income Overview in Warren
Per Capita Income in Warren is $22,037, while median incomes of families and households are $66,477 and $66,250 respectively.
| Characteristic | Number | Measure |
| Per Capita Income | 731 | $22,037 |
| Median Family Income | 175 | $66,477 |
| Mean Family Income | 175 | $73,979 |
| Median Household Income | 231 | $66,250 |
| Mean Household Income | 231 | $70,035 |
| Income Deficit | 175 | $0 |
| Wage / Income Gap (%) | 731 | 0.00% |
| Wage / Income Gap ($) | 731 | 100.00¢ per $1 |
| Gini / Inequality Index | 731 | 0.31 |
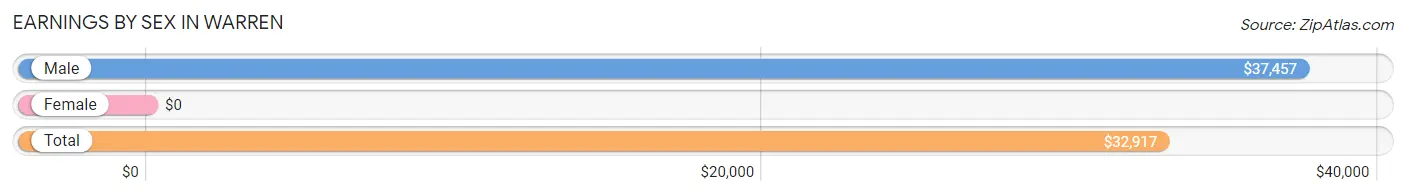
Earnings by Sex in Warren
| Sex | Number | Average Earnings |
| Male | 219 (61.0%) | $37,457 |
| Female | 140 (39.0%) | $0 |
| Total | 359 (100.0%) | $32,917 |
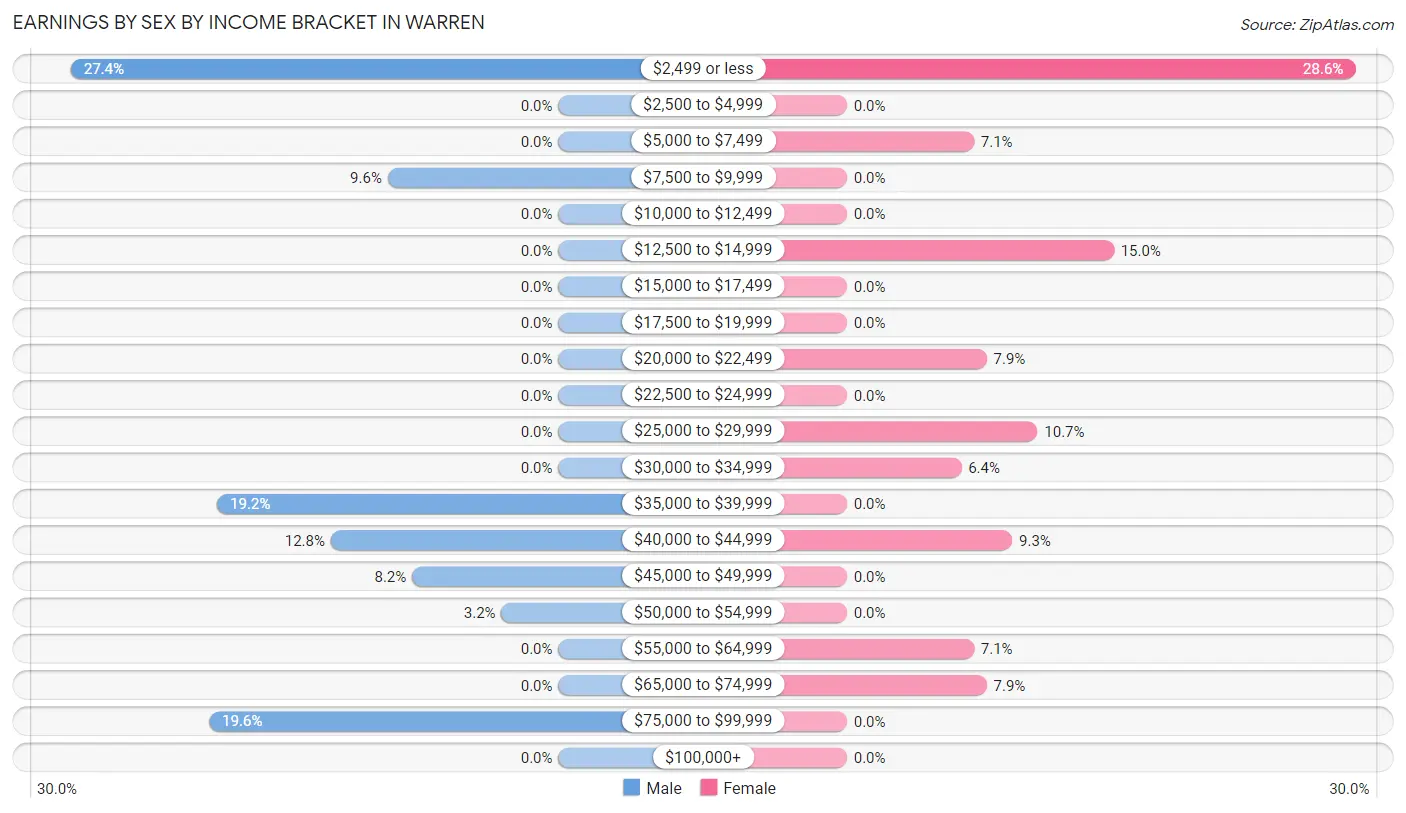
Earnings by Sex by Income Bracket in Warren
The most common earnings brackets in Warren are $2,499 or less for men (60 | 27.4%) and $2,499 or less for women (40 | 28.6%).
| Income | Male | Female |
| $2,499 or less | 60 (27.4%) | 40 (28.6%) |
| $2,500 to $4,999 | 0 (0.0%) | 0 (0.0%) |
| $5,000 to $7,499 | 0 (0.0%) | 10 (7.1%) |
| $7,500 to $9,999 | 21 (9.6%) | 0 (0.0%) |
| $10,000 to $12,499 | 0 (0.0%) | 0 (0.0%) |
| $12,500 to $14,999 | 0 (0.0%) | 21 (15.0%) |
| $15,000 to $17,499 | 0 (0.0%) | 0 (0.0%) |
| $17,500 to $19,999 | 0 (0.0%) | 0 (0.0%) |
| $20,000 to $22,499 | 0 (0.0%) | 11 (7.9%) |
| $22,500 to $24,999 | 0 (0.0%) | 0 (0.0%) |
| $25,000 to $29,999 | 0 (0.0%) | 15 (10.7%) |
| $30,000 to $34,999 | 0 (0.0%) | 9 (6.4%) |
| $35,000 to $39,999 | 42 (19.2%) | 0 (0.0%) |
| $40,000 to $44,999 | 28 (12.8%) | 13 (9.3%) |
| $45,000 to $49,999 | 18 (8.2%) | 0 (0.0%) |
| $50,000 to $54,999 | 7 (3.2%) | 0 (0.0%) |
| $55,000 to $64,999 | 0 (0.0%) | 10 (7.1%) |
| $65,000 to $74,999 | 0 (0.0%) | 11 (7.9%) |
| $75,000 to $99,999 | 43 (19.6%) | 0 (0.0%) |
| $100,000+ | 0 (0.0%) | 0 (0.0%) |
| Total | 219 (100.0%) | 140 (100.0%) |
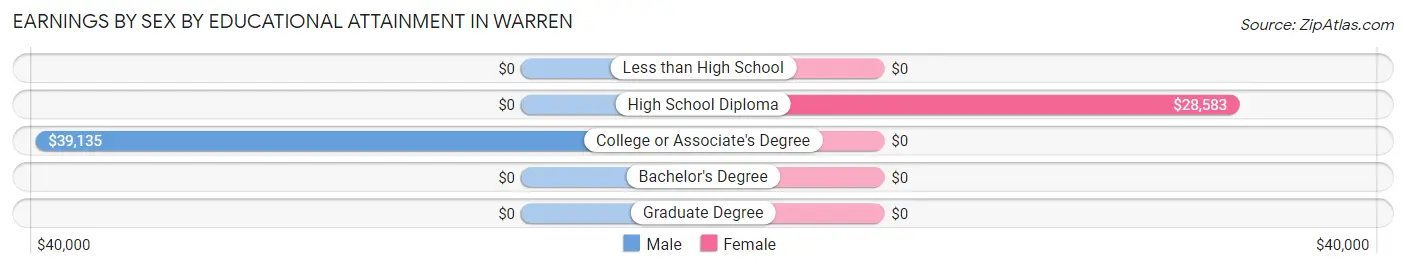
Earnings by Sex by Educational Attainment in Warren
Average earnings in Warren are $41,473 for men and $34,861 for women, a difference of 15.9%. Men with an educational attainment of college or associate's degree enjoy the highest average annual earnings of $39,135, while those with college or associate's degree education earn the least with $39,135. Women with an educational attainment of high school diploma earn the most with the average annual earnings of $28,583, while those with high school diploma education have the smallest earnings of $28,583.
| Educational Attainment | Male Income | Female Income |
| Less than High School | - | - |
| High School Diploma | - | - |
| College or Associate's Degree | $39,135 | $0 |
| Bachelor's Degree | - | - |
| Graduate Degree | - | - |
| Total | $41,473 | $34,861 |
Family Income in Warren
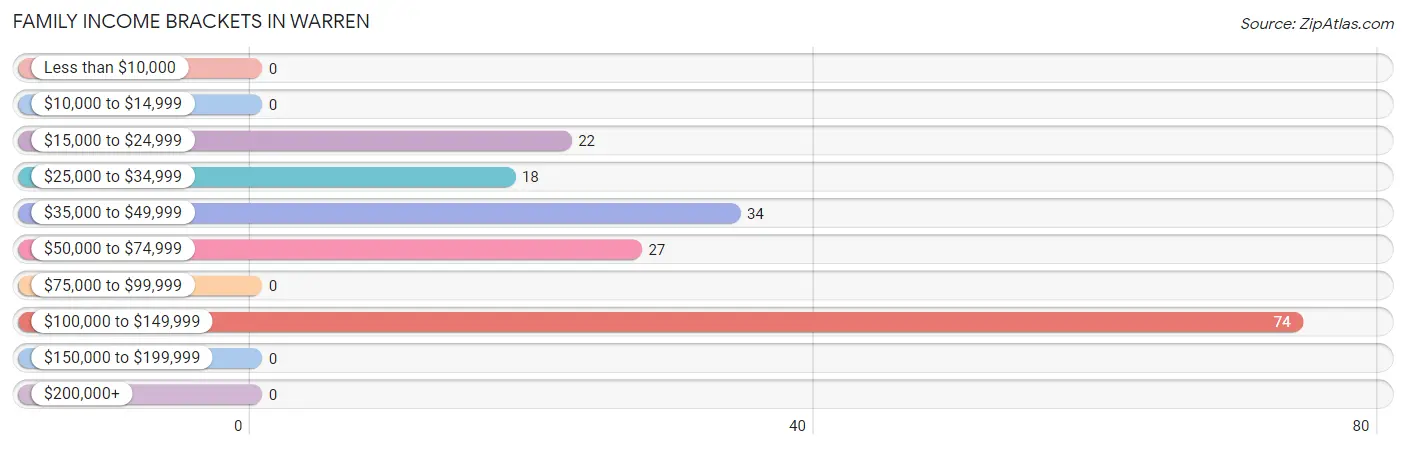
Family Income Brackets in Warren
According to the Warren family income data, there are 74 families falling into the $100,000 to $149,999 income range, which is the most common income bracket and makes up 42.3% of all families.
| Income Bracket | # Families | % Families |
| Less than $10,000 | 0 | 0.0% |
| $10,000 to $14,999 | 0 | 0.0% |
| $15,000 to $24,999 | 22 | 12.6% |
| $25,000 to $34,999 | 18 | 10.3% |
| $35,000 to $49,999 | 34 | 19.4% |
| $50,000 to $74,999 | 27 | 15.4% |
| $75,000 to $99,999 | 0 | 0.0% |
| $100,000 to $149,999 | 74 | 42.3% |
| $150,000 to $199,999 | 0 | 0.0% |
| $200,000+ | 0 | 0.0% |
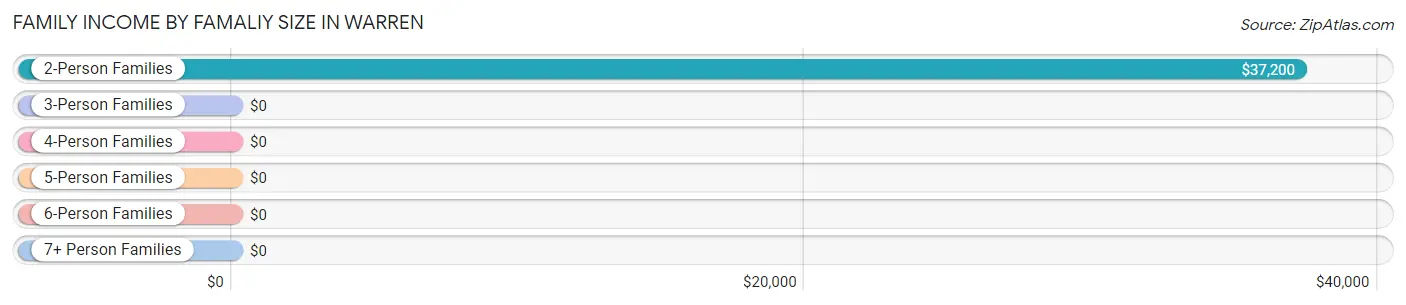
Family Income by Famaliy Size in Warren
2-person families (66 | 37.7%) account for the highest median family income in Warren with $37,200 per family, while 2-person families (66 | 37.7%) have the highest median income of $18,600 per family member.
| Income Bracket | # Families | Median Income |
| 2-Person Families | 66 (37.7%) | $37,200 |
| 3-Person Families | 45 (25.7%) | $0 |
| 4-Person Families | 20 (11.4%) | $0 |
| 5-Person Families | 28 (16.0%) | $0 |
| 6-Person Families | 16 (9.1%) | $0 |
| 7+ Person Families | 0 (0.0%) | $0 |
| Total | 175 (100.0%) | $66,477 |
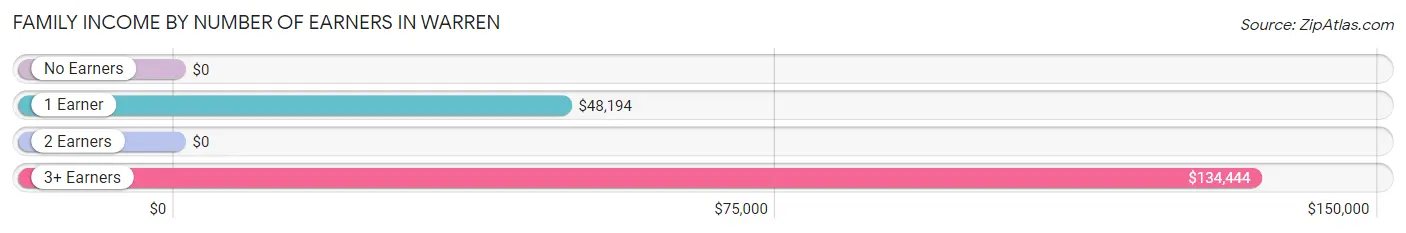
Family Income by Number of Earners in Warren
| Number of Earners | # Families | Median Income |
| No Earners | 46 (26.3%) | $0 |
| 1 Earner | 27 (15.4%) | $48,194 |
| 2 Earners | 66 (37.7%) | $0 |
| 3+ Earners | 36 (20.6%) | $134,444 |
| Total | 175 (100.0%) | $66,477 |
Household Income in Warren
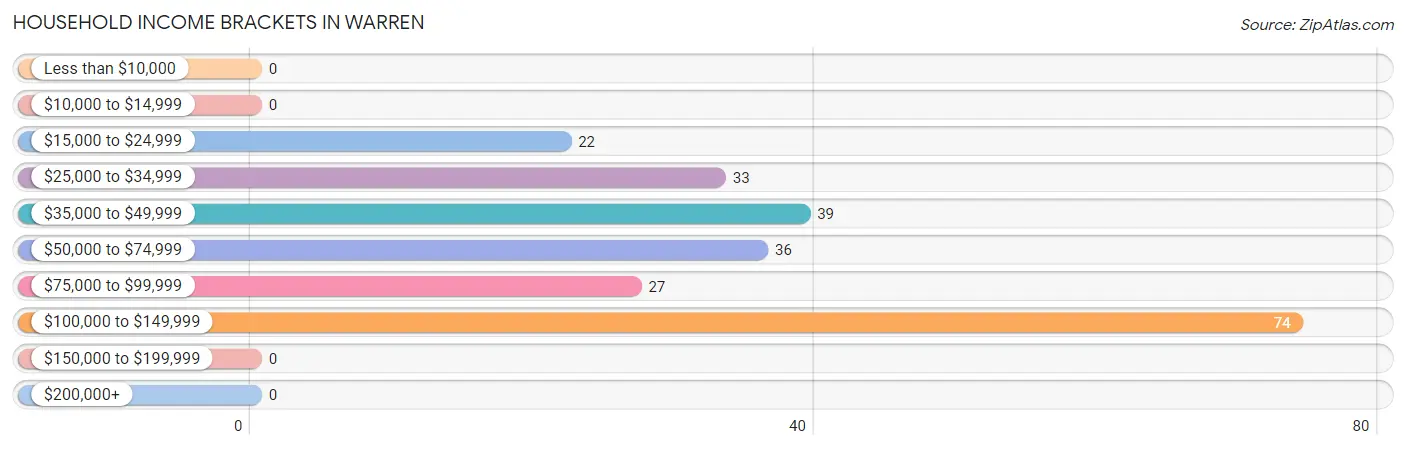
Household Income Brackets in Warren
With 74 households falling in the category, the $100,000 to $149,999 income range is the most frequent in Warren, accounting for 32.0% of all households.
| Income Bracket | # Households | % Households |
| Less than $10,000 | 0 | 0.0% |
| $10,000 to $14,999 | 0 | 0.0% |
| $15,000 to $24,999 | 22 | 9.5% |
| $25,000 to $34,999 | 33 | 14.3% |
| $35,000 to $49,999 | 39 | 16.9% |
| $50,000 to $74,999 | 36 | 15.6% |
| $75,000 to $99,999 | 27 | 11.7% |
| $100,000 to $149,999 | 74 | 32.0% |
| $150,000 to $199,999 | 0 | 0.0% |
| $200,000+ | 0 | 0.0% |
Household Income by Householder Age in Warren
The median household income in Warren is $66,250, with the highest median household income of $108,295 found in the 45 to 64 years age bracket for the primary householder. A total of 121 households (52.4%) fall into this category.
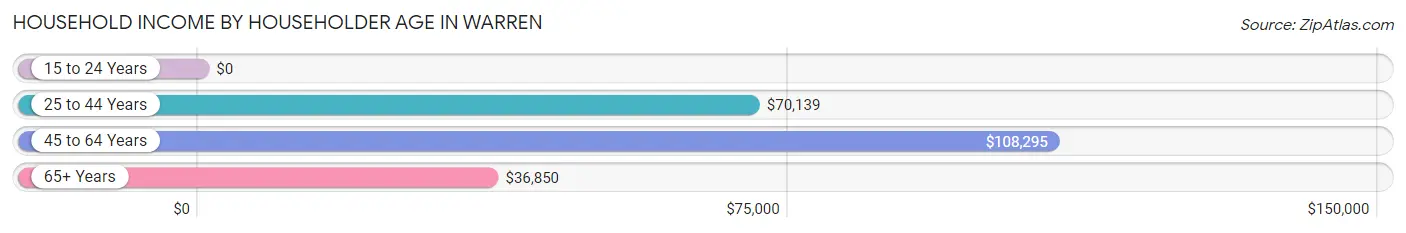
| Income Bracket | # Households | Median Income |
| 15 to 24 Years | 0 (0.0%) | $0 |
| 25 to 44 Years | 37 (16.0%) | $70,139 |
| 45 to 64 Years | 121 (52.4%) | $108,295 |
| 65+ Years | 73 (31.6%) | $36,850 |
| Total | 231 (100.0%) | $66,250 |
Poverty in Warren
Income Below Poverty by Sex and Age in Warren
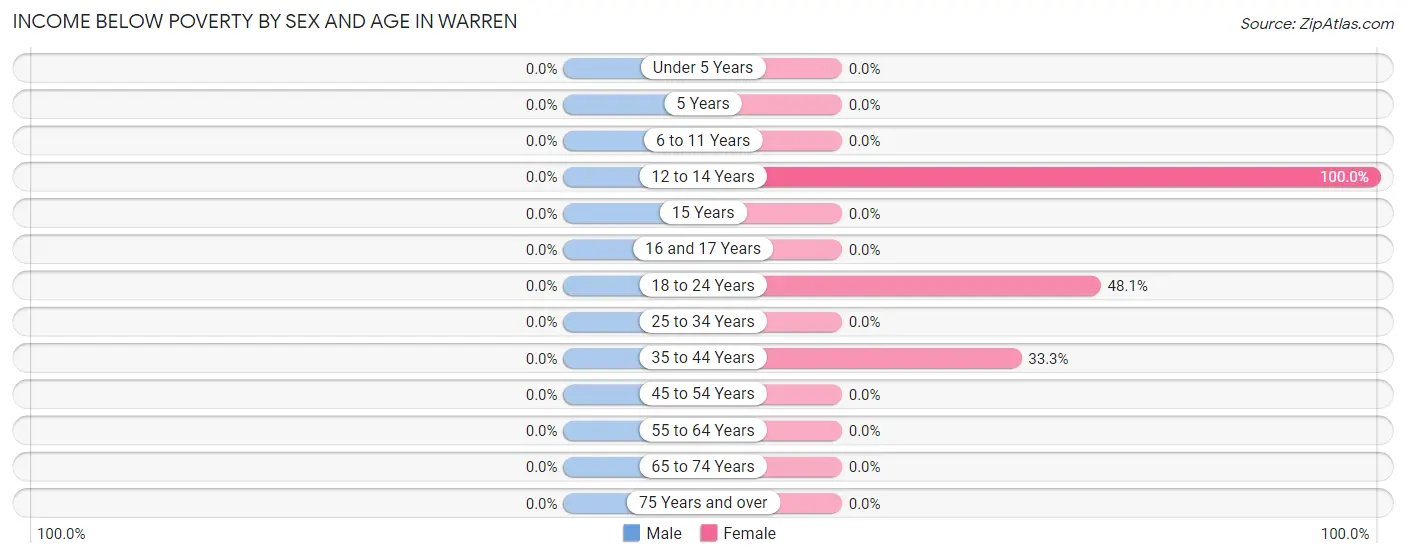
| Age Bracket | Male | Female |
| Under 5 Years | 0 (0.0%) | 0 (0.0%) |
| 5 Years | 0 (0.0%) | 0 (0.0%) |
| 6 to 11 Years | 0 (0.0%) | 0 (0.0%) |
| 12 to 14 Years | 0 (0.0%) | 12 (100.0%) |
| 15 Years | 0 (0.0%) | 0 (0.0%) |
| 16 and 17 Years | 0 (0.0%) | 0 (0.0%) |
| 18 to 24 Years | 0 (0.0%) | 37 (48.0%) |
| 25 to 34 Years | 0 (0.0%) | 0 (0.0%) |
| 35 to 44 Years | 0 (0.0%) | 11 (33.3%) |
| 45 to 54 Years | 0 (0.0%) | 0 (0.0%) |
| 55 to 64 Years | 0 (0.0%) | 0 (0.0%) |
| 65 to 74 Years | 0 (0.0%) | 0 (0.0%) |
| 75 Years and over | 0 (0.0%) | 0 (0.0%) |
| Total | 0 (0.0%) | 60 (21.4%) |
Income Above Poverty by Sex and Age in Warren
According to the poverty statistics in Warren, males aged under 5 years and females aged 6 to 11 years are the age groups that are most secure financially, with 100.0% of males and 100.0% of females in these age groups living above the poverty line.
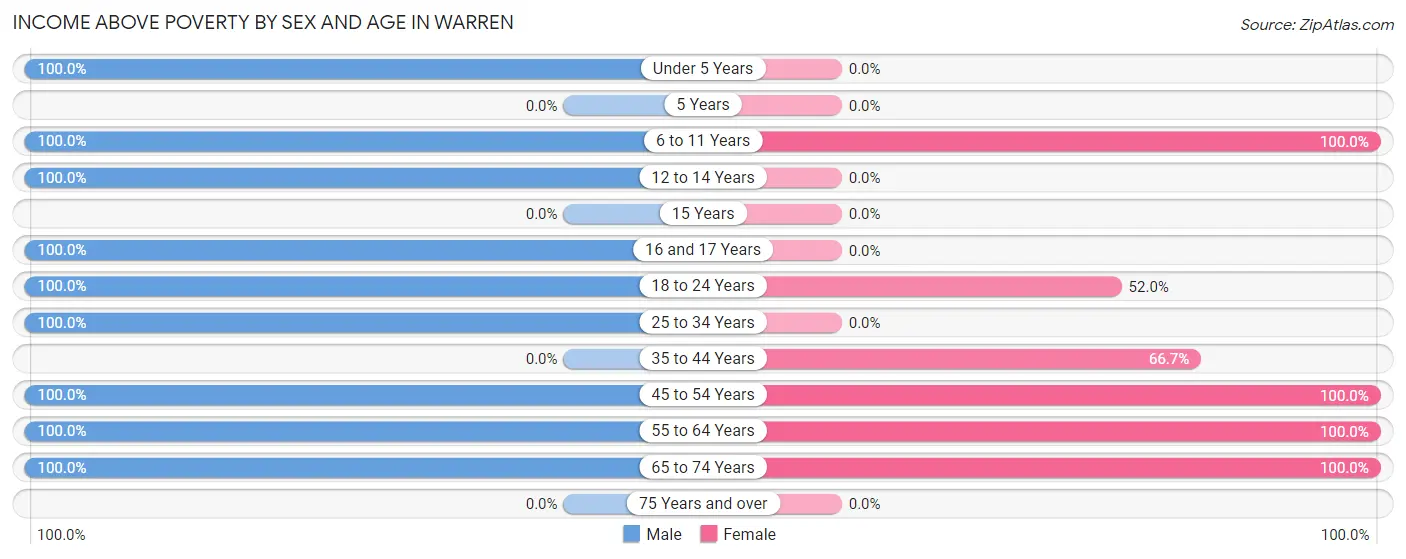
| Age Bracket | Male | Female |
| Under 5 Years | 44 (100.0%) | 0 (0.0%) |
| 5 Years | 0 (0.0%) | 0 (0.0%) |
| 6 to 11 Years | 18 (100.0%) | 11 (100.0%) |
| 12 to 14 Years | 10 (100.0%) | 0 (0.0%) |
| 15 Years | 0 (0.0%) | 0 (0.0%) |
| 16 and 17 Years | 100 (100.0%) | 0 (0.0%) |
| 18 to 24 Years | 22 (100.0%) | 40 (51.9%) |
| 25 to 34 Years | 17 (100.0%) | 0 (0.0%) |
| 35 to 44 Years | 0 (0.0%) | 22 (66.7%) |
| 45 to 54 Years | 93 (100.0%) | 37 (100.0%) |
| 55 to 64 Years | 41 (100.0%) | 57 (100.0%) |
| 65 to 74 Years | 106 (100.0%) | 53 (100.0%) |
| 75 Years and over | 0 (0.0%) | 0 (0.0%) |
| Total | 451 (100.0%) | 220 (78.6%) |
Income Below Poverty Among Married-Couple Families in Warren
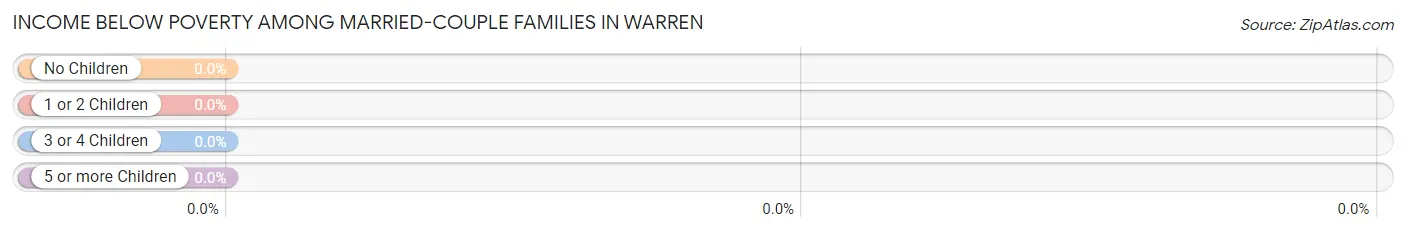
| Children | Above Poverty | Below Poverty |
| No Children | 86 (100.0%) | 0 (0.0%) |
| 1 or 2 Children | 55 (100.0%) | 0 (0.0%) |
| 3 or 4 Children | 16 (100.0%) | 0 (0.0%) |
| 5 or more Children | 0 (0.0%) | 0 (0.0%) |
| Total | 157 (100.0%) | 0 (0.0%) |
Income Below Poverty Among Single-Parent Households in Warren
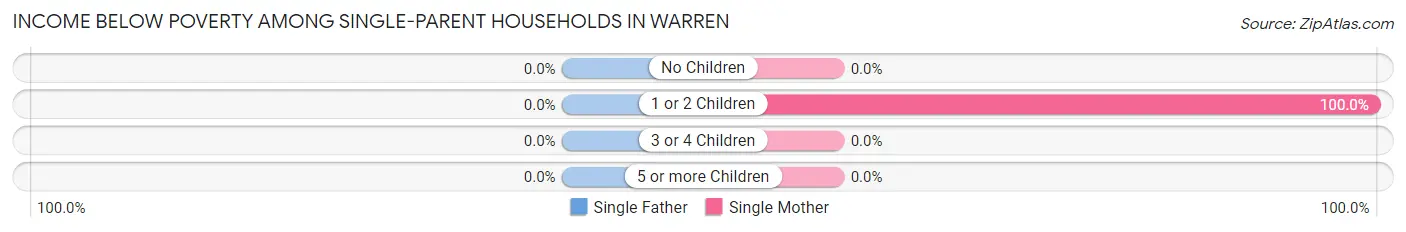
| Children | Single Father | Single Mother |
| No Children | 0 (0.0%) | 0 (0.0%) |
| 1 or 2 Children | 0 (0.0%) | 11 (100.0%) |
| 3 or 4 Children | 0 (0.0%) | 0 (0.0%) |
| 5 or more Children | 0 (0.0%) | 0 (0.0%) |
| Total | 0 (0.0%) | 11 (100.0%) |
Income Below Poverty Among Married-Couple vs Single-Parent Households in Warren
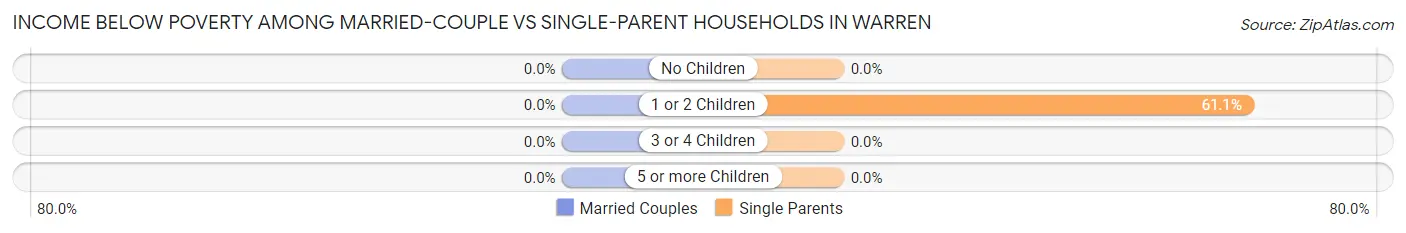
| Children | Married-Couple Families | Single-Parent Households |
| No Children | 0 (0.0%) | 0 (0.0%) |
| 1 or 2 Children | 0 (0.0%) | 11 (61.1%) |
| 3 or 4 Children | 0 (0.0%) | 0 (0.0%) |
| 5 or more Children | 0 (0.0%) | 0 (0.0%) |
| Total | 0 (0.0%) | 11 (61.1%) |
Race in Warren
The most populous races in Warren are White / Caucasian (588 | 80.4%), Two or more Races (134 | 18.3%), and Hispanic or Latino (34 | 4.6%).
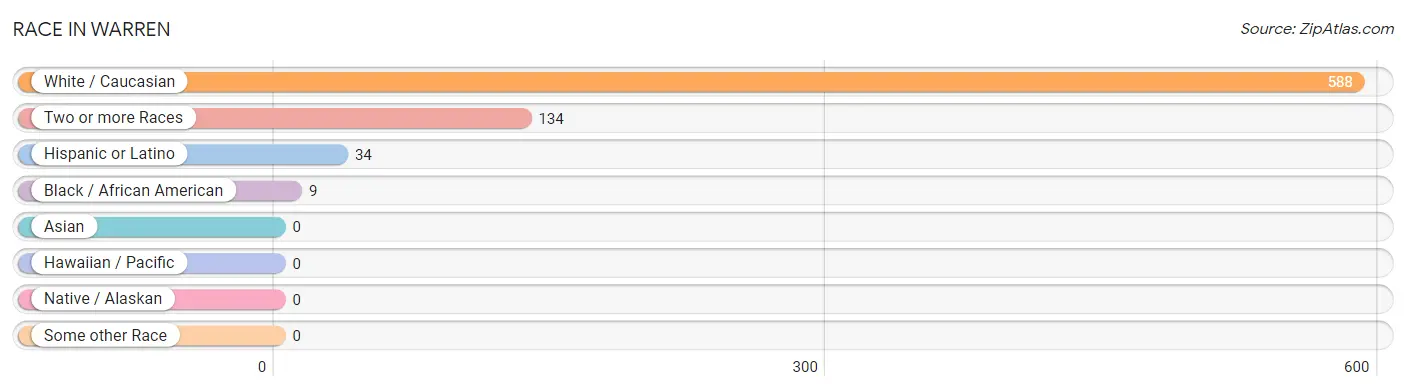
| Race | # Population | % Population |
| Asian | 0 | 0.0% |
| Black / African American | 9 | 1.2% |
| Hawaiian / Pacific | 0 | 0.0% |
| Hispanic or Latino | 34 | 4.6% |
| Native / Alaskan | 0 | 0.0% |
| White / Caucasian | 588 | 80.4% |
| Two or more Races | 134 | 18.3% |
| Some other Race | 0 | 0.0% |
| Total | 731 | 100.0% |
Ancestry in Warren
The most populous ancestries reported in Warren are American (135 | 18.5%), Irish (93 | 12.7%), German (66 | 9.0%), Cherokee (39 | 5.3%), and Mexican (34 | 4.6%), together accounting for 50.2% of all Warren residents.
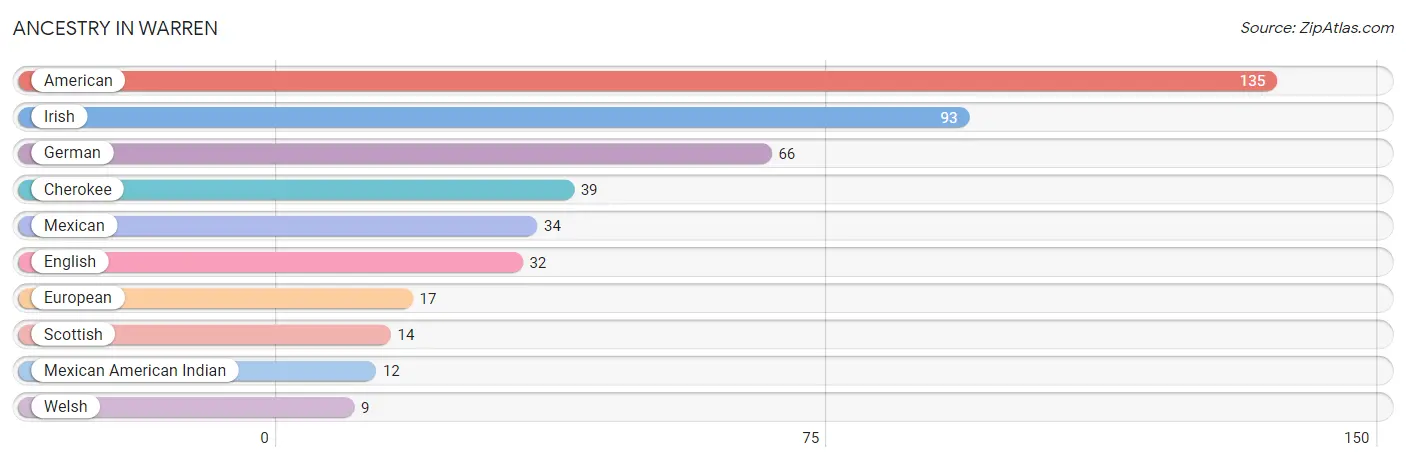
| Ancestry | # Population | % Population |
| American | 135 | 18.5% |
| Cherokee | 39 | 5.3% |
| English | 32 | 4.4% |
| European | 17 | 2.3% |
| German | 66 | 9.0% |
| Irish | 93 | 12.7% |
| Mexican | 34 | 4.6% |
| Mexican American Indian | 12 | 1.6% |
| Scottish | 14 | 1.9% |
| Welsh | 9 | 1.2% | View All 10 Rows |
Immigrants in Warren

| Immigration Origin | # Population | % Population | View All 0 Rows |
Sex and Age in Warren
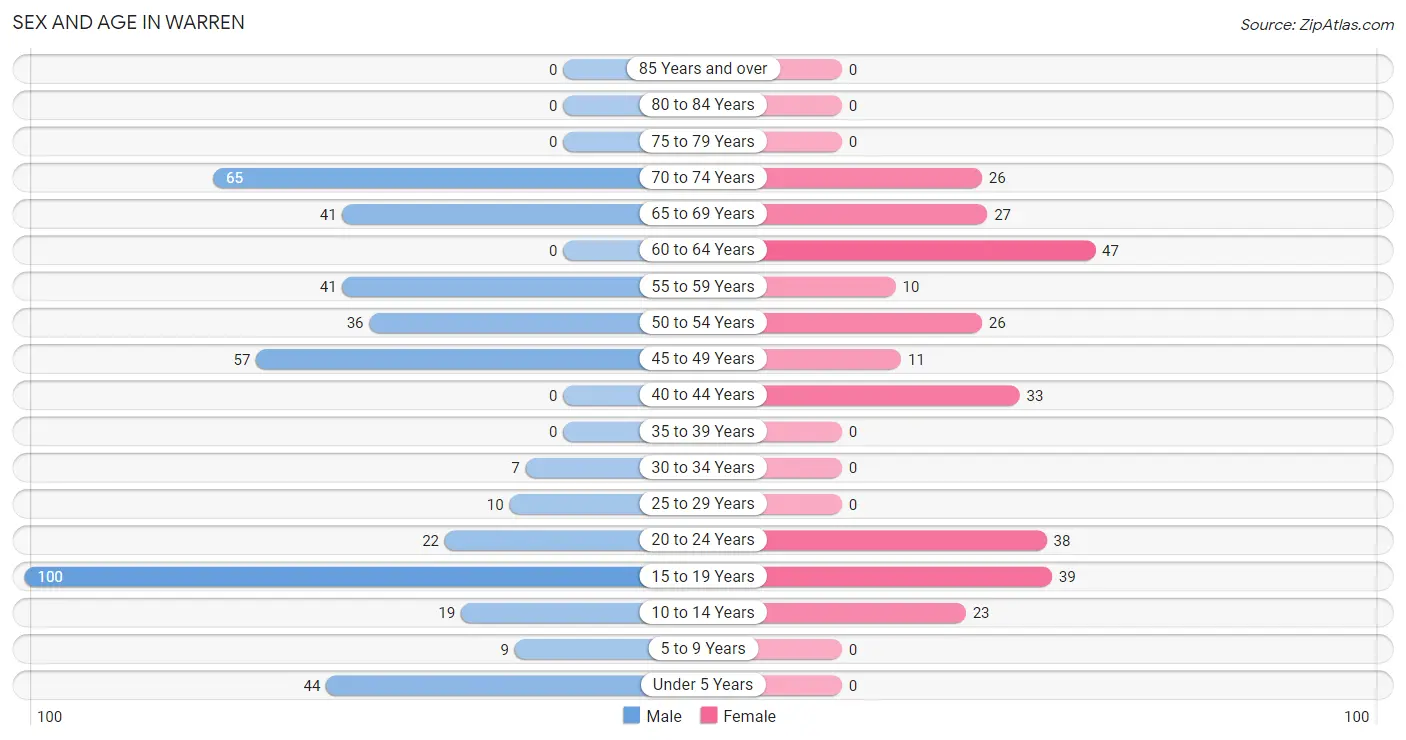
Sex and Age in Warren
The most populous age groups in Warren are 15 to 19 Years (100 | 22.2%) for men and 60 to 64 Years (47 | 16.8%) for women.
| Age Bracket | Male | Female |
| Under 5 Years | 44 (9.8%) | 0 (0.0%) |
| 5 to 9 Years | 9 (2.0%) | 0 (0.0%) |
| 10 to 14 Years | 19 (4.2%) | 23 (8.2%) |
| 15 to 19 Years | 100 (22.2%) | 39 (13.9%) |
| 20 to 24 Years | 22 (4.9%) | 38 (13.6%) |
| 25 to 29 Years | 10 (2.2%) | 0 (0.0%) |
| 30 to 34 Years | 7 (1.5%) | 0 (0.0%) |
| 35 to 39 Years | 0 (0.0%) | 0 (0.0%) |
| 40 to 44 Years | 0 (0.0%) | 33 (11.8%) |
| 45 to 49 Years | 57 (12.6%) | 11 (3.9%) |
| 50 to 54 Years | 36 (8.0%) | 26 (9.3%) |
| 55 to 59 Years | 41 (9.1%) | 10 (3.6%) |
| 60 to 64 Years | 0 (0.0%) | 47 (16.8%) |
| 65 to 69 Years | 41 (9.1%) | 27 (9.6%) |
| 70 to 74 Years | 65 (14.4%) | 26 (9.3%) |
| 75 to 79 Years | 0 (0.0%) | 0 (0.0%) |
| 80 to 84 Years | 0 (0.0%) | 0 (0.0%) |
| 85 Years and over | 0 (0.0%) | 0 (0.0%) |
| Total | 451 (100.0%) | 280 (100.0%) |
Families and Households in Warren
Median Family Size in Warren
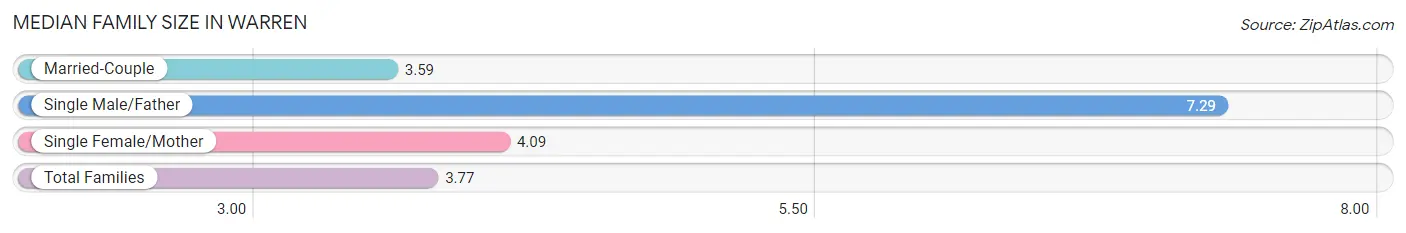
The median family size in Warren is 3.77 persons per family, with single male/father families (7 | 4.0%) accounting for the largest median family size of 7.29 persons per family. On the other hand, married-couple families (157 | 89.7%) represent the smallest median family size with 3.59 persons per family.
| Family Type | # Families | Family Size |
| Married-Couple | 157 (89.7%) | 3.59 |
| Single Male/Father | 7 (4.0%) | 7.29 |
| Single Female/Mother | 11 (6.3%) | 4.09 |
| Total Families | 175 (100.0%) | 3.77 |
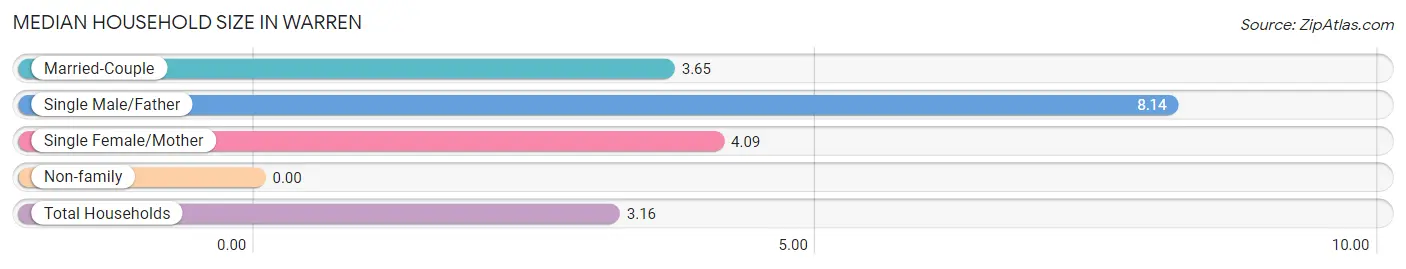
Median Household Size in Warren
| Household Type | # Households | Household Size |
| Married-Couple | 157 (68.0%) | 3.65 |
| Single Male/Father | 7 (3.0%) | 8.14 |
| Single Female/Mother | 11 (4.8%) | 4.09 |
| Non-family | 56 (24.2%) | - |
| Total Households | 231 (100.0%) | 3.16 |
Household Size by Marriage Status in Warren
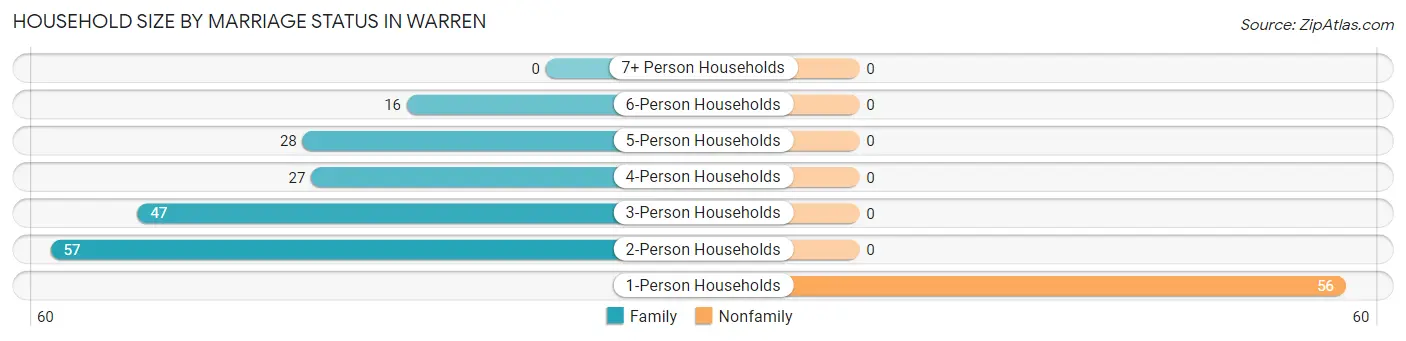
Out of a total of 231 households in Warren, 175 (75.8%) are family households, while 56 (24.2%) are nonfamily households. The most numerous type of family households are 2-person households, comprising 57, and the most common type of nonfamily households are 1-person households, comprising 56.
| Household Size | Family Households | Nonfamily Households |
| 1-Person Households | - | 56 (24.2%) |
| 2-Person Households | 57 (24.7%) | 0 (0.0%) |
| 3-Person Households | 47 (20.3%) | 0 (0.0%) |
| 4-Person Households | 27 (11.7%) | 0 (0.0%) |
| 5-Person Households | 28 (12.1%) | 0 (0.0%) |
| 6-Person Households | 16 (6.9%) | 0 (0.0%) |
| 7+ Person Households | 0 (0.0%) | 0 (0.0%) |
| Total | 175 (75.8%) | 56 (24.2%) |
Female Fertility in Warren
Fertility by Age in Warren
| Age Bracket | Women with Births | Births / 1,000 Women |
| 15 to 19 years | 0 (0.0%) | 0.0 |
| 20 to 34 years | 0 (0.0%) | 0.0 |
| 35 to 50 years | 0 (0.0%) | 0.0 |
| Total | 0 (0.0%) | 0.0 |
Fertility by Age by Marriage Status in Warren
| Age Bracket | Married | Unmarried |
| 15 to 19 years | 0 (0.0%) | 0 (0.0%) |
| 20 to 34 years | 0 (0.0%) | 0 (0.0%) |
| 35 to 50 years | 0 (0.0%) | 0 (0.0%) |
| Total | 0 (0.0%) | 0 (0.0%) |
Fertility by Education in Warren
| Educational Attainment | Women with Births | Births / 1,000 Women |
| Less than High School | 0 (0.0%) | 0.0 |
| High School Diploma | 0 (0.0%) | 0.0 |
| College or Associate's Degree | 0 (0.0%) | 0.0 |
| Bachelor's Degree | 0 (0.0%) | 0.0 |
| Graduate Degree | 0 (0.0%) | 0.0 |
| Total | 0 (0.0%) | 0.0 |
Fertility by Education by Marriage Status in Warren
| Educational Attainment | Married | Unmarried |
| Less than High School | 0 (0.0%) | 0 (0.0%) |
| High School Diploma | 0 (0.0%) | 0 (0.0%) |
| College or Associate's Degree | 0 (0.0%) | 0 (0.0%) |
| Bachelor's Degree | 0 (0.0%) | 0 (0.0%) |
| Graduate Degree | 0 (0.0%) | 0 (0.0%) |
| Total | 0 (0.0%) | 0 (0.0%) |
Employment Characteristics in Warren
Employment by Class of Employer in Warren
Among the 266 employed individuals in Warren, private company employees (144 | 54.1%), local government employees (52 | 19.6%), and not-for-profit organizations (42 | 15.8%) make up the most common classes of employment.
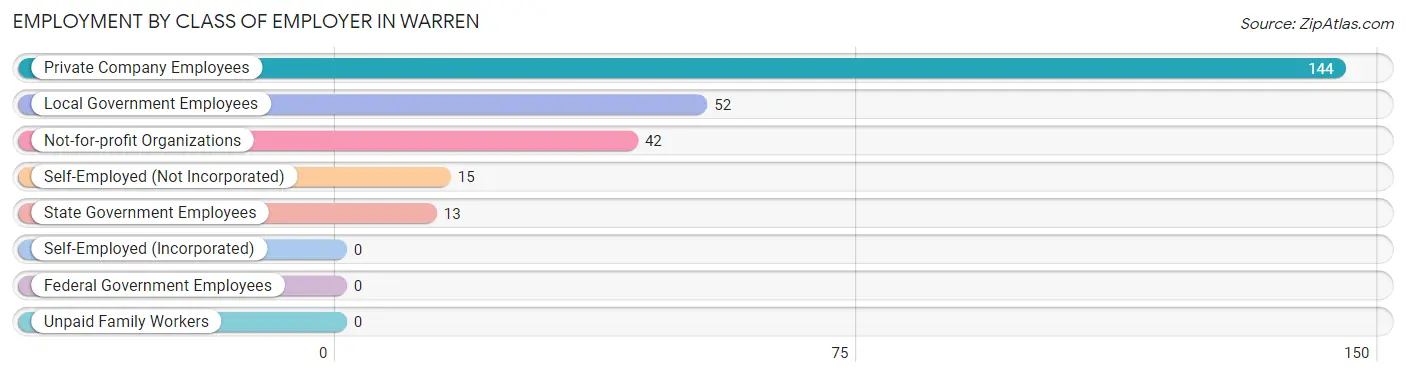
| Employer Class | # Employees | % Employees |
| Private Company Employees | 144 | 54.1% |
| Self-Employed (Incorporated) | 0 | 0.0% |
| Self-Employed (Not Incorporated) | 15 | 5.6% |
| Not-for-profit Organizations | 42 | 15.8% |
| Local Government Employees | 52 | 19.6% |
| State Government Employees | 13 | 4.9% |
| Federal Government Employees | 0 | 0.0% |
| Unpaid Family Workers | 0 | 0.0% |
| Total | 266 | 100.0% |
Employment Status by Age in Warren
According to the labor force statistics for Warren, out of the total population over 16 years of age (636), 48.0% or 305 individuals are in the labor force, with 12.8% or 39 of them unemployed. The age group with the highest labor force participation rate is 25 to 29 years, with 100.0% or 10 individuals in the labor force. Within the labor force, the 20 to 24 years age range has the highest percentage of unemployed individuals, with 71.0% or 22 of them being unemployed.
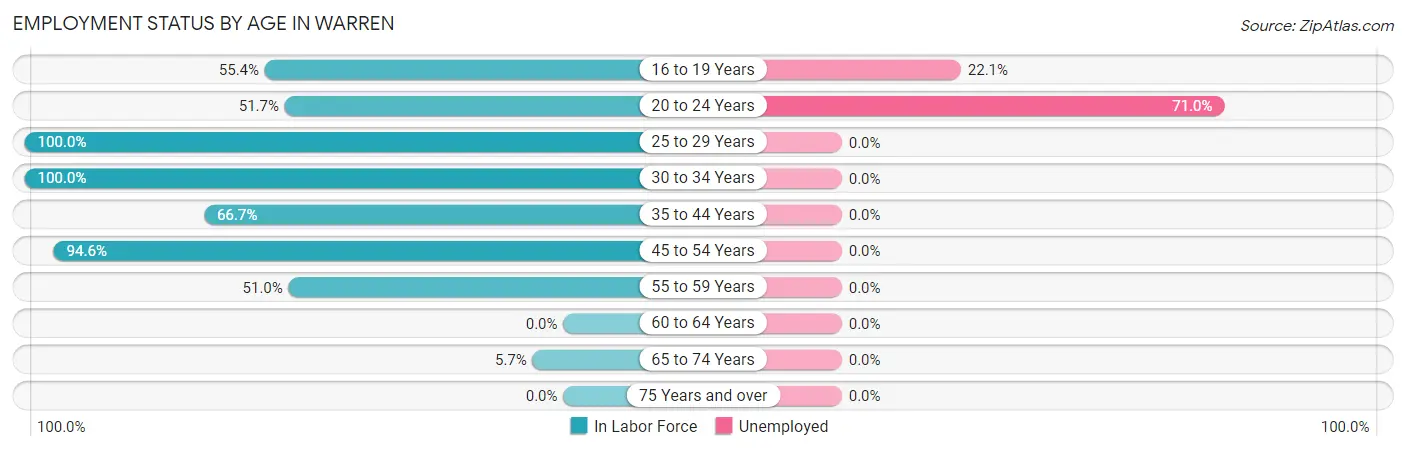
| Age Bracket | In Labor Force | Unemployed |
| 16 to 19 Years | 77 (55.4%) | 17 (22.1%) |
| 20 to 24 Years | 31 (51.7%) | 22 (71.0%) |
| 25 to 29 Years | 10 (100.0%) | 0 (0.0%) |
| 30 to 34 Years | 7 (100.0%) | 0 (0.0%) |
| 35 to 44 Years | 22 (66.7%) | 0 (0.0%) |
| 45 to 54 Years | 123 (94.6%) | 0 (0.0%) |
| 55 to 59 Years | 26 (51.0%) | 0 (0.0%) |
| 60 to 64 Years | 0 (0.0%) | 0 (0.0%) |
| 65 to 74 Years | 9 (5.7%) | 0 (0.0%) |
| 75 Years and over | 0 (0.0%) | 0 (0.0%) |
| Total | 305 (48.0%) | 39 (12.8%) |
Employment Status by Educational Attainment in Warren
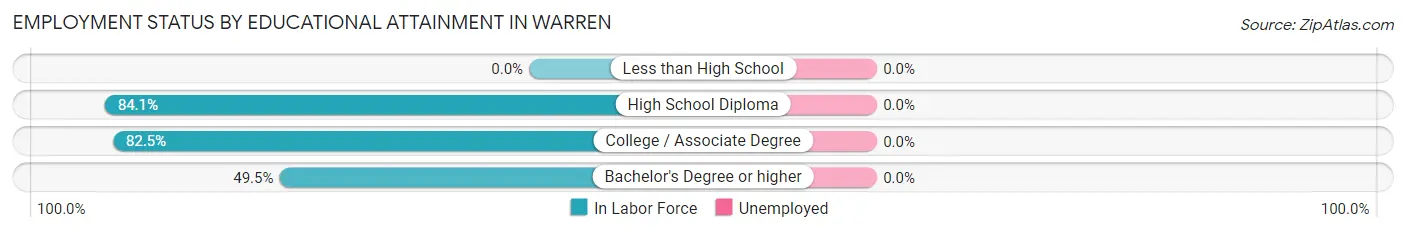
| Educational Attainment | In Labor Force | Unemployed |
| Less than High School | 0 (0.0%) | 0 (0.0%) |
| High School Diploma | 90 (84.1%) | 0 (0.0%) |
| College / Associate Degree | 47 (82.5%) | 0 (0.0%) |
| Bachelor's Degree or higher | 51 (49.5%) | 0 (0.0%) |
| Total | 188 (67.6%) | 0 (0.0%) |
Employment Occupations by Sex in Warren
Management, Business, Science and Arts Occupations
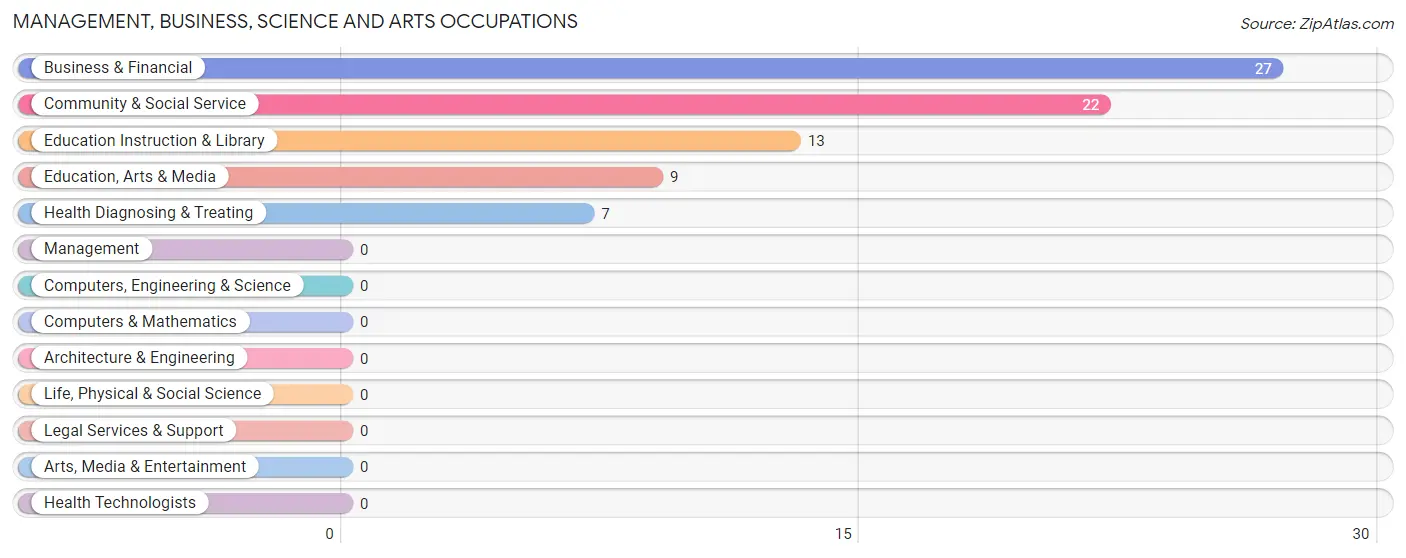
The most common Management, Business, Science and Arts occupations in Warren are Business & Financial (27 | 10.2%), Community & Social Service (22 | 8.3%), Education Instruction & Library (13 | 4.9%), Education, Arts & Media (9 | 3.4%), and Health Diagnosing & Treating (7 | 2.6%).
Management, Business, Science and Arts Occupations by Sex
Within the Management, Business, Science and Arts occupations in Warren, the most male-oriented occupations are Education, Arts & Media (100.0%), Health Diagnosing & Treating (100.0%), and Business & Financial (59.3%), while the most female-oriented occupations are Education Instruction & Library (100.0%), Community & Social Service (59.1%), and Business & Financial (40.7%).
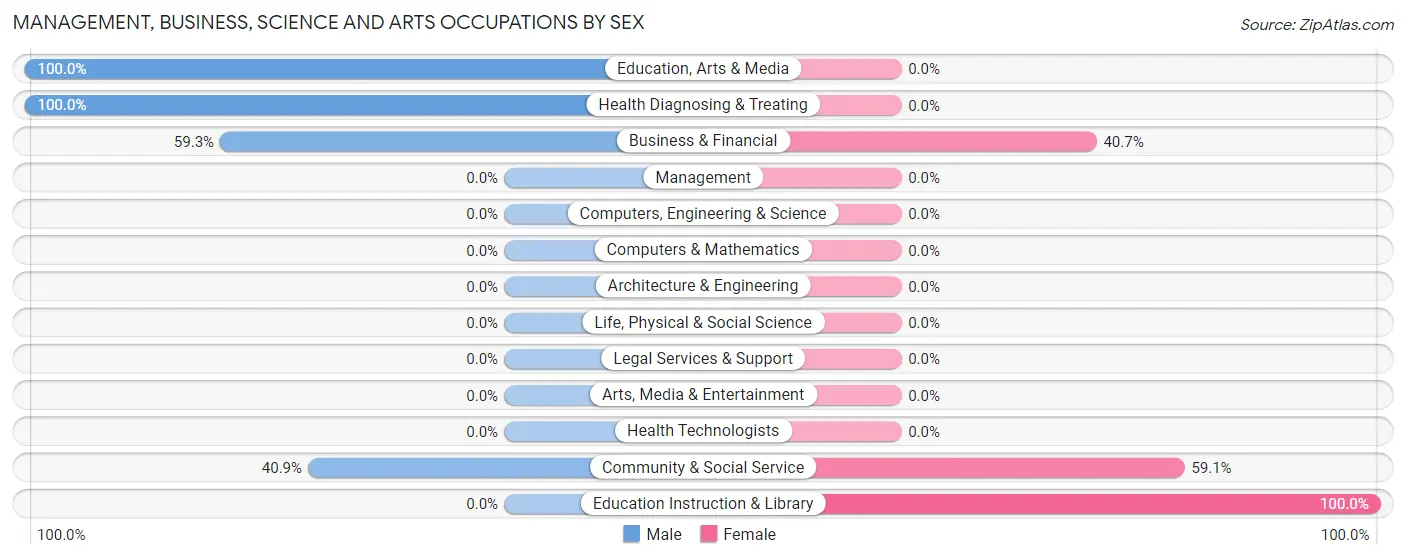
| Occupation | Male | Female |
| Management | 0 (0.0%) | 0 (0.0%) |
| Business & Financial | 16 (59.3%) | 11 (40.7%) |
| Computers, Engineering & Science | 0 (0.0%) | 0 (0.0%) |
| Computers & Mathematics | 0 (0.0%) | 0 (0.0%) |
| Architecture & Engineering | 0 (0.0%) | 0 (0.0%) |
| Life, Physical & Social Science | 0 (0.0%) | 0 (0.0%) |
| Community & Social Service | 9 (40.9%) | 13 (59.1%) |
| Education, Arts & Media | 9 (100.0%) | 0 (0.0%) |
| Legal Services & Support | 0 (0.0%) | 0 (0.0%) |
| Education Instruction & Library | 0 (0.0%) | 13 (100.0%) |
| Arts, Media & Entertainment | 0 (0.0%) | 0 (0.0%) |
| Health Diagnosing & Treating | 7 (100.0%) | 0 (0.0%) |
| Health Technologists | 0 (0.0%) | 0 (0.0%) |
| Total (Category) | 32 (57.1%) | 24 (42.9%) |
| Total (Overall) | 176 (66.2%) | 90 (33.8%) |
Services Occupations
The most common Services occupations in Warren are Security & Protection (28 | 10.5%), Firefighting & Prevention (28 | 10.5%), Food Preparation & Serving (23 | 8.6%), and Personal Care & Service (15 | 5.6%).
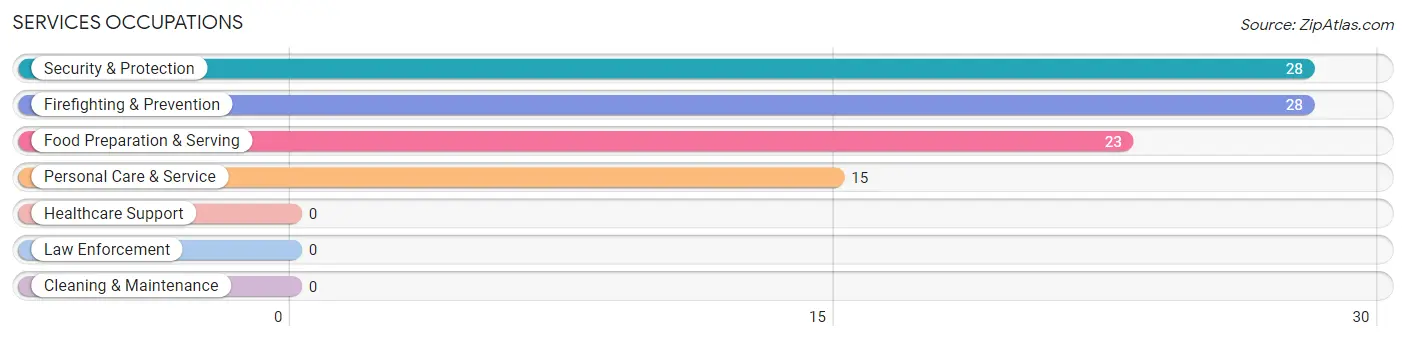
Services Occupations by Sex
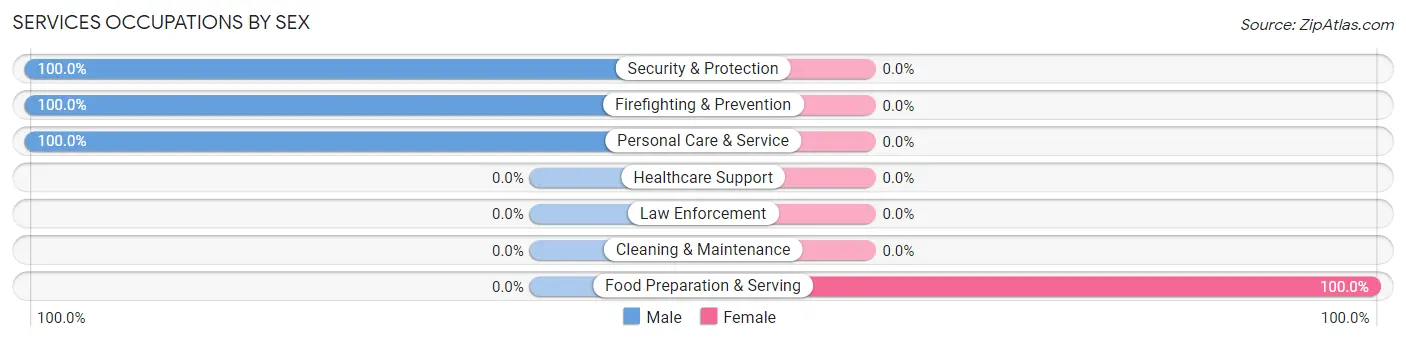
| Occupation | Male | Female |
| Healthcare Support | 0 (0.0%) | 0 (0.0%) |
| Security & Protection | 28 (100.0%) | 0 (0.0%) |
| Firefighting & Prevention | 28 (100.0%) | 0 (0.0%) |
| Law Enforcement | 0 (0.0%) | 0 (0.0%) |
| Food Preparation & Serving | 0 (0.0%) | 23 (100.0%) |
| Cleaning & Maintenance | 0 (0.0%) | 0 (0.0%) |
| Personal Care & Service | 15 (100.0%) | 0 (0.0%) |
| Total (Category) | 43 (65.1%) | 23 (34.8%) |
| Total (Overall) | 176 (66.2%) | 90 (33.8%) |
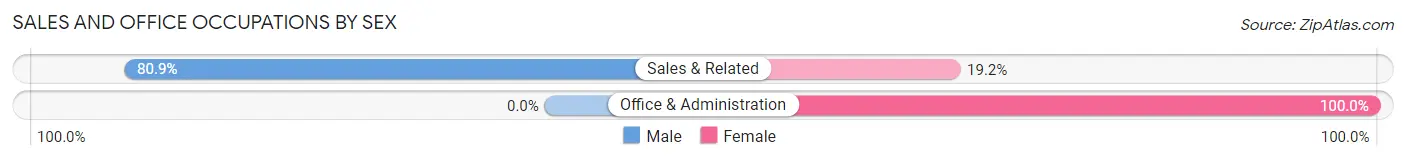
Sales and Office Occupations
The most common Sales and Office occupations in Warren are Sales & Related (47 | 17.7%), and Office & Administration (24 | 9.0%).
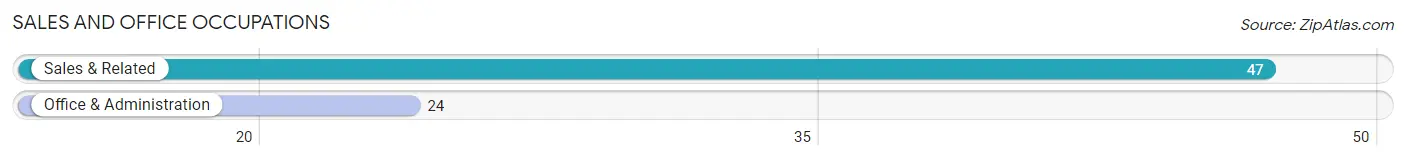
Sales and Office Occupations by Sex
| Occupation | Male | Female |
| Sales & Related | 38 (80.8%) | 9 (19.2%) |
| Office & Administration | 0 (0.0%) | 24 (100.0%) |
| Total (Category) | 38 (53.5%) | 33 (46.5%) |
| Total (Overall) | 176 (66.2%) | 90 (33.8%) |
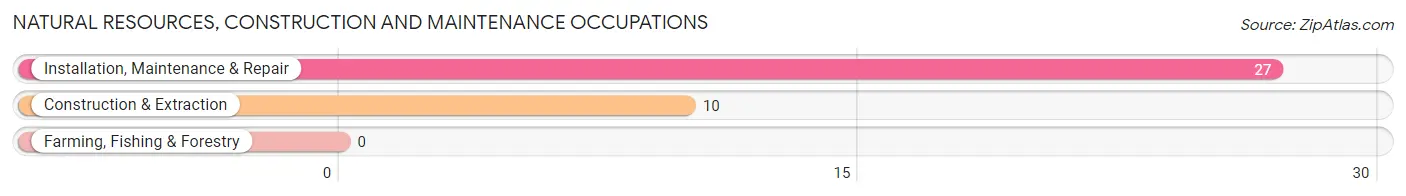
Natural Resources, Construction and Maintenance Occupations
The most common Natural Resources, Construction and Maintenance occupations in Warren are Installation, Maintenance & Repair (27 | 10.2%), and Construction & Extraction (10 | 3.8%).
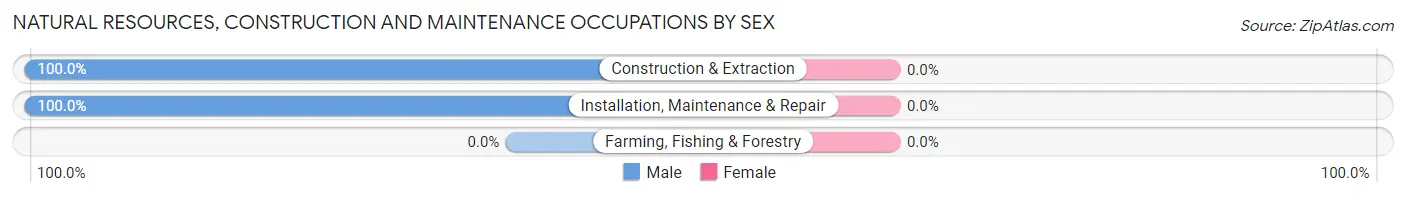
Natural Resources, Construction and Maintenance Occupations by Sex
| Occupation | Male | Female |
| Farming, Fishing & Forestry | 0 (0.0%) | 0 (0.0%) |
| Construction & Extraction | 10 (100.0%) | 0 (0.0%) |
| Installation, Maintenance & Repair | 27 (100.0%) | 0 (0.0%) |
| Total (Category) | 37 (100.0%) | 0 (0.0%) |
| Total (Overall) | 176 (66.2%) | 90 (33.8%) |
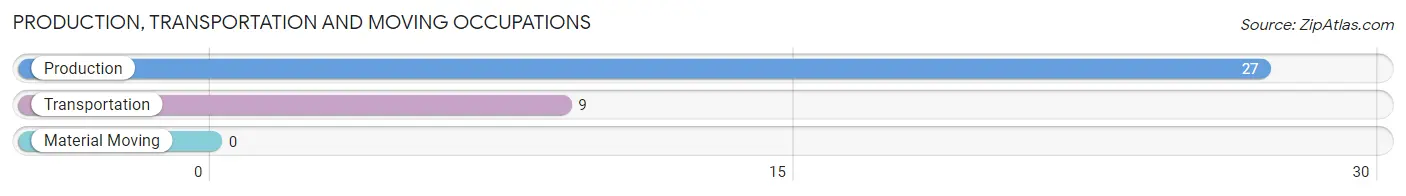
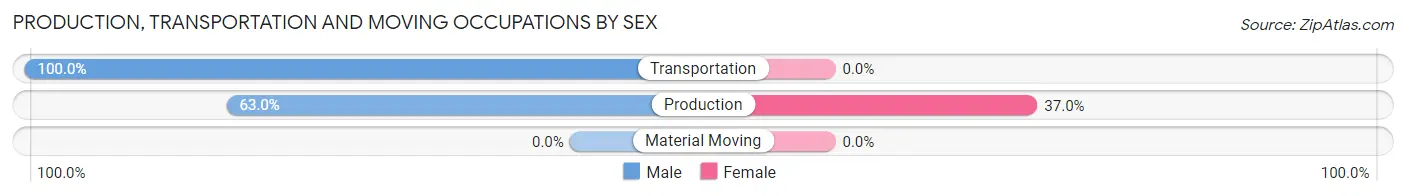
Production, Transportation and Moving Occupations
The most common Production, Transportation and Moving occupations in Warren are Production (27 | 10.2%), and Transportation (9 | 3.4%).
Production, Transportation and Moving Occupations by Sex
| Occupation | Male | Female |
| Production | 17 (63.0%) | 10 (37.0%) |
| Transportation | 9 (100.0%) | 0 (0.0%) |
| Material Moving | 0 (0.0%) | 0 (0.0%) |
| Total (Category) | 26 (72.2%) | 10 (27.8%) |
| Total (Overall) | 176 (66.2%) | 90 (33.8%) |
Employment Industries by Sex in Warren
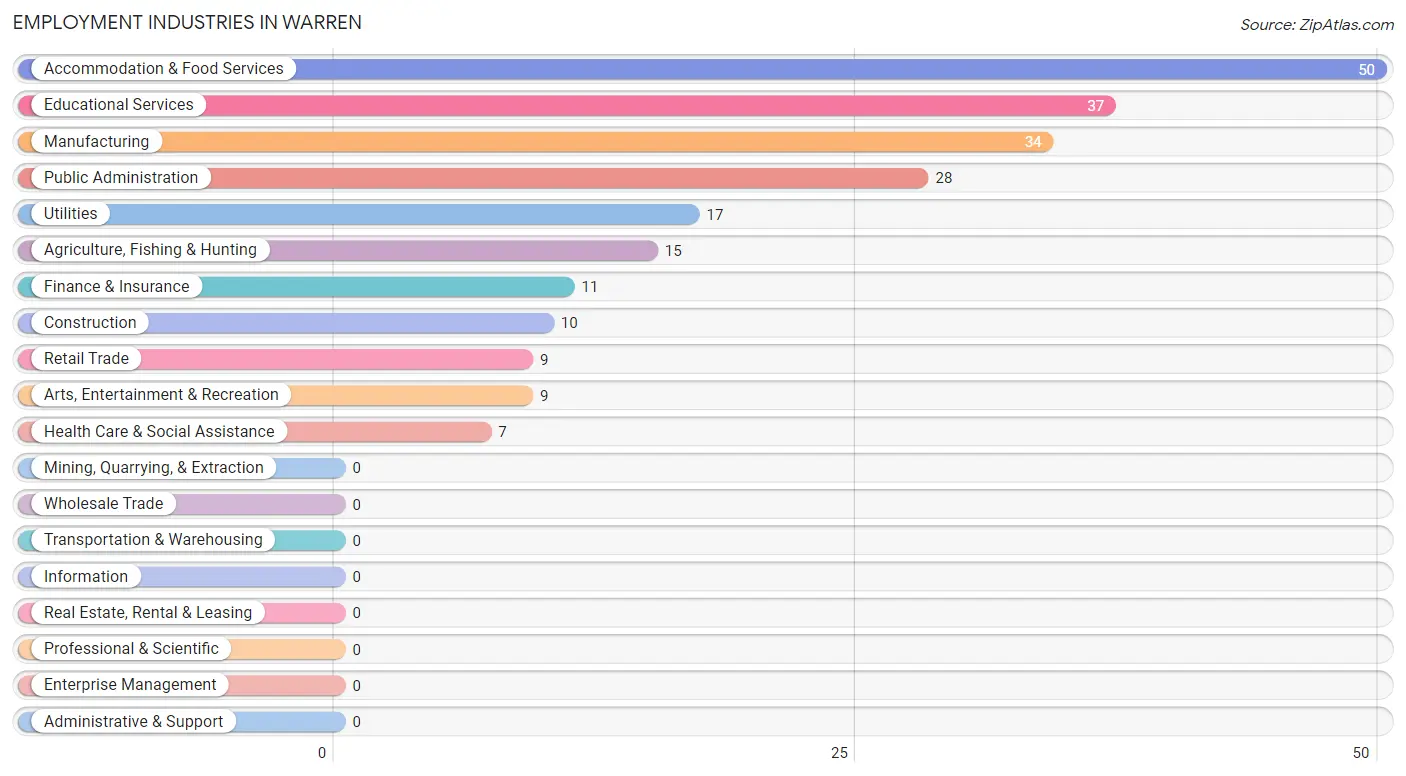
Employment Industries in Warren
The major employment industries in Warren include Accommodation & Food Services (50 | 18.8%), Educational Services (37 | 13.9%), Manufacturing (34 | 12.8%), Public Administration (28 | 10.5%), and Utilities (17 | 6.4%).
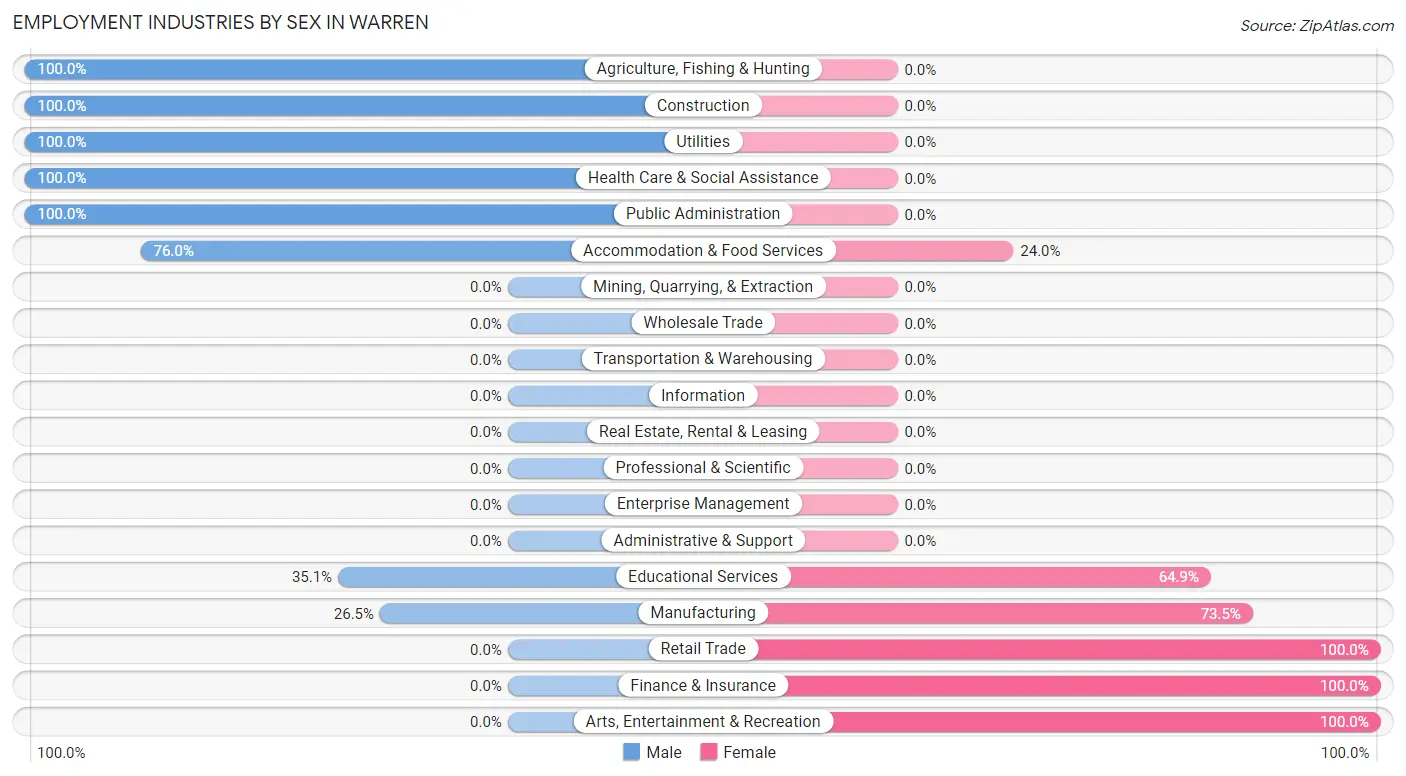
Employment Industries by Sex in Warren
The Warren industries that see more men than women are Agriculture, Fishing & Hunting (100.0%), Construction (100.0%), and Utilities (100.0%), whereas the industries that tend to have a higher number of women are Retail Trade (100.0%), Finance & Insurance (100.0%), and Arts, Entertainment & Recreation (100.0%).
| Industry | Male | Female |
| Agriculture, Fishing & Hunting | 15 (100.0%) | 0 (0.0%) |
| Mining, Quarrying, & Extraction | 0 (0.0%) | 0 (0.0%) |
| Construction | 10 (100.0%) | 0 (0.0%) |
| Manufacturing | 9 (26.5%) | 25 (73.5%) |
| Wholesale Trade | 0 (0.0%) | 0 (0.0%) |
| Retail Trade | 0 (0.0%) | 9 (100.0%) |
| Transportation & Warehousing | 0 (0.0%) | 0 (0.0%) |
| Utilities | 17 (100.0%) | 0 (0.0%) |
| Information | 0 (0.0%) | 0 (0.0%) |
| Finance & Insurance | 0 (0.0%) | 11 (100.0%) |
| Real Estate, Rental & Leasing | 0 (0.0%) | 0 (0.0%) |
| Professional & Scientific | 0 (0.0%) | 0 (0.0%) |
| Enterprise Management | 0 (0.0%) | 0 (0.0%) |
| Administrative & Support | 0 (0.0%) | 0 (0.0%) |
| Educational Services | 13 (35.1%) | 24 (64.9%) |
| Health Care & Social Assistance | 7 (100.0%) | 0 (0.0%) |
| Arts, Entertainment & Recreation | 0 (0.0%) | 9 (100.0%) |
| Accommodation & Food Services | 38 (76.0%) | 12 (24.0%) |
| Public Administration | 28 (100.0%) | 0 (0.0%) |
| Total | 176 (66.2%) | 90 (33.8%) |
Education in Warren
School Enrollment in Warren
The most common levels of schooling among the 191 students in Warren are high school (78 | 40.8%), middle school (42 | 22.0%), and college / undergraduate (39 | 20.4%).
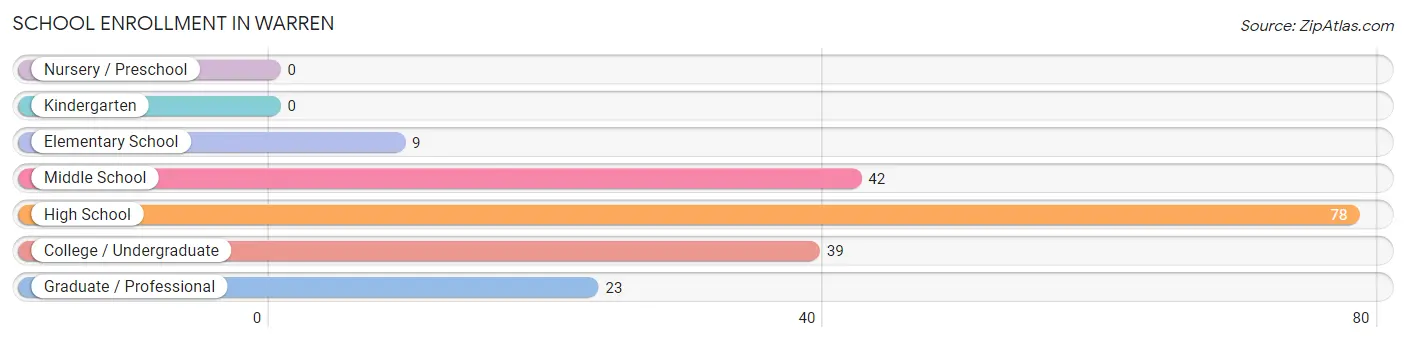
| School Level | # Students | % Students |
| Nursery / Preschool | 0 | 0.0% |
| Kindergarten | 0 | 0.0% |
| Elementary School | 9 | 4.7% |
| Middle School | 42 | 22.0% |
| High School | 78 | 40.8% |
| College / Undergraduate | 39 | 20.4% |
| Graduate / Professional | 23 | 12.0% |
| Total | 191 | 100.0% |
School Enrollment by Age by Funding Source in Warren
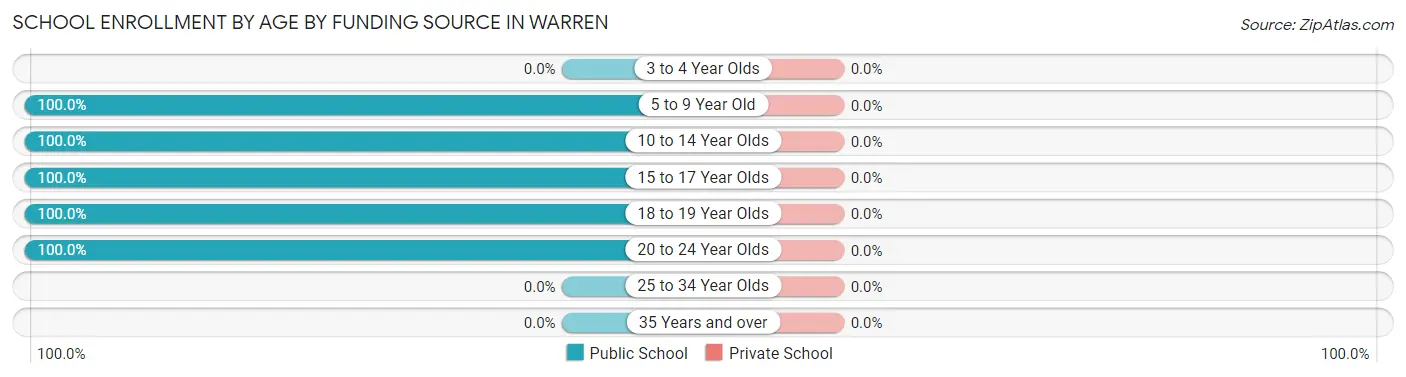
| Age Bracket | Public School | Private School |
| 3 to 4 Year Olds | 0 (0.0%) | 0 (0.0%) |
| 5 to 9 Year Old | 9 (100.0%) | 0 (0.0%) |
| 10 to 14 Year Olds | 42 (100.0%) | 0 (0.0%) |
| 15 to 17 Year Olds | 78 (100.0%) | 0 (0.0%) |
| 18 to 19 Year Olds | 17 (100.0%) | 0 (0.0%) |
| 20 to 24 Year Olds | 45 (100.0%) | 0 (0.0%) |
| 25 to 34 Year Olds | 0 (0.0%) | 0 (0.0%) |
| 35 Years and over | 0 (0.0%) | 0 (0.0%) |
| Total | 191 (100.0%) | 0 (0.0%) |
Educational Attainment by Field of Study in Warren
Education (39 | 28.3%), business (37 | 26.8%), computers & mathematics (25 | 18.1%), bio, nature & agricultural (15 | 10.9%), and arts & humanities (15 | 10.9%) are the most common fields of study among 138 individuals in Warren who have obtained a bachelor's degree or higher.
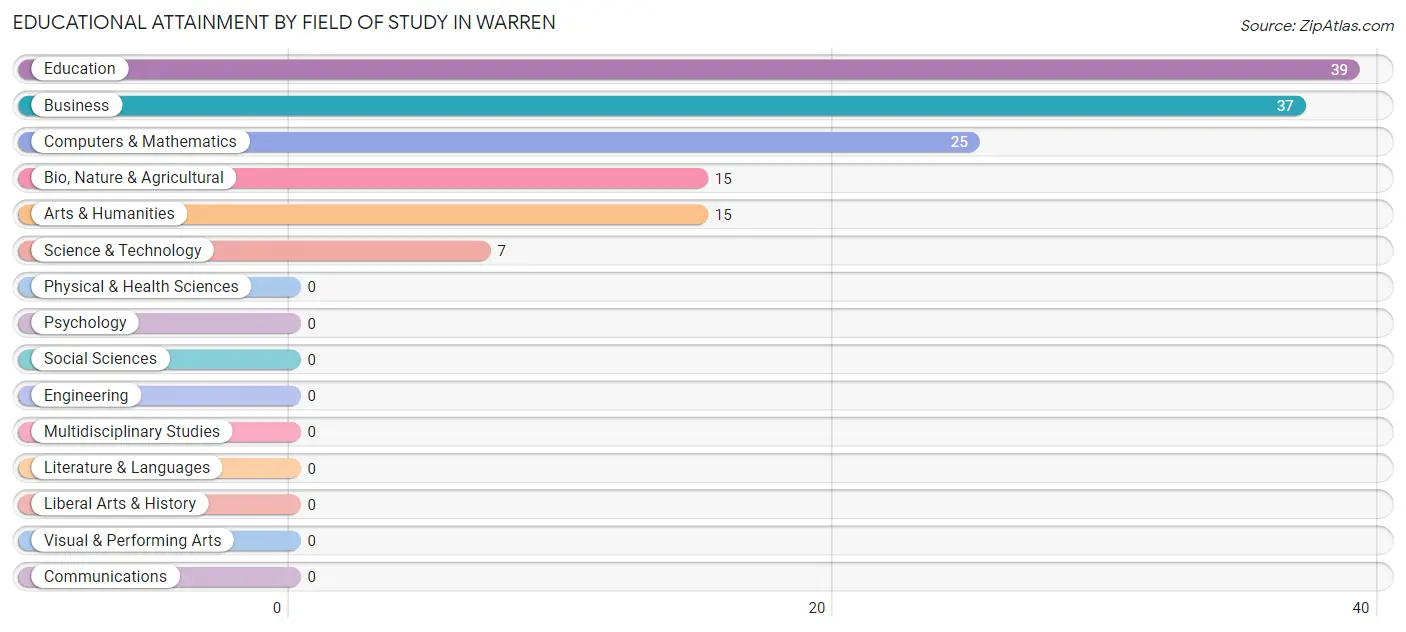
| Field of Study | # Graduates | % Graduates |
| Computers & Mathematics | 25 | 18.1% |
| Bio, Nature & Agricultural | 15 | 10.9% |
| Physical & Health Sciences | 0 | 0.0% |
| Psychology | 0 | 0.0% |
| Social Sciences | 0 | 0.0% |
| Engineering | 0 | 0.0% |
| Multidisciplinary Studies | 0 | 0.0% |
| Science & Technology | 7 | 5.1% |
| Business | 37 | 26.8% |
| Education | 39 | 28.3% |
| Literature & Languages | 0 | 0.0% |
| Liberal Arts & History | 0 | 0.0% |
| Visual & Performing Arts | 0 | 0.0% |
| Communications | 0 | 0.0% |
| Arts & Humanities | 15 | 10.9% |
| Total | 138 | 100.0% |
Transportation & Commute in Warren
Vehicle Availability by Sex in Warren
The most prevalent vehicle ownership categories in Warren are males with 4 vehicles (66, accounting for 37.5%) and females with 4 vehicles (26, making up 73.3%).
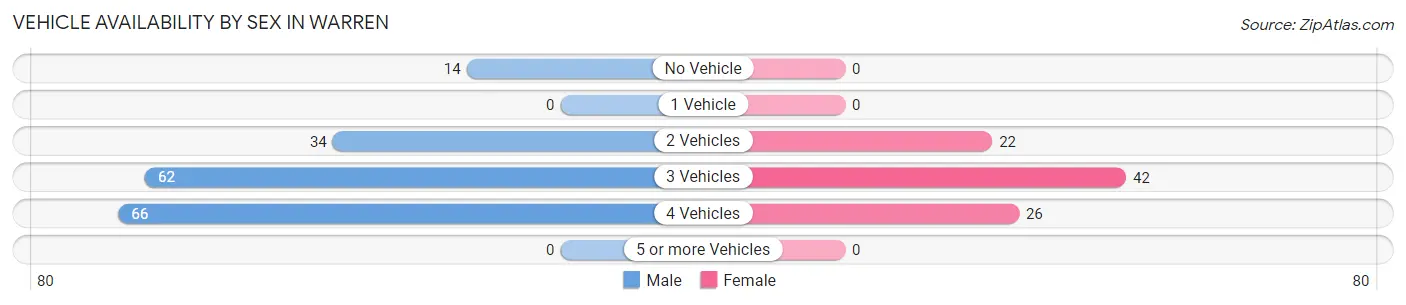
| Vehicles Available | Male | Female |
| No Vehicle | 14 (8.0%) | 0 (0.0%) |
| 1 Vehicle | 0 (0.0%) | 0 (0.0%) |
| 2 Vehicles | 34 (19.3%) | 22 (24.4%) |
| 3 Vehicles | 62 (35.2%) | 42 (46.7%) |
| 4 Vehicles | 66 (37.5%) | 26 (28.9%) |
| 5 or more Vehicles | 0 (0.0%) | 0 (0.0%) |
| Total | 176 (100.0%) | 90 (100.0%) |
Commute Time in Warren
The most frequently occuring commute durations in Warren are 60 to 89 minutes (65 commuters, 28.5%), 45 to 59 minutes (45 commuters, 19.7%), and 15 to 19 minutes (31 commuters, 13.6%).
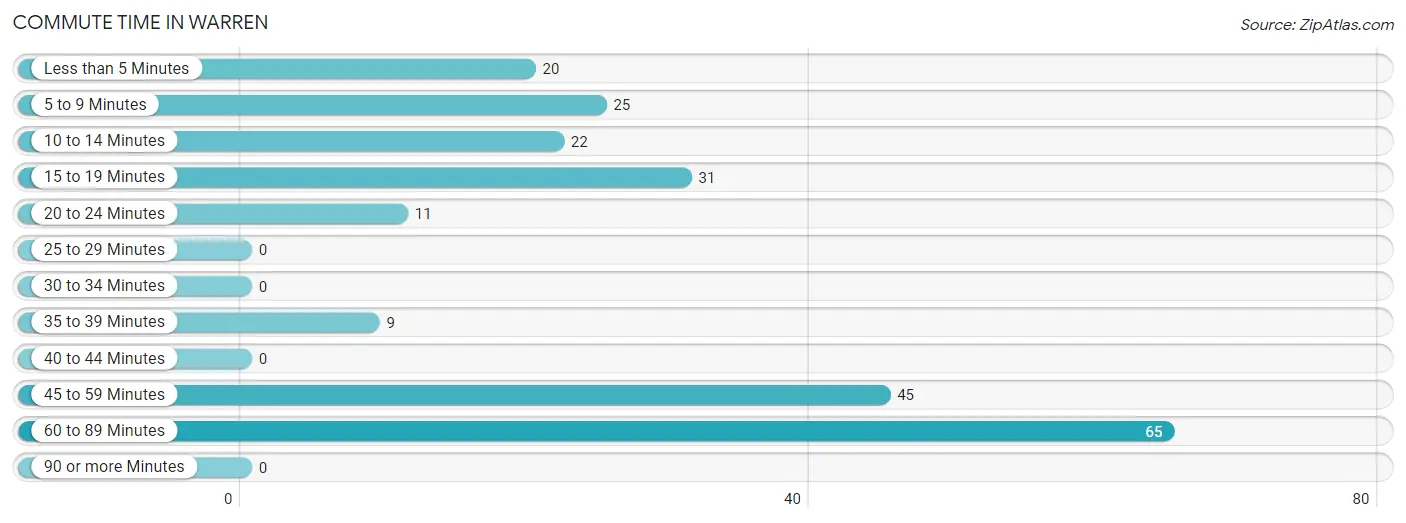
| Commute Time | # Commuters | % Commuters |
| Less than 5 Minutes | 20 | 8.8% |
| 5 to 9 Minutes | 25 | 11.0% |
| 10 to 14 Minutes | 22 | 9.7% |
| 15 to 19 Minutes | 31 | 13.6% |
| 20 to 24 Minutes | 11 | 4.8% |
| 25 to 29 Minutes | 0 | 0.0% |
| 30 to 34 Minutes | 0 | 0.0% |
| 35 to 39 Minutes | 9 | 4.0% |
| 40 to 44 Minutes | 0 | 0.0% |
| 45 to 59 Minutes | 45 | 19.7% |
| 60 to 89 Minutes | 65 | 28.5% |
| 90 or more Minutes | 0 | 0.0% |
Commute Time by Sex in Warren
The most common commute times in Warren are 60 to 89 minutes (50 commuters, 36.2%) for males and 15 to 19 minutes (31 commuters, 34.4%) for females.
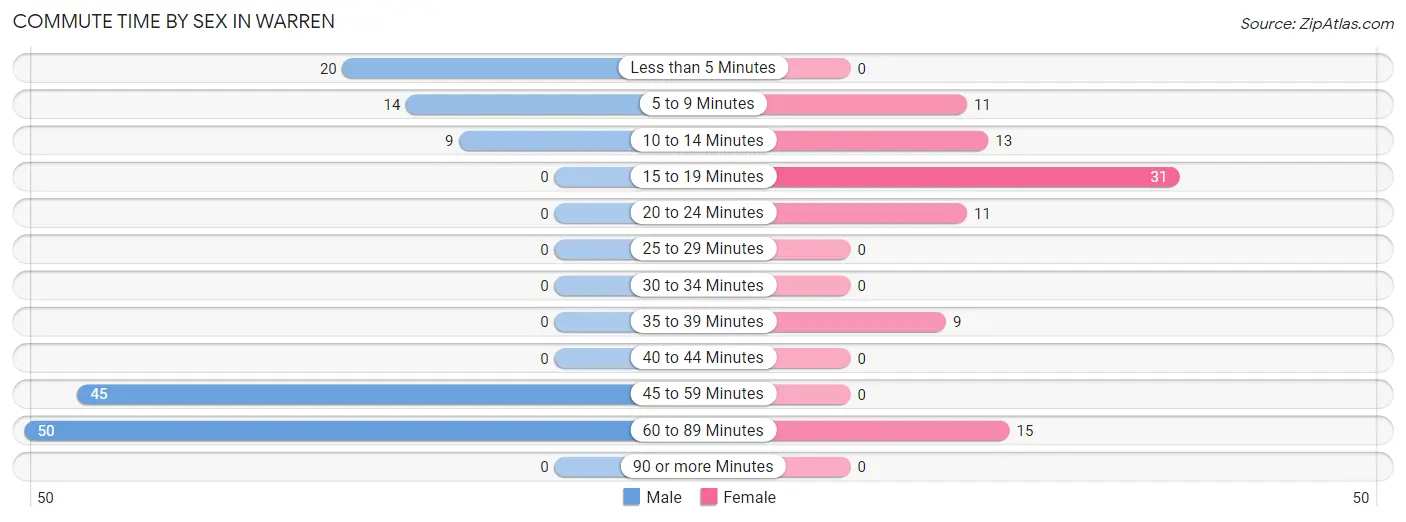
| Commute Time | Male | Female |
| Less than 5 Minutes | 20 (14.5%) | 0 (0.0%) |
| 5 to 9 Minutes | 14 (10.1%) | 11 (12.2%) |
| 10 to 14 Minutes | 9 (6.5%) | 13 (14.4%) |
| 15 to 19 Minutes | 0 (0.0%) | 31 (34.4%) |
| 20 to 24 Minutes | 0 (0.0%) | 11 (12.2%) |
| 25 to 29 Minutes | 0 (0.0%) | 0 (0.0%) |
| 30 to 34 Minutes | 0 (0.0%) | 0 (0.0%) |
| 35 to 39 Minutes | 0 (0.0%) | 9 (10.0%) |
| 40 to 44 Minutes | 0 (0.0%) | 0 (0.0%) |
| 45 to 59 Minutes | 45 (32.6%) | 0 (0.0%) |
| 60 to 89 Minutes | 50 (36.2%) | 15 (16.7%) |
| 90 or more Minutes | 0 (0.0%) | 0 (0.0%) |
Time of Departure to Work by Sex in Warren
The most frequent times of departure to work in Warren are 6:30 AM to 6:59 AM (88, 63.8%) for males and 7:00 AM to 7:29 AM (26, 28.9%) for females.
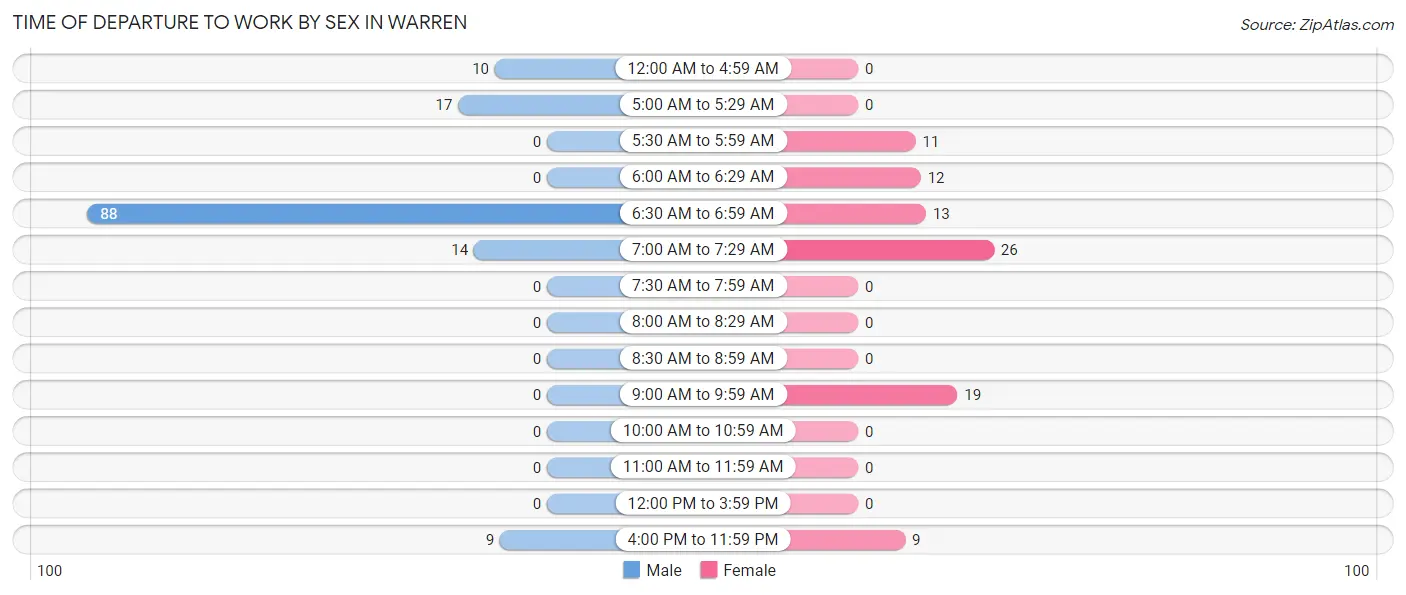
| Time of Departure | Male | Female |
| 12:00 AM to 4:59 AM | 10 (7.2%) | 0 (0.0%) |
| 5:00 AM to 5:29 AM | 17 (12.3%) | 0 (0.0%) |
| 5:30 AM to 5:59 AM | 0 (0.0%) | 11 (12.2%) |
| 6:00 AM to 6:29 AM | 0 (0.0%) | 12 (13.3%) |
| 6:30 AM to 6:59 AM | 88 (63.8%) | 13 (14.4%) |
| 7:00 AM to 7:29 AM | 14 (10.1%) | 26 (28.9%) |
| 7:30 AM to 7:59 AM | 0 (0.0%) | 0 (0.0%) |
| 8:00 AM to 8:29 AM | 0 (0.0%) | 0 (0.0%) |
| 8:30 AM to 8:59 AM | 0 (0.0%) | 0 (0.0%) |
| 9:00 AM to 9:59 AM | 0 (0.0%) | 19 (21.1%) |
| 10:00 AM to 10:59 AM | 0 (0.0%) | 0 (0.0%) |
| 11:00 AM to 11:59 AM | 0 (0.0%) | 0 (0.0%) |
| 12:00 PM to 3:59 PM | 0 (0.0%) | 0 (0.0%) |
| 4:00 PM to 11:59 PM | 9 (6.5%) | 9 (10.0%) |
| Total | 138 (100.0%) | 90 (100.0%) |
Housing Occupancy in Warren
Occupancy by Ownership in Warren
Of the total 231 dwellings in Warren, owner-occupied units account for 224 (97.0%), while renter-occupied units make up 7 (3.0%).
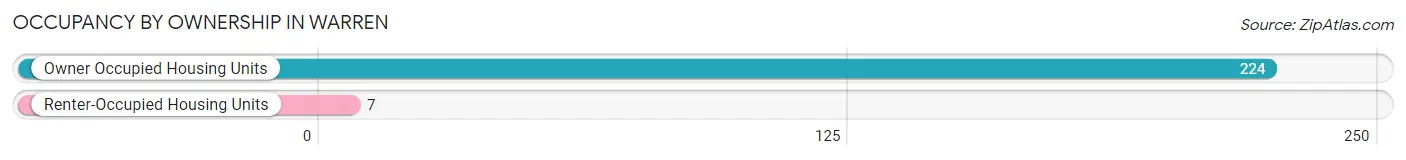
| Occupancy | # Housing Units | % Housing Units |
| Owner Occupied Housing Units | 224 | 97.0% |
| Renter-Occupied Housing Units | 7 | 3.0% |
| Total Occupied Housing Units | 231 | 100.0% |
Occupancy by Household Size in Warren
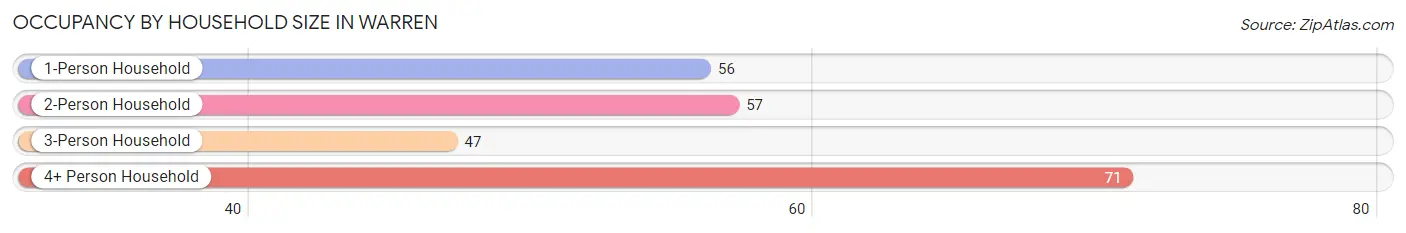
| Household Size | # Housing Units | % Housing Units |
| 1-Person Household | 56 | 24.2% |
| 2-Person Household | 57 | 24.7% |
| 3-Person Household | 47 | 20.3% |
| 4+ Person Household | 71 | 30.7% |
| Total Housing Units | 231 | 100.0% |
Occupancy by Ownership by Household Size in Warren
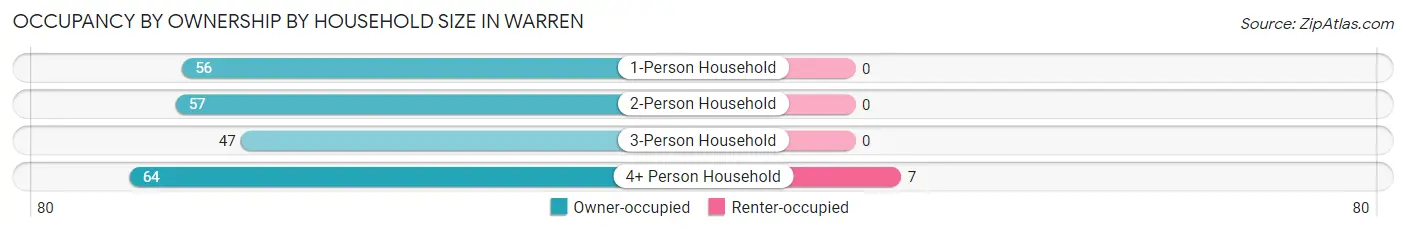
| Household Size | Owner-occupied | Renter-occupied |
| 1-Person Household | 56 (100.0%) | 0 (0.0%) |
| 2-Person Household | 57 (100.0%) | 0 (0.0%) |
| 3-Person Household | 47 (100.0%) | 0 (0.0%) |
| 4+ Person Household | 64 (90.1%) | 7 (9.9%) |
| Total Housing Units | 224 (97.0%) | 7 (3.0%) |
Occupancy by Educational Attainment in Warren
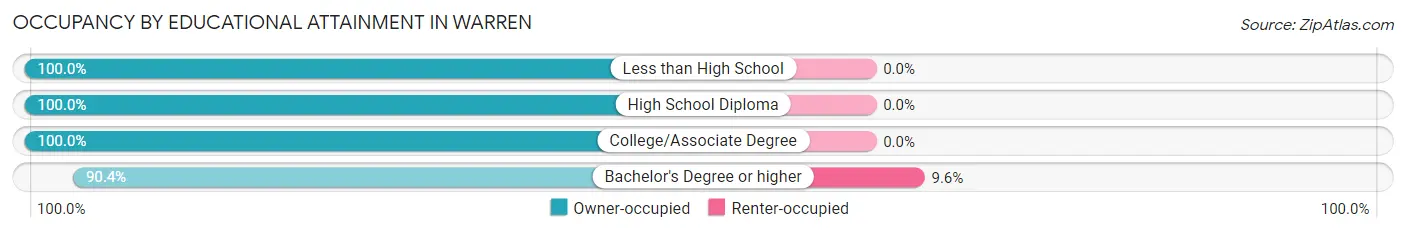
| Household Size | Owner-occupied | Renter-occupied |
| Less than High School | 11 (100.0%) | 0 (0.0%) |
| High School Diploma | 104 (100.0%) | 0 (0.0%) |
| College/Associate Degree | 43 (100.0%) | 0 (0.0%) |
| Bachelor's Degree or higher | 66 (90.4%) | 7 (9.6%) |
Occupancy by Age of Householder in Warren
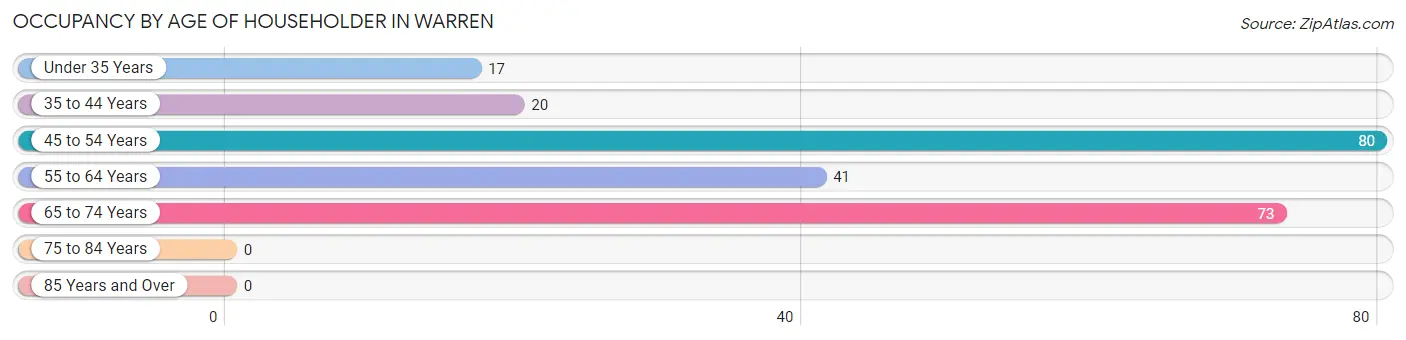
| Age Bracket | # Households | % Households |
| Under 35 Years | 17 | 7.4% |
| 35 to 44 Years | 20 | 8.7% |
| 45 to 54 Years | 80 | 34.6% |
| 55 to 64 Years | 41 | 17.7% |
| 65 to 74 Years | 73 | 31.6% |
| 75 to 84 Years | 0 | 0.0% |
| 85 Years and Over | 0 | 0.0% |
| Total | 231 | 100.0% |
Housing Finances in Warren
Median Income by Occupancy in Warren
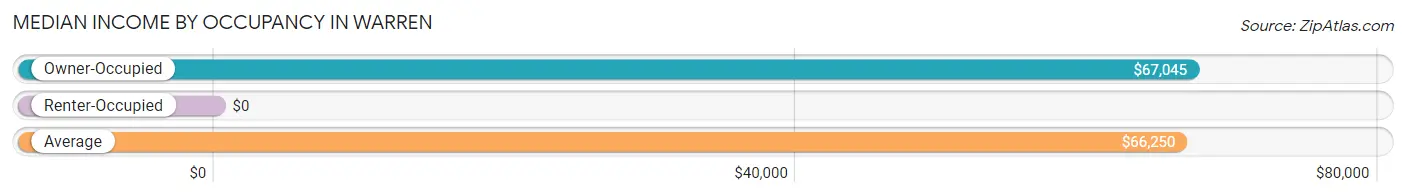
| Occupancy Type | # Households | Median Income |
| Owner-Occupied | 224 (97.0%) | $67,045 |
| Renter-Occupied | 7 (3.0%) | $0 |
| Average | 231 (100.0%) | $66,250 |
Occupancy by Householder Income Bracket in Warren
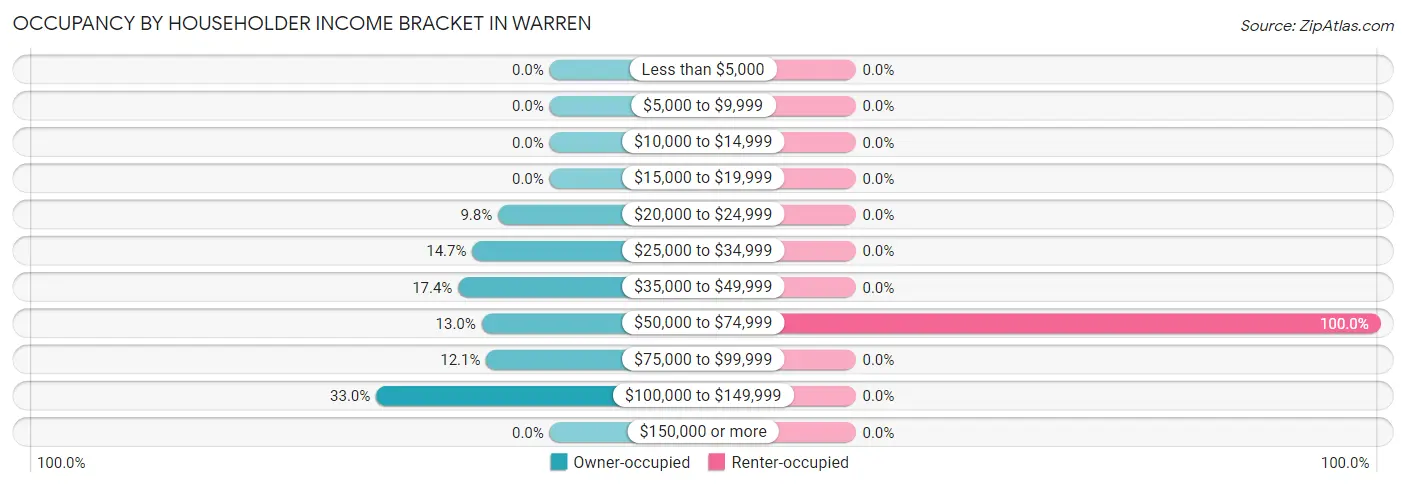
| Income Bracket | Owner-occupied | Renter-occupied |
| Less than $5,000 | 0 (0.0%) | 0 (0.0%) |
| $5,000 to $9,999 | 0 (0.0%) | 0 (0.0%) |
| $10,000 to $14,999 | 0 (0.0%) | 0 (0.0%) |
| $15,000 to $19,999 | 0 (0.0%) | 0 (0.0%) |
| $20,000 to $24,999 | 22 (9.8%) | 0 (0.0%) |
| $25,000 to $34,999 | 33 (14.7%) | 0 (0.0%) |
| $35,000 to $49,999 | 39 (17.4%) | 0 (0.0%) |
| $50,000 to $74,999 | 29 (13.0%) | 7 (100.0%) |
| $75,000 to $99,999 | 27 (12.0%) | 0 (0.0%) |
| $100,000 to $149,999 | 74 (33.0%) | 0 (0.0%) |
| $150,000 or more | 0 (0.0%) | 0 (0.0%) |
| Total | 224 (100.0%) | 7 (100.0%) |
Monthly Housing Cost Tiers in Warren
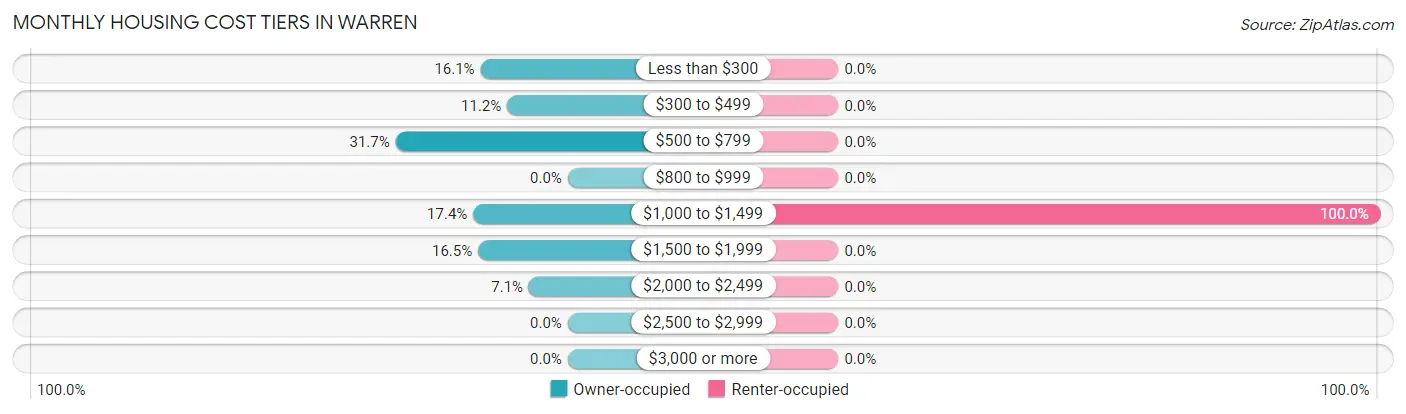
| Monthly Cost | Owner-occupied | Renter-occupied |
| Less than $300 | 36 (16.1%) | 0 (0.0%) |
| $300 to $499 | 25 (11.2%) | 0 (0.0%) |
| $500 to $799 | 71 (31.7%) | 0 (0.0%) |
| $800 to $999 | 0 (0.0%) | 0 (0.0%) |
| $1,000 to $1,499 | 39 (17.4%) | 7 (100.0%) |
| $1,500 to $1,999 | 37 (16.5%) | 0 (0.0%) |
| $2,000 to $2,499 | 16 (7.1%) | 0 (0.0%) |
| $2,500 to $2,999 | 0 (0.0%) | 0 (0.0%) |
| $3,000 or more | 0 (0.0%) | 0 (0.0%) |
| Total | 224 (100.0%) | 7 (100.0%) |
Physical Housing Characteristics in Warren
Housing Structures in Warren
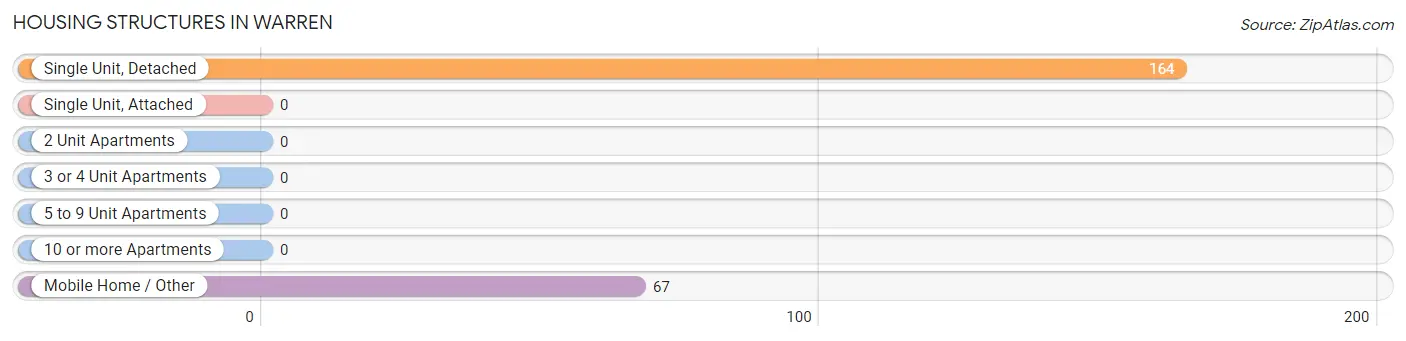
| Structure Type | # Housing Units | % Housing Units |
| Single Unit, Detached | 164 | 71.0% |
| Single Unit, Attached | 0 | 0.0% |
| 2 Unit Apartments | 0 | 0.0% |
| 3 or 4 Unit Apartments | 0 | 0.0% |
| 5 to 9 Unit Apartments | 0 | 0.0% |
| 10 or more Apartments | 0 | 0.0% |
| Mobile Home / Other | 67 | 29.0% |
| Total | 231 | 100.0% |
Housing Structures by Occupancy in Warren
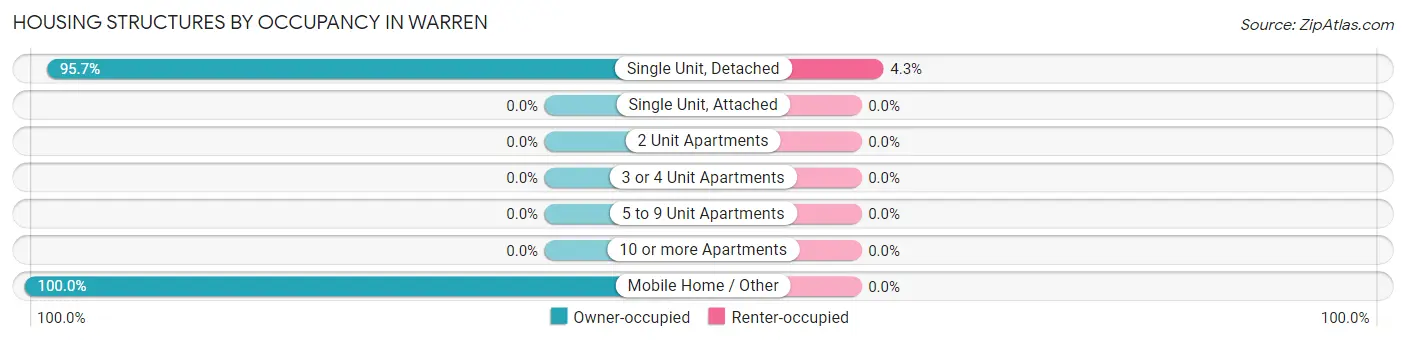
| Structure Type | Owner-occupied | Renter-occupied |
| Single Unit, Detached | 157 (95.7%) | 7 (4.3%) |
| Single Unit, Attached | 0 (0.0%) | 0 (0.0%) |
| 2 Unit Apartments | 0 (0.0%) | 0 (0.0%) |
| 3 or 4 Unit Apartments | 0 (0.0%) | 0 (0.0%) |
| 5 to 9 Unit Apartments | 0 (0.0%) | 0 (0.0%) |
| 10 or more Apartments | 0 (0.0%) | 0 (0.0%) |
| Mobile Home / Other | 67 (100.0%) | 0 (0.0%) |
| Total | 224 (97.0%) | 7 (3.0%) |
Housing Structures by Number of Rooms in Warren
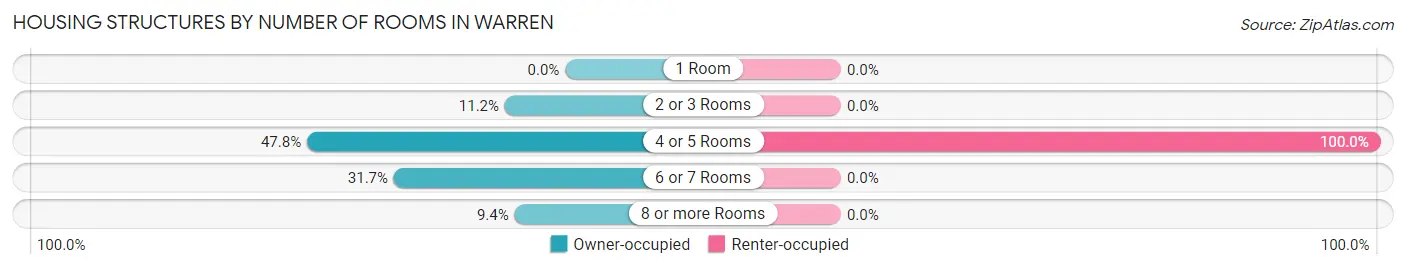
| Number of Rooms | Owner-occupied | Renter-occupied |
| 1 Room | 0 (0.0%) | 0 (0.0%) |
| 2 or 3 Rooms | 25 (11.2%) | 0 (0.0%) |
| 4 or 5 Rooms | 107 (47.8%) | 7 (100.0%) |
| 6 or 7 Rooms | 71 (31.7%) | 0 (0.0%) |
| 8 or more Rooms | 21 (9.4%) | 0 (0.0%) |
| Total | 224 (100.0%) | 7 (100.0%) |
Housing Structure by Heating Type in Warren
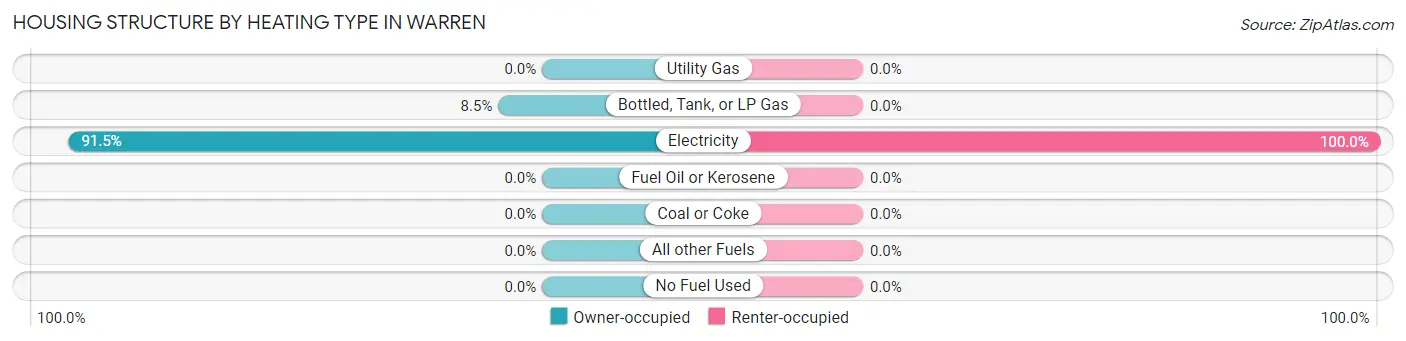
| Heating Type | Owner-occupied | Renter-occupied |
| Utility Gas | 0 (0.0%) | 0 (0.0%) |
| Bottled, Tank, or LP Gas | 19 (8.5%) | 0 (0.0%) |
| Electricity | 205 (91.5%) | 7 (100.0%) |
| Fuel Oil or Kerosene | 0 (0.0%) | 0 (0.0%) |
| Coal or Coke | 0 (0.0%) | 0 (0.0%) |
| All other Fuels | 0 (0.0%) | 0 (0.0%) |
| No Fuel Used | 0 (0.0%) | 0 (0.0%) |
| Total | 224 (100.0%) | 7 (100.0%) |
Household Vehicle Usage in Warren
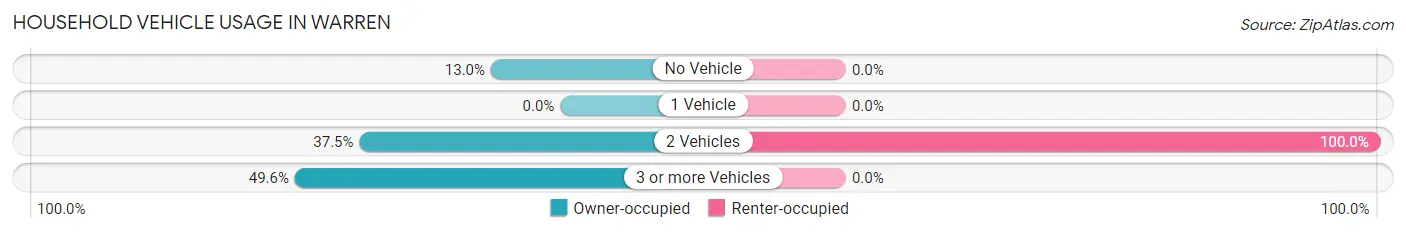
| Vehicles per Household | Owner-occupied | Renter-occupied |
| No Vehicle | 29 (13.0%) | 0 (0.0%) |
| 1 Vehicle | 0 (0.0%) | 0 (0.0%) |
| 2 Vehicles | 84 (37.5%) | 7 (100.0%) |
| 3 or more Vehicles | 111 (49.5%) | 0 (0.0%) |
| Total | 224 (100.0%) | 7 (100.0%) |
Real Estate & Mortgages in Warren
Real Estate and Mortgage Overview in Warren
| Characteristic | Without Mortgage | With Mortgage |
| Housing Units | 134 | 90 |
| Median Property Value | $89,100 | $169,400 |
| Median Household Income | - | - |
| Monthly Housing Costs | $517 | $0 |
| Real Estate Taxes | $780 | $0 |
Property Value by Mortgage Status in Warren
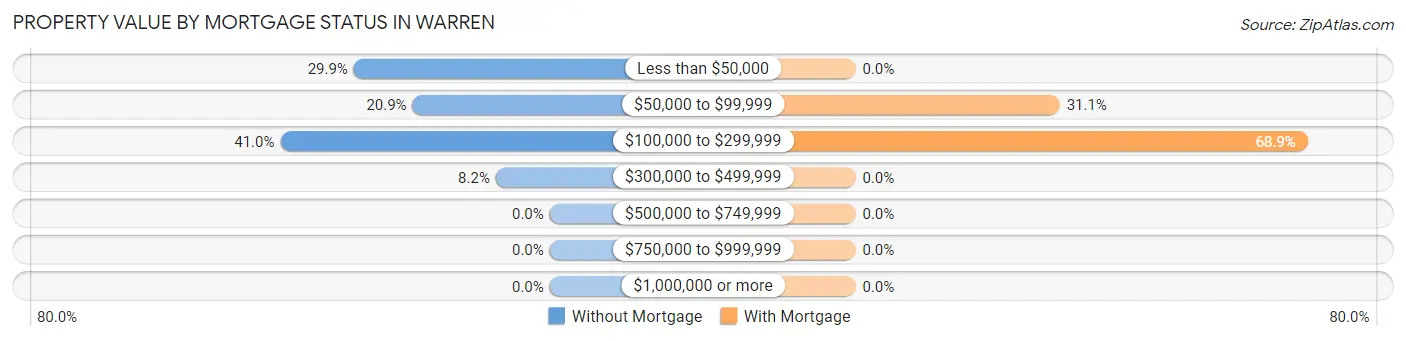
| Property Value | Without Mortgage | With Mortgage |
| Less than $50,000 | 40 (29.8%) | 0 (0.0%) |
| $50,000 to $99,999 | 28 (20.9%) | 28 (31.1%) |
| $100,000 to $299,999 | 55 (41.0%) | 62 (68.9%) |
| $300,000 to $499,999 | 11 (8.2%) | 0 (0.0%) |
| $500,000 to $749,999 | 0 (0.0%) | 0 (0.0%) |
| $750,000 to $999,999 | 0 (0.0%) | 0 (0.0%) |
| $1,000,000 or more | 0 (0.0%) | 0 (0.0%) |
| Total | 134 (100.0%) | 90 (100.0%) |
Household Income by Mortgage Status in Warren
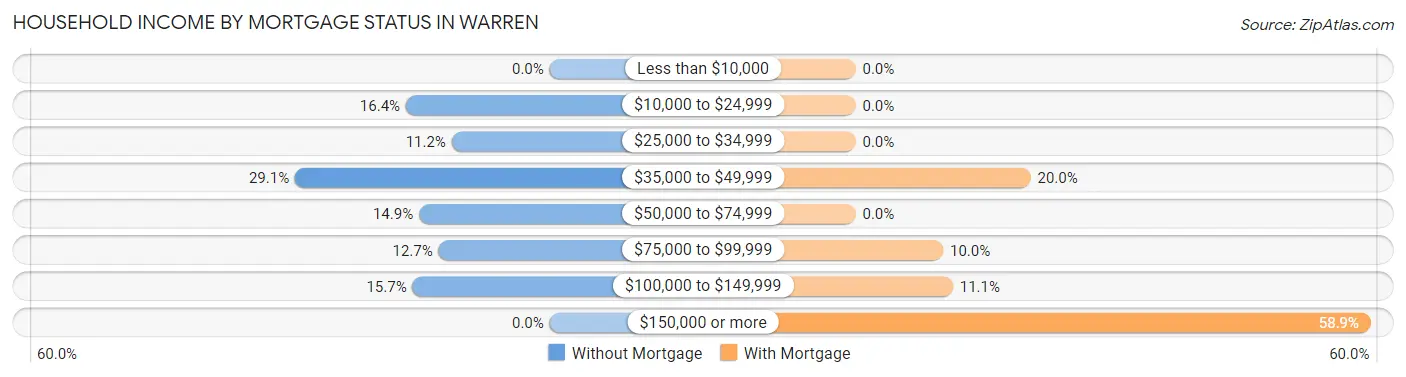
| Household Income | Without Mortgage | With Mortgage |
| Less than $10,000 | 0 (0.0%) | 0 (0.0%) |
| $10,000 to $24,999 | 22 (16.4%) | 0 (0.0%) |
| $25,000 to $34,999 | 15 (11.2%) | 0 (0.0%) |
| $35,000 to $49,999 | 39 (29.1%) | 18 (20.0%) |
| $50,000 to $74,999 | 20 (14.9%) | 0 (0.0%) |
| $75,000 to $99,999 | 17 (12.7%) | 9 (10.0%) |
| $100,000 to $149,999 | 21 (15.7%) | 10 (11.1%) |
| $150,000 or more | 0 (0.0%) | 53 (58.9%) |
| Total | 134 (100.0%) | 90 (100.0%) |
Property Value to Household Income Ratio in Warren
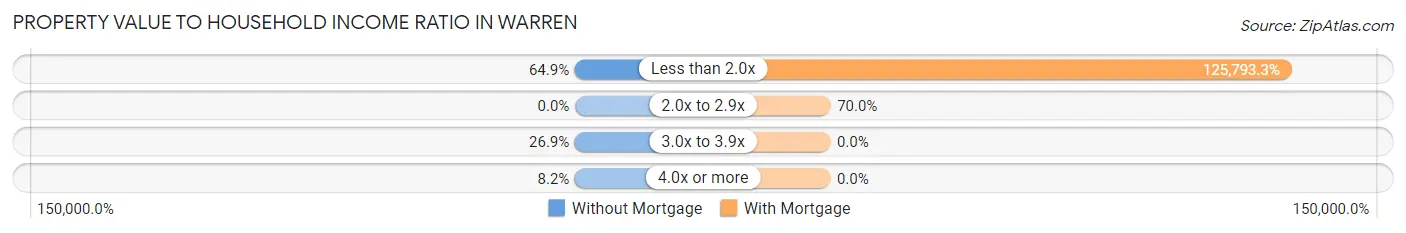
| Value-to-Income Ratio | Without Mortgage | With Mortgage |
| Less than 2.0x | 87 (64.9%) | 113,214 (125,793.3%) |
| 2.0x to 2.9x | 0 (0.0%) | 63 (70.0%) |
| 3.0x to 3.9x | 36 (26.9%) | 0 (0.0%) |
| 4.0x or more | 11 (8.2%) | 0 (0.0%) |
| Total | 134 (100.0%) | 90 (100.0%) |
Real Estate Taxes by Mortgage Status in Warren
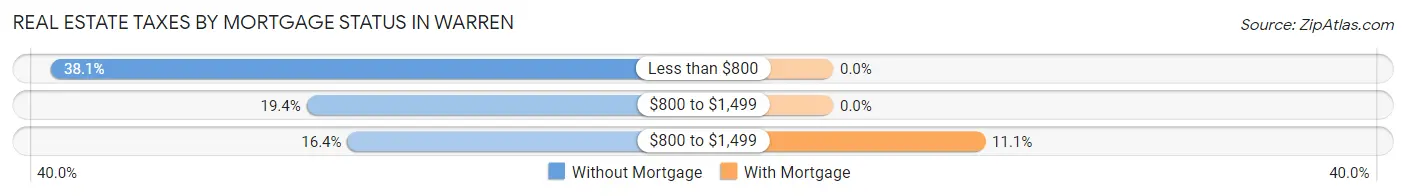
| Property Taxes | Without Mortgage | With Mortgage |
| Less than $800 | 51 (38.1%) | 0 (0.0%) |
| $800 to $1,499 | 26 (19.4%) | 0 (0.0%) |
| $800 to $1,499 | 22 (16.4%) | 10 (11.1%) |
| Total | 134 (100.0%) | 90 (100.0%) |
Health & Disability in Warren
Health Insurance Coverage by Age in Warren
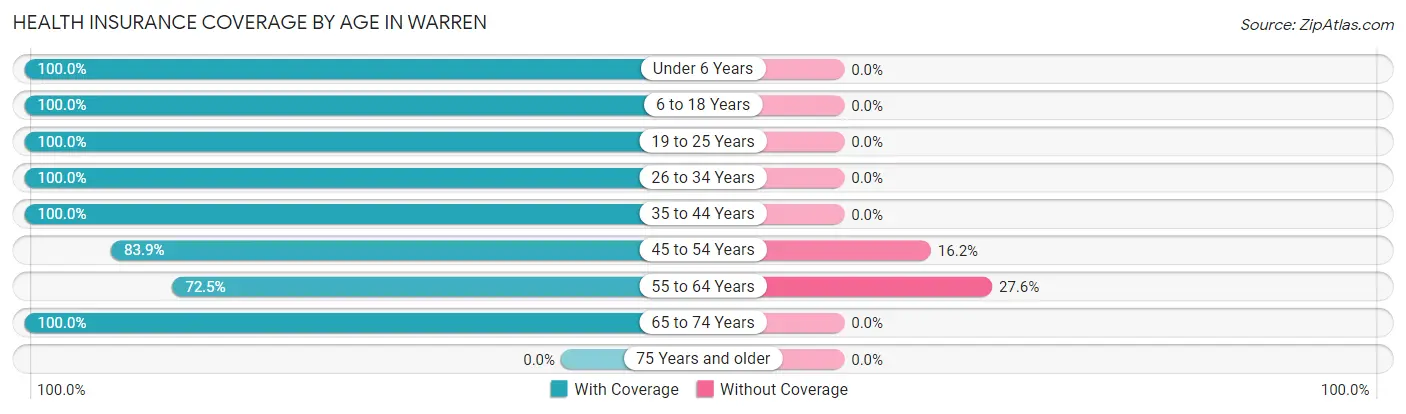
| Age Bracket | With Coverage | Without Coverage |
| Under 6 Years | 44 (100.0%) | 0 (0.0%) |
| 6 to 18 Years | 180 (100.0%) | 0 (0.0%) |
| 19 to 25 Years | 70 (100.0%) | 0 (0.0%) |
| 26 to 34 Years | 17 (100.0%) | 0 (0.0%) |
| 35 to 44 Years | 33 (100.0%) | 0 (0.0%) |
| 45 to 54 Years | 109 (83.9%) | 21 (16.2%) |
| 55 to 64 Years | 71 (72.5%) | 27 (27.6%) |
| 65 to 74 Years | 159 (100.0%) | 0 (0.0%) |
| 75 Years and older | 0 (0.0%) | 0 (0.0%) |
| Total | 683 (93.4%) | 48 (6.6%) |
Health Insurance Coverage by Citizenship Status in Warren
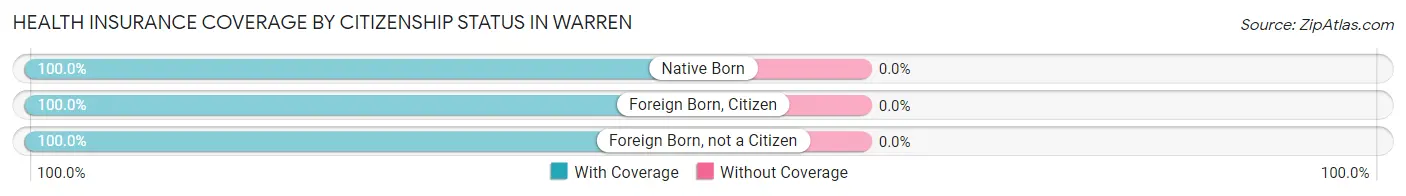
| Citizenship Status | With Coverage | Without Coverage |
| Native Born | 44 (100.0%) | 0 (0.0%) |
| Foreign Born, Citizen | 180 (100.0%) | 0 (0.0%) |
| Foreign Born, not a Citizen | 70 (100.0%) | 0 (0.0%) |
Health Insurance Coverage by Household Income in Warren
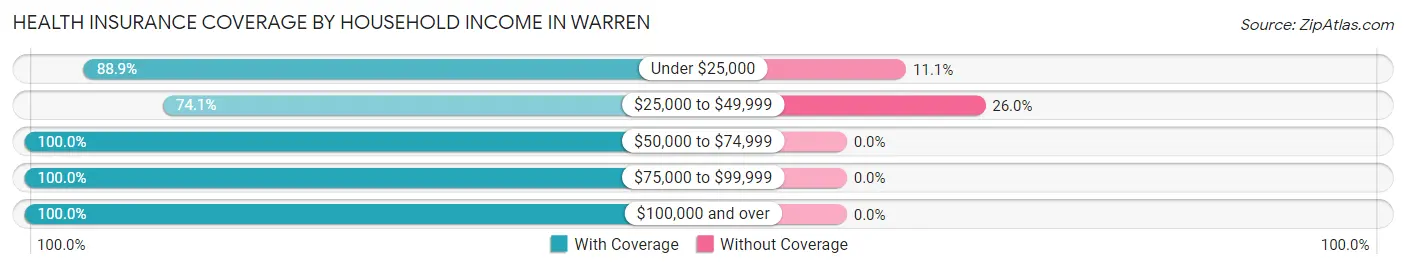
| Household Income | With Coverage | Without Coverage |
| Under $25,000 | 56 (88.9%) | 7 (11.1%) |
| $25,000 to $49,999 | 117 (74.1%) | 41 (26.0%) |
| $50,000 to $74,999 | 145 (100.0%) | 0 (0.0%) |
| $75,000 to $99,999 | 27 (100.0%) | 0 (0.0%) |
| $100,000 and over | 338 (100.0%) | 0 (0.0%) |
Public vs Private Health Insurance Coverage by Age in Warren
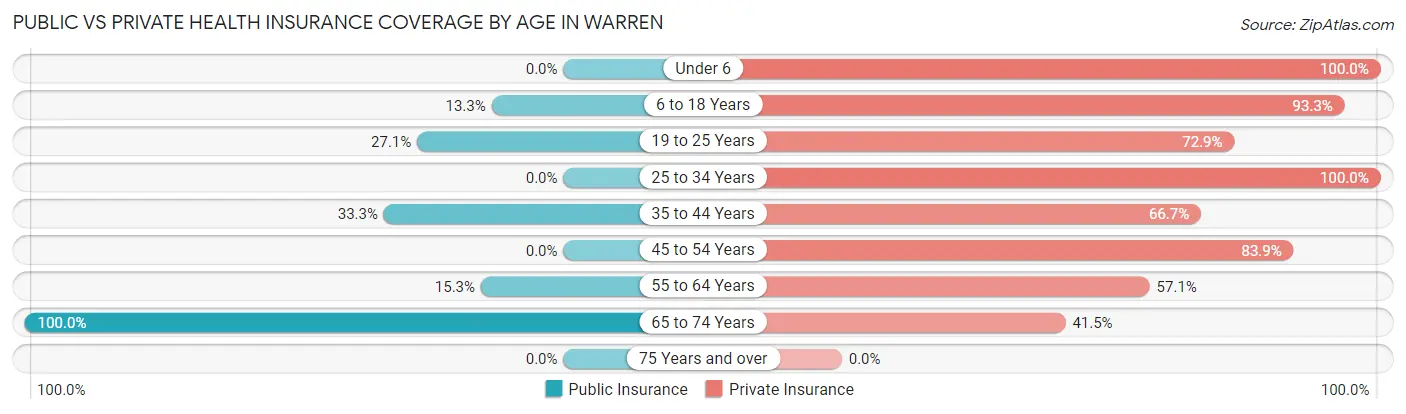
| Age Bracket | Public Insurance | Private Insurance |
| Under 6 | 0 (0.0%) | 44 (100.0%) |
| 6 to 18 Years | 24 (13.3%) | 168 (93.3%) |
| 19 to 25 Years | 19 (27.1%) | 51 (72.9%) |
| 25 to 34 Years | 0 (0.0%) | 17 (100.0%) |
| 35 to 44 Years | 11 (33.3%) | 22 (66.7%) |
| 45 to 54 Years | 0 (0.0%) | 109 (83.9%) |
| 55 to 64 Years | 15 (15.3%) | 56 (57.1%) |
| 65 to 74 Years | 159 (100.0%) | 66 (41.5%) |
| 75 Years and over | 0 (0.0%) | 0 (0.0%) |
| Total | 228 (31.2%) | 533 (72.9%) |
Disability Status by Sex by Age in Warren
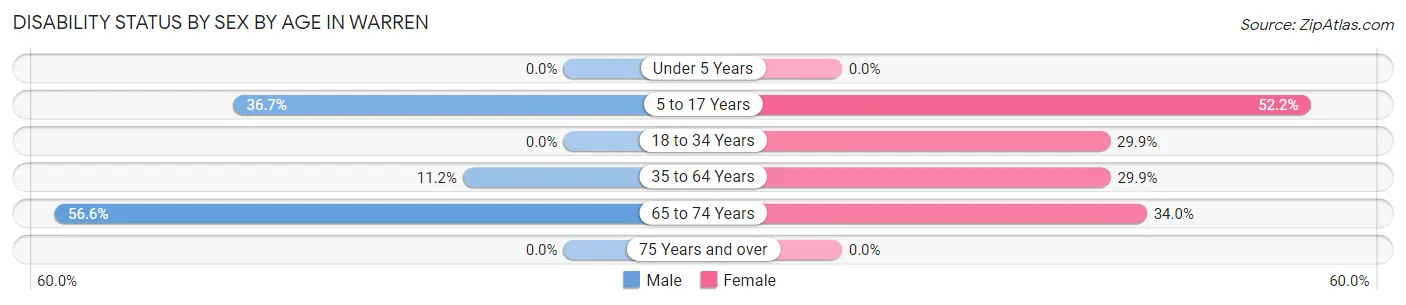
| Age Bracket | Male | Female |
| Under 5 Years | 0 (0.0%) | 0 (0.0%) |
| 5 to 17 Years | 47 (36.7%) | 12 (52.2%) |
| 18 to 34 Years | 0 (0.0%) | 23 (29.9%) |
| 35 to 64 Years | 15 (11.2%) | 38 (29.9%) |
| 65 to 74 Years | 60 (56.6%) | 18 (34.0%) |
| 75 Years and over | 0 (0.0%) | 0 (0.0%) |
Disability Class by Sex by Age in Warren
Disability Class: Hearing Difficulty
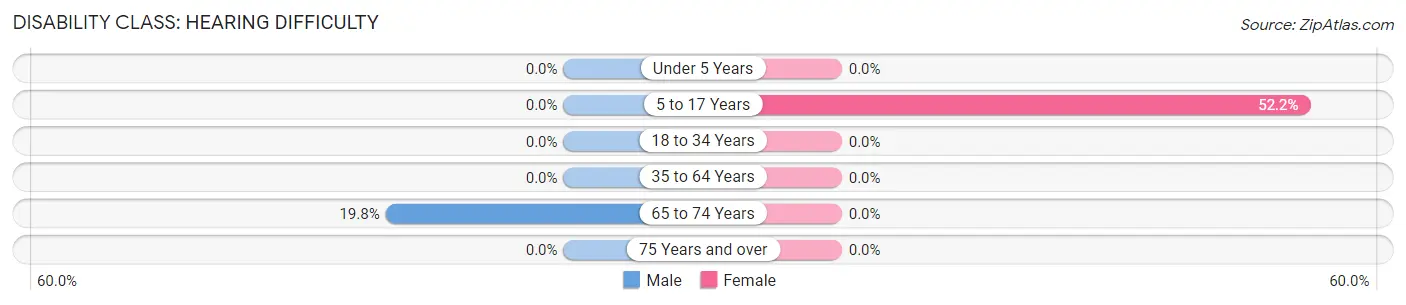
| Age Bracket | Male | Female |
| Under 5 Years | 0 (0.0%) | 0 (0.0%) |
| 5 to 17 Years | 0 (0.0%) | 12 (52.2%) |
| 18 to 34 Years | 0 (0.0%) | 0 (0.0%) |
| 35 to 64 Years | 0 (0.0%) | 0 (0.0%) |
| 65 to 74 Years | 21 (19.8%) | 0 (0.0%) |
| 75 Years and over | 0 (0.0%) | 0 (0.0%) |
Disability Class: Vision Difficulty
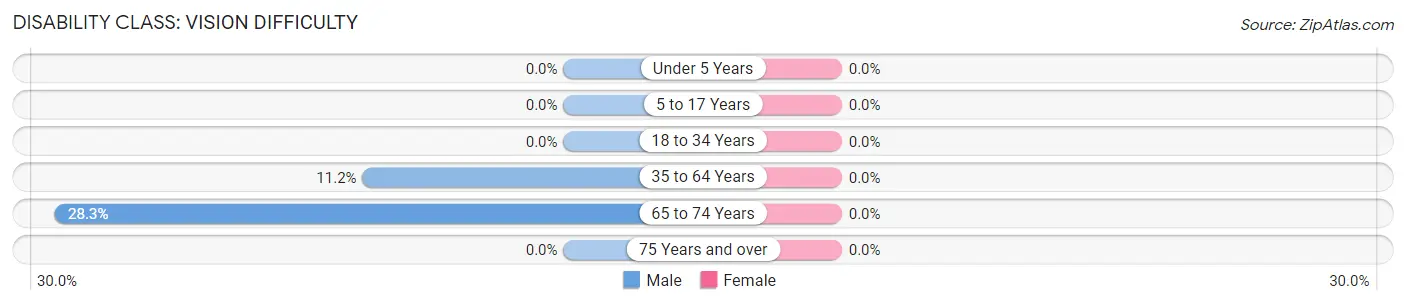
| Age Bracket | Male | Female |
| Under 5 Years | 0 (0.0%) | 0 (0.0%) |
| 5 to 17 Years | 0 (0.0%) | 0 (0.0%) |
| 18 to 34 Years | 0 (0.0%) | 0 (0.0%) |
| 35 to 64 Years | 15 (11.2%) | 0 (0.0%) |
| 65 to 74 Years | 30 (28.3%) | 0 (0.0%) |
| 75 Years and over | 0 (0.0%) | 0 (0.0%) |
Disability Class: Cognitive Difficulty
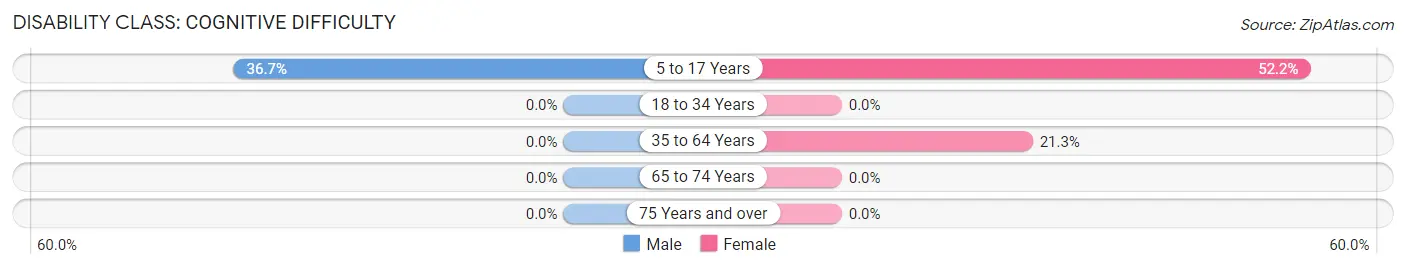
| Age Bracket | Male | Female |
| 5 to 17 Years | 47 (36.7%) | 12 (52.2%) |
| 18 to 34 Years | 0 (0.0%) | 0 (0.0%) |
| 35 to 64 Years | 0 (0.0%) | 27 (21.3%) |
| 65 to 74 Years | 0 (0.0%) | 0 (0.0%) |
| 75 Years and over | 0 (0.0%) | 0 (0.0%) |
Disability Class: Ambulatory Difficulty
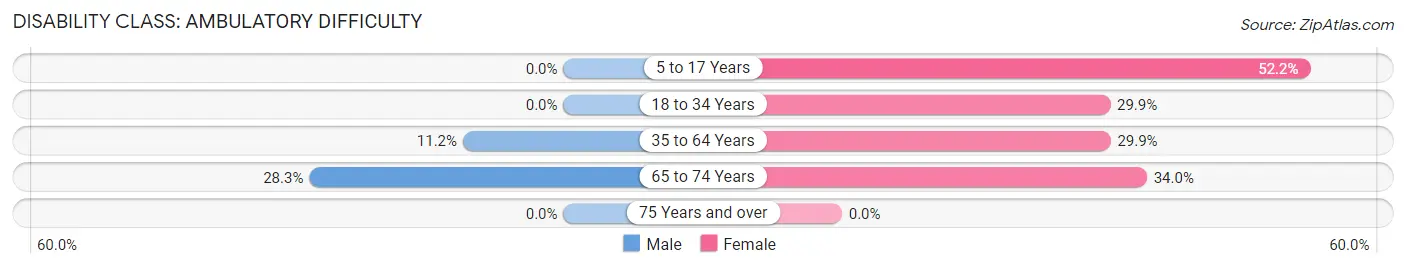
| Age Bracket | Male | Female |
| 5 to 17 Years | 0 (0.0%) | 12 (52.2%) |
| 18 to 34 Years | 0 (0.0%) | 23 (29.9%) |
| 35 to 64 Years | 15 (11.2%) | 38 (29.9%) |
| 65 to 74 Years | 30 (28.3%) | 18 (34.0%) |
| 75 Years and over | 0 (0.0%) | 0 (0.0%) |
Disability Class: Self-Care Difficulty
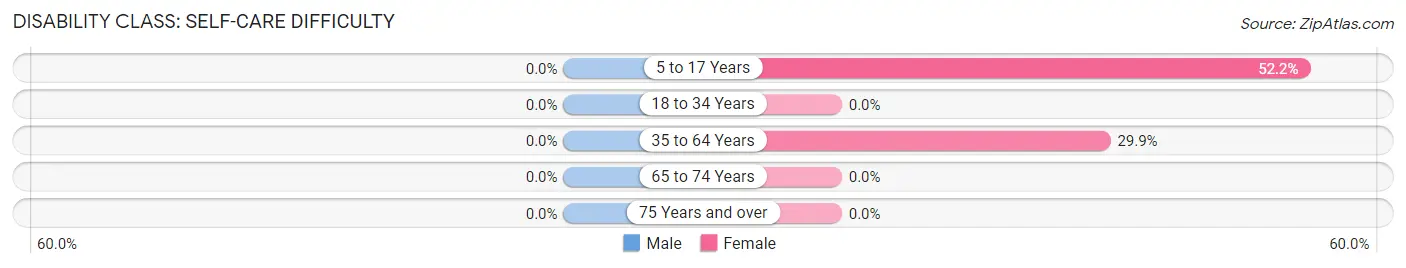
| Age Bracket | Male | Female |
| 5 to 17 Years | 0 (0.0%) | 12 (52.2%) |
| 18 to 34 Years | 0 (0.0%) | 0 (0.0%) |
| 35 to 64 Years | 0 (0.0%) | 38 (29.9%) |
| 65 to 74 Years | 0 (0.0%) | 0 (0.0%) |
| 75 Years and over | 0 (0.0%) | 0 (0.0%) |
Technology Access in Warren
Computing Device Access in Warren
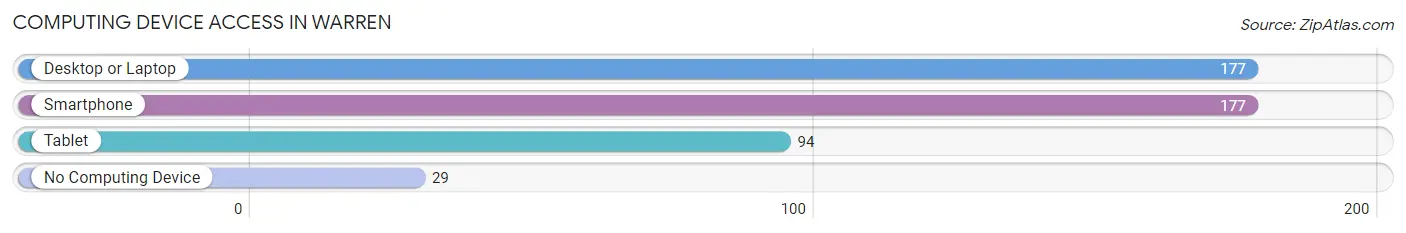
| Device Type | # Households | % Households |
| Desktop or Laptop | 177 | 76.6% |
| Smartphone | 177 | 76.6% |
| Tablet | 94 | 40.7% |
| No Computing Device | 29 | 12.6% |
| Total | 231 | 100.0% |
Internet Access in Warren
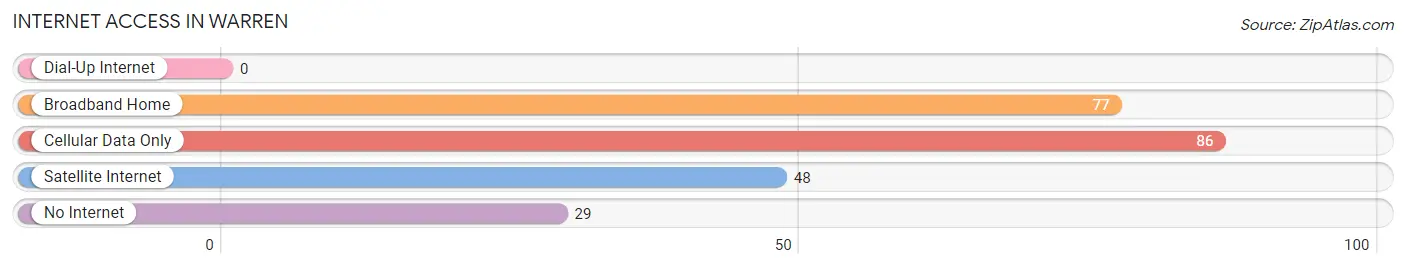
| Internet Type | # Households | % Households |
| Dial-Up Internet | 0 | 0.0% |
| Broadband Home | 77 | 33.3% |
| Cellular Data Only | 86 | 37.2% |
| Satellite Internet | 48 | 20.8% |
| No Internet | 29 | 12.6% |
| Total | 231 | 100.0% |
Warren Summary
Warren, Texas is a small town located in the eastern part of the state, in the county of Tyler. It is situated on the banks of the Neches River, and is part of the Tyler-Longview metropolitan area. The town has a population of just over 1,000 people, and is known for its rural charm and small-town atmosphere.
History
The area that is now Warren was first settled in the early 1800s by a group of settlers from the United States. The town was originally known as “Warren’s Settlement”, and was named after the first settler, William Warren. The town was officially incorporated in 1891, and was named after the Warren family.
In the early 1900s, the town began to grow and develop, and by the 1920s, it had become a thriving agricultural center. The town was home to several cotton gins, and the local economy was largely based on the production of cotton. The town also had a number of stores, churches, and other businesses.
In the 1950s, the town began to decline, as the cotton industry began to decline. The town’s population began to decline as well, and by the 1970s, the population had dropped to just over 500 people.
Geography
Warren is located in the eastern part of Texas, in the county of Tyler. It is situated on the banks of the Neches River, and is part of the Tyler-Longview metropolitan area. The town is located about 30 miles east of Tyler, and about 50 miles north of Beaumont.
The town is located in a rural area, and is surrounded by rolling hills and forests. The town is located in a humid subtropical climate, and experiences hot summers and mild winters.
Economy
The economy of Warren is largely based on agriculture. The town is home to several cotton gins, and the local economy is largely based on the production of cotton. The town also has a number of stores, churches, and other businesses.
The town is also home to a number of small businesses, including a few restaurants, a grocery store, and a few other retail stores. The town also has a few small manufacturing businesses, including a furniture factory and a woodworking shop.
Demographics
As of the 2010 census, the population of Warren was 1,072. The town is predominantly white, with about 85% of the population being white. The town also has a small Hispanic population, with about 10% of the population being Hispanic. The town also has a small African American population, with about 5% of the population being African American.
The median household income in Warren is $37,500, and the median home value is $90,000. The town has a low unemployment rate, with only about 4% of the population being unemployed. The town also has a low poverty rate, with about 10% of the population living below the poverty line.
Common Questions
What is Per Capita Income in Warren?
Per Capita income in Warren is $22,037.
What is the Median Family Income in Warren?
Median Family Income in Warren is $66,477.
What is the Median Household income in Warren?
Median Household Income in Warren is $66,250.
What is Inequality or Gini Index in Warren?
Inequality or Gini Index in Warren is 0.31.
What is the Total Population of Warren?
Total Population of Warren is 731.
What is the Total Male Population of Warren?
Total Male Population of Warren is 451.
What is the Total Female Population of Warren?
Total Female Population of Warren is 280.
What is the Ratio of Males per 100 Females in Warren?
There are 161.07 Males per 100 Females in Warren.
What is the Ratio of Females per 100 Males in Warren?
There are 62.08 Females per 100 Males in Warren.
What is the Median Population Age in Warren?
Median Population Age in Warren is 45.8 Years.
What is the Average Family Size in Warren
Average Family Size in Warren is 3.8 People.
What is the Average Household Size in Warren
Average Household Size in Warren is 3.2 People.
How Large is the Labor Force in Warren?
There are 305 People in the Labor Forcein in Warren.
What is the Percentage of People in the Labor Force in Warren?
48.0% of People are in the Labor Force in Warren.
What is the Unemployment Rate in Warren?
Unemployment Rate in Warren is 12.8%.