Mirando City, TX Map & Demographics
Mirando City Map
Mirando City Overview
$31,825
PER CAPITA INCOME
$89,375
AVG FAMILY INCOME
0.54
INEQUALITY / GINI INDEX
199
TOTAL POPULATION
99
MALE POPULATION
100
FEMALE POPULATION
99.00
MALES / 100 FEMALES
101.01
FEMALES / 100 MALES
41.1
MEDIAN AGE
3.5
AVG FAMILY SIZE
2.6
AVG HOUSEHOLD SIZE
95
LABOR FORCE [ PEOPLE ]
60.1%
PERCENT IN LABOR FORCE
13.7%
UNEMPLOYMENT RATE
Mirando City Zip Codes
Mirando City Area Codes
Income in Mirando City
Income Overview in Mirando City
| Characteristic | Number | Measure |
| Per Capita Income | 199 | $31,825 |
| Median Family Income | 46 | $89,375 |
| Mean Family Income | 46 | $101,722 |
| Median Household Income | 76 | $0 |
| Mean Household Income | 76 | $75,005 |
| Income Deficit | 46 | $0 |
| Wage / Income Gap (%) | 199 | 0.00% |
| Wage / Income Gap ($) | 199 | 100.00¢ per $1 |
| Gini / Inequality Index | 199 | 0.54 |
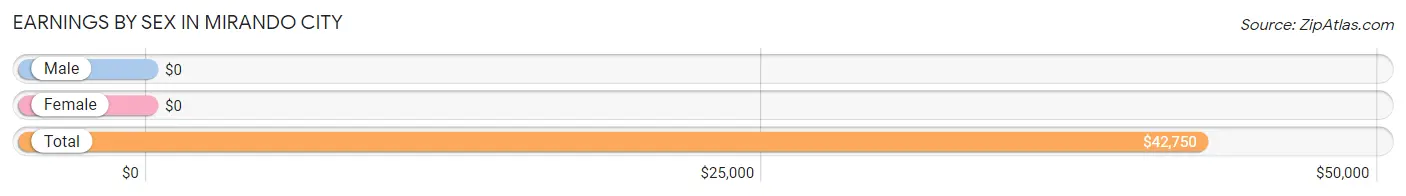
Earnings by Sex in Mirando City
| Sex | Number | Average Earnings |
| Male | 33 (36.7%) | $0 |
| Female | 57 (63.3%) | $0 |
| Total | 90 (100.0%) | $42,750 |
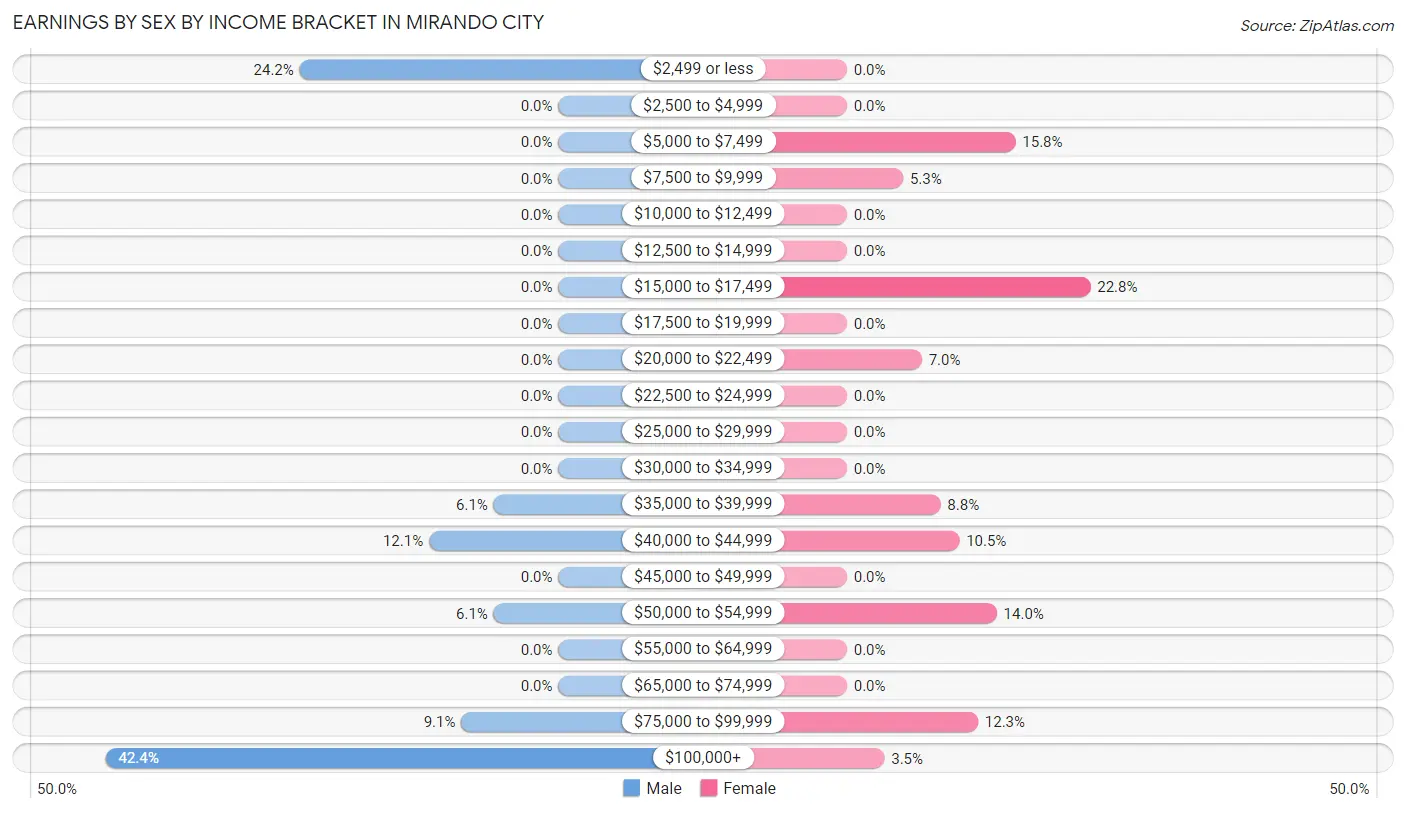
Earnings by Sex by Income Bracket in Mirando City
The most common earnings brackets in Mirando City are $100,000+ for men (14 | 42.4%) and $15,000 to $17,499 for women (13 | 22.8%).
| Income | Male | Female |
| $2,499 or less | 8 (24.2%) | 0 (0.0%) |
| $2,500 to $4,999 | 0 (0.0%) | 0 (0.0%) |
| $5,000 to $7,499 | 0 (0.0%) | 9 (15.8%) |
| $7,500 to $9,999 | 0 (0.0%) | 3 (5.3%) |
| $10,000 to $12,499 | 0 (0.0%) | 0 (0.0%) |
| $12,500 to $14,999 | 0 (0.0%) | 0 (0.0%) |
| $15,000 to $17,499 | 0 (0.0%) | 13 (22.8%) |
| $17,500 to $19,999 | 0 (0.0%) | 0 (0.0%) |
| $20,000 to $22,499 | 0 (0.0%) | 4 (7.0%) |
| $22,500 to $24,999 | 0 (0.0%) | 0 (0.0%) |
| $25,000 to $29,999 | 0 (0.0%) | 0 (0.0%) |
| $30,000 to $34,999 | 0 (0.0%) | 0 (0.0%) |
| $35,000 to $39,999 | 2 (6.1%) | 5 (8.8%) |
| $40,000 to $44,999 | 4 (12.1%) | 6 (10.5%) |
| $45,000 to $49,999 | 0 (0.0%) | 0 (0.0%) |
| $50,000 to $54,999 | 2 (6.1%) | 8 (14.0%) |
| $55,000 to $64,999 | 0 (0.0%) | 0 (0.0%) |
| $65,000 to $74,999 | 0 (0.0%) | 0 (0.0%) |
| $75,000 to $99,999 | 3 (9.1%) | 7 (12.3%) |
| $100,000+ | 14 (42.4%) | 2 (3.5%) |
| Total | 33 (100.0%) | 57 (100.0%) |
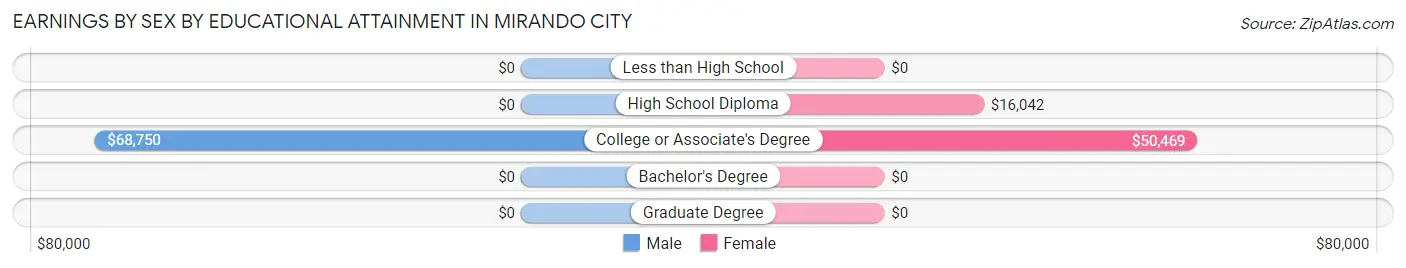
Earnings by Sex by Educational Attainment in Mirando City
Average earnings in Mirando City are $110,938 for men and $17,019 for women, a difference of 84.7%. Men with an educational attainment of college or associate's degree enjoy the highest average annual earnings of $68,750, while those with college or associate's degree education earn the least with $68,750. Women with an educational attainment of college or associate's degree earn the most with the average annual earnings of $50,469, while those with high school diploma education have the smallest earnings of $16,042.
| Educational Attainment | Male Income | Female Income |
| Less than High School | - | - |
| High School Diploma | - | - |
| College or Associate's Degree | $68,750 | $50,469 |
| Bachelor's Degree | - | - |
| Graduate Degree | - | - |
| Total | $110,938 | $17,019 |
Family Income in Mirando City
Family Income Brackets in Mirando City
According to the Mirando City family income data, there are 15 families falling into the $15,000 to $24,999 income range, which is the most common income bracket and makes up 32.6% of all families.
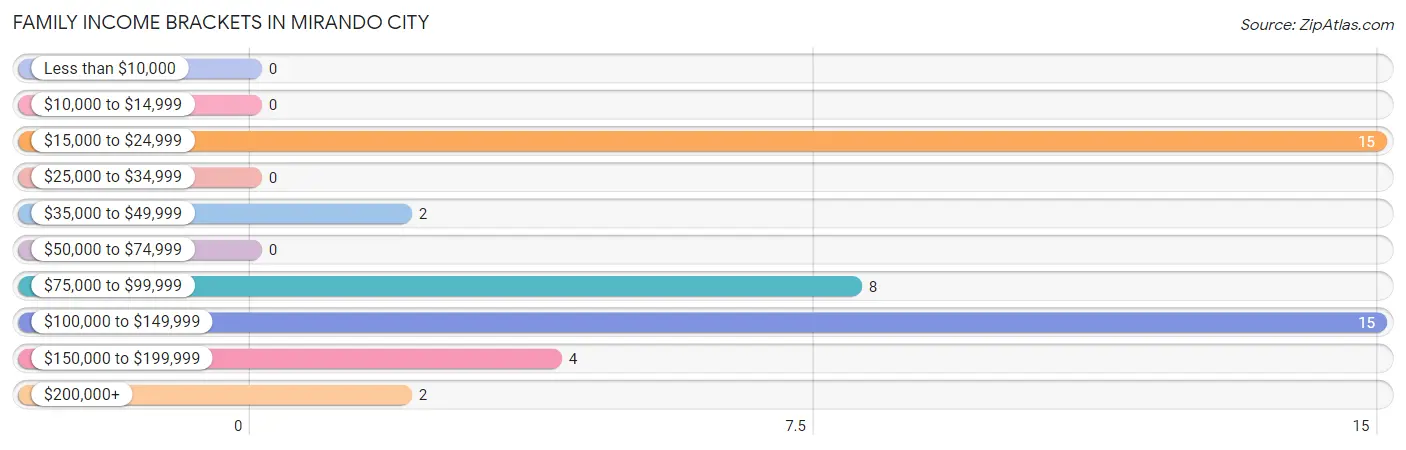
| Income Bracket | # Families | % Families |
| Less than $10,000 | 0 | 0.0% |
| $10,000 to $14,999 | 0 | 0.0% |
| $15,000 to $24,999 | 15 | 32.6% |
| $25,000 to $34,999 | 0 | 0.0% |
| $35,000 to $49,999 | 2 | 4.3% |
| $50,000 to $74,999 | 0 | 0.0% |
| $75,000 to $99,999 | 8 | 17.4% |
| $100,000 to $149,999 | 15 | 32.6% |
| $150,000 to $199,999 | 4 | 8.7% |
| $200,000+ | 2 | 4.3% |
Family Income by Famaliy Size in Mirando City
3-person families (20 | 43.5%) account for the highest median family income in Mirando City with $113,929 per family, while 3-person families (20 | 43.5%) have the highest median income of $37,976 per family member.
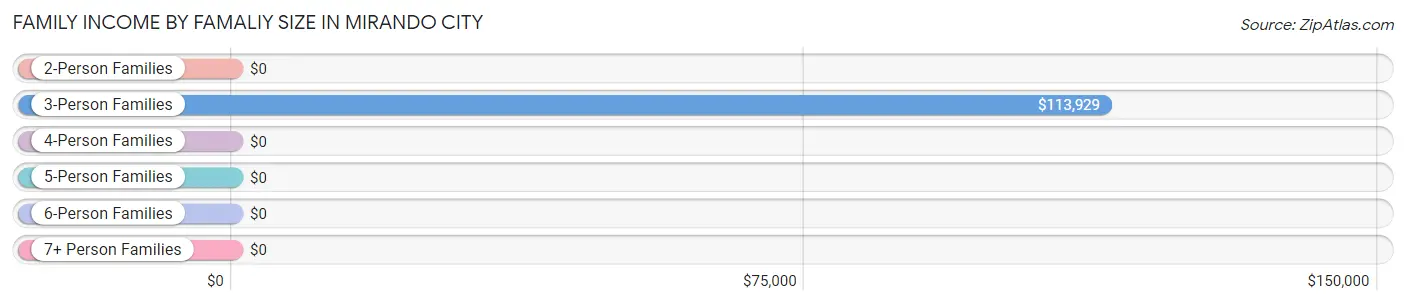
| Income Bracket | # Families | Median Income |
| 2-Person Families | 11 (23.9%) | $0 |
| 3-Person Families | 20 (43.5%) | $113,929 |
| 4-Person Families | 3 (6.5%) | $0 |
| 5-Person Families | 12 (26.1%) | $0 |
| 6-Person Families | 0 (0.0%) | $0 |
| 7+ Person Families | 0 (0.0%) | $0 |
| Total | 46 (100.0%) | $89,375 |
Family Income by Number of Earners in Mirando City
| Number of Earners | # Families | Median Income |
| No Earners | 0 (0.0%) | $0 |
| 1 Earner | 24 (52.2%) | $0 |
| 2 Earners | 8 (17.4%) | $0 |
| 3+ Earners | 14 (30.4%) | $0 |
| Total | 46 (100.0%) | $89,375 |
Household Income in Mirando City
Household Income Brackets in Mirando City
With 20 households falling in the category, the $15,000 to $24,999 income range is the most frequent in Mirando City, accounting for 26.3% of all households.
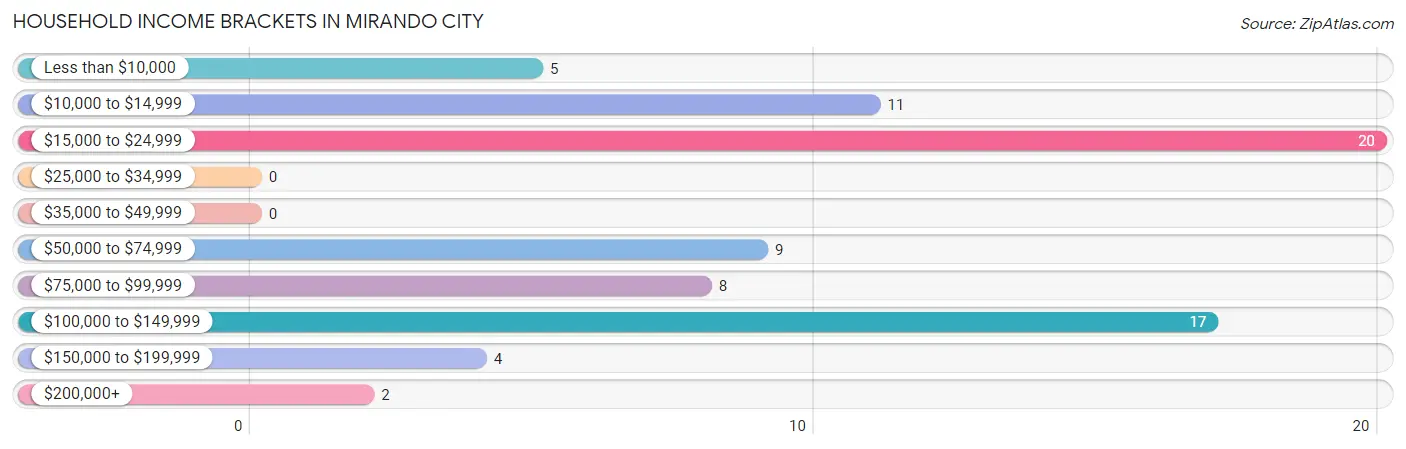
| Income Bracket | # Households | % Households |
| Less than $10,000 | 5 | 6.6% |
| $10,000 to $14,999 | 11 | 14.5% |
| $15,000 to $24,999 | 20 | 26.3% |
| $25,000 to $34,999 | 0 | 0.0% |
| $35,000 to $49,999 | 0 | 0.0% |
| $50,000 to $74,999 | 9 | 11.8% |
| $75,000 to $99,999 | 8 | 10.5% |
| $100,000 to $149,999 | 17 | 22.4% |
| $150,000 to $199,999 | 4 | 5.3% |
| $200,000+ | 2 | 2.6% |
Household Income by Householder Age in Mirando City
The median household income in Mirando City is $0, with the highest median household income of $113,214 found in the 45 to 64 years age bracket for the primary householder. A total of 28 households (36.8%) fall into this category.
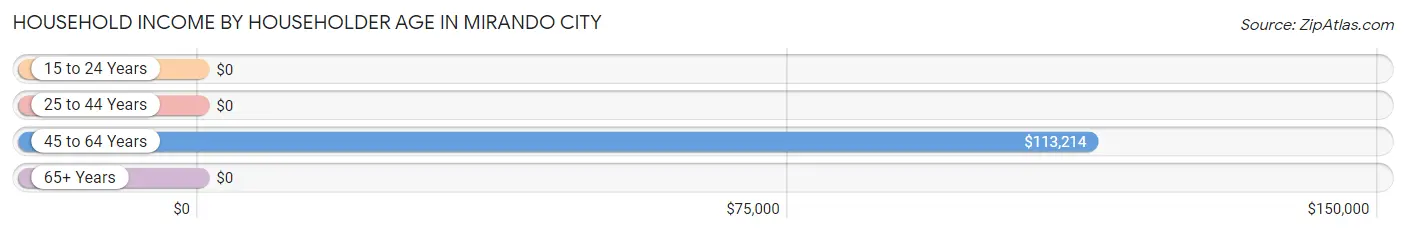
| Income Bracket | # Households | Median Income |
| 15 to 24 Years | 0 (0.0%) | $0 |
| 25 to 44 Years | 8 (10.5%) | $0 |
| 45 to 64 Years | 28 (36.8%) | $113,214 |
| 65+ Years | 40 (52.6%) | $0 |
| Total | 76 (100.0%) | $0 |
Poverty in Mirando City
Income Below Poverty by Sex and Age in Mirando City
With 24.2% poverty level for males and 20.0% for females among the residents of Mirando City, 25 to 34 year old males and 25 to 34 year old females are the most vulnerable to poverty, with 11 males (84.6%) and 6 females (100.0%) in their respective age groups living below the poverty level.
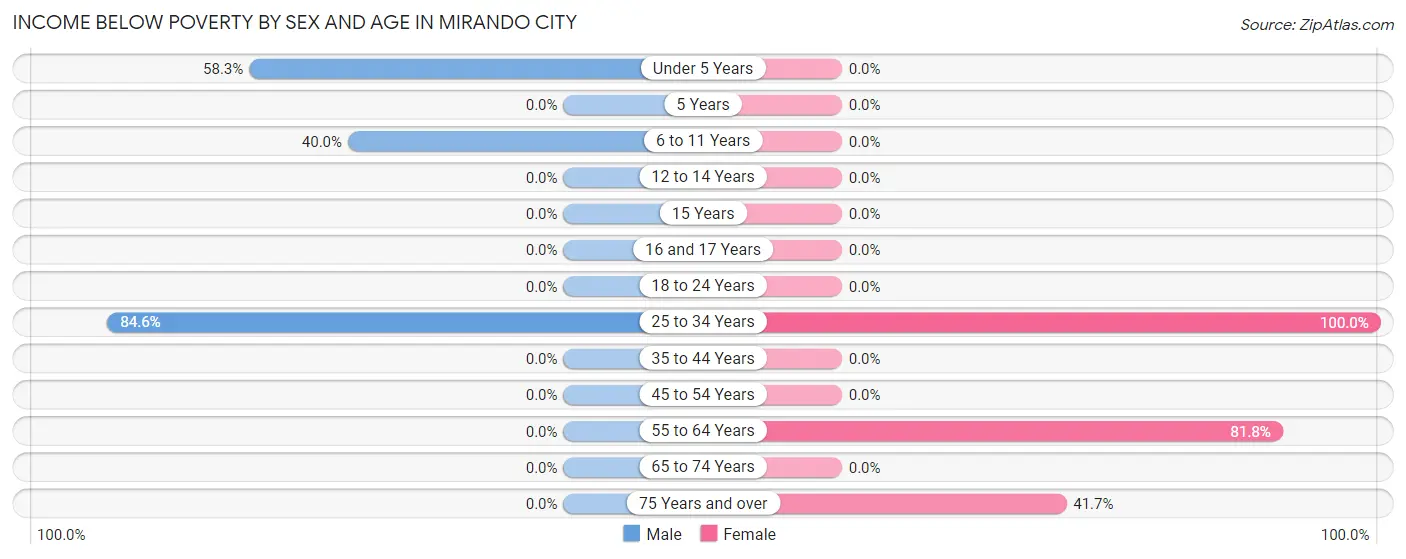
| Age Bracket | Male | Female |
| Under 5 Years | 7 (58.3%) | 0 (0.0%) |
| 5 Years | 0 (0.0%) | 0 (0.0%) |
| 6 to 11 Years | 6 (40.0%) | 0 (0.0%) |
| 12 to 14 Years | 0 (0.0%) | 0 (0.0%) |
| 15 Years | 0 (0.0%) | 0 (0.0%) |
| 16 and 17 Years | 0 (0.0%) | 0 (0.0%) |
| 18 to 24 Years | 0 (0.0%) | 0 (0.0%) |
| 25 to 34 Years | 11 (84.6%) | 6 (100.0%) |
| 35 to 44 Years | 0 (0.0%) | 0 (0.0%) |
| 45 to 54 Years | 0 (0.0%) | 0 (0.0%) |
| 55 to 64 Years | 0 (0.0%) | 9 (81.8%) |
| 65 to 74 Years | 0 (0.0%) | 0 (0.0%) |
| 75 Years and over | 0 (0.0%) | 5 (41.7%) |
| Total | 24 (24.2%) | 20 (20.0%) |
Income Above Poverty by Sex and Age in Mirando City
According to the poverty statistics in Mirando City, males aged 12 to 14 years and females aged 18 to 24 years are the age groups that are most secure financially, with 100.0% of males and 100.0% of females in these age groups living above the poverty line.
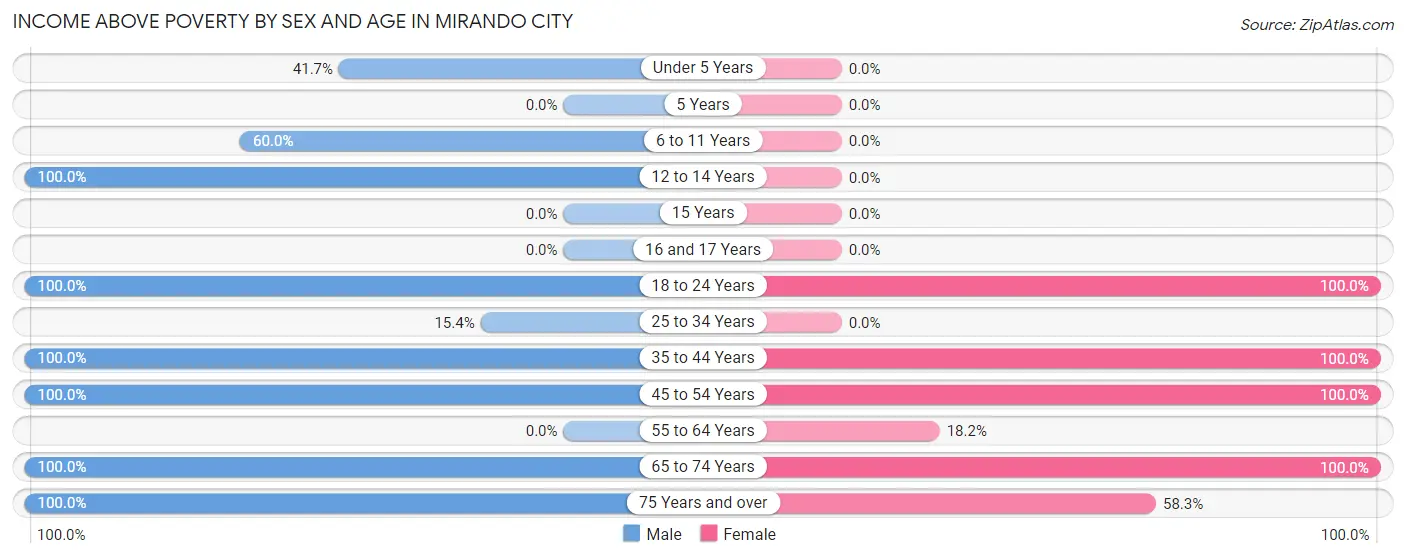
| Age Bracket | Male | Female |
| Under 5 Years | 5 (41.7%) | 0 (0.0%) |
| 5 Years | 0 (0.0%) | 0 (0.0%) |
| 6 to 11 Years | 9 (60.0%) | 0 (0.0%) |
| 12 to 14 Years | 14 (100.0%) | 0 (0.0%) |
| 15 Years | 0 (0.0%) | 0 (0.0%) |
| 16 and 17 Years | 0 (0.0%) | 0 (0.0%) |
| 18 to 24 Years | 8 (100.0%) | 22 (100.0%) |
| 25 to 34 Years | 2 (15.4%) | 0 (0.0%) |
| 35 to 44 Years | 4 (100.0%) | 13 (100.0%) |
| 45 to 54 Years | 21 (100.0%) | 15 (100.0%) |
| 55 to 64 Years | 0 (0.0%) | 2 (18.2%) |
| 65 to 74 Years | 9 (100.0%) | 21 (100.0%) |
| 75 Years and over | 3 (100.0%) | 7 (58.3%) |
| Total | 75 (75.8%) | 80 (80.0%) |
Income Below Poverty Among Married-Couple Families in Mirando City
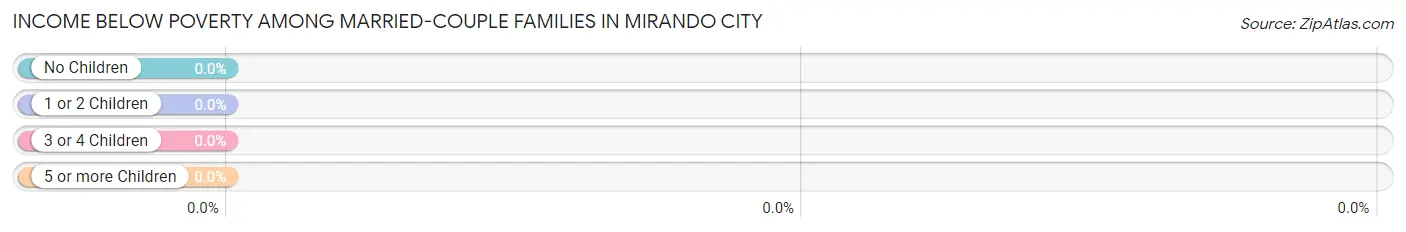
| Children | Above Poverty | Below Poverty |
| No Children | 14 (100.0%) | 0 (0.0%) |
| 1 or 2 Children | 7 (100.0%) | 0 (0.0%) |
| 3 or 4 Children | 0 (0.0%) | 0 (0.0%) |
| 5 or more Children | 0 (0.0%) | 0 (0.0%) |
| Total | 21 (100.0%) | 0 (0.0%) |
Income Below Poverty Among Single-Parent Households in Mirando City
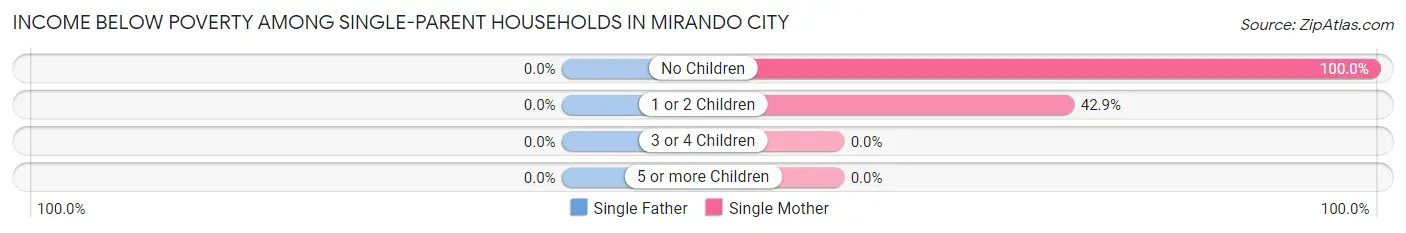
| Children | Single Father | Single Mother |
| No Children | 0 (0.0%) | 9 (100.0%) |
| 1 or 2 Children | 0 (0.0%) | 6 (42.9%) |
| 3 or 4 Children | 0 (0.0%) | 0 (0.0%) |
| 5 or more Children | 0 (0.0%) | 0 (0.0%) |
| Total | 0 (0.0%) | 15 (65.2%) |
Income Below Poverty Among Married-Couple vs Single-Parent Households in Mirando City
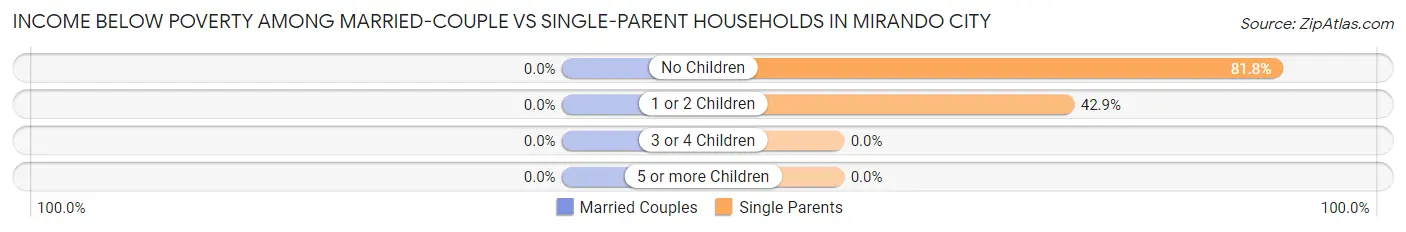
| Children | Married-Couple Families | Single-Parent Households |
| No Children | 0 (0.0%) | 9 (81.8%) |
| 1 or 2 Children | 0 (0.0%) | 6 (42.9%) |
| 3 or 4 Children | 0 (0.0%) | 0 (0.0%) |
| 5 or more Children | 0 (0.0%) | 0 (0.0%) |
| Total | 0 (0.0%) | 15 (60.0%) |
Race in Mirando City
The most populous races in Mirando City are Hispanic or Latino (188 | 94.5%), White / Caucasian (167 | 83.9%), and Two or more Races (32 | 16.1%).
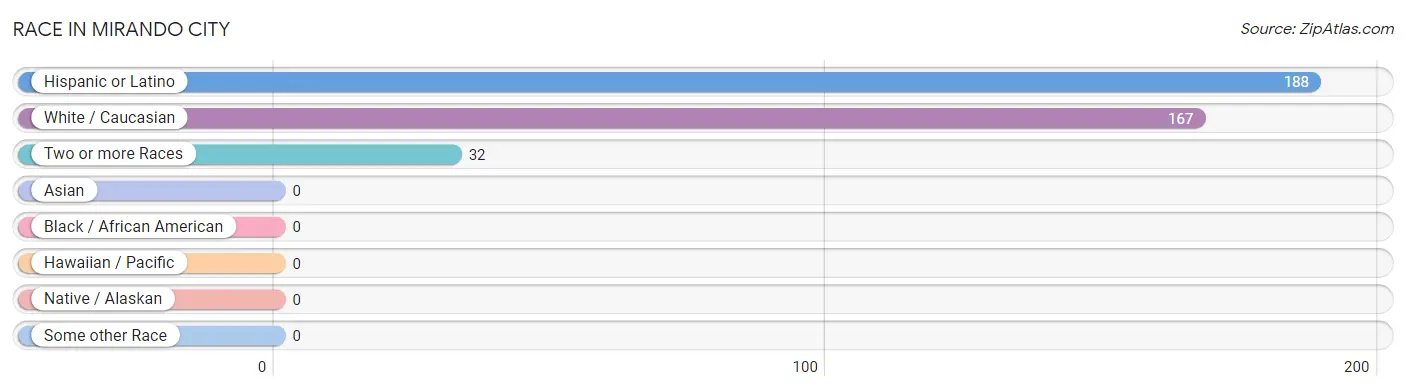
| Race | # Population | % Population |
| Asian | 0 | 0.0% |
| Black / African American | 0 | 0.0% |
| Hawaiian / Pacific | 0 | 0.0% |
| Hispanic or Latino | 188 | 94.5% |
| Native / Alaskan | 0 | 0.0% |
| White / Caucasian | 167 | 83.9% |
| Two or more Races | 32 | 16.1% |
| Some other Race | 0 | 0.0% |
| Total | 199 | 100.0% |
Ancestry in Mirando City
The most populous ancestries reported in Mirando City are Mexican (188 | 94.5%), and Italian (11 | 5.5%), together accounting for 100.0% of all Mirando City residents.
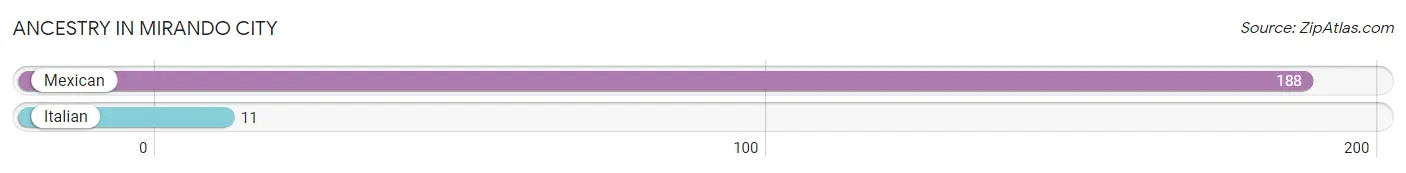
| Ancestry | # Population | % Population |
| Italian | 11 | 5.5% |
| Mexican | 188 | 94.5% | View All 2 Rows |
Immigrants in Mirando City
The most numerous immigrant groups reported in Mirando City came from Central America (5 | 2.5%), Latin America (5 | 2.5%), and Mexico (5 | 2.5%), together accounting for 7.5% of all Mirando City residents.
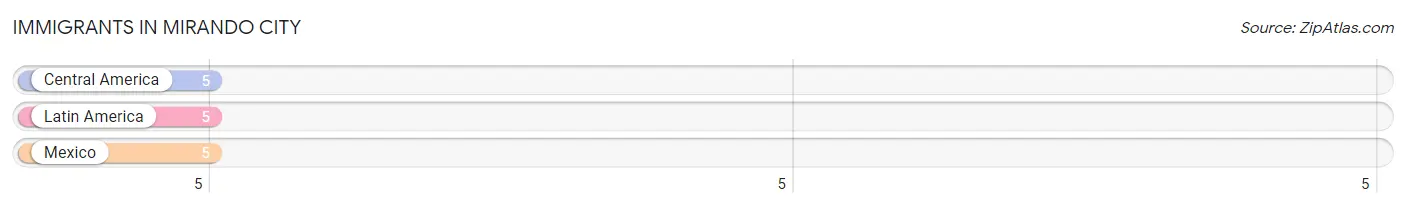
| Immigration Origin | # Population | % Population |
| Central America | 5 | 2.5% |
| Latin America | 5 | 2.5% |
| Mexico | 5 | 2.5% | View All 3 Rows |
Sex and Age in Mirando City
Sex and Age in Mirando City
The most populous age groups in Mirando City are 10 to 14 Years (29 | 29.3%) for men and 20 to 24 Years (22 | 22.0%) for women.
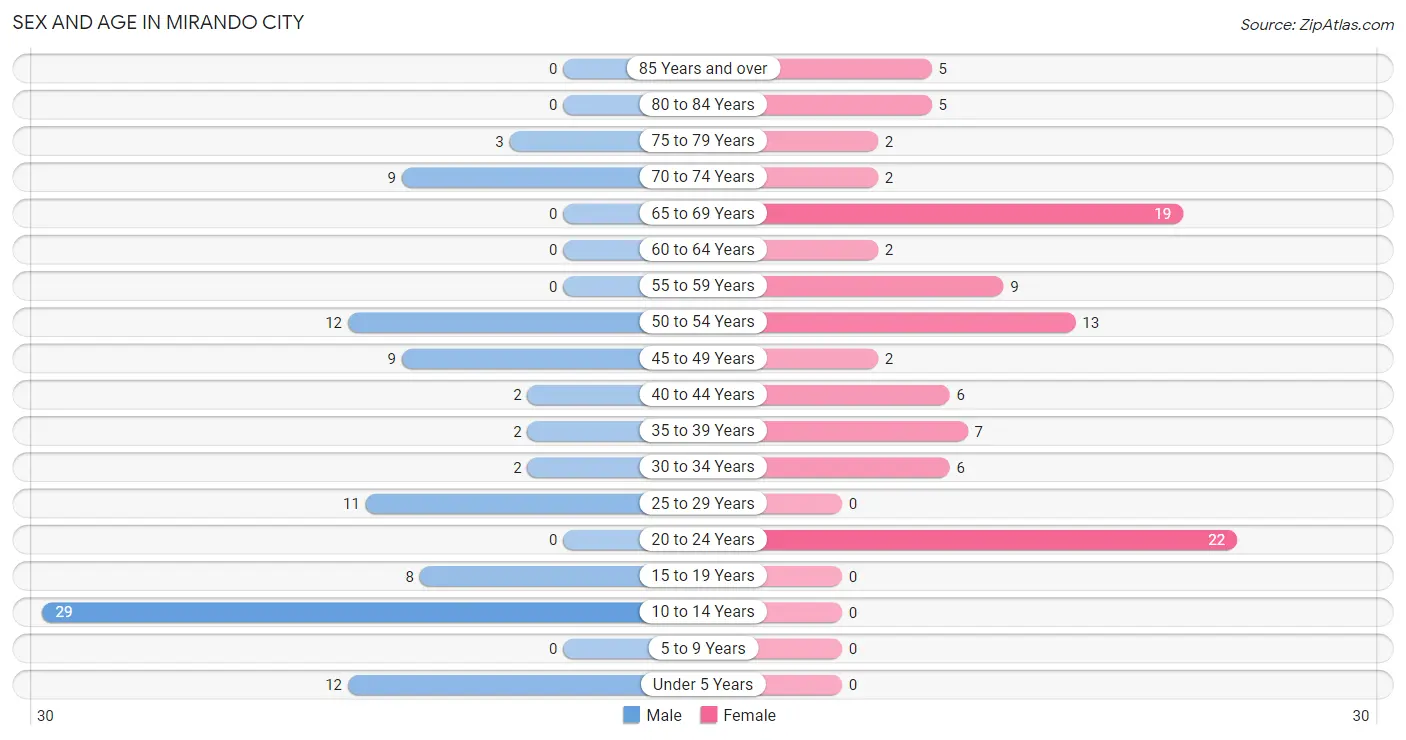
| Age Bracket | Male | Female |
| Under 5 Years | 12 (12.1%) | 0 (0.0%) |
| 5 to 9 Years | 0 (0.0%) | 0 (0.0%) |
| 10 to 14 Years | 29 (29.3%) | 0 (0.0%) |
| 15 to 19 Years | 8 (8.1%) | 0 (0.0%) |
| 20 to 24 Years | 0 (0.0%) | 22 (22.0%) |
| 25 to 29 Years | 11 (11.1%) | 0 (0.0%) |
| 30 to 34 Years | 2 (2.0%) | 6 (6.0%) |
| 35 to 39 Years | 2 (2.0%) | 7 (7.0%) |
| 40 to 44 Years | 2 (2.0%) | 6 (6.0%) |
| 45 to 49 Years | 9 (9.1%) | 2 (2.0%) |
| 50 to 54 Years | 12 (12.1%) | 13 (13.0%) |
| 55 to 59 Years | 0 (0.0%) | 9 (9.0%) |
| 60 to 64 Years | 0 (0.0%) | 2 (2.0%) |
| 65 to 69 Years | 0 (0.0%) | 19 (19.0%) |
| 70 to 74 Years | 9 (9.1%) | 2 (2.0%) |
| 75 to 79 Years | 3 (3.0%) | 2 (2.0%) |
| 80 to 84 Years | 0 (0.0%) | 5 (5.0%) |
| 85 Years and over | 0 (0.0%) | 5 (5.0%) |
| Total | 99 (100.0%) | 100 (100.0%) |
Families and Households in Mirando City
Median Family Size in Mirando City
The median family size in Mirando City is 3.54 persons per family, with married-couple families (21 | 45.7%) accounting for the largest median family size of 3.71 persons per family. On the other hand, single male/father families (2 | 4.3%) represent the smallest median family size with 2.00 persons per family.
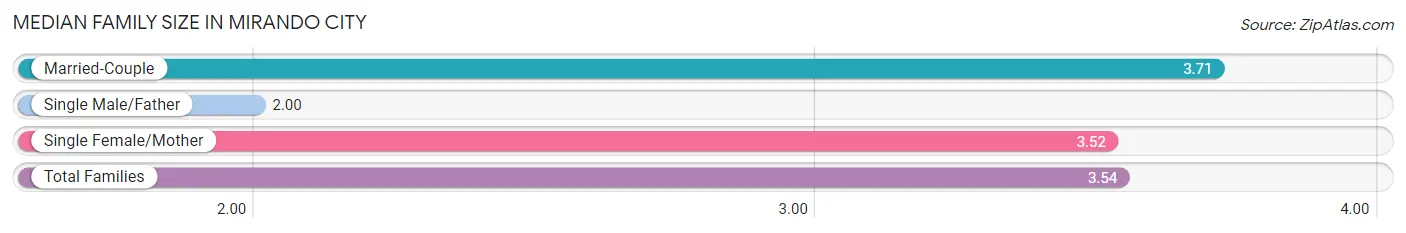
| Family Type | # Families | Family Size |
| Married-Couple | 21 (45.7%) | 3.71 |
| Single Male/Father | 2 (4.3%) | 2.00 |
| Single Female/Mother | 23 (50.0%) | 3.52 |
| Total Families | 46 (100.0%) | 3.54 |
Median Household Size in Mirando City
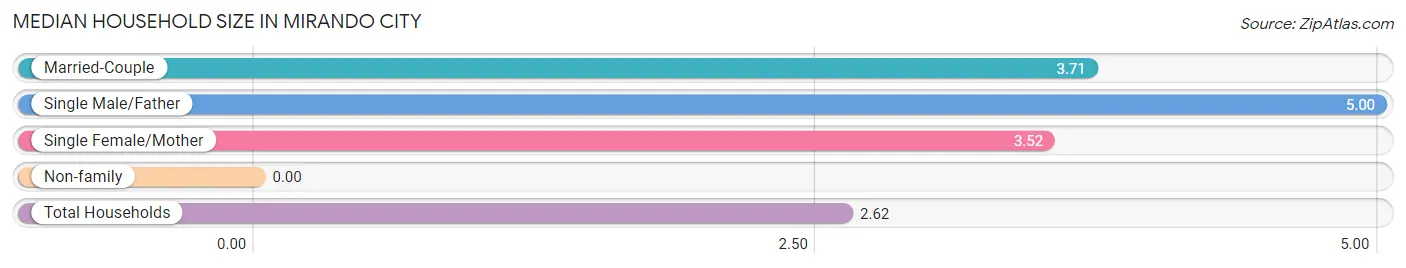
| Household Type | # Households | Household Size |
| Married-Couple | 21 (27.6%) | 3.71 |
| Single Male/Father | 2 (2.6%) | 5.00 |
| Single Female/Mother | 23 (30.3%) | 3.52 |
| Non-family | 30 (39.5%) | - |
| Total Households | 76 (100.0%) | 2.62 |
Household Size by Marriage Status in Mirando City
Out of a total of 76 households in Mirando City, 46 (60.5%) are family households, while 30 (39.5%) are nonfamily households. The most numerous type of family households are 3-person households, comprising 20, and the most common type of nonfamily households are 1-person households, comprising 30.
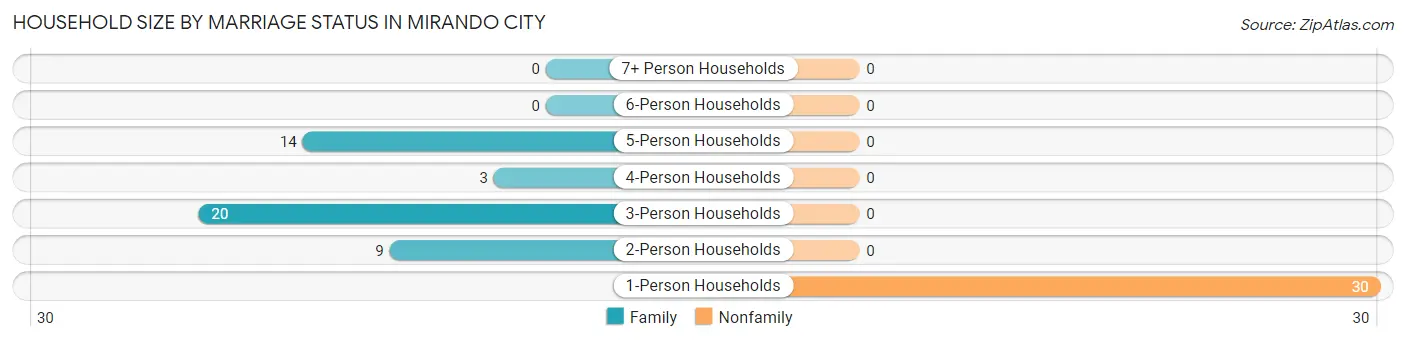
| Household Size | Family Households | Nonfamily Households |
| 1-Person Households | - | 30 (39.5%) |
| 2-Person Households | 9 (11.8%) | 0 (0.0%) |
| 3-Person Households | 20 (26.3%) | 0 (0.0%) |
| 4-Person Households | 3 (4.0%) | 0 (0.0%) |
| 5-Person Households | 14 (18.4%) | 0 (0.0%) |
| 6-Person Households | 0 (0.0%) | 0 (0.0%) |
| 7+ Person Households | 0 (0.0%) | 0 (0.0%) |
| Total | 46 (60.5%) | 30 (39.5%) |
Female Fertility in Mirando City
Fertility by Age in Mirando City
| Age Bracket | Women with Births | Births / 1,000 Women |
| 15 to 19 years | 0 (0.0%) | 0.0 |
| 20 to 34 years | 0 (0.0%) | 0.0 |
| 35 to 50 years | 0 (0.0%) | 0.0 |
| Total | 0 (0.0%) | 0.0 |
Fertility by Age by Marriage Status in Mirando City
| Age Bracket | Married | Unmarried |
| 15 to 19 years | 0 (0.0%) | 0 (0.0%) |
| 20 to 34 years | 0 (0.0%) | 0 (0.0%) |
| 35 to 50 years | 0 (0.0%) | 0 (0.0%) |
| Total | 0 (0.0%) | 0 (0.0%) |
Fertility by Education in Mirando City
| Educational Attainment | Women with Births | Births / 1,000 Women |
| Less than High School | 0 (0.0%) | 0.0 |
| High School Diploma | 0 (0.0%) | 0.0 |
| College or Associate's Degree | 0 (0.0%) | 0.0 |
| Bachelor's Degree | 0 (0.0%) | 0.0 |
| Graduate Degree | 0 (0.0%) | 0.0 |
| Total | 0 (0.0%) | 0.0 |
Fertility by Education by Marriage Status in Mirando City
| Educational Attainment | Married | Unmarried |
| Less than High School | 0 (0.0%) | 0 (0.0%) |
| High School Diploma | 0 (0.0%) | 0 (0.0%) |
| College or Associate's Degree | 0 (0.0%) | 0 (0.0%) |
| Bachelor's Degree | 0 (0.0%) | 0 (0.0%) |
| Graduate Degree | 0 (0.0%) | 0 (0.0%) |
| Total | 0 (0.0%) | 0 (0.0%) |
Employment Characteristics in Mirando City
Employment by Class of Employer in Mirando City
Among the 82 employed individuals in Mirando City, private company employees (57 | 69.5%), local government employees (17 | 20.7%), and self-employed (not incorporated) (5 | 6.1%) make up the most common classes of employment.
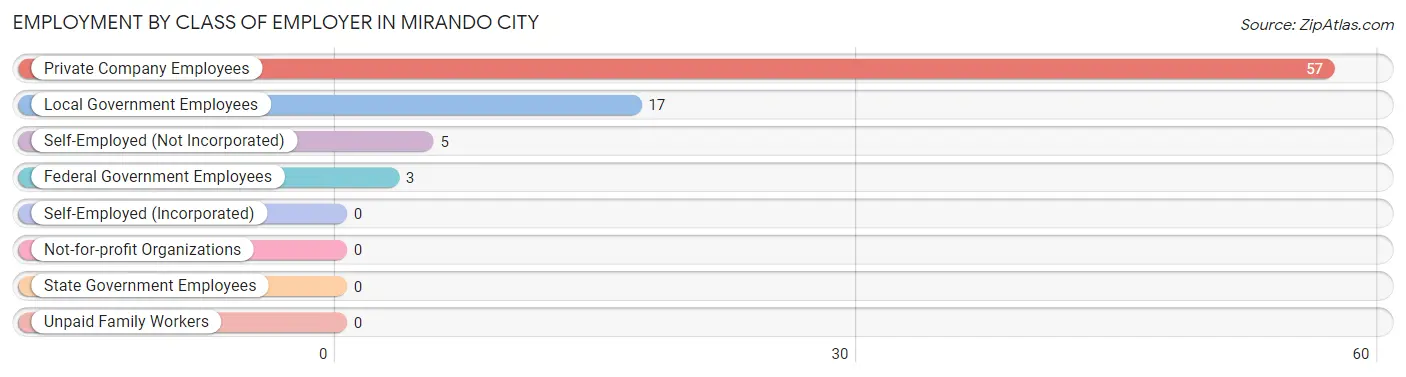
| Employer Class | # Employees | % Employees |
| Private Company Employees | 57 | 69.5% |
| Self-Employed (Incorporated) | 0 | 0.0% |
| Self-Employed (Not Incorporated) | 5 | 6.1% |
| Not-for-profit Organizations | 0 | 0.0% |
| Local Government Employees | 17 | 20.7% |
| State Government Employees | 0 | 0.0% |
| Federal Government Employees | 3 | 3.7% |
| Unpaid Family Workers | 0 | 0.0% |
| Total | 82 | 100.0% |
Employment Status by Age in Mirando City
According to the labor force statistics for Mirando City, out of the total population over 16 years of age (158), 60.1% or 95 individuals are in the labor force, with 13.7% or 13 of them unemployed. The age group with the highest labor force participation rate is 16 to 19 years, with 100.0% or 8 individuals in the labor force. Within the labor force, the 16 to 19 years age range has the highest percentage of unemployed individuals, with 100.0% or 8 of them being unemployed.
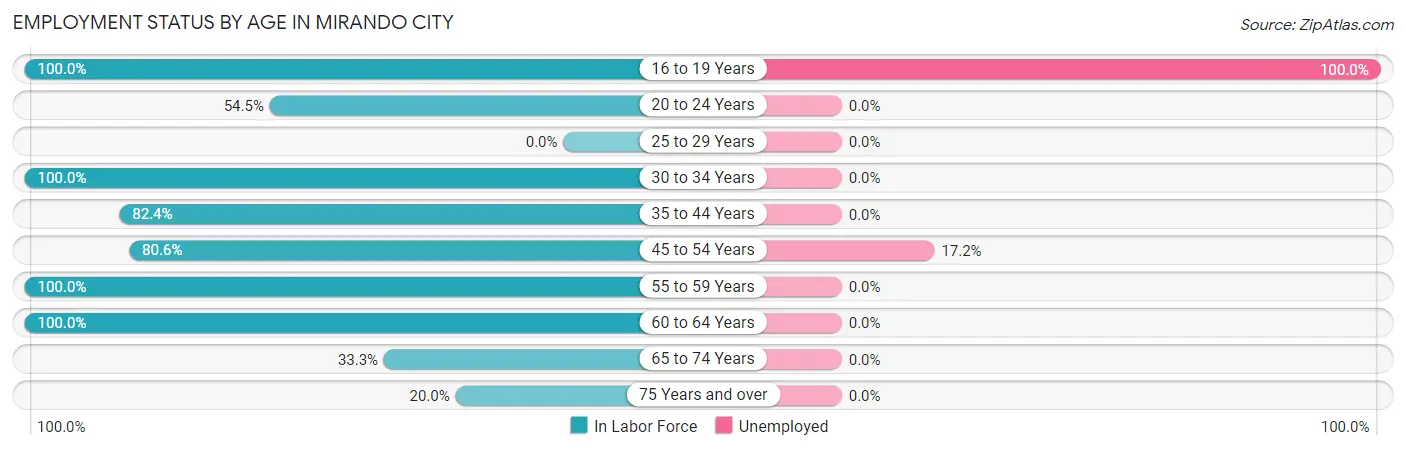
| Age Bracket | In Labor Force | Unemployed |
| 16 to 19 Years | 8 (100.0%) | 8 (100.0%) |
| 20 to 24 Years | 12 (54.5%) | 0 (0.0%) |
| 25 to 29 Years | 0 (0.0%) | 0 (0.0%) |
| 30 to 34 Years | 8 (100.0%) | 0 (0.0%) |
| 35 to 44 Years | 14 (82.4%) | 0 (0.0%) |
| 45 to 54 Years | 29 (80.6%) | 5 (17.2%) |
| 55 to 59 Years | 9 (100.0%) | 0 (0.0%) |
| 60 to 64 Years | 2 (100.0%) | 0 (0.0%) |
| 65 to 74 Years | 10 (33.3%) | 0 (0.0%) |
| 75 Years and over | 3 (20.0%) | 0 (0.0%) |
| Total | 95 (60.1%) | 13 (13.7%) |
Employment Status by Educational Attainment in Mirando City
According to labor force statistics for Mirando City, 74.7% of individuals (62) out of the total population between 25 and 64 years of age (83) are in the labor force, with 8.1% or 5 of them being unemployed. The group with the highest labor force participation rate are those with the educational attainment of high school diploma, with 100.0% or 25 individuals in the labor force. Within the labor force, individuals with high school diploma education have the highest percentage of unemployment, with 20.0% or 5 of them being unemployed.
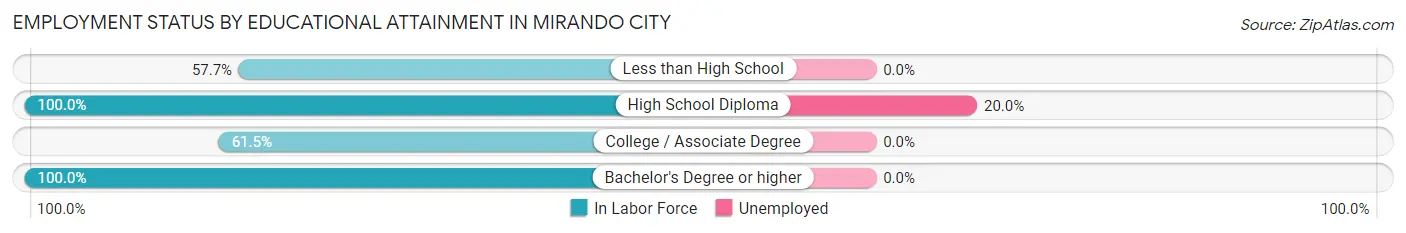
| Educational Attainment | In Labor Force | Unemployed |
| Less than High School | 15 (57.7%) | 0 (0.0%) |
| High School Diploma | 25 (100.0%) | 5 (20.0%) |
| College / Associate Degree | 16 (61.5%) | 0 (0.0%) |
| Bachelor's Degree or higher | 6 (100.0%) | 0 (0.0%) |
| Total | 62 (74.7%) | 7 (8.1%) |
Employment Occupations by Sex in Mirando City
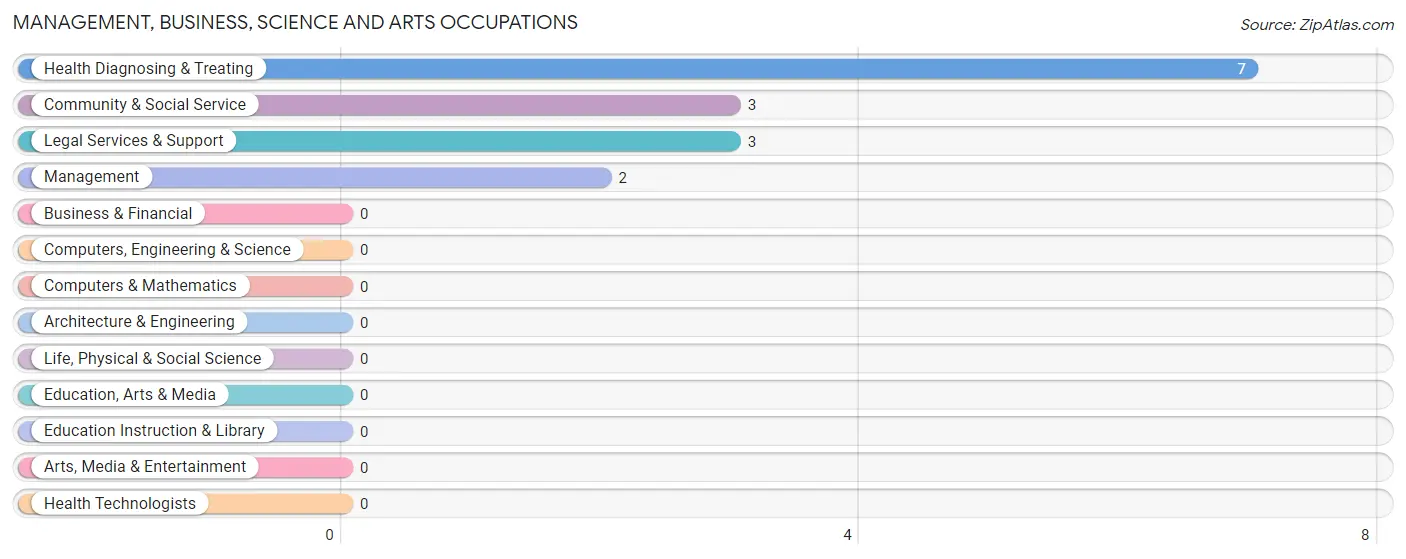
Management, Business, Science and Arts Occupations
The most common Management, Business, Science and Arts occupations in Mirando City are Health Diagnosing & Treating (7 | 8.5%), Community & Social Service (3 | 3.7%), Legal Services & Support (3 | 3.7%), and Management (2 | 2.4%).
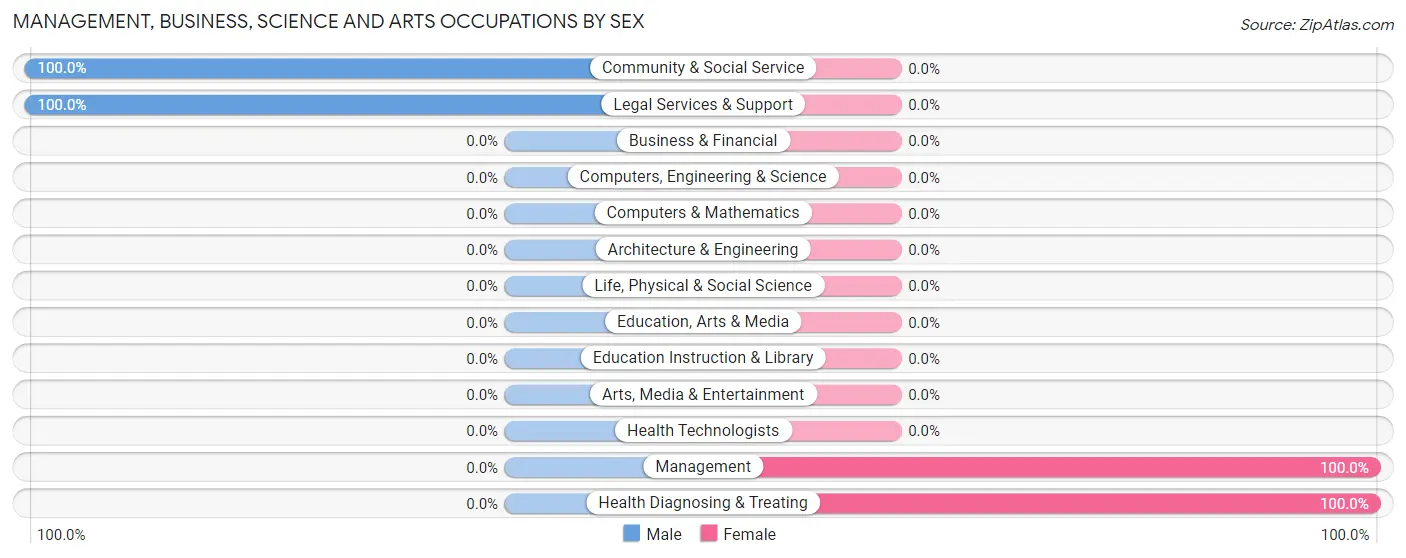
Management, Business, Science and Arts Occupations by Sex
Within the Management, Business, Science and Arts occupations in Mirando City, the most male-oriented occupations are Community & Social Service (100.0%), and Legal Services & Support (100.0%), while the most female-oriented occupations are Management (100.0%), and Health Diagnosing & Treating (100.0%).
| Occupation | Male | Female |
| Management | 0 (0.0%) | 2 (100.0%) |
| Business & Financial | 0 (0.0%) | 0 (0.0%) |
| Computers, Engineering & Science | 0 (0.0%) | 0 (0.0%) |
| Computers & Mathematics | 0 (0.0%) | 0 (0.0%) |
| Architecture & Engineering | 0 (0.0%) | 0 (0.0%) |
| Life, Physical & Social Science | 0 (0.0%) | 0 (0.0%) |
| Community & Social Service | 3 (100.0%) | 0 (0.0%) |
| Education, Arts & Media | 0 (0.0%) | 0 (0.0%) |
| Legal Services & Support | 3 (100.0%) | 0 (0.0%) |
| Education Instruction & Library | 0 (0.0%) | 0 (0.0%) |
| Arts, Media & Entertainment | 0 (0.0%) | 0 (0.0%) |
| Health Diagnosing & Treating | 0 (0.0%) | 7 (100.0%) |
| Health Technologists | 0 (0.0%) | 0 (0.0%) |
| Total (Category) | 3 (25.0%) | 9 (75.0%) |
| Total (Overall) | 25 (30.5%) | 57 (69.5%) |
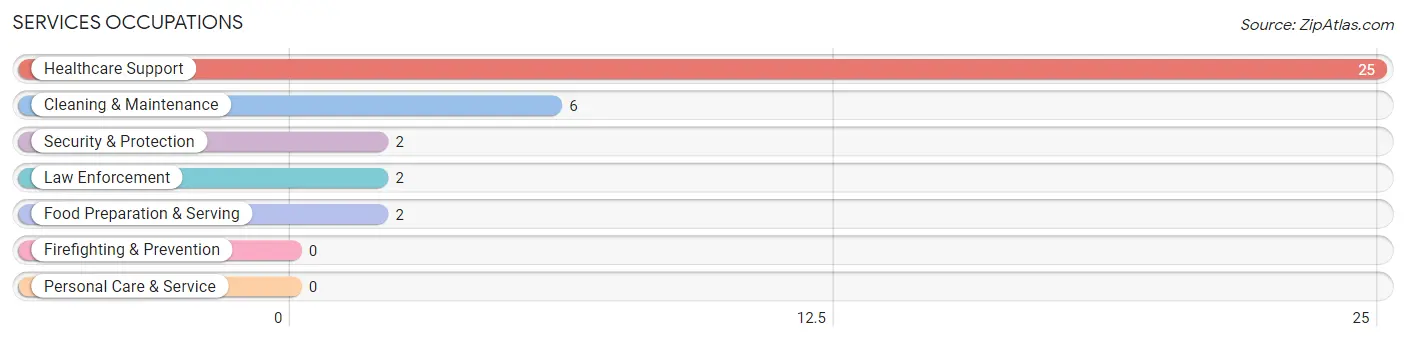
Services Occupations
The most common Services occupations in Mirando City are Healthcare Support (25 | 30.5%), Cleaning & Maintenance (6 | 7.3%), Security & Protection (2 | 2.4%), Law Enforcement (2 | 2.4%), and Food Preparation & Serving (2 | 2.4%).
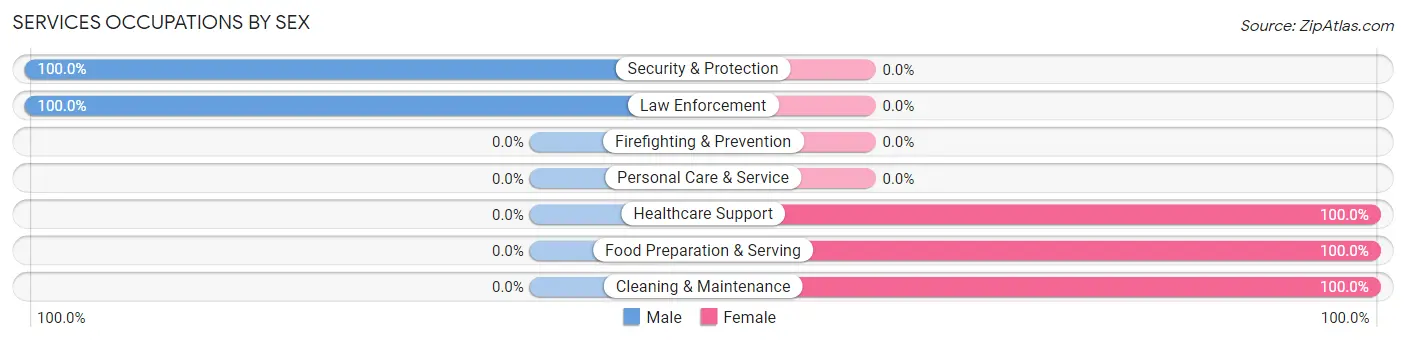
Services Occupations by Sex
Within the Services occupations in Mirando City, the most male-oriented occupations are Security & Protection (100.0%), and Law Enforcement (100.0%), while the most female-oriented occupations are Healthcare Support (100.0%), Food Preparation & Serving (100.0%), and Cleaning & Maintenance (100.0%).
| Occupation | Male | Female |
| Healthcare Support | 0 (0.0%) | 25 (100.0%) |
| Security & Protection | 2 (100.0%) | 0 (0.0%) |
| Firefighting & Prevention | 0 (0.0%) | 0 (0.0%) |
| Law Enforcement | 2 (100.0%) | 0 (0.0%) |
| Food Preparation & Serving | 0 (0.0%) | 2 (100.0%) |
| Cleaning & Maintenance | 0 (0.0%) | 6 (100.0%) |
| Personal Care & Service | 0 (0.0%) | 0 (0.0%) |
| Total (Category) | 2 (5.7%) | 33 (94.3%) |
| Total (Overall) | 25 (30.5%) | 57 (69.5%) |
Sales and Office Occupations
The most common Sales and Office occupations in Mirando City are , and Office & Administration (13 | 15.9%).

Sales and Office Occupations by Sex

| Occupation | Male | Female |
| Sales & Related | 0 (0.0%) | 0 (0.0%) |
| Office & Administration | 0 (0.0%) | 13 (100.0%) |
| Total (Category) | 0 (0.0%) | 13 (100.0%) |
| Total (Overall) | 25 (30.5%) | 57 (69.5%) |
Natural Resources, Construction and Maintenance Occupations
The most common Natural Resources, Construction and Maintenance occupations in Mirando City are , and Construction & Extraction (20 | 24.4%).
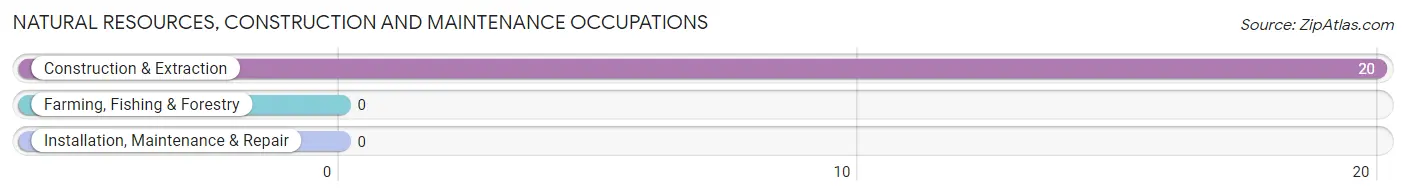
Natural Resources, Construction and Maintenance Occupations by Sex
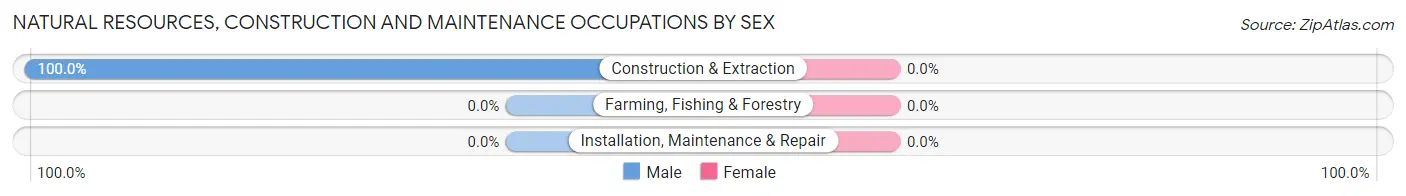
| Occupation | Male | Female |
| Farming, Fishing & Forestry | 0 (0.0%) | 0 (0.0%) |
| Construction & Extraction | 20 (100.0%) | 0 (0.0%) |
| Installation, Maintenance & Repair | 0 (0.0%) | 0 (0.0%) |
| Total (Category) | 20 (100.0%) | 0 (0.0%) |
| Total (Overall) | 25 (30.5%) | 57 (69.5%) |
Production, Transportation and Moving Occupations
The most common Production, Transportation and Moving occupations in Mirando City are , and Production (2 | 2.4%).
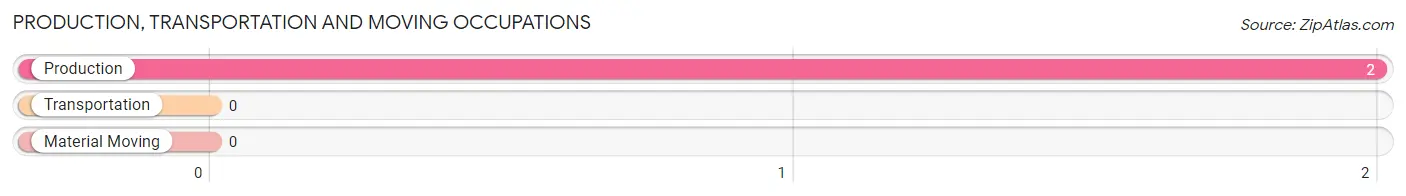
Production, Transportation and Moving Occupations by Sex
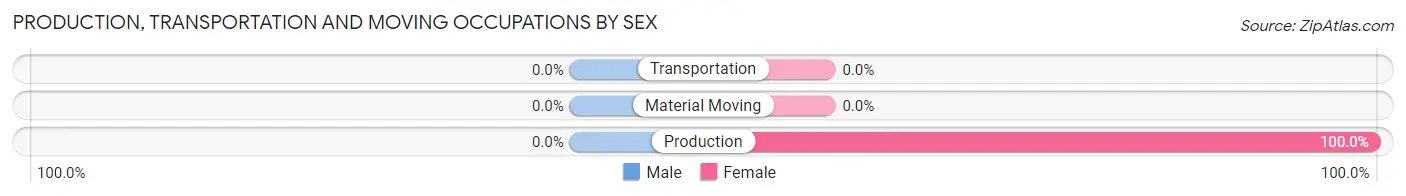
| Occupation | Male | Female |
| Production | 0 (0.0%) | 2 (100.0%) |
| Transportation | 0 (0.0%) | 0 (0.0%) |
| Material Moving | 0 (0.0%) | 0 (0.0%) |
| Total (Category) | 0 (0.0%) | 2 (100.0%) |
| Total (Overall) | 25 (30.5%) | 57 (69.5%) |
Employment Industries by Sex in Mirando City
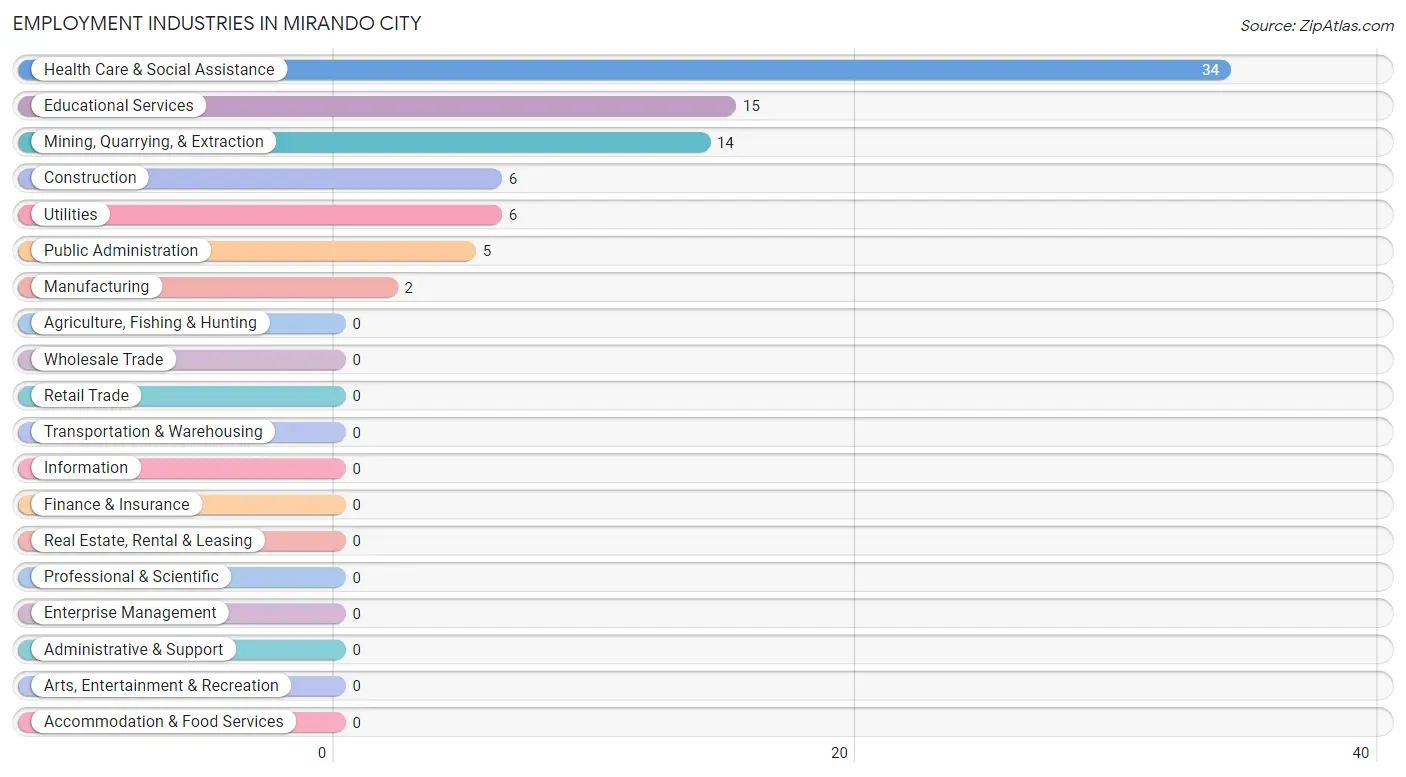
Employment Industries in Mirando City
The major employment industries in Mirando City include Health Care & Social Assistance (34 | 41.5%), Educational Services (15 | 18.3%), Mining, Quarrying, & Extraction (14 | 17.1%), Construction (6 | 7.3%), and Utilities (6 | 7.3%).
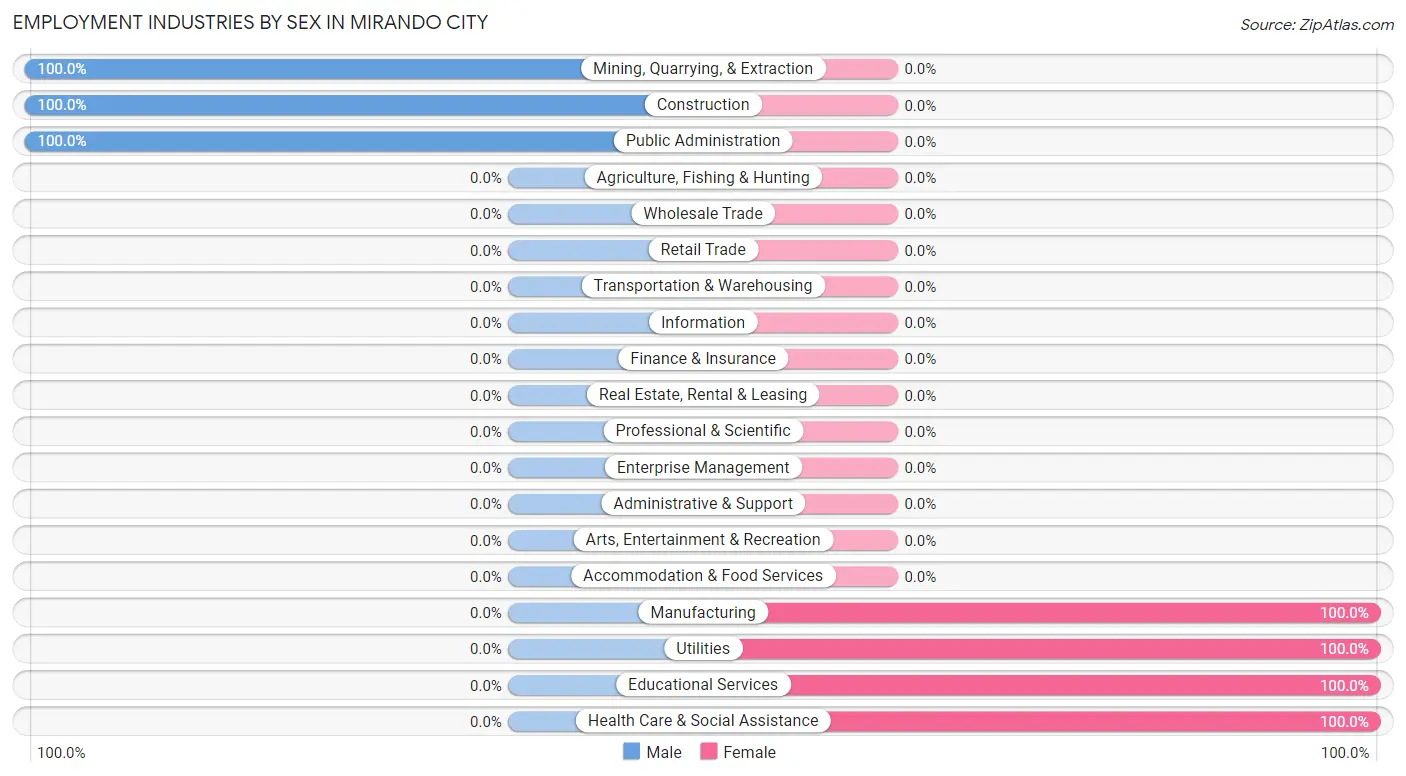
Employment Industries by Sex in Mirando City
The Mirando City industries that see more men than women are Mining, Quarrying, & Extraction (100.0%), Construction (100.0%), and Public Administration (100.0%), whereas the industries that tend to have a higher number of women are Manufacturing (100.0%), Utilities (100.0%), and Educational Services (100.0%).
| Industry | Male | Female |
| Agriculture, Fishing & Hunting | 0 (0.0%) | 0 (0.0%) |
| Mining, Quarrying, & Extraction | 14 (100.0%) | 0 (0.0%) |
| Construction | 6 (100.0%) | 0 (0.0%) |
| Manufacturing | 0 (0.0%) | 2 (100.0%) |
| Wholesale Trade | 0 (0.0%) | 0 (0.0%) |
| Retail Trade | 0 (0.0%) | 0 (0.0%) |
| Transportation & Warehousing | 0 (0.0%) | 0 (0.0%) |
| Utilities | 0 (0.0%) | 6 (100.0%) |
| Information | 0 (0.0%) | 0 (0.0%) |
| Finance & Insurance | 0 (0.0%) | 0 (0.0%) |
| Real Estate, Rental & Leasing | 0 (0.0%) | 0 (0.0%) |
| Professional & Scientific | 0 (0.0%) | 0 (0.0%) |
| Enterprise Management | 0 (0.0%) | 0 (0.0%) |
| Administrative & Support | 0 (0.0%) | 0 (0.0%) |
| Educational Services | 0 (0.0%) | 15 (100.0%) |
| Health Care & Social Assistance | 0 (0.0%) | 34 (100.0%) |
| Arts, Entertainment & Recreation | 0 (0.0%) | 0 (0.0%) |
| Accommodation & Food Services | 0 (0.0%) | 0 (0.0%) |
| Public Administration | 5 (100.0%) | 0 (0.0%) |
| Total | 25 (30.5%) | 57 (69.5%) |
Education in Mirando City
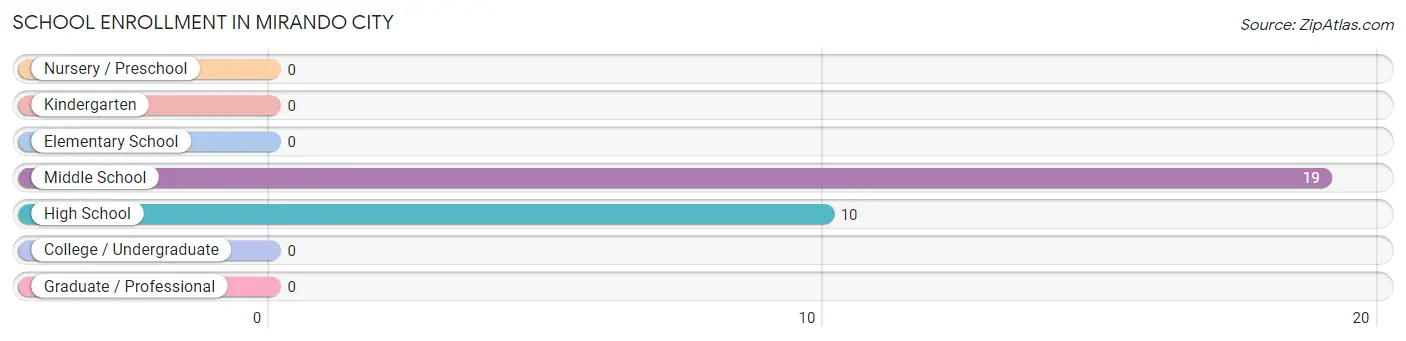
School Enrollment in Mirando City
The most common levels of schooling among the 29 students in Mirando City are middle school (19 | 65.5%), and high school (10 | 34.5%).
| School Level | # Students | % Students |
| Nursery / Preschool | 0 | 0.0% |
| Kindergarten | 0 | 0.0% |
| Elementary School | 0 | 0.0% |
| Middle School | 19 | 65.5% |
| High School | 10 | 34.5% |
| College / Undergraduate | 0 | 0.0% |
| Graduate / Professional | 0 | 0.0% |
| Total | 29 | 100.0% |
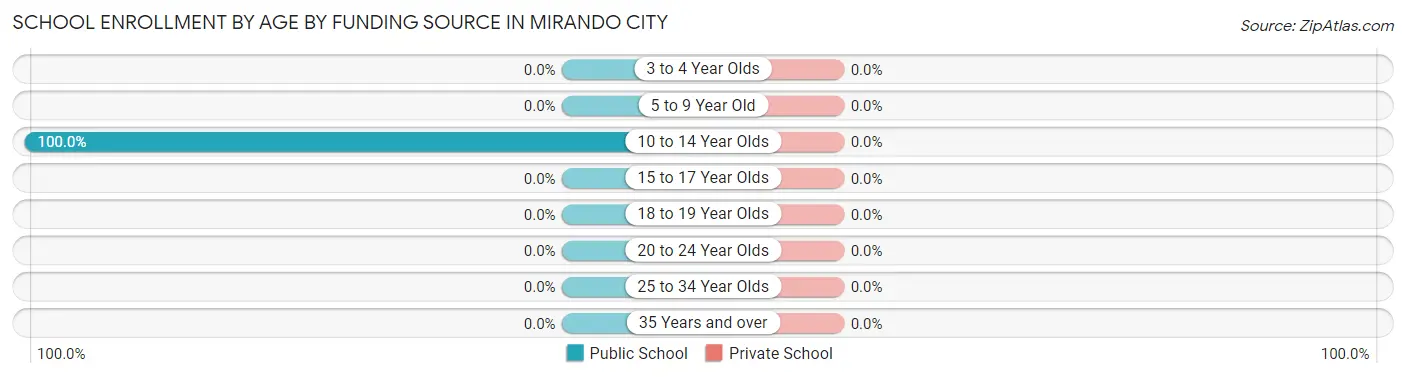
School Enrollment by Age by Funding Source in Mirando City
| Age Bracket | Public School | Private School |
| 3 to 4 Year Olds | 0 (0.0%) | 0 (0.0%) |
| 5 to 9 Year Old | 0 (0.0%) | 0 (0.0%) |
| 10 to 14 Year Olds | 29 (100.0%) | 0 (0.0%) |
| 15 to 17 Year Olds | 0 (0.0%) | 0 (0.0%) |
| 18 to 19 Year Olds | 0 (0.0%) | 0 (0.0%) |
| 20 to 24 Year Olds | 0 (0.0%) | 0 (0.0%) |
| 25 to 34 Year Olds | 0 (0.0%) | 0 (0.0%) |
| 35 Years and over | 0 (0.0%) | 0 (0.0%) |
| Total | 29 (100.0%) | 0 (0.0%) |
Educational Attainment by Field of Study in Mirando City
Science & technology (6 | 37.5%), education (5 | 31.2%), and arts & humanities (5 | 31.2%) are the most common fields of study among 16 individuals in Mirando City who have obtained a bachelor's degree or higher.
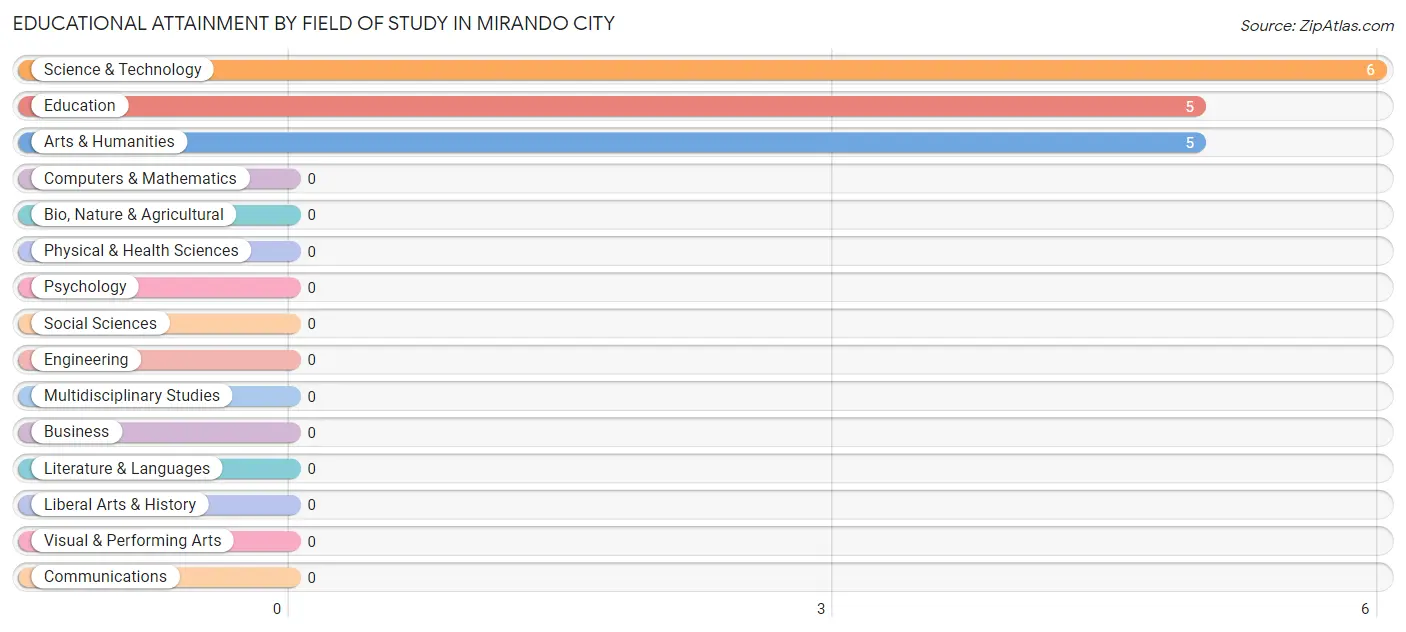
| Field of Study | # Graduates | % Graduates |
| Computers & Mathematics | 0 | 0.0% |
| Bio, Nature & Agricultural | 0 | 0.0% |
| Physical & Health Sciences | 0 | 0.0% |
| Psychology | 0 | 0.0% |
| Social Sciences | 0 | 0.0% |
| Engineering | 0 | 0.0% |
| Multidisciplinary Studies | 0 | 0.0% |
| Science & Technology | 6 | 37.5% |
| Business | 0 | 0.0% |
| Education | 5 | 31.2% |
| Literature & Languages | 0 | 0.0% |
| Liberal Arts & History | 0 | 0.0% |
| Visual & Performing Arts | 0 | 0.0% |
| Communications | 0 | 0.0% |
| Arts & Humanities | 5 | 31.2% |
| Total | 16 | 100.0% |
Transportation & Commute in Mirando City
Vehicle Availability by Sex in Mirando City
The most prevalent vehicle ownership categories in Mirando City are males with 2 vehicles (13, accounting for 52.0%) and females with 2 vehicles (26, making up 22.8%).
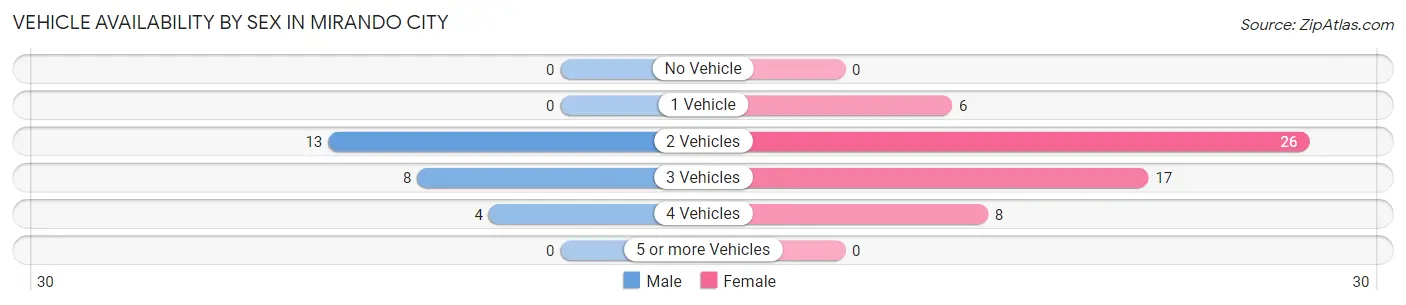
| Vehicles Available | Male | Female |
| No Vehicle | 0 (0.0%) | 0 (0.0%) |
| 1 Vehicle | 0 (0.0%) | 6 (10.5%) |
| 2 Vehicles | 13 (52.0%) | 26 (45.6%) |
| 3 Vehicles | 8 (32.0%) | 17 (29.8%) |
| 4 Vehicles | 4 (16.0%) | 8 (14.0%) |
| 5 or more Vehicles | 0 (0.0%) | 0 (0.0%) |
| Total | 25 (100.0%) | 57 (100.0%) |
Commute Time in Mirando City
The most frequently occuring commute durations in Mirando City are 5 to 9 minutes (17 commuters, 20.7%), 30 to 34 minutes (12 commuters, 14.6%), and 10 to 14 minutes (11 commuters, 13.4%).
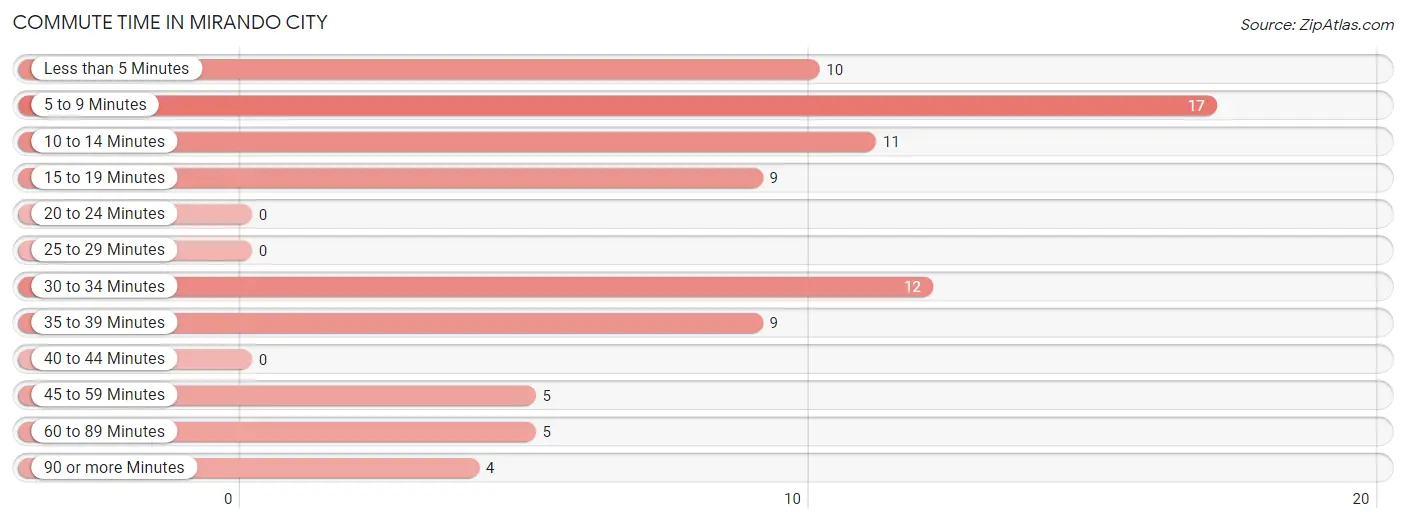
| Commute Time | # Commuters | % Commuters |
| Less than 5 Minutes | 10 | 12.2% |
| 5 to 9 Minutes | 17 | 20.7% |
| 10 to 14 Minutes | 11 | 13.4% |
| 15 to 19 Minutes | 9 | 11.0% |
| 20 to 24 Minutes | 0 | 0.0% |
| 25 to 29 Minutes | 0 | 0.0% |
| 30 to 34 Minutes | 12 | 14.6% |
| 35 to 39 Minutes | 9 | 11.0% |
| 40 to 44 Minutes | 0 | 0.0% |
| 45 to 59 Minutes | 5 | 6.1% |
| 60 to 89 Minutes | 5 | 6.1% |
| 90 or more Minutes | 4 | 4.9% |
Commute Time by Sex in Mirando City
The most common commute times in Mirando City are less than 5 minutes (7 commuters, 28.0%) for males and 5 to 9 minutes (17 commuters, 29.8%) for females.
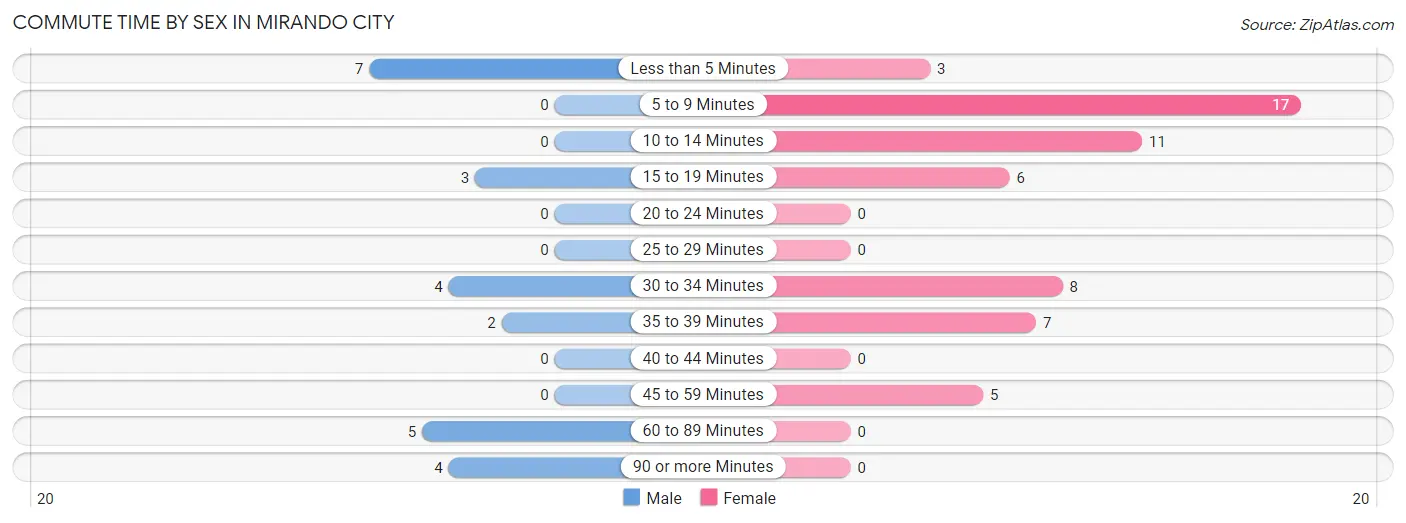
| Commute Time | Male | Female |
| Less than 5 Minutes | 7 (28.0%) | 3 (5.3%) |
| 5 to 9 Minutes | 0 (0.0%) | 17 (29.8%) |
| 10 to 14 Minutes | 0 (0.0%) | 11 (19.3%) |
| 15 to 19 Minutes | 3 (12.0%) | 6 (10.5%) |
| 20 to 24 Minutes | 0 (0.0%) | 0 (0.0%) |
| 25 to 29 Minutes | 0 (0.0%) | 0 (0.0%) |
| 30 to 34 Minutes | 4 (16.0%) | 8 (14.0%) |
| 35 to 39 Minutes | 2 (8.0%) | 7 (12.3%) |
| 40 to 44 Minutes | 0 (0.0%) | 0 (0.0%) |
| 45 to 59 Minutes | 0 (0.0%) | 5 (8.8%) |
| 60 to 89 Minutes | 5 (20.0%) | 0 (0.0%) |
| 90 or more Minutes | 4 (16.0%) | 0 (0.0%) |
Time of Departure to Work by Sex in Mirando City
The most frequent times of departure to work in Mirando City are 5:00 AM to 5:29 AM (7, 28.0%) for males and 8:00 AM to 8:29 AM (20, 35.1%) for females.
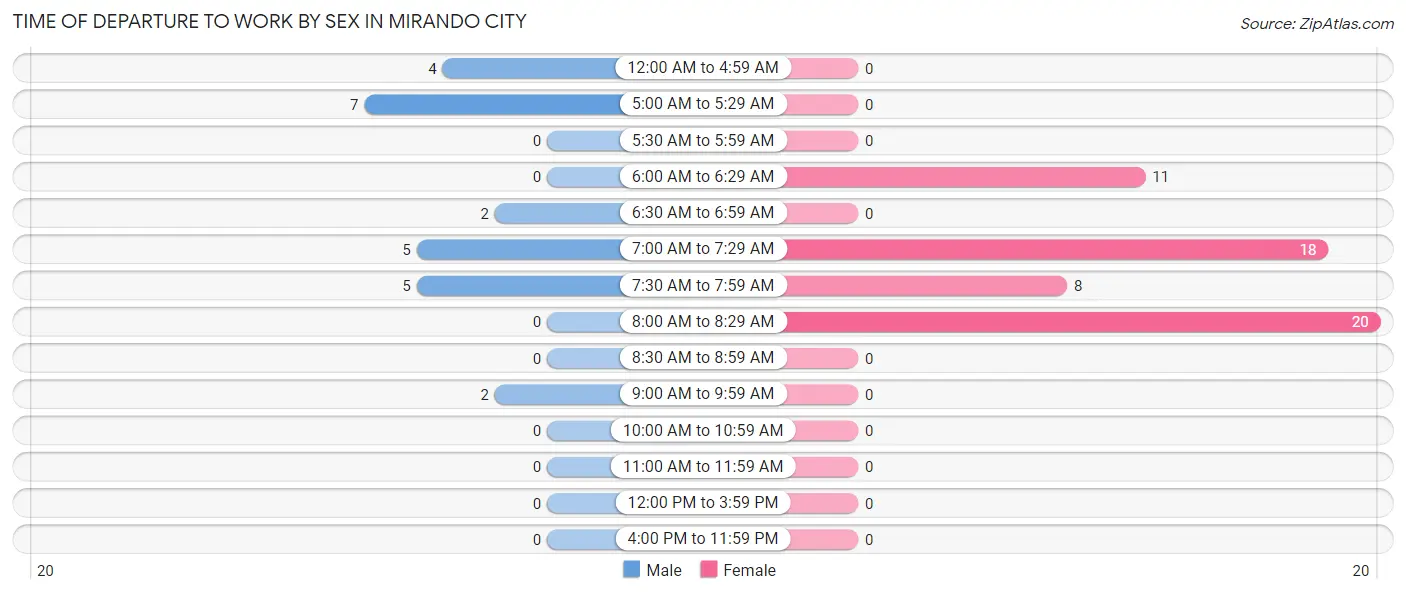
| Time of Departure | Male | Female |
| 12:00 AM to 4:59 AM | 4 (16.0%) | 0 (0.0%) |
| 5:00 AM to 5:29 AM | 7 (28.0%) | 0 (0.0%) |
| 5:30 AM to 5:59 AM | 0 (0.0%) | 0 (0.0%) |
| 6:00 AM to 6:29 AM | 0 (0.0%) | 11 (19.3%) |
| 6:30 AM to 6:59 AM | 2 (8.0%) | 0 (0.0%) |
| 7:00 AM to 7:29 AM | 5 (20.0%) | 18 (31.6%) |
| 7:30 AM to 7:59 AM | 5 (20.0%) | 8 (14.0%) |
| 8:00 AM to 8:29 AM | 0 (0.0%) | 20 (35.1%) |
| 8:30 AM to 8:59 AM | 0 (0.0%) | 0 (0.0%) |
| 9:00 AM to 9:59 AM | 2 (8.0%) | 0 (0.0%) |
| 10:00 AM to 10:59 AM | 0 (0.0%) | 0 (0.0%) |
| 11:00 AM to 11:59 AM | 0 (0.0%) | 0 (0.0%) |
| 12:00 PM to 3:59 PM | 0 (0.0%) | 0 (0.0%) |
| 4:00 PM to 11:59 PM | 0 (0.0%) | 0 (0.0%) |
| Total | 25 (100.0%) | 57 (100.0%) |
Housing Occupancy in Mirando City
Occupancy by Ownership in Mirando City
Of the total 76 dwellings in Mirando City, owner-occupied units account for 52 (68.4%), while renter-occupied units make up 24 (31.6%).
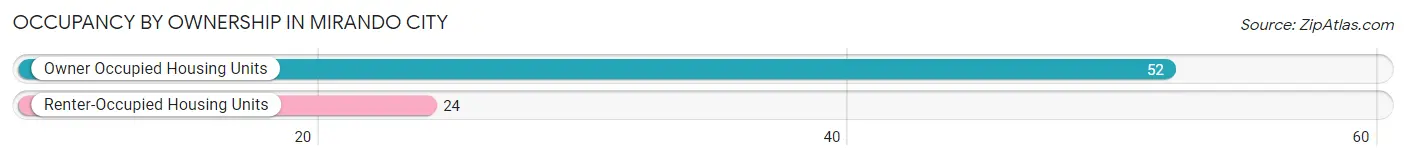
| Occupancy | # Housing Units | % Housing Units |
| Owner Occupied Housing Units | 52 | 68.4% |
| Renter-Occupied Housing Units | 24 | 31.6% |
| Total Occupied Housing Units | 76 | 100.0% |
Occupancy by Household Size in Mirando City
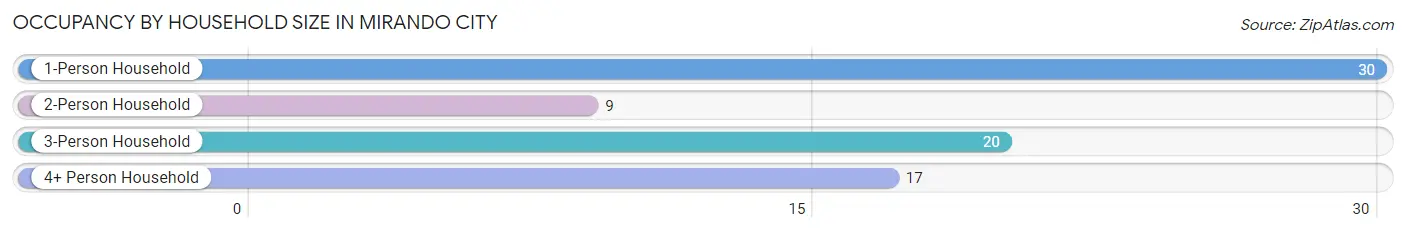
| Household Size | # Housing Units | % Housing Units |
| 1-Person Household | 30 | 39.5% |
| 2-Person Household | 9 | 11.8% |
| 3-Person Household | 20 | 26.3% |
| 4+ Person Household | 17 | 22.4% |
| Total Housing Units | 76 | 100.0% |
Occupancy by Ownership by Household Size in Mirando City
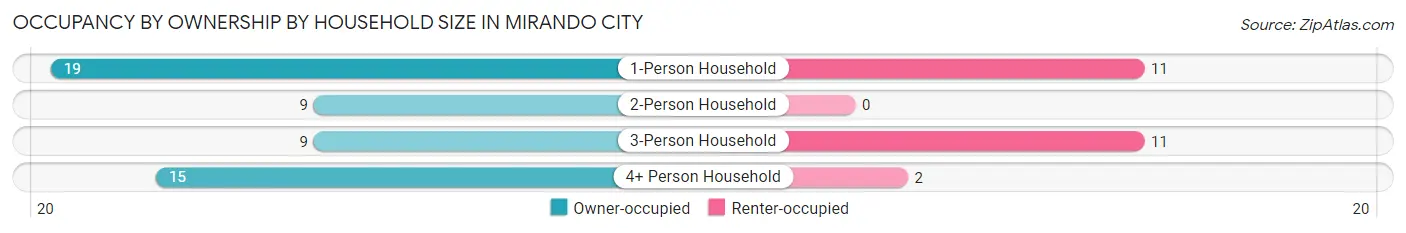
| Household Size | Owner-occupied | Renter-occupied |
| 1-Person Household | 19 (63.3%) | 11 (36.7%) |
| 2-Person Household | 9 (100.0%) | 0 (0.0%) |
| 3-Person Household | 9 (45.0%) | 11 (55.0%) |
| 4+ Person Household | 15 (88.2%) | 2 (11.8%) |
| Total Housing Units | 52 (68.4%) | 24 (31.6%) |
Occupancy by Educational Attainment in Mirando City
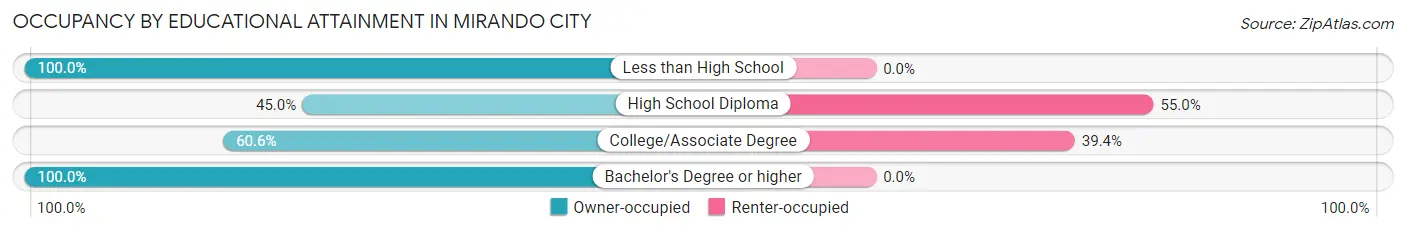
| Household Size | Owner-occupied | Renter-occupied |
| Less than High School | 18 (100.0%) | 0 (0.0%) |
| High School Diploma | 9 (45.0%) | 11 (55.0%) |
| College/Associate Degree | 20 (60.6%) | 13 (39.4%) |
| Bachelor's Degree or higher | 5 (100.0%) | 0 (0.0%) |
Occupancy by Age of Householder in Mirando City
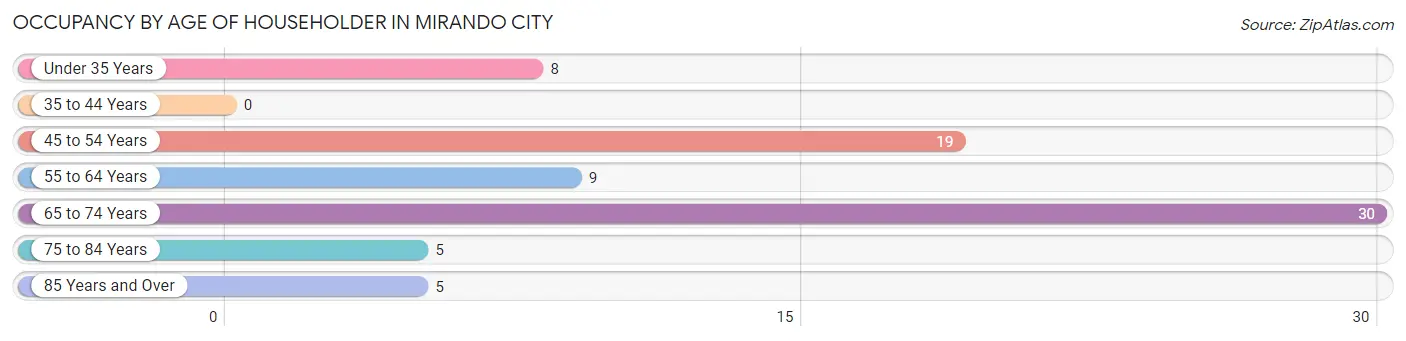
| Age Bracket | # Households | % Households |
| Under 35 Years | 8 | 10.5% |
| 35 to 44 Years | 0 | 0.0% |
| 45 to 54 Years | 19 | 25.0% |
| 55 to 64 Years | 9 | 11.8% |
| 65 to 74 Years | 30 | 39.5% |
| 75 to 84 Years | 5 | 6.6% |
| 85 Years and Over | 5 | 6.6% |
| Total | 76 | 100.0% |
Housing Finances in Mirando City
Median Income by Occupancy in Mirando City
| Occupancy Type | # Households | Median Income |
| Owner-Occupied | 52 (68.4%) | $0 |
| Renter-Occupied | 24 (31.6%) | $0 |
| Average | 76 (100.0%) | $0 |
Occupancy by Householder Income Bracket in Mirando City
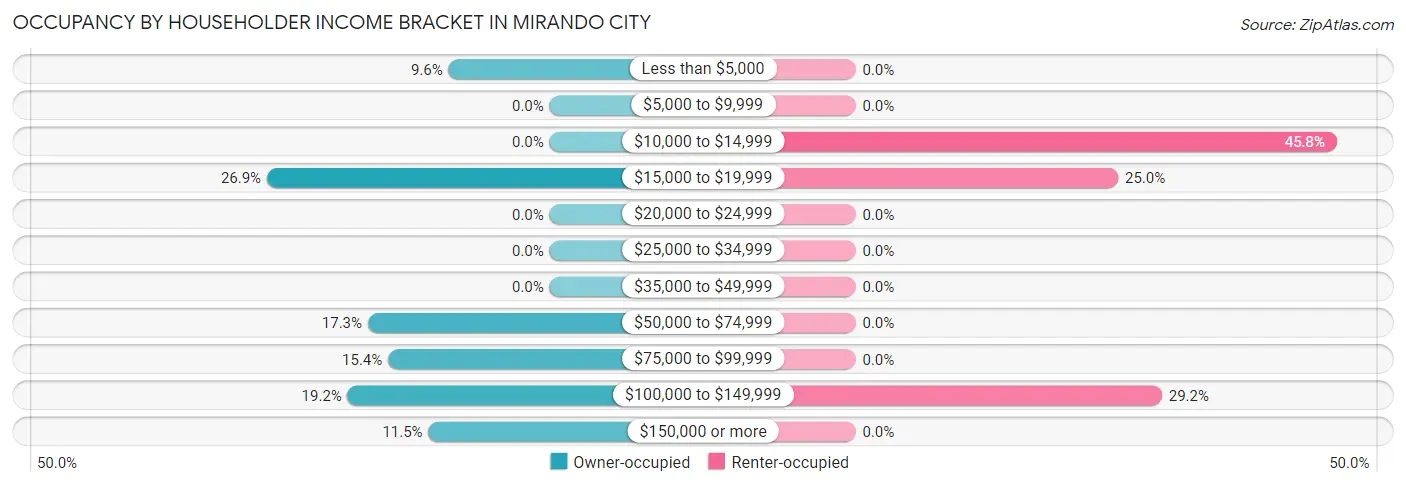
| Income Bracket | Owner-occupied | Renter-occupied |
| Less than $5,000 | 5 (9.6%) | 0 (0.0%) |
| $5,000 to $9,999 | 0 (0.0%) | 0 (0.0%) |
| $10,000 to $14,999 | 0 (0.0%) | 11 (45.8%) |
| $15,000 to $19,999 | 14 (26.9%) | 6 (25.0%) |
| $20,000 to $24,999 | 0 (0.0%) | 0 (0.0%) |
| $25,000 to $34,999 | 0 (0.0%) | 0 (0.0%) |
| $35,000 to $49,999 | 0 (0.0%) | 0 (0.0%) |
| $50,000 to $74,999 | 9 (17.3%) | 0 (0.0%) |
| $75,000 to $99,999 | 8 (15.4%) | 0 (0.0%) |
| $100,000 to $149,999 | 10 (19.2%) | 7 (29.2%) |
| $150,000 or more | 6 (11.5%) | 0 (0.0%) |
| Total | 52 (100.0%) | 24 (100.0%) |
Monthly Housing Cost Tiers in Mirando City
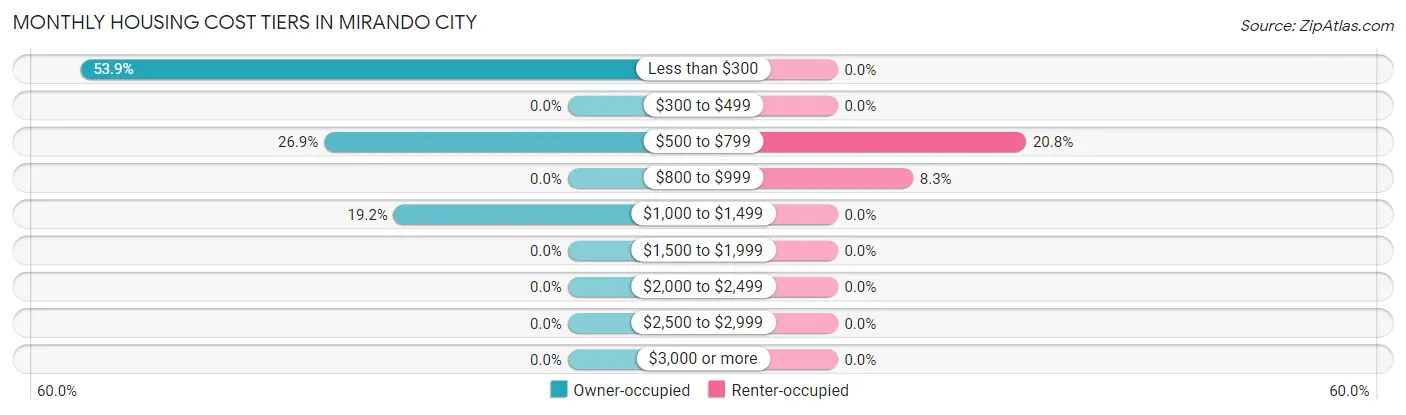
| Monthly Cost | Owner-occupied | Renter-occupied |
| Less than $300 | 28 (53.8%) | 0 (0.0%) |
| $300 to $499 | 0 (0.0%) | 0 (0.0%) |
| $500 to $799 | 14 (26.9%) | 5 (20.8%) |
| $800 to $999 | 0 (0.0%) | 2 (8.3%) |
| $1,000 to $1,499 | 10 (19.2%) | 0 (0.0%) |
| $1,500 to $1,999 | 0 (0.0%) | 0 (0.0%) |
| $2,000 to $2,499 | 0 (0.0%) | 0 (0.0%) |
| $2,500 to $2,999 | 0 (0.0%) | 0 (0.0%) |
| $3,000 or more | 0 (0.0%) | 0 (0.0%) |
| Total | 52 (100.0%) | 24 (100.0%) |
Physical Housing Characteristics in Mirando City
Housing Structures in Mirando City
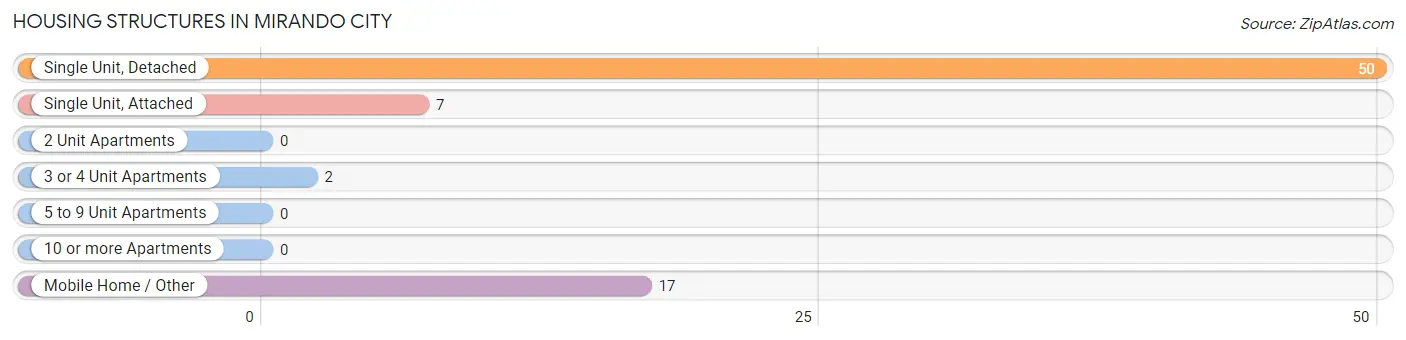
| Structure Type | # Housing Units | % Housing Units |
| Single Unit, Detached | 50 | 65.8% |
| Single Unit, Attached | 7 | 9.2% |
| 2 Unit Apartments | 0 | 0.0% |
| 3 or 4 Unit Apartments | 2 | 2.6% |
| 5 to 9 Unit Apartments | 0 | 0.0% |
| 10 or more Apartments | 0 | 0.0% |
| Mobile Home / Other | 17 | 22.4% |
| Total | 76 | 100.0% |
Housing Structures by Occupancy in Mirando City
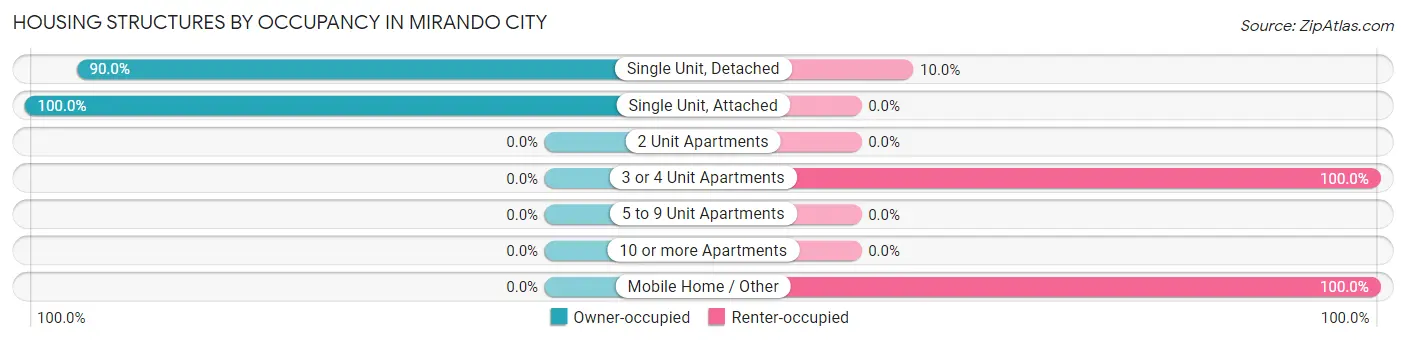
| Structure Type | Owner-occupied | Renter-occupied |
| Single Unit, Detached | 45 (90.0%) | 5 (10.0%) |
| Single Unit, Attached | 7 (100.0%) | 0 (0.0%) |
| 2 Unit Apartments | 0 (0.0%) | 0 (0.0%) |
| 3 or 4 Unit Apartments | 0 (0.0%) | 2 (100.0%) |
| 5 to 9 Unit Apartments | 0 (0.0%) | 0 (0.0%) |
| 10 or more Apartments | 0 (0.0%) | 0 (0.0%) |
| Mobile Home / Other | 0 (0.0%) | 17 (100.0%) |
| Total | 52 (68.4%) | 24 (31.6%) |
Housing Structures by Number of Rooms in Mirando City
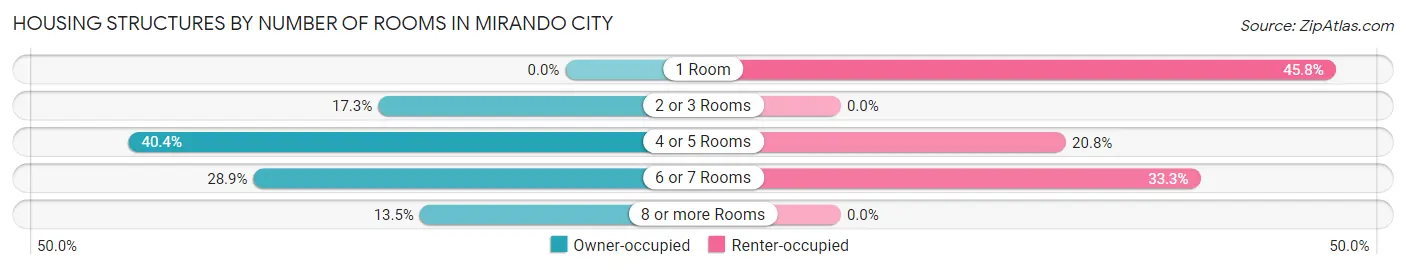
| Number of Rooms | Owner-occupied | Renter-occupied |
| 1 Room | 0 (0.0%) | 11 (45.8%) |
| 2 or 3 Rooms | 9 (17.3%) | 0 (0.0%) |
| 4 or 5 Rooms | 21 (40.4%) | 5 (20.8%) |
| 6 or 7 Rooms | 15 (28.8%) | 8 (33.3%) |
| 8 or more Rooms | 7 (13.5%) | 0 (0.0%) |
| Total | 52 (100.0%) | 24 (100.0%) |
Housing Structure by Heating Type in Mirando City
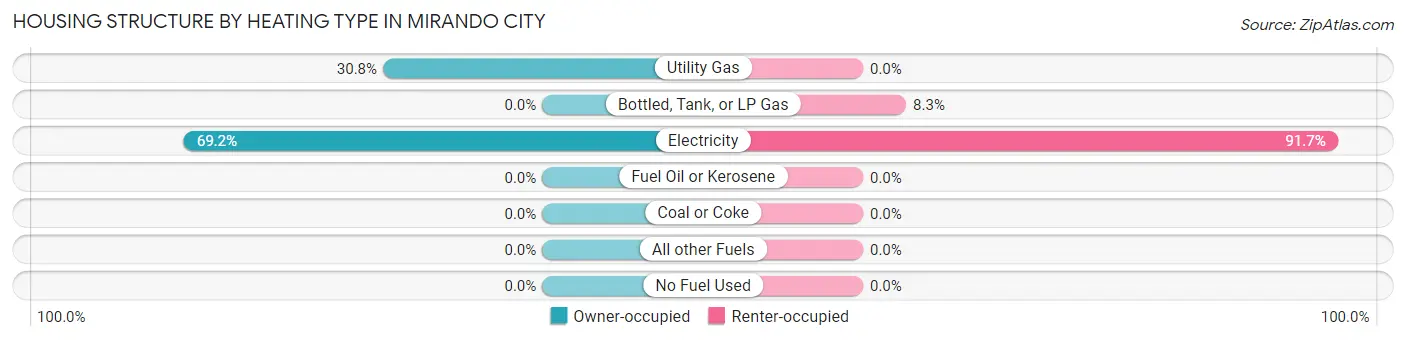
| Heating Type | Owner-occupied | Renter-occupied |
| Utility Gas | 16 (30.8%) | 0 (0.0%) |
| Bottled, Tank, or LP Gas | 0 (0.0%) | 2 (8.3%) |
| Electricity | 36 (69.2%) | 22 (91.7%) |
| Fuel Oil or Kerosene | 0 (0.0%) | 0 (0.0%) |
| Coal or Coke | 0 (0.0%) | 0 (0.0%) |
| All other Fuels | 0 (0.0%) | 0 (0.0%) |
| No Fuel Used | 0 (0.0%) | 0 (0.0%) |
| Total | 52 (100.0%) | 24 (100.0%) |
Household Vehicle Usage in Mirando City
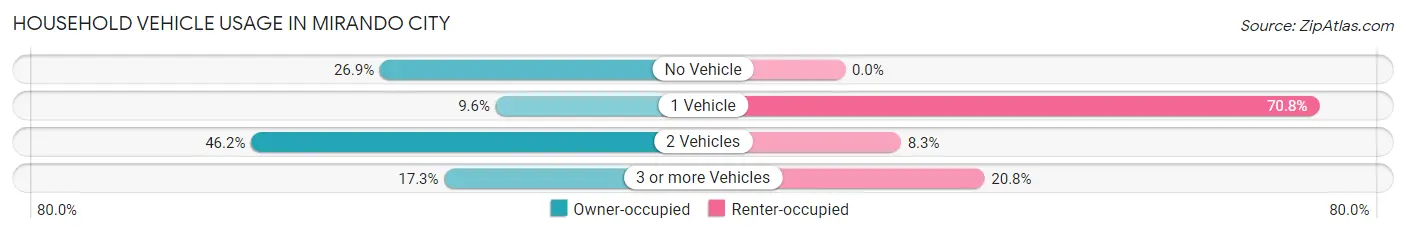
| Vehicles per Household | Owner-occupied | Renter-occupied |
| No Vehicle | 14 (26.9%) | 0 (0.0%) |
| 1 Vehicle | 5 (9.6%) | 17 (70.8%) |
| 2 Vehicles | 24 (46.2%) | 2 (8.3%) |
| 3 or more Vehicles | 9 (17.3%) | 5 (20.8%) |
| Total | 52 (100.0%) | 24 (100.0%) |
Real Estate & Mortgages in Mirando City
Real Estate and Mortgage Overview in Mirando City
| Characteristic | Without Mortgage | With Mortgage |
| Housing Units | 42 | 10 |
| Median Property Value | $18,500 | $0 |
| Median Household Income | - | - |
| Monthly Housing Costs | - | - |
| Real Estate Taxes | - | - |
Property Value by Mortgage Status in Mirando City
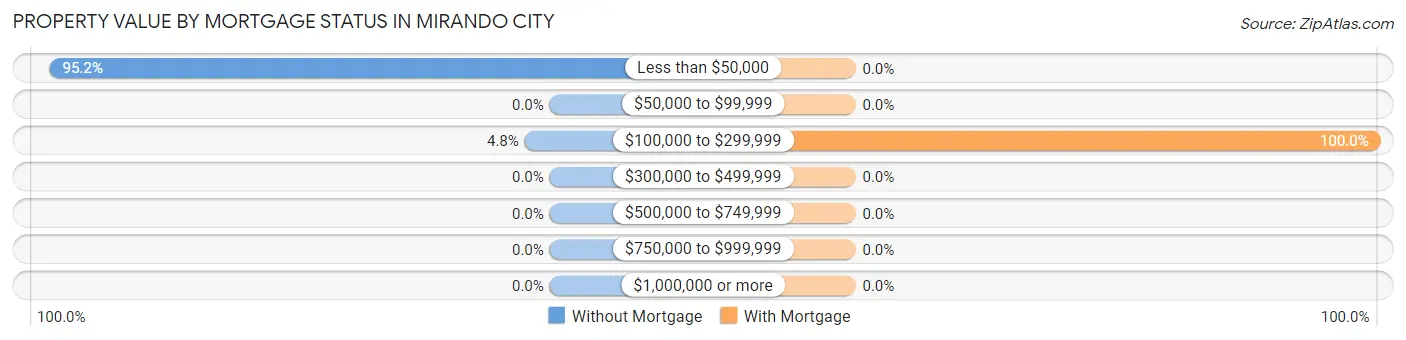
| Property Value | Without Mortgage | With Mortgage |
| Less than $50,000 | 40 (95.2%) | 0 (0.0%) |
| $50,000 to $99,999 | 0 (0.0%) | 0 (0.0%) |
| $100,000 to $299,999 | 2 (4.8%) | 10 (100.0%) |
| $300,000 to $499,999 | 0 (0.0%) | 0 (0.0%) |
| $500,000 to $749,999 | 0 (0.0%) | 0 (0.0%) |
| $750,000 to $999,999 | 0 (0.0%) | 0 (0.0%) |
| $1,000,000 or more | 0 (0.0%) | 0 (0.0%) |
| Total | 42 (100.0%) | 10 (100.0%) |
Household Income by Mortgage Status in Mirando City
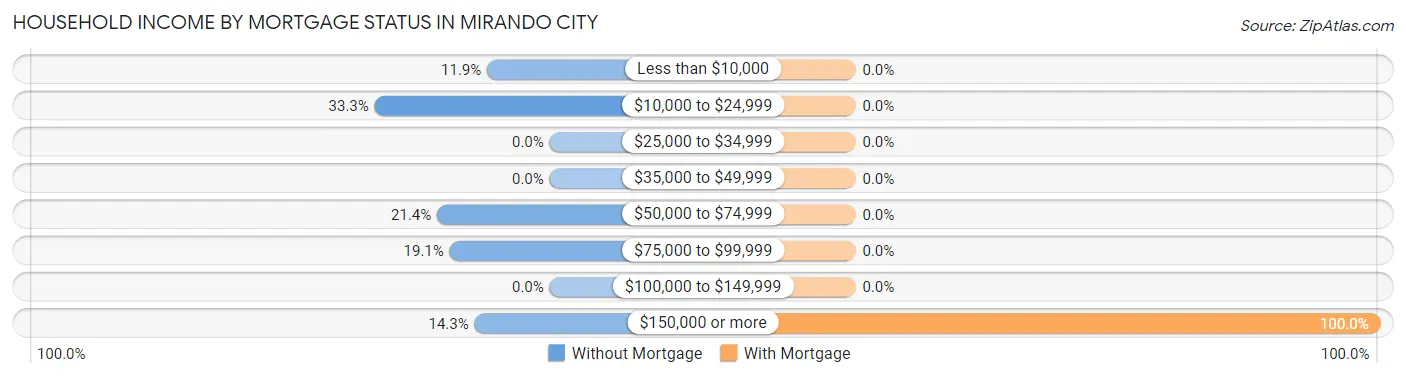
| Household Income | Without Mortgage | With Mortgage |
| Less than $10,000 | 5 (11.9%) | 0 (0.0%) |
| $10,000 to $24,999 | 14 (33.3%) | 0 (0.0%) |
| $25,000 to $34,999 | 0 (0.0%) | 0 (0.0%) |
| $35,000 to $49,999 | 0 (0.0%) | 0 (0.0%) |
| $50,000 to $74,999 | 9 (21.4%) | 0 (0.0%) |
| $75,000 to $99,999 | 8 (19.1%) | 0 (0.0%) |
| $100,000 to $149,999 | 0 (0.0%) | 0 (0.0%) |
| $150,000 or more | 6 (14.3%) | 10 (100.0%) |
| Total | 42 (100.0%) | 10 (100.0%) |
Property Value to Household Income Ratio in Mirando City
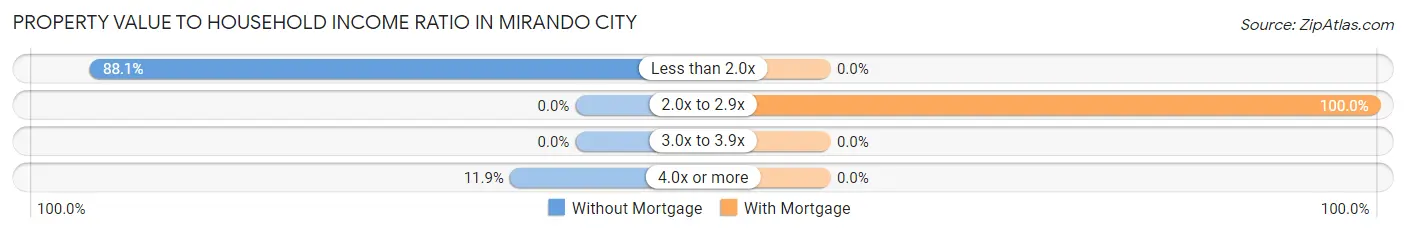
| Value-to-Income Ratio | Without Mortgage | With Mortgage |
| Less than 2.0x | 37 (88.1%) | 0 (0.0%) |
| 2.0x to 2.9x | 0 (0.0%) | 10 (100.0%) |
| 3.0x to 3.9x | 0 (0.0%) | 0 (0.0%) |
| 4.0x or more | 5 (11.9%) | 0 (0.0%) |
| Total | 42 (100.0%) | 10 (100.0%) |
Real Estate Taxes by Mortgage Status in Mirando City
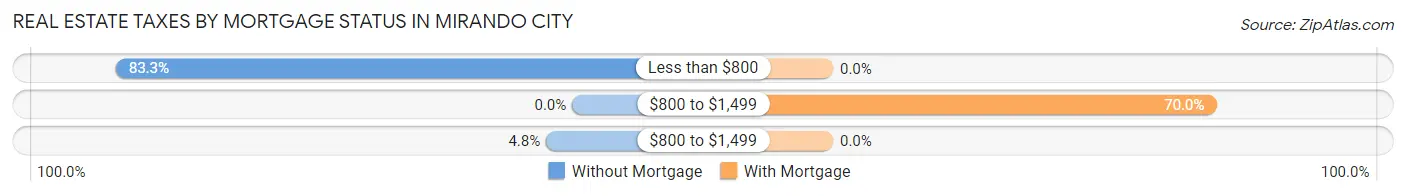
| Property Taxes | Without Mortgage | With Mortgage |
| Less than $800 | 35 (83.3%) | 0 (0.0%) |
| $800 to $1,499 | 0 (0.0%) | 7 (70.0%) |
| $800 to $1,499 | 2 (4.8%) | 0 (0.0%) |
| Total | 42 (100.0%) | 10 (100.0%) |
Health & Disability in Mirando City
Health Insurance Coverage by Age in Mirando City
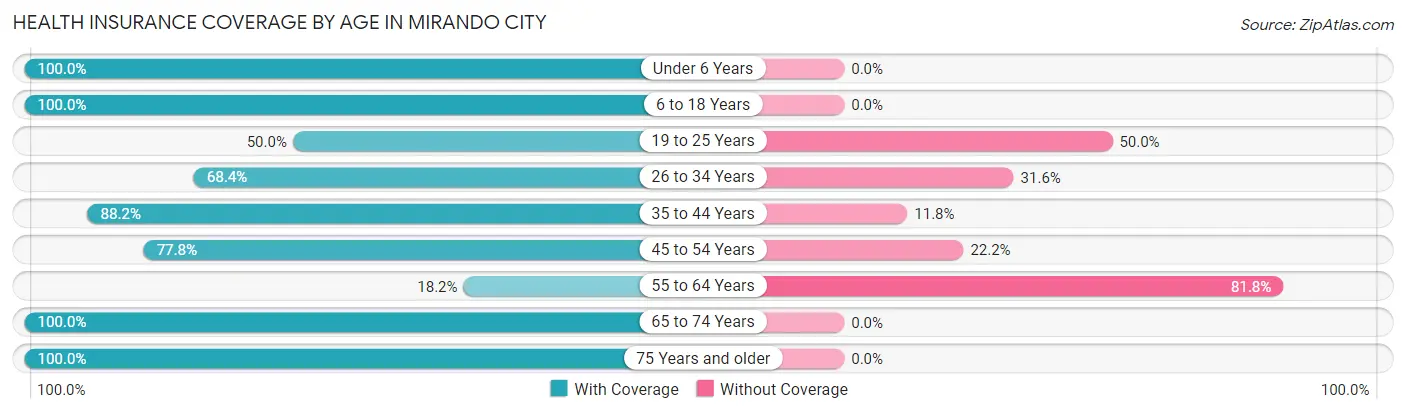
| Age Bracket | With Coverage | Without Coverage |
| Under 6 Years | 12 (100.0%) | 0 (0.0%) |
| 6 to 18 Years | 29 (100.0%) | 0 (0.0%) |
| 19 to 25 Years | 15 (50.0%) | 15 (50.0%) |
| 26 to 34 Years | 13 (68.4%) | 6 (31.6%) |
| 35 to 44 Years | 15 (88.2%) | 2 (11.8%) |
| 45 to 54 Years | 28 (77.8%) | 8 (22.2%) |
| 55 to 64 Years | 2 (18.2%) | 9 (81.8%) |
| 65 to 74 Years | 30 (100.0%) | 0 (0.0%) |
| 75 Years and older | 15 (100.0%) | 0 (0.0%) |
| Total | 159 (79.9%) | 40 (20.1%) |
Health Insurance Coverage by Citizenship Status in Mirando City

| Citizenship Status | With Coverage | Without Coverage |
| Native Born | 12 (100.0%) | 0 (0.0%) |
| Foreign Born, Citizen | 29 (100.0%) | 0 (0.0%) |
| Foreign Born, not a Citizen | 15 (50.0%) | 15 (50.0%) |
Health Insurance Coverage by Household Income in Mirando City
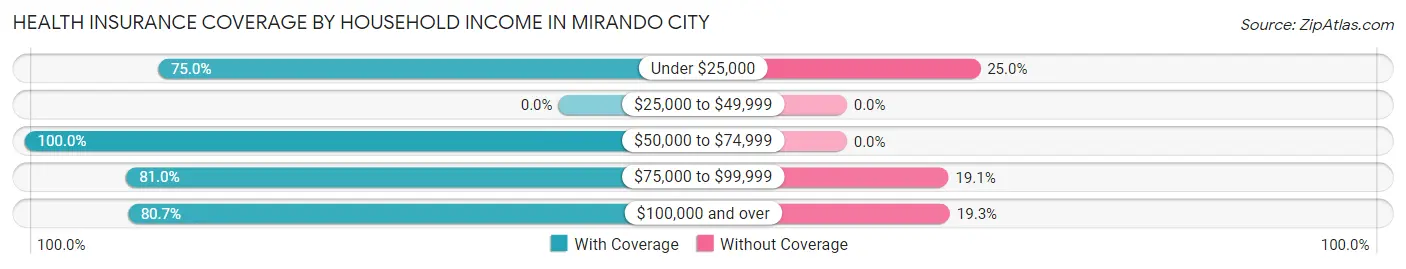
| Household Income | With Coverage | Without Coverage |
| Under $25,000 | 45 (75.0%) | 15 (25.0%) |
| $25,000 to $49,999 | 0 (0.0%) | 0 (0.0%) |
| $50,000 to $74,999 | 9 (100.0%) | 0 (0.0%) |
| $75,000 to $99,999 | 34 (80.9%) | 8 (19.1%) |
| $100,000 and over | 71 (80.7%) | 17 (19.3%) |
Public vs Private Health Insurance Coverage by Age in Mirando City
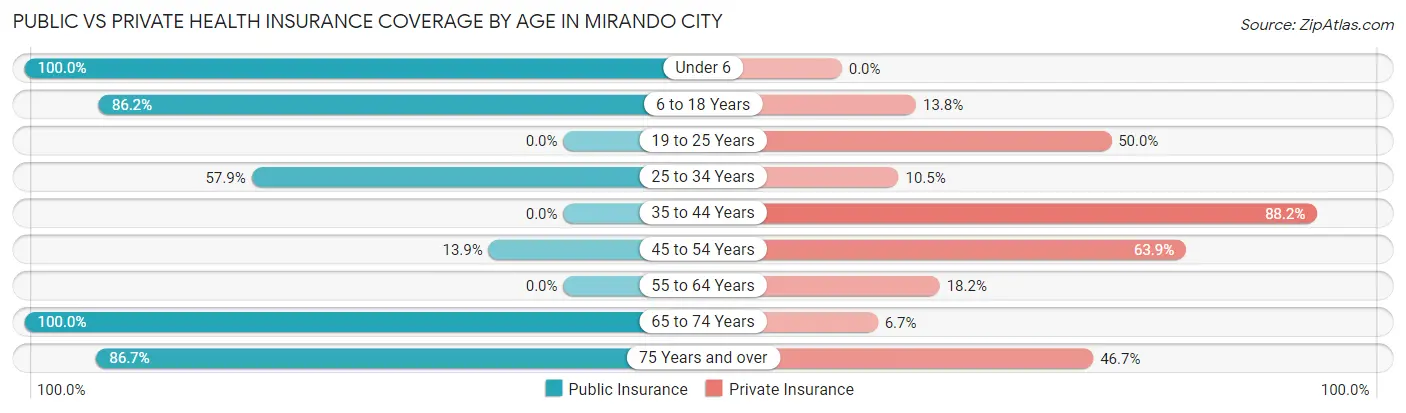
| Age Bracket | Public Insurance | Private Insurance |
| Under 6 | 12 (100.0%) | 0 (0.0%) |
| 6 to 18 Years | 25 (86.2%) | 4 (13.8%) |
| 19 to 25 Years | 0 (0.0%) | 15 (50.0%) |
| 25 to 34 Years | 11 (57.9%) | 2 (10.5%) |
| 35 to 44 Years | 0 (0.0%) | 15 (88.2%) |
| 45 to 54 Years | 5 (13.9%) | 23 (63.9%) |
| 55 to 64 Years | 0 (0.0%) | 2 (18.2%) |
| 65 to 74 Years | 30 (100.0%) | 2 (6.7%) |
| 75 Years and over | 13 (86.7%) | 7 (46.7%) |
| Total | 96 (48.2%) | 70 (35.2%) |
Disability Status by Sex by Age in Mirando City
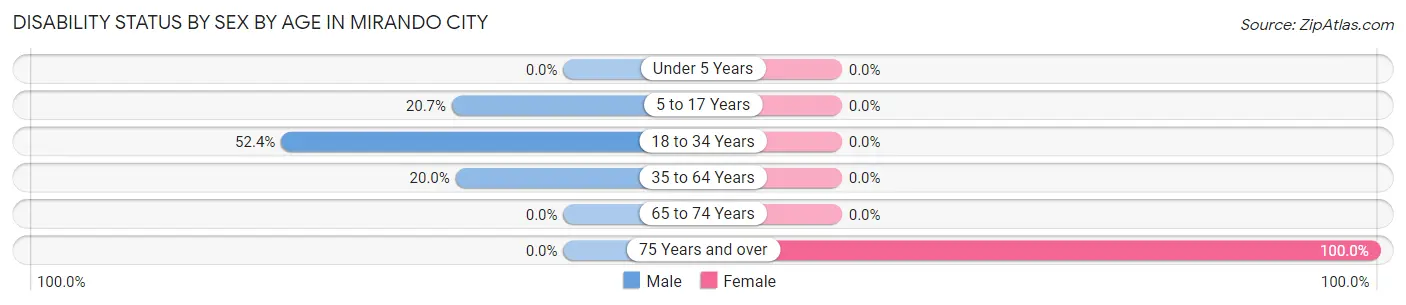
| Age Bracket | Male | Female |
| Under 5 Years | 0 (0.0%) | 0 (0.0%) |
| 5 to 17 Years | 6 (20.7%) | 0 (0.0%) |
| 18 to 34 Years | 11 (52.4%) | 0 (0.0%) |
| 35 to 64 Years | 5 (20.0%) | 0 (0.0%) |
| 65 to 74 Years | 0 (0.0%) | 0 (0.0%) |
| 75 Years and over | 0 (0.0%) | 12 (100.0%) |
Disability Class by Sex by Age in Mirando City
Disability Class: Hearing Difficulty
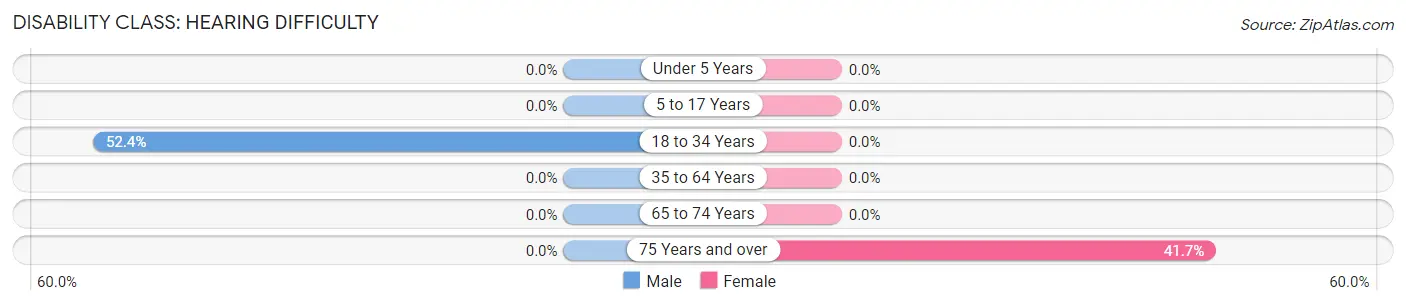
| Age Bracket | Male | Female |
| Under 5 Years | 0 (0.0%) | 0 (0.0%) |
| 5 to 17 Years | 0 (0.0%) | 0 (0.0%) |
| 18 to 34 Years | 11 (52.4%) | 0 (0.0%) |
| 35 to 64 Years | 0 (0.0%) | 0 (0.0%) |
| 65 to 74 Years | 0 (0.0%) | 0 (0.0%) |
| 75 Years and over | 0 (0.0%) | 5 (41.7%) |
Disability Class: Vision Difficulty
| Age Bracket | Male | Female |
| Under 5 Years | 0 (0.0%) | 0 (0.0%) |
| 5 to 17 Years | 0 (0.0%) | 0 (0.0%) |
| 18 to 34 Years | 0 (0.0%) | 0 (0.0%) |
| 35 to 64 Years | 0 (0.0%) | 0 (0.0%) |
| 65 to 74 Years | 0 (0.0%) | 0 (0.0%) |
| 75 Years and over | 0 (0.0%) | 0 (0.0%) |
Disability Class: Cognitive Difficulty
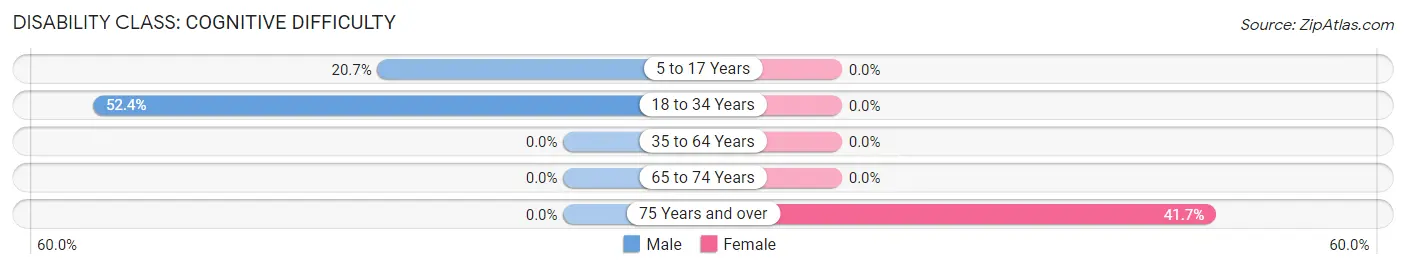
| Age Bracket | Male | Female |
| 5 to 17 Years | 6 (20.7%) | 0 (0.0%) |
| 18 to 34 Years | 11 (52.4%) | 0 (0.0%) |
| 35 to 64 Years | 0 (0.0%) | 0 (0.0%) |
| 65 to 74 Years | 0 (0.0%) | 0 (0.0%) |
| 75 Years and over | 0 (0.0%) | 5 (41.7%) |
Disability Class: Ambulatory Difficulty
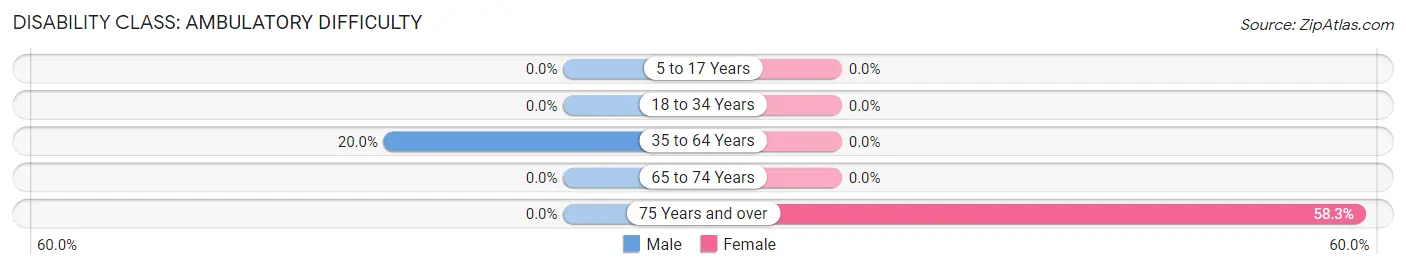
| Age Bracket | Male | Female |
| 5 to 17 Years | 0 (0.0%) | 0 (0.0%) |
| 18 to 34 Years | 0 (0.0%) | 0 (0.0%) |
| 35 to 64 Years | 5 (20.0%) | 0 (0.0%) |
| 65 to 74 Years | 0 (0.0%) | 0 (0.0%) |
| 75 Years and over | 0 (0.0%) | 7 (58.3%) |
Disability Class: Self-Care Difficulty
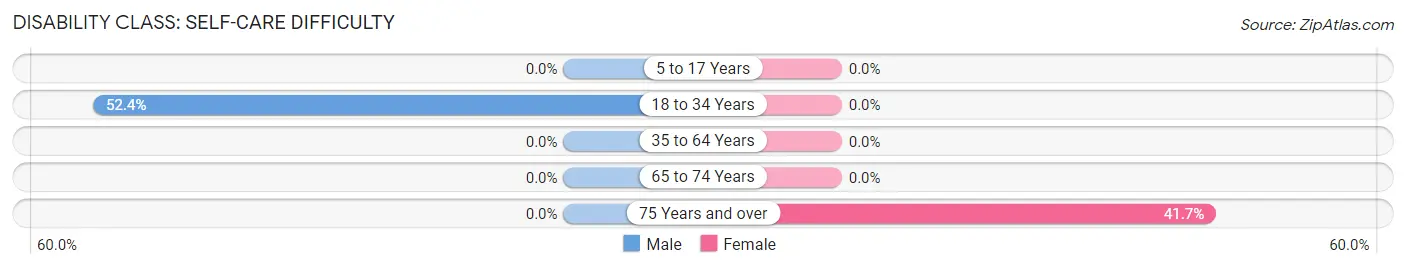
| Age Bracket | Male | Female |
| 5 to 17 Years | 0 (0.0%) | 0 (0.0%) |
| 18 to 34 Years | 11 (52.4%) | 0 (0.0%) |
| 35 to 64 Years | 0 (0.0%) | 0 (0.0%) |
| 65 to 74 Years | 0 (0.0%) | 0 (0.0%) |
| 75 Years and over | 0 (0.0%) | 5 (41.7%) |
Technology Access in Mirando City
Computing Device Access in Mirando City
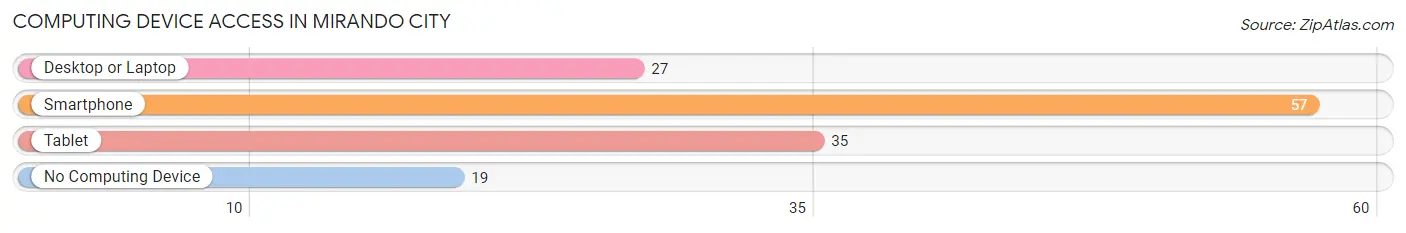
| Device Type | # Households | % Households |
| Desktop or Laptop | 27 | 35.5% |
| Smartphone | 57 | 75.0% |
| Tablet | 35 | 46.1% |
| No Computing Device | 19 | 25.0% |
| Total | 76 | 100.0% |
Internet Access in Mirando City
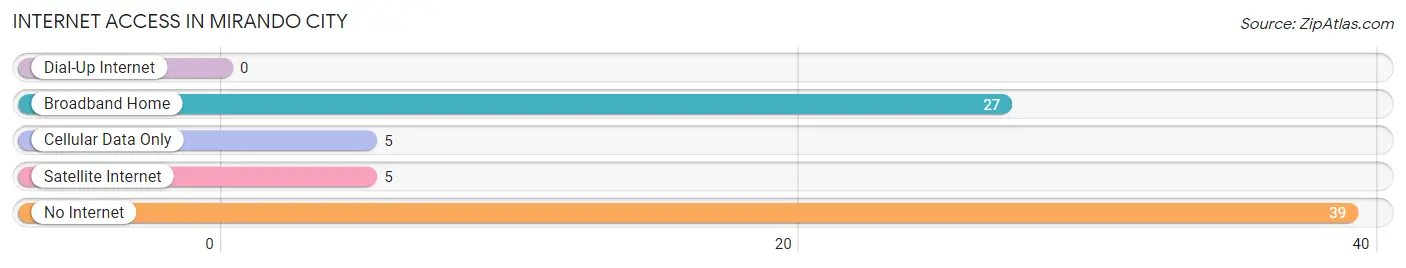
| Internet Type | # Households | % Households |
| Dial-Up Internet | 0 | 0.0% |
| Broadband Home | 27 | 35.5% |
| Cellular Data Only | 5 | 6.6% |
| Satellite Internet | 5 | 6.6% |
| No Internet | 39 | 51.3% |
| Total | 76 | 100.0% |
Mirando City Summary
Mirando City is a small town located in Webb County, Texas. It is situated on the banks of the Rio Grande, just south of Laredo. The town was founded in the late 19th century and has a population of just over 1,000 people.
Geography
Mirando City is located in the Rio Grande Valley of South Texas. It is situated on the banks of the Rio Grande, just south of Laredo. The town is surrounded by agricultural land and is located in a semi-arid climate. The average temperature in the summer is around 90 degrees Fahrenheit and the average temperature in the winter is around 60 degrees Fahrenheit. The town is located in an area of low elevation, with an average elevation of just over 500 feet.
Economy
The economy of Mirando City is largely based on agriculture. The town is home to a number of farms and ranches, which produce a variety of crops, including cotton, corn, sorghum, and wheat. The town also has a number of small businesses, including restaurants, grocery stores, and gas stations. The town is also home to a number of manufacturing plants, which produce a variety of products, including furniture, clothing, and electronics.
Demographics
As of the 2010 census, the population of Mirando City was 1,068. The population is predominantly Hispanic, with over 90% of the population identifying as Hispanic or Latino. The median household income in the town is $25,000, and the median age is 33. The town has a high rate of poverty, with over 40% of the population living below the poverty line.
History
Mirando City was founded in the late 19th century by a group of Mexican settlers. The town was originally called “La Ciudad de Mirando”, which translates to “The City of Mirando”. The town was named after a local rancher, Don Mirando. The town grew rapidly in the early 20th century, and by the 1930s, it had become a bustling center of commerce and industry.
In the 1950s, the town began to decline as the local economy shifted away from agriculture and towards manufacturing. The town was hit hard by the Great Depression and the Dust Bowl, and many of the town’s residents moved away in search of work. In the 1970s, the town began to experience a resurgence, as new businesses and industries moved into the area. Today, Mirando City is a small but vibrant town, with a strong sense of community and a rich cultural heritage.
Common Questions
What is Per Capita Income in Mirando City?
Per Capita income in Mirando City is $31,825.
What is the Median Family Income in Mirando City?
Median Family Income in Mirando City is $89,375.
What is Inequality or Gini Index in Mirando City?
Inequality or Gini Index in Mirando City is 0.54.
What is the Total Population of Mirando City?
Total Population of Mirando City is 199.
What is the Total Male Population of Mirando City?
Total Male Population of Mirando City is 99.
What is the Total Female Population of Mirando City?
Total Female Population of Mirando City is 100.
What is the Ratio of Males per 100 Females in Mirando City?
There are 99.00 Males per 100 Females in Mirando City.
What is the Ratio of Females per 100 Males in Mirando City?
There are 101.01 Females per 100 Males in Mirando City.
What is the Median Population Age in Mirando City?
Median Population Age in Mirando City is 41.1 Years.
What is the Average Family Size in Mirando City
Average Family Size in Mirando City is 3.5 People.
What is the Average Household Size in Mirando City
Average Household Size in Mirando City is 2.6 People.
How Large is the Labor Force in Mirando City?
There are 95 People in the Labor Forcein in Mirando City.
What is the Percentage of People in the Labor Force in Mirando City?
60.1% of People are in the Labor Force in Mirando City.
What is the Unemployment Rate in Mirando City?
Unemployment Rate in Mirando City is 13.7%.