Arp, TX Map & Demographics
Arp Map
Arp Overview
$22,834
PER CAPITA INCOME
$68,826
AVG FAMILY INCOME
$63,472
AVG HOUSEHOLD INCOME
15.3%
WAGE / INCOME GAP [ % ]
84.7¢/ $1
WAGE / INCOME GAP [ $ ]
$15,726
FAMILY INCOME DEFICIT
0.37
INEQUALITY / GINI INDEX
1,367
TOTAL POPULATION
644
MALE POPULATION
723
FEMALE POPULATION
89.07
MALES / 100 FEMALES
112.27
FEMALES / 100 MALES
32.8
MEDIAN AGE
4.0
AVG FAMILY SIZE
3.3
AVG HOUSEHOLD SIZE
587
LABOR FORCE [ PEOPLE ]
58.8%
PERCENT IN LABOR FORCE
3.6%
UNEMPLOYMENT RATE
Arp Zip Codes
Arp Area Codes
Income in Arp
Income Overview in Arp
Per Capita Income in Arp is $22,834, while median incomes of families and households are $68,826 and $63,472 respectively.
| Characteristic | Number | Measure |
| Per Capita Income | 1,367 | $22,834 |
| Median Family Income | 295 | $68,826 |
| Mean Family Income | 295 | $77,629 |
| Median Household Income | 411 | $63,472 |
| Mean Household Income | 411 | $69,732 |
| Income Deficit | 295 | $15,726 |
| Wage / Income Gap (%) | 1,367 | 15.29% |
| Wage / Income Gap ($) | 1,367 | 84.71¢ per $1 |
| Gini / Inequality Index | 1,367 | 0.37 |
Earnings by Sex in Arp
Average Earnings in Arp are $34,569, $37,500 for men and $31,765 for women, a difference of 15.3%.
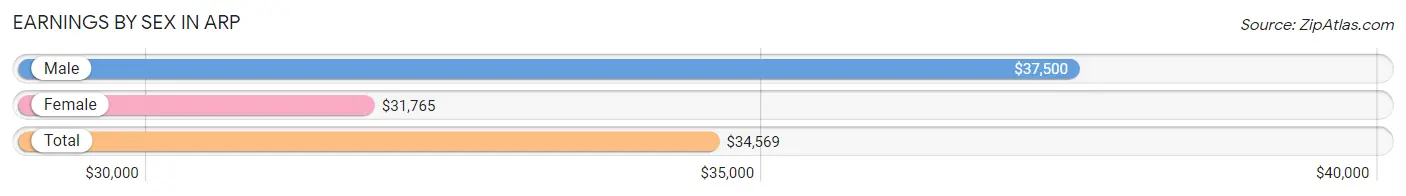
| Sex | Number | Average Earnings |
| Male | 330 (55.4%) | $37,500 |
| Female | 266 (44.6%) | $31,765 |
| Total | 596 (100.0%) | $34,569 |
Earnings by Sex by Income Bracket in Arp
The most common earnings brackets in Arp are $30,000 to $34,999 for men (72 | 21.8%) and $25,000 to $29,999 for women (49 | 18.4%).
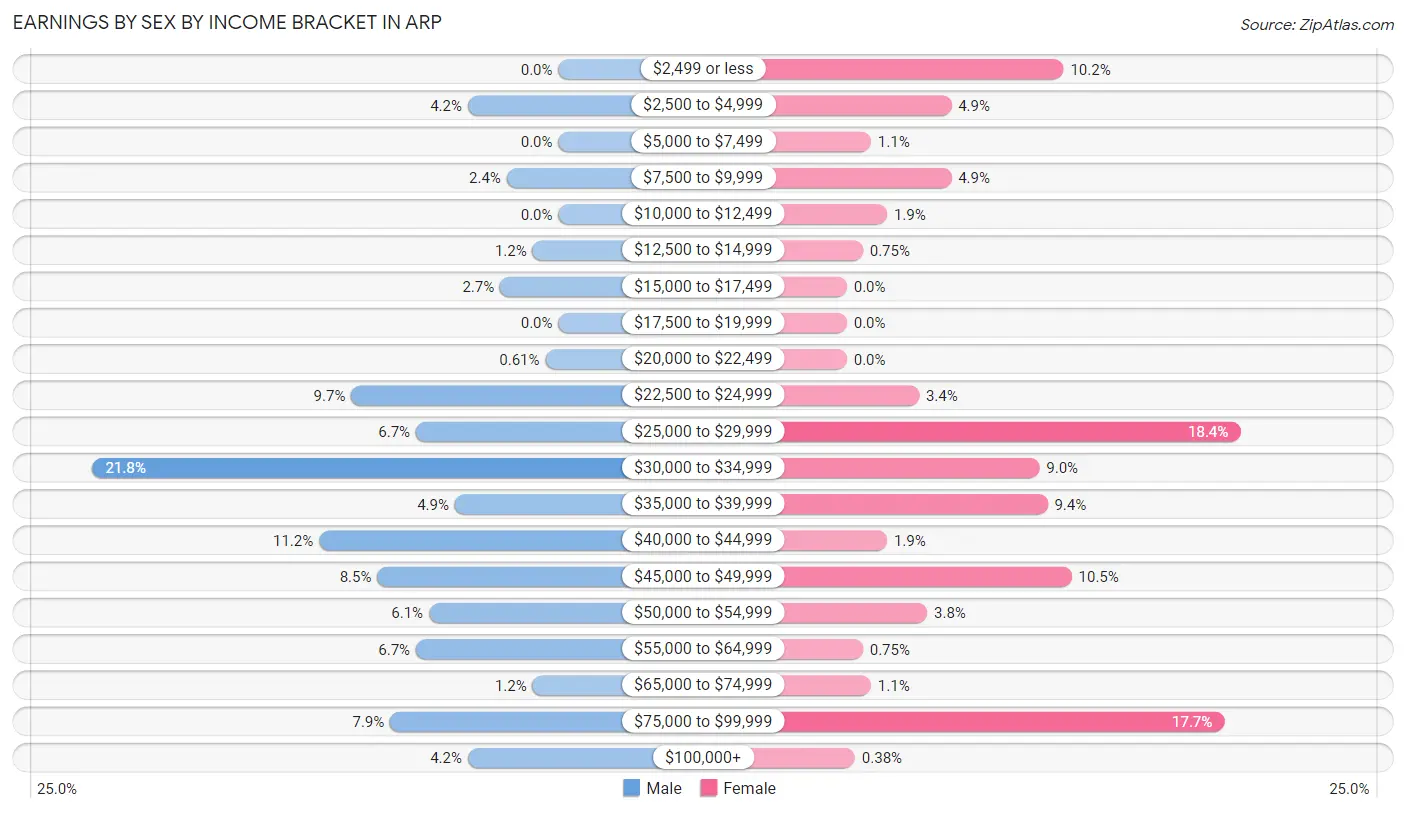
| Income | Male | Female |
| $2,499 or less | 0 (0.0%) | 27 (10.2%) |
| $2,500 to $4,999 | 14 (4.2%) | 13 (4.9%) |
| $5,000 to $7,499 | 0 (0.0%) | 3 (1.1%) |
| $7,500 to $9,999 | 8 (2.4%) | 13 (4.9%) |
| $10,000 to $12,499 | 0 (0.0%) | 5 (1.9%) |
| $12,500 to $14,999 | 4 (1.2%) | 2 (0.7%) |
| $15,000 to $17,499 | 9 (2.7%) | 0 (0.0%) |
| $17,500 to $19,999 | 0 (0.0%) | 0 (0.0%) |
| $20,000 to $22,499 | 2 (0.6%) | 0 (0.0%) |
| $22,500 to $24,999 | 32 (9.7%) | 9 (3.4%) |
| $25,000 to $29,999 | 22 (6.7%) | 49 (18.4%) |
| $30,000 to $34,999 | 72 (21.8%) | 24 (9.0%) |
| $35,000 to $39,999 | 16 (4.9%) | 25 (9.4%) |
| $40,000 to $44,999 | 37 (11.2%) | 5 (1.9%) |
| $45,000 to $49,999 | 28 (8.5%) | 28 (10.5%) |
| $50,000 to $54,999 | 20 (6.1%) | 10 (3.8%) |
| $55,000 to $64,999 | 22 (6.7%) | 2 (0.7%) |
| $65,000 to $74,999 | 4 (1.2%) | 3 (1.1%) |
| $75,000 to $99,999 | 26 (7.9%) | 47 (17.7%) |
| $100,000+ | 14 (4.2%) | 1 (0.4%) |
| Total | 330 (100.0%) | 266 (100.0%) |
Earnings by Sex by Educational Attainment in Arp
Average earnings in Arp are $38,214 for men and $35,000 for women, a difference of 8.4%. Men with an educational attainment of bachelor's degree enjoy the highest average annual earnings of $46,188, while those with less than high school education earn the least with $24,737. Women with an educational attainment of bachelor's degree earn the most with the average annual earnings of $45,833, while those with high school diploma education have the smallest earnings of $30,250.
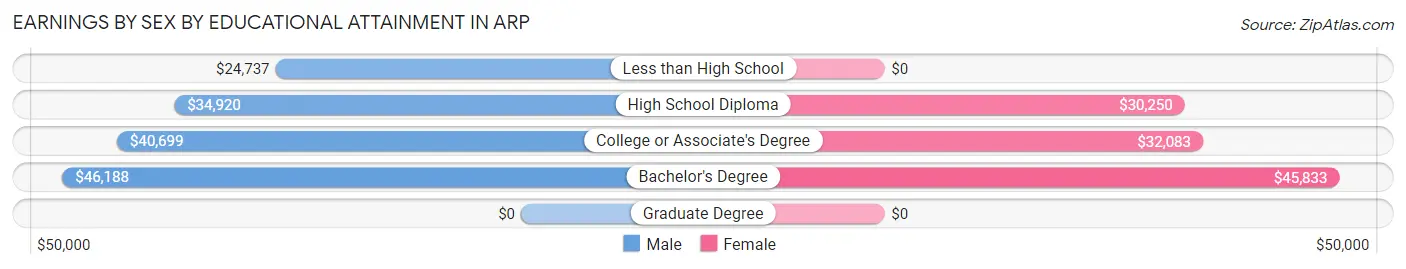
| Educational Attainment | Male Income | Female Income |
| Less than High School | $24,737 | $0 |
| High School Diploma | $34,920 | $30,250 |
| College or Associate's Degree | $40,699 | $32,083 |
| Bachelor's Degree | $46,188 | $45,833 |
| Graduate Degree | - | - |
| Total | $38,214 | $35,000 |
Family Income in Arp
Family Income Brackets in Arp
According to the Arp family income data, there are 83 families falling into the $50,000 to $74,999 income range, which is the most common income bracket and makes up 28.1% of all families. Conversely, the $200,000+ income bracket is the least frequent group with only 7 families (2.4%) belonging to this category.
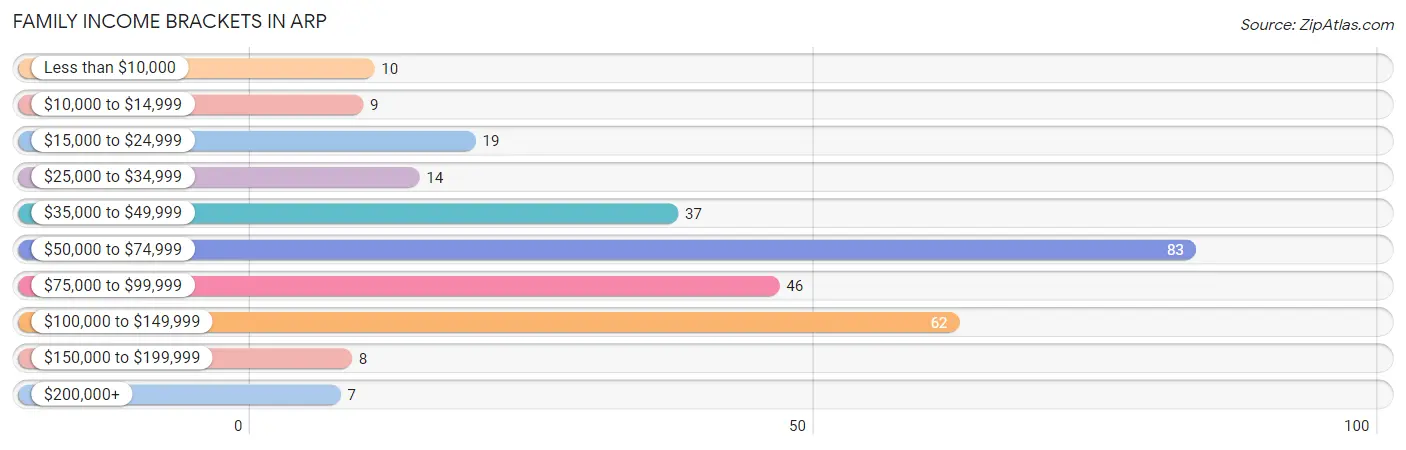
| Income Bracket | # Families | % Families |
| Less than $10,000 | 10 | 3.4% |
| $10,000 to $14,999 | 9 | 3.1% |
| $15,000 to $24,999 | 19 | 6.4% |
| $25,000 to $34,999 | 14 | 4.7% |
| $35,000 to $49,999 | 37 | 12.5% |
| $50,000 to $74,999 | 83 | 28.1% |
| $75,000 to $99,999 | 46 | 15.6% |
| $100,000 to $149,999 | 62 | 21.0% |
| $150,000 to $199,999 | 8 | 2.7% |
| $200,000+ | 7 | 2.4% |
Family Income by Famaliy Size in Arp
4-person families (68 | 23.1%) account for the highest median family income in Arp with $96,389 per family, while 2-person families (85 | 28.8%) have the highest median income of $25,670 per family member.
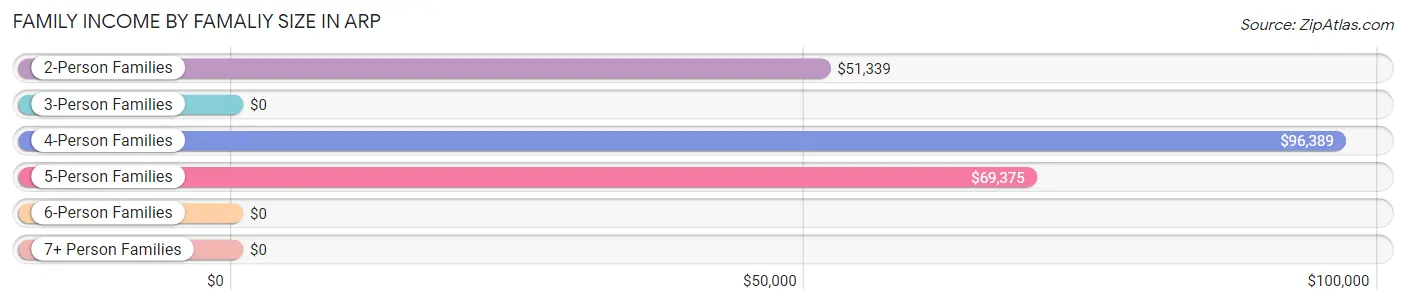
| Income Bracket | # Families | Median Income |
| 2-Person Families | 85 (28.8%) | $51,339 |
| 3-Person Families | 67 (22.7%) | $0 |
| 4-Person Families | 68 (23.1%) | $96,389 |
| 5-Person Families | 42 (14.2%) | $69,375 |
| 6-Person Families | 33 (11.2%) | $0 |
| 7+ Person Families | 0 (0.0%) | $0 |
| Total | 295 (100.0%) | $68,826 |
Family Income by Number of Earners in Arp
The median family income in Arp is $68,826, with families comprising 2 earners (122) having the highest median family income of $96,389, while families with no earners (56) have the lowest median family income of $36,429, accounting for 41.4% and 19.0% of families, respectively.
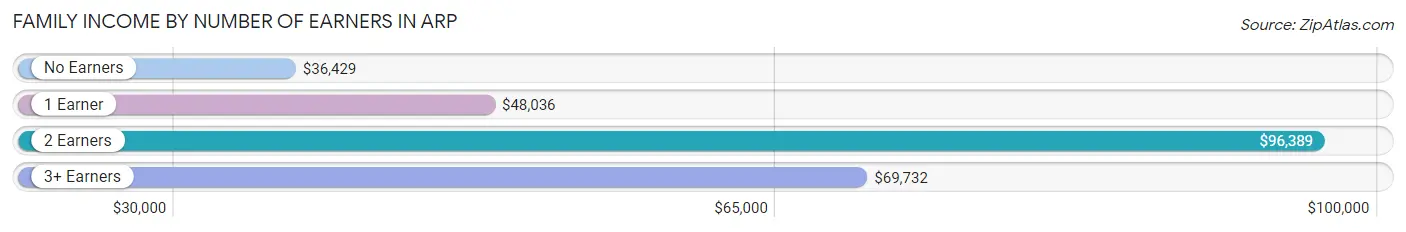
| Number of Earners | # Families | Median Income |
| No Earners | 56 (19.0%) | $36,429 |
| 1 Earner | 67 (22.7%) | $48,036 |
| 2 Earners | 122 (41.4%) | $96,389 |
| 3+ Earners | 50 (17.0%) | $69,732 |
| Total | 295 (100.0%) | $68,826 |
Household Income in Arp
Household Income Brackets in Arp
With 94 households falling in the category, the $50,000 to $74,999 income range is the most frequent in Arp, accounting for 22.9% of all households. In contrast, only 7 households (1.7%) fall into the $200,000+ income bracket, making it the least populous group.
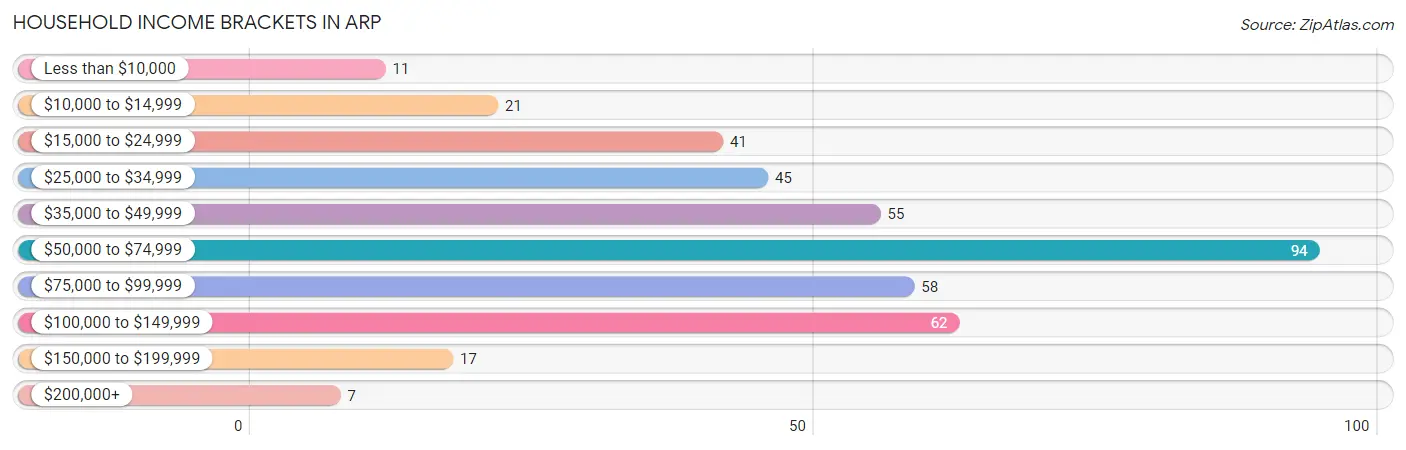
| Income Bracket | # Households | % Households |
| Less than $10,000 | 11 | 2.7% |
| $10,000 to $14,999 | 21 | 5.1% |
| $15,000 to $24,999 | 41 | 10.0% |
| $25,000 to $34,999 | 45 | 10.9% |
| $35,000 to $49,999 | 55 | 13.4% |
| $50,000 to $74,999 | 94 | 22.9% |
| $75,000 to $99,999 | 58 | 14.1% |
| $100,000 to $149,999 | 62 | 15.1% |
| $150,000 to $199,999 | 17 | 4.1% |
| $200,000+ | 7 | 1.7% |
Household Income by Householder Age in Arp
The median household income in Arp is $63,472, with the highest median household income of $93,542 found in the 25 to 44 years age bracket for the primary householder. A total of 141 households (34.3%) fall into this category. Meanwhile, the 15 to 24 years age bracket for the primary householder has the lowest median household income of $0, with 12 households (2.9%) in this group.
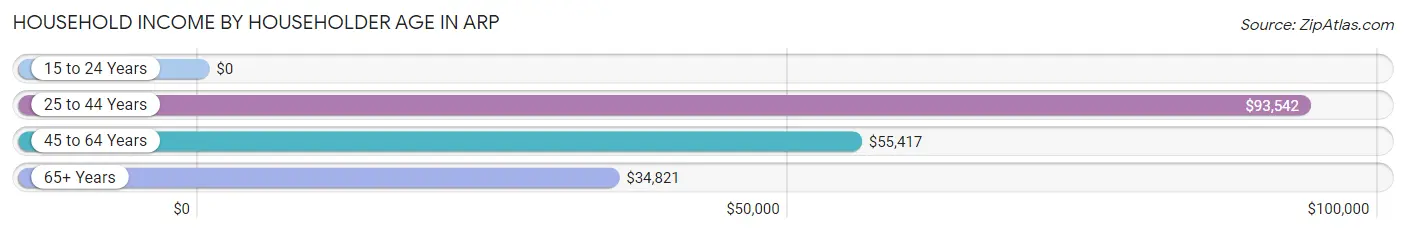
| Income Bracket | # Households | Median Income |
| 15 to 24 Years | 12 (2.9%) | $0 |
| 25 to 44 Years | 141 (34.3%) | $93,542 |
| 45 to 64 Years | 129 (31.4%) | $55,417 |
| 65+ Years | 129 (31.4%) | $34,821 |
| Total | 411 (100.0%) | $63,472 |
Poverty in Arp
Income Below Poverty by Sex and Age in Arp
With 5.1% poverty level for males and 8.3% for females among the residents of Arp, 6 to 11 year old males and 15 year old females are the most vulnerable to poverty, with 15 males (30.0%) and 5 females (100.0%) in their respective age groups living below the poverty level.
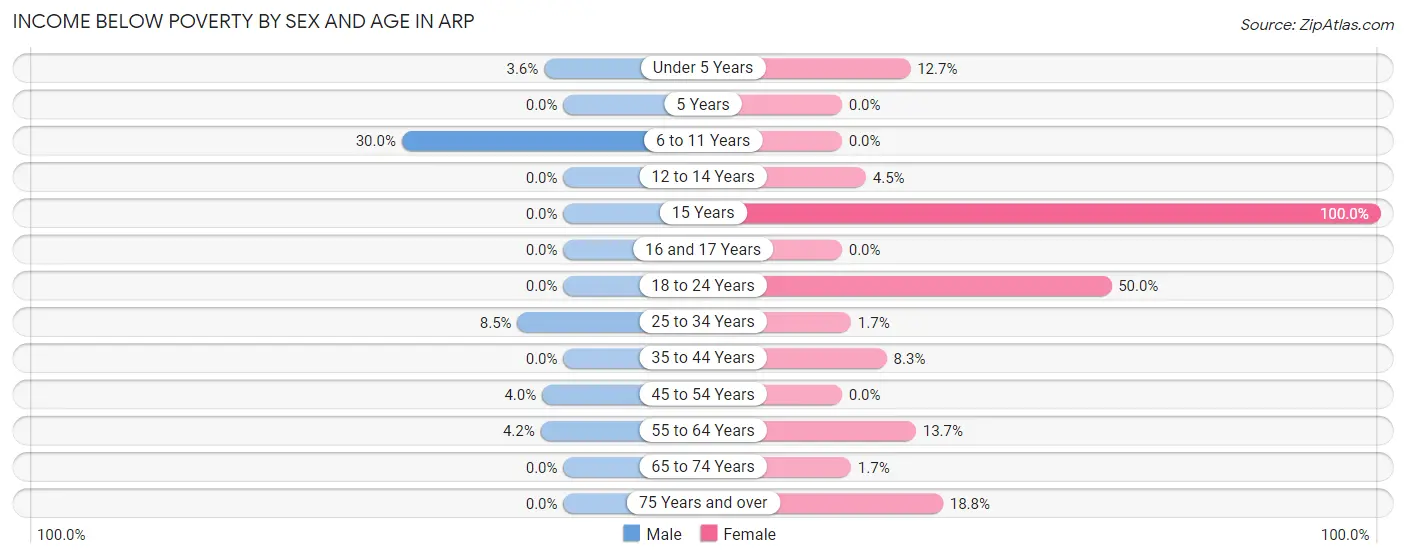
| Age Bracket | Male | Female |
| Under 5 Years | 1 (3.6%) | 8 (12.7%) |
| 5 Years | 0 (0.0%) | 0 (0.0%) |
| 6 to 11 Years | 15 (30.0%) | 0 (0.0%) |
| 12 to 14 Years | 0 (0.0%) | 5 (4.5%) |
| 15 Years | 0 (0.0%) | 5 (100.0%) |
| 16 and 17 Years | 0 (0.0%) | 0 (0.0%) |
| 18 to 24 Years | 0 (0.0%) | 6 (50.0%) |
| 25 to 34 Years | 11 (8.5%) | 2 (1.7%) |
| 35 to 44 Years | 0 (0.0%) | 7 (8.3%) |
| 45 to 54 Years | 3 (4.0%) | 0 (0.0%) |
| 55 to 64 Years | 3 (4.2%) | 14 (13.7%) |
| 65 to 74 Years | 0 (0.0%) | 1 (1.7%) |
| 75 Years and over | 0 (0.0%) | 12 (18.8%) |
| Total | 33 (5.1%) | 60 (8.3%) |
Income Above Poverty by Sex and Age in Arp
According to the poverty statistics in Arp, males aged 5 years and females aged 5 years are the age groups that are most secure financially, with 100.0% of males and 100.0% of females in these age groups living above the poverty line.
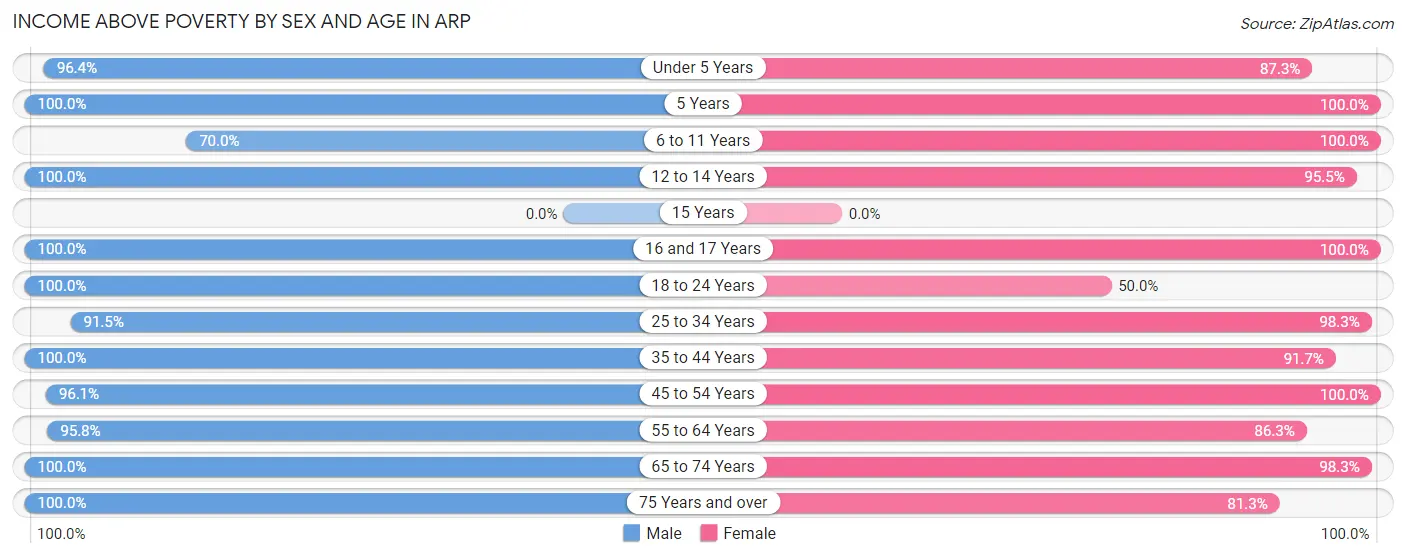
| Age Bracket | Male | Female |
| Under 5 Years | 27 (96.4%) | 55 (87.3%) |
| 5 Years | 2 (100.0%) | 29 (100.0%) |
| 6 to 11 Years | 35 (70.0%) | 19 (100.0%) |
| 12 to 14 Years | 60 (100.0%) | 107 (95.5%) |
| 15 Years | 0 (0.0%) | 0 (0.0%) |
| 16 and 17 Years | 24 (100.0%) | 21 (100.0%) |
| 18 to 24 Years | 42 (100.0%) | 6 (50.0%) |
| 25 to 34 Years | 118 (91.5%) | 116 (98.3%) |
| 35 to 44 Years | 94 (100.0%) | 77 (91.7%) |
| 45 to 54 Years | 73 (96.1%) | 35 (100.0%) |
| 55 to 64 Years | 68 (95.8%) | 88 (86.3%) |
| 65 to 74 Years | 46 (100.0%) | 58 (98.3%) |
| 75 Years and over | 22 (100.0%) | 52 (81.2%) |
| Total | 611 (94.9%) | 663 (91.7%) |
Income Below Poverty Among Married-Couple Families in Arp
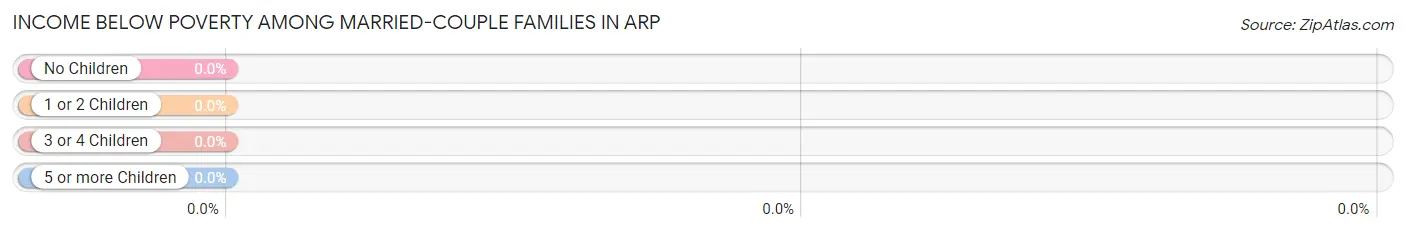
| Children | Above Poverty | Below Poverty |
| No Children | 92 (100.0%) | 0 (0.0%) |
| 1 or 2 Children | 65 (100.0%) | 0 (0.0%) |
| 3 or 4 Children | 61 (100.0%) | 0 (0.0%) |
| 5 or more Children | 0 (0.0%) | 0 (0.0%) |
| Total | 218 (100.0%) | 0 (0.0%) |
Income Below Poverty Among Single-Parent Households in Arp
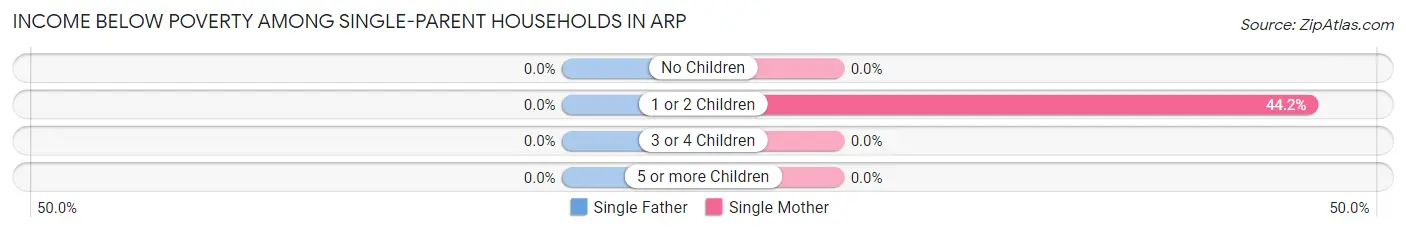
| Children | Single Father | Single Mother |
| No Children | 0 (0.0%) | 0 (0.0%) |
| 1 or 2 Children | 0 (0.0%) | 19 (44.2%) |
| 3 or 4 Children | 0 (0.0%) | 0 (0.0%) |
| 5 or more Children | 0 (0.0%) | 0 (0.0%) |
| Total | 0 (0.0%) | 19 (32.2%) |
Income Below Poverty Among Married-Couple vs Single-Parent Households in Arp
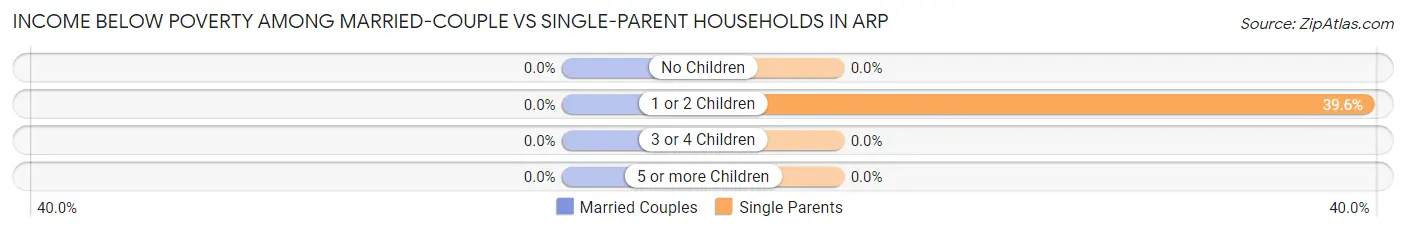
| Children | Married-Couple Families | Single-Parent Households |
| No Children | 0 (0.0%) | 0 (0.0%) |
| 1 or 2 Children | 0 (0.0%) | 19 (39.6%) |
| 3 or 4 Children | 0 (0.0%) | 0 (0.0%) |
| 5 or more Children | 0 (0.0%) | 0 (0.0%) |
| Total | 0 (0.0%) | 19 (24.7%) |
Race in Arp
The most populous races in Arp are White / Caucasian (1,132 | 82.8%), Two or more Races (183 | 13.4%), and Black / African American (44 | 3.2%).
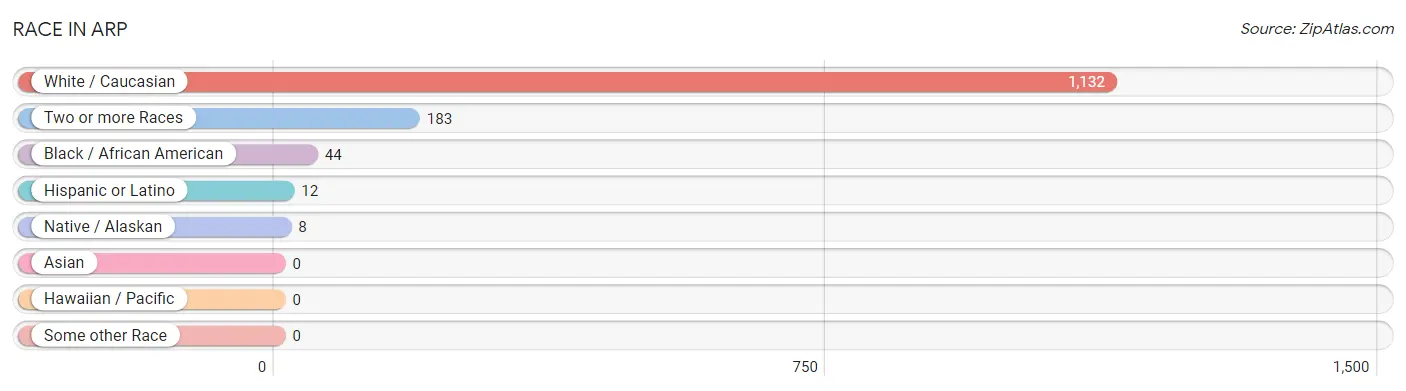
| Race | # Population | % Population |
| Asian | 0 | 0.0% |
| Black / African American | 44 | 3.2% |
| Hawaiian / Pacific | 0 | 0.0% |
| Hispanic or Latino | 12 | 0.9% |
| Native / Alaskan | 8 | 0.6% |
| White / Caucasian | 1,132 | 82.8% |
| Two or more Races | 183 | 13.4% |
| Some other Race | 0 | 0.0% |
| Total | 1,367 | 100.0% |
Ancestry in Arp
The most populous ancestries reported in Arp are American (521 | 38.1%), English (197 | 14.4%), German (143 | 10.5%), Irish (115 | 8.4%), and Cherokee (60 | 4.4%), together accounting for 75.8% of all Arp residents.
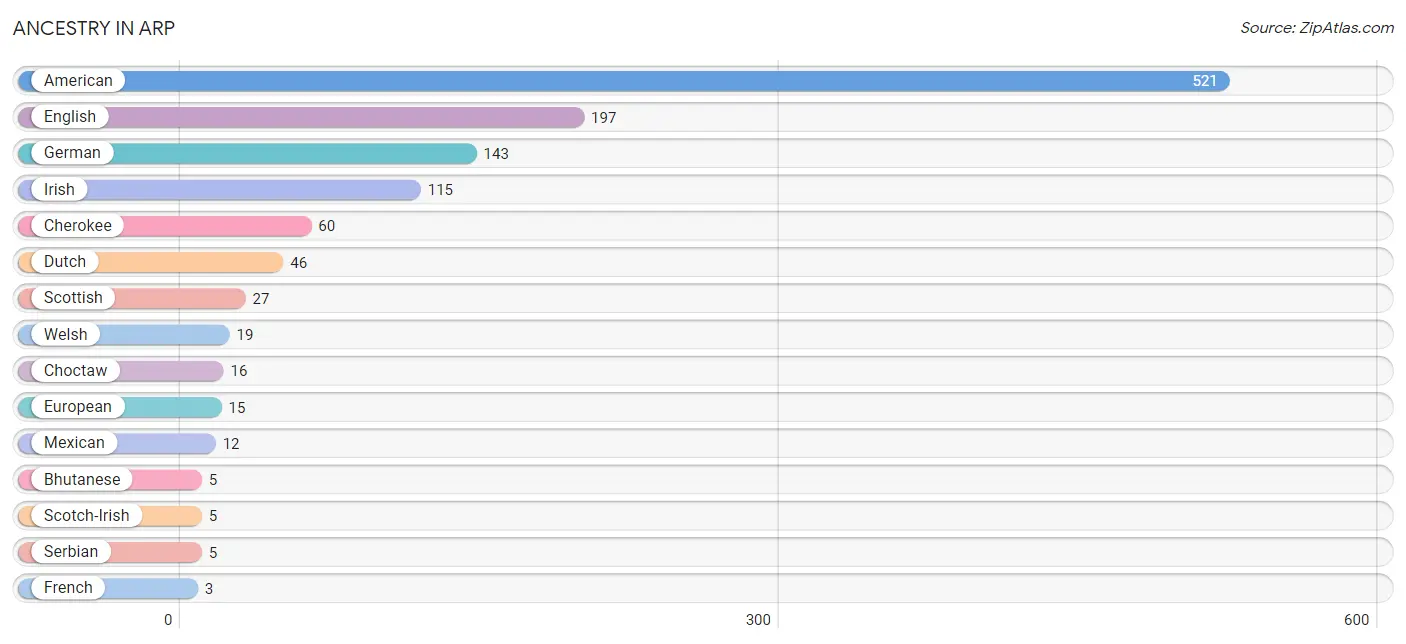
| Ancestry | # Population | % Population |
| American | 521 | 38.1% |
| Bhutanese | 5 | 0.4% |
| Cherokee | 60 | 4.4% |
| Choctaw | 16 | 1.2% |
| Dutch | 46 | 3.4% |
| English | 197 | 14.4% |
| European | 15 | 1.1% |
| French | 3 | 0.2% |
| German | 143 | 10.5% |
| Greek | 2 | 0.2% |
| Irish | 115 | 8.4% |
| Mexican | 12 | 0.9% |
| Pima | 2 | 0.2% |
| Scotch-Irish | 5 | 0.4% |
| Scottish | 27 | 2.0% |
| Serbian | 5 | 0.4% |
| Welsh | 19 | 1.4% | View All 17 Rows |
Immigrants in Arp

| Immigration Origin | # Population | % Population | View All 0 Rows |
Sex and Age in Arp
Sex and Age in Arp
The most populous age groups in Arp are 10 to 14 Years (68 | 10.6%) for men and 10 to 14 Years (125 | 17.3%) for women.
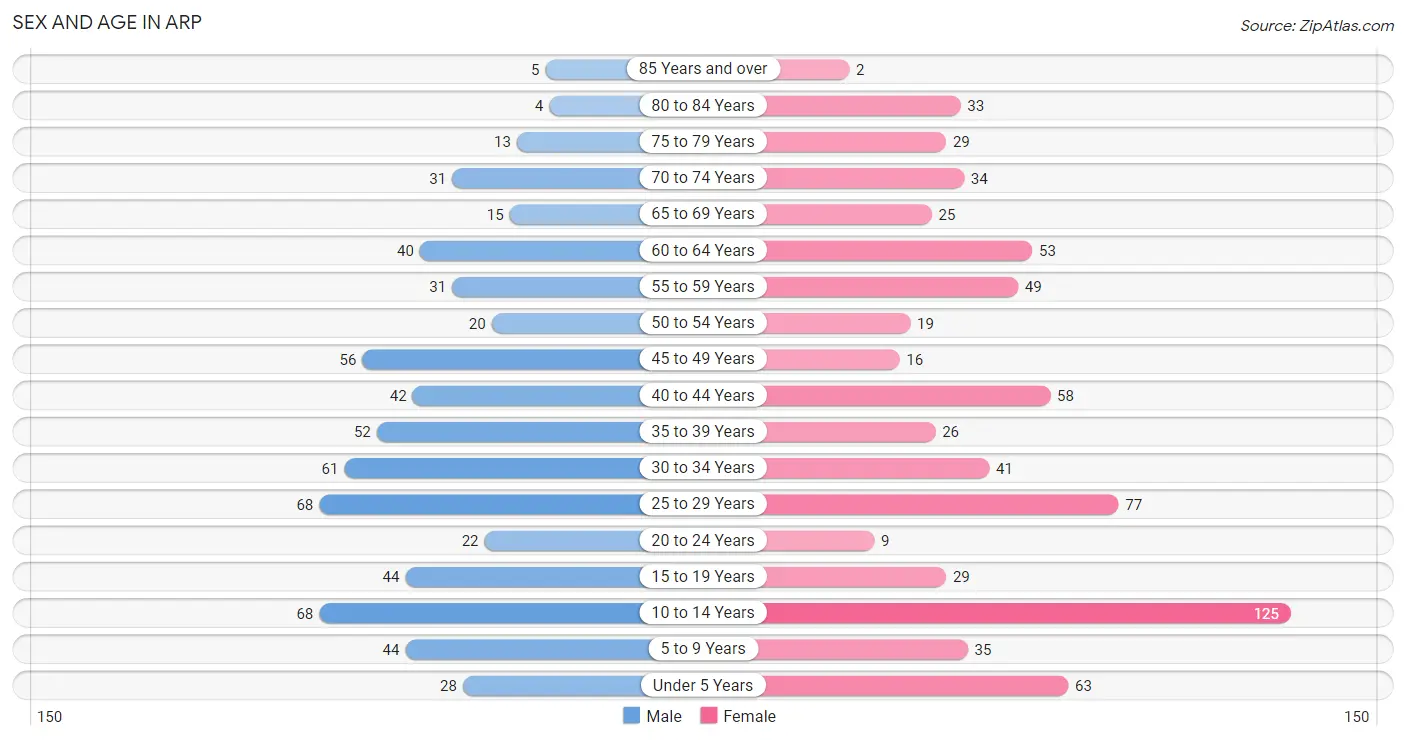
| Age Bracket | Male | Female |
| Under 5 Years | 28 (4.3%) | 63 (8.7%) |
| 5 to 9 Years | 44 (6.8%) | 35 (4.8%) |
| 10 to 14 Years | 68 (10.6%) | 125 (17.3%) |
| 15 to 19 Years | 44 (6.8%) | 29 (4.0%) |
| 20 to 24 Years | 22 (3.4%) | 9 (1.2%) |
| 25 to 29 Years | 68 (10.6%) | 77 (10.6%) |
| 30 to 34 Years | 61 (9.5%) | 41 (5.7%) |
| 35 to 39 Years | 52 (8.1%) | 26 (3.6%) |
| 40 to 44 Years | 42 (6.5%) | 58 (8.0%) |
| 45 to 49 Years | 56 (8.7%) | 16 (2.2%) |
| 50 to 54 Years | 20 (3.1%) | 19 (2.6%) |
| 55 to 59 Years | 31 (4.8%) | 49 (6.8%) |
| 60 to 64 Years | 40 (6.2%) | 53 (7.3%) |
| 65 to 69 Years | 15 (2.3%) | 25 (3.5%) |
| 70 to 74 Years | 31 (4.8%) | 34 (4.7%) |
| 75 to 79 Years | 13 (2.0%) | 29 (4.0%) |
| 80 to 84 Years | 4 (0.6%) | 33 (4.6%) |
| 85 Years and over | 5 (0.8%) | 2 (0.3%) |
| Total | 644 (100.0%) | 723 (100.0%) |
Families and Households in Arp
Median Family Size in Arp
The median family size in Arp is 4.02 persons per family, with single female/mother families (59 | 20.0%) accounting for the largest median family size of 4.39 persons per family. On the other hand, single male/father families (18 | 6.1%) represent the smallest median family size with 2.33 persons per family.
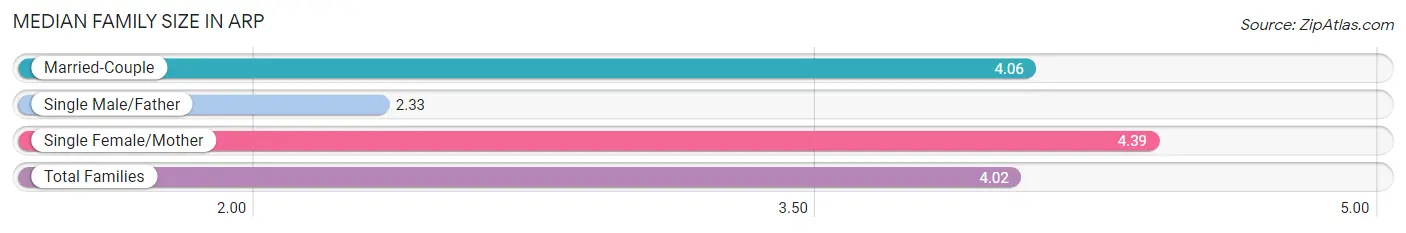
| Family Type | # Families | Family Size |
| Married-Couple | 218 (73.9%) | 4.06 |
| Single Male/Father | 18 (6.1%) | 2.33 |
| Single Female/Mother | 59 (20.0%) | 4.39 |
| Total Families | 295 (100.0%) | 4.02 |
Median Household Size in Arp
The median household size in Arp is 3.33 persons per household, with single female/mother households (59 | 14.4%) accounting for the largest median household size of 4.66 persons per household. non-family households (116 | 28.2%) represent the smallest median household size with 1.38 persons per household.
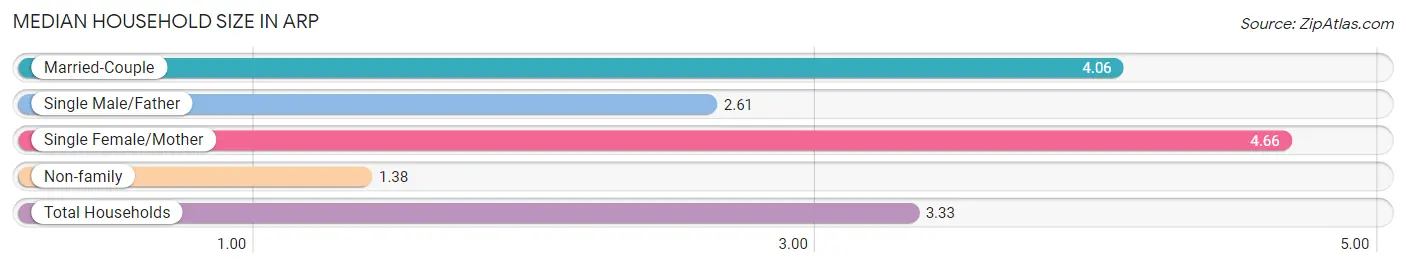
| Household Type | # Households | Household Size |
| Married-Couple | 218 (53.0%) | 4.06 |
| Single Male/Father | 18 (4.4%) | 2.61 |
| Single Female/Mother | 59 (14.4%) | 4.66 |
| Non-family | 116 (28.2%) | 1.38 |
| Total Households | 411 (100.0%) | 3.33 |
Household Size by Marriage Status in Arp
Out of a total of 411 households in Arp, 295 (71.8%) are family households, while 116 (28.2%) are nonfamily households. The most numerous type of family households are 2-person households, comprising 80, and the most common type of nonfamily households are 1-person households, comprising 100.
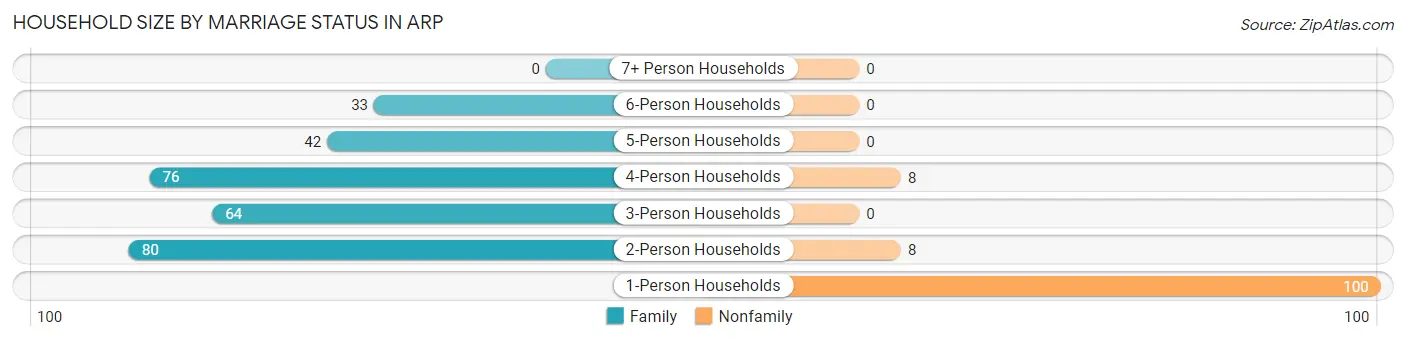
| Household Size | Family Households | Nonfamily Households |
| 1-Person Households | - | 100 (24.3%) |
| 2-Person Households | 80 (19.5%) | 8 (1.9%) |
| 3-Person Households | 64 (15.6%) | 0 (0.0%) |
| 4-Person Households | 76 (18.5%) | 8 (1.9%) |
| 5-Person Households | 42 (10.2%) | 0 (0.0%) |
| 6-Person Households | 33 (8.0%) | 0 (0.0%) |
| 7+ Person Households | 0 (0.0%) | 0 (0.0%) |
| Total | 295 (71.8%) | 116 (28.2%) |
Female Fertility in Arp
Fertility by Age in Arp
Average fertility rate in Arp is 4.0 births per 1,000 women. Women in the age bracket of 20 to 34 years have the highest fertility rate with 8.0 births per 1,000 women. Women in the age bracket of 20 to 34 years acount for 100.0% of all women with births.
| Age Bracket | Women with Births | Births / 1,000 Women |
| 15 to 19 years | 0 (0.0%) | 0.0 |
| 20 to 34 years | 1 (100.0%) | 8.0 |
| 35 to 50 years | 0 (0.0%) | 0.0 |
| Total | 1 (100.0%) | 4.0 |
Fertility by Age by Marriage Status in Arp
| Age Bracket | Married | Unmarried |
| 15 to 19 years | 0 (0.0%) | 0 (0.0%) |
| 20 to 34 years | 1 (100.0%) | 0 (0.0%) |
| 35 to 50 years | 0 (0.0%) | 0 (0.0%) |
| Total | 1 (100.0%) | 0 (0.0%) |
Fertility by Education in Arp
| Educational Attainment | Women with Births | Births / 1,000 Women |
| Less than High School | 0 (0.0%) | 0.0 |
| High School Diploma | 0 (0.0%) | 0.0 |
| College or Associate's Degree | 0 (0.0%) | 0.0 |
| Bachelor's Degree | 1 (100.0%) | 111.0 |
| Graduate Degree | 0 (0.0%) | 0.0 |
| Total | 1 (100.0%) | 4.0 |
Fertility by Education by Marriage Status in Arp
| Educational Attainment | Married | Unmarried |
| Less than High School | 0 (0.0%) | 0 (0.0%) |
| High School Diploma | 0 (0.0%) | 0 (0.0%) |
| College or Associate's Degree | 0 (0.0%) | 0 (0.0%) |
| Bachelor's Degree | 1 (100.0%) | 0 (0.0%) |
| Graduate Degree | 0 (0.0%) | 0 (0.0%) |
| Total | 1 (100.0%) | 0 (0.0%) |
Employment Characteristics in Arp
Employment by Class of Employer in Arp
Among the 535 employed individuals in Arp, private company employees (266 | 49.7%), self-employed (incorporated) (71 | 13.3%), and self-employed (not incorporated) (70 | 13.1%) make up the most common classes of employment.
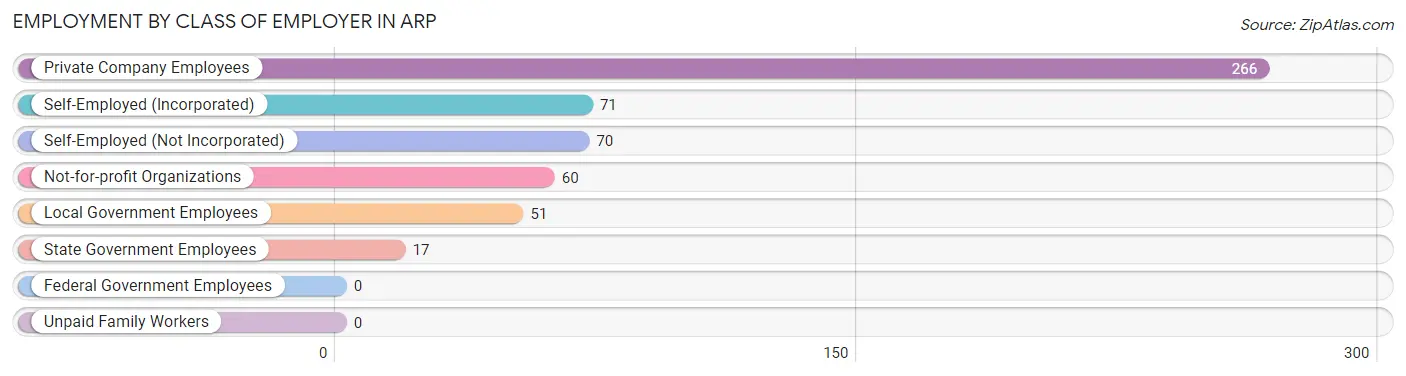
| Employer Class | # Employees | % Employees |
| Private Company Employees | 266 | 49.7% |
| Self-Employed (Incorporated) | 71 | 13.3% |
| Self-Employed (Not Incorporated) | 70 | 13.1% |
| Not-for-profit Organizations | 60 | 11.2% |
| Local Government Employees | 51 | 9.5% |
| State Government Employees | 17 | 3.2% |
| Federal Government Employees | 0 | 0.0% |
| Unpaid Family Workers | 0 | 0.0% |
| Total | 535 | 100.0% |
Employment Status by Age in Arp
According to the labor force statistics for Arp, out of the total population over 16 years of age (999), 58.8% or 587 individuals are in the labor force, with 3.6% or 21 of them unemployed. The age group with the highest labor force participation rate is 30 to 34 years, with 100.0% or 102 individuals in the labor force. Within the labor force, the 20 to 24 years age range has the highest percentage of unemployed individuals, with 68.0% or 17 of them being unemployed.
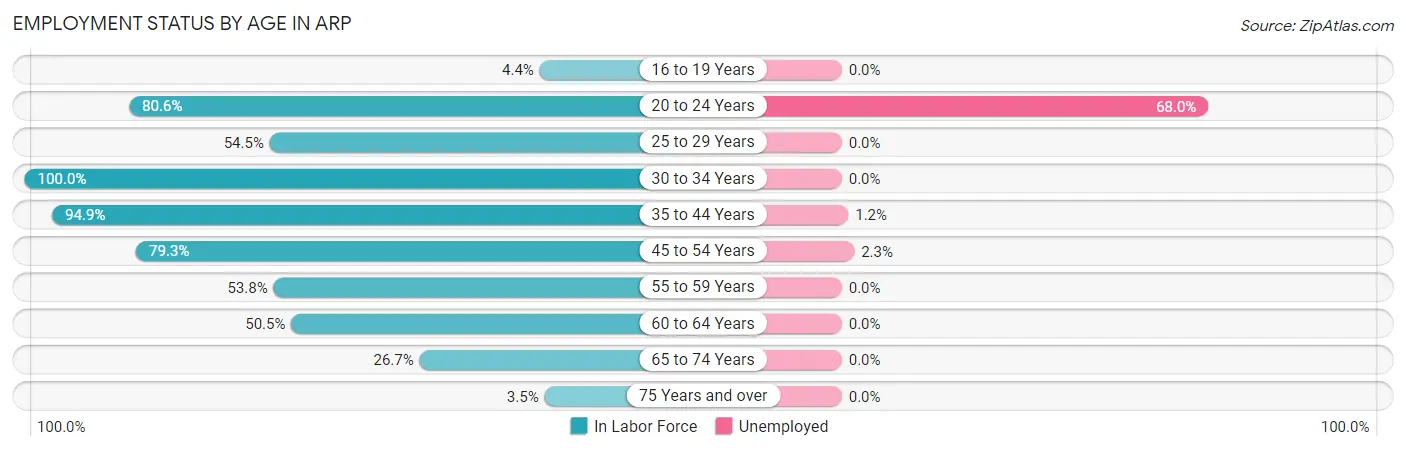
| Age Bracket | In Labor Force | Unemployed |
| 16 to 19 Years | 3 (4.4%) | 0 (0.0%) |
| 20 to 24 Years | 25 (80.6%) | 17 (68.0%) |
| 25 to 29 Years | 79 (54.5%) | 0 (0.0%) |
| 30 to 34 Years | 102 (100.0%) | 0 (0.0%) |
| 35 to 44 Years | 169 (94.9%) | 2 (1.2%) |
| 45 to 54 Years | 88 (79.3%) | 2 (2.3%) |
| 55 to 59 Years | 43 (53.8%) | 0 (0.0%) |
| 60 to 64 Years | 47 (50.5%) | 0 (0.0%) |
| 65 to 74 Years | 28 (26.7%) | 0 (0.0%) |
| 75 Years and over | 3 (3.5%) | 0 (0.0%) |
| Total | 587 (58.8%) | 21 (3.6%) |
Employment Status by Educational Attainment in Arp
According to labor force statistics for Arp, 74.5% of individuals (528) out of the total population between 25 and 64 years of age (709) are in the labor force, with 0.8% or 4 of them being unemployed. The group with the highest labor force participation rate are those with the educational attainment of bachelor's degree or higher, with 85.0% or 85 individuals in the labor force. Within the labor force, individuals with less than high school education have the highest percentage of unemployment, with 2.6% or 2 of them being unemployed.
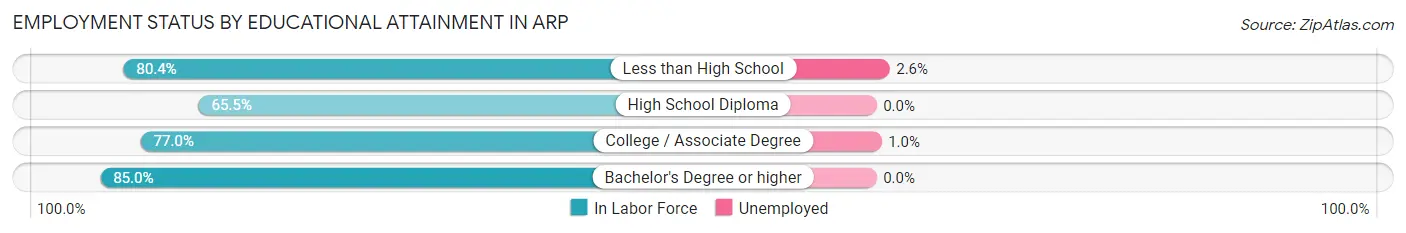
| Educational Attainment | In Labor Force | Unemployed |
| Less than High School | 78 (80.4%) | 3 (2.6%) |
| High School Diploma | 167 (65.5%) | 0 (0.0%) |
| College / Associate Degree | 198 (77.0%) | 3 (1.0%) |
| Bachelor's Degree or higher | 85 (85.0%) | 0 (0.0%) |
| Total | 528 (74.5%) | 6 (0.8%) |
Employment Occupations by Sex in Arp
Management, Business, Science and Arts Occupations
The most common Management, Business, Science and Arts occupations in Arp are Management (89 | 15.7%), Community & Social Service (32 | 5.7%), Education Instruction & Library (30 | 5.3%), Computers, Engineering & Science (23 | 4.1%), and Architecture & Engineering (19 | 3.4%).
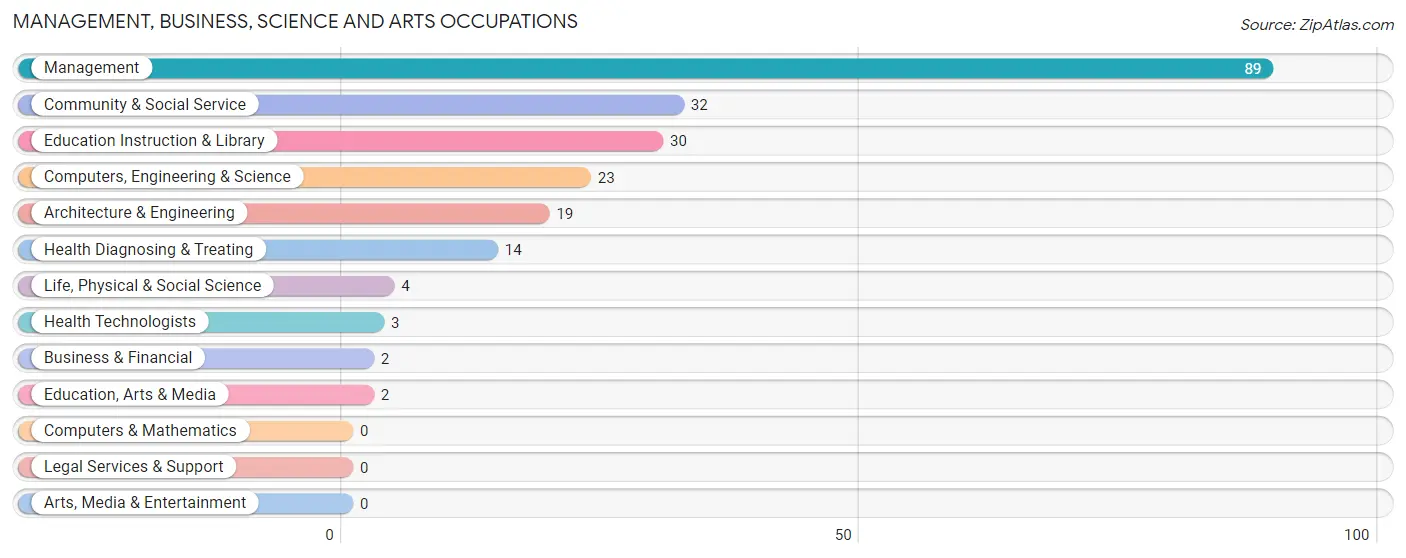
Management, Business, Science and Arts Occupations by Sex
Within the Management, Business, Science and Arts occupations in Arp, the most male-oriented occupations are Business & Financial (100.0%), Life, Physical & Social Science (100.0%), and Education, Arts & Media (100.0%), while the most female-oriented occupations are Health Technologists (100.0%), Education Instruction & Library (76.7%), and Community & Social Service (71.9%).
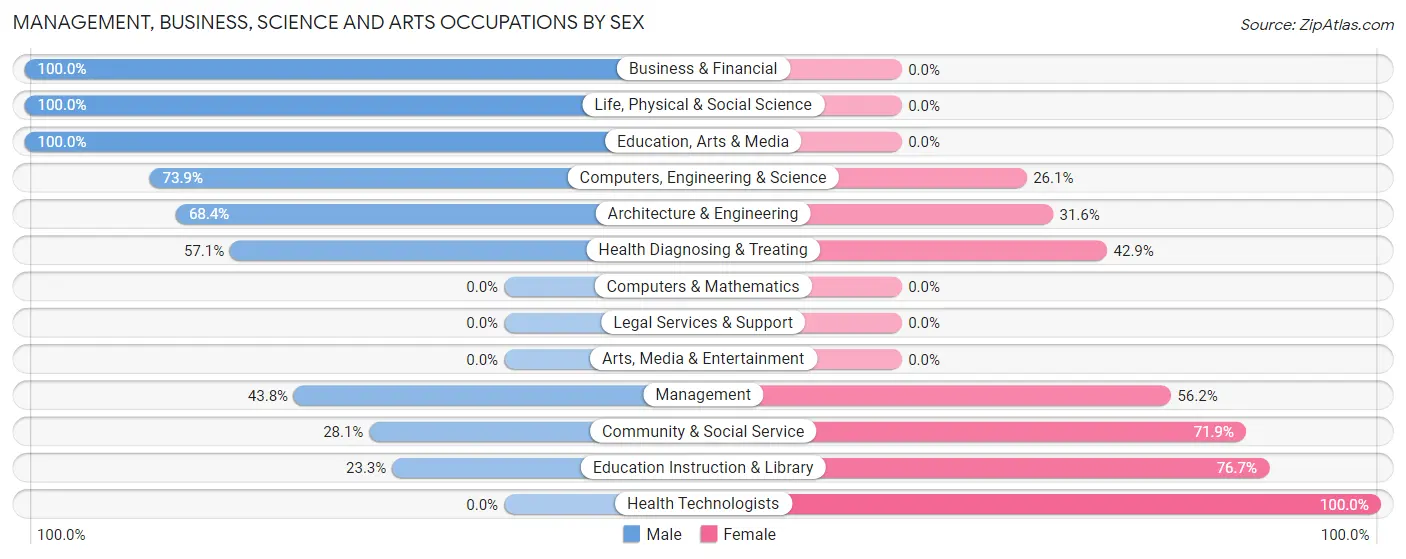
| Occupation | Male | Female |
| Management | 39 (43.8%) | 50 (56.2%) |
| Business & Financial | 2 (100.0%) | 0 (0.0%) |
| Computers, Engineering & Science | 17 (73.9%) | 6 (26.1%) |
| Computers & Mathematics | 0 (0.0%) | 0 (0.0%) |
| Architecture & Engineering | 13 (68.4%) | 6 (31.6%) |
| Life, Physical & Social Science | 4 (100.0%) | 0 (0.0%) |
| Community & Social Service | 9 (28.1%) | 23 (71.9%) |
| Education, Arts & Media | 2 (100.0%) | 0 (0.0%) |
| Legal Services & Support | 0 (0.0%) | 0 (0.0%) |
| Education Instruction & Library | 7 (23.3%) | 23 (76.7%) |
| Arts, Media & Entertainment | 0 (0.0%) | 0 (0.0%) |
| Health Diagnosing & Treating | 8 (57.1%) | 6 (42.9%) |
| Health Technologists | 0 (0.0%) | 3 (100.0%) |
| Total (Category) | 75 (46.9%) | 85 (53.1%) |
| Total (Overall) | 325 (57.4%) | 241 (42.6%) |
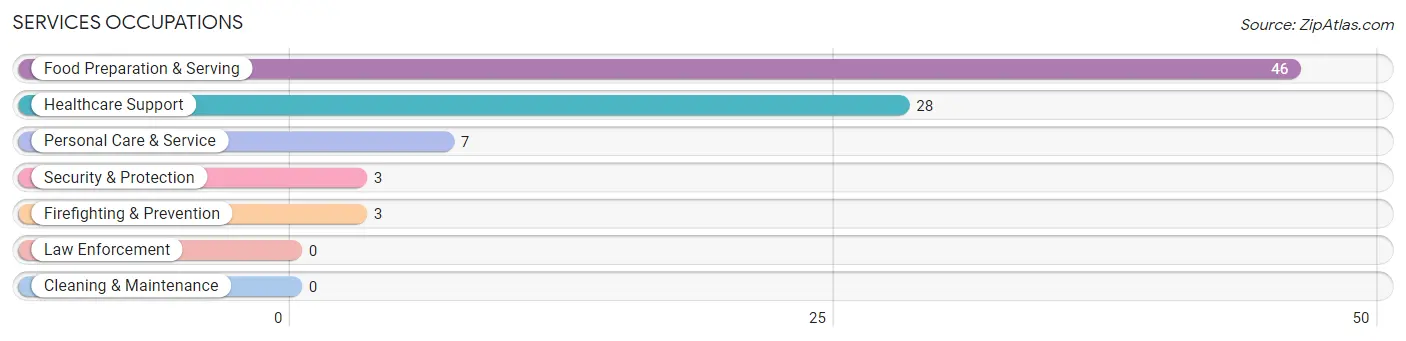
Services Occupations
The most common Services occupations in Arp are Food Preparation & Serving (46 | 8.1%), Healthcare Support (28 | 5.0%), Personal Care & Service (7 | 1.2%), Security & Protection (3 | 0.5%), and Firefighting & Prevention (3 | 0.5%).
Services Occupations by Sex
Within the Services occupations in Arp, the most male-oriented occupations are Security & Protection (100.0%), Firefighting & Prevention (100.0%), and Food Preparation & Serving (73.9%), while the most female-oriented occupations are Healthcare Support (100.0%), Personal Care & Service (100.0%), and Food Preparation & Serving (26.1%).
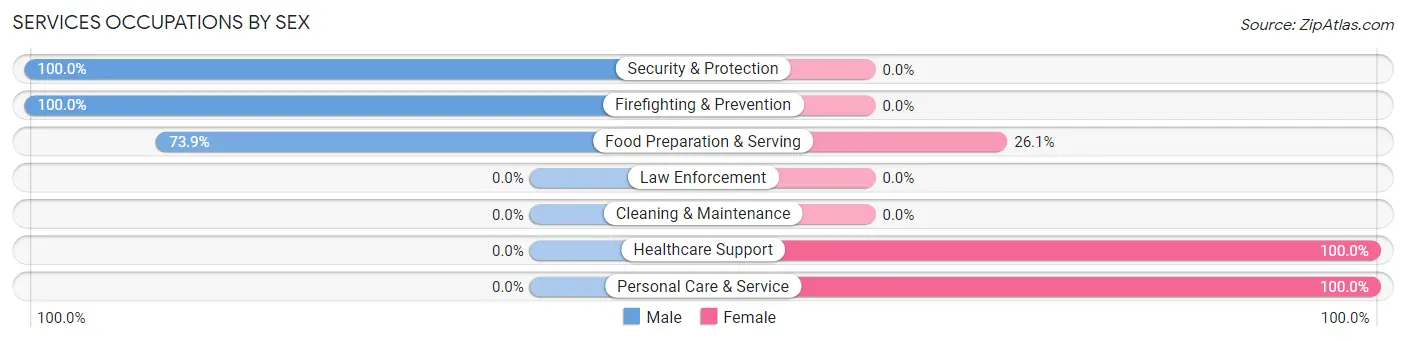
| Occupation | Male | Female |
| Healthcare Support | 0 (0.0%) | 28 (100.0%) |
| Security & Protection | 3 (100.0%) | 0 (0.0%) |
| Firefighting & Prevention | 3 (100.0%) | 0 (0.0%) |
| Law Enforcement | 0 (0.0%) | 0 (0.0%) |
| Food Preparation & Serving | 34 (73.9%) | 12 (26.1%) |
| Cleaning & Maintenance | 0 (0.0%) | 0 (0.0%) |
| Personal Care & Service | 0 (0.0%) | 7 (100.0%) |
| Total (Category) | 37 (44.1%) | 47 (55.9%) |
| Total (Overall) | 325 (57.4%) | 241 (42.6%) |
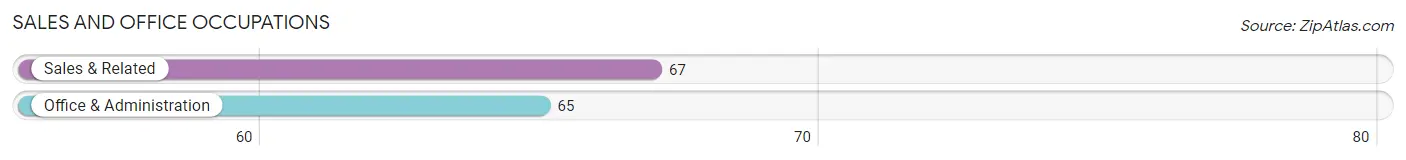
Sales and Office Occupations
The most common Sales and Office occupations in Arp are Sales & Related (67 | 11.8%), and Office & Administration (65 | 11.5%).
Sales and Office Occupations by Sex
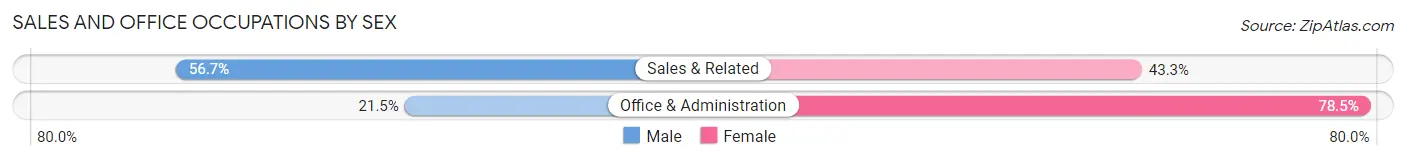
| Occupation | Male | Female |
| Sales & Related | 38 (56.7%) | 29 (43.3%) |
| Office & Administration | 14 (21.5%) | 51 (78.5%) |
| Total (Category) | 52 (39.4%) | 80 (60.6%) |
| Total (Overall) | 325 (57.4%) | 241 (42.6%) |
Natural Resources, Construction and Maintenance Occupations
The most common Natural Resources, Construction and Maintenance occupations in Arp are Construction & Extraction (86 | 15.2%), and Installation, Maintenance & Repair (18 | 3.2%).
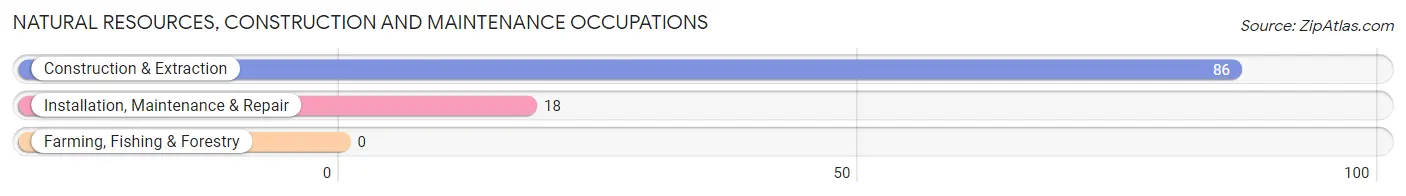
Natural Resources, Construction and Maintenance Occupations by Sex
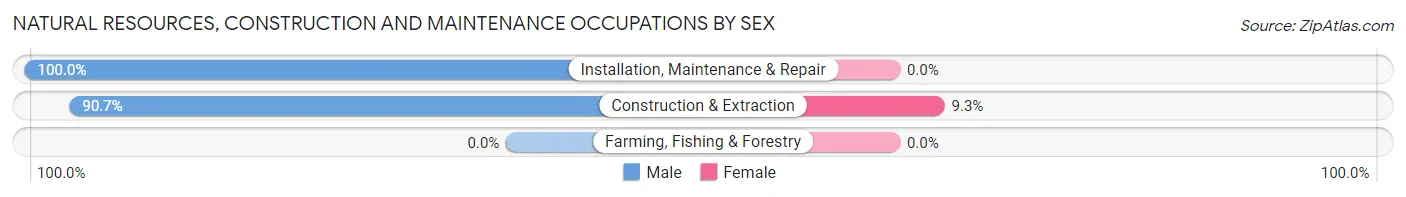
| Occupation | Male | Female |
| Farming, Fishing & Forestry | 0 (0.0%) | 0 (0.0%) |
| Construction & Extraction | 78 (90.7%) | 8 (9.3%) |
| Installation, Maintenance & Repair | 18 (100.0%) | 0 (0.0%) |
| Total (Category) | 96 (92.3%) | 8 (7.7%) |
| Total (Overall) | 325 (57.4%) | 241 (42.6%) |
Production, Transportation and Moving Occupations
The most common Production, Transportation and Moving occupations in Arp are Production (49 | 8.7%), Material Moving (27 | 4.8%), and Transportation (10 | 1.8%).
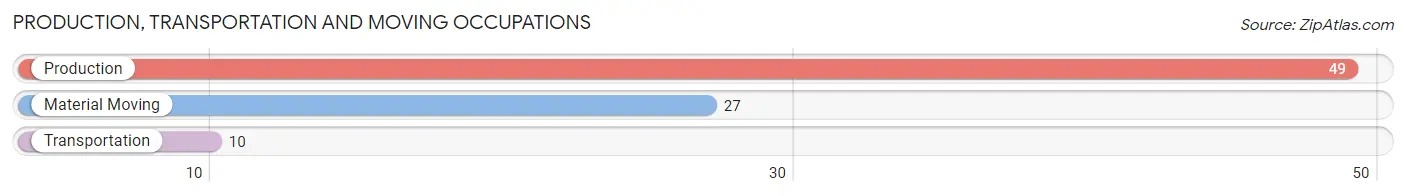
Production, Transportation and Moving Occupations by Sex
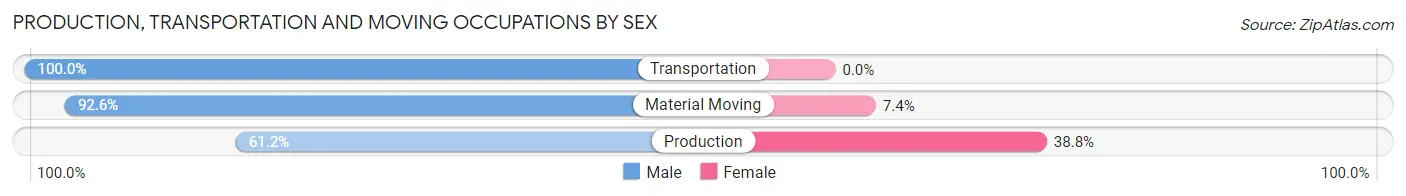
| Occupation | Male | Female |
| Production | 30 (61.2%) | 19 (38.8%) |
| Transportation | 10 (100.0%) | 0 (0.0%) |
| Material Moving | 25 (92.6%) | 2 (7.4%) |
| Total (Category) | 65 (75.6%) | 21 (24.4%) |
| Total (Overall) | 325 (57.4%) | 241 (42.6%) |
Employment Industries by Sex in Arp
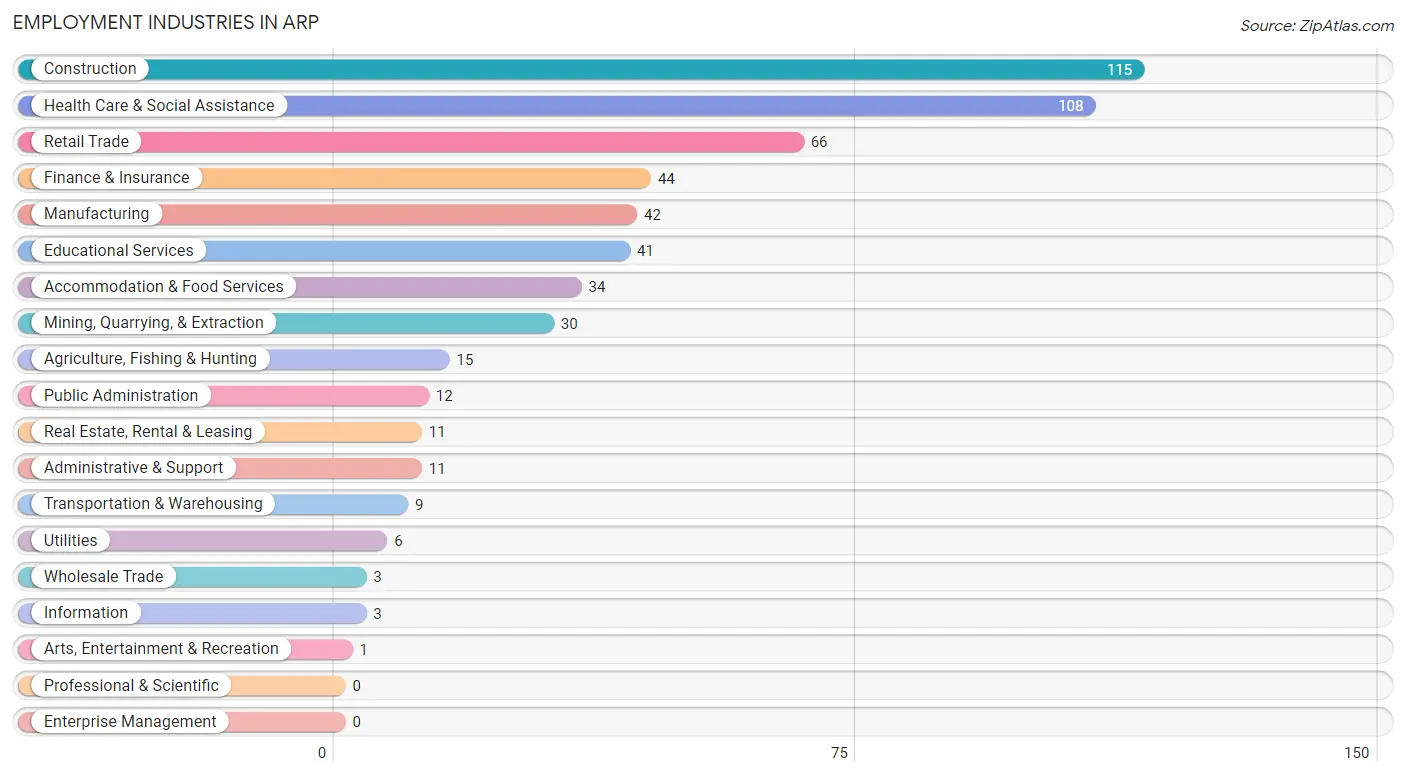
Employment Industries in Arp
The major employment industries in Arp include Construction (115 | 20.3%), Health Care & Social Assistance (108 | 19.1%), Retail Trade (66 | 11.7%), Finance & Insurance (44 | 7.8%), and Manufacturing (42 | 7.4%).
Employment Industries by Sex in Arp
The Arp industries that see more men than women are Agriculture, Fishing & Hunting (100.0%), Mining, Quarrying, & Extraction (100.0%), and Wholesale Trade (100.0%), whereas the industries that tend to have a higher number of women are Information (100.0%), Real Estate, Rental & Leasing (100.0%), and Arts, Entertainment & Recreation (100.0%).
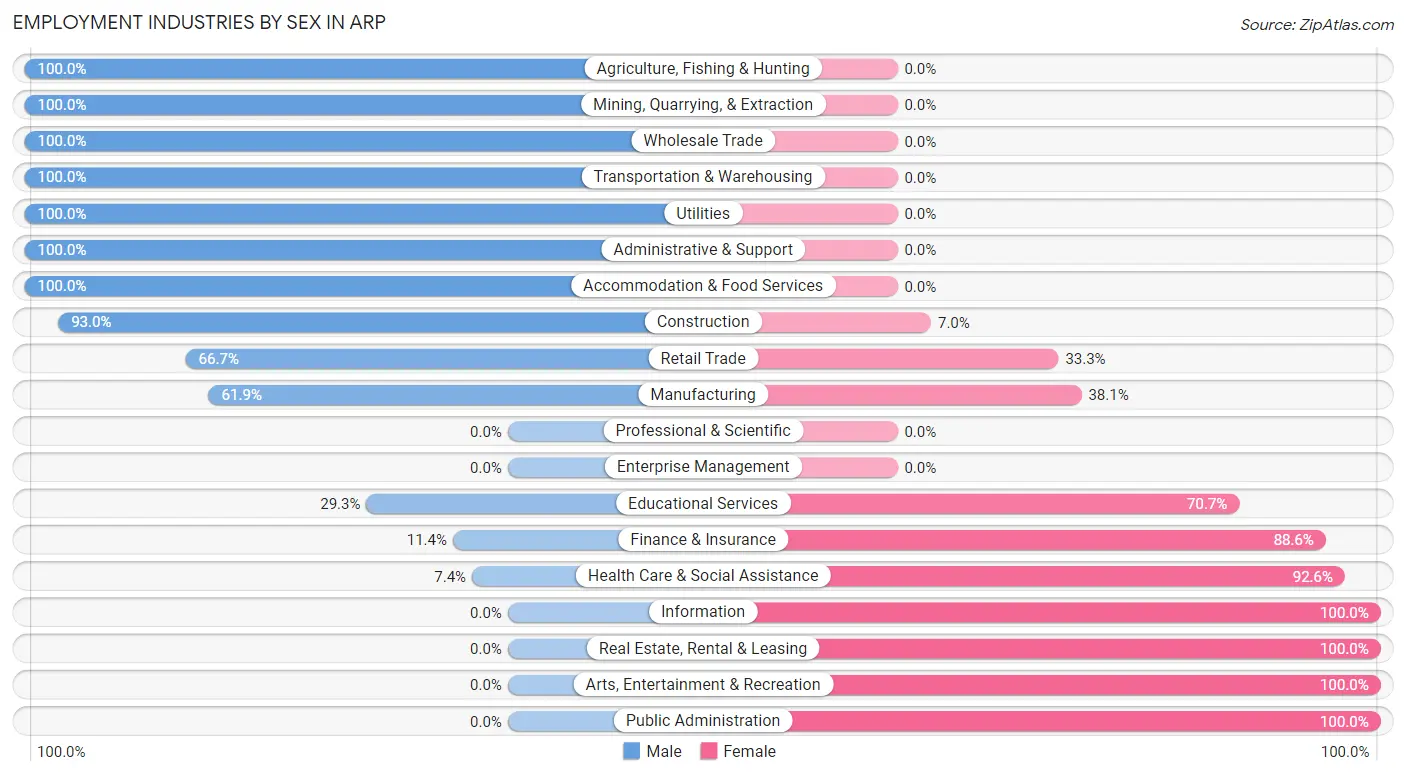
| Industry | Male | Female |
| Agriculture, Fishing & Hunting | 15 (100.0%) | 0 (0.0%) |
| Mining, Quarrying, & Extraction | 30 (100.0%) | 0 (0.0%) |
| Construction | 107 (93.0%) | 8 (7.0%) |
| Manufacturing | 26 (61.9%) | 16 (38.1%) |
| Wholesale Trade | 3 (100.0%) | 0 (0.0%) |
| Retail Trade | 44 (66.7%) | 22 (33.3%) |
| Transportation & Warehousing | 9 (100.0%) | 0 (0.0%) |
| Utilities | 6 (100.0%) | 0 (0.0%) |
| Information | 0 (0.0%) | 3 (100.0%) |
| Finance & Insurance | 5 (11.4%) | 39 (88.6%) |
| Real Estate, Rental & Leasing | 0 (0.0%) | 11 (100.0%) |
| Professional & Scientific | 0 (0.0%) | 0 (0.0%) |
| Enterprise Management | 0 (0.0%) | 0 (0.0%) |
| Administrative & Support | 11 (100.0%) | 0 (0.0%) |
| Educational Services | 12 (29.3%) | 29 (70.7%) |
| Health Care & Social Assistance | 8 (7.4%) | 100 (92.6%) |
| Arts, Entertainment & Recreation | 0 (0.0%) | 1 (100.0%) |
| Accommodation & Food Services | 34 (100.0%) | 0 (0.0%) |
| Public Administration | 0 (0.0%) | 12 (100.0%) |
| Total | 325 (57.4%) | 241 (42.6%) |
Education in Arp
School Enrollment in Arp
The most common levels of schooling among the 369 students in Arp are high school (141 | 38.2%), middle school (115 | 31.2%), and elementary school (48 | 13.0%).
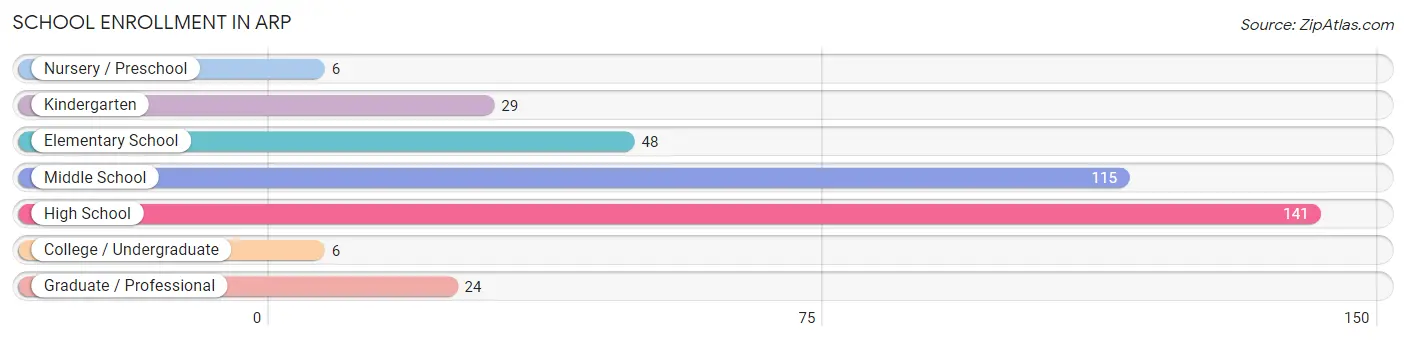
| School Level | # Students | % Students |
| Nursery / Preschool | 6 | 1.6% |
| Kindergarten | 29 | 7.9% |
| Elementary School | 48 | 13.0% |
| Middle School | 115 | 31.2% |
| High School | 141 | 38.2% |
| College / Undergraduate | 6 | 1.6% |
| Graduate / Professional | 24 | 6.5% |
| Total | 369 | 100.0% |
School Enrollment by Age by Funding Source in Arp
Out of a total of 369 students who are enrolled in schools in Arp, 9 (2.4%) attend a private institution, while the remaining 360 (97.6%) are enrolled in public schools. The age group of 3 to 4 year olds has the highest likelihood of being enrolled in private schools, with 6 (100.0% in the age bracket) enrolled. Conversely, the age group of 5 to 9 year old has the lowest likelihood of being enrolled in a private school, with 77 (100.0% in the age bracket) attending a public institution.
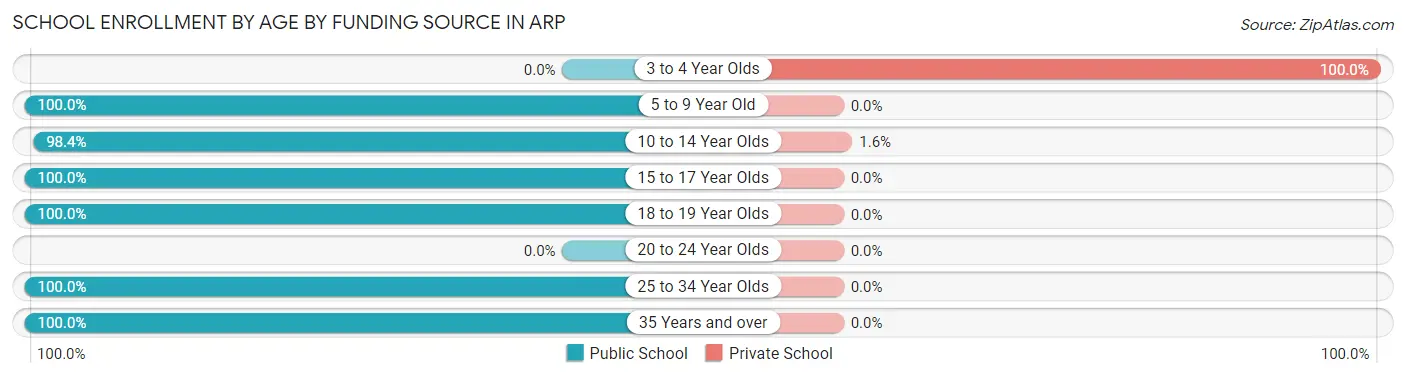
| Age Bracket | Public School | Private School |
| 3 to 4 Year Olds | 0 (0.0%) | 6 (100.0%) |
| 5 to 9 Year Old | 77 (100.0%) | 0 (0.0%) |
| 10 to 14 Year Olds | 183 (98.4%) | 3 (1.6%) |
| 15 to 17 Year Olds | 50 (100.0%) | 0 (0.0%) |
| 18 to 19 Year Olds | 23 (100.0%) | 0 (0.0%) |
| 20 to 24 Year Olds | 0 (0.0%) | 0 (0.0%) |
| 25 to 34 Year Olds | 6 (100.0%) | 0 (0.0%) |
| 35 Years and over | 21 (100.0%) | 0 (0.0%) |
| Total | 360 (97.6%) | 9 (2.4%) |
Educational Attainment by Field of Study in Arp
Science & technology (27 | 25.2%), literature & languages (21 | 19.6%), business (15 | 14.0%), physical & health sciences (8 | 7.5%), and communications (8 | 7.5%) are the most common fields of study among 107 individuals in Arp who have obtained a bachelor's degree or higher.
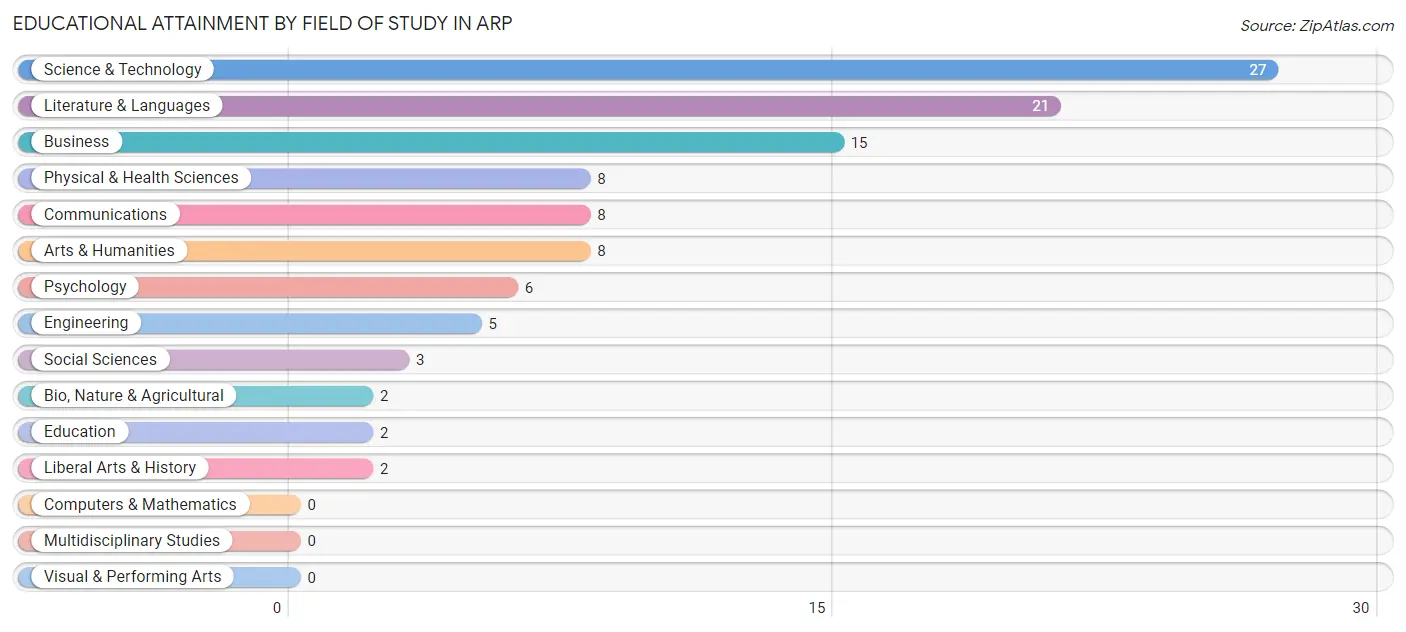
| Field of Study | # Graduates | % Graduates |
| Computers & Mathematics | 0 | 0.0% |
| Bio, Nature & Agricultural | 2 | 1.9% |
| Physical & Health Sciences | 8 | 7.5% |
| Psychology | 6 | 5.6% |
| Social Sciences | 3 | 2.8% |
| Engineering | 5 | 4.7% |
| Multidisciplinary Studies | 0 | 0.0% |
| Science & Technology | 27 | 25.2% |
| Business | 15 | 14.0% |
| Education | 2 | 1.9% |
| Literature & Languages | 21 | 19.6% |
| Liberal Arts & History | 2 | 1.9% |
| Visual & Performing Arts | 0 | 0.0% |
| Communications | 8 | 7.5% |
| Arts & Humanities | 8 | 7.5% |
| Total | 107 | 100.0% |
Transportation & Commute in Arp
Vehicle Availability by Sex in Arp
The most prevalent vehicle ownership categories in Arp are males with 2 vehicles (124, accounting for 38.2%) and females with 2 vehicles (118, making up 59.1%).
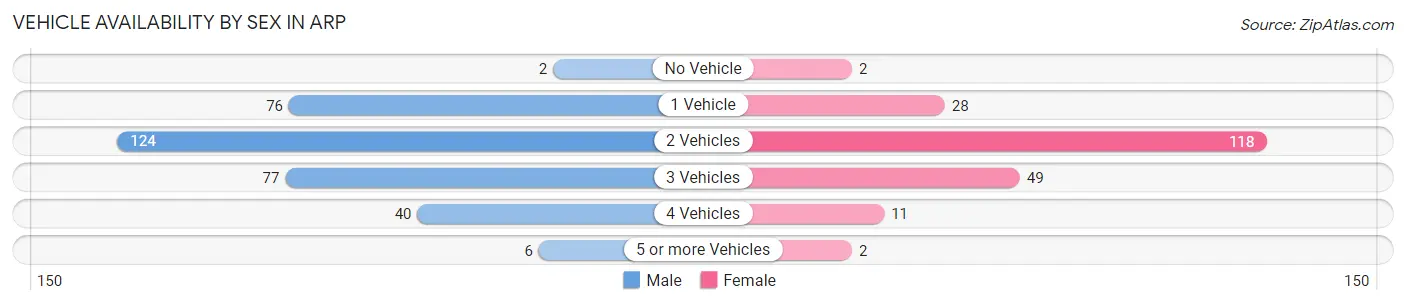
| Vehicles Available | Male | Female |
| No Vehicle | 2 (0.6%) | 2 (0.9%) |
| 1 Vehicle | 76 (23.4%) | 28 (13.3%) |
| 2 Vehicles | 124 (38.2%) | 118 (56.2%) |
| 3 Vehicles | 77 (23.7%) | 49 (23.3%) |
| 4 Vehicles | 40 (12.3%) | 11 (5.2%) |
| 5 or more Vehicles | 6 (1.8%) | 2 (0.9%) |
| Total | 325 (100.0%) | 210 (100.0%) |
Commute Time in Arp
The most frequently occuring commute durations in Arp are 30 to 34 minutes (213 commuters, 44.1%), less than 5 minutes (61 commuters, 12.6%), and 10 to 14 minutes (38 commuters, 7.9%).
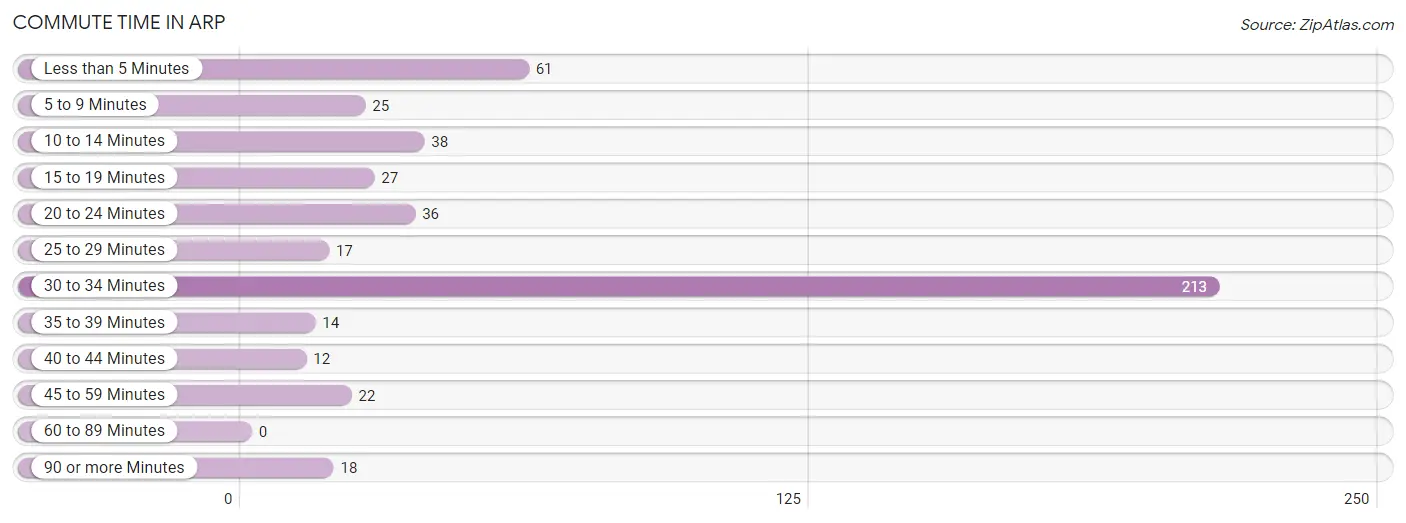
| Commute Time | # Commuters | % Commuters |
| Less than 5 Minutes | 61 | 12.6% |
| 5 to 9 Minutes | 25 | 5.2% |
| 10 to 14 Minutes | 38 | 7.9% |
| 15 to 19 Minutes | 27 | 5.6% |
| 20 to 24 Minutes | 36 | 7.4% |
| 25 to 29 Minutes | 17 | 3.5% |
| 30 to 34 Minutes | 213 | 44.1% |
| 35 to 39 Minutes | 14 | 2.9% |
| 40 to 44 Minutes | 12 | 2.5% |
| 45 to 59 Minutes | 22 | 4.5% |
| 60 to 89 Minutes | 0 | 0.0% |
| 90 or more Minutes | 18 | 3.7% |
Commute Time by Sex in Arp
The most common commute times in Arp are 30 to 34 minutes (143 commuters, 51.8%) for males and 30 to 34 minutes (70 commuters, 33.8%) for females.
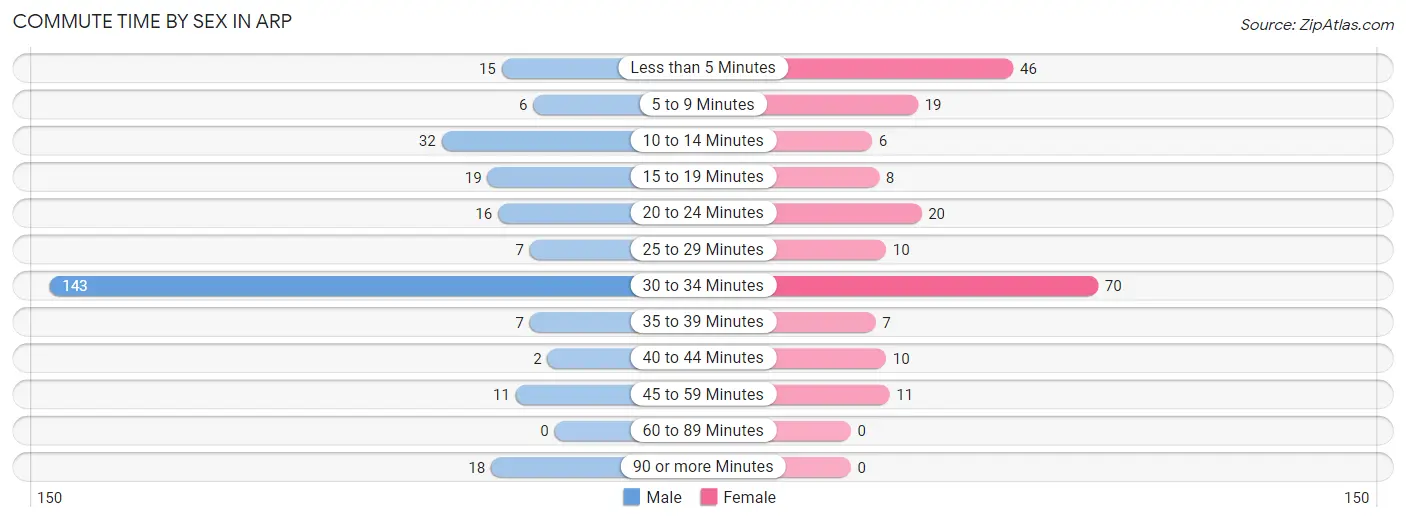
| Commute Time | Male | Female |
| Less than 5 Minutes | 15 (5.4%) | 46 (22.2%) |
| 5 to 9 Minutes | 6 (2.2%) | 19 (9.2%) |
| 10 to 14 Minutes | 32 (11.6%) | 6 (2.9%) |
| 15 to 19 Minutes | 19 (6.9%) | 8 (3.9%) |
| 20 to 24 Minutes | 16 (5.8%) | 20 (9.7%) |
| 25 to 29 Minutes | 7 (2.5%) | 10 (4.8%) |
| 30 to 34 Minutes | 143 (51.8%) | 70 (33.8%) |
| 35 to 39 Minutes | 7 (2.5%) | 7 (3.4%) |
| 40 to 44 Minutes | 2 (0.7%) | 10 (4.8%) |
| 45 to 59 Minutes | 11 (4.0%) | 11 (5.3%) |
| 60 to 89 Minutes | 0 (0.0%) | 0 (0.0%) |
| 90 or more Minutes | 18 (6.5%) | 0 (0.0%) |
Time of Departure to Work by Sex in Arp
The most frequent times of departure to work in Arp are 7:00 AM to 7:29 AM (65, 23.5%) for males and 7:00 AM to 7:29 AM (100, 48.3%) for females.
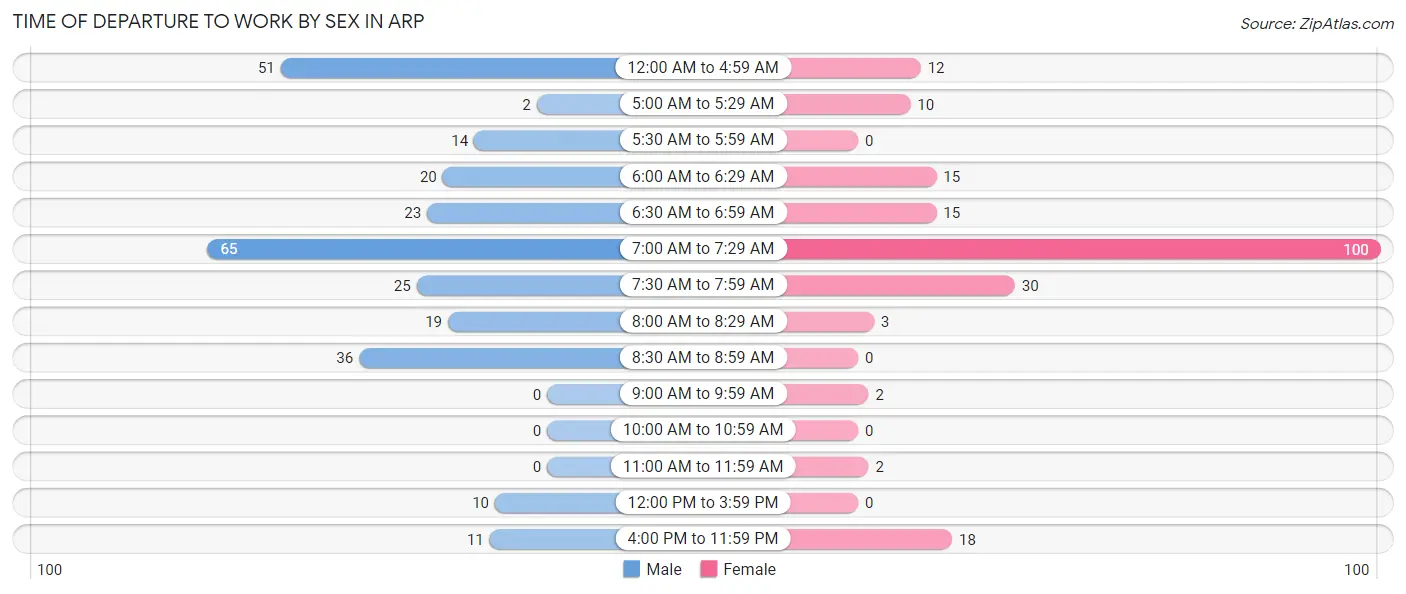
| Time of Departure | Male | Female |
| 12:00 AM to 4:59 AM | 51 (18.5%) | 12 (5.8%) |
| 5:00 AM to 5:29 AM | 2 (0.7%) | 10 (4.8%) |
| 5:30 AM to 5:59 AM | 14 (5.1%) | 0 (0.0%) |
| 6:00 AM to 6:29 AM | 20 (7.2%) | 15 (7.2%) |
| 6:30 AM to 6:59 AM | 23 (8.3%) | 15 (7.2%) |
| 7:00 AM to 7:29 AM | 65 (23.5%) | 100 (48.3%) |
| 7:30 AM to 7:59 AM | 25 (9.1%) | 30 (14.5%) |
| 8:00 AM to 8:29 AM | 19 (6.9%) | 3 (1.5%) |
| 8:30 AM to 8:59 AM | 36 (13.0%) | 0 (0.0%) |
| 9:00 AM to 9:59 AM | 0 (0.0%) | 2 (1.0%) |
| 10:00 AM to 10:59 AM | 0 (0.0%) | 0 (0.0%) |
| 11:00 AM to 11:59 AM | 0 (0.0%) | 2 (1.0%) |
| 12:00 PM to 3:59 PM | 10 (3.6%) | 0 (0.0%) |
| 4:00 PM to 11:59 PM | 11 (4.0%) | 18 (8.7%) |
| Total | 276 (100.0%) | 207 (100.0%) |
Housing Occupancy in Arp
Occupancy by Ownership in Arp
Of the total 411 dwellings in Arp, owner-occupied units account for 297 (72.3%), while renter-occupied units make up 114 (27.7%).
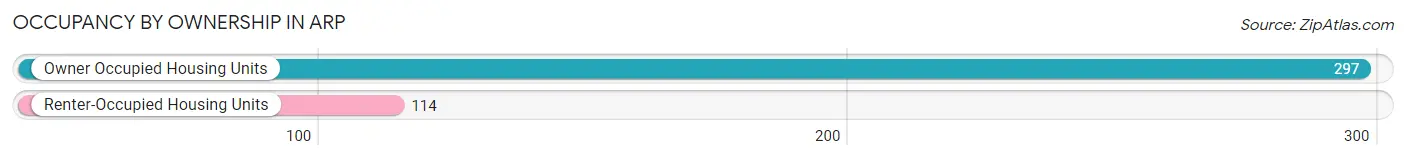
| Occupancy | # Housing Units | % Housing Units |
| Owner Occupied Housing Units | 297 | 72.3% |
| Renter-Occupied Housing Units | 114 | 27.7% |
| Total Occupied Housing Units | 411 | 100.0% |
Occupancy by Household Size in Arp
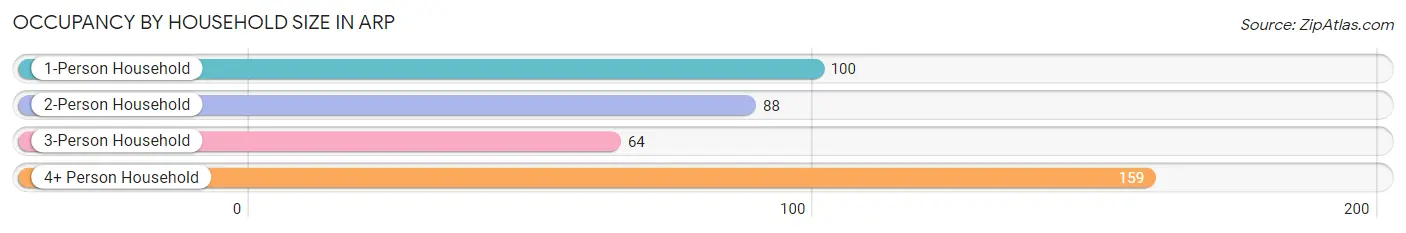
| Household Size | # Housing Units | % Housing Units |
| 1-Person Household | 100 | 24.3% |
| 2-Person Household | 88 | 21.4% |
| 3-Person Household | 64 | 15.6% |
| 4+ Person Household | 159 | 38.7% |
| Total Housing Units | 411 | 100.0% |
Occupancy by Ownership by Household Size in Arp
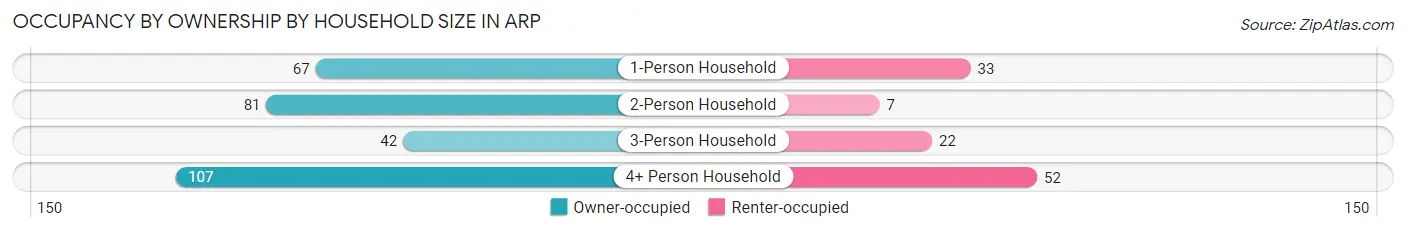
| Household Size | Owner-occupied | Renter-occupied |
| 1-Person Household | 67 (67.0%) | 33 (33.0%) |
| 2-Person Household | 81 (92.0%) | 7 (8.0%) |
| 3-Person Household | 42 (65.6%) | 22 (34.4%) |
| 4+ Person Household | 107 (67.3%) | 52 (32.7%) |
| Total Housing Units | 297 (72.3%) | 114 (27.7%) |
Occupancy by Educational Attainment in Arp
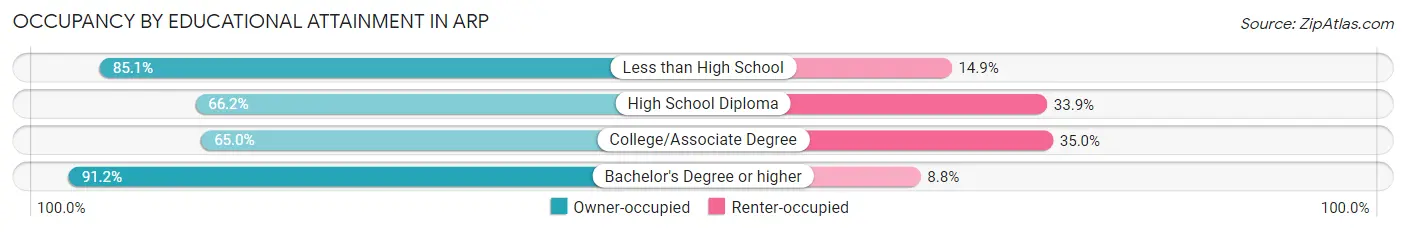
| Household Size | Owner-occupied | Renter-occupied |
| Less than High School | 57 (85.1%) | 10 (14.9%) |
| High School Diploma | 86 (66.1%) | 44 (33.9%) |
| College/Associate Degree | 102 (65.0%) | 55 (35.0%) |
| Bachelor's Degree or higher | 52 (91.2%) | 5 (8.8%) |
Occupancy by Age of Householder in Arp
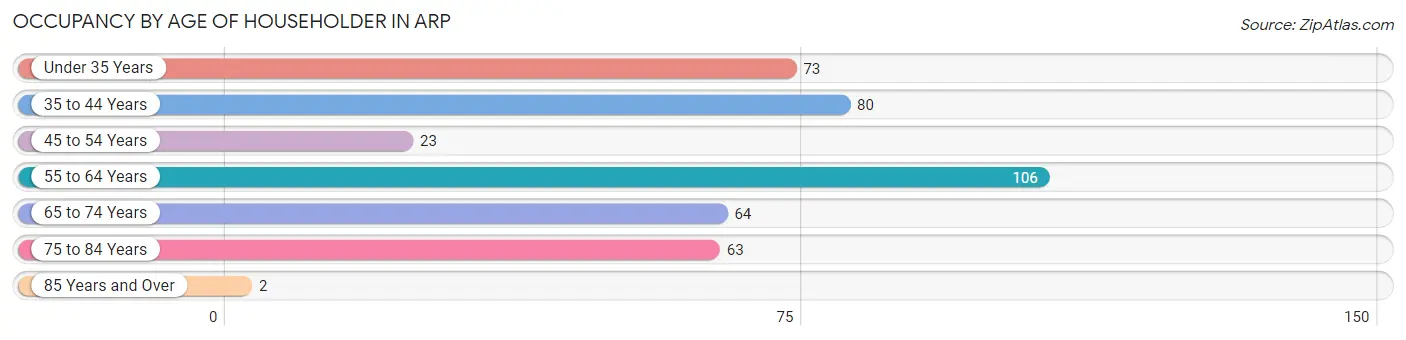
| Age Bracket | # Households | % Households |
| Under 35 Years | 73 | 17.8% |
| 35 to 44 Years | 80 | 19.5% |
| 45 to 54 Years | 23 | 5.6% |
| 55 to 64 Years | 106 | 25.8% |
| 65 to 74 Years | 64 | 15.6% |
| 75 to 84 Years | 63 | 15.3% |
| 85 Years and Over | 2 | 0.5% |
| Total | 411 | 100.0% |
Housing Finances in Arp
Median Income by Occupancy in Arp
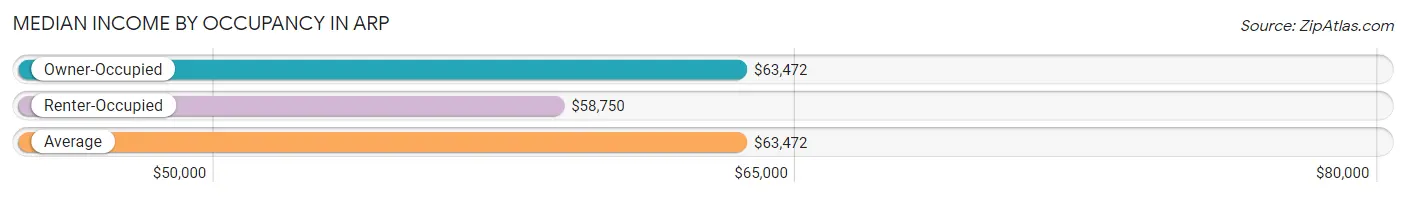
| Occupancy Type | # Households | Median Income |
| Owner-Occupied | 297 (72.3%) | $63,472 |
| Renter-Occupied | 114 (27.7%) | $58,750 |
| Average | 411 (100.0%) | $63,472 |
Occupancy by Householder Income Bracket in Arp
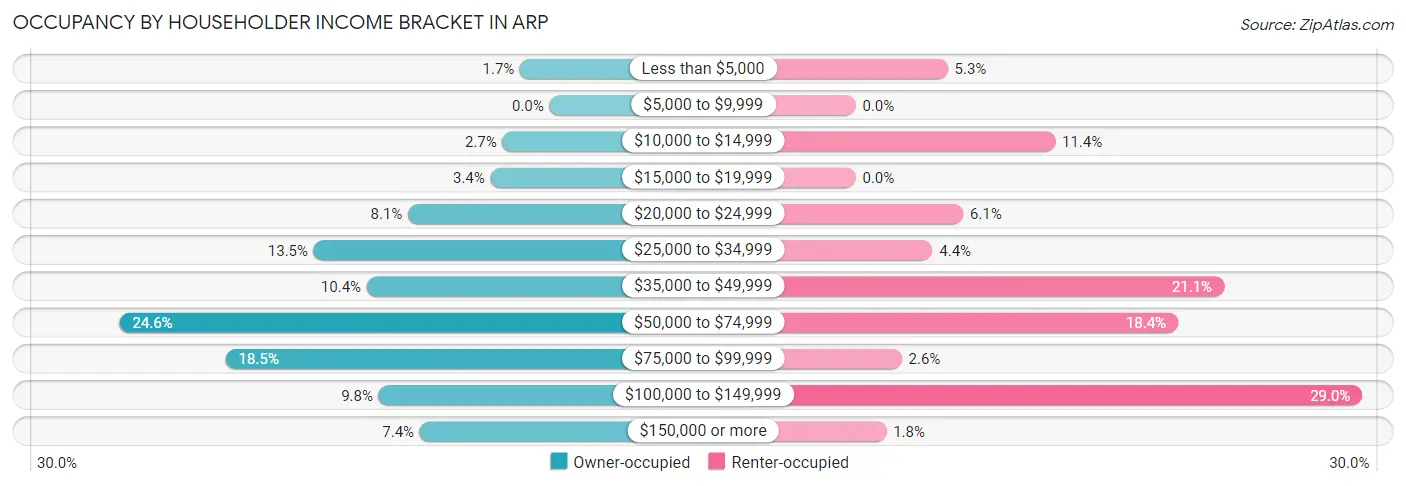
| Income Bracket | Owner-occupied | Renter-occupied |
| Less than $5,000 | 5 (1.7%) | 6 (5.3%) |
| $5,000 to $9,999 | 0 (0.0%) | 0 (0.0%) |
| $10,000 to $14,999 | 8 (2.7%) | 13 (11.4%) |
| $15,000 to $19,999 | 10 (3.4%) | 0 (0.0%) |
| $20,000 to $24,999 | 24 (8.1%) | 7 (6.1%) |
| $25,000 to $34,999 | 40 (13.5%) | 5 (4.4%) |
| $35,000 to $49,999 | 31 (10.4%) | 24 (21.0%) |
| $50,000 to $74,999 | 73 (24.6%) | 21 (18.4%) |
| $75,000 to $99,999 | 55 (18.5%) | 3 (2.6%) |
| $100,000 to $149,999 | 29 (9.8%) | 33 (28.9%) |
| $150,000 or more | 22 (7.4%) | 2 (1.8%) |
| Total | 297 (100.0%) | 114 (100.0%) |
Monthly Housing Cost Tiers in Arp
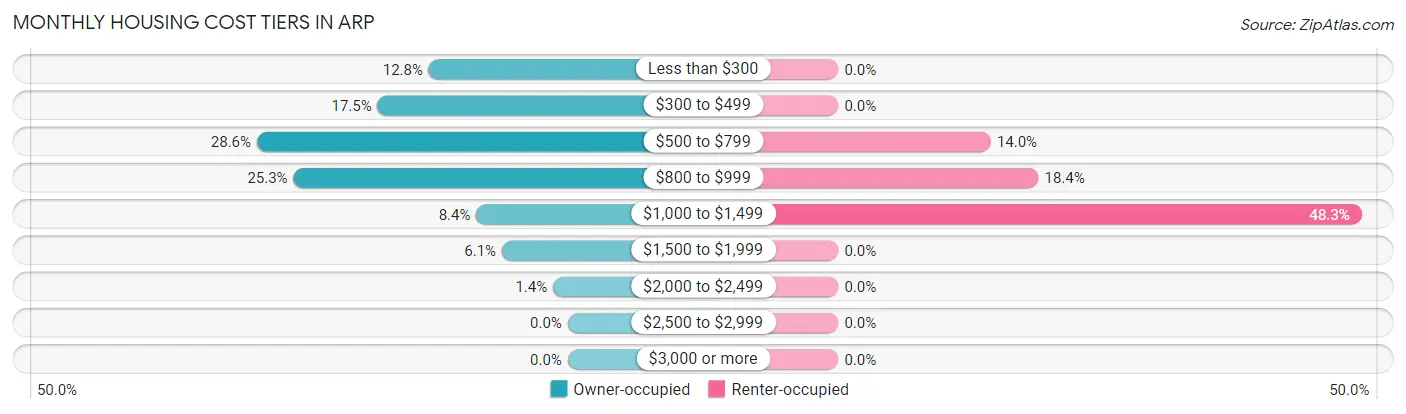
| Monthly Cost | Owner-occupied | Renter-occupied |
| Less than $300 | 38 (12.8%) | 0 (0.0%) |
| $300 to $499 | 52 (17.5%) | 0 (0.0%) |
| $500 to $799 | 85 (28.6%) | 16 (14.0%) |
| $800 to $999 | 75 (25.3%) | 21 (18.4%) |
| $1,000 to $1,499 | 25 (8.4%) | 55 (48.2%) |
| $1,500 to $1,999 | 18 (6.1%) | 0 (0.0%) |
| $2,000 to $2,499 | 4 (1.3%) | 0 (0.0%) |
| $2,500 to $2,999 | 0 (0.0%) | 0 (0.0%) |
| $3,000 or more | 0 (0.0%) | 0 (0.0%) |
| Total | 297 (100.0%) | 114 (100.0%) |
Physical Housing Characteristics in Arp
Housing Structures in Arp
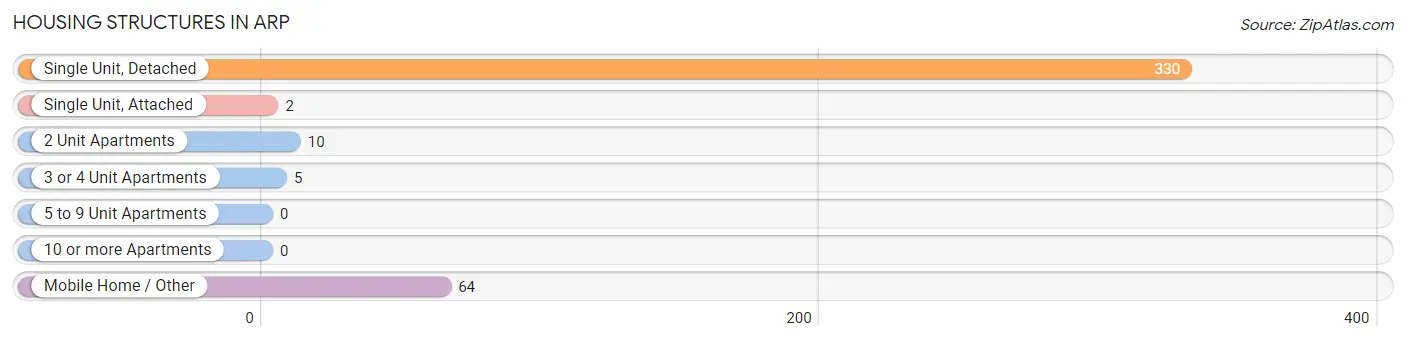
| Structure Type | # Housing Units | % Housing Units |
| Single Unit, Detached | 330 | 80.3% |
| Single Unit, Attached | 2 | 0.5% |
| 2 Unit Apartments | 10 | 2.4% |
| 3 or 4 Unit Apartments | 5 | 1.2% |
| 5 to 9 Unit Apartments | 0 | 0.0% |
| 10 or more Apartments | 0 | 0.0% |
| Mobile Home / Other | 64 | 15.6% |
| Total | 411 | 100.0% |
Housing Structures by Occupancy in Arp
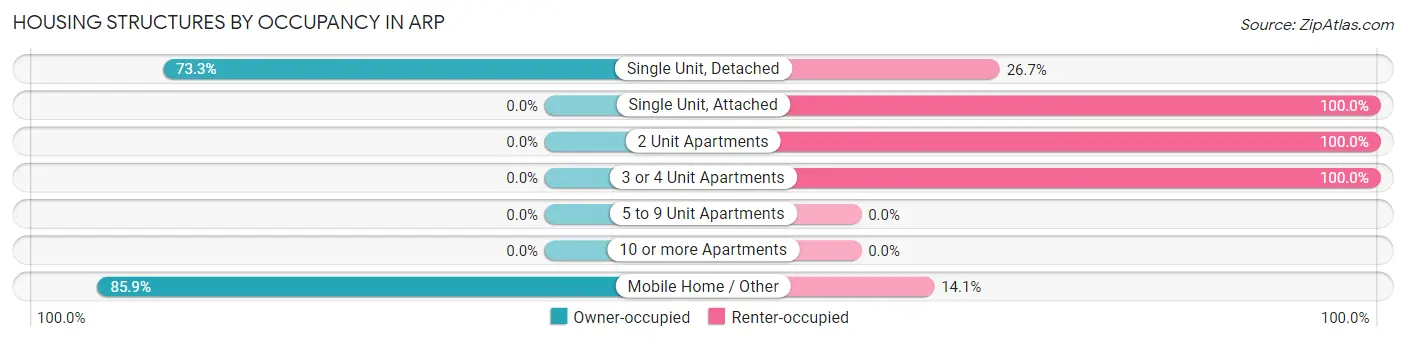
| Structure Type | Owner-occupied | Renter-occupied |
| Single Unit, Detached | 242 (73.3%) | 88 (26.7%) |
| Single Unit, Attached | 0 (0.0%) | 2 (100.0%) |
| 2 Unit Apartments | 0 (0.0%) | 10 (100.0%) |
| 3 or 4 Unit Apartments | 0 (0.0%) | 5 (100.0%) |
| 5 to 9 Unit Apartments | 0 (0.0%) | 0 (0.0%) |
| 10 or more Apartments | 0 (0.0%) | 0 (0.0%) |
| Mobile Home / Other | 55 (85.9%) | 9 (14.1%) |
| Total | 297 (72.3%) | 114 (27.7%) |
Housing Structures by Number of Rooms in Arp
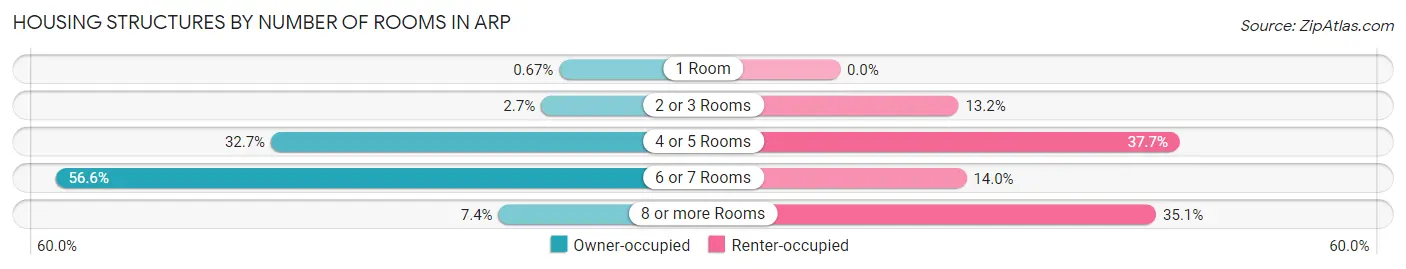
| Number of Rooms | Owner-occupied | Renter-occupied |
| 1 Room | 2 (0.7%) | 0 (0.0%) |
| 2 or 3 Rooms | 8 (2.7%) | 15 (13.2%) |
| 4 or 5 Rooms | 97 (32.7%) | 43 (37.7%) |
| 6 or 7 Rooms | 168 (56.6%) | 16 (14.0%) |
| 8 or more Rooms | 22 (7.4%) | 40 (35.1%) |
| Total | 297 (100.0%) | 114 (100.0%) |
Housing Structure by Heating Type in Arp
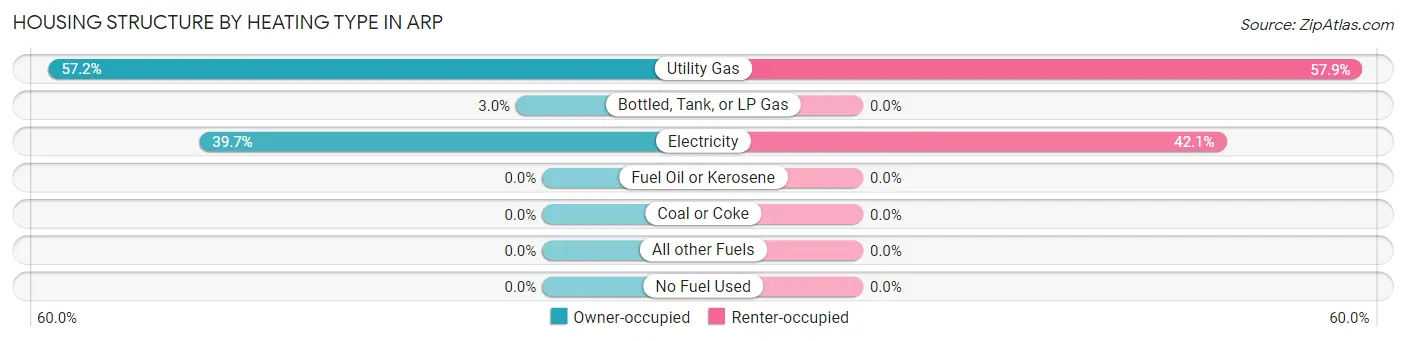
| Heating Type | Owner-occupied | Renter-occupied |
| Utility Gas | 170 (57.2%) | 66 (57.9%) |
| Bottled, Tank, or LP Gas | 9 (3.0%) | 0 (0.0%) |
| Electricity | 118 (39.7%) | 48 (42.1%) |
| Fuel Oil or Kerosene | 0 (0.0%) | 0 (0.0%) |
| Coal or Coke | 0 (0.0%) | 0 (0.0%) |
| All other Fuels | 0 (0.0%) | 0 (0.0%) |
| No Fuel Used | 0 (0.0%) | 0 (0.0%) |
| Total | 297 (100.0%) | 114 (100.0%) |
Household Vehicle Usage in Arp
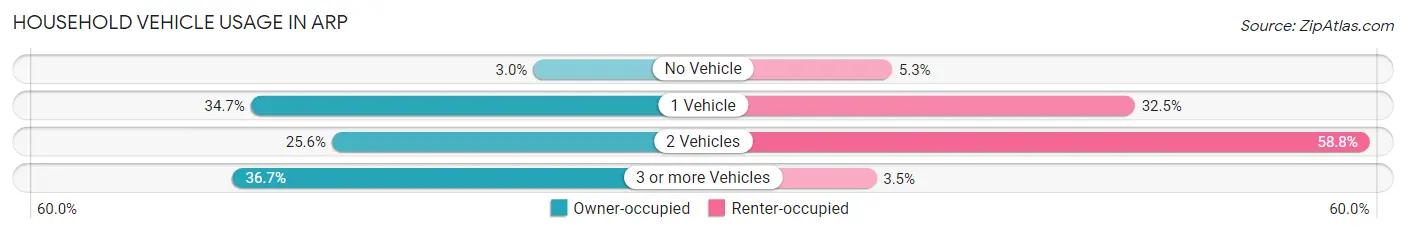
| Vehicles per Household | Owner-occupied | Renter-occupied |
| No Vehicle | 9 (3.0%) | 6 (5.3%) |
| 1 Vehicle | 103 (34.7%) | 37 (32.5%) |
| 2 Vehicles | 76 (25.6%) | 67 (58.8%) |
| 3 or more Vehicles | 109 (36.7%) | 4 (3.5%) |
| Total | 297 (100.0%) | 114 (100.0%) |
Real Estate & Mortgages in Arp
Real Estate and Mortgage Overview in Arp
| Characteristic | Without Mortgage | With Mortgage |
| Housing Units | 210 | 87 |
| Median Property Value | $98,700 | $112,500 |
| Median Household Income | $53,750 | $14 |
| Monthly Housing Costs | $536 | $0 |
| Real Estate Taxes | $1,000 | $0 |
Property Value by Mortgage Status in Arp
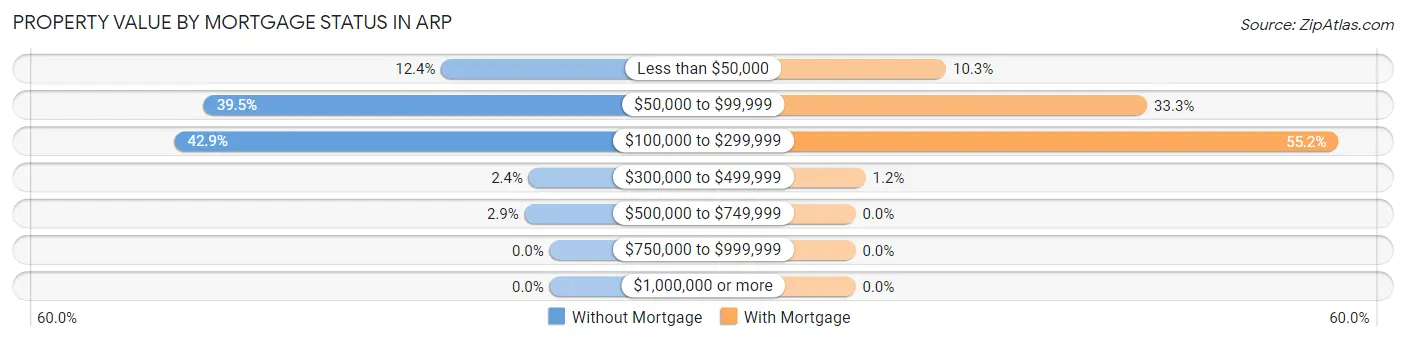
| Property Value | Without Mortgage | With Mortgage |
| Less than $50,000 | 26 (12.4%) | 9 (10.3%) |
| $50,000 to $99,999 | 83 (39.5%) | 29 (33.3%) |
| $100,000 to $299,999 | 90 (42.9%) | 48 (55.2%) |
| $300,000 to $499,999 | 5 (2.4%) | 1 (1.1%) |
| $500,000 to $749,999 | 6 (2.9%) | 0 (0.0%) |
| $750,000 to $999,999 | 0 (0.0%) | 0 (0.0%) |
| $1,000,000 or more | 0 (0.0%) | 0 (0.0%) |
| Total | 210 (100.0%) | 87 (100.0%) |
Household Income by Mortgage Status in Arp
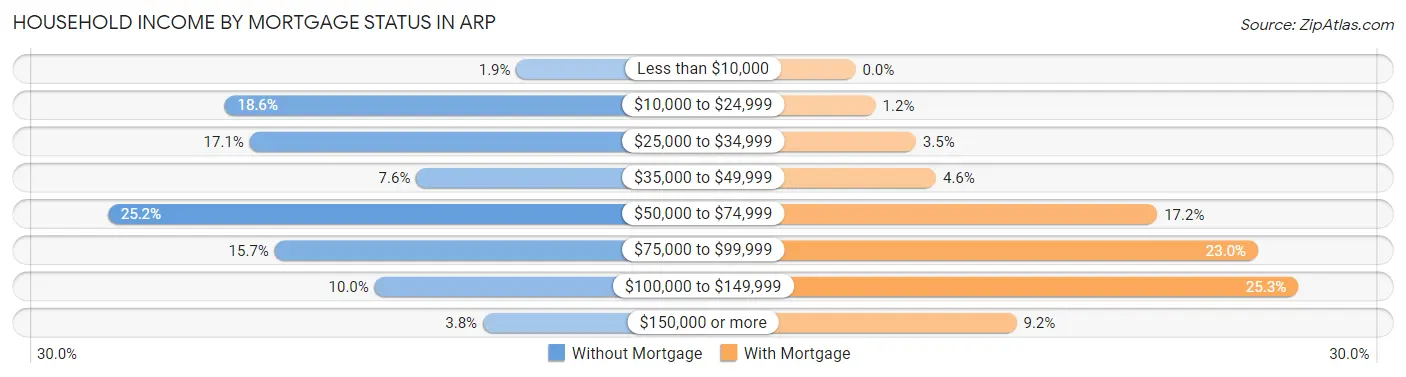
| Household Income | Without Mortgage | With Mortgage |
| Less than $10,000 | 4 (1.9%) | 0 (0.0%) |
| $10,000 to $24,999 | 39 (18.6%) | 1 (1.1%) |
| $25,000 to $34,999 | 36 (17.1%) | 3 (3.5%) |
| $35,000 to $49,999 | 16 (7.6%) | 4 (4.6%) |
| $50,000 to $74,999 | 53 (25.2%) | 15 (17.2%) |
| $75,000 to $99,999 | 33 (15.7%) | 20 (23.0%) |
| $100,000 to $149,999 | 21 (10.0%) | 22 (25.3%) |
| $150,000 or more | 8 (3.8%) | 8 (9.2%) |
| Total | 210 (100.0%) | 87 (100.0%) |
Property Value to Household Income Ratio in Arp
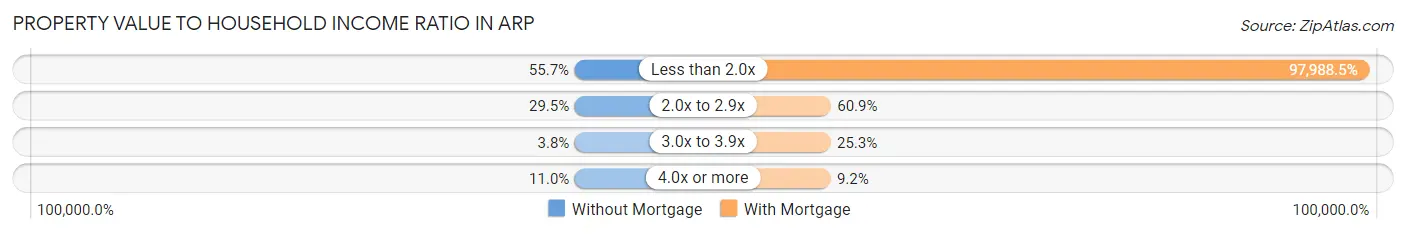
| Value-to-Income Ratio | Without Mortgage | With Mortgage |
| Less than 2.0x | 117 (55.7%) | 85,250 (97,988.5%) |
| 2.0x to 2.9x | 62 (29.5%) | 53 (60.9%) |
| 3.0x to 3.9x | 8 (3.8%) | 22 (25.3%) |
| 4.0x or more | 23 (11.0%) | 8 (9.2%) |
| Total | 210 (100.0%) | 87 (100.0%) |
Real Estate Taxes by Mortgage Status in Arp
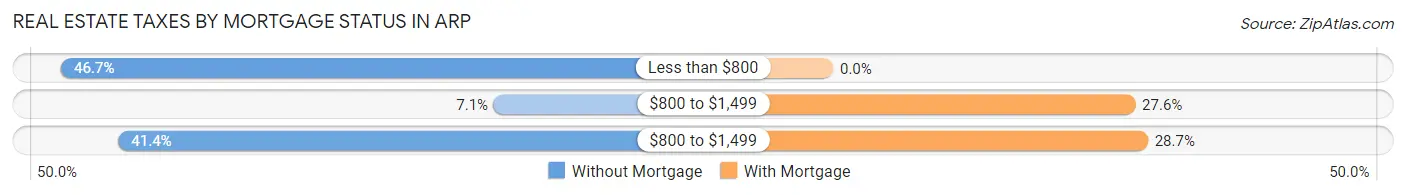
| Property Taxes | Without Mortgage | With Mortgage |
| Less than $800 | 98 (46.7%) | 0 (0.0%) |
| $800 to $1,499 | 15 (7.1%) | 24 (27.6%) |
| $800 to $1,499 | 87 (41.4%) | 25 (28.7%) |
| Total | 210 (100.0%) | 87 (100.0%) |
Health & Disability in Arp
Health Insurance Coverage by Age in Arp
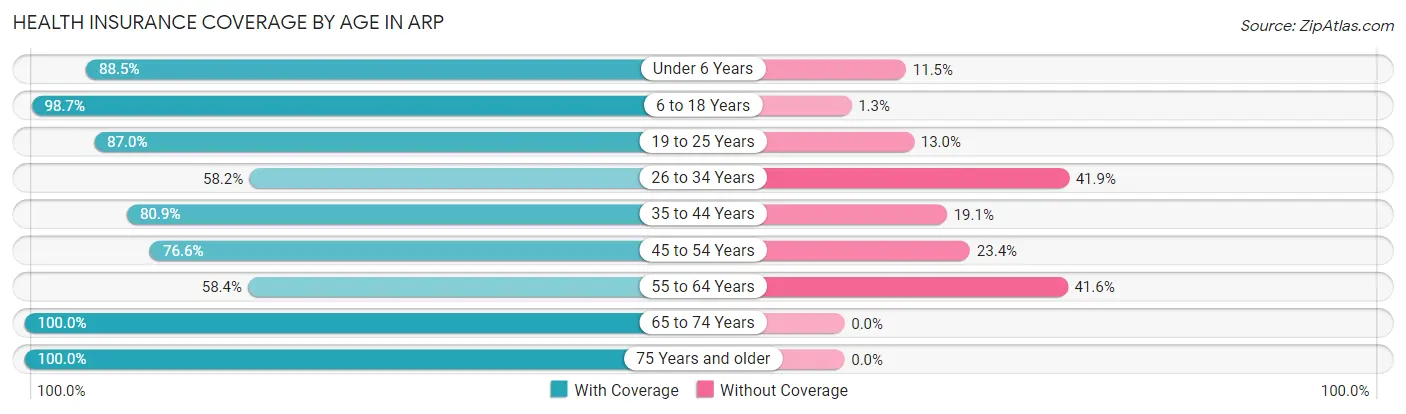
| Age Bracket | With Coverage | Without Coverage |
| Under 6 Years | 108 (88.5%) | 14 (11.5%) |
| 6 to 18 Years | 307 (98.7%) | 4 (1.3%) |
| 19 to 25 Years | 47 (87.0%) | 7 (13.0%) |
| 26 to 34 Years | 132 (58.2%) | 95 (41.8%) |
| 35 to 44 Years | 144 (80.9%) | 34 (19.1%) |
| 45 to 54 Years | 85 (76.6%) | 26 (23.4%) |
| 55 to 64 Years | 101 (58.4%) | 72 (41.6%) |
| 65 to 74 Years | 105 (100.0%) | 0 (0.0%) |
| 75 Years and older | 86 (100.0%) | 0 (0.0%) |
| Total | 1,115 (81.6%) | 252 (18.4%) |
Health Insurance Coverage by Citizenship Status in Arp
| Citizenship Status | With Coverage | Without Coverage |
| Native Born | 108 (88.5%) | 14 (11.5%) |
| Foreign Born, Citizen | 307 (98.7%) | 4 (1.3%) |
| Foreign Born, not a Citizen | 47 (87.0%) | 7 (13.0%) |
Health Insurance Coverage by Household Income in Arp
| Household Income | With Coverage | Without Coverage |
| Under $25,000 | 99 (60.4%) | 65 (39.6%) |
| $25,000 to $49,999 | 150 (71.4%) | 60 (28.6%) |
| $50,000 to $74,999 | 330 (89.4%) | 39 (10.6%) |
| $75,000 to $99,999 | 182 (95.3%) | 9 (4.7%) |
| $100,000 and over | 354 (81.8%) | 79 (18.2%) |
Public vs Private Health Insurance Coverage by Age in Arp
| Age Bracket | Public Insurance | Private Insurance |
| Under 6 | 70 (57.4%) | 42 (34.4%) |
| 6 to 18 Years | 36 (11.6%) | 271 (87.1%) |
| 19 to 25 Years | 21 (38.9%) | 26 (48.1%) |
| 25 to 34 Years | 59 (26.0%) | 73 (32.2%) |
| 35 to 44 Years | 12 (6.7%) | 137 (77.0%) |
| 45 to 54 Years | 13 (11.7%) | 72 (64.9%) |
| 55 to 64 Years | 23 (13.3%) | 93 (53.8%) |
| 65 to 74 Years | 105 (100.0%) | 57 (54.3%) |
| 75 Years and over | 86 (100.0%) | 70 (81.4%) |
| Total | 425 (31.1%) | 841 (61.5%) |
Disability Status by Sex by Age in Arp
| Age Bracket | Male | Female |
| Under 5 Years | 0 (0.0%) | 0 (0.0%) |
| 5 to 17 Years | 0 (0.0%) | 5 (2.7%) |
| 18 to 34 Years | 25 (14.6%) | 6 (4.6%) |
| 35 to 64 Years | 12 (5.0%) | 42 (19.0%) |
| 65 to 74 Years | 13 (28.3%) | 32 (54.2%) |
| 75 Years and over | 4 (18.2%) | 20 (31.2%) |
Disability Class by Sex by Age in Arp
Disability Class: Hearing Difficulty

| Age Bracket | Male | Female |
| Under 5 Years | 0 (0.0%) | 0 (0.0%) |
| 5 to 17 Years | 0 (0.0%) | 0 (0.0%) |
| 18 to 34 Years | 0 (0.0%) | 0 (0.0%) |
| 35 to 64 Years | 2 (0.8%) | 13 (5.9%) |
| 65 to 74 Years | 10 (21.7%) | 9 (15.2%) |
| 75 Years and over | 4 (18.2%) | 9 (14.1%) |
Disability Class: Vision Difficulty
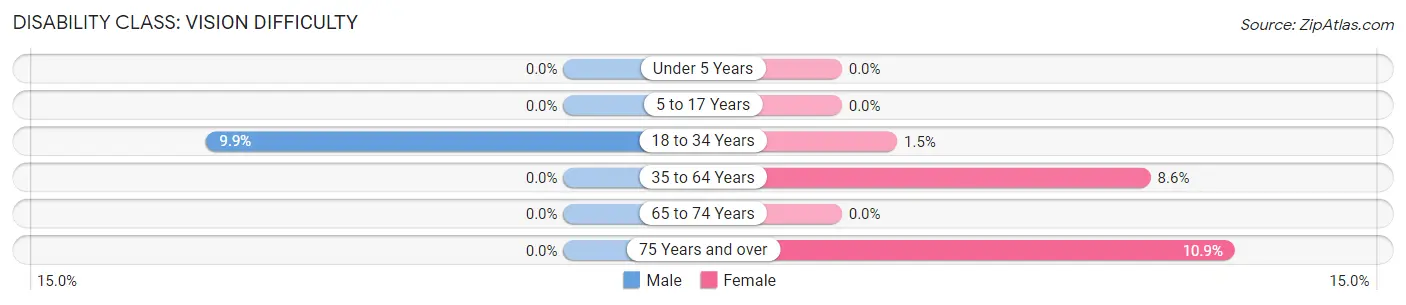
| Age Bracket | Male | Female |
| Under 5 Years | 0 (0.0%) | 0 (0.0%) |
| 5 to 17 Years | 0 (0.0%) | 0 (0.0%) |
| 18 to 34 Years | 17 (9.9%) | 2 (1.5%) |
| 35 to 64 Years | 0 (0.0%) | 19 (8.6%) |
| 65 to 74 Years | 0 (0.0%) | 0 (0.0%) |
| 75 Years and over | 0 (0.0%) | 7 (10.9%) |
Disability Class: Cognitive Difficulty
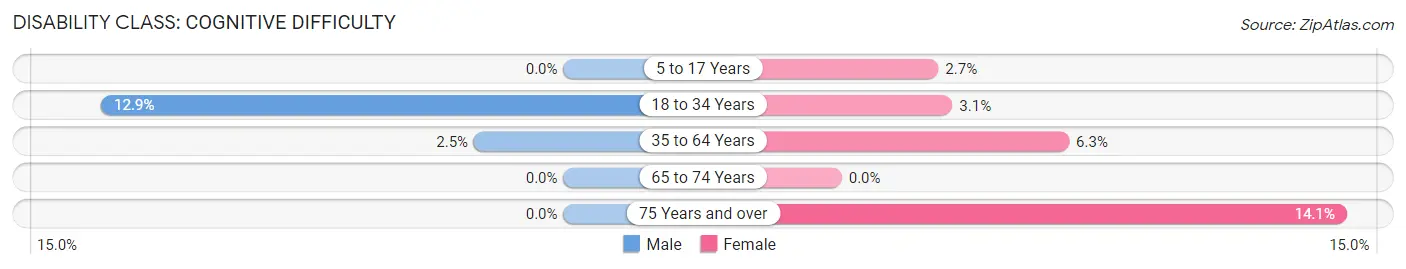
| Age Bracket | Male | Female |
| 5 to 17 Years | 0 (0.0%) | 5 (2.7%) |
| 18 to 34 Years | 22 (12.9%) | 4 (3.1%) |
| 35 to 64 Years | 6 (2.5%) | 14 (6.3%) |
| 65 to 74 Years | 0 (0.0%) | 0 (0.0%) |
| 75 Years and over | 0 (0.0%) | 9 (14.1%) |
Disability Class: Ambulatory Difficulty
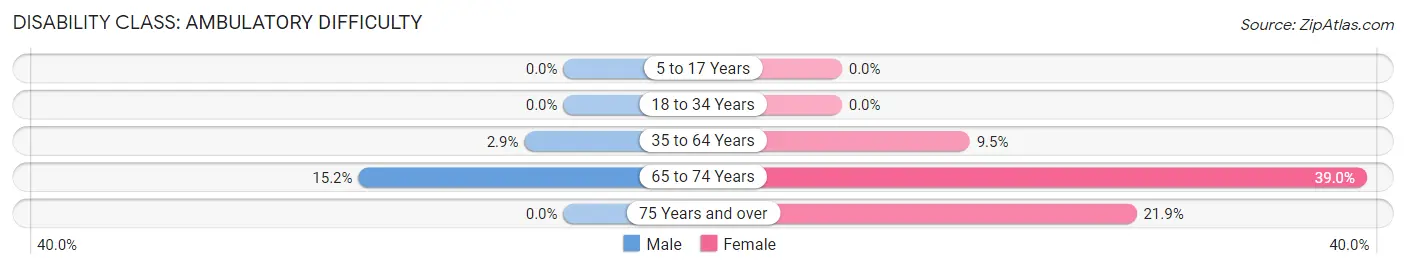
| Age Bracket | Male | Female |
| 5 to 17 Years | 0 (0.0%) | 0 (0.0%) |
| 18 to 34 Years | 0 (0.0%) | 0 (0.0%) |
| 35 to 64 Years | 7 (2.9%) | 21 (9.5%) |
| 65 to 74 Years | 7 (15.2%) | 23 (39.0%) |
| 75 Years and over | 0 (0.0%) | 14 (21.9%) |
Disability Class: Self-Care Difficulty
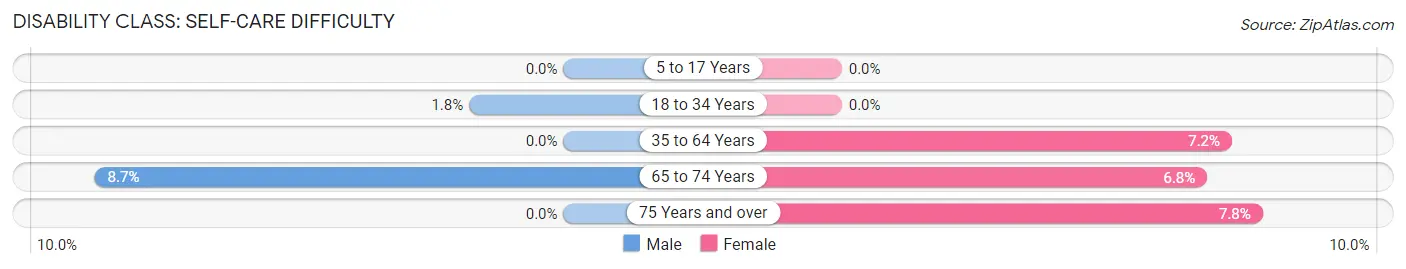
| Age Bracket | Male | Female |
| 5 to 17 Years | 0 (0.0%) | 0 (0.0%) |
| 18 to 34 Years | 3 (1.8%) | 0 (0.0%) |
| 35 to 64 Years | 0 (0.0%) | 16 (7.2%) |
| 65 to 74 Years | 4 (8.7%) | 4 (6.8%) |
| 75 Years and over | 0 (0.0%) | 5 (7.8%) |
Technology Access in Arp
Computing Device Access in Arp
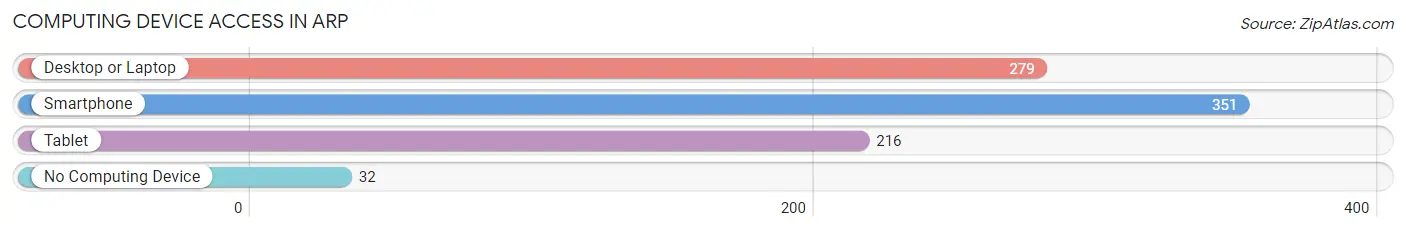
| Device Type | # Households | % Households |
| Desktop or Laptop | 279 | 67.9% |
| Smartphone | 351 | 85.4% |
| Tablet | 216 | 52.5% |
| No Computing Device | 32 | 7.8% |
| Total | 411 | 100.0% |
Internet Access in Arp
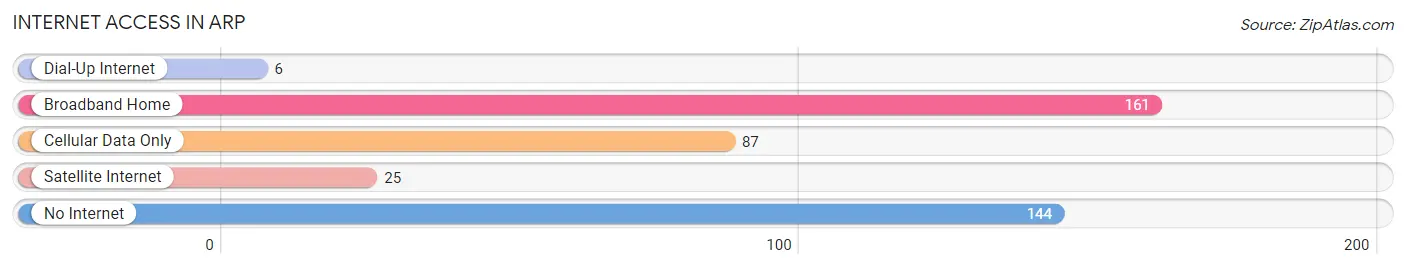
| Internet Type | # Households | % Households |
| Dial-Up Internet | 6 | 1.5% |
| Broadband Home | 161 | 39.2% |
| Cellular Data Only | 87 | 21.2% |
| Satellite Internet | 25 | 6.1% |
| No Internet | 144 | 35.0% |
| Total | 411 | 100.0% |
Arp Summary
Arp is a small town located in Smith County, Texas, United States. It is situated about 10 miles south of Tyler, the county seat. The population of Arp was 1,093 at the 2010 census.
History
Arp was founded in 1872 by a group of settlers from Arkansas. The town was named after one of the settlers, John Arp. The first post office was established in 1873.
In 1876, the town was incorporated and a school was built. The town grew slowly but steadily, and by the early 1900s, it had a population of around 500.
In the 1920s, the town experienced a period of growth due to the discovery of oil in the area. This led to the construction of several oil wells and the establishment of several businesses.
In the 1940s, the town experienced a period of decline due to the Great Depression and World War II. However, the town began to experience a period of growth in the 1950s and 1960s due to the development of the nearby Tyler State Park.
Geography
Arp is located at 32°19'25" North, 95°17'45" West (32.323889, -95.295833). It is situated about 10 miles south of Tyler, the county seat.
The town has a total area of 1 2 square miles all of which is land
Economy
The economy of Arp is largely based on agriculture and oil production. The town is home to several farms and ranches, as well as several oil wells.
The town also has several small businesses, including a grocery store, a hardware store, and a few restaurants.
Demographics
As of the 2010 census, the population of Arp was 1,093. The racial makeup of the town was 79.2% White, 16.2% African American, 0.7% Native American, 0.3% Asian, 0.1% Pacific Islander, 1.7% from other races, and 1.7% from two or more races. Hispanic or Latino of any race were 4.2% of the population.
The median income for a household in the town was $37,500, and the median income for a family was $45,000. The per capita income for the town was $17,845. About 15.2% of families and 18.2% of the population were below the poverty line, including 25.2% of those under age 18 and 11.2% of those age 65 or over.
Common Questions
What is Per Capita Income in Arp?
Per Capita income in Arp is $22,834.
What is the Median Family Income in Arp?
Median Family Income in Arp is $68,826.
What is the Median Household income in Arp?
Median Household Income in Arp is $63,472.
What is Income or Wage Gap in Arp?
Income or Wage Gap in Arp is 15.3%.
Women in Arp earn 84.7 cents for every dollar earned by a man.
What is Family Income Deficit in Arp?
Family Income Deficit in Arp is $15,726.
Families that are below poverty line in Arp earn $15,726 less on average than the poverty threshold level.
What is Inequality or Gini Index in Arp?
Inequality or Gini Index in Arp is 0.37.
What is the Total Population of Arp?
Total Population of Arp is 1,367.
What is the Total Male Population of Arp?
Total Male Population of Arp is 644.
What is the Total Female Population of Arp?
Total Female Population of Arp is 723.
What is the Ratio of Males per 100 Females in Arp?
There are 89.07 Males per 100 Females in Arp.
What is the Ratio of Females per 100 Males in Arp?
There are 112.27 Females per 100 Males in Arp.
What is the Median Population Age in Arp?
Median Population Age in Arp is 32.8 Years.
What is the Average Family Size in Arp
Average Family Size in Arp is 4.0 People.
What is the Average Household Size in Arp
Average Household Size in Arp is 3.3 People.
How Large is the Labor Force in Arp?
There are 587 People in the Labor Forcein in Arp.
What is the Percentage of People in the Labor Force in Arp?
58.8% of People are in the Labor Force in Arp.
What is the Unemployment Rate in Arp?
Unemployment Rate in Arp is 3.6%.