West Alto Bonito, TX Map & Demographics
West Alto Bonito Map
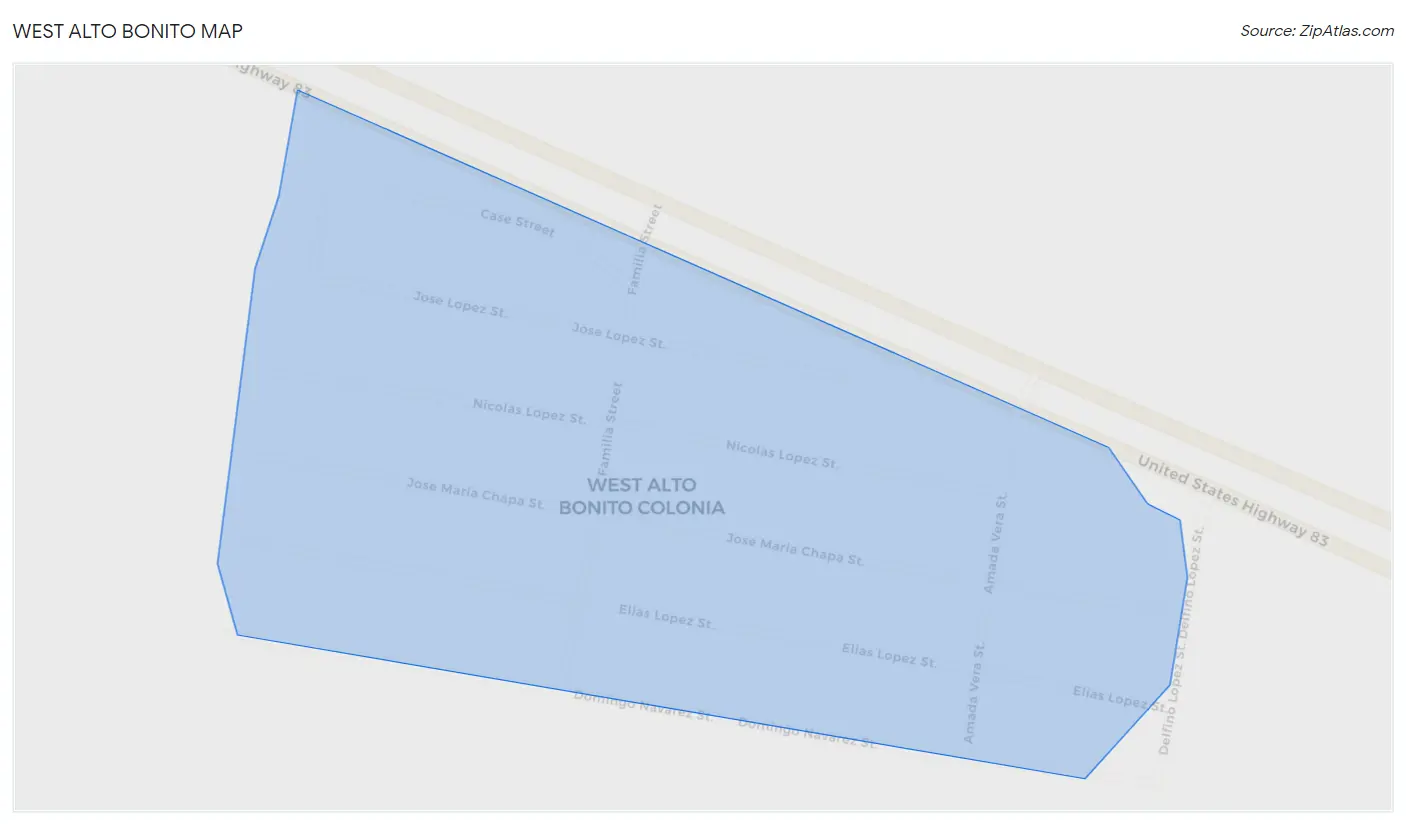
West Alto Bonito Overview
$13,186
PER CAPITA INCOME
$53,793
AVG FAMILY INCOME
$39,688
AVG HOUSEHOLD INCOME
54.0%
WAGE / INCOME GAP [ % ]
46.0¢/ $1
WAGE / INCOME GAP [ $ ]
0.29
INEQUALITY / GINI INDEX
505
TOTAL POPULATION
240
MALE POPULATION
265
FEMALE POPULATION
90.57
MALES / 100 FEMALES
110.42
FEMALES / 100 MALES
21.3
MEDIAN AGE
5.2
AVG FAMILY SIZE
3.3
AVG HOUSEHOLD SIZE
251
LABOR FORCE [ PEOPLE ]
62.0%
PERCENT IN LABOR FORCE
37.5%
UNEMPLOYMENT RATE
Income in West Alto Bonito
Income Overview in West Alto Bonito
Per Capita Income in West Alto Bonito is $13,186, while median incomes of families and households are $53,793 and $39,688 respectively.
| Characteristic | Number | Measure |
| Per Capita Income | 505 | $13,186 |
| Median Family Income | 72 | $53,793 |
| Mean Family Income | 72 | $58,613 |
| Median Household Income | 155 | $39,688 |
| Mean Household Income | 155 | $40,179 |
| Income Deficit | 72 | $0 |
| Wage / Income Gap (%) | 505 | 54.04% |
| Wage / Income Gap ($) | 505 | 45.96¢ per $1 |
| Gini / Inequality Index | 505 | 0.29 |
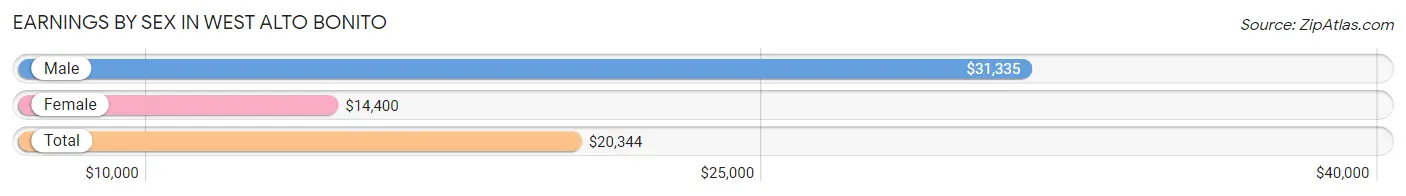
Earnings by Sex in West Alto Bonito
Average Earnings in West Alto Bonito are $20,344, $31,335 for men and $14,400 for women, a difference of 54.0%.
| Sex | Number | Average Earnings |
| Male | 85 (33.9%) | $31,335 |
| Female | 166 (66.1%) | $14,400 |
| Total | 251 (100.0%) | $20,344 |
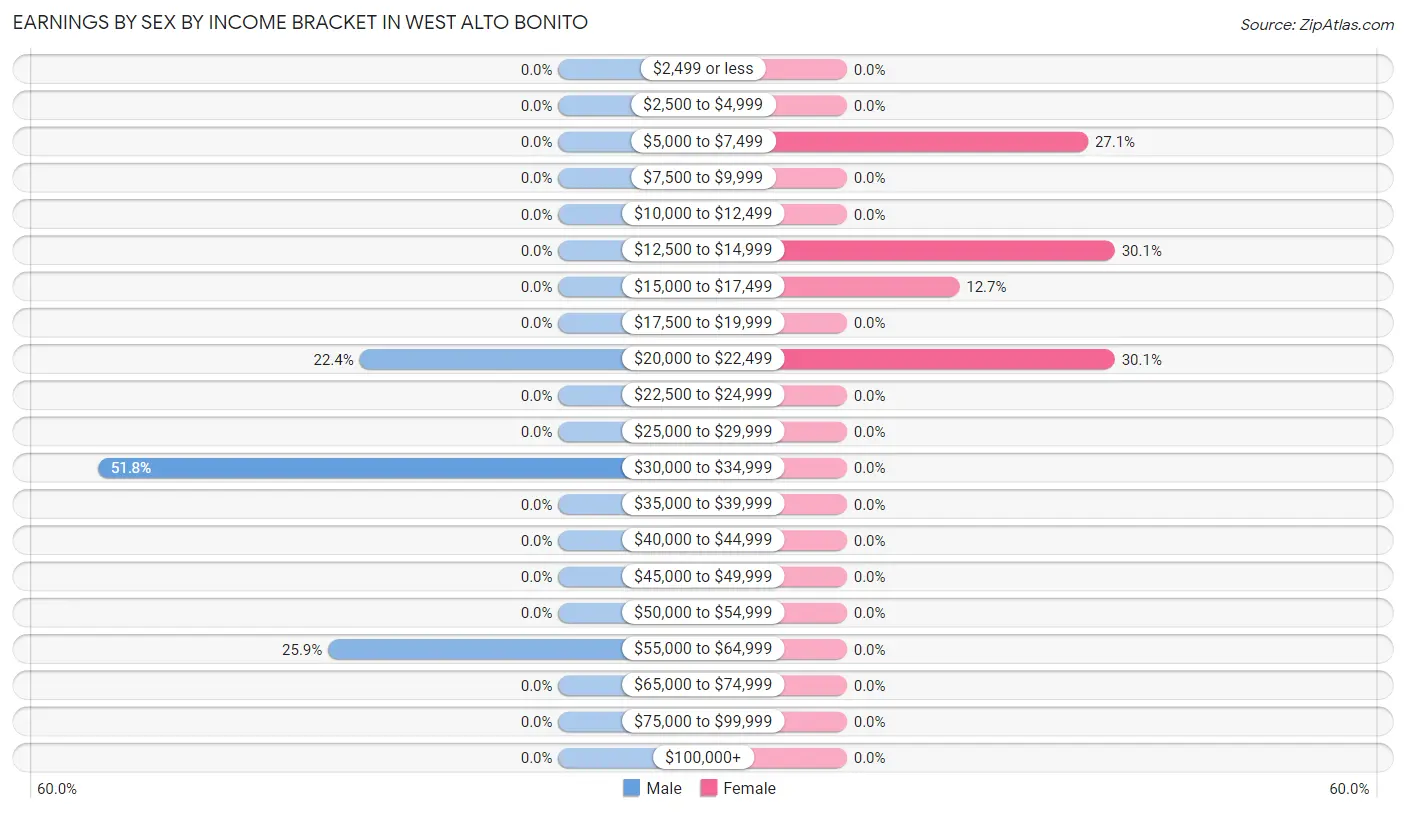
Earnings by Sex by Income Bracket in West Alto Bonito
The most common earnings brackets in West Alto Bonito are $30,000 to $34,999 for men (44 | 51.8%) and $12,500 to $14,999 for women (50 | 30.1%).
| Income | Male | Female |
| $2,499 or less | 0 (0.0%) | 0 (0.0%) |
| $2,500 to $4,999 | 0 (0.0%) | 0 (0.0%) |
| $5,000 to $7,499 | 0 (0.0%) | 45 (27.1%) |
| $7,500 to $9,999 | 0 (0.0%) | 0 (0.0%) |
| $10,000 to $12,499 | 0 (0.0%) | 0 (0.0%) |
| $12,500 to $14,999 | 0 (0.0%) | 50 (30.1%) |
| $15,000 to $17,499 | 0 (0.0%) | 21 (12.7%) |
| $17,500 to $19,999 | 0 (0.0%) | 0 (0.0%) |
| $20,000 to $22,499 | 19 (22.4%) | 50 (30.1%) |
| $22,500 to $24,999 | 0 (0.0%) | 0 (0.0%) |
| $25,000 to $29,999 | 0 (0.0%) | 0 (0.0%) |
| $30,000 to $34,999 | 44 (51.8%) | 0 (0.0%) |
| $35,000 to $39,999 | 0 (0.0%) | 0 (0.0%) |
| $40,000 to $44,999 | 0 (0.0%) | 0 (0.0%) |
| $45,000 to $49,999 | 0 (0.0%) | 0 (0.0%) |
| $50,000 to $54,999 | 0 (0.0%) | 0 (0.0%) |
| $55,000 to $64,999 | 22 (25.9%) | 0 (0.0%) |
| $65,000 to $74,999 | 0 (0.0%) | 0 (0.0%) |
| $75,000 to $99,999 | 0 (0.0%) | 0 (0.0%) |
| $100,000+ | 0 (0.0%) | 0 (0.0%) |
| Total | 85 (100.0%) | 166 (100.0%) |
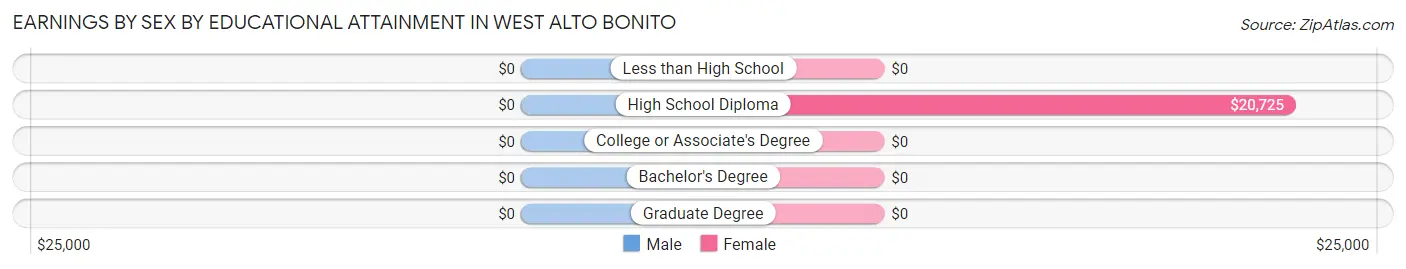
Earnings by Sex by Educational Attainment in West Alto Bonito
| Educational Attainment | Male Income | Female Income |
| Less than High School | - | - |
| High School Diploma | - | - |
| College or Associate's Degree | - | - |
| Bachelor's Degree | - | - |
| Graduate Degree | - | - |
| Total | - | - |
Family Income in West Alto Bonito
Family Income Brackets in West Alto Bonito
According to the West Alto Bonito family income data, there are 72 families falling into the $50,000 to $74,999 income range, which is the most common income bracket and makes up 100.0% of all families.
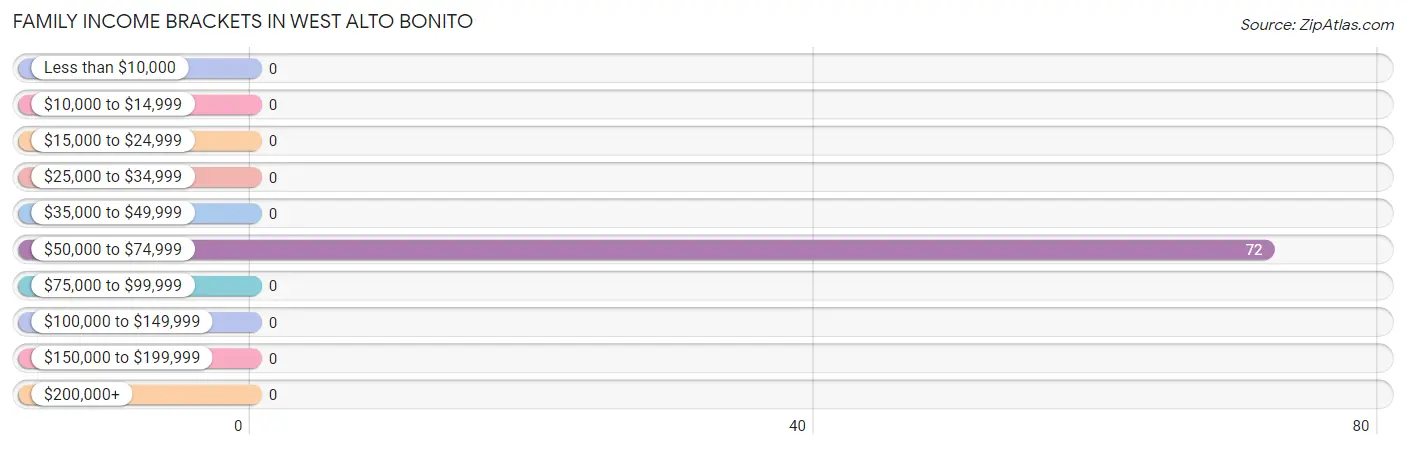
| Income Bracket | # Families | % Families |
| Less than $10,000 | 0 | 0.0% |
| $10,000 to $14,999 | 0 | 0.0% |
| $15,000 to $24,999 | 0 | 0.0% |
| $25,000 to $34,999 | 0 | 0.0% |
| $35,000 to $49,999 | 0 | 0.0% |
| $50,000 to $74,999 | 72 | 100.0% |
| $75,000 to $99,999 | 0 | 0.0% |
| $100,000 to $149,999 | 0 | 0.0% |
| $150,000 to $199,999 | 0 | 0.0% |
| $200,000+ | 0 | 0.0% |
Family Income by Famaliy Size in West Alto Bonito
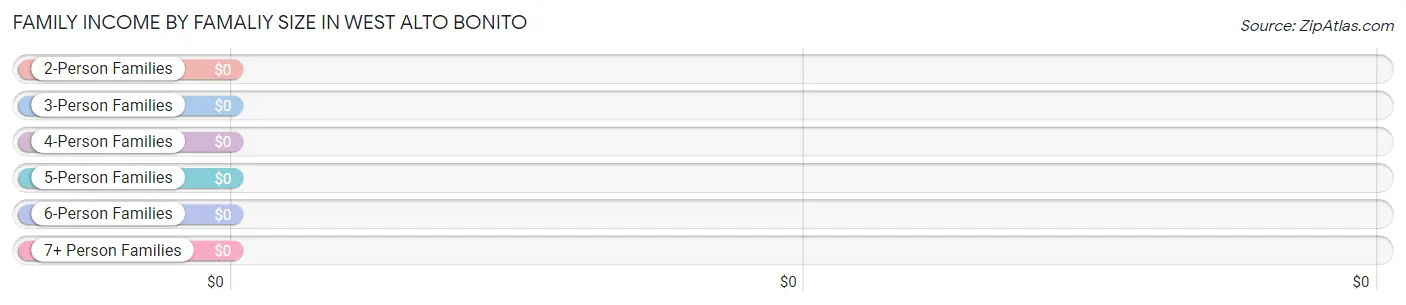
| Income Bracket | # Families | Median Income |
| 2-Person Families | 43 (59.7%) | $0 |
| 3-Person Families | 0 (0.0%) | $0 |
| 4-Person Families | 0 (0.0%) | $0 |
| 5-Person Families | 0 (0.0%) | $0 |
| 6-Person Families | 0 (0.0%) | $0 |
| 7+ Person Families | 29 (40.3%) | $0 |
| Total | 72 (100.0%) | $53,793 |
Family Income by Number of Earners in West Alto Bonito
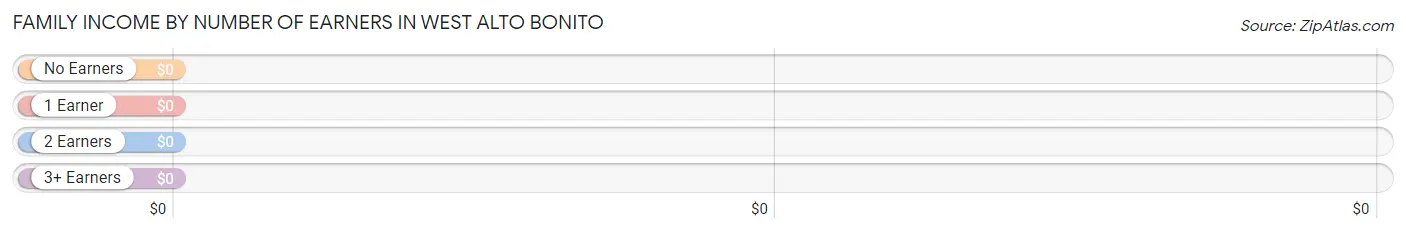
| Number of Earners | # Families | Median Income |
| No Earners | 0 (0.0%) | $0 |
| 1 Earner | 0 (0.0%) | $0 |
| 2 Earners | 43 (59.7%) | $0 |
| 3+ Earners | 29 (40.3%) | $0 |
| Total | 72 (100.0%) | $53,793 |
Household Income in West Alto Bonito
Household Income Brackets in West Alto Bonito
With 72 households falling in the category, the $50,000 to $74,999 income range is the most frequent in West Alto Bonito, accounting for 46.5% of all households.
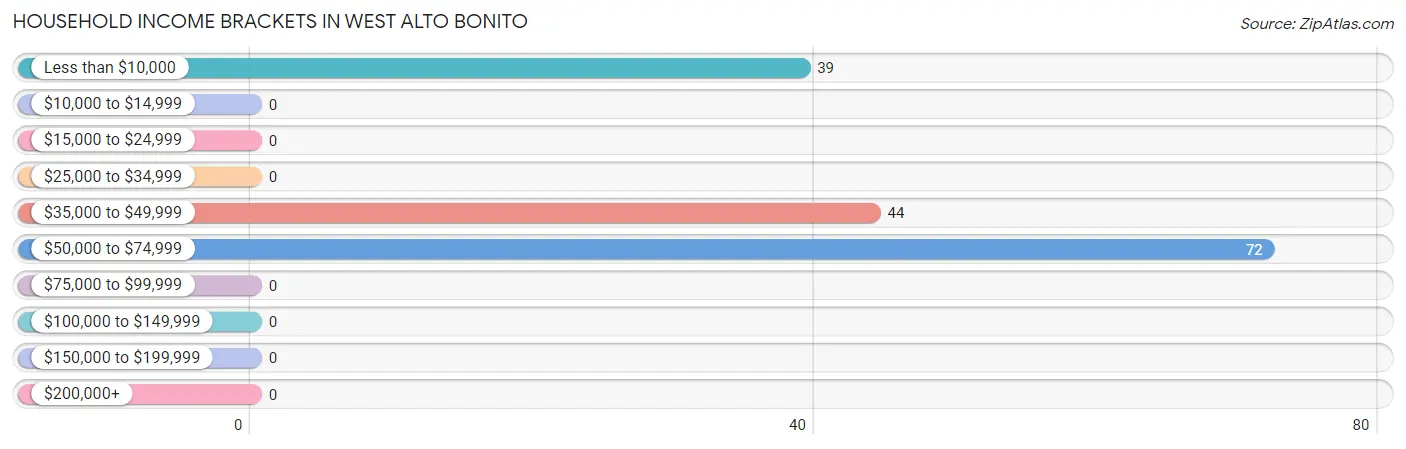
| Income Bracket | # Households | % Households |
| Less than $10,000 | 39 | 25.2% |
| $10,000 to $14,999 | 0 | 0.0% |
| $15,000 to $24,999 | 0 | 0.0% |
| $25,000 to $34,999 | 0 | 0.0% |
| $35,000 to $49,999 | 44 | 28.4% |
| $50,000 to $74,999 | 72 | 46.5% |
| $75,000 to $99,999 | 0 | 0.0% |
| $100,000 to $149,999 | 0 | 0.0% |
| $150,000 to $199,999 | 0 | 0.0% |
| $200,000+ | 0 | 0.0% |
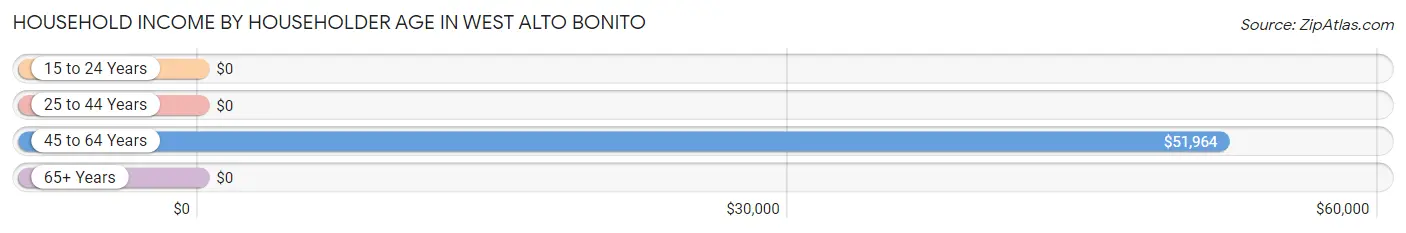
Household Income by Householder Age in West Alto Bonito
The median household income in West Alto Bonito is $39,688, with the highest median household income of $51,964 found in the 45 to 64 years age bracket for the primary householder. A total of 111 households (71.6%) fall into this category. Meanwhile, the 15 to 24 years age bracket for the primary householder has the lowest median household income of $0, with 44 households (28.4%) in this group.
| Income Bracket | # Households | Median Income |
| 15 to 24 Years | 44 (28.4%) | $0 |
| 25 to 44 Years | 0 (0.0%) | $0 |
| 45 to 64 Years | 111 (71.6%) | $51,964 |
| 65+ Years | 0 (0.0%) | $0 |
| Total | 155 (100.0%) | $39,688 |
Poverty in West Alto Bonito
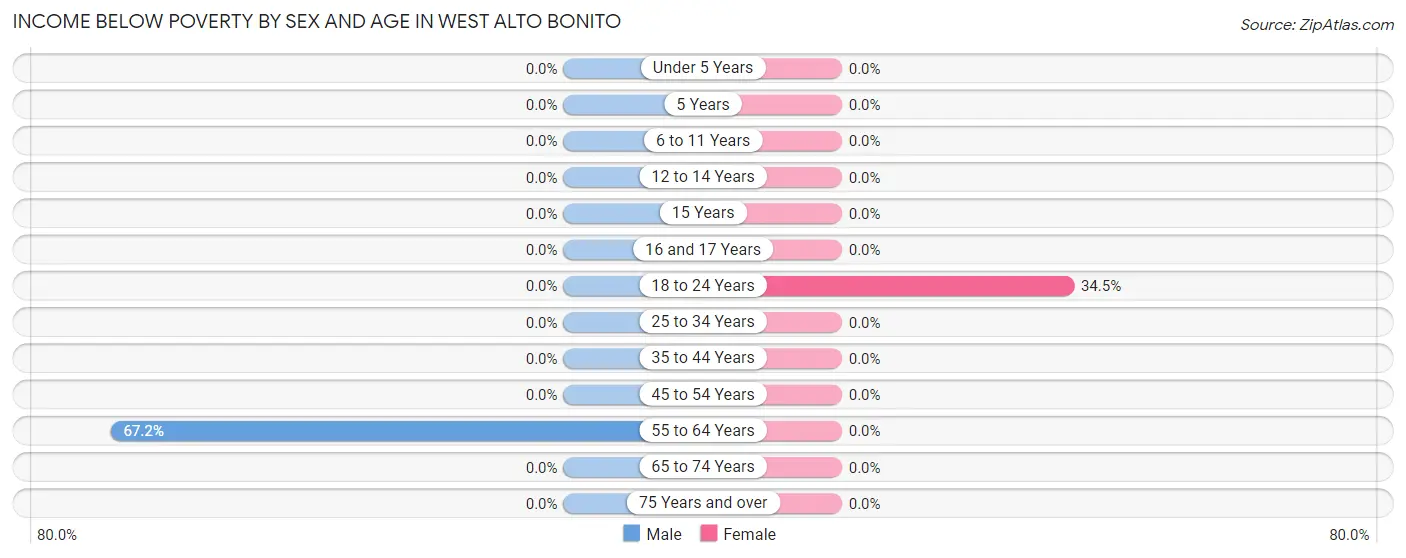
Income Below Poverty by Sex and Age in West Alto Bonito
With 16.3% poverty level for males and 18.9% for females among the residents of West Alto Bonito, 55 to 64 year old males and 18 to 24 year old females are the most vulnerable to poverty, with 39 males (67.2%) and 50 females (34.5%) in their respective age groups living below the poverty level.
| Age Bracket | Male | Female |
| Under 5 Years | 0 (0.0%) | 0 (0.0%) |
| 5 Years | 0 (0.0%) | 0 (0.0%) |
| 6 to 11 Years | 0 (0.0%) | 0 (0.0%) |
| 12 to 14 Years | 0 (0.0%) | 0 (0.0%) |
| 15 Years | 0 (0.0%) | 0 (0.0%) |
| 16 and 17 Years | 0 (0.0%) | 0 (0.0%) |
| 18 to 24 Years | 0 (0.0%) | 50 (34.5%) |
| 25 to 34 Years | 0 (0.0%) | 0 (0.0%) |
| 35 to 44 Years | 0 (0.0%) | 0 (0.0%) |
| 45 to 54 Years | 0 (0.0%) | 0 (0.0%) |
| 55 to 64 Years | 39 (67.2%) | 0 (0.0%) |
| 65 to 74 Years | 0 (0.0%) | 0 (0.0%) |
| 75 Years and over | 0 (0.0%) | 0 (0.0%) |
| Total | 39 (16.3%) | 50 (18.9%) |
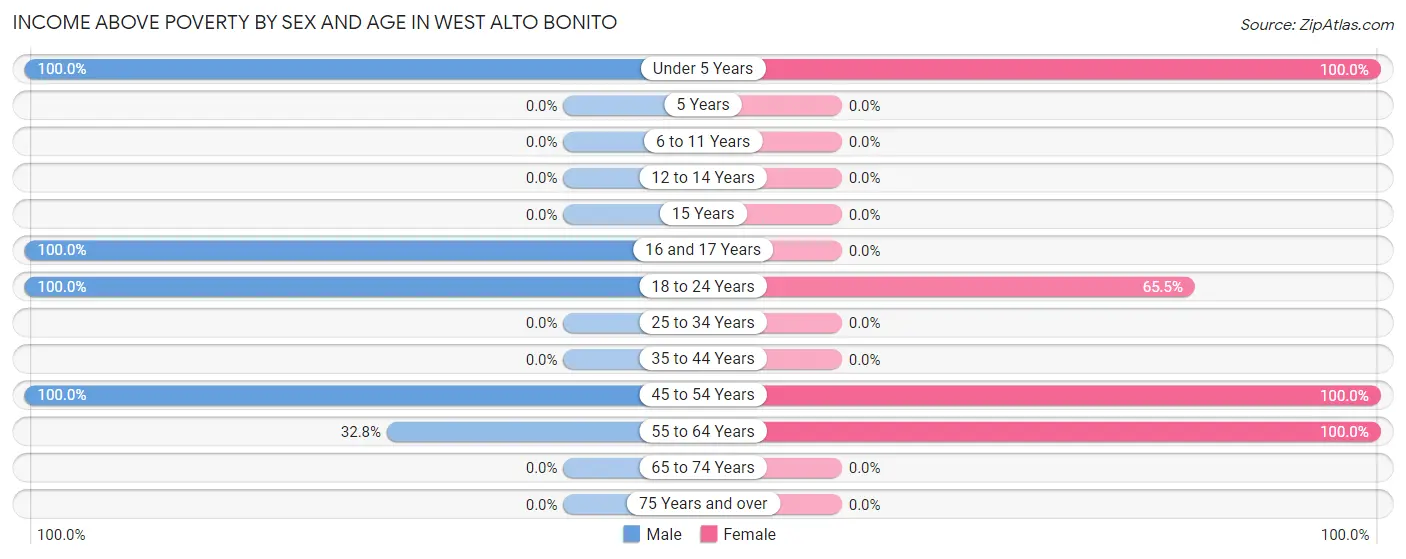
Income Above Poverty by Sex and Age in West Alto Bonito
According to the poverty statistics in West Alto Bonito, males aged under 5 years and females aged under 5 years are the age groups that are most secure financially, with 100.0% of males and 100.0% of females in these age groups living above the poverty line.
| Age Bracket | Male | Female |
| Under 5 Years | 51 (100.0%) | 49 (100.0%) |
| 5 Years | 0 (0.0%) | 0 (0.0%) |
| 6 to 11 Years | 0 (0.0%) | 0 (0.0%) |
| 12 to 14 Years | 0 (0.0%) | 0 (0.0%) |
| 15 Years | 0 (0.0%) | 0 (0.0%) |
| 16 and 17 Years | 27 (100.0%) | 0 (0.0%) |
| 18 to 24 Years | 44 (100.0%) | 95 (65.5%) |
| 25 to 34 Years | 0 (0.0%) | 0 (0.0%) |
| 35 to 44 Years | 0 (0.0%) | 0 (0.0%) |
| 45 to 54 Years | 60 (100.0%) | 50 (100.0%) |
| 55 to 64 Years | 19 (32.8%) | 21 (100.0%) |
| 65 to 74 Years | 0 (0.0%) | 0 (0.0%) |
| 75 Years and over | 0 (0.0%) | 0 (0.0%) |
| Total | 201 (83.8%) | 215 (81.1%) |
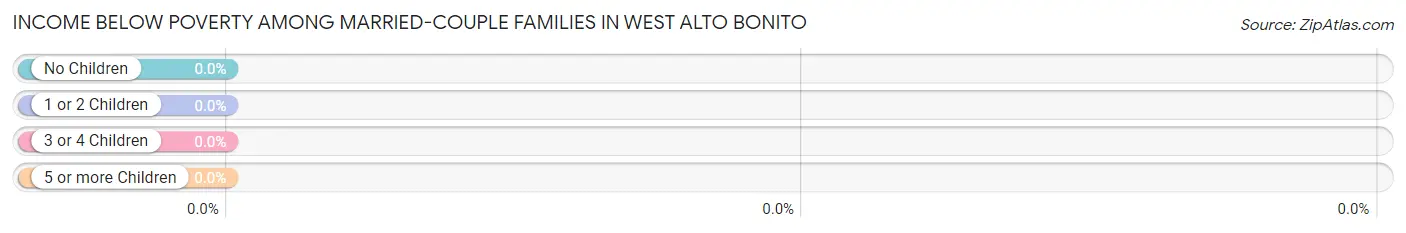
Income Below Poverty Among Married-Couple Families in West Alto Bonito
| Children | Above Poverty | Below Poverty |
| No Children | 43 (100.0%) | 0 (0.0%) |
| 1 or 2 Children | 0 (0.0%) | 0 (0.0%) |
| 3 or 4 Children | 0 (0.0%) | 0 (0.0%) |
| 5 or more Children | 0 (0.0%) | 0 (0.0%) |
| Total | 43 (100.0%) | 0 (0.0%) |
Income Below Poverty Among Single-Parent Households in West Alto Bonito
| Children | Single Father | Single Mother |
| No Children | 0 (0.0%) | 0 (0.0%) |
| 1 or 2 Children | 0 (0.0%) | 0 (0.0%) |
| 3 or 4 Children | 0 (0.0%) | 0 (0.0%) |
| 5 or more Children | 0 (0.0%) | 0 (0.0%) |
| Total | 0 (0.0%) | 0 (0.0%) |
Income Below Poverty Among Married-Couple vs Single-Parent Households in West Alto Bonito
| Children | Married-Couple Families | Single-Parent Households |
| No Children | 0 (0.0%) | 0 (0.0%) |
| 1 or 2 Children | 0 (0.0%) | 0 (0.0%) |
| 3 or 4 Children | 0 (0.0%) | 0 (0.0%) |
| 5 or more Children | 0 (0.0%) | 0 (0.0%) |
| Total | 0 (0.0%) | 0 (0.0%) |
Race in West Alto Bonito
The most populous races in West Alto Bonito are Hispanic or Latino (505 | 100.0%), White / Caucasian (372 | 73.7%), and Two or more Races (133 | 26.3%).
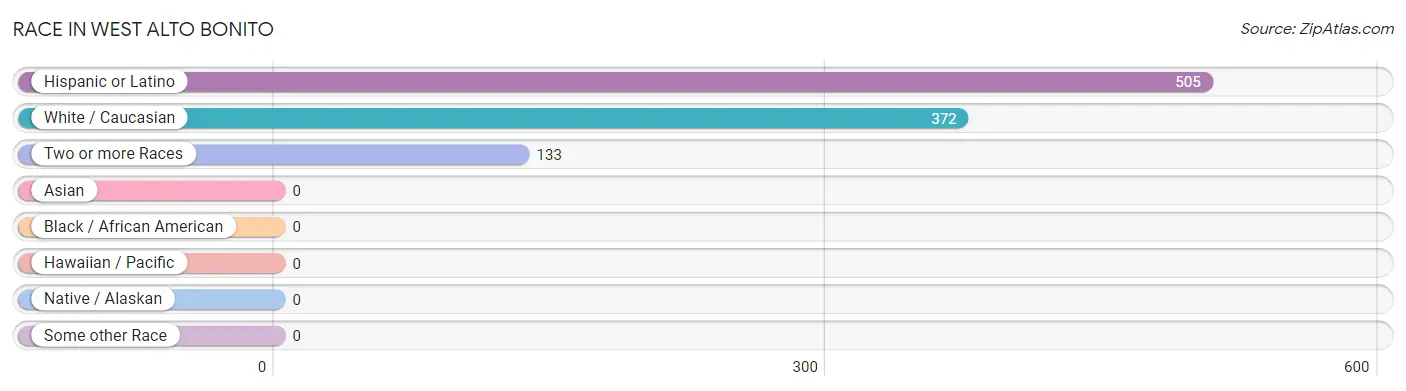
| Race | # Population | % Population |
| Asian | 0 | 0.0% |
| Black / African American | 0 | 0.0% |
| Hawaiian / Pacific | 0 | 0.0% |
| Hispanic or Latino | 505 | 100.0% |
| Native / Alaskan | 0 | 0.0% |
| White / Caucasian | 372 | 73.7% |
| Two or more Races | 133 | 26.3% |
| Some other Race | 0 | 0.0% |
| Total | 505 | 100.0% |
Ancestry in West Alto Bonito
The most populous ancestries reported in West Alto Bonito are , and Mexican (505 | 100.0%), together accounting for 100.0% of all West Alto Bonito residents.

| Ancestry | # Population | % Population |
| Mexican | 505 | 100.0% | View All 1 Rows |
Immigrants in West Alto Bonito
The most numerous immigrant groups reported in West Alto Bonito came from Central America (146 | 28.9%), Latin America (146 | 28.9%), and Mexico (146 | 28.9%), together accounting for 86.7% of all West Alto Bonito residents.
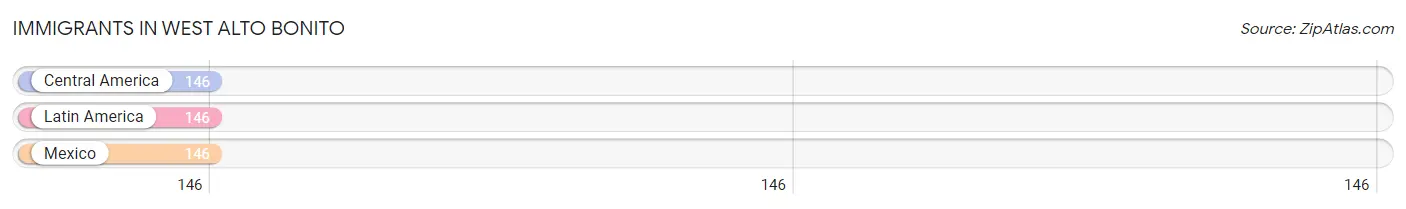
| Immigration Origin | # Population | % Population |
| Central America | 146 | 28.9% |
| Latin America | 146 | 28.9% |
| Mexico | 146 | 28.9% | View All 3 Rows |
Sex and Age in West Alto Bonito
Sex and Age in West Alto Bonito
The most populous age groups in West Alto Bonito are 50 to 54 Years (60 | 25.0%) for men and 15 to 19 Years (100 | 37.7%) for women.
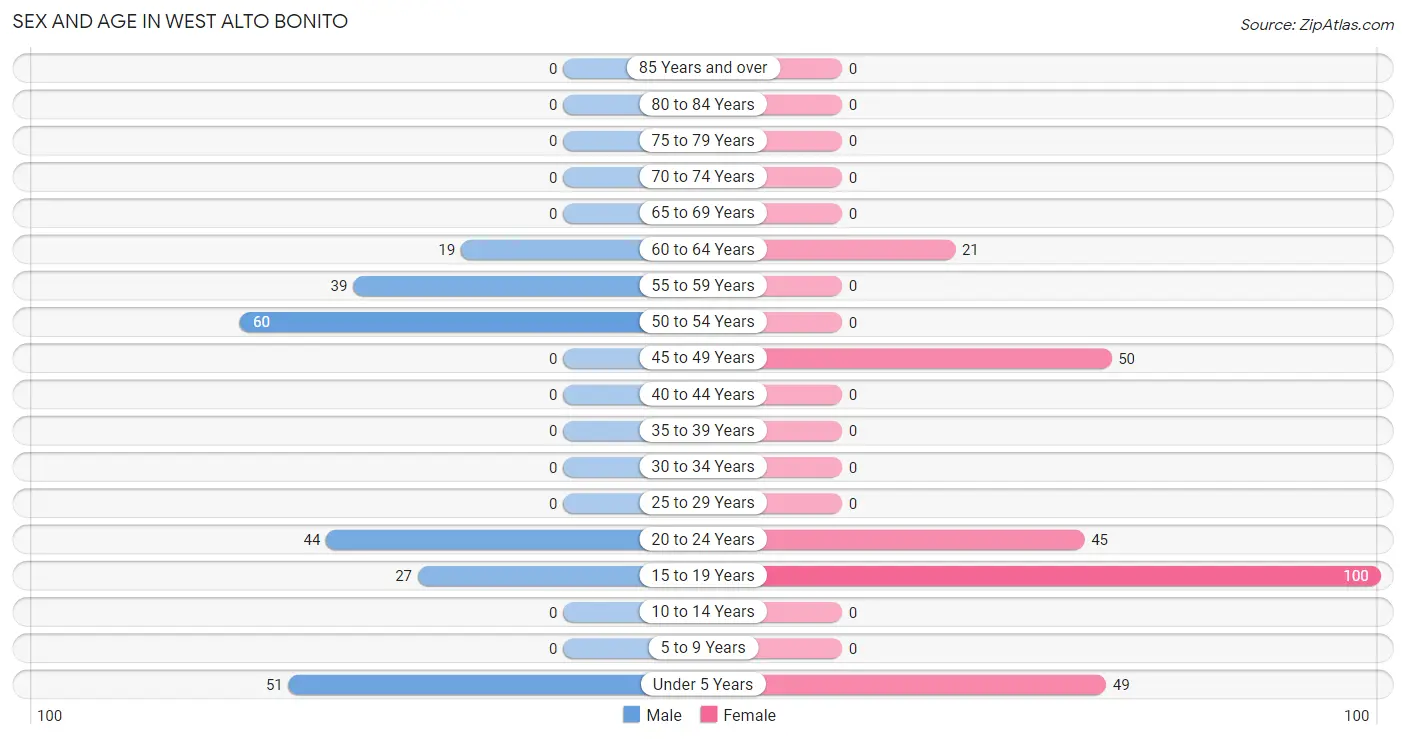
| Age Bracket | Male | Female |
| Under 5 Years | 51 (21.2%) | 49 (18.5%) |
| 5 to 9 Years | 0 (0.0%) | 0 (0.0%) |
| 10 to 14 Years | 0 (0.0%) | 0 (0.0%) |
| 15 to 19 Years | 27 (11.3%) | 100 (37.7%) |
| 20 to 24 Years | 44 (18.3%) | 45 (17.0%) |
| 25 to 29 Years | 0 (0.0%) | 0 (0.0%) |
| 30 to 34 Years | 0 (0.0%) | 0 (0.0%) |
| 35 to 39 Years | 0 (0.0%) | 0 (0.0%) |
| 40 to 44 Years | 0 (0.0%) | 0 (0.0%) |
| 45 to 49 Years | 0 (0.0%) | 50 (18.9%) |
| 50 to 54 Years | 60 (25.0%) | 0 (0.0%) |
| 55 to 59 Years | 39 (16.3%) | 0 (0.0%) |
| 60 to 64 Years | 19 (7.9%) | 21 (7.9%) |
| 65 to 69 Years | 0 (0.0%) | 0 (0.0%) |
| 70 to 74 Years | 0 (0.0%) | 0 (0.0%) |
| 75 to 79 Years | 0 (0.0%) | 0 (0.0%) |
| 80 to 84 Years | 0 (0.0%) | 0 (0.0%) |
| 85 Years and over | 0 (0.0%) | 0 (0.0%) |
| Total | 240 (100.0%) | 265 (100.0%) |
Families and Households in West Alto Bonito
Median Family Size in West Alto Bonito
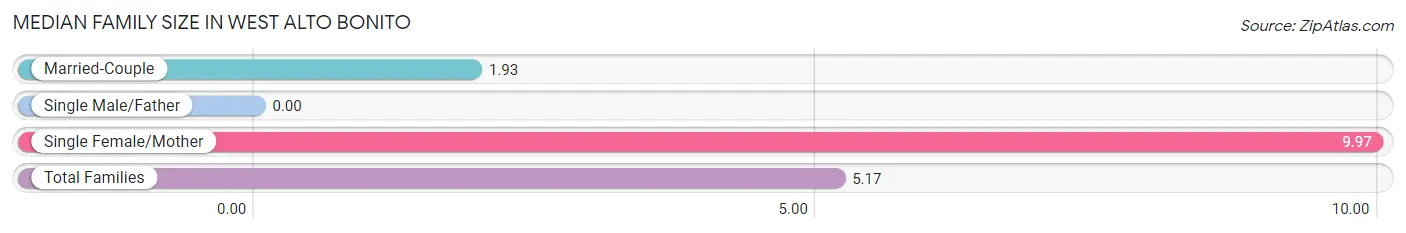
| Family Type | # Families | Family Size |
| Married-Couple | 43 (59.7%) | 1.93 |
| Single Male/Father | 0 (0.0%) | - |
| Single Female/Mother | 29 (40.3%) | 9.97 |
| Total Families | 72 (100.0%) | 5.17 |
Median Household Size in West Alto Bonito
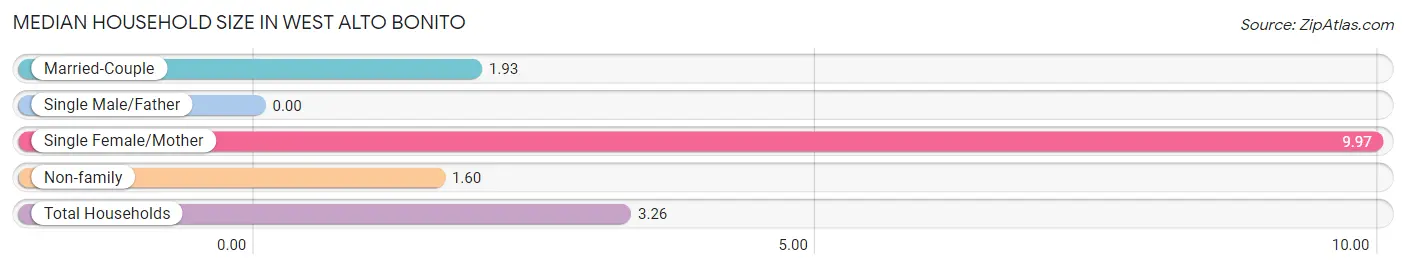
| Household Type | # Households | Household Size |
| Married-Couple | 43 (27.7%) | 1.93 |
| Single Male/Father | 0 (0.0%) | - |
| Single Female/Mother | 29 (18.7%) | 9.97 |
| Non-family | 83 (53.5%) | 1.60 |
| Total Households | 155 (100.0%) | 3.26 |
Household Size by Marriage Status in West Alto Bonito
Out of a total of 155 households in West Alto Bonito, 72 (46.5%) are family households, while 83 (53.5%) are nonfamily households. The most numerous type of family households are 2-person households, comprising 43, and the most common type of nonfamily households are 2-person households, comprising 44.
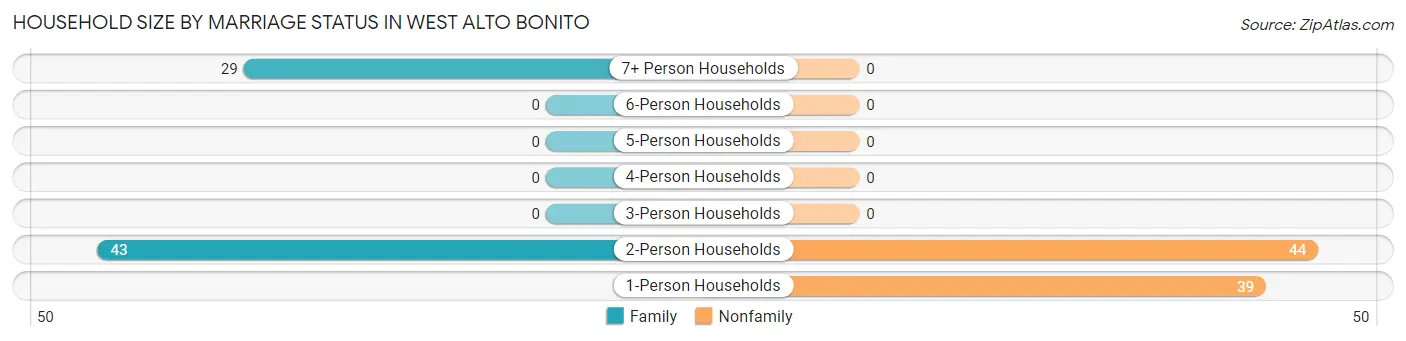
| Household Size | Family Households | Nonfamily Households |
| 1-Person Households | - | 39 (25.2%) |
| 2-Person Households | 43 (27.7%) | 44 (28.4%) |
| 3-Person Households | 0 (0.0%) | 0 (0.0%) |
| 4-Person Households | 0 (0.0%) | 0 (0.0%) |
| 5-Person Households | 0 (0.0%) | 0 (0.0%) |
| 6-Person Households | 0 (0.0%) | 0 (0.0%) |
| 7+ Person Households | 29 (18.7%) | 0 (0.0%) |
| Total | 72 (46.5%) | 83 (53.5%) |
Female Fertility in West Alto Bonito
Fertility by Age in West Alto Bonito
| Age Bracket | Women with Births | Births / 1,000 Women |
| 15 to 19 years | 0 (0.0%) | 0.0 |
| 20 to 34 years | 0 (0.0%) | 0.0 |
| 35 to 50 years | 0 (0.0%) | 0.0 |
| Total | 0 (0.0%) | 0.0 |
Fertility by Age by Marriage Status in West Alto Bonito
| Age Bracket | Married | Unmarried |
| 15 to 19 years | 0 (0.0%) | 0 (0.0%) |
| 20 to 34 years | 0 (0.0%) | 0 (0.0%) |
| 35 to 50 years | 0 (0.0%) | 0 (0.0%) |
| Total | 0 (0.0%) | 0 (0.0%) |
Fertility by Education in West Alto Bonito
| Educational Attainment | Women with Births | Births / 1,000 Women |
| Less than High School | 0 (0.0%) | 0.0 |
| High School Diploma | 0 (0.0%) | 0.0 |
| College or Associate's Degree | 0 (0.0%) | 0.0 |
| Bachelor's Degree | 0 (0.0%) | 0.0 |
| Graduate Degree | 0 (0.0%) | 0.0 |
| Total | 0 (0.0%) | 0.0 |
Fertility by Education by Marriage Status in West Alto Bonito
| Educational Attainment | Married | Unmarried |
| Less than High School | 0 (0.0%) | 0 (0.0%) |
| High School Diploma | 0 (0.0%) | 0 (0.0%) |
| College or Associate's Degree | 0 (0.0%) | 0 (0.0%) |
| Bachelor's Degree | 0 (0.0%) | 0 (0.0%) |
| Graduate Degree | 0 (0.0%) | 0 (0.0%) |
| Total | 0 (0.0%) | 0 (0.0%) |
Employment Characteristics in West Alto Bonito
Employment by Class of Employer in West Alto Bonito
Among the 112 employed individuals in West Alto Bonito, private company employees (71 | 63.4%), not-for-profit organizations (22 | 19.6%), and local government employees (19 | 17.0%) make up the most common classes of employment.
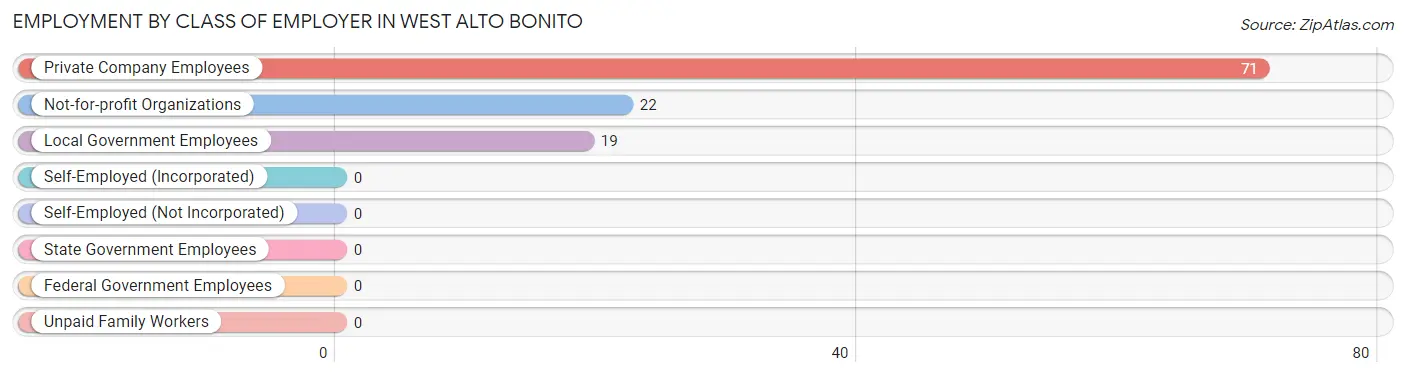
| Employer Class | # Employees | % Employees |
| Private Company Employees | 71 | 63.4% |
| Self-Employed (Incorporated) | 0 | 0.0% |
| Self-Employed (Not Incorporated) | 0 | 0.0% |
| Not-for-profit Organizations | 22 | 19.6% |
| Local Government Employees | 19 | 17.0% |
| State Government Employees | 0 | 0.0% |
| Federal Government Employees | 0 | 0.0% |
| Unpaid Family Workers | 0 | 0.0% |
| Total | 112 | 100.0% |
Employment Status by Age in West Alto Bonito
According to the labor force statistics for West Alto Bonito, out of the total population over 16 years of age (405), 62.0% or 251 individuals are in the labor force, with 37.5% or 94 of them unemployed. The age group with the highest labor force participation rate is 20 to 24 years, with 100.0% or 89 individuals in the labor force. Within the labor force, the 16 to 19 years age range has the highest percentage of unemployed individuals, with 100.0% or 50 of them being unemployed.
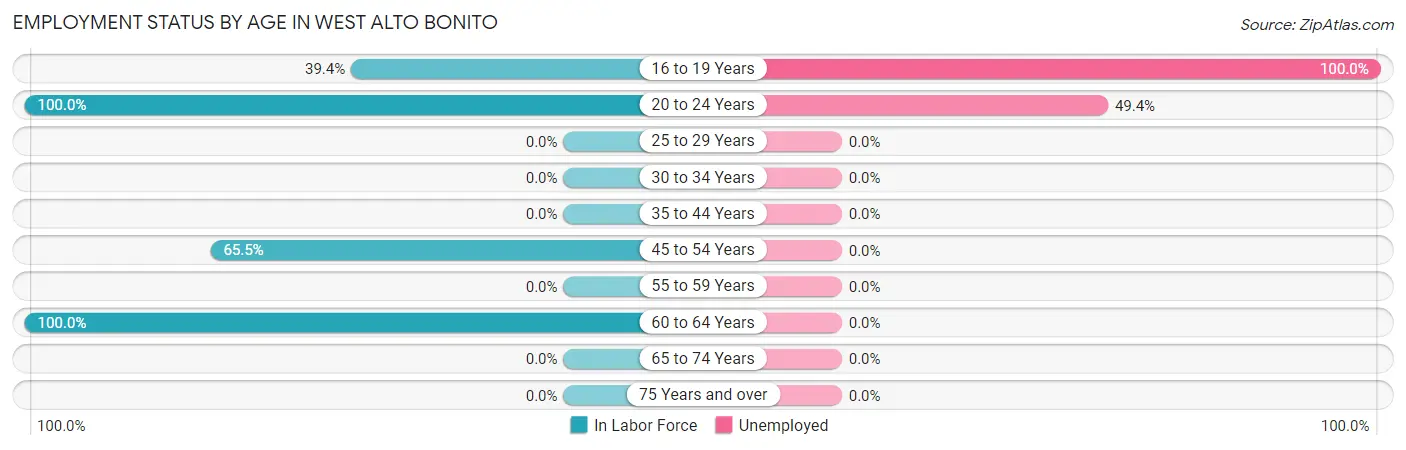
| Age Bracket | In Labor Force | Unemployed |
| 16 to 19 Years | 50 (39.4%) | 50 (100.0%) |
| 20 to 24 Years | 89 (100.0%) | 44 (49.4%) |
| 25 to 29 Years | 0 (0.0%) | 0 (0.0%) |
| 30 to 34 Years | 0 (0.0%) | 0 (0.0%) |
| 35 to 44 Years | 0 (0.0%) | 0 (0.0%) |
| 45 to 54 Years | 72 (65.5%) | 0 (0.0%) |
| 55 to 59 Years | 0 (0.0%) | 0 (0.0%) |
| 60 to 64 Years | 40 (100.0%) | 0 (0.0%) |
| 65 to 74 Years | 0 (0.0%) | 0 (0.0%) |
| 75 Years and over | 0 (0.0%) | 0 (0.0%) |
| Total | 251 (62.0%) | 94 (37.5%) |
Employment Status by Educational Attainment in West Alto Bonito
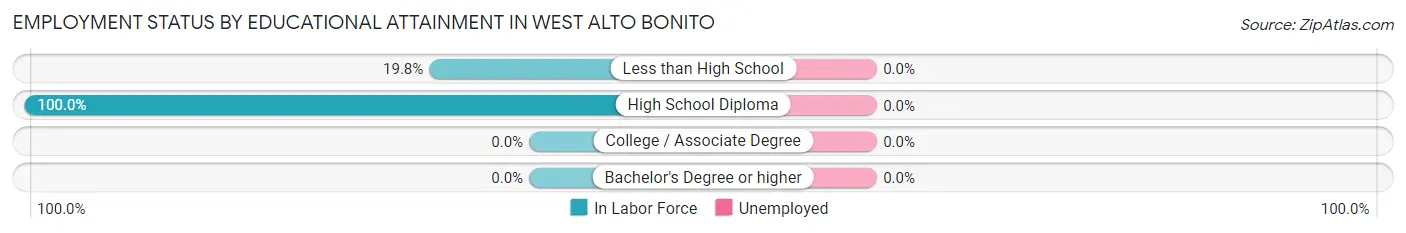
| Educational Attainment | In Labor Force | Unemployed |
| Less than High School | 19 (19.8%) | 0 (0.0%) |
| High School Diploma | 93 (100.0%) | 0 (0.0%) |
| College / Associate Degree | 0 (0.0%) | 0 (0.0%) |
| Bachelor's Degree or higher | 0 (0.0%) | 0 (0.0%) |
| Total | 112 (59.3%) | 0 (0.0%) |
Employment Occupations by Sex in West Alto Bonito
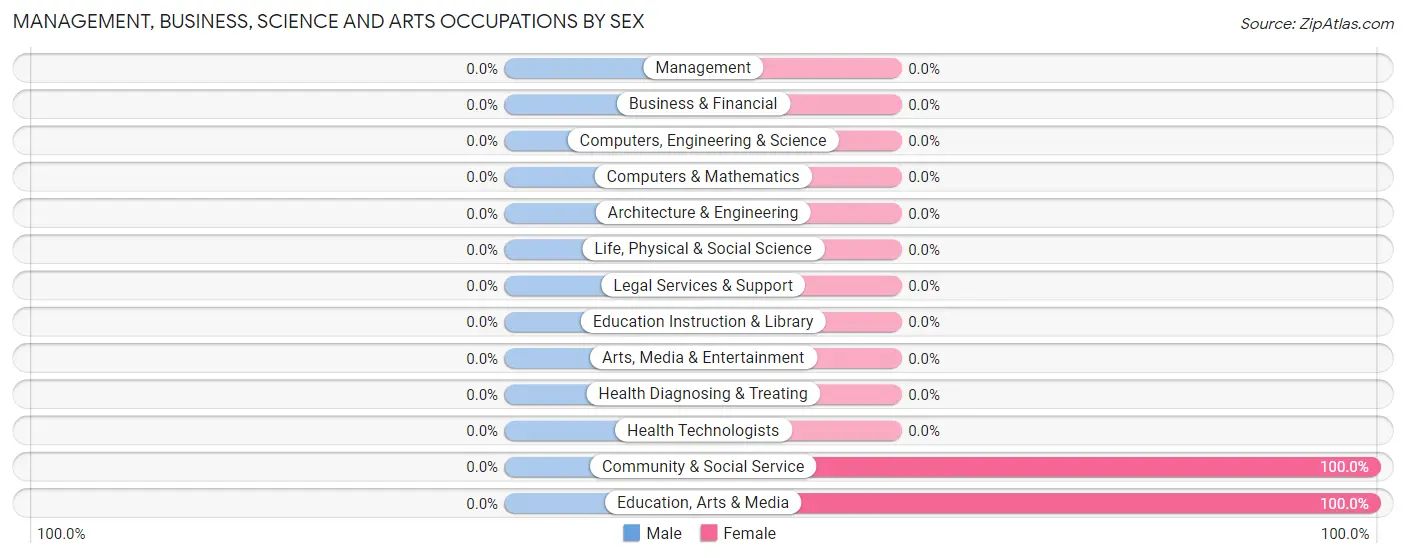
Management, Business, Science and Arts Occupations
The most common Management, Business, Science and Arts occupations in West Alto Bonito are Community & Social Service (29 | 18.5%), and Education, Arts & Media (29 | 18.5%).
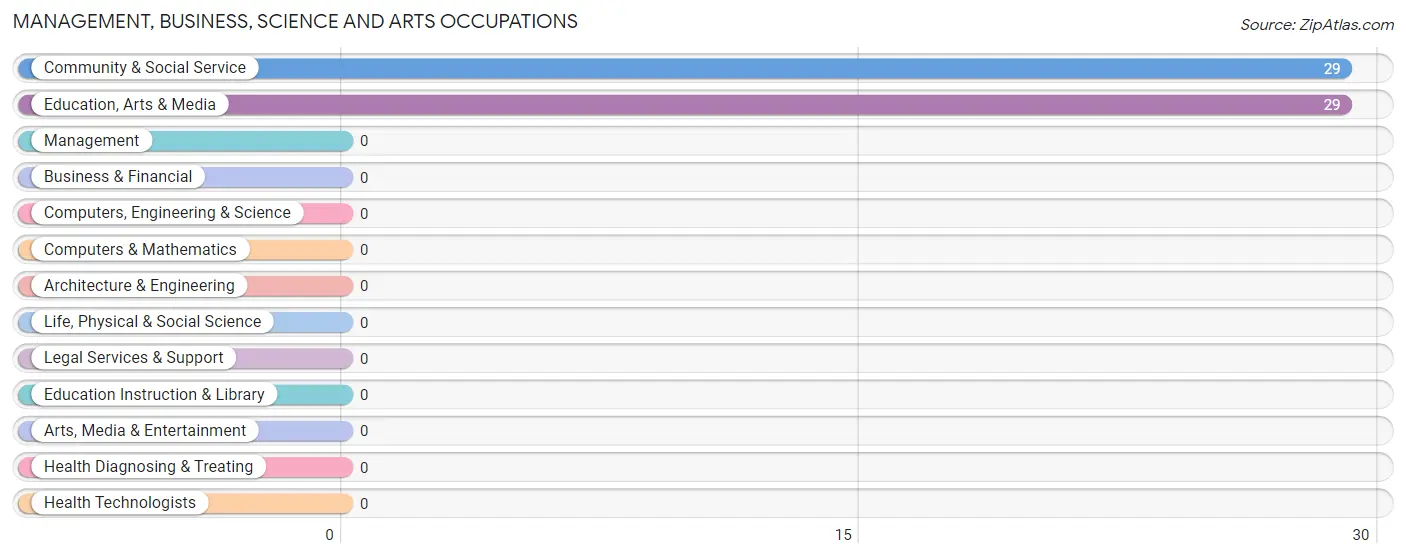
Management, Business, Science and Arts Occupations by Sex
| Occupation | Male | Female |
| Management | 0 (0.0%) | 0 (0.0%) |
| Business & Financial | 0 (0.0%) | 0 (0.0%) |
| Computers, Engineering & Science | 0 (0.0%) | 0 (0.0%) |
| Computers & Mathematics | 0 (0.0%) | 0 (0.0%) |
| Architecture & Engineering | 0 (0.0%) | 0 (0.0%) |
| Life, Physical & Social Science | 0 (0.0%) | 0 (0.0%) |
| Community & Social Service | 0 (0.0%) | 29 (100.0%) |
| Education, Arts & Media | 0 (0.0%) | 29 (100.0%) |
| Legal Services & Support | 0 (0.0%) | 0 (0.0%) |
| Education Instruction & Library | 0 (0.0%) | 0 (0.0%) |
| Arts, Media & Entertainment | 0 (0.0%) | 0 (0.0%) |
| Health Diagnosing & Treating | 0 (0.0%) | 0 (0.0%) |
| Health Technologists | 0 (0.0%) | 0 (0.0%) |
| Total (Category) | 0 (0.0%) | 29 (100.0%) |
| Total (Overall) | 41 (26.1%) | 116 (73.9%) |
Services Occupations
The most common Services occupations in West Alto Bonito are Healthcare Support (21 | 13.4%), and Cleaning & Maintenance (19 | 12.1%).
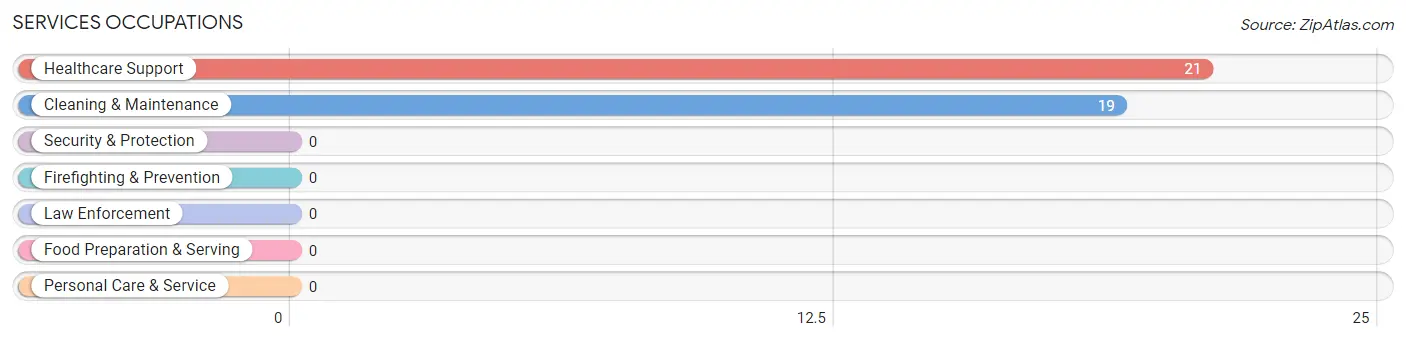
Services Occupations by Sex
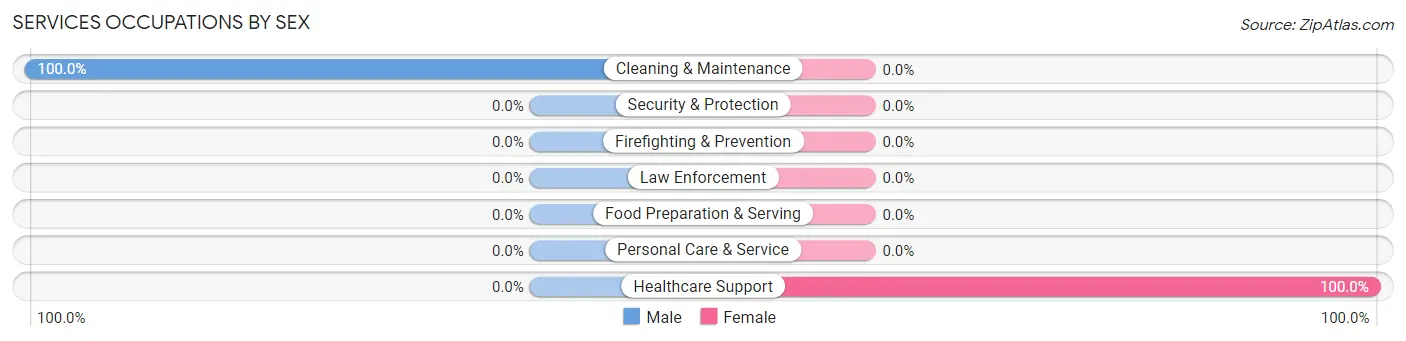
| Occupation | Male | Female |
| Healthcare Support | 0 (0.0%) | 21 (100.0%) |
| Security & Protection | 0 (0.0%) | 0 (0.0%) |
| Firefighting & Prevention | 0 (0.0%) | 0 (0.0%) |
| Law Enforcement | 0 (0.0%) | 0 (0.0%) |
| Food Preparation & Serving | 0 (0.0%) | 0 (0.0%) |
| Cleaning & Maintenance | 19 (100.0%) | 0 (0.0%) |
| Personal Care & Service | 0 (0.0%) | 0 (0.0%) |
| Total (Category) | 19 (47.5%) | 21 (52.5%) |
| Total (Overall) | 41 (26.1%) | 116 (73.9%) |
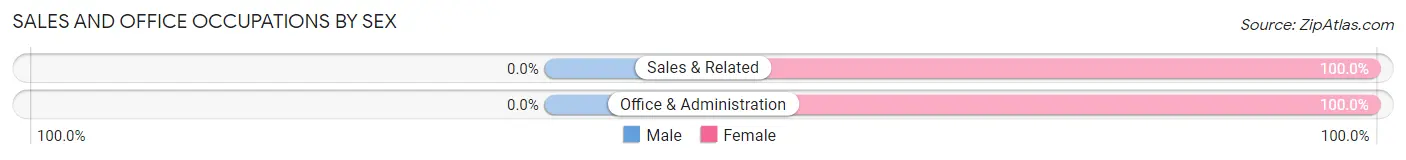
Sales and Office Occupations
The most common Sales and Office occupations in West Alto Bonito are Sales & Related (45 | 28.7%), and Office & Administration (21 | 13.4%).
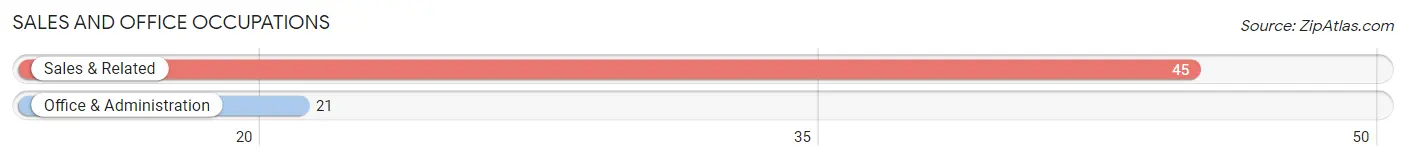
Sales and Office Occupations by Sex
| Occupation | Male | Female |
| Sales & Related | 0 (0.0%) | 45 (100.0%) |
| Office & Administration | 0 (0.0%) | 21 (100.0%) |
| Total (Category) | 0 (0.0%) | 66 (100.0%) |
| Total (Overall) | 41 (26.1%) | 116 (73.9%) |
Natural Resources, Construction and Maintenance Occupations
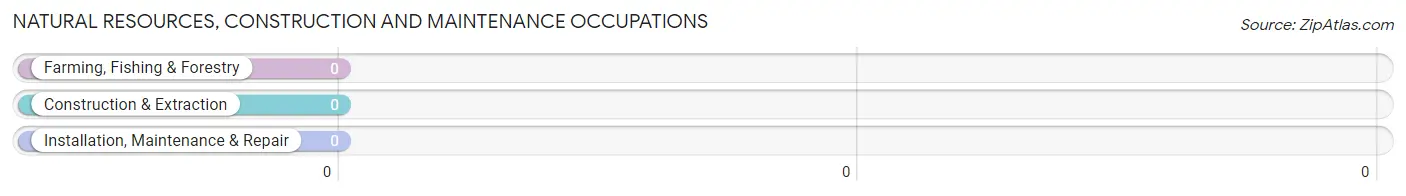
Natural Resources, Construction and Maintenance Occupations by Sex
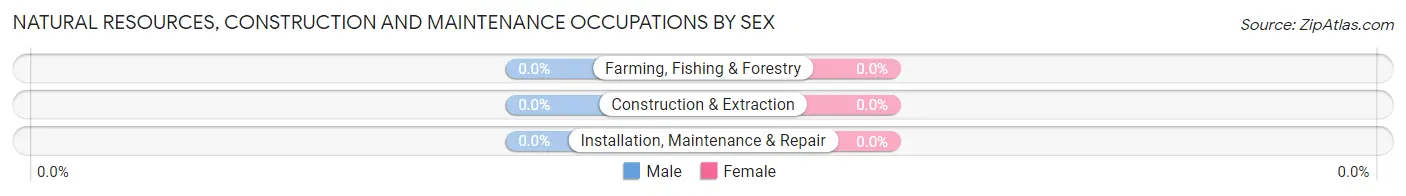
| Occupation | Male | Female |
| Farming, Fishing & Forestry | 0 (0.0%) | 0 (0.0%) |
| Construction & Extraction | 0 (0.0%) | 0 (0.0%) |
| Installation, Maintenance & Repair | 0 (0.0%) | 0 (0.0%) |
| Total (Category) | 0 (0.0%) | 0 (0.0%) |
| Total (Overall) | 41 (26.1%) | 116 (73.9%) |
Production, Transportation and Moving Occupations
The most common Production, Transportation and Moving occupations in West Alto Bonito are , and Production (22 | 14.0%).
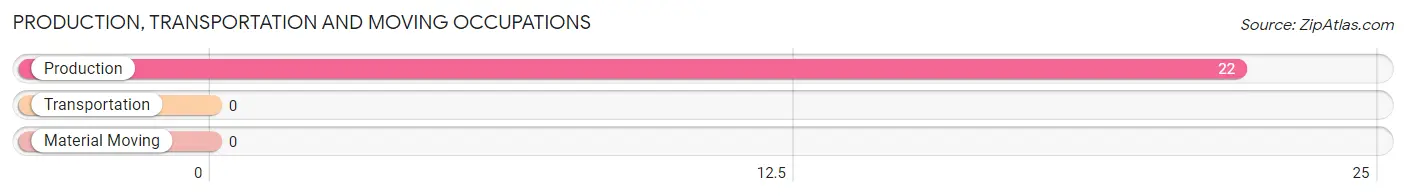
Production, Transportation and Moving Occupations by Sex
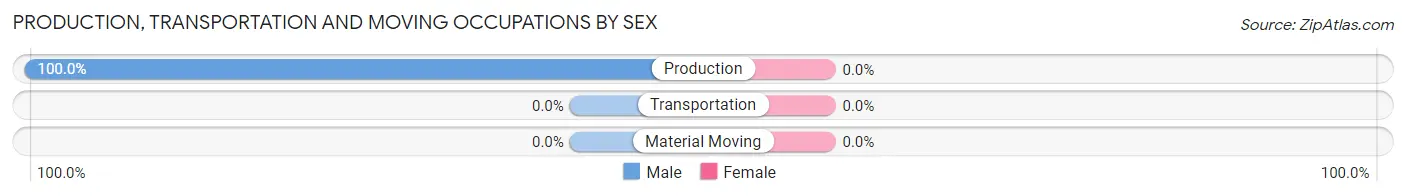
| Occupation | Male | Female |
| Production | 22 (100.0%) | 0 (0.0%) |
| Transportation | 0 (0.0%) | 0 (0.0%) |
| Material Moving | 0 (0.0%) | 0 (0.0%) |
| Total (Category) | 22 (100.0%) | 0 (0.0%) |
| Total (Overall) | 41 (26.1%) | 116 (73.9%) |
Employment Industries by Sex in West Alto Bonito
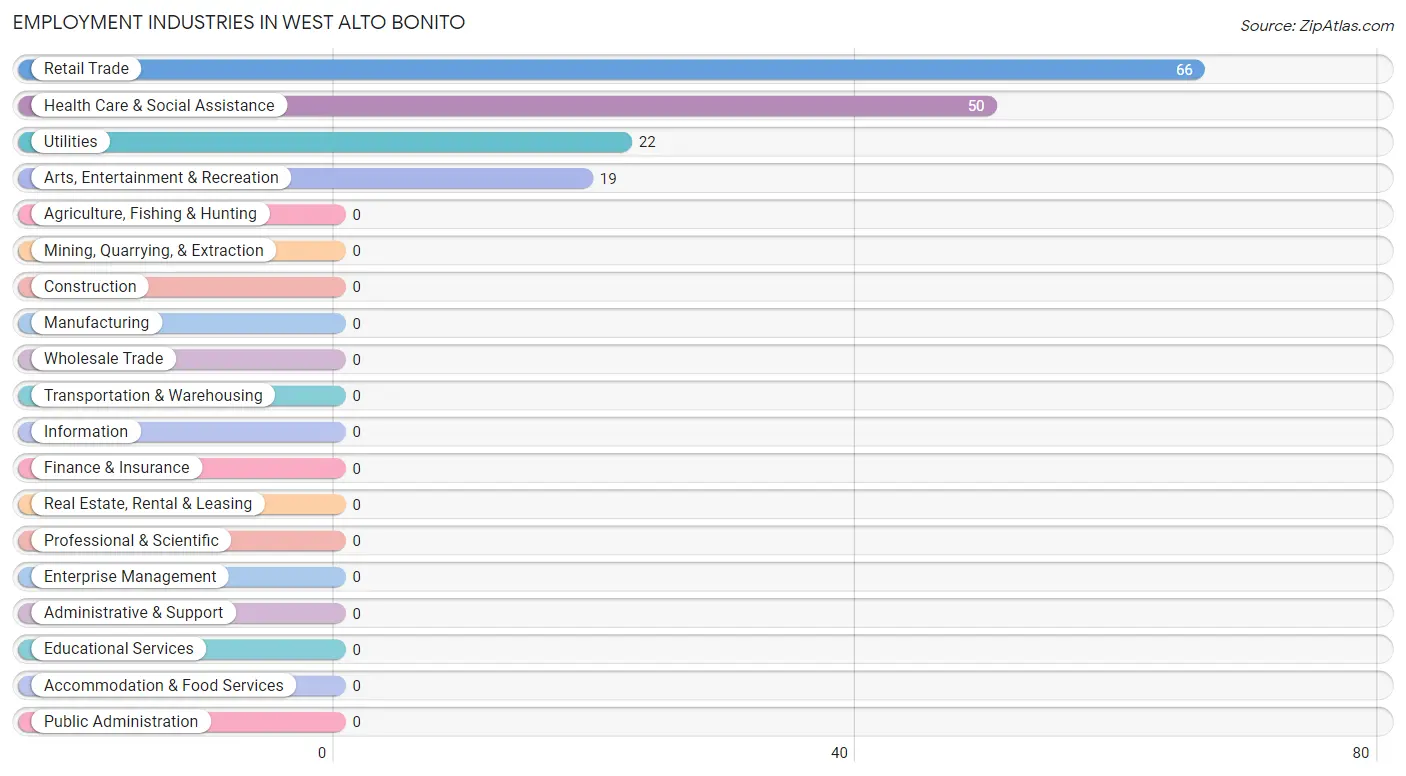
Employment Industries in West Alto Bonito
The major employment industries in West Alto Bonito include Retail Trade (66 | 42.0%), Health Care & Social Assistance (50 | 31.9%), Utilities (22 | 14.0%), and Arts, Entertainment & Recreation (19 | 12.1%).
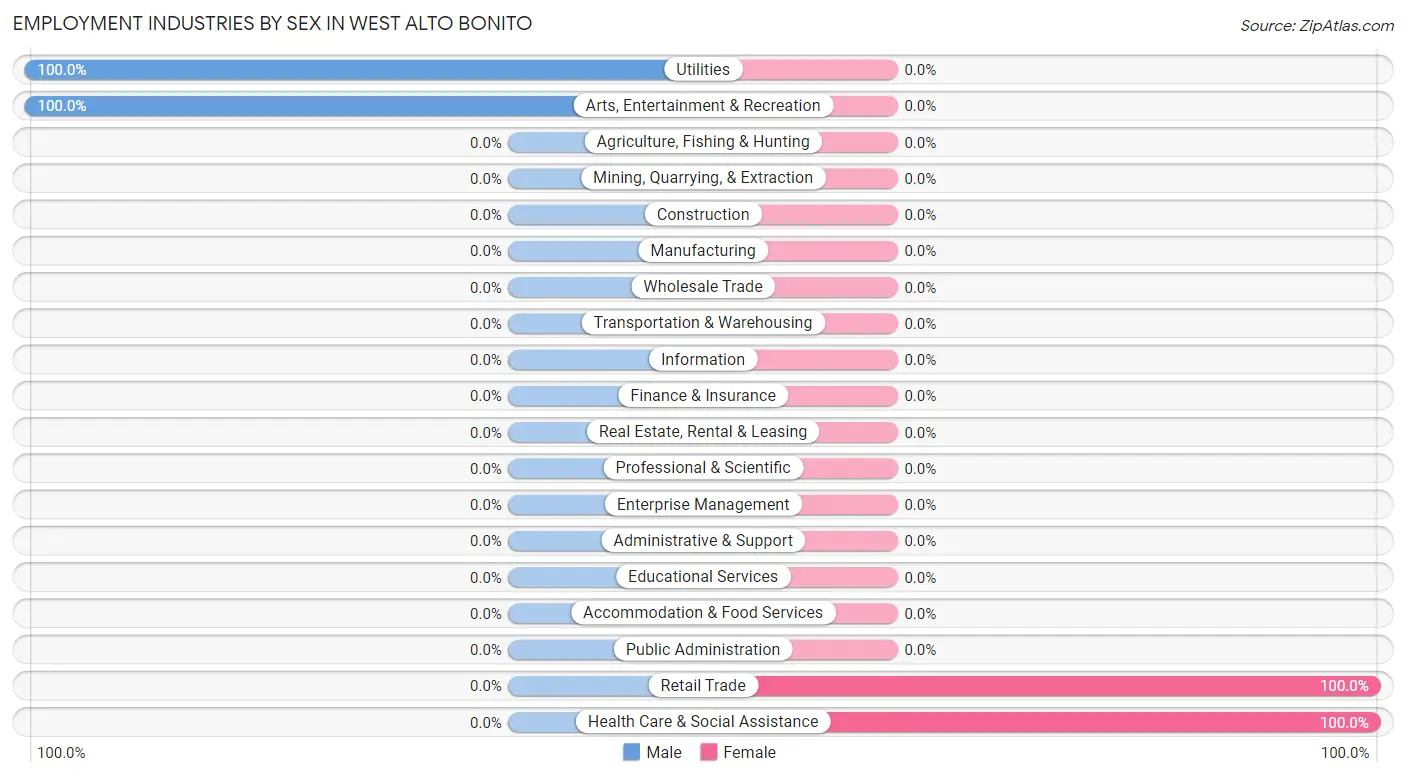
Employment Industries by Sex in West Alto Bonito
The West Alto Bonito industries that see more men than women are Utilities (100.0%), and Arts, Entertainment & Recreation (100.0%), whereas the industries that tend to have a higher number of women are Retail Trade (100.0%), and Health Care & Social Assistance (100.0%).
| Industry | Male | Female |
| Agriculture, Fishing & Hunting | 0 (0.0%) | 0 (0.0%) |
| Mining, Quarrying, & Extraction | 0 (0.0%) | 0 (0.0%) |
| Construction | 0 (0.0%) | 0 (0.0%) |
| Manufacturing | 0 (0.0%) | 0 (0.0%) |
| Wholesale Trade | 0 (0.0%) | 0 (0.0%) |
| Retail Trade | 0 (0.0%) | 66 (100.0%) |
| Transportation & Warehousing | 0 (0.0%) | 0 (0.0%) |
| Utilities | 22 (100.0%) | 0 (0.0%) |
| Information | 0 (0.0%) | 0 (0.0%) |
| Finance & Insurance | 0 (0.0%) | 0 (0.0%) |
| Real Estate, Rental & Leasing | 0 (0.0%) | 0 (0.0%) |
| Professional & Scientific | 0 (0.0%) | 0 (0.0%) |
| Enterprise Management | 0 (0.0%) | 0 (0.0%) |
| Administrative & Support | 0 (0.0%) | 0 (0.0%) |
| Educational Services | 0 (0.0%) | 0 (0.0%) |
| Health Care & Social Assistance | 0 (0.0%) | 50 (100.0%) |
| Arts, Entertainment & Recreation | 19 (100.0%) | 0 (0.0%) |
| Accommodation & Food Services | 0 (0.0%) | 0 (0.0%) |
| Public Administration | 0 (0.0%) | 0 (0.0%) |
| Total | 41 (26.1%) | 116 (73.9%) |
Education in West Alto Bonito
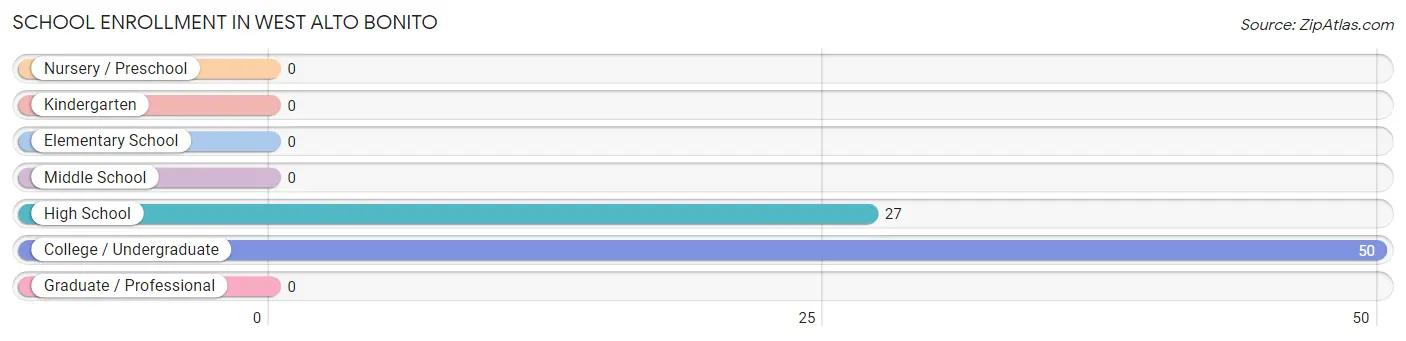
School Enrollment in West Alto Bonito
The most common levels of schooling among the 77 students in West Alto Bonito are college / undergraduate (50 | 64.9%), and high school (27 | 35.1%).
| School Level | # Students | % Students |
| Nursery / Preschool | 0 | 0.0% |
| Kindergarten | 0 | 0.0% |
| Elementary School | 0 | 0.0% |
| Middle School | 0 | 0.0% |
| High School | 27 | 35.1% |
| College / Undergraduate | 50 | 64.9% |
| Graduate / Professional | 0 | 0.0% |
| Total | 77 | 100.0% |
School Enrollment by Age by Funding Source in West Alto Bonito
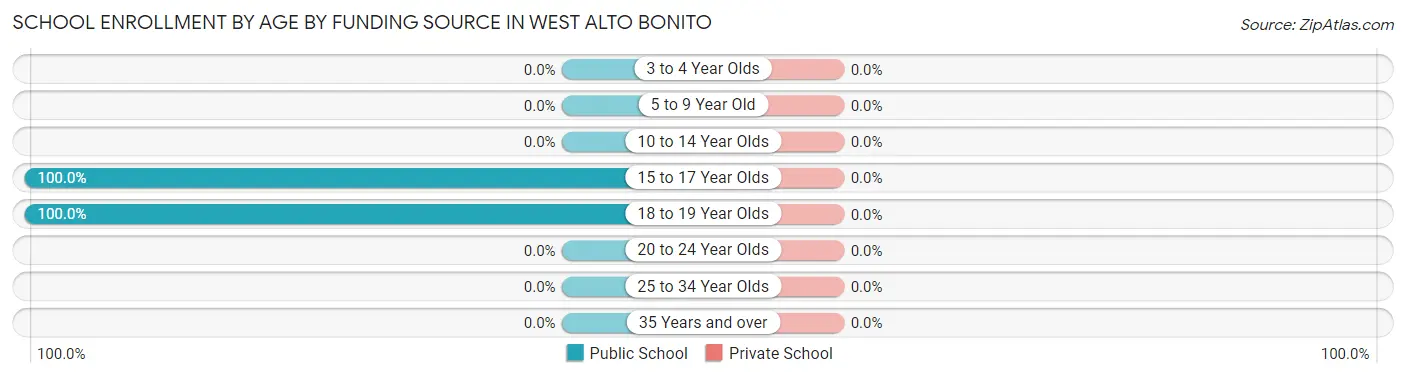
| Age Bracket | Public School | Private School |
| 3 to 4 Year Olds | 0 (0.0%) | 0 (0.0%) |
| 5 to 9 Year Old | 0 (0.0%) | 0 (0.0%) |
| 10 to 14 Year Olds | 0 (0.0%) | 0 (0.0%) |
| 15 to 17 Year Olds | 27 (100.0%) | 0 (0.0%) |
| 18 to 19 Year Olds | 50 (100.0%) | 0 (0.0%) |
| 20 to 24 Year Olds | 0 (0.0%) | 0 (0.0%) |
| 25 to 34 Year Olds | 0 (0.0%) | 0 (0.0%) |
| 35 Years and over | 0 (0.0%) | 0 (0.0%) |
| Total | 77 (100.0%) | 0 (0.0%) |
Educational Attainment by Field of Study in West Alto Bonito
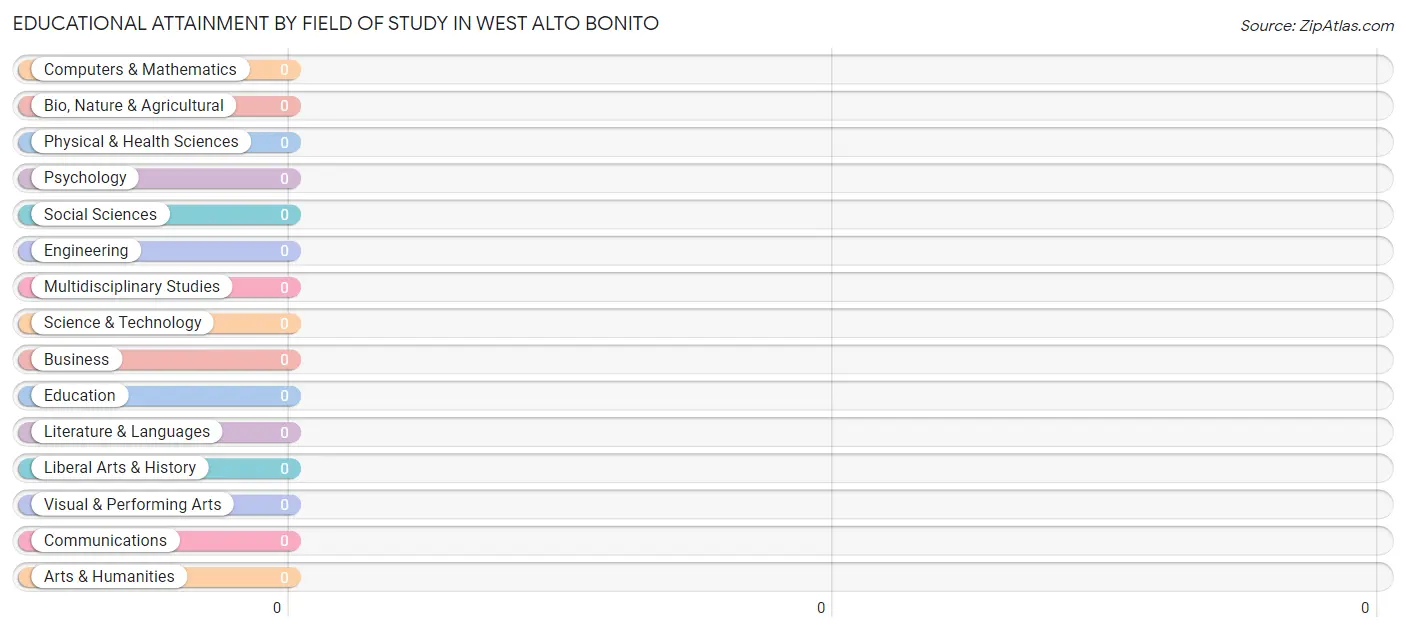
| Field of Study | # Graduates | % Graduates |
| Computers & Mathematics | 0 | 0.0% |
| Bio, Nature & Agricultural | 0 | 0.0% |
| Physical & Health Sciences | 0 | 0.0% |
| Psychology | 0 | 0.0% |
| Social Sciences | 0 | 0.0% |
| Engineering | 0 | 0.0% |
| Multidisciplinary Studies | 0 | 0.0% |
| Science & Technology | 0 | 0.0% |
| Business | 0 | 0.0% |
| Education | 0 | 0.0% |
| Literature & Languages | 0 | 0.0% |
| Liberal Arts & History | 0 | 0.0% |
| Visual & Performing Arts | 0 | 0.0% |
| Communications | 0 | 0.0% |
| Arts & Humanities | 0 | 0.0% |
| Total | 0 | 0.0% |
Transportation & Commute in West Alto Bonito
Vehicle Availability by Sex in West Alto Bonito
The most prevalent vehicle ownership categories in West Alto Bonito are males with 2 vehicles (22, accounting for 53.7%) and females with 2 vehicles (21, making up 31.0%).
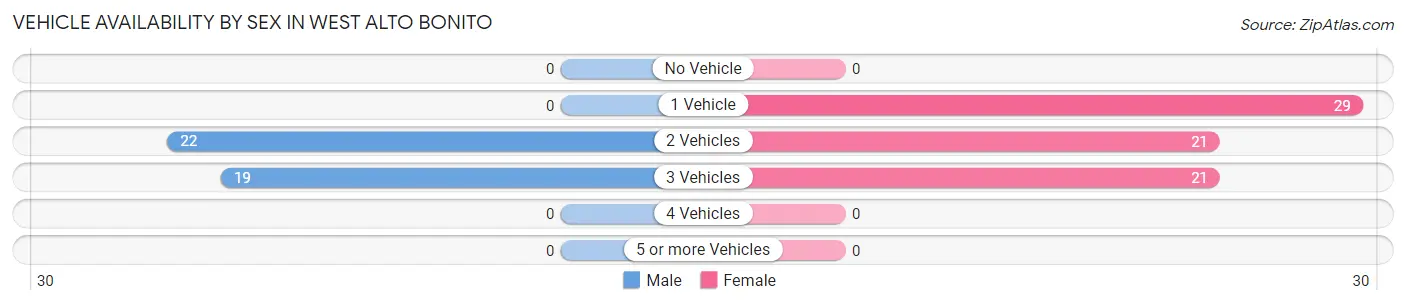
| Vehicles Available | Male | Female |
| No Vehicle | 0 (0.0%) | 0 (0.0%) |
| 1 Vehicle | 0 (0.0%) | 29 (40.8%) |
| 2 Vehicles | 22 (53.7%) | 21 (29.6%) |
| 3 Vehicles | 19 (46.3%) | 21 (29.6%) |
| 4 Vehicles | 0 (0.0%) | 0 (0.0%) |
| 5 or more Vehicles | 0 (0.0%) | 0 (0.0%) |
| Total | 41 (100.0%) | 71 (100.0%) |
Commute Time in West Alto Bonito
The most frequently occuring commute durations in West Alto Bonito are 40 to 44 minutes (22 commuters, 26.5%), 10 to 14 minutes (21 commuters, 25.3%), and 25 to 29 minutes (21 commuters, 25.3%).
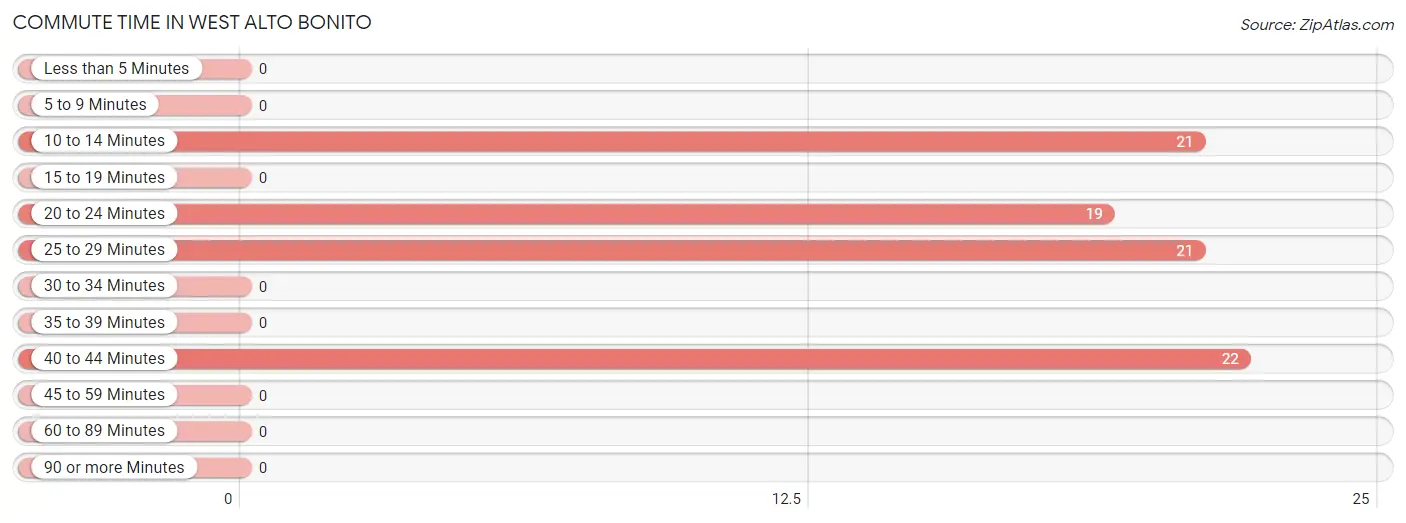
| Commute Time | # Commuters | % Commuters |
| Less than 5 Minutes | 0 | 0.0% |
| 5 to 9 Minutes | 0 | 0.0% |
| 10 to 14 Minutes | 21 | 25.3% |
| 15 to 19 Minutes | 0 | 0.0% |
| 20 to 24 Minutes | 19 | 22.9% |
| 25 to 29 Minutes | 21 | 25.3% |
| 30 to 34 Minutes | 0 | 0.0% |
| 35 to 39 Minutes | 0 | 0.0% |
| 40 to 44 Minutes | 22 | 26.5% |
| 45 to 59 Minutes | 0 | 0.0% |
| 60 to 89 Minutes | 0 | 0.0% |
| 90 or more Minutes | 0 | 0.0% |
Commute Time by Sex in West Alto Bonito
The most common commute times in West Alto Bonito are 40 to 44 minutes (22 commuters, 53.7%) for males and 10 to 14 minutes (21 commuters, 50.0%) for females.
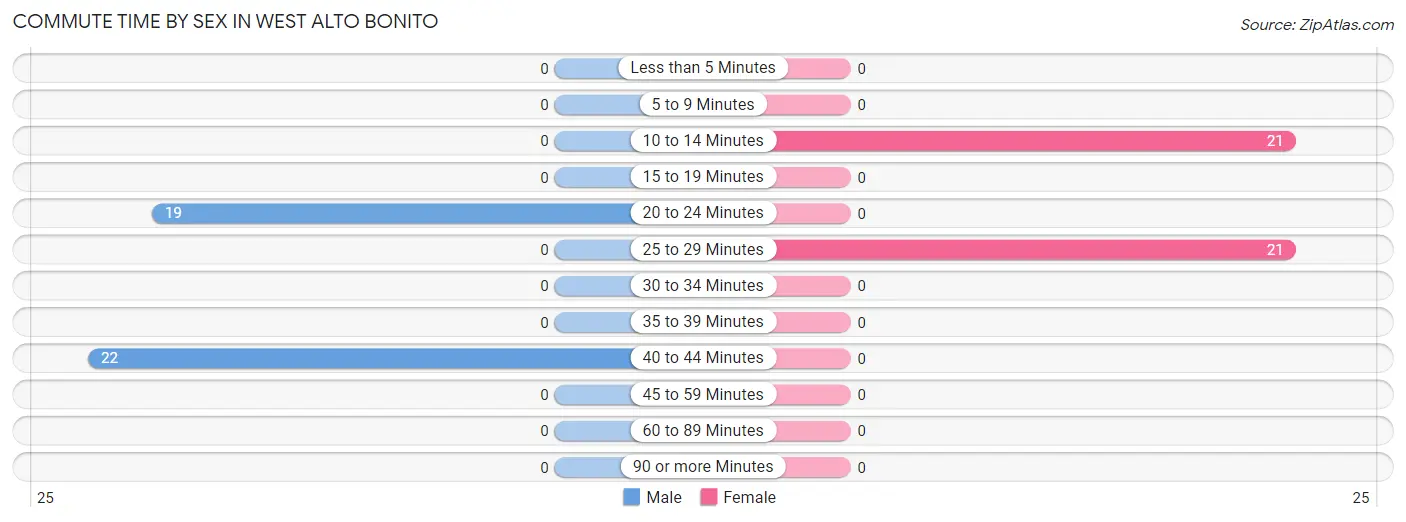
| Commute Time | Male | Female |
| Less than 5 Minutes | 0 (0.0%) | 0 (0.0%) |
| 5 to 9 Minutes | 0 (0.0%) | 0 (0.0%) |
| 10 to 14 Minutes | 0 (0.0%) | 21 (50.0%) |
| 15 to 19 Minutes | 0 (0.0%) | 0 (0.0%) |
| 20 to 24 Minutes | 19 (46.3%) | 0 (0.0%) |
| 25 to 29 Minutes | 0 (0.0%) | 21 (50.0%) |
| 30 to 34 Minutes | 0 (0.0%) | 0 (0.0%) |
| 35 to 39 Minutes | 0 (0.0%) | 0 (0.0%) |
| 40 to 44 Minutes | 22 (53.7%) | 0 (0.0%) |
| 45 to 59 Minutes | 0 (0.0%) | 0 (0.0%) |
| 60 to 89 Minutes | 0 (0.0%) | 0 (0.0%) |
| 90 or more Minutes | 0 (0.0%) | 0 (0.0%) |
Time of Departure to Work by Sex in West Alto Bonito
The most frequent times of departure to work in West Alto Bonito are 9:00 AM to 9:59 AM (22, 53.7%) for males and 6:00 AM to 6:29 AM (21, 50.0%) for females.
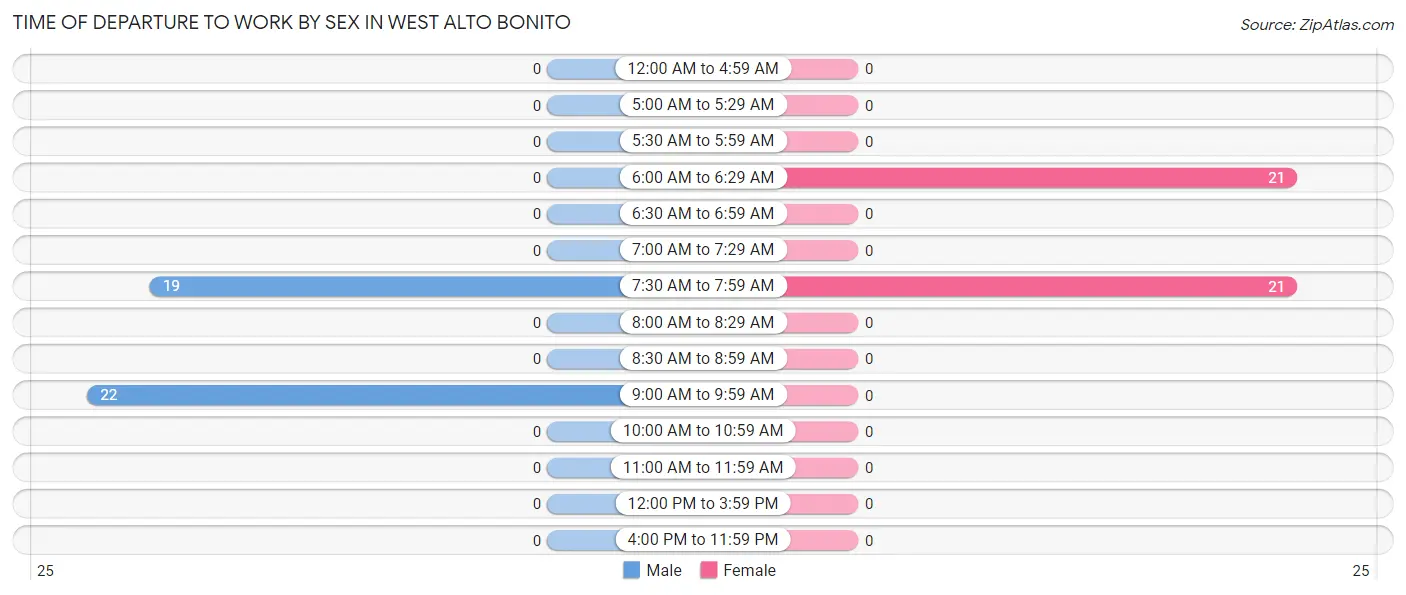
| Time of Departure | Male | Female |
| 12:00 AM to 4:59 AM | 0 (0.0%) | 0 (0.0%) |
| 5:00 AM to 5:29 AM | 0 (0.0%) | 0 (0.0%) |
| 5:30 AM to 5:59 AM | 0 (0.0%) | 0 (0.0%) |
| 6:00 AM to 6:29 AM | 0 (0.0%) | 21 (50.0%) |
| 6:30 AM to 6:59 AM | 0 (0.0%) | 0 (0.0%) |
| 7:00 AM to 7:29 AM | 0 (0.0%) | 0 (0.0%) |
| 7:30 AM to 7:59 AM | 19 (46.3%) | 21 (50.0%) |
| 8:00 AM to 8:29 AM | 0 (0.0%) | 0 (0.0%) |
| 8:30 AM to 8:59 AM | 0 (0.0%) | 0 (0.0%) |
| 9:00 AM to 9:59 AM | 22 (53.7%) | 0 (0.0%) |
| 10:00 AM to 10:59 AM | 0 (0.0%) | 0 (0.0%) |
| 11:00 AM to 11:59 AM | 0 (0.0%) | 0 (0.0%) |
| 12:00 PM to 3:59 PM | 0 (0.0%) | 0 (0.0%) |
| 4:00 PM to 11:59 PM | 0 (0.0%) | 0 (0.0%) |
| Total | 41 (100.0%) | 42 (100.0%) |
Housing Occupancy in West Alto Bonito
Occupancy by Ownership in West Alto Bonito
Of the total 155 dwellings in West Alto Bonito, owner-occupied units account for 111 (71.6%), while renter-occupied units make up 44 (28.4%).
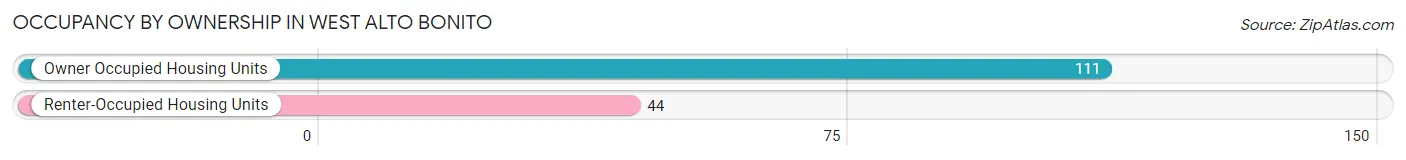
| Occupancy | # Housing Units | % Housing Units |
| Owner Occupied Housing Units | 111 | 71.6% |
| Renter-Occupied Housing Units | 44 | 28.4% |
| Total Occupied Housing Units | 155 | 100.0% |
Occupancy by Household Size in West Alto Bonito
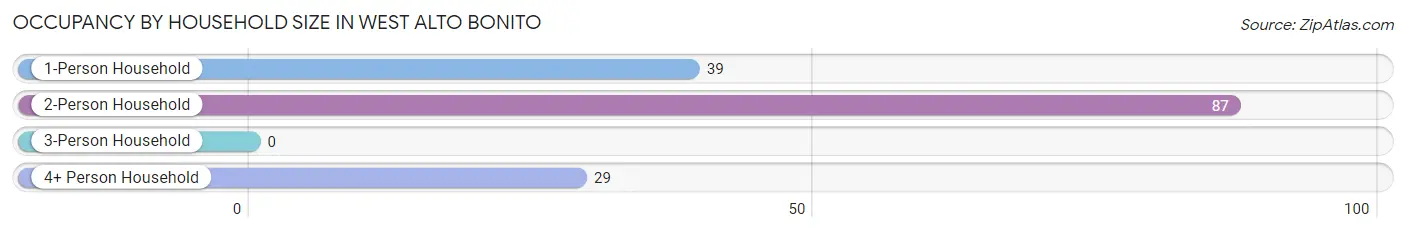
| Household Size | # Housing Units | % Housing Units |
| 1-Person Household | 39 | 25.2% |
| 2-Person Household | 87 | 56.1% |
| 3-Person Household | 0 | 0.0% |
| 4+ Person Household | 29 | 18.7% |
| Total Housing Units | 155 | 100.0% |
Occupancy by Ownership by Household Size in West Alto Bonito
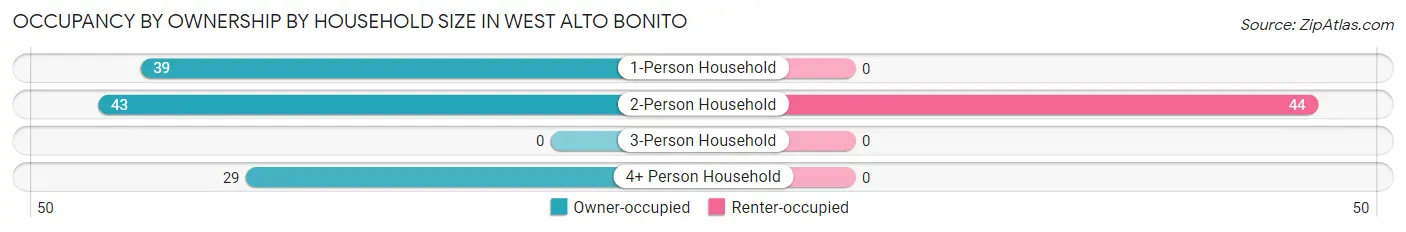
| Household Size | Owner-occupied | Renter-occupied |
| 1-Person Household | 39 (100.0%) | 0 (0.0%) |
| 2-Person Household | 43 (49.4%) | 44 (50.6%) |
| 3-Person Household | 0 (0.0%) | 0 (0.0%) |
| 4+ Person Household | 29 (100.0%) | 0 (0.0%) |
| Total Housing Units | 111 (71.6%) | 44 (28.4%) |
Occupancy by Educational Attainment in West Alto Bonito
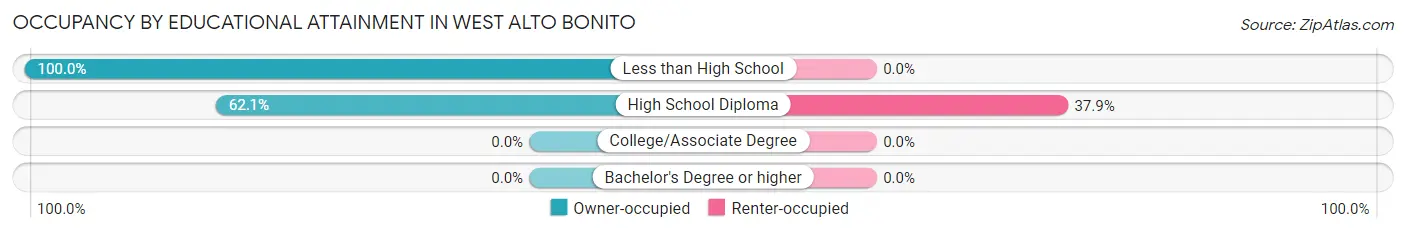
| Household Size | Owner-occupied | Renter-occupied |
| Less than High School | 39 (100.0%) | 0 (0.0%) |
| High School Diploma | 72 (62.1%) | 44 (37.9%) |
| College/Associate Degree | 0 (0.0%) | 0 (0.0%) |
| Bachelor's Degree or higher | 0 (0.0%) | 0 (0.0%) |
Occupancy by Age of Householder in West Alto Bonito
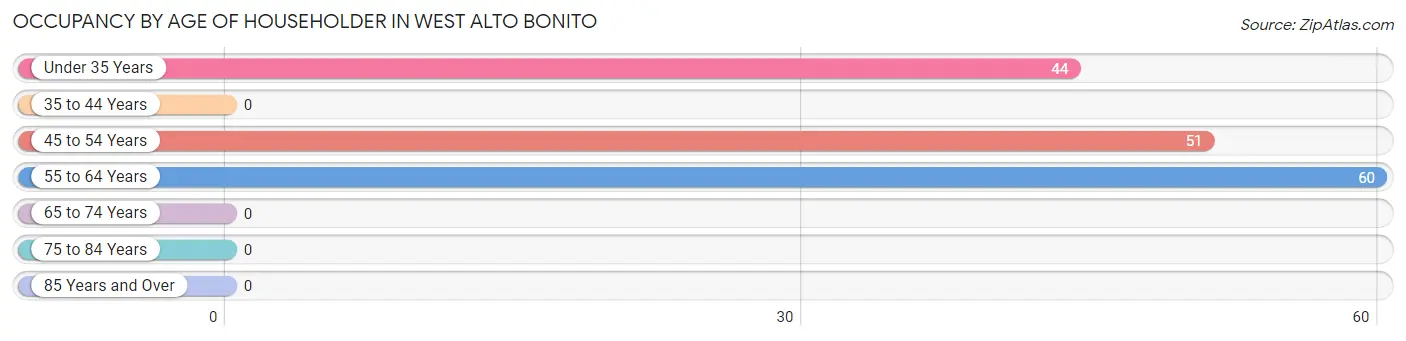
| Age Bracket | # Households | % Households |
| Under 35 Years | 44 | 28.4% |
| 35 to 44 Years | 0 | 0.0% |
| 45 to 54 Years | 51 | 32.9% |
| 55 to 64 Years | 60 | 38.7% |
| 65 to 74 Years | 0 | 0.0% |
| 75 to 84 Years | 0 | 0.0% |
| 85 Years and Over | 0 | 0.0% |
| Total | 155 | 100.0% |
Housing Finances in West Alto Bonito
Median Income by Occupancy in West Alto Bonito
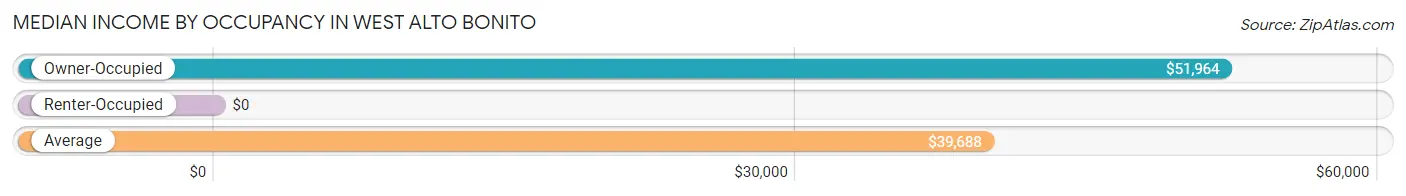
| Occupancy Type | # Households | Median Income |
| Owner-Occupied | 111 (71.6%) | $51,964 |
| Renter-Occupied | 44 (28.4%) | $0 |
| Average | 155 (100.0%) | $39,688 |
Occupancy by Householder Income Bracket in West Alto Bonito
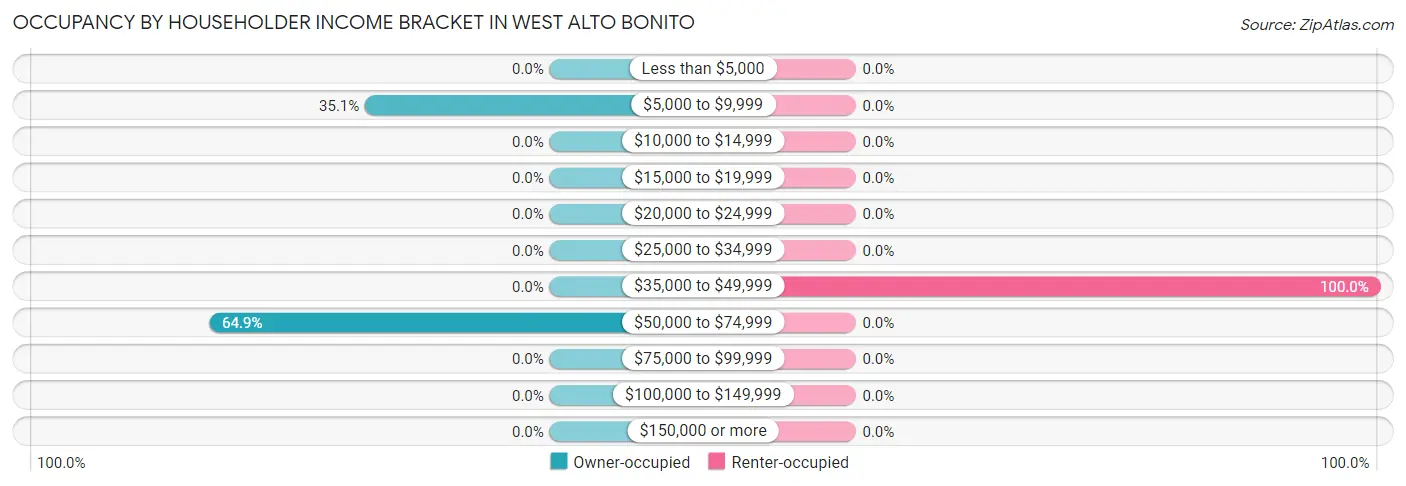
| Income Bracket | Owner-occupied | Renter-occupied |
| Less than $5,000 | 0 (0.0%) | 0 (0.0%) |
| $5,000 to $9,999 | 39 (35.1%) | 0 (0.0%) |
| $10,000 to $14,999 | 0 (0.0%) | 0 (0.0%) |
| $15,000 to $19,999 | 0 (0.0%) | 0 (0.0%) |
| $20,000 to $24,999 | 0 (0.0%) | 0 (0.0%) |
| $25,000 to $34,999 | 0 (0.0%) | 0 (0.0%) |
| $35,000 to $49,999 | 0 (0.0%) | 44 (100.0%) |
| $50,000 to $74,999 | 72 (64.9%) | 0 (0.0%) |
| $75,000 to $99,999 | 0 (0.0%) | 0 (0.0%) |
| $100,000 to $149,999 | 0 (0.0%) | 0 (0.0%) |
| $150,000 or more | 0 (0.0%) | 0 (0.0%) |
| Total | 111 (100.0%) | 44 (100.0%) |
Monthly Housing Cost Tiers in West Alto Bonito
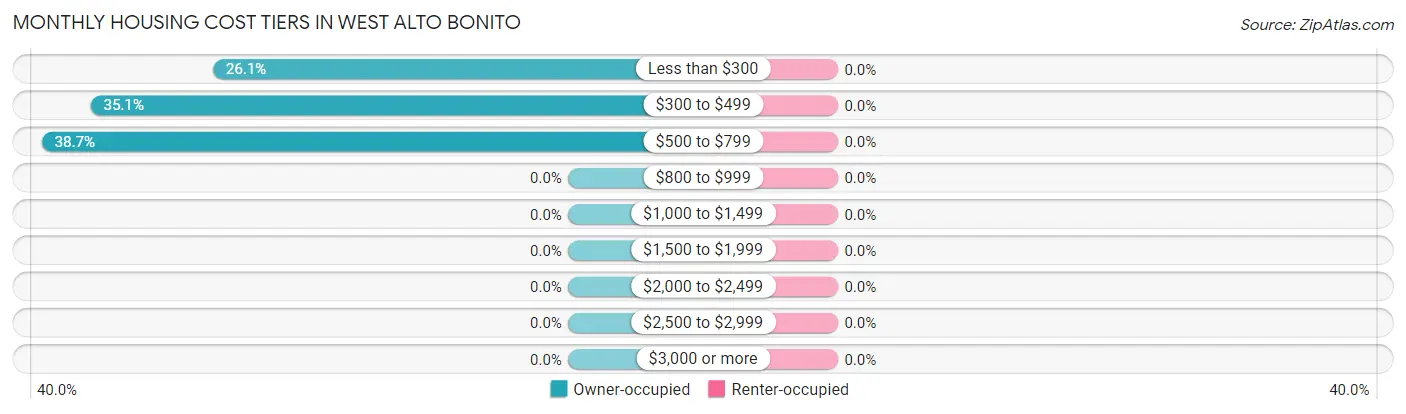
| Monthly Cost | Owner-occupied | Renter-occupied |
| Less than $300 | 29 (26.1%) | 0 (0.0%) |
| $300 to $499 | 39 (35.1%) | 0 (0.0%) |
| $500 to $799 | 43 (38.7%) | 0 (0.0%) |
| $800 to $999 | 0 (0.0%) | 0 (0.0%) |
| $1,000 to $1,499 | 0 (0.0%) | 0 (0.0%) |
| $1,500 to $1,999 | 0 (0.0%) | 0 (0.0%) |
| $2,000 to $2,499 | 0 (0.0%) | 0 (0.0%) |
| $2,500 to $2,999 | 0 (0.0%) | 0 (0.0%) |
| $3,000 or more | 0 (0.0%) | 0 (0.0%) |
| Total | 111 (100.0%) | 44 (100.0%) |
Physical Housing Characteristics in West Alto Bonito
Housing Structures in West Alto Bonito
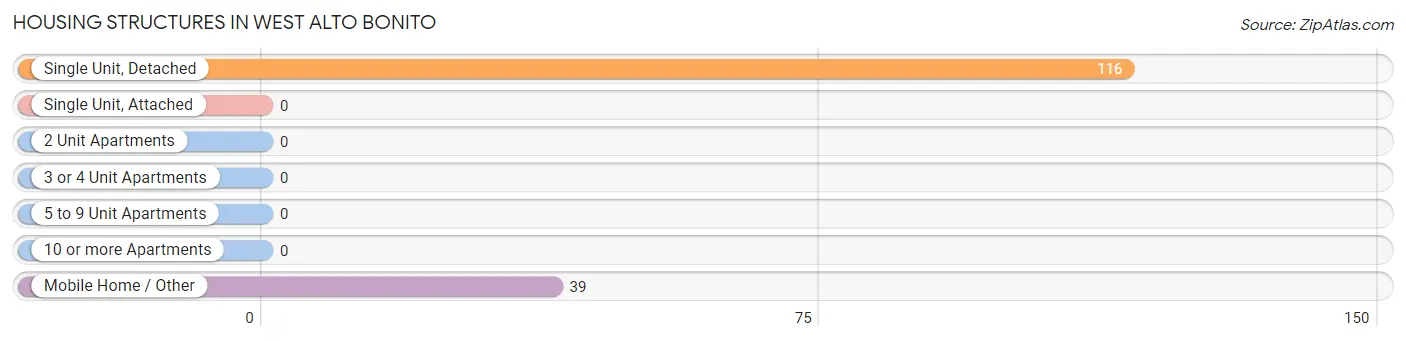
| Structure Type | # Housing Units | % Housing Units |
| Single Unit, Detached | 116 | 74.8% |
| Single Unit, Attached | 0 | 0.0% |
| 2 Unit Apartments | 0 | 0.0% |
| 3 or 4 Unit Apartments | 0 | 0.0% |
| 5 to 9 Unit Apartments | 0 | 0.0% |
| 10 or more Apartments | 0 | 0.0% |
| Mobile Home / Other | 39 | 25.2% |
| Total | 155 | 100.0% |
Housing Structures by Occupancy in West Alto Bonito
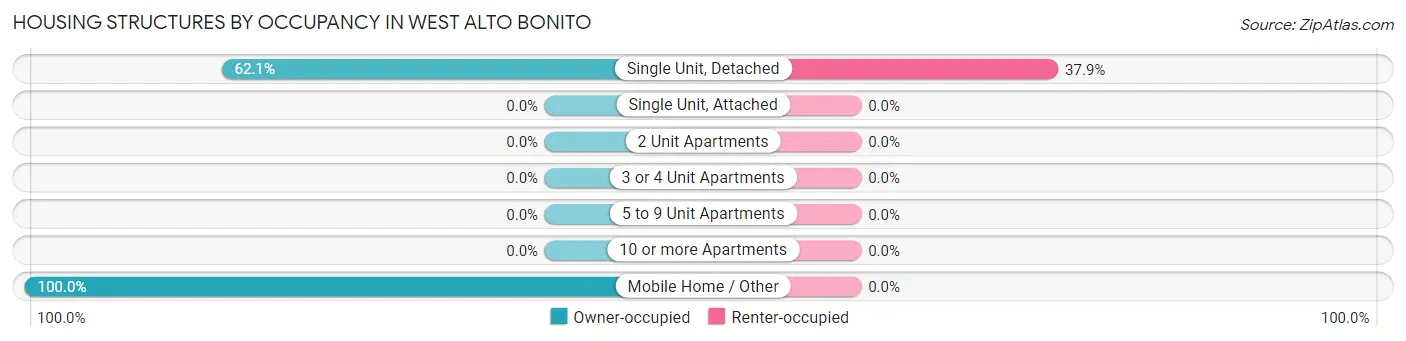
| Structure Type | Owner-occupied | Renter-occupied |
| Single Unit, Detached | 72 (62.1%) | 44 (37.9%) |
| Single Unit, Attached | 0 (0.0%) | 0 (0.0%) |
| 2 Unit Apartments | 0 (0.0%) | 0 (0.0%) |
| 3 or 4 Unit Apartments | 0 (0.0%) | 0 (0.0%) |
| 5 to 9 Unit Apartments | 0 (0.0%) | 0 (0.0%) |
| 10 or more Apartments | 0 (0.0%) | 0 (0.0%) |
| Mobile Home / Other | 39 (100.0%) | 0 (0.0%) |
| Total | 111 (71.6%) | 44 (28.4%) |
Housing Structures by Number of Rooms in West Alto Bonito
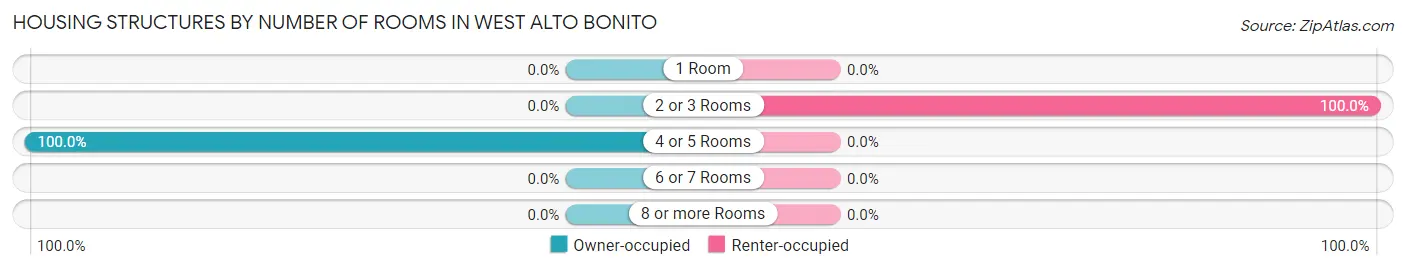
| Number of Rooms | Owner-occupied | Renter-occupied |
| 1 Room | 0 (0.0%) | 0 (0.0%) |
| 2 or 3 Rooms | 0 (0.0%) | 44 (100.0%) |
| 4 or 5 Rooms | 111 (100.0%) | 0 (0.0%) |
| 6 or 7 Rooms | 0 (0.0%) | 0 (0.0%) |
| 8 or more Rooms | 0 (0.0%) | 0 (0.0%) |
| Total | 111 (100.0%) | 44 (100.0%) |
Housing Structure by Heating Type in West Alto Bonito
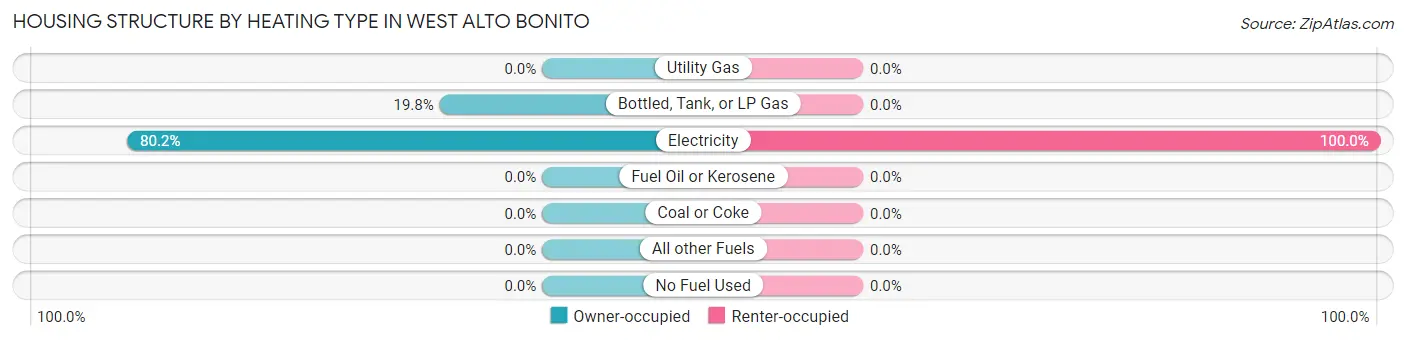
| Heating Type | Owner-occupied | Renter-occupied |
| Utility Gas | 0 (0.0%) | 0 (0.0%) |
| Bottled, Tank, or LP Gas | 22 (19.8%) | 0 (0.0%) |
| Electricity | 89 (80.2%) | 44 (100.0%) |
| Fuel Oil or Kerosene | 0 (0.0%) | 0 (0.0%) |
| Coal or Coke | 0 (0.0%) | 0 (0.0%) |
| All other Fuels | 0 (0.0%) | 0 (0.0%) |
| No Fuel Used | 0 (0.0%) | 0 (0.0%) |
| Total | 111 (100.0%) | 44 (100.0%) |
Household Vehicle Usage in West Alto Bonito
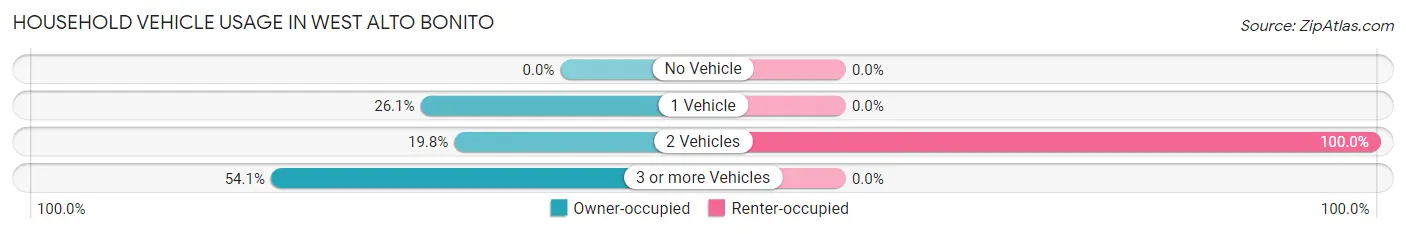
| Vehicles per Household | Owner-occupied | Renter-occupied |
| No Vehicle | 0 (0.0%) | 0 (0.0%) |
| 1 Vehicle | 29 (26.1%) | 0 (0.0%) |
| 2 Vehicles | 22 (19.8%) | 44 (100.0%) |
| 3 or more Vehicles | 60 (54.0%) | 0 (0.0%) |
| Total | 111 (100.0%) | 44 (100.0%) |
Real Estate & Mortgages in West Alto Bonito
Real Estate and Mortgage Overview in West Alto Bonito
| Characteristic | Without Mortgage | With Mortgage |
| Housing Units | 111 | 0 |
| Median Property Value | $38,900 | $0 |
| Median Household Income | $51,964 | $0 |
| Monthly Housing Costs | $384 | $0 |
| Real Estate Taxes | $557 | $0 |
Property Value by Mortgage Status in West Alto Bonito
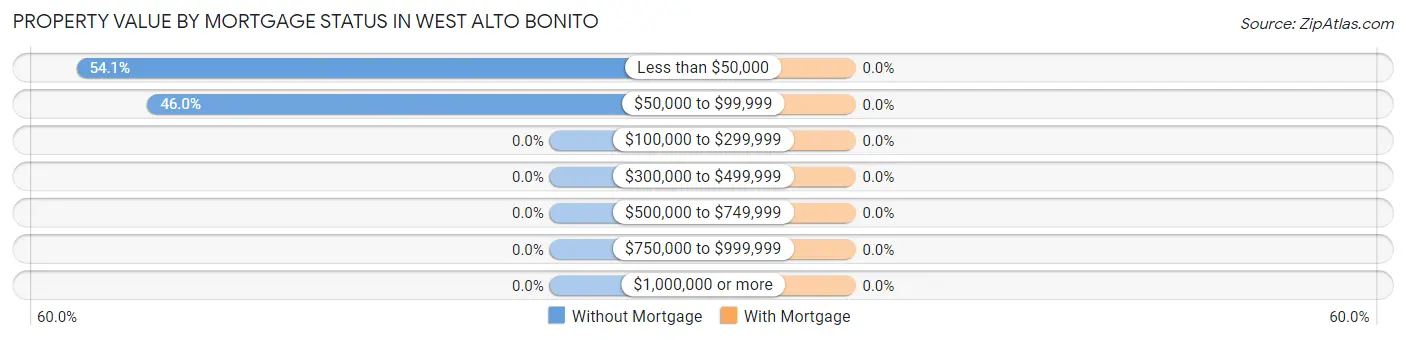
| Property Value | Without Mortgage | With Mortgage |
| Less than $50,000 | 60 (54.0%) | 0 (0.0%) |
| $50,000 to $99,999 | 51 (46.0%) | 0 (0.0%) |
| $100,000 to $299,999 | 0 (0.0%) | 0 (0.0%) |
| $300,000 to $499,999 | 0 (0.0%) | 0 (0.0%) |
| $500,000 to $749,999 | 0 (0.0%) | 0 (0.0%) |
| $750,000 to $999,999 | 0 (0.0%) | 0 (0.0%) |
| $1,000,000 or more | 0 (0.0%) | 0 (0.0%) |
| Total | 111 (100.0%) | 0 (0.0%) |
Household Income by Mortgage Status in West Alto Bonito
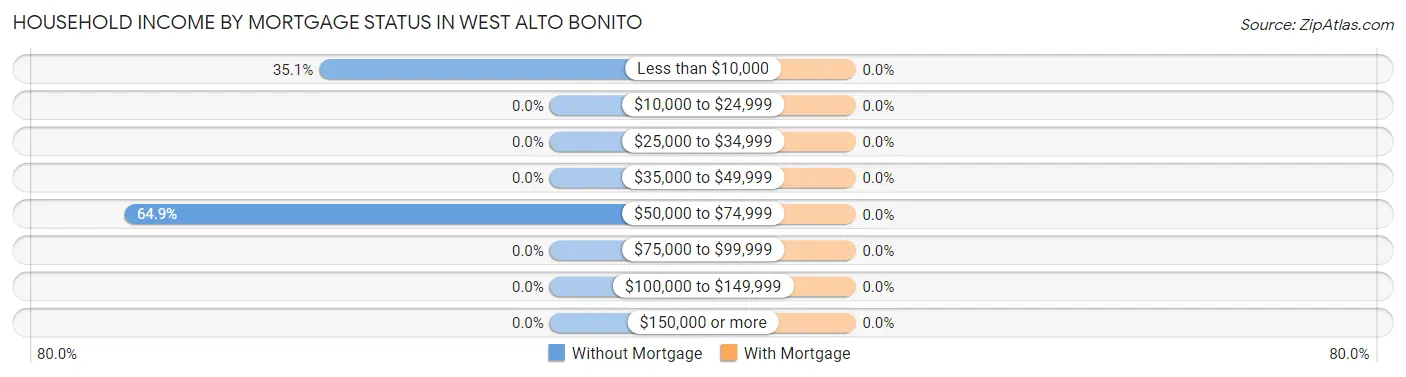
| Household Income | Without Mortgage | With Mortgage |
| Less than $10,000 | 39 (35.1%) | 0 (0.0%) |
| $10,000 to $24,999 | 0 (0.0%) | 0 (0.0%) |
| $25,000 to $34,999 | 0 (0.0%) | 0 (0.0%) |
| $35,000 to $49,999 | 0 (0.0%) | 0 (0.0%) |
| $50,000 to $74,999 | 72 (64.9%) | 0 (0.0%) |
| $75,000 to $99,999 | 0 (0.0%) | 0 (0.0%) |
| $100,000 to $149,999 | 0 (0.0%) | 0 (0.0%) |
| $150,000 or more | 0 (0.0%) | 0 (0.0%) |
| Total | 111 (100.0%) | 0 (0.0%) |
Property Value to Household Income Ratio in West Alto Bonito
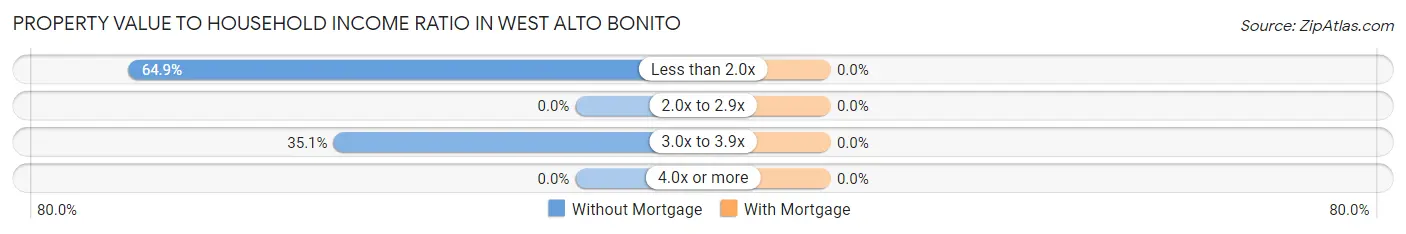
| Value-to-Income Ratio | Without Mortgage | With Mortgage |
| Less than 2.0x | 72 (64.9%) | 0 (0.0%) |
| 2.0x to 2.9x | 0 (0.0%) | 0 (0.0%) |
| 3.0x to 3.9x | 39 (35.1%) | 0 (0.0%) |
| 4.0x or more | 0 (0.0%) | 0 (0.0%) |
| Total | 111 (100.0%) | 0 (0.0%) |
Real Estate Taxes by Mortgage Status in West Alto Bonito
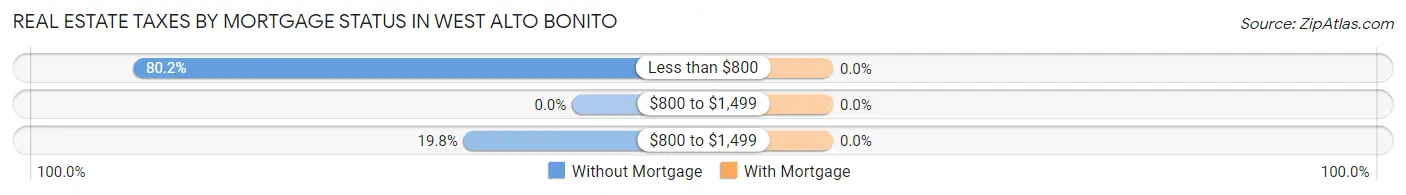
| Property Taxes | Without Mortgage | With Mortgage |
| Less than $800 | 89 (80.2%) | 0 (0.0%) |
| $800 to $1,499 | 0 (0.0%) | 0 (0.0%) |
| $800 to $1,499 | 22 (19.8%) | 0 (0.0%) |
| Total | 111 (100.0%) | 0 (0.0%) |
Health & Disability in West Alto Bonito
Health Insurance Coverage by Age in West Alto Bonito
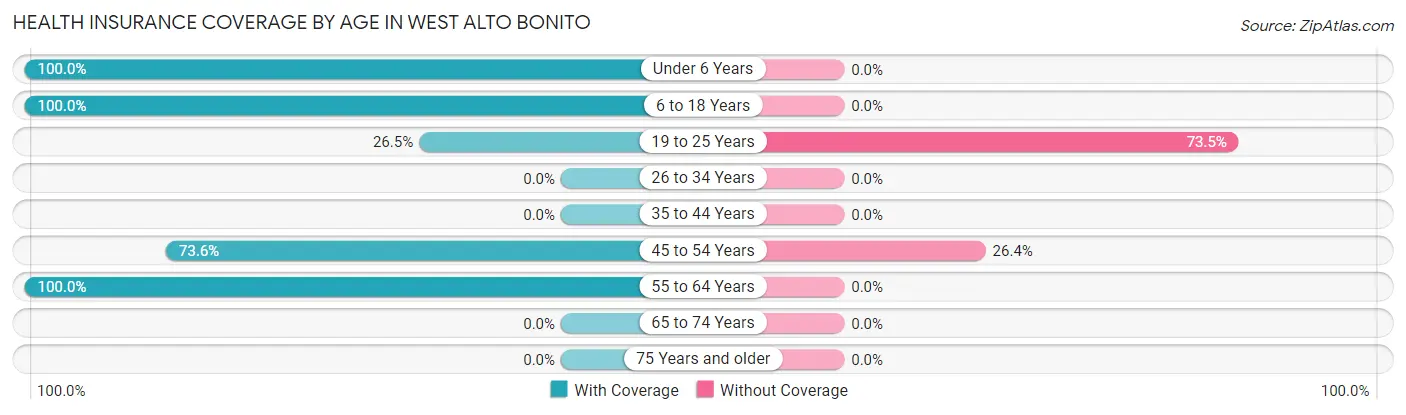
| Age Bracket | With Coverage | Without Coverage |
| Under 6 Years | 100 (100.0%) | 0 (0.0%) |
| 6 to 18 Years | 27 (100.0%) | 0 (0.0%) |
| 19 to 25 Years | 50 (26.5%) | 139 (73.5%) |
| 26 to 34 Years | 0 (0.0%) | 0 (0.0%) |
| 35 to 44 Years | 0 (0.0%) | 0 (0.0%) |
| 45 to 54 Years | 81 (73.6%) | 29 (26.4%) |
| 55 to 64 Years | 79 (100.0%) | 0 (0.0%) |
| 65 to 74 Years | 0 (0.0%) | 0 (0.0%) |
| 75 Years and older | 0 (0.0%) | 0 (0.0%) |
| Total | 337 (66.7%) | 168 (33.3%) |
Health Insurance Coverage by Citizenship Status in West Alto Bonito
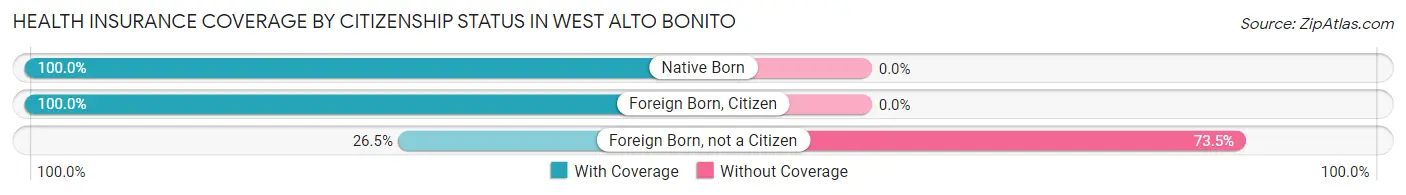
| Citizenship Status | With Coverage | Without Coverage |
| Native Born | 100 (100.0%) | 0 (0.0%) |
| Foreign Born, Citizen | 27 (100.0%) | 0 (0.0%) |
| Foreign Born, not a Citizen | 50 (26.5%) | 139 (73.5%) |
Health Insurance Coverage by Household Income in West Alto Bonito
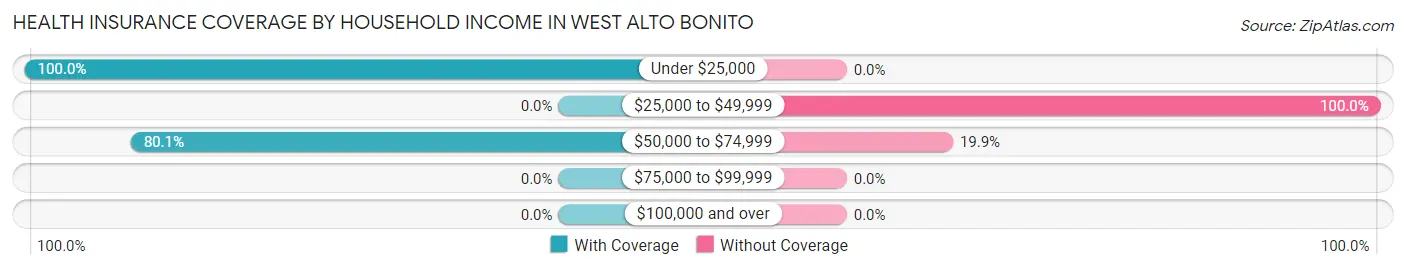
| Household Income | With Coverage | Without Coverage |
| Under $25,000 | 39 (100.0%) | 0 (0.0%) |
| $25,000 to $49,999 | 0 (0.0%) | 94 (100.0%) |
| $50,000 to $74,999 | 298 (80.1%) | 74 (19.9%) |
| $75,000 to $99,999 | 0 (0.0%) | 0 (0.0%) |
| $100,000 and over | 0 (0.0%) | 0 (0.0%) |
Public vs Private Health Insurance Coverage by Age in West Alto Bonito
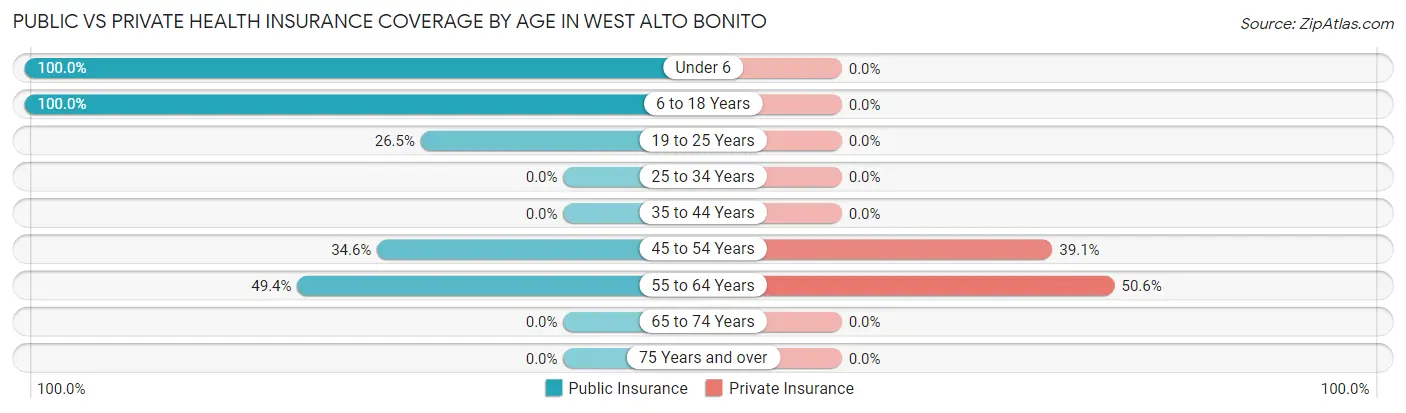
| Age Bracket | Public Insurance | Private Insurance |
| Under 6 | 100 (100.0%) | 0 (0.0%) |
| 6 to 18 Years | 27 (100.0%) | 0 (0.0%) |
| 19 to 25 Years | 50 (26.5%) | 0 (0.0%) |
| 25 to 34 Years | 0 (0.0%) | 0 (0.0%) |
| 35 to 44 Years | 0 (0.0%) | 0 (0.0%) |
| 45 to 54 Years | 38 (34.5%) | 43 (39.1%) |
| 55 to 64 Years | 39 (49.4%) | 40 (50.6%) |
| 65 to 74 Years | 0 (0.0%) | 0 (0.0%) |
| 75 Years and over | 0 (0.0%) | 0 (0.0%) |
| Total | 254 (50.3%) | 83 (16.4%) |
Disability Status by Sex by Age in West Alto Bonito
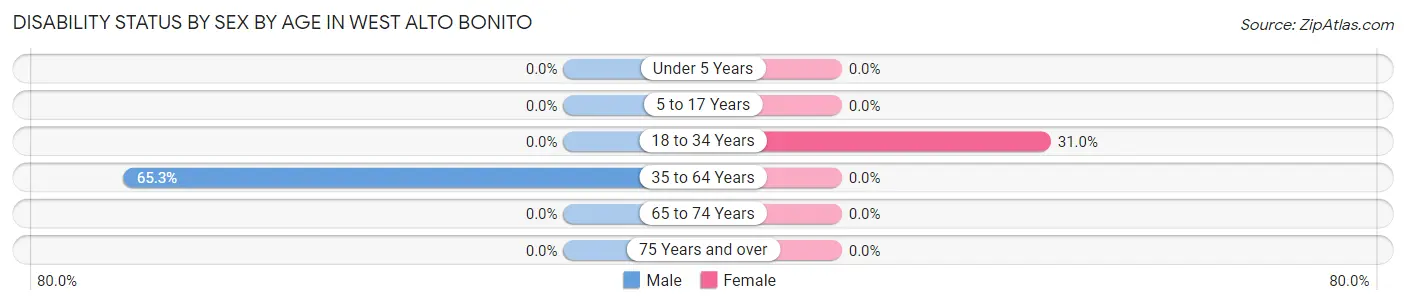
| Age Bracket | Male | Female |
| Under 5 Years | 0 (0.0%) | 0 (0.0%) |
| 5 to 17 Years | 0 (0.0%) | 0 (0.0%) |
| 18 to 34 Years | 0 (0.0%) | 45 (31.0%) |
| 35 to 64 Years | 77 (65.2%) | 0 (0.0%) |
| 65 to 74 Years | 0 (0.0%) | 0 (0.0%) |
| 75 Years and over | 0 (0.0%) | 0 (0.0%) |
Disability Class by Sex by Age in West Alto Bonito
Disability Class: Hearing Difficulty
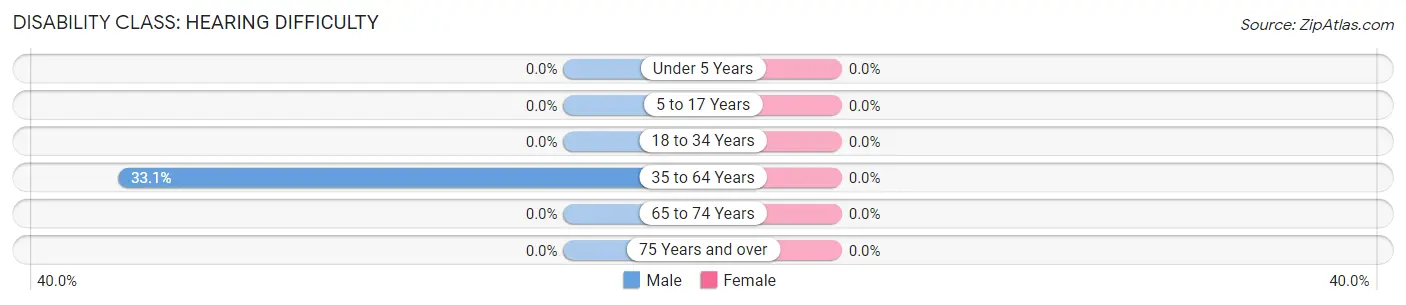
| Age Bracket | Male | Female |
| Under 5 Years | 0 (0.0%) | 0 (0.0%) |
| 5 to 17 Years | 0 (0.0%) | 0 (0.0%) |
| 18 to 34 Years | 0 (0.0%) | 0 (0.0%) |
| 35 to 64 Years | 39 (33.1%) | 0 (0.0%) |
| 65 to 74 Years | 0 (0.0%) | 0 (0.0%) |
| 75 Years and over | 0 (0.0%) | 0 (0.0%) |
Disability Class: Vision Difficulty
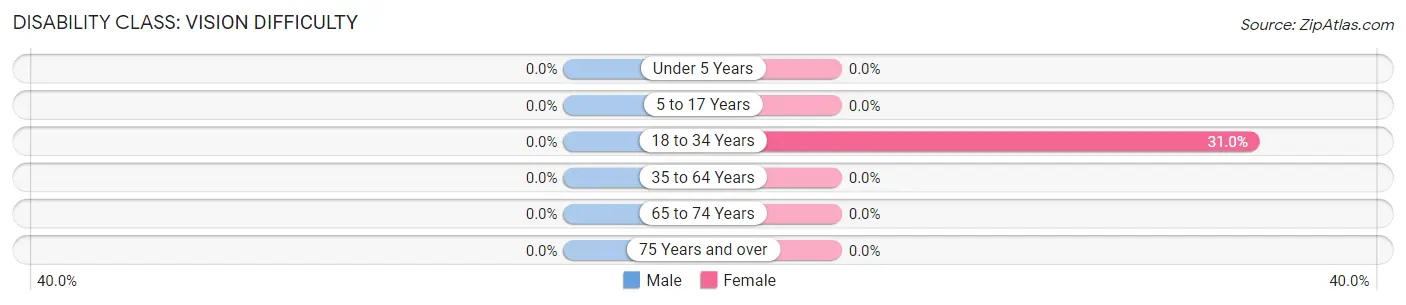
| Age Bracket | Male | Female |
| Under 5 Years | 0 (0.0%) | 0 (0.0%) |
| 5 to 17 Years | 0 (0.0%) | 0 (0.0%) |
| 18 to 34 Years | 0 (0.0%) | 45 (31.0%) |
| 35 to 64 Years | 0 (0.0%) | 0 (0.0%) |
| 65 to 74 Years | 0 (0.0%) | 0 (0.0%) |
| 75 Years and over | 0 (0.0%) | 0 (0.0%) |
Disability Class: Cognitive Difficulty
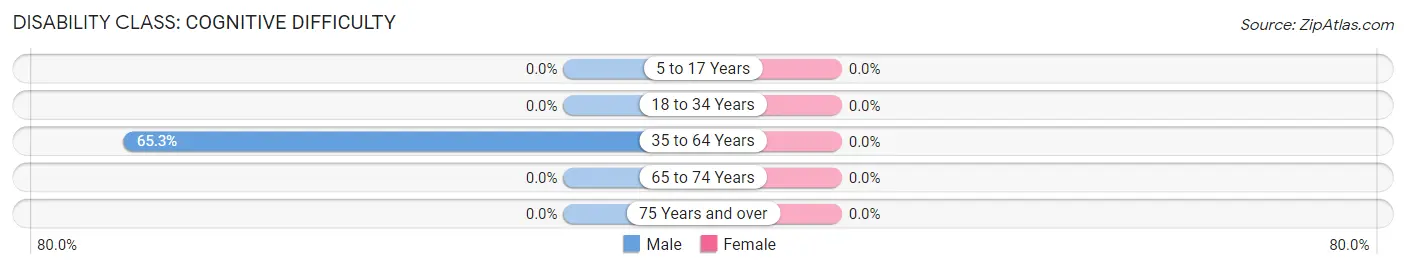
| Age Bracket | Male | Female |
| 5 to 17 Years | 0 (0.0%) | 0 (0.0%) |
| 18 to 34 Years | 0 (0.0%) | 0 (0.0%) |
| 35 to 64 Years | 77 (65.2%) | 0 (0.0%) |
| 65 to 74 Years | 0 (0.0%) | 0 (0.0%) |
| 75 Years and over | 0 (0.0%) | 0 (0.0%) |
Disability Class: Ambulatory Difficulty
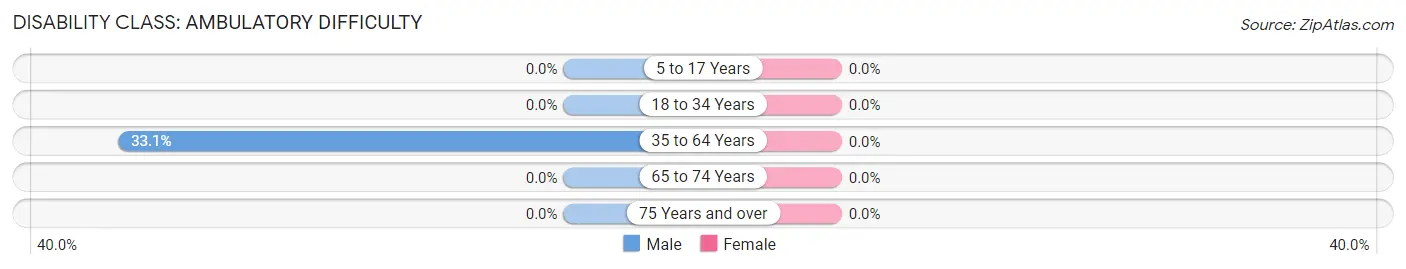
| Age Bracket | Male | Female |
| 5 to 17 Years | 0 (0.0%) | 0 (0.0%) |
| 18 to 34 Years | 0 (0.0%) | 0 (0.0%) |
| 35 to 64 Years | 39 (33.1%) | 0 (0.0%) |
| 65 to 74 Years | 0 (0.0%) | 0 (0.0%) |
| 75 Years and over | 0 (0.0%) | 0 (0.0%) |
Disability Class: Self-Care Difficulty
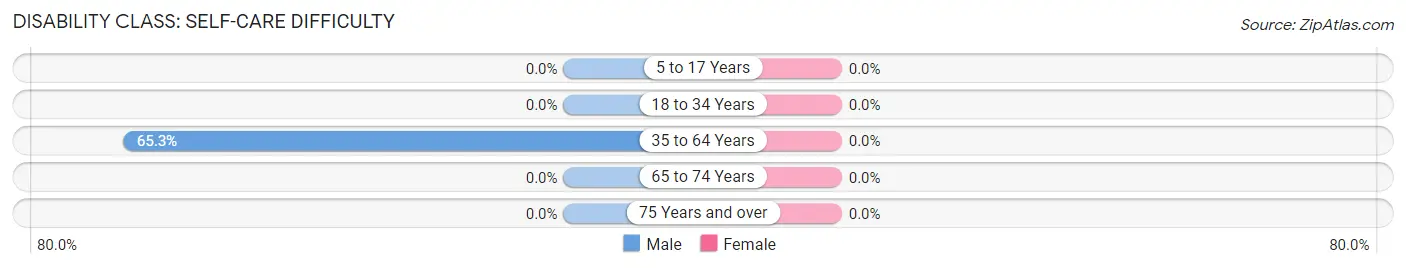
| Age Bracket | Male | Female |
| 5 to 17 Years | 0 (0.0%) | 0 (0.0%) |
| 18 to 34 Years | 0 (0.0%) | 0 (0.0%) |
| 35 to 64 Years | 77 (65.2%) | 0 (0.0%) |
| 65 to 74 Years | 0 (0.0%) | 0 (0.0%) |
| 75 Years and over | 0 (0.0%) | 0 (0.0%) |
Technology Access in West Alto Bonito
Computing Device Access in West Alto Bonito
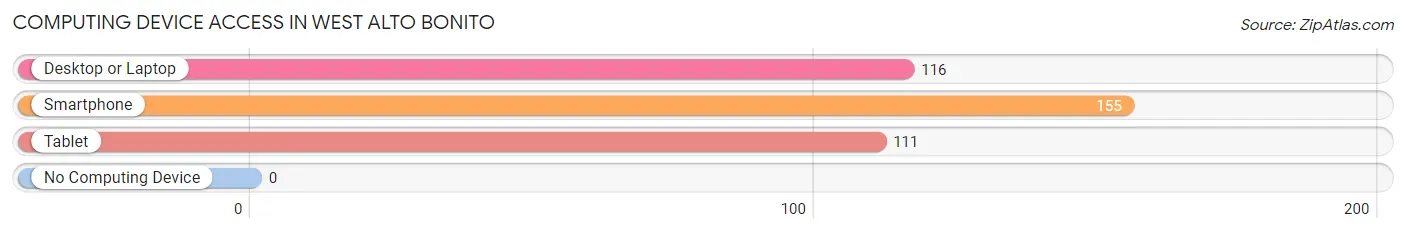
| Device Type | # Households | % Households |
| Desktop or Laptop | 116 | 74.8% |
| Smartphone | 155 | 100.0% |
| Tablet | 111 | 71.6% |
| No Computing Device | 0 | 0.0% |
| Total | 155 | 100.0% |
Internet Access in West Alto Bonito
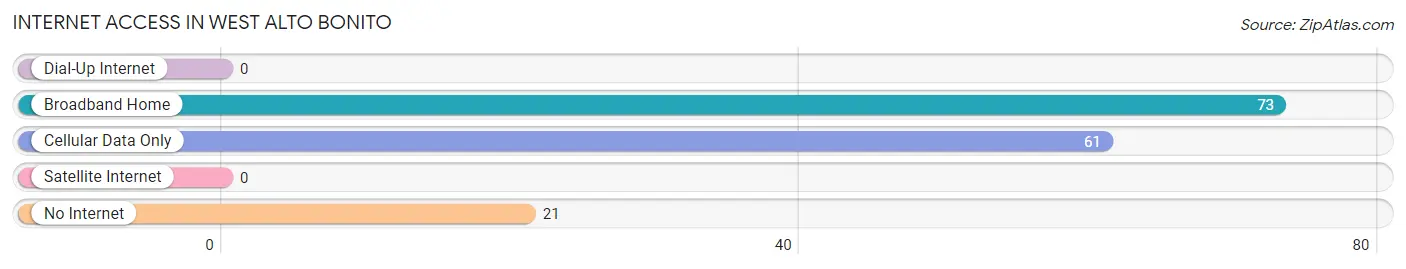
| Internet Type | # Households | % Households |
| Dial-Up Internet | 0 | 0.0% |
| Broadband Home | 73 | 47.1% |
| Cellular Data Only | 61 | 39.4% |
| Satellite Internet | 0 | 0.0% |
| No Internet | 21 | 13.6% |
| Total | 155 | 100.0% |
West Alto Bonito Summary
History
West Alto Bonito is a small unincorporated community located in Starr County, Texas. It is situated on the banks of the Rio Grande, just south of the city of Rio Grande City. The area was first settled in the late 1800s by Mexican and Tejano settlers, who were attracted to the fertile land and abundant water sources. The community was originally known as Alto Bonito, but the name was changed to West Alto Bonito in the early 1900s to distinguish it from the nearby town of Alto Bonito.
The area was largely agricultural, with the main crops being cotton, corn, and sorghum. The community also had a small number of businesses, including a general store, a blacksmith shop, and a saloon. In the early 1900s, the area was also home to a number of ranches, which raised cattle and horses.
In the 1920s, the area began to experience a population boom as a result of the oil boom in nearby Mexico. This influx of people brought with it a number of new businesses, including a bank, a movie theater, and a hotel. The population continued to grow throughout the 1930s and 1940s, and by the 1950s, the area had become a bustling small town.
Geography
West Alto Bonito is located in Starr County, Texas, on the banks of the Rio Grande. It is situated just south of the city of Rio Grande City, and is approximately 25 miles from the Mexican border. The area is characterized by flat, open terrain, with the Rio Grande providing a natural border to the south. The climate is semi-arid, with hot summers and mild winters.
Economy
West Alto Bonito is a largely agricultural community, with the main crops being cotton, corn, and sorghum. The area also has a number of small businesses, including a general store, a blacksmith shop, and a saloon. In recent years, the area has seen an influx of new businesses, including a bank, a movie theater, and a hotel.
Demographics
As of the 2010 census, the population of West Alto Bonito was 1,845. The population is predominantly Hispanic, with over 95% of the population identifying as such. The median household income is $25,000, and the median age is 33. The area is largely rural, with over 90% of the population living in rural areas.
Common Questions
What is Per Capita Income in West Alto Bonito?
Per Capita income in West Alto Bonito is $13,186.
What is the Median Family Income in West Alto Bonito?
Median Family Income in West Alto Bonito is $53,793.
What is the Median Household income in West Alto Bonito?
Median Household Income in West Alto Bonito is $39,688.
What is Income or Wage Gap in West Alto Bonito?
Income or Wage Gap in West Alto Bonito is 54.0%.
Women in West Alto Bonito earn 46.0 cents for every dollar earned by a man.
What is Inequality or Gini Index in West Alto Bonito?
Inequality or Gini Index in West Alto Bonito is 0.29.
What is the Total Population of West Alto Bonito?
Total Population of West Alto Bonito is 505.
What is the Total Male Population of West Alto Bonito?
Total Male Population of West Alto Bonito is 240.
What is the Total Female Population of West Alto Bonito?
Total Female Population of West Alto Bonito is 265.
What is the Ratio of Males per 100 Females in West Alto Bonito?
There are 90.57 Males per 100 Females in West Alto Bonito.
What is the Ratio of Females per 100 Males in West Alto Bonito?
There are 110.42 Females per 100 Males in West Alto Bonito.
What is the Median Population Age in West Alto Bonito?
Median Population Age in West Alto Bonito is 21.3 Years.
What is the Average Family Size in West Alto Bonito
Average Family Size in West Alto Bonito is 5.2 People.
What is the Average Household Size in West Alto Bonito
Average Household Size in West Alto Bonito is 3.3 People.
How Large is the Labor Force in West Alto Bonito?
There are 251 People in the Labor Forcein in West Alto Bonito.
What is the Percentage of People in the Labor Force in West Alto Bonito?
62.0% of People are in the Labor Force in West Alto Bonito.
What is the Unemployment Rate in West Alto Bonito?
Unemployment Rate in West Alto Bonito is 37.5%.