Stagecoach, TX Map & Demographics
Stagecoach Map
Stagecoach Overview
$45,304
PER CAPITA INCOME
$113,229
AVG FAMILY INCOME
$109,107
AVG HOUSEHOLD INCOME
2.4%
WAGE / INCOME GAP [ % ]
97.6¢/ $1
WAGE / INCOME GAP [ $ ]
0.37
INEQUALITY / GINI INDEX
554
TOTAL POPULATION
296
MALE POPULATION
258
FEMALE POPULATION
114.73
MALES / 100 FEMALES
87.16
FEMALES / 100 MALES
53.0
MEDIAN AGE
3.2
AVG FAMILY SIZE
2.7
AVG HOUSEHOLD SIZE
240
LABOR FORCE [ PEOPLE ]
52.5%
PERCENT IN LABOR FORCE
4.6%
UNEMPLOYMENT RATE
Stagecoach Area Codes
Income in Stagecoach
Income Overview in Stagecoach
Per Capita Income in Stagecoach is $45,304, while median incomes of families and households are $113,229 and $109,107 respectively.
| Characteristic | Number | Measure |
| Per Capita Income | 554 | $45,304 |
| Median Family Income | 161 | $113,229 |
| Mean Family Income | 161 | $140,310 |
| Median Household Income | 203 | $109,107 |
| Mean Household Income | 203 | $126,647 |
| Income Deficit | 161 | $0 |
| Wage / Income Gap (%) | 554 | 2.35% |
| Wage / Income Gap ($) | 554 | 97.65¢ per $1 |
| Gini / Inequality Index | 554 | 0.37 |
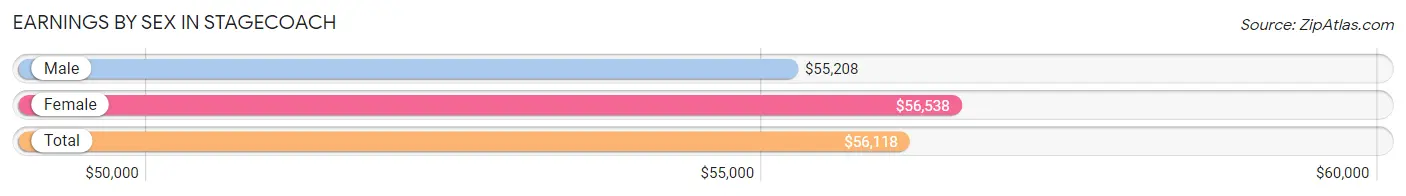
Earnings by Sex in Stagecoach
Average Earnings in Stagecoach are $56,118, $55,208 for men and $56,538 for women, a difference of 2.4%.
| Sex | Number | Average Earnings |
| Male | 137 (53.3%) | $55,208 |
| Female | 120 (46.7%) | $56,538 |
| Total | 257 (100.0%) | $56,118 |
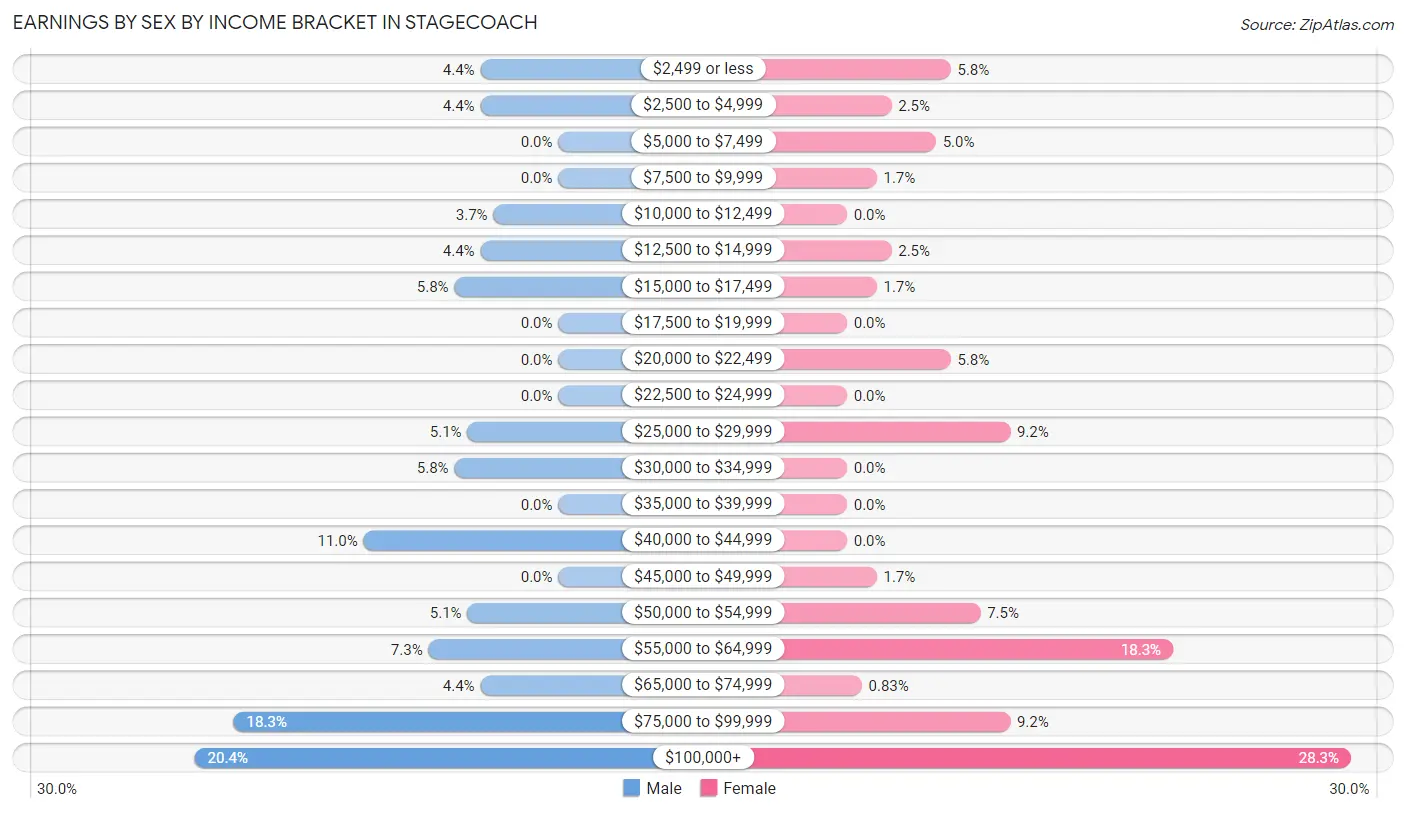
Earnings by Sex by Income Bracket in Stagecoach
The most common earnings brackets in Stagecoach are $100,000+ for men (28 | 20.4%) and $100,000+ for women (34 | 28.3%).
| Income | Male | Female |
| $2,499 or less | 6 (4.4%) | 7 (5.8%) |
| $2,500 to $4,999 | 6 (4.4%) | 3 (2.5%) |
| $5,000 to $7,499 | 0 (0.0%) | 6 (5.0%) |
| $7,500 to $9,999 | 0 (0.0%) | 2 (1.7%) |
| $10,000 to $12,499 | 5 (3.6%) | 0 (0.0%) |
| $12,500 to $14,999 | 6 (4.4%) | 3 (2.5%) |
| $15,000 to $17,499 | 8 (5.8%) | 2 (1.7%) |
| $17,500 to $19,999 | 0 (0.0%) | 0 (0.0%) |
| $20,000 to $22,499 | 0 (0.0%) | 7 (5.8%) |
| $22,500 to $24,999 | 0 (0.0%) | 0 (0.0%) |
| $25,000 to $29,999 | 7 (5.1%) | 11 (9.2%) |
| $30,000 to $34,999 | 8 (5.8%) | 0 (0.0%) |
| $35,000 to $39,999 | 0 (0.0%) | 0 (0.0%) |
| $40,000 to $44,999 | 15 (11.0%) | 0 (0.0%) |
| $45,000 to $49,999 | 0 (0.0%) | 2 (1.7%) |
| $50,000 to $54,999 | 7 (5.1%) | 9 (7.5%) |
| $55,000 to $64,999 | 10 (7.3%) | 22 (18.3%) |
| $65,000 to $74,999 | 6 (4.4%) | 1 (0.8%) |
| $75,000 to $99,999 | 25 (18.2%) | 11 (9.2%) |
| $100,000+ | 28 (20.4%) | 34 (28.3%) |
| Total | 137 (100.0%) | 120 (100.0%) |
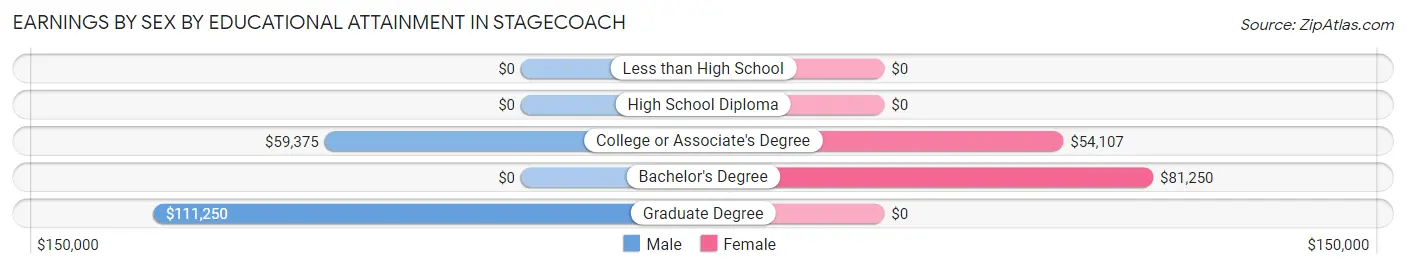
Earnings by Sex by Educational Attainment in Stagecoach
Average earnings in Stagecoach are $57,292 for men and $56,538 for women, a difference of 1.3%. Men with an educational attainment of graduate degree enjoy the highest average annual earnings of $111,250, while those with college or associate's degree education earn the least with $59,375. Women with an educational attainment of bachelor's degree earn the most with the average annual earnings of $81,250, while those with college or associate's degree education have the smallest earnings of $54,107.
| Educational Attainment | Male Income | Female Income |
| Less than High School | - | - |
| High School Diploma | - | - |
| College or Associate's Degree | $59,375 | $54,107 |
| Bachelor's Degree | - | - |
| Graduate Degree | $111,250 | $0 |
| Total | $57,292 | $56,538 |
Family Income in Stagecoach
Family Income Brackets in Stagecoach
According to the Stagecoach family income data, there are 52 families falling into the $100,000 to $149,999 income range, which is the most common income bracket and makes up 32.3% of all families.
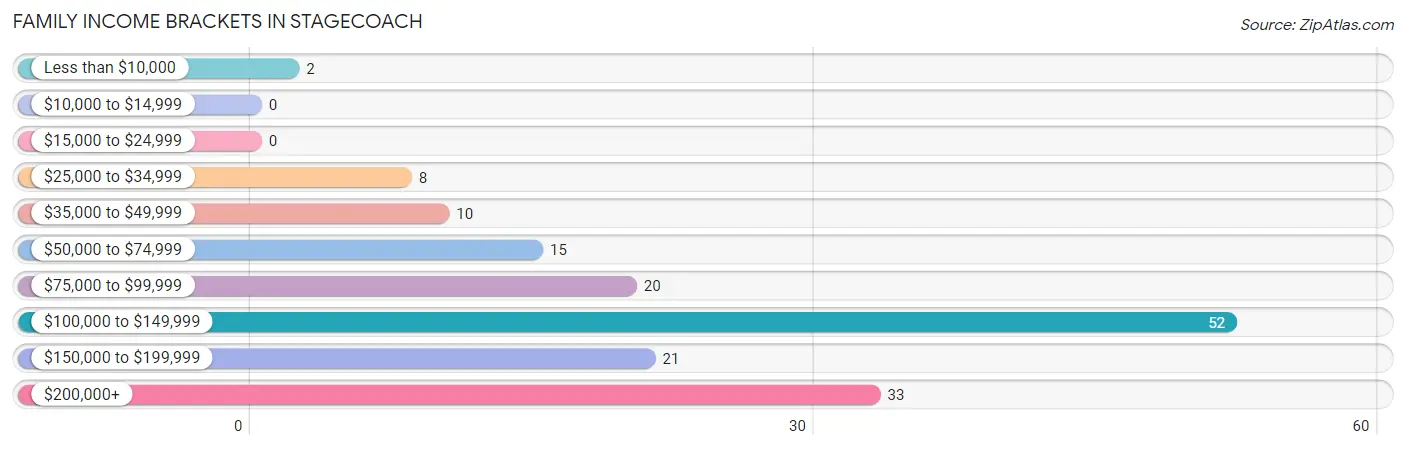
| Income Bracket | # Families | % Families |
| Less than $10,000 | 2 | 1.2% |
| $10,000 to $14,999 | 0 | 0.0% |
| $15,000 to $24,999 | 0 | 0.0% |
| $25,000 to $34,999 | 8 | 5.0% |
| $35,000 to $49,999 | 10 | 6.2% |
| $50,000 to $74,999 | 15 | 9.3% |
| $75,000 to $99,999 | 20 | 12.4% |
| $100,000 to $149,999 | 52 | 32.3% |
| $150,000 to $199,999 | 21 | 13.0% |
| $200,000+ | 33 | 20.5% |
Family Income by Famaliy Size in Stagecoach
5-person families (12 | 7.4%) account for the highest median family income in Stagecoach with $173,750 per family, while 2-person families (92 | 57.1%) have the highest median income of $58,750 per family member.
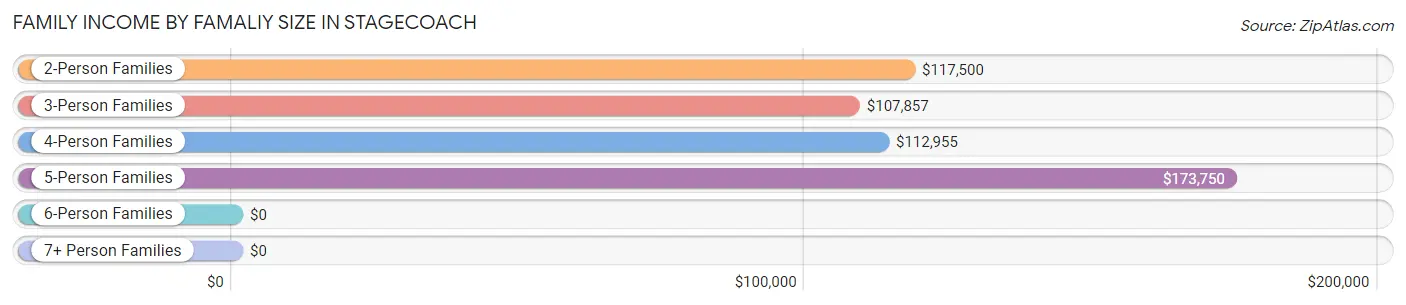
| Income Bracket | # Families | Median Income |
| 2-Person Families | 92 (57.1%) | $117,500 |
| 3-Person Families | 22 (13.7%) | $107,857 |
| 4-Person Families | 20 (12.4%) | $112,955 |
| 5-Person Families | 12 (7.4%) | $173,750 |
| 6-Person Families | 5 (3.1%) | $0 |
| 7+ Person Families | 10 (6.2%) | $0 |
| Total | 161 (100.0%) | $113,229 |
Family Income by Number of Earners in Stagecoach
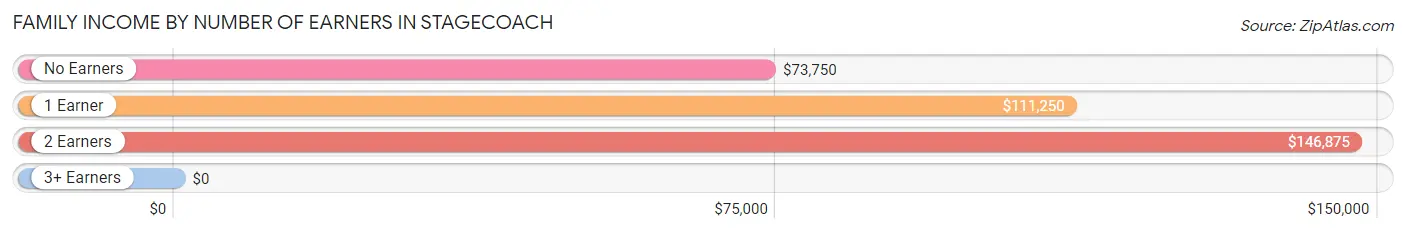
| Number of Earners | # Families | Median Income |
| No Earners | 31 (19.3%) | $73,750 |
| 1 Earner | 45 (28.0%) | $111,250 |
| 2 Earners | 67 (41.6%) | $146,875 |
| 3+ Earners | 18 (11.2%) | $0 |
| Total | 161 (100.0%) | $113,229 |
Household Income in Stagecoach
Household Income Brackets in Stagecoach
With 55 households falling in the category, the $100,000 to $149,999 income range is the most frequent in Stagecoach, accounting for 27.1% of all households. In contrast, only 2 households (1.0%) fall into the less than $10,000 income bracket, making it the least populous group.
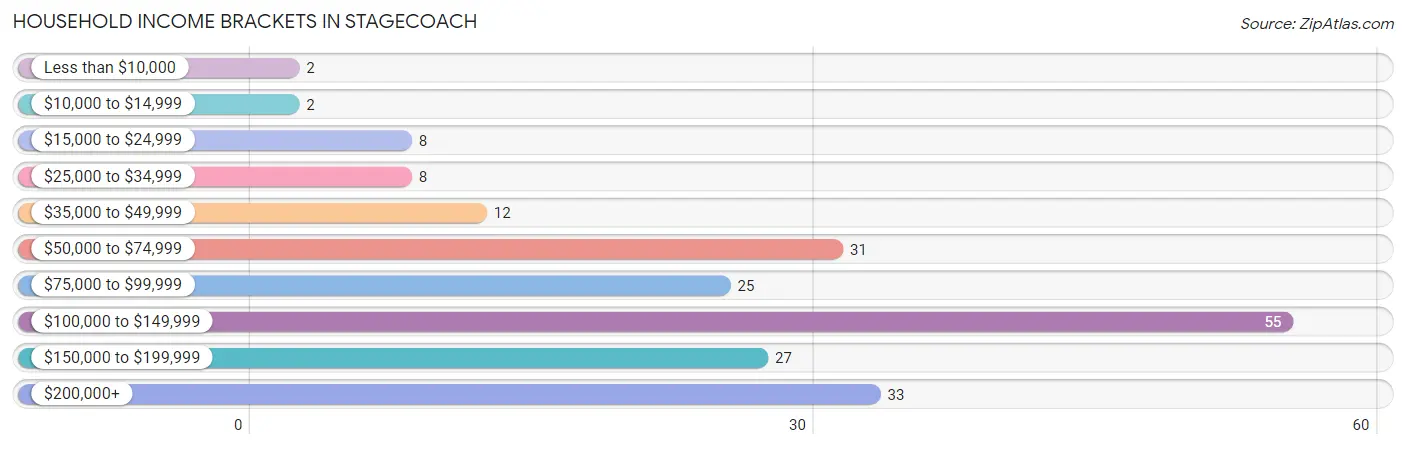
| Income Bracket | # Households | % Households |
| Less than $10,000 | 2 | 1.0% |
| $10,000 to $14,999 | 2 | 1.0% |
| $15,000 to $24,999 | 8 | 3.9% |
| $25,000 to $34,999 | 8 | 3.9% |
| $35,000 to $49,999 | 12 | 5.9% |
| $50,000 to $74,999 | 31 | 15.3% |
| $75,000 to $99,999 | 25 | 12.3% |
| $100,000 to $149,999 | 55 | 27.1% |
| $150,000 to $199,999 | 27 | 13.3% |
| $200,000+ | 33 | 16.3% |
Household Income by Householder Age in Stagecoach
The median household income in Stagecoach is $109,107, with the highest median household income of $153,750 found in the 25 to 44 years age bracket for the primary householder. A total of 20 households (9.9%) fall into this category.
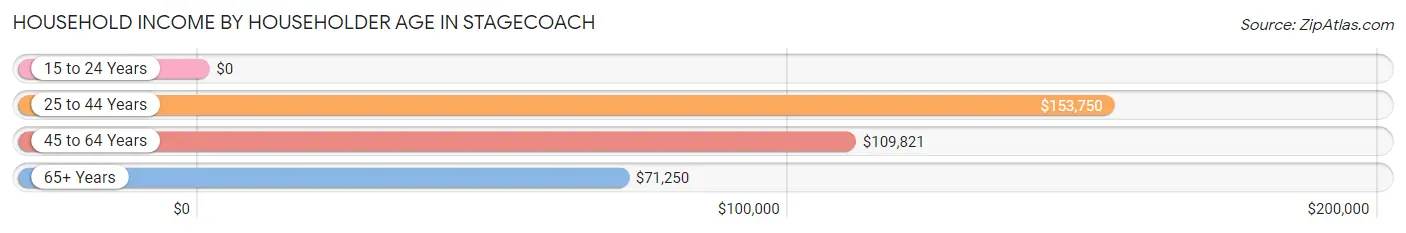
| Income Bracket | # Households | Median Income |
| 15 to 24 Years | 0 (0.0%) | $0 |
| 25 to 44 Years | 20 (9.9%) | $153,750 |
| 45 to 64 Years | 105 (51.7%) | $109,821 |
| 65+ Years | 78 (38.4%) | $71,250 |
| Total | 203 (100.0%) | $109,107 |
Poverty in Stagecoach
Income Below Poverty by Sex and Age in Stagecoach
With 2.0% poverty level for males and 10.1% for females among the residents of Stagecoach, 75 year old and over males and 75 year old and over females are the most vulnerable to poverty, with 2 males (7.1%) and 18 females (40.0%) in their respective age groups living below the poverty level.
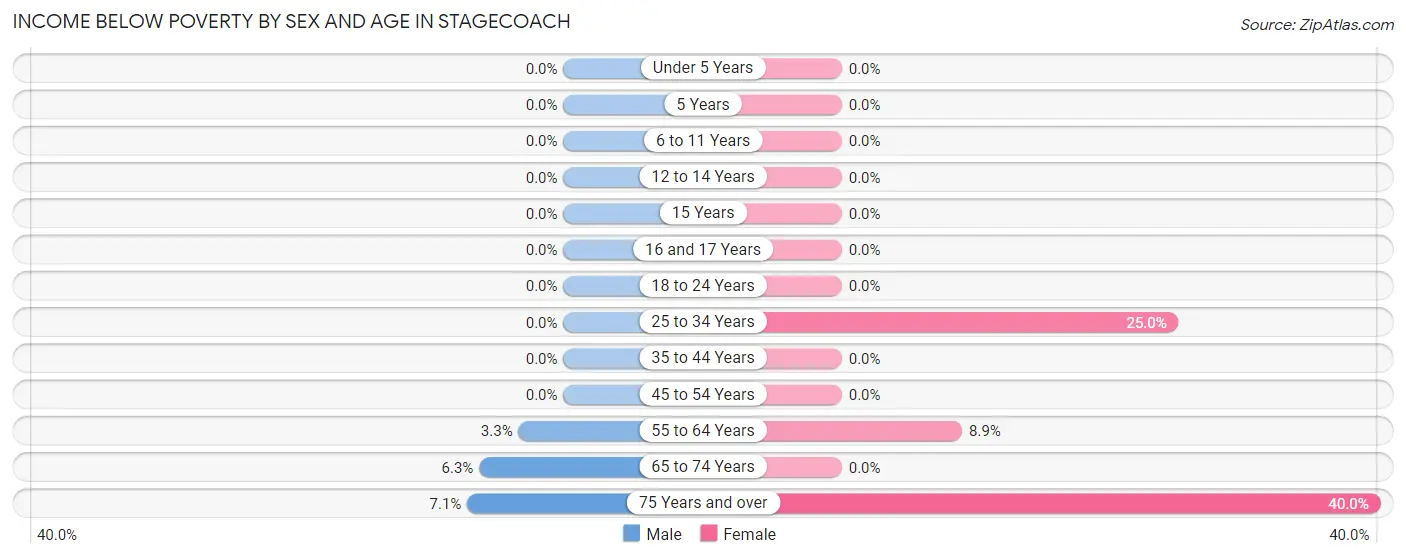
| Age Bracket | Male | Female |
| Under 5 Years | 0 (0.0%) | 0 (0.0%) |
| 5 Years | 0 (0.0%) | 0 (0.0%) |
| 6 to 11 Years | 0 (0.0%) | 0 (0.0%) |
| 12 to 14 Years | 0 (0.0%) | 0 (0.0%) |
| 15 Years | 0 (0.0%) | 0 (0.0%) |
| 16 and 17 Years | 0 (0.0%) | 0 (0.0%) |
| 18 to 24 Years | 0 (0.0%) | 0 (0.0%) |
| 25 to 34 Years | 0 (0.0%) | 3 (25.0%) |
| 35 to 44 Years | 0 (0.0%) | 0 (0.0%) |
| 45 to 54 Years | 0 (0.0%) | 0 (0.0%) |
| 55 to 64 Years | 2 (3.3%) | 5 (8.9%) |
| 65 to 74 Years | 2 (6.2%) | 0 (0.0%) |
| 75 Years and over | 2 (7.1%) | 18 (40.0%) |
| Total | 6 (2.0%) | 26 (10.1%) |
Income Above Poverty by Sex and Age in Stagecoach
According to the poverty statistics in Stagecoach, males aged under 5 years and females aged 6 to 11 years are the age groups that are most secure financially, with 100.0% of males and 100.0% of females in these age groups living above the poverty line.
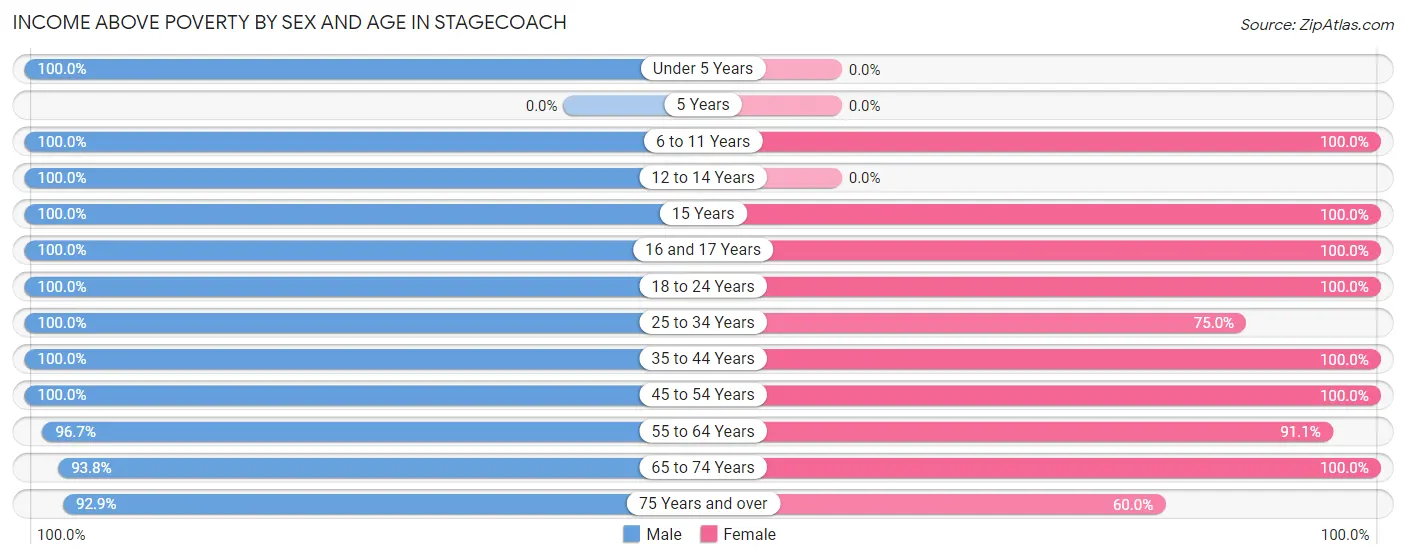
| Age Bracket | Male | Female |
| Under 5 Years | 16 (100.0%) | 0 (0.0%) |
| 5 Years | 0 (0.0%) | 0 (0.0%) |
| 6 to 11 Years | 23 (100.0%) | 26 (100.0%) |
| 12 to 14 Years | 21 (100.0%) | 0 (0.0%) |
| 15 Years | 9 (100.0%) | 2 (100.0%) |
| 16 and 17 Years | 16 (100.0%) | 12 (100.0%) |
| 18 to 24 Years | 19 (100.0%) | 3 (100.0%) |
| 25 to 34 Years | 9 (100.0%) | 9 (75.0%) |
| 35 to 44 Years | 27 (100.0%) | 16 (100.0%) |
| 45 to 54 Years | 36 (100.0%) | 61 (100.0%) |
| 55 to 64 Years | 58 (96.7%) | 51 (91.1%) |
| 65 to 74 Years | 30 (93.8%) | 25 (100.0%) |
| 75 Years and over | 26 (92.9%) | 27 (60.0%) |
| Total | 290 (98.0%) | 232 (89.9%) |
Income Below Poverty Among Married-Couple Families in Stagecoach
The poverty statistics for married-couple families in Stagecoach show that 3.0% or 4 of the total 135 families live below the poverty line. Families with no children have the highest poverty rate of 4.1%, comprising of 4 families. On the other hand, families with 1 or 2 children have the lowest poverty rate of 0.0%, which includes 0 families.
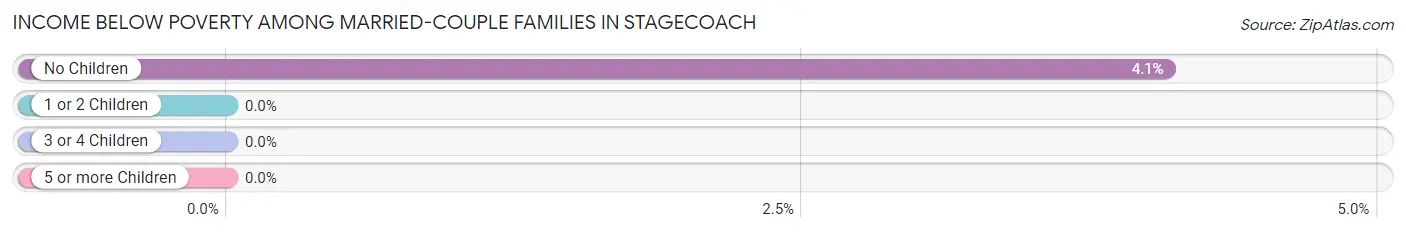
| Children | Above Poverty | Below Poverty |
| No Children | 94 (95.9%) | 4 (4.1%) |
| 1 or 2 Children | 17 (100.0%) | 0 (0.0%) |
| 3 or 4 Children | 20 (100.0%) | 0 (0.0%) |
| 5 or more Children | 0 (0.0%) | 0 (0.0%) |
| Total | 131 (97.0%) | 4 (3.0%) |
Income Below Poverty Among Single-Parent Households in Stagecoach
| Children | Single Father | Single Mother |
| No Children | 0 (0.0%) | 0 (0.0%) |
| 1 or 2 Children | 0 (0.0%) | 0 (0.0%) |
| 3 or 4 Children | 0 (0.0%) | 0 (0.0%) |
| 5 or more Children | 0 (0.0%) | 0 (0.0%) |
| Total | 0 (0.0%) | 0 (0.0%) |
Income Below Poverty Among Married-Couple vs Single-Parent Households in Stagecoach
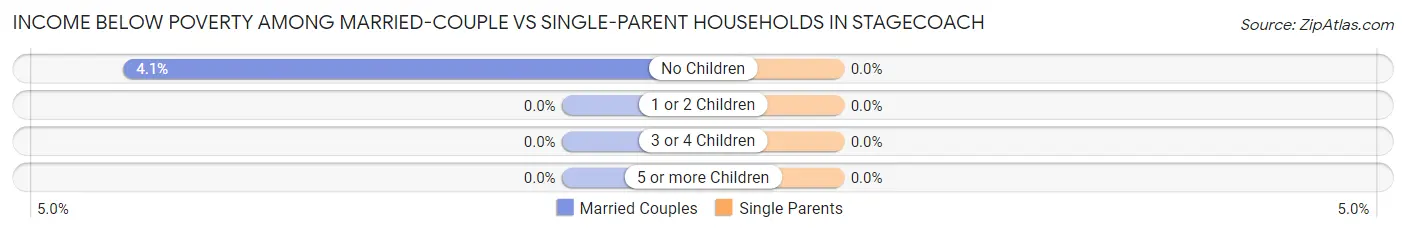
| Children | Married-Couple Families | Single-Parent Households |
| No Children | 4 (4.1%) | 0 (0.0%) |
| 1 or 2 Children | 0 (0.0%) | 0 (0.0%) |
| 3 or 4 Children | 0 (0.0%) | 0 (0.0%) |
| 5 or more Children | 0 (0.0%) | 0 (0.0%) |
| Total | 4 (3.0%) | 0 (0.0%) |
Race in Stagecoach
The most populous races in Stagecoach are White / Caucasian (472 | 85.2%), Hispanic or Latino (60 | 10.8%), and Two or more Races (32 | 5.8%).
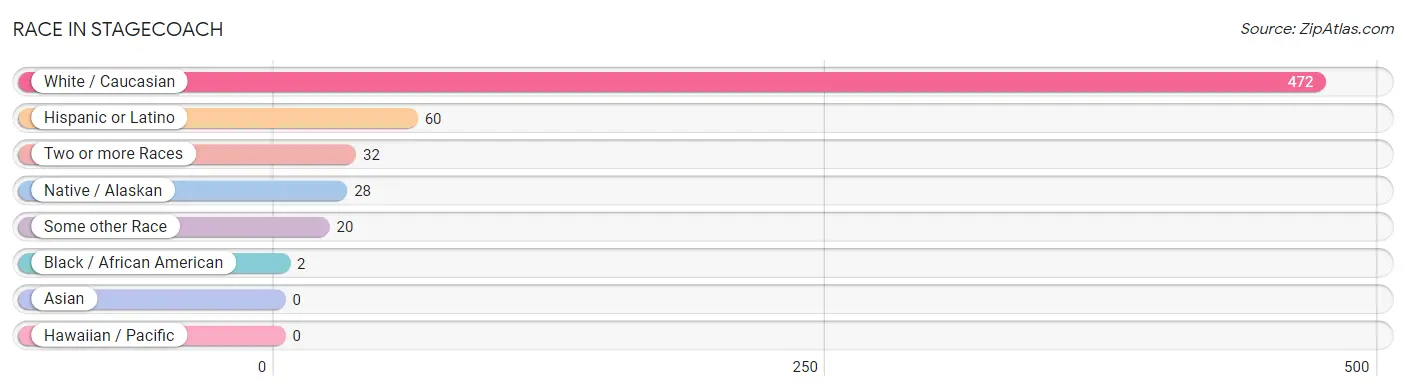
| Race | # Population | % Population |
| Asian | 0 | 0.0% |
| Black / African American | 2 | 0.4% |
| Hawaiian / Pacific | 0 | 0.0% |
| Hispanic or Latino | 60 | 10.8% |
| Native / Alaskan | 28 | 5.1% |
| White / Caucasian | 472 | 85.2% |
| Two or more Races | 32 | 5.8% |
| Some other Race | 20 | 3.6% |
| Total | 554 | 100.0% |
Ancestry in Stagecoach
The most populous ancestries reported in Stagecoach are German (103 | 18.6%), English (102 | 18.4%), Irish (73 | 13.2%), French (51 | 9.2%), and Mexican (50 | 9.0%), together accounting for 68.4% of all Stagecoach residents.
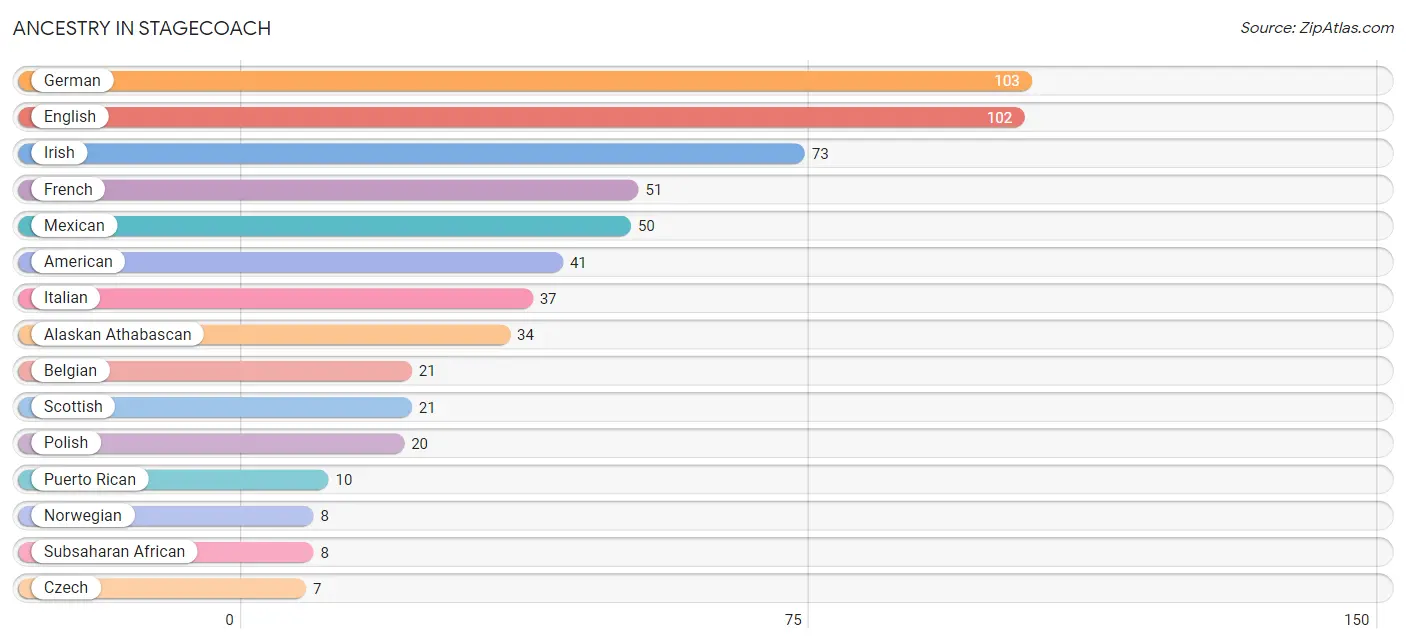
| Ancestry | # Population | % Population |
| Alaskan Athabascan | 34 | 6.1% |
| American | 41 | 7.4% |
| Australian | 2 | 0.4% |
| Belgian | 21 | 3.8% |
| Chickasaw | 2 | 0.4% |
| Czech | 7 | 1.3% |
| Dutch | 3 | 0.5% |
| English | 102 | 18.4% |
| European | 4 | 0.7% |
| French | 51 | 9.2% |
| German | 103 | 18.6% |
| Hungarian | 3 | 0.5% |
| Indian (Asian) | 3 | 0.5% |
| Irish | 73 | 13.2% |
| Italian | 37 | 6.7% |
| Mexican | 50 | 9.0% |
| Mexican American Indian | 3 | 0.5% |
| Norwegian | 8 | 1.4% |
| Polish | 20 | 3.6% |
| Portuguese | 5 | 0.9% |
| Puerto Rican | 10 | 1.8% |
| Russian | 3 | 0.5% |
| Scotch-Irish | 3 | 0.5% |
| Scottish | 21 | 3.8% |
| Subsaharan African | 8 | 1.4% | View All 25 Rows |
Immigrants in Stagecoach
The most numerous immigrant groups reported in Stagecoach came from Latin America (25 | 4.5%), Europe (23 | 4.2%), Belgium (21 | 3.8%), Western Europe (21 | 3.8%), and Caribbean (20 | 3.6%), together accounting for 19.9% of all Stagecoach residents.
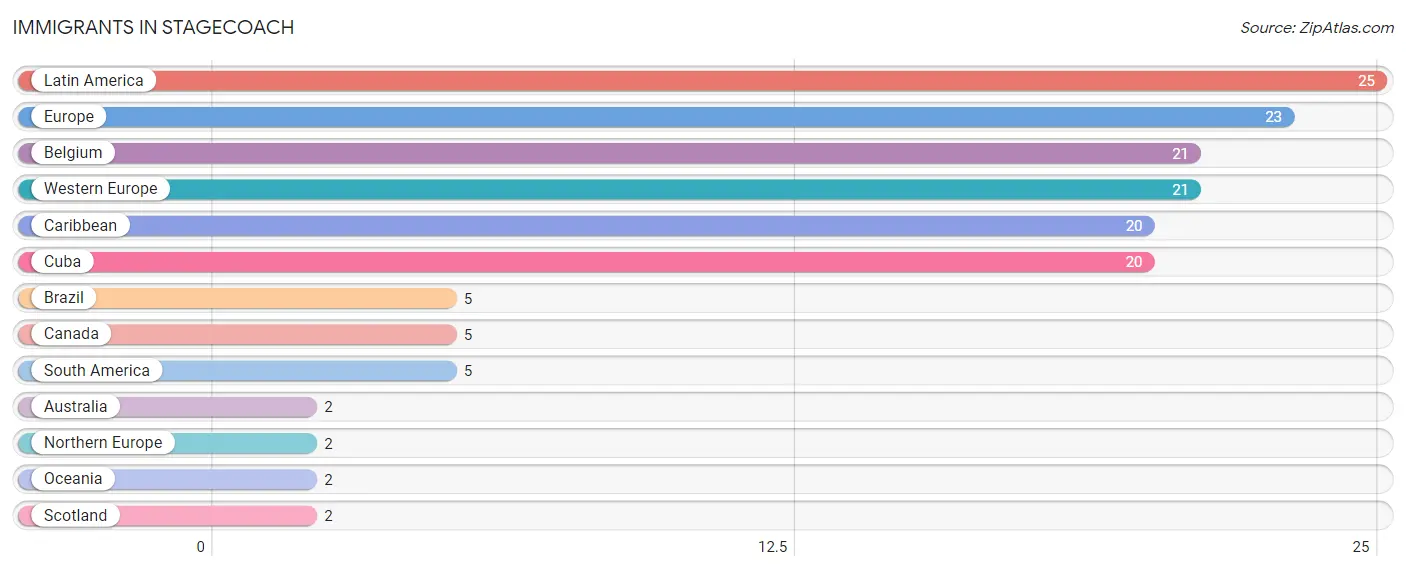
| Immigration Origin | # Population | % Population |
| Australia | 2 | 0.4% |
| Belgium | 21 | 3.8% |
| Brazil | 5 | 0.9% |
| Canada | 5 | 0.9% |
| Caribbean | 20 | 3.6% |
| Cuba | 20 | 3.6% |
| Europe | 23 | 4.2% |
| Latin America | 25 | 4.5% |
| Northern Europe | 2 | 0.4% |
| Oceania | 2 | 0.4% |
| Scotland | 2 | 0.4% |
| South America | 5 | 0.9% |
| Western Europe | 21 | 3.8% | View All 13 Rows |
Sex and Age in Stagecoach
Sex and Age in Stagecoach
The most populous age groups in Stagecoach are 60 to 64 Years (48 | 16.2%) for men and 60 to 64 Years (33 | 12.8%) for women.
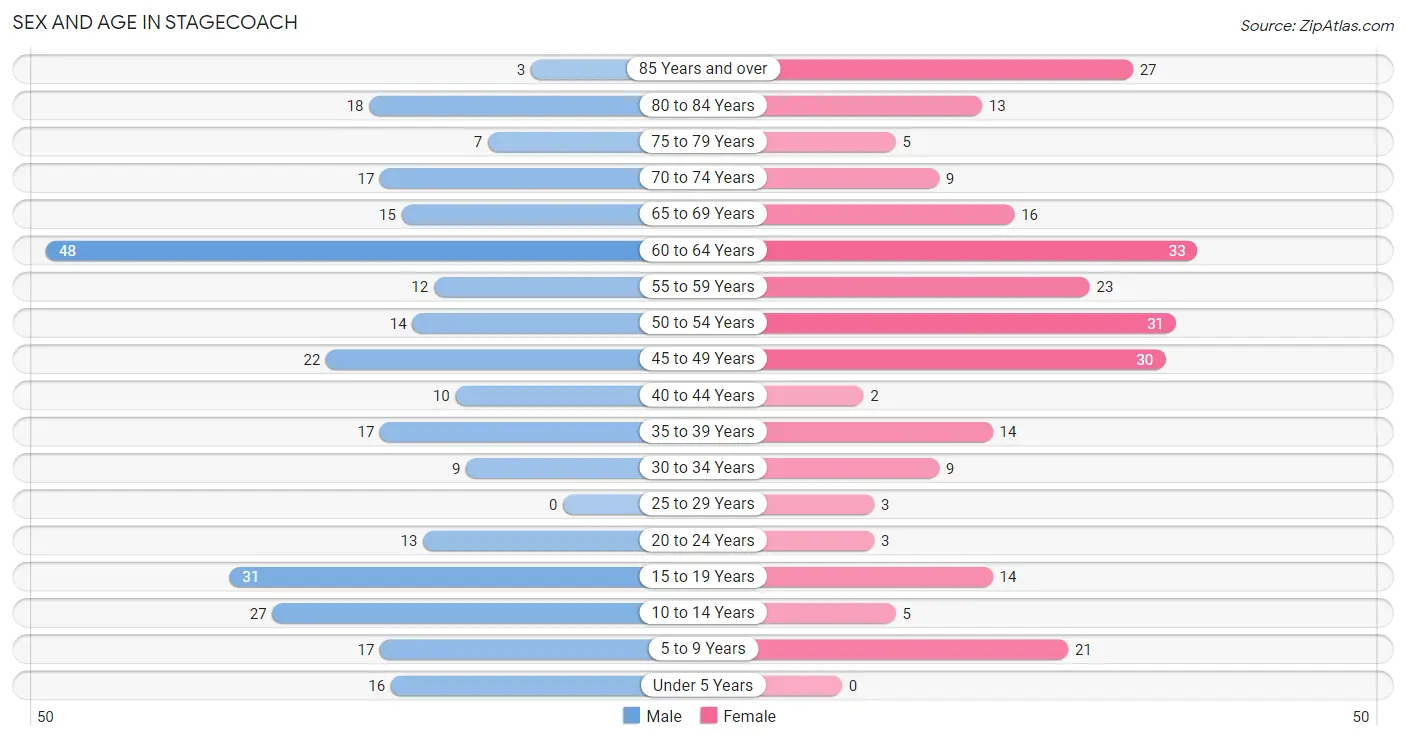
| Age Bracket | Male | Female |
| Under 5 Years | 16 (5.4%) | 0 (0.0%) |
| 5 to 9 Years | 17 (5.7%) | 21 (8.1%) |
| 10 to 14 Years | 27 (9.1%) | 5 (1.9%) |
| 15 to 19 Years | 31 (10.5%) | 14 (5.4%) |
| 20 to 24 Years | 13 (4.4%) | 3 (1.2%) |
| 25 to 29 Years | 0 (0.0%) | 3 (1.2%) |
| 30 to 34 Years | 9 (3.0%) | 9 (3.5%) |
| 35 to 39 Years | 17 (5.7%) | 14 (5.4%) |
| 40 to 44 Years | 10 (3.4%) | 2 (0.8%) |
| 45 to 49 Years | 22 (7.4%) | 30 (11.6%) |
| 50 to 54 Years | 14 (4.7%) | 31 (12.0%) |
| 55 to 59 Years | 12 (4.1%) | 23 (8.9%) |
| 60 to 64 Years | 48 (16.2%) | 33 (12.8%) |
| 65 to 69 Years | 15 (5.1%) | 16 (6.2%) |
| 70 to 74 Years | 17 (5.7%) | 9 (3.5%) |
| 75 to 79 Years | 7 (2.4%) | 5 (1.9%) |
| 80 to 84 Years | 18 (6.1%) | 13 (5.0%) |
| 85 Years and over | 3 (1.0%) | 27 (10.5%) |
| Total | 296 (100.0%) | 258 (100.0%) |
Families and Households in Stagecoach
Median Family Size in Stagecoach
The median family size in Stagecoach is 3.16 persons per family, with single male/father families (17 | 10.6%) accounting for the largest median family size of 4.12 persons per family. On the other hand, single female/mother families (9 | 5.6%) represent the smallest median family size with 2.89 persons per family.
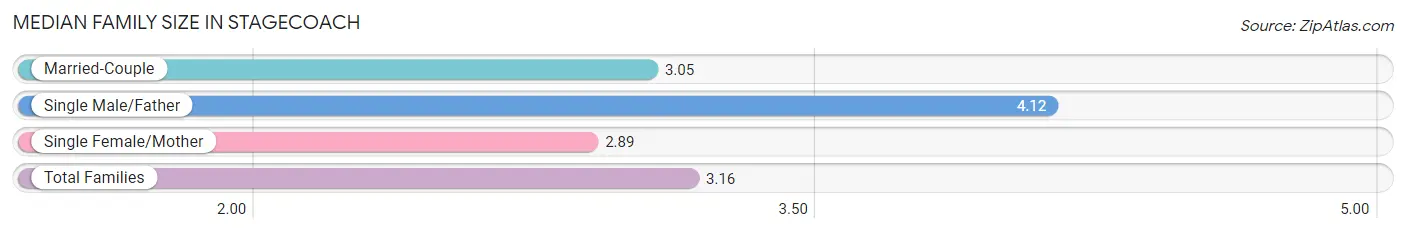
| Family Type | # Families | Family Size |
| Married-Couple | 135 (83.9%) | 3.05 |
| Single Male/Father | 17 (10.6%) | 4.12 |
| Single Female/Mother | 9 (5.6%) | 2.89 |
| Total Families | 161 (100.0%) | 3.16 |
Median Household Size in Stagecoach
The median household size in Stagecoach is 2.73 persons per household, with single male/father households (17 | 8.4%) accounting for the largest median household size of 4.24 persons per household. non-family households (42 | 20.7%) represent the smallest median household size with 1.05 persons per household.
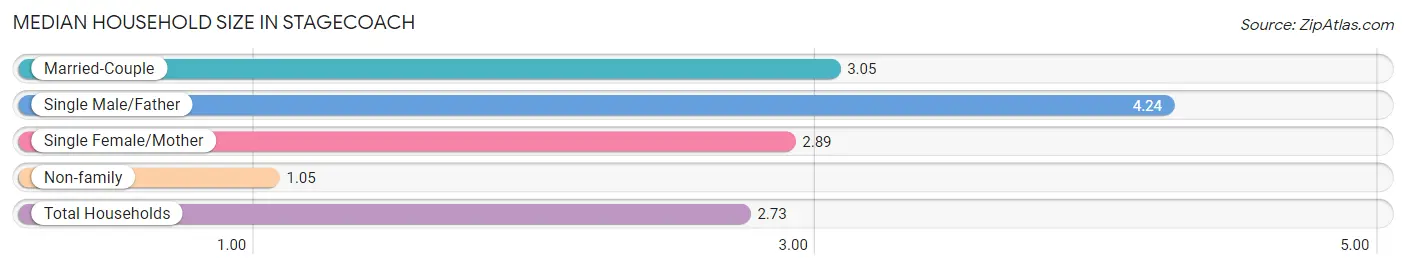
| Household Type | # Households | Household Size |
| Married-Couple | 135 (66.5%) | 3.05 |
| Single Male/Father | 17 (8.4%) | 4.24 |
| Single Female/Mother | 9 (4.4%) | 2.89 |
| Non-family | 42 (20.7%) | 1.05 |
| Total Households | 203 (100.0%) | 2.73 |
Household Size by Marriage Status in Stagecoach
Out of a total of 203 households in Stagecoach, 161 (79.3%) are family households, while 42 (20.7%) are nonfamily households. The most numerous type of family households are 2-person households, comprising 89, and the most common type of nonfamily households are 1-person households, comprising 39.
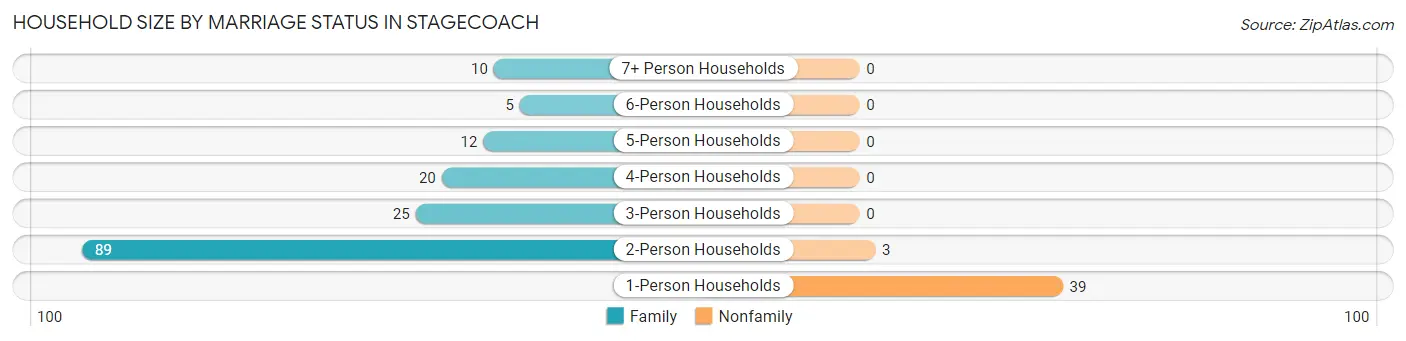
| Household Size | Family Households | Nonfamily Households |
| 1-Person Households | - | 39 (19.2%) |
| 2-Person Households | 89 (43.8%) | 3 (1.5%) |
| 3-Person Households | 25 (12.3%) | 0 (0.0%) |
| 4-Person Households | 20 (9.9%) | 0 (0.0%) |
| 5-Person Households | 12 (5.9%) | 0 (0.0%) |
| 6-Person Households | 5 (2.5%) | 0 (0.0%) |
| 7+ Person Households | 10 (4.9%) | 0 (0.0%) |
| Total | 161 (79.3%) | 42 (20.7%) |
Female Fertility in Stagecoach
Fertility by Age in Stagecoach
| Age Bracket | Women with Births | Births / 1,000 Women |
| 15 to 19 years | 0 (0.0%) | 0.0 |
| 20 to 34 years | 0 (0.0%) | 0.0 |
| 35 to 50 years | 0 (0.0%) | 0.0 |
| Total | 0 (0.0%) | 0.0 |
Fertility by Age by Marriage Status in Stagecoach
| Age Bracket | Married | Unmarried |
| 15 to 19 years | 0 (0.0%) | 0 (0.0%) |
| 20 to 34 years | 0 (0.0%) | 0 (0.0%) |
| 35 to 50 years | 0 (0.0%) | 0 (0.0%) |
| Total | 0 (0.0%) | 0 (0.0%) |
Fertility by Education in Stagecoach
| Educational Attainment | Women with Births | Births / 1,000 Women |
| Less than High School | 0 (0.0%) | 0.0 |
| High School Diploma | 0 (0.0%) | 0.0 |
| College or Associate's Degree | 0 (0.0%) | 0.0 |
| Bachelor's Degree | 0 (0.0%) | 0.0 |
| Graduate Degree | 0 (0.0%) | 0.0 |
| Total | 0 (0.0%) | 0.0 |
Fertility by Education by Marriage Status in Stagecoach
| Educational Attainment | Married | Unmarried |
| Less than High School | 0 (0.0%) | 0 (0.0%) |
| High School Diploma | 0 (0.0%) | 0 (0.0%) |
| College or Associate's Degree | 0 (0.0%) | 0 (0.0%) |
| Bachelor's Degree | 0 (0.0%) | 0 (0.0%) |
| Graduate Degree | 0 (0.0%) | 0 (0.0%) |
| Total | 0 (0.0%) | 0 (0.0%) |
Employment Characteristics in Stagecoach
Employment by Class of Employer in Stagecoach
Among the 221 employed individuals in Stagecoach, private company employees (145 | 65.6%), local government employees (27 | 12.2%), and self-employed (not incorporated) (22 | 10.0%) make up the most common classes of employment.
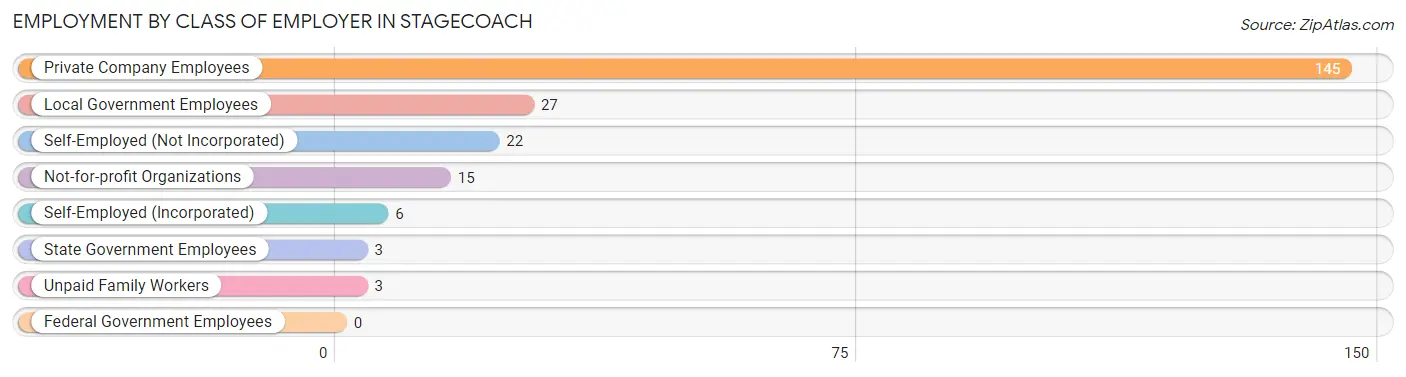
| Employer Class | # Employees | % Employees |
| Private Company Employees | 145 | 65.6% |
| Self-Employed (Incorporated) | 6 | 2.7% |
| Self-Employed (Not Incorporated) | 22 | 10.0% |
| Not-for-profit Organizations | 15 | 6.8% |
| Local Government Employees | 27 | 12.2% |
| State Government Employees | 3 | 1.4% |
| Federal Government Employees | 0 | 0.0% |
| Unpaid Family Workers | 3 | 1.4% |
| Total | 221 | 100.0% |
Employment Status by Age in Stagecoach
According to the labor force statistics for Stagecoach, out of the total population over 16 years of age (457), 52.5% or 240 individuals are in the labor force, with 4.6% or 11 of them unemployed. The age group with the highest labor force participation rate is 25 to 29 years, with 100.0% or 3 individuals in the labor force. Within the labor force, the 20 to 24 years age range has the highest percentage of unemployed individuals, with 55.6% or 5 of them being unemployed.
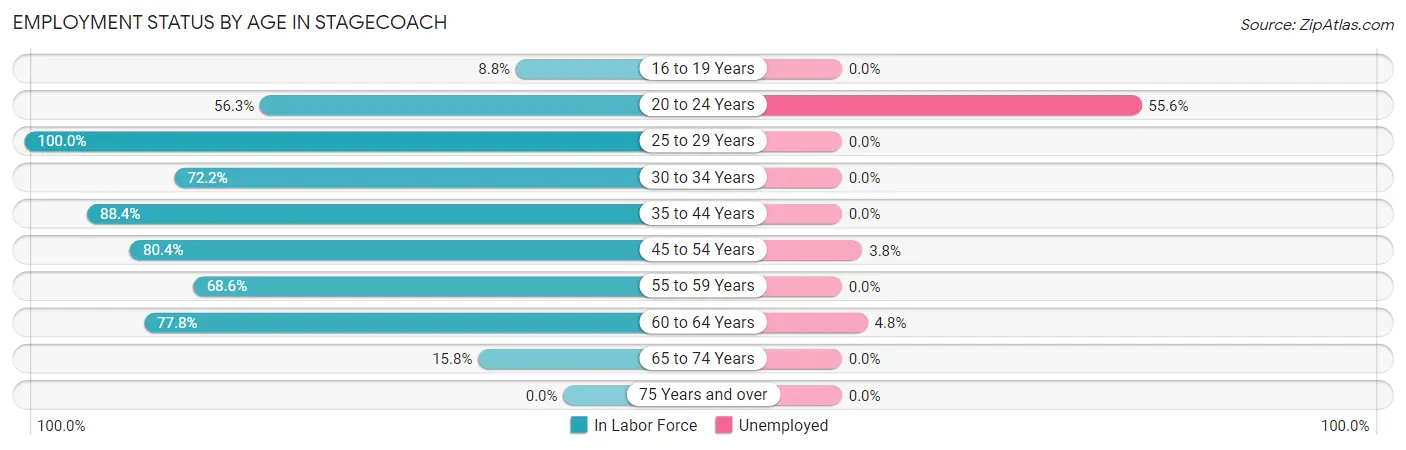
| Age Bracket | In Labor Force | Unemployed |
| 16 to 19 Years | 3 (8.8%) | 0 (0.0%) |
| 20 to 24 Years | 9 (56.3%) | 5 (55.6%) |
| 25 to 29 Years | 3 (100.0%) | 0 (0.0%) |
| 30 to 34 Years | 13 (72.2%) | 0 (0.0%) |
| 35 to 44 Years | 38 (88.4%) | 0 (0.0%) |
| 45 to 54 Years | 78 (80.4%) | 3 (3.8%) |
| 55 to 59 Years | 24 (68.6%) | 0 (0.0%) |
| 60 to 64 Years | 63 (77.8%) | 3 (4.8%) |
| 65 to 74 Years | 9 (15.8%) | 0 (0.0%) |
| 75 Years and over | 0 (0.0%) | 0 (0.0%) |
| Total | 240 (52.5%) | 11 (4.6%) |
Employment Status by Educational Attainment in Stagecoach
According to labor force statistics for Stagecoach, 79.1% of individuals (219) out of the total population between 25 and 64 years of age (277) are in the labor force, with 2.7% or 6 of them being unemployed. The group with the highest labor force participation rate are those with the educational attainment of less than high school, with 100.0% or 3 individuals in the labor force. Within the labor force, individuals with college / associate degree education have the highest percentage of unemployment, with 5.7% or 6 of them being unemployed.
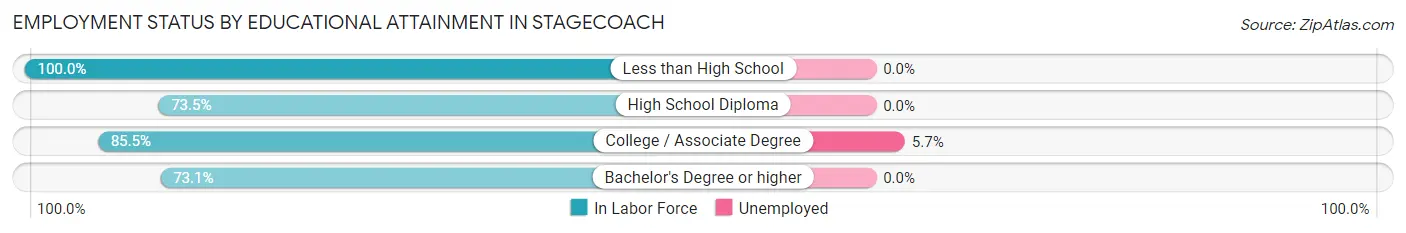
| Educational Attainment | In Labor Force | Unemployed |
| Less than High School | 3 (100.0%) | 0 (0.0%) |
| High School Diploma | 61 (73.5%) | 0 (0.0%) |
| College / Associate Degree | 106 (85.5%) | 7 (5.7%) |
| Bachelor's Degree or higher | 49 (73.1%) | 0 (0.0%) |
| Total | 219 (79.1%) | 7 (2.7%) |
Employment Occupations by Sex in Stagecoach
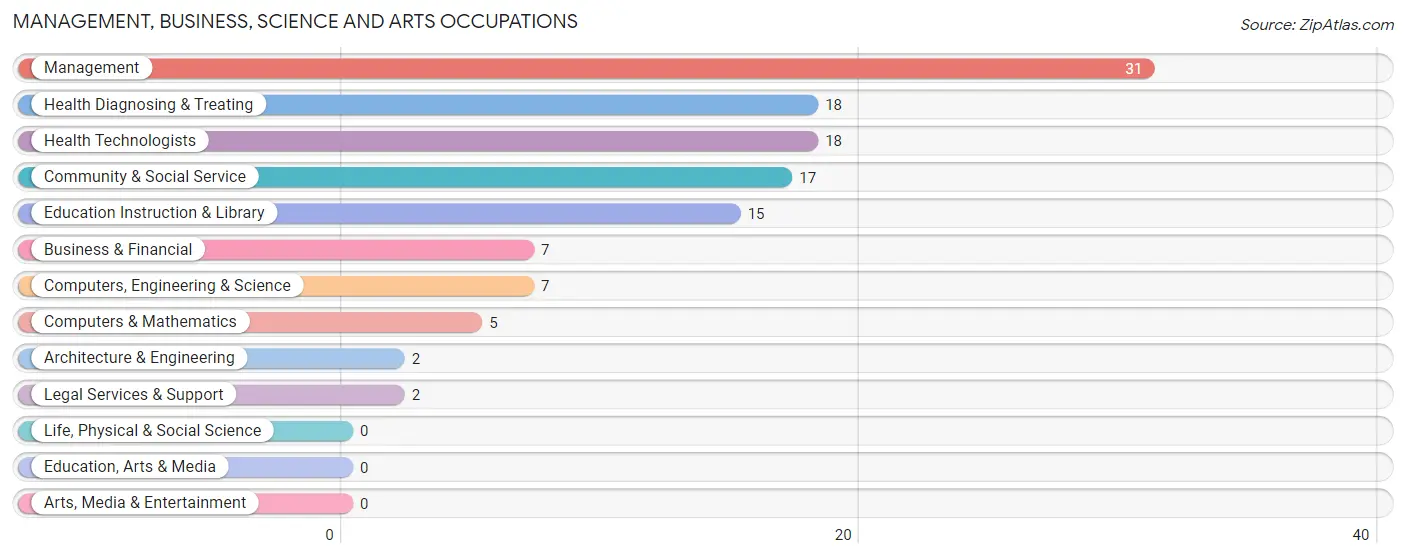
Management, Business, Science and Arts Occupations
The most common Management, Business, Science and Arts occupations in Stagecoach are Management (31 | 13.5%), Health Diagnosing & Treating (18 | 7.9%), Health Technologists (18 | 7.9%), Community & Social Service (17 | 7.4%), and Education Instruction & Library (15 | 6.6%).
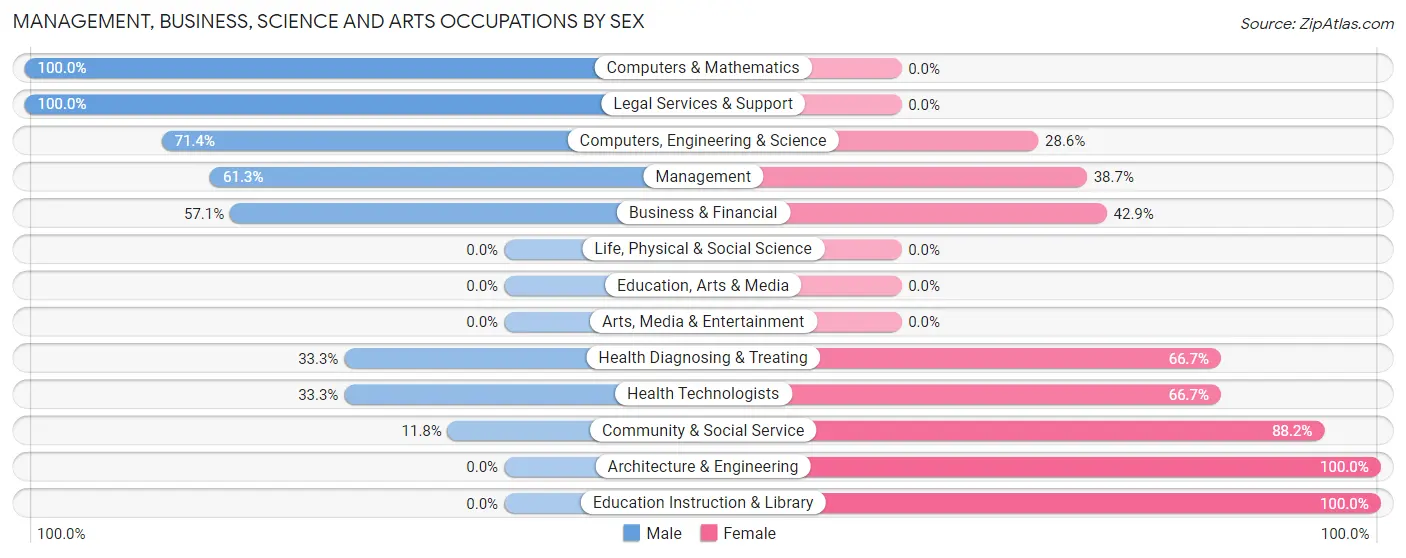
Management, Business, Science and Arts Occupations by Sex
Within the Management, Business, Science and Arts occupations in Stagecoach, the most male-oriented occupations are Computers & Mathematics (100.0%), Legal Services & Support (100.0%), and Computers, Engineering & Science (71.4%), while the most female-oriented occupations are Architecture & Engineering (100.0%), Education Instruction & Library (100.0%), and Community & Social Service (88.2%).
| Occupation | Male | Female |
| Management | 19 (61.3%) | 12 (38.7%) |
| Business & Financial | 4 (57.1%) | 3 (42.9%) |
| Computers, Engineering & Science | 5 (71.4%) | 2 (28.6%) |
| Computers & Mathematics | 5 (100.0%) | 0 (0.0%) |
| Architecture & Engineering | 0 (0.0%) | 2 (100.0%) |
| Life, Physical & Social Science | 0 (0.0%) | 0 (0.0%) |
| Community & Social Service | 2 (11.8%) | 15 (88.2%) |
| Education, Arts & Media | 0 (0.0%) | 0 (0.0%) |
| Legal Services & Support | 2 (100.0%) | 0 (0.0%) |
| Education Instruction & Library | 0 (0.0%) | 15 (100.0%) |
| Arts, Media & Entertainment | 0 (0.0%) | 0 (0.0%) |
| Health Diagnosing & Treating | 6 (33.3%) | 12 (66.7%) |
| Health Technologists | 6 (33.3%) | 12 (66.7%) |
| Total (Category) | 36 (45.0%) | 44 (55.0%) |
| Total (Overall) | 130 (56.8%) | 99 (43.2%) |
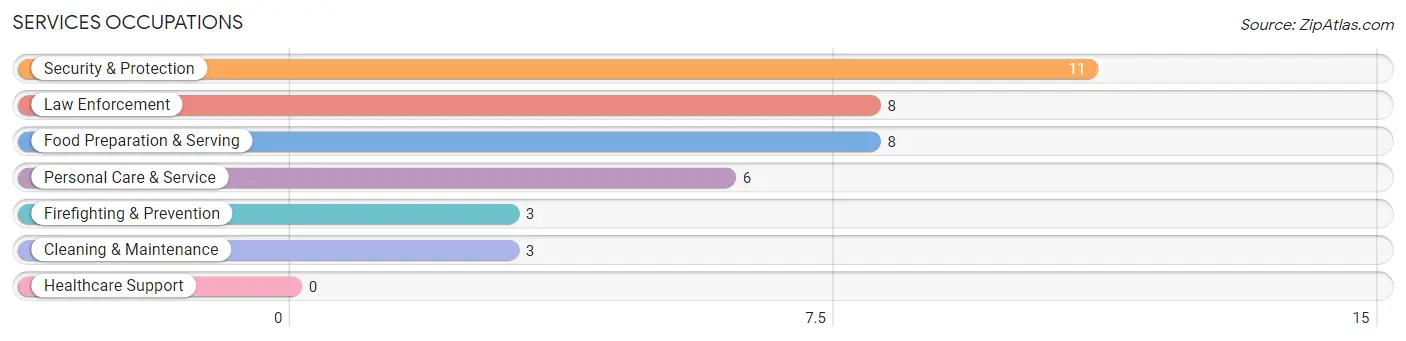
Services Occupations
The most common Services occupations in Stagecoach are Security & Protection (11 | 4.8%), Law Enforcement (8 | 3.5%), Food Preparation & Serving (8 | 3.5%), Personal Care & Service (6 | 2.6%), and Firefighting & Prevention (3 | 1.3%).
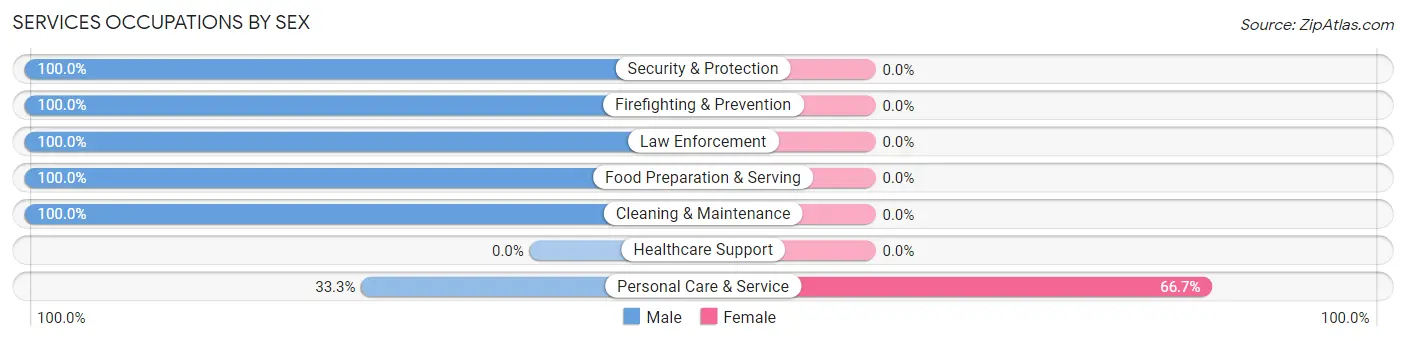
Services Occupations by Sex
| Occupation | Male | Female |
| Healthcare Support | 0 (0.0%) | 0 (0.0%) |
| Security & Protection | 11 (100.0%) | 0 (0.0%) |
| Firefighting & Prevention | 3 (100.0%) | 0 (0.0%) |
| Law Enforcement | 8 (100.0%) | 0 (0.0%) |
| Food Preparation & Serving | 8 (100.0%) | 0 (0.0%) |
| Cleaning & Maintenance | 3 (100.0%) | 0 (0.0%) |
| Personal Care & Service | 2 (33.3%) | 4 (66.7%) |
| Total (Category) | 24 (85.7%) | 4 (14.3%) |
| Total (Overall) | 130 (56.8%) | 99 (43.2%) |
Sales and Office Occupations
The most common Sales and Office occupations in Stagecoach are Sales & Related (37 | 16.2%), and Office & Administration (28 | 12.2%).

Sales and Office Occupations by Sex

| Occupation | Male | Female |
| Sales & Related | 20 (54.0%) | 17 (46.0%) |
| Office & Administration | 0 (0.0%) | 28 (100.0%) |
| Total (Category) | 20 (30.8%) | 45 (69.2%) |
| Total (Overall) | 130 (56.8%) | 99 (43.2%) |
Natural Resources, Construction and Maintenance Occupations
The most common Natural Resources, Construction and Maintenance occupations in Stagecoach are Installation, Maintenance & Repair (22 | 9.6%), and Construction & Extraction (19 | 8.3%).

Natural Resources, Construction and Maintenance Occupations by Sex

| Occupation | Male | Female |
| Farming, Fishing & Forestry | 0 (0.0%) | 0 (0.0%) |
| Construction & Extraction | 19 (100.0%) | 0 (0.0%) |
| Installation, Maintenance & Repair | 22 (100.0%) | 0 (0.0%) |
| Total (Category) | 41 (100.0%) | 0 (0.0%) |
| Total (Overall) | 130 (56.8%) | 99 (43.2%) |
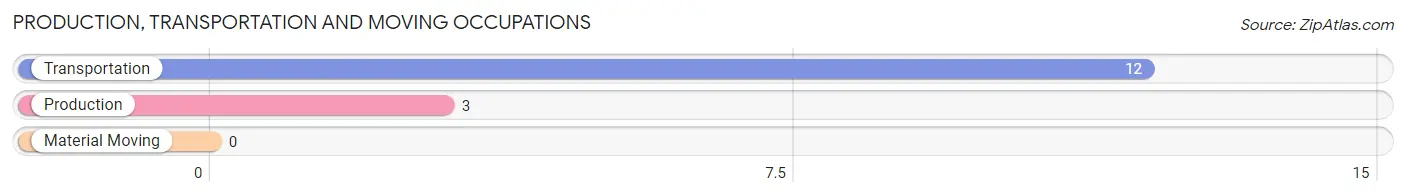
Production, Transportation and Moving Occupations
The most common Production, Transportation and Moving occupations in Stagecoach are Transportation (12 | 5.2%), and Production (3 | 1.3%).
Production, Transportation and Moving Occupations by Sex
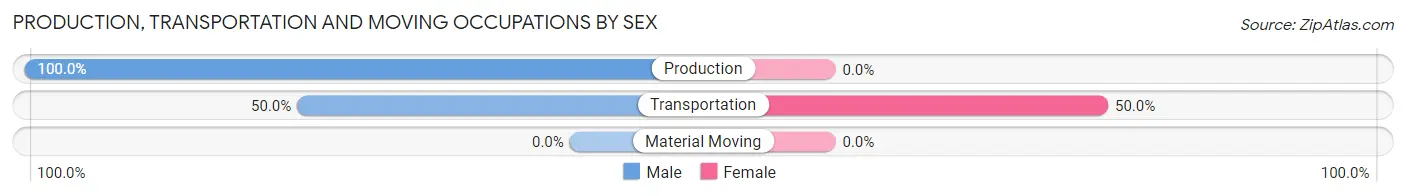
| Occupation | Male | Female |
| Production | 3 (100.0%) | 0 (0.0%) |
| Transportation | 6 (50.0%) | 6 (50.0%) |
| Material Moving | 0 (0.0%) | 0 (0.0%) |
| Total (Category) | 9 (60.0%) | 6 (40.0%) |
| Total (Overall) | 130 (56.8%) | 99 (43.2%) |
Employment Industries by Sex in Stagecoach
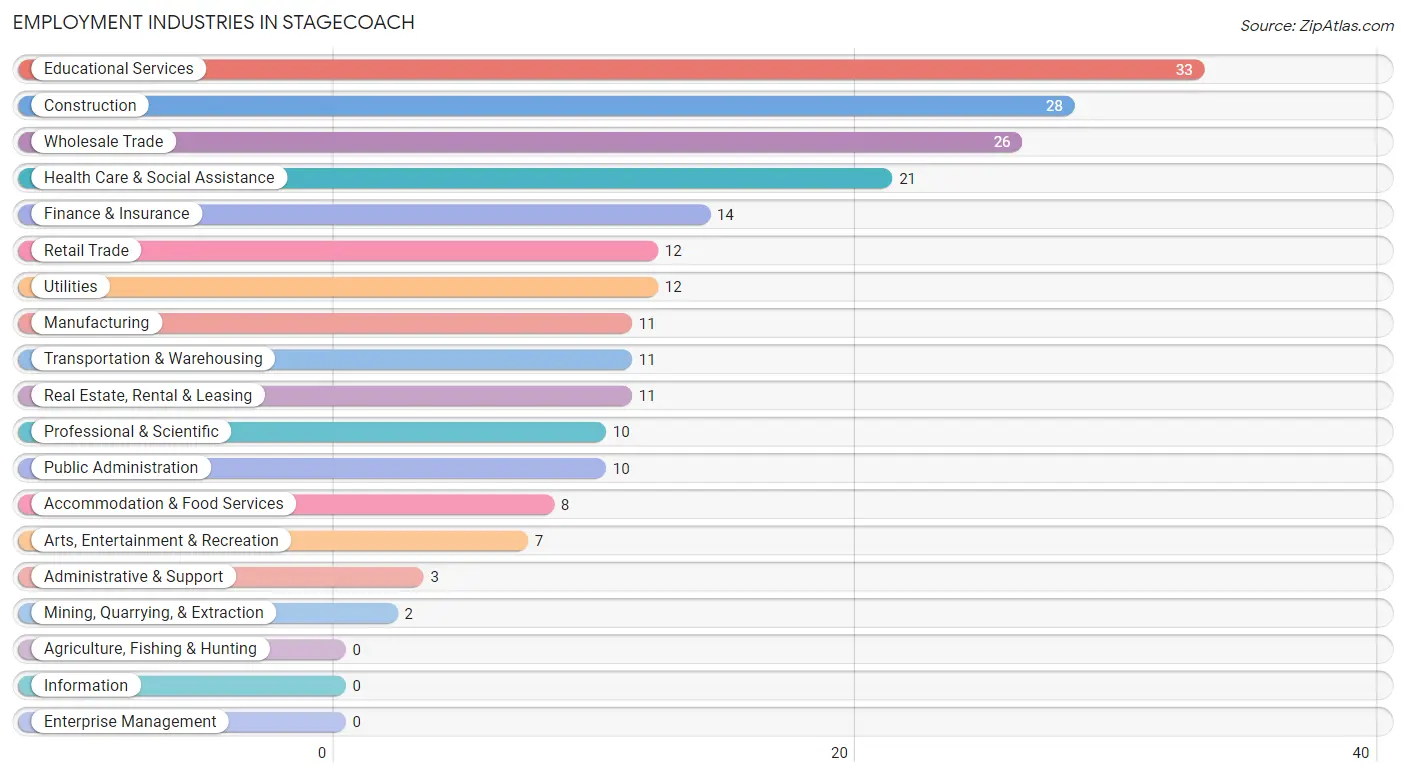
Employment Industries in Stagecoach
The major employment industries in Stagecoach include Educational Services (33 | 14.4%), Construction (28 | 12.2%), Wholesale Trade (26 | 11.4%), Health Care & Social Assistance (21 | 9.2%), and Finance & Insurance (14 | 6.1%).
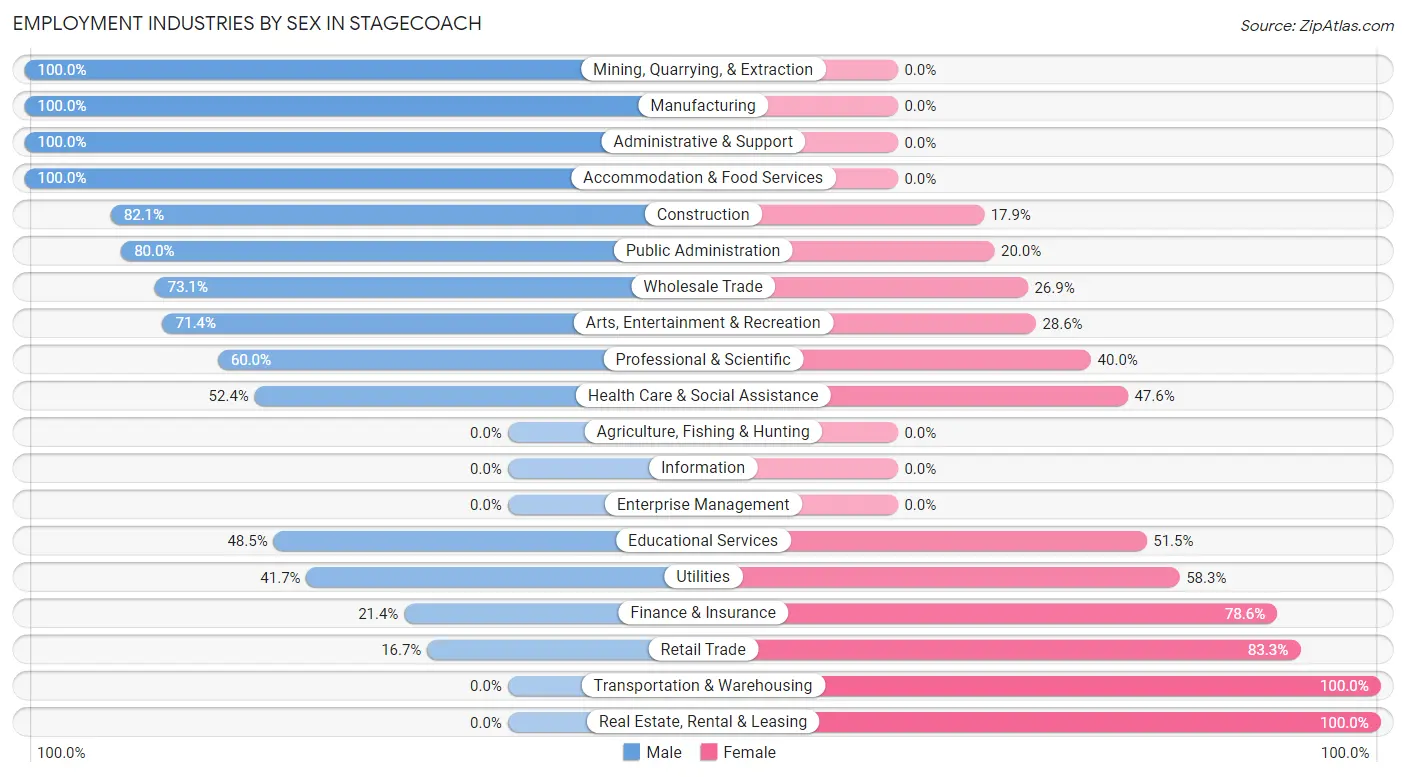
Employment Industries by Sex in Stagecoach
The Stagecoach industries that see more men than women are Mining, Quarrying, & Extraction (100.0%), Manufacturing (100.0%), and Administrative & Support (100.0%), whereas the industries that tend to have a higher number of women are Transportation & Warehousing (100.0%), Real Estate, Rental & Leasing (100.0%), and Retail Trade (83.3%).
| Industry | Male | Female |
| Agriculture, Fishing & Hunting | 0 (0.0%) | 0 (0.0%) |
| Mining, Quarrying, & Extraction | 2 (100.0%) | 0 (0.0%) |
| Construction | 23 (82.1%) | 5 (17.9%) |
| Manufacturing | 11 (100.0%) | 0 (0.0%) |
| Wholesale Trade | 19 (73.1%) | 7 (26.9%) |
| Retail Trade | 2 (16.7%) | 10 (83.3%) |
| Transportation & Warehousing | 0 (0.0%) | 11 (100.0%) |
| Utilities | 5 (41.7%) | 7 (58.3%) |
| Information | 0 (0.0%) | 0 (0.0%) |
| Finance & Insurance | 3 (21.4%) | 11 (78.6%) |
| Real Estate, Rental & Leasing | 0 (0.0%) | 11 (100.0%) |
| Professional & Scientific | 6 (60.0%) | 4 (40.0%) |
| Enterprise Management | 0 (0.0%) | 0 (0.0%) |
| Administrative & Support | 3 (100.0%) | 0 (0.0%) |
| Educational Services | 16 (48.5%) | 17 (51.5%) |
| Health Care & Social Assistance | 11 (52.4%) | 10 (47.6%) |
| Arts, Entertainment & Recreation | 5 (71.4%) | 2 (28.6%) |
| Accommodation & Food Services | 8 (100.0%) | 0 (0.0%) |
| Public Administration | 8 (80.0%) | 2 (20.0%) |
| Total | 130 (56.8%) | 99 (43.2%) |
Education in Stagecoach
School Enrollment in Stagecoach
The most common levels of schooling among the 123 students in Stagecoach are elementary school (35 | 28.5%), high school (32 | 26.0%), and middle school (31 | 25.2%).
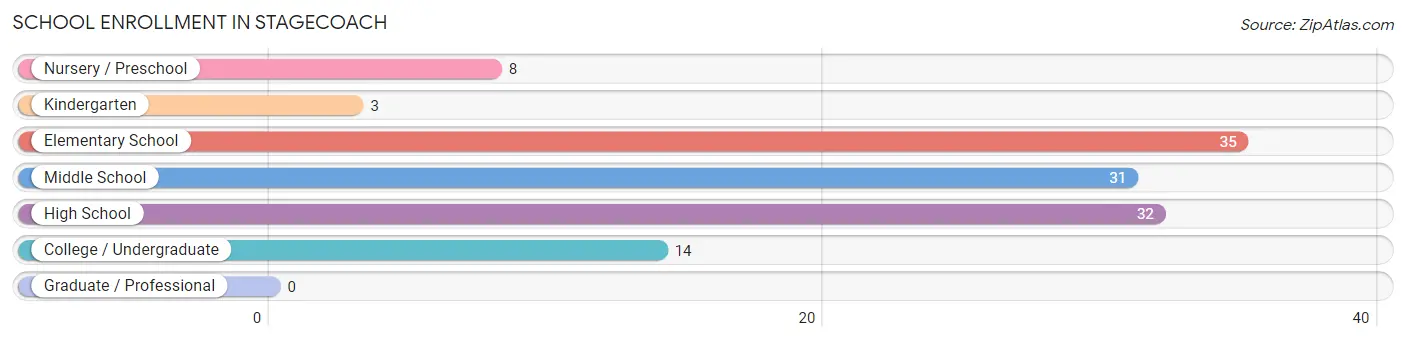
| School Level | # Students | % Students |
| Nursery / Preschool | 8 | 6.5% |
| Kindergarten | 3 | 2.4% |
| Elementary School | 35 | 28.5% |
| Middle School | 31 | 25.2% |
| High School | 32 | 26.0% |
| College / Undergraduate | 14 | 11.4% |
| Graduate / Professional | 0 | 0.0% |
| Total | 123 | 100.0% |
School Enrollment by Age by Funding Source in Stagecoach
Out of a total of 123 students who are enrolled in schools in Stagecoach, 27 (22.0%) attend a private institution, while the remaining 96 (78.0%) are enrolled in public schools. The age group of 3 to 4 year olds has the highest likelihood of being enrolled in private schools, with 8 (100.0% in the age bracket) enrolled. Conversely, the age group of 15 to 17 year olds has the lowest likelihood of being enrolled in a private school, with 33 (100.0% in the age bracket) attending a public institution.
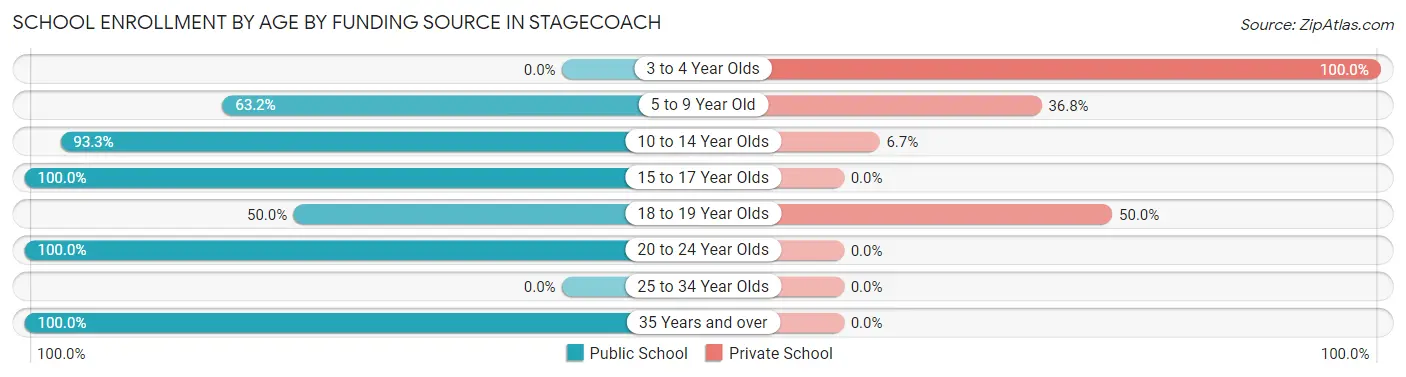
| Age Bracket | Public School | Private School |
| 3 to 4 Year Olds | 0 (0.0%) | 8 (100.0%) |
| 5 to 9 Year Old | 24 (63.2%) | 14 (36.8%) |
| 10 to 14 Year Olds | 28 (93.3%) | 2 (6.7%) |
| 15 to 17 Year Olds | 33 (100.0%) | 0 (0.0%) |
| 18 to 19 Year Olds | 3 (50.0%) | 3 (50.0%) |
| 20 to 24 Year Olds | 7 (100.0%) | 0 (0.0%) |
| 25 to 34 Year Olds | 0 (0.0%) | 0 (0.0%) |
| 35 Years and over | 1 (100.0%) | 0 (0.0%) |
| Total | 96 (78.0%) | 27 (22.0%) |
Educational Attainment by Field of Study in Stagecoach
Science & technology (23 | 20.0%), business (18 | 15.7%), education (18 | 15.7%), liberal arts & history (13 | 11.3%), and social sciences (11 | 9.6%) are the most common fields of study among 115 individuals in Stagecoach who have obtained a bachelor's degree or higher.
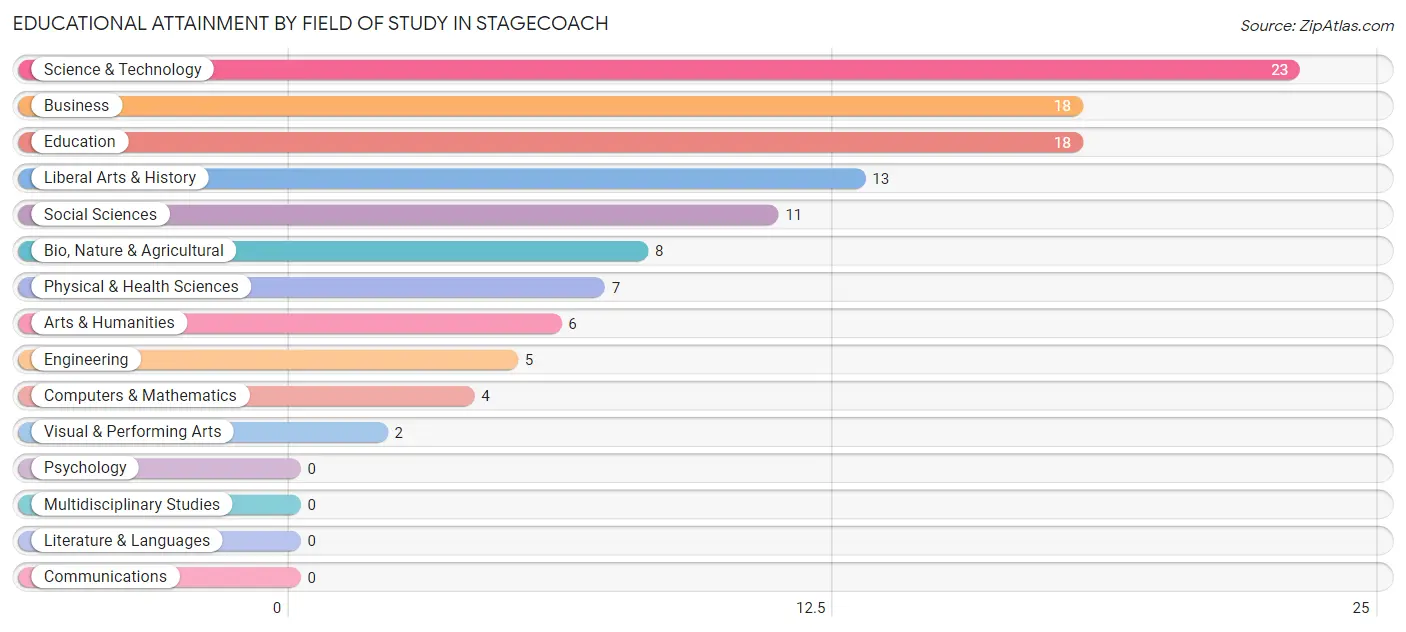
| Field of Study | # Graduates | % Graduates |
| Computers & Mathematics | 4 | 3.5% |
| Bio, Nature & Agricultural | 8 | 7.0% |
| Physical & Health Sciences | 7 | 6.1% |
| Psychology | 0 | 0.0% |
| Social Sciences | 11 | 9.6% |
| Engineering | 5 | 4.3% |
| Multidisciplinary Studies | 0 | 0.0% |
| Science & Technology | 23 | 20.0% |
| Business | 18 | 15.7% |
| Education | 18 | 15.7% |
| Literature & Languages | 0 | 0.0% |
| Liberal Arts & History | 13 | 11.3% |
| Visual & Performing Arts | 2 | 1.7% |
| Communications | 0 | 0.0% |
| Arts & Humanities | 6 | 5.2% |
| Total | 115 | 100.0% |
Transportation & Commute in Stagecoach
Vehicle Availability by Sex in Stagecoach
The most prevalent vehicle ownership categories in Stagecoach are males with 3 vehicles (42, accounting for 34.4%) and females with 3 vehicles (23, making up 42.4%).
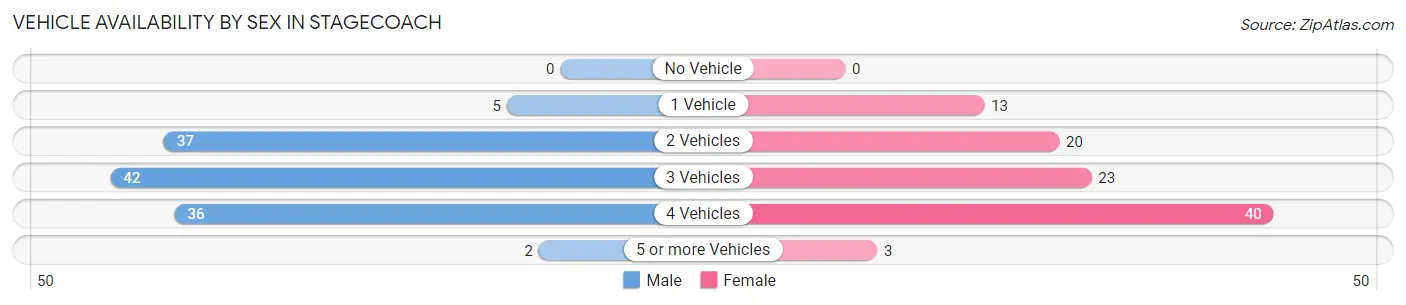
| Vehicles Available | Male | Female |
| No Vehicle | 0 (0.0%) | 0 (0.0%) |
| 1 Vehicle | 5 (4.1%) | 13 (13.1%) |
| 2 Vehicles | 37 (30.3%) | 20 (20.2%) |
| 3 Vehicles | 42 (34.4%) | 23 (23.2%) |
| 4 Vehicles | 36 (29.5%) | 40 (40.4%) |
| 5 or more Vehicles | 2 (1.6%) | 3 (3.0%) |
| Total | 122 (100.0%) | 99 (100.0%) |
Commute Time in Stagecoach
The most frequently occuring commute durations in Stagecoach are 45 to 59 minutes (57 commuters, 27.9%), 15 to 19 minutes (32 commuters, 15.7%), and 60 to 89 minutes (28 commuters, 13.7%).
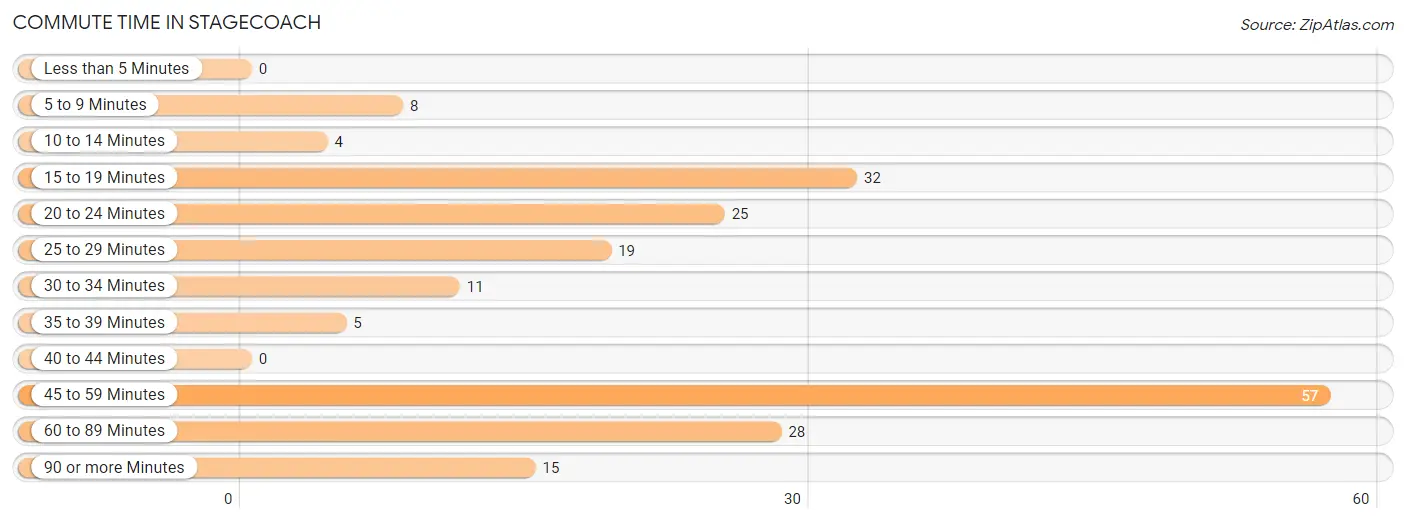
| Commute Time | # Commuters | % Commuters |
| Less than 5 Minutes | 0 | 0.0% |
| 5 to 9 Minutes | 8 | 3.9% |
| 10 to 14 Minutes | 4 | 2.0% |
| 15 to 19 Minutes | 32 | 15.7% |
| 20 to 24 Minutes | 25 | 12.2% |
| 25 to 29 Minutes | 19 | 9.3% |
| 30 to 34 Minutes | 11 | 5.4% |
| 35 to 39 Minutes | 5 | 2.5% |
| 40 to 44 Minutes | 0 | 0.0% |
| 45 to 59 Minutes | 57 | 27.9% |
| 60 to 89 Minutes | 28 | 13.7% |
| 90 or more Minutes | 15 | 7.3% |
Commute Time by Sex in Stagecoach
The most common commute times in Stagecoach are 45 to 59 minutes (35 commuters, 29.9%) for males and 45 to 59 minutes (22 commuters, 25.3%) for females.
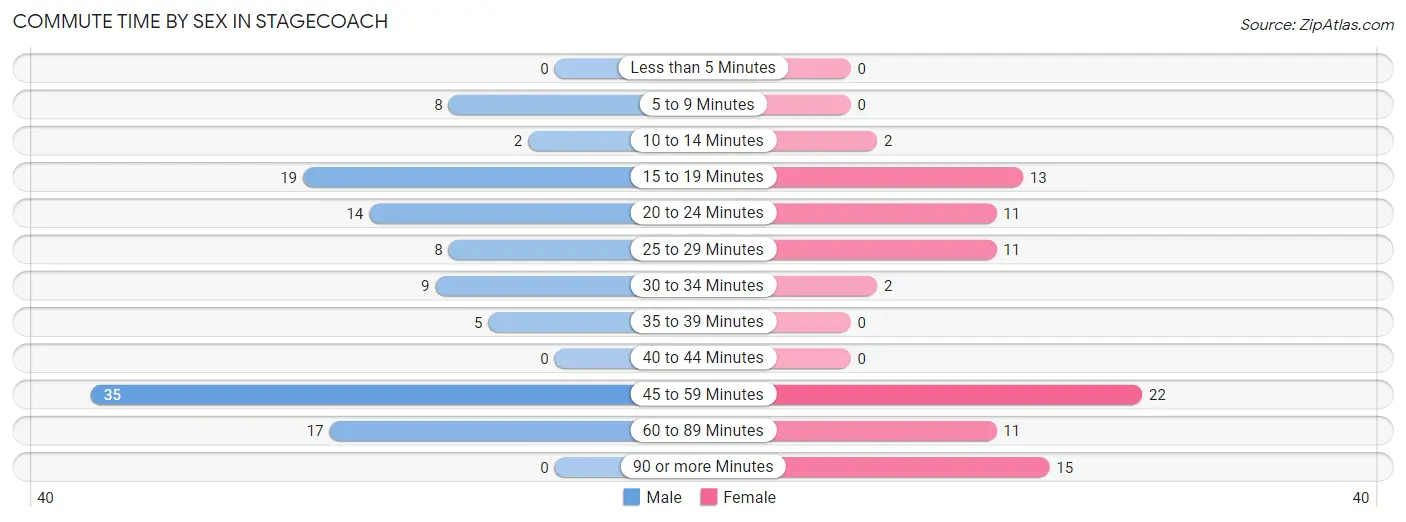
| Commute Time | Male | Female |
| Less than 5 Minutes | 0 (0.0%) | 0 (0.0%) |
| 5 to 9 Minutes | 8 (6.8%) | 0 (0.0%) |
| 10 to 14 Minutes | 2 (1.7%) | 2 (2.3%) |
| 15 to 19 Minutes | 19 (16.2%) | 13 (14.9%) |
| 20 to 24 Minutes | 14 (12.0%) | 11 (12.6%) |
| 25 to 29 Minutes | 8 (6.8%) | 11 (12.6%) |
| 30 to 34 Minutes | 9 (7.7%) | 2 (2.3%) |
| 35 to 39 Minutes | 5 (4.3%) | 0 (0.0%) |
| 40 to 44 Minutes | 0 (0.0%) | 0 (0.0%) |
| 45 to 59 Minutes | 35 (29.9%) | 22 (25.3%) |
| 60 to 89 Minutes | 17 (14.5%) | 11 (12.6%) |
| 90 or more Minutes | 0 (0.0%) | 15 (17.2%) |
Time of Departure to Work by Sex in Stagecoach
The most frequent times of departure to work in Stagecoach are 6:00 AM to 6:29 AM (35, 29.9%) for males and 7:30 AM to 7:59 AM (21, 24.1%) for females.
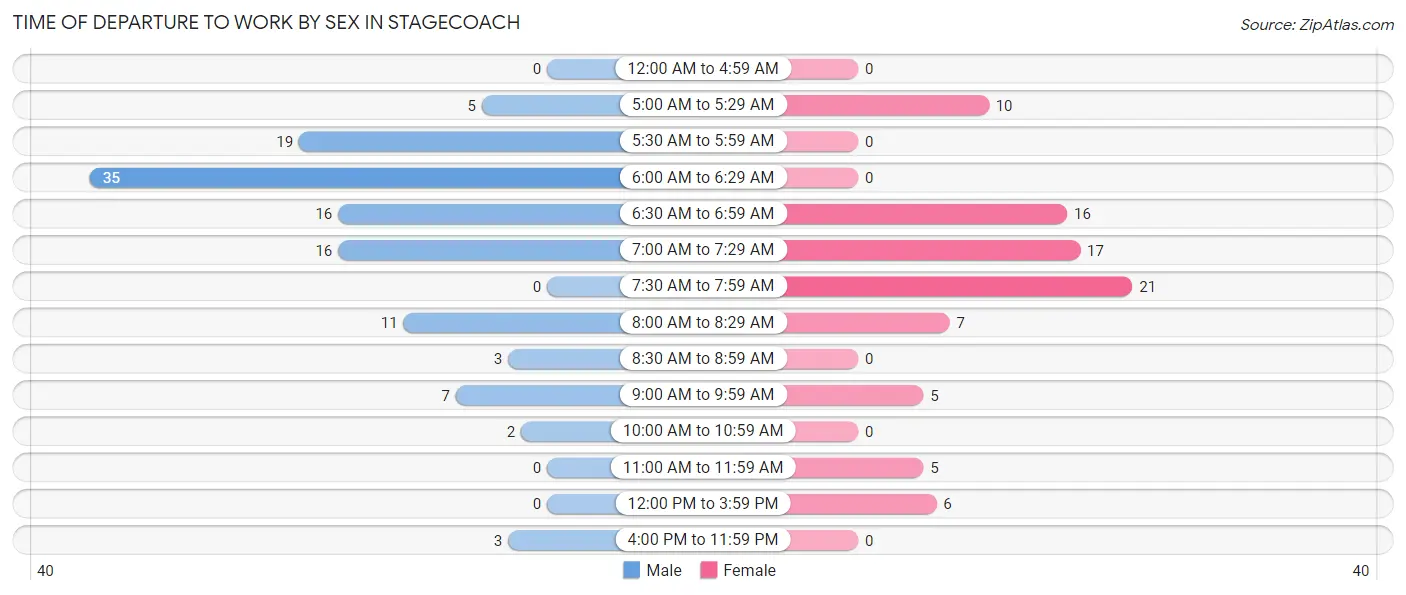
| Time of Departure | Male | Female |
| 12:00 AM to 4:59 AM | 0 (0.0%) | 0 (0.0%) |
| 5:00 AM to 5:29 AM | 5 (4.3%) | 10 (11.5%) |
| 5:30 AM to 5:59 AM | 19 (16.2%) | 0 (0.0%) |
| 6:00 AM to 6:29 AM | 35 (29.9%) | 0 (0.0%) |
| 6:30 AM to 6:59 AM | 16 (13.7%) | 16 (18.4%) |
| 7:00 AM to 7:29 AM | 16 (13.7%) | 17 (19.5%) |
| 7:30 AM to 7:59 AM | 0 (0.0%) | 21 (24.1%) |
| 8:00 AM to 8:29 AM | 11 (9.4%) | 7 (8.1%) |
| 8:30 AM to 8:59 AM | 3 (2.6%) | 0 (0.0%) |
| 9:00 AM to 9:59 AM | 7 (6.0%) | 5 (5.8%) |
| 10:00 AM to 10:59 AM | 2 (1.7%) | 0 (0.0%) |
| 11:00 AM to 11:59 AM | 0 (0.0%) | 5 (5.8%) |
| 12:00 PM to 3:59 PM | 0 (0.0%) | 6 (6.9%) |
| 4:00 PM to 11:59 PM | 3 (2.6%) | 0 (0.0%) |
| Total | 117 (100.0%) | 87 (100.0%) |
Housing Occupancy in Stagecoach
Occupancy by Ownership in Stagecoach
Of the total 203 dwellings in Stagecoach, owner-occupied units account for 198 (97.5%), while renter-occupied units make up 5 (2.5%).
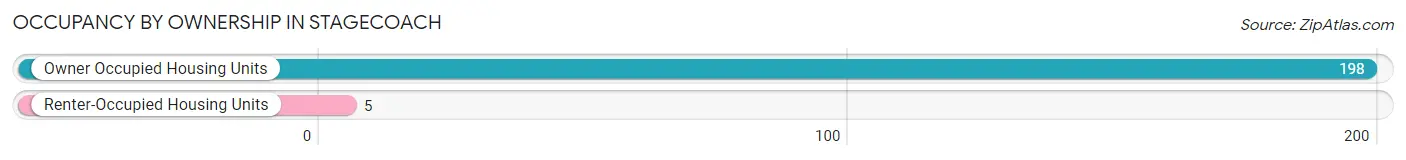
| Occupancy | # Housing Units | % Housing Units |
| Owner Occupied Housing Units | 198 | 97.5% |
| Renter-Occupied Housing Units | 5 | 2.5% |
| Total Occupied Housing Units | 203 | 100.0% |
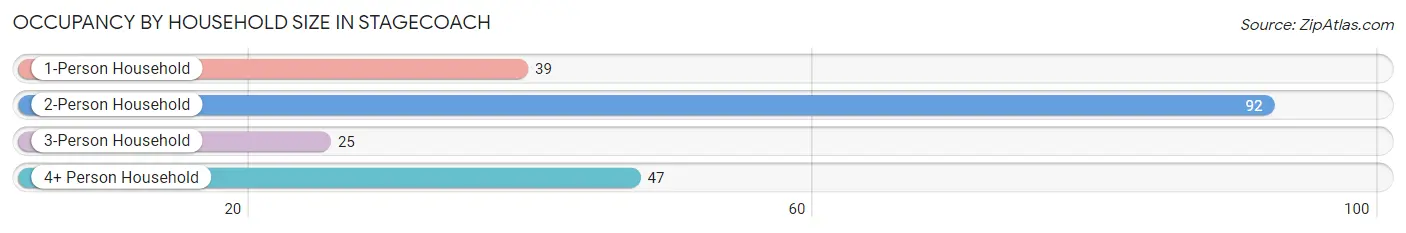
Occupancy by Household Size in Stagecoach
| Household Size | # Housing Units | % Housing Units |
| 1-Person Household | 39 | 19.2% |
| 2-Person Household | 92 | 45.3% |
| 3-Person Household | 25 | 12.3% |
| 4+ Person Household | 47 | 23.2% |
| Total Housing Units | 203 | 100.0% |
Occupancy by Ownership by Household Size in Stagecoach
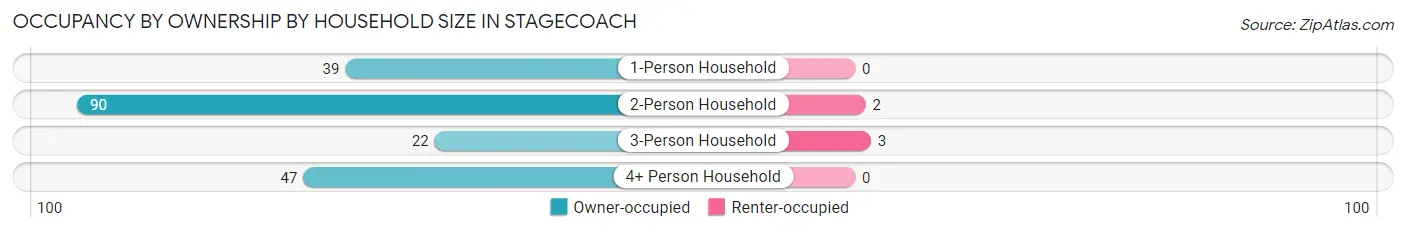
| Household Size | Owner-occupied | Renter-occupied |
| 1-Person Household | 39 (100.0%) | 0 (0.0%) |
| 2-Person Household | 90 (97.8%) | 2 (2.2%) |
| 3-Person Household | 22 (88.0%) | 3 (12.0%) |
| 4+ Person Household | 47 (100.0%) | 0 (0.0%) |
| Total Housing Units | 198 (97.5%) | 5 (2.5%) |
Occupancy by Educational Attainment in Stagecoach
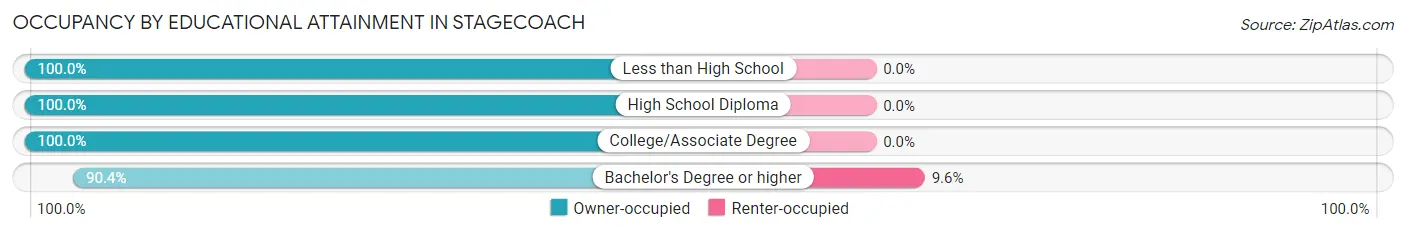
| Household Size | Owner-occupied | Renter-occupied |
| Less than High School | 5 (100.0%) | 0 (0.0%) |
| High School Diploma | 68 (100.0%) | 0 (0.0%) |
| College/Associate Degree | 78 (100.0%) | 0 (0.0%) |
| Bachelor's Degree or higher | 47 (90.4%) | 5 (9.6%) |
Occupancy by Age of Householder in Stagecoach
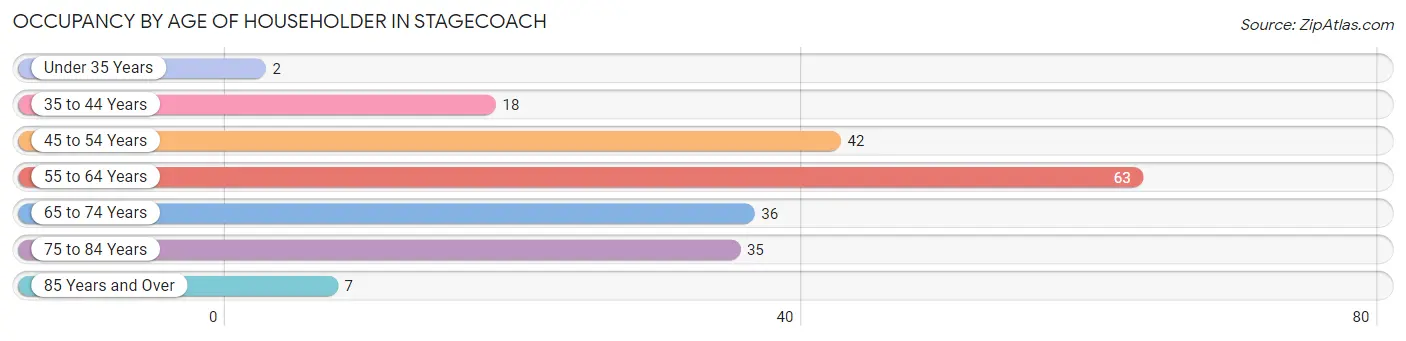
| Age Bracket | # Households | % Households |
| Under 35 Years | 2 | 1.0% |
| 35 to 44 Years | 18 | 8.9% |
| 45 to 54 Years | 42 | 20.7% |
| 55 to 64 Years | 63 | 31.0% |
| 65 to 74 Years | 36 | 17.7% |
| 75 to 84 Years | 35 | 17.2% |
| 85 Years and Over | 7 | 3.5% |
| Total | 203 | 100.0% |
Housing Finances in Stagecoach
Median Income by Occupancy in Stagecoach
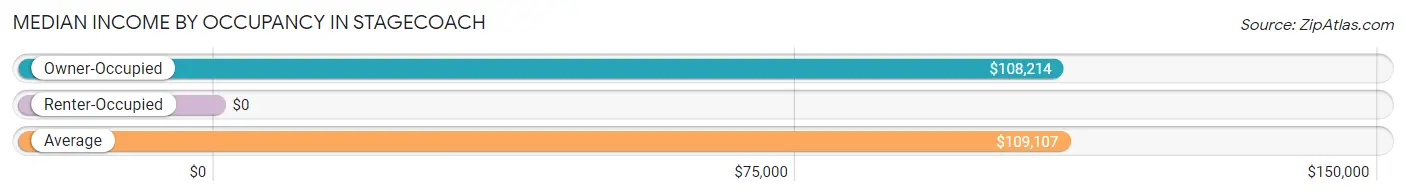
| Occupancy Type | # Households | Median Income |
| Owner-Occupied | 198 (97.5%) | $108,214 |
| Renter-Occupied | 5 (2.5%) | $0 |
| Average | 203 (100.0%) | $109,107 |
Occupancy by Householder Income Bracket in Stagecoach
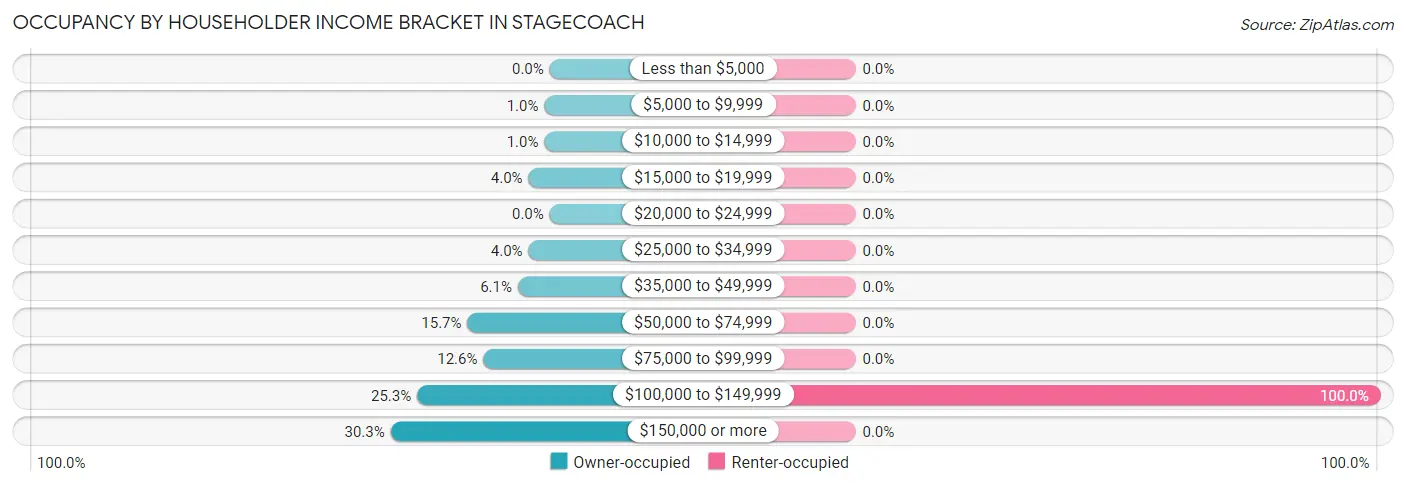
| Income Bracket | Owner-occupied | Renter-occupied |
| Less than $5,000 | 0 (0.0%) | 0 (0.0%) |
| $5,000 to $9,999 | 2 (1.0%) | 0 (0.0%) |
| $10,000 to $14,999 | 2 (1.0%) | 0 (0.0%) |
| $15,000 to $19,999 | 8 (4.0%) | 0 (0.0%) |
| $20,000 to $24,999 | 0 (0.0%) | 0 (0.0%) |
| $25,000 to $34,999 | 8 (4.0%) | 0 (0.0%) |
| $35,000 to $49,999 | 12 (6.1%) | 0 (0.0%) |
| $50,000 to $74,999 | 31 (15.7%) | 0 (0.0%) |
| $75,000 to $99,999 | 25 (12.6%) | 0 (0.0%) |
| $100,000 to $149,999 | 50 (25.3%) | 5 (100.0%) |
| $150,000 or more | 60 (30.3%) | 0 (0.0%) |
| Total | 198 (100.0%) | 5 (100.0%) |
Monthly Housing Cost Tiers in Stagecoach
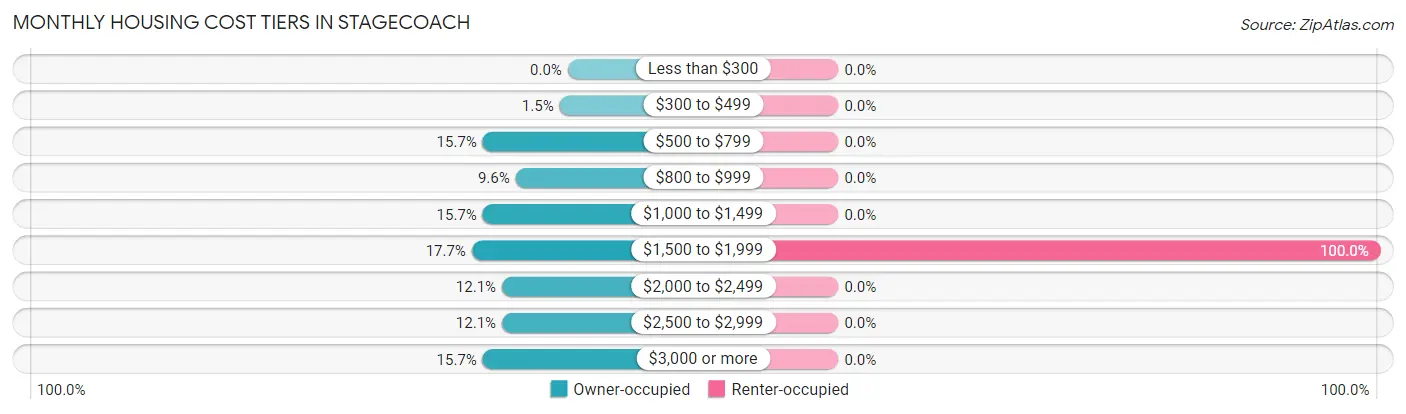
| Monthly Cost | Owner-occupied | Renter-occupied |
| Less than $300 | 0 (0.0%) | 0 (0.0%) |
| $300 to $499 | 3 (1.5%) | 0 (0.0%) |
| $500 to $799 | 31 (15.7%) | 0 (0.0%) |
| $800 to $999 | 19 (9.6%) | 0 (0.0%) |
| $1,000 to $1,499 | 31 (15.7%) | 0 (0.0%) |
| $1,500 to $1,999 | 35 (17.7%) | 5 (100.0%) |
| $2,000 to $2,499 | 24 (12.1%) | 0 (0.0%) |
| $2,500 to $2,999 | 24 (12.1%) | 0 (0.0%) |
| $3,000 or more | 31 (15.7%) | 0 (0.0%) |
| Total | 198 (100.0%) | 5 (100.0%) |
Physical Housing Characteristics in Stagecoach
Housing Structures in Stagecoach
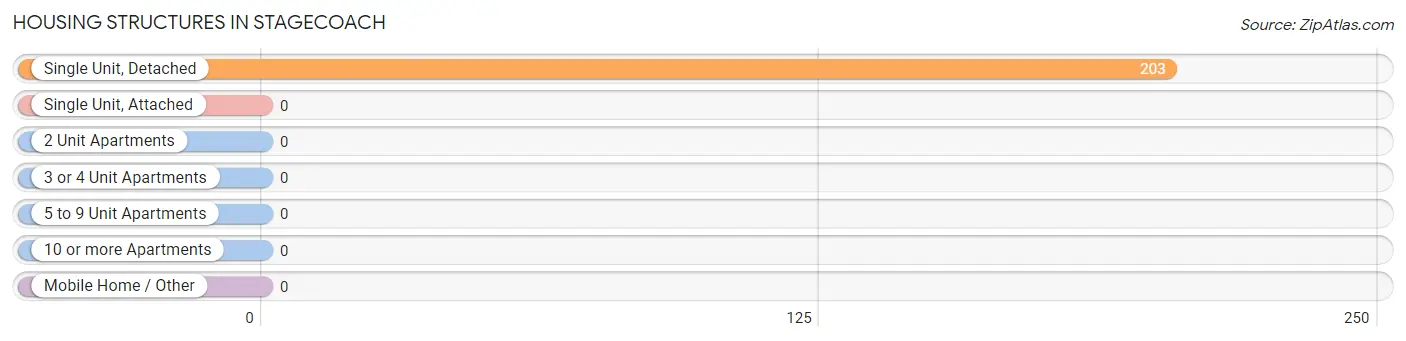
| Structure Type | # Housing Units | % Housing Units |
| Single Unit, Detached | 203 | 100.0% |
| Single Unit, Attached | 0 | 0.0% |
| 2 Unit Apartments | 0 | 0.0% |
| 3 or 4 Unit Apartments | 0 | 0.0% |
| 5 to 9 Unit Apartments | 0 | 0.0% |
| 10 or more Apartments | 0 | 0.0% |
| Mobile Home / Other | 0 | 0.0% |
| Total | 203 | 100.0% |
Housing Structures by Occupancy in Stagecoach
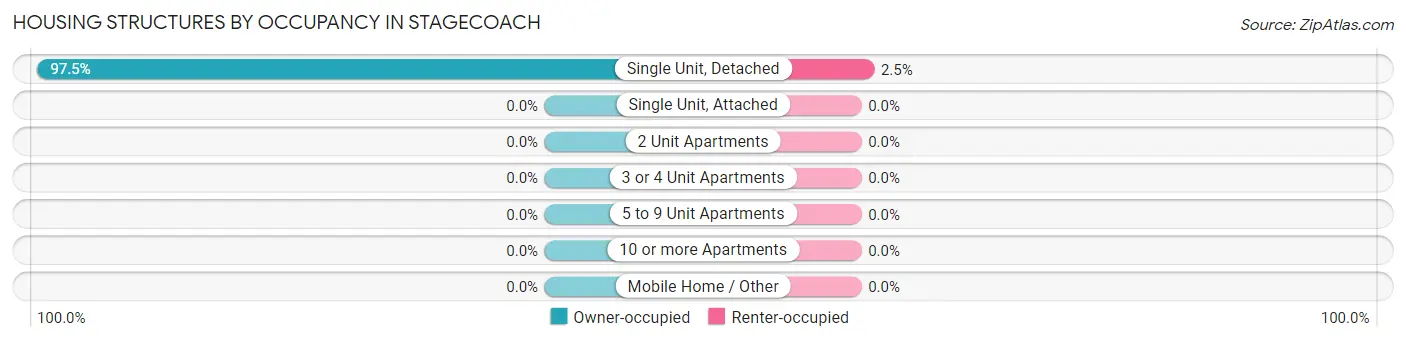
| Structure Type | Owner-occupied | Renter-occupied |
| Single Unit, Detached | 198 (97.5%) | 5 (2.5%) |
| Single Unit, Attached | 0 (0.0%) | 0 (0.0%) |
| 2 Unit Apartments | 0 (0.0%) | 0 (0.0%) |
| 3 or 4 Unit Apartments | 0 (0.0%) | 0 (0.0%) |
| 5 to 9 Unit Apartments | 0 (0.0%) | 0 (0.0%) |
| 10 or more Apartments | 0 (0.0%) | 0 (0.0%) |
| Mobile Home / Other | 0 (0.0%) | 0 (0.0%) |
| Total | 198 (97.5%) | 5 (2.5%) |
Housing Structures by Number of Rooms in Stagecoach
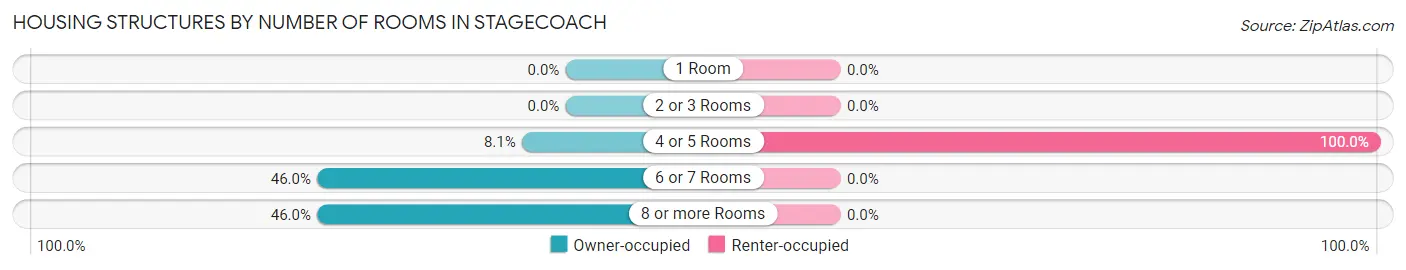
| Number of Rooms | Owner-occupied | Renter-occupied |
| 1 Room | 0 (0.0%) | 0 (0.0%) |
| 2 or 3 Rooms | 0 (0.0%) | 0 (0.0%) |
| 4 or 5 Rooms | 16 (8.1%) | 5 (100.0%) |
| 6 or 7 Rooms | 91 (46.0%) | 0 (0.0%) |
| 8 or more Rooms | 91 (46.0%) | 0 (0.0%) |
| Total | 198 (100.0%) | 5 (100.0%) |
Housing Structure by Heating Type in Stagecoach
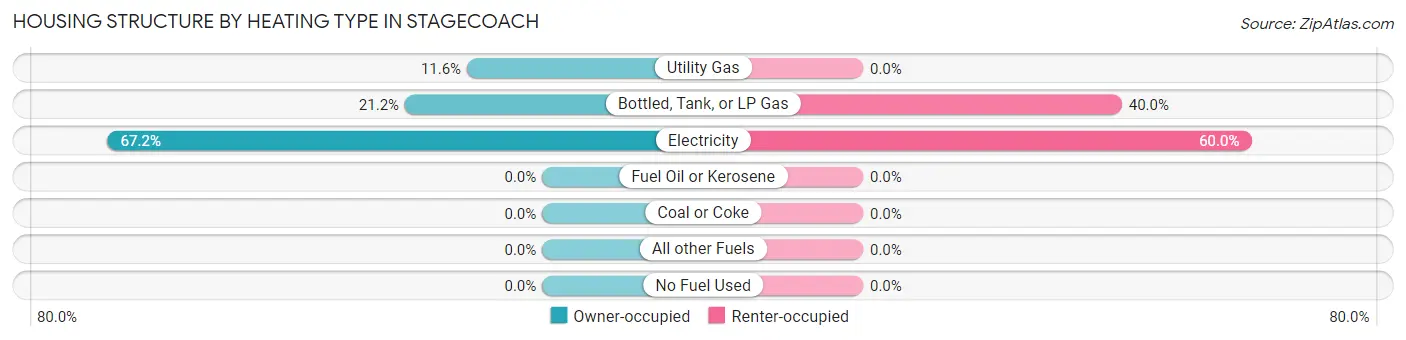
| Heating Type | Owner-occupied | Renter-occupied |
| Utility Gas | 23 (11.6%) | 0 (0.0%) |
| Bottled, Tank, or LP Gas | 42 (21.2%) | 2 (40.0%) |
| Electricity | 133 (67.2%) | 3 (60.0%) |
| Fuel Oil or Kerosene | 0 (0.0%) | 0 (0.0%) |
| Coal or Coke | 0 (0.0%) | 0 (0.0%) |
| All other Fuels | 0 (0.0%) | 0 (0.0%) |
| No Fuel Used | 0 (0.0%) | 0 (0.0%) |
| Total | 198 (100.0%) | 5 (100.0%) |
Household Vehicle Usage in Stagecoach
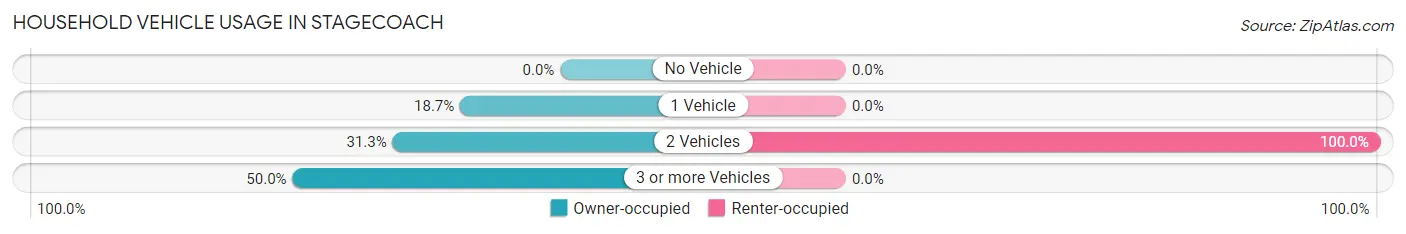
| Vehicles per Household | Owner-occupied | Renter-occupied |
| No Vehicle | 0 (0.0%) | 0 (0.0%) |
| 1 Vehicle | 37 (18.7%) | 0 (0.0%) |
| 2 Vehicles | 62 (31.3%) | 5 (100.0%) |
| 3 or more Vehicles | 99 (50.0%) | 0 (0.0%) |
| Total | 198 (100.0%) | 5 (100.0%) |
Real Estate & Mortgages in Stagecoach
Real Estate and Mortgage Overview in Stagecoach
| Characteristic | Without Mortgage | With Mortgage |
| Housing Units | 74 | 124 |
| Median Property Value | $405,900 | $352,400 |
| Median Household Income | $106,250 | $42 |
| Monthly Housing Costs | $850 | $31 |
| Real Estate Taxes | $3,385 | $3 |
Property Value by Mortgage Status in Stagecoach
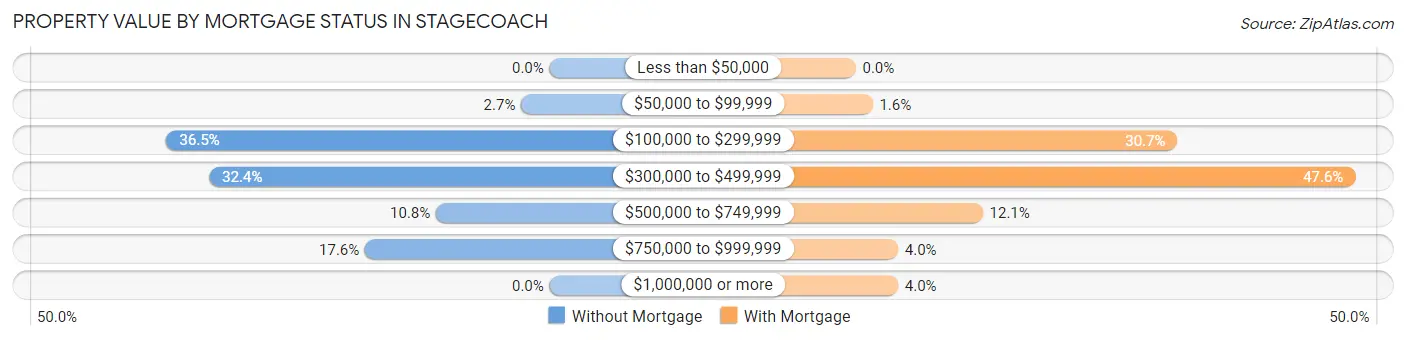
| Property Value | Without Mortgage | With Mortgage |
| Less than $50,000 | 0 (0.0%) | 0 (0.0%) |
| $50,000 to $99,999 | 2 (2.7%) | 2 (1.6%) |
| $100,000 to $299,999 | 27 (36.5%) | 38 (30.6%) |
| $300,000 to $499,999 | 24 (32.4%) | 59 (47.6%) |
| $500,000 to $749,999 | 8 (10.8%) | 15 (12.1%) |
| $750,000 to $999,999 | 13 (17.6%) | 5 (4.0%) |
| $1,000,000 or more | 0 (0.0%) | 5 (4.0%) |
| Total | 74 (100.0%) | 124 (100.0%) |
Household Income by Mortgage Status in Stagecoach
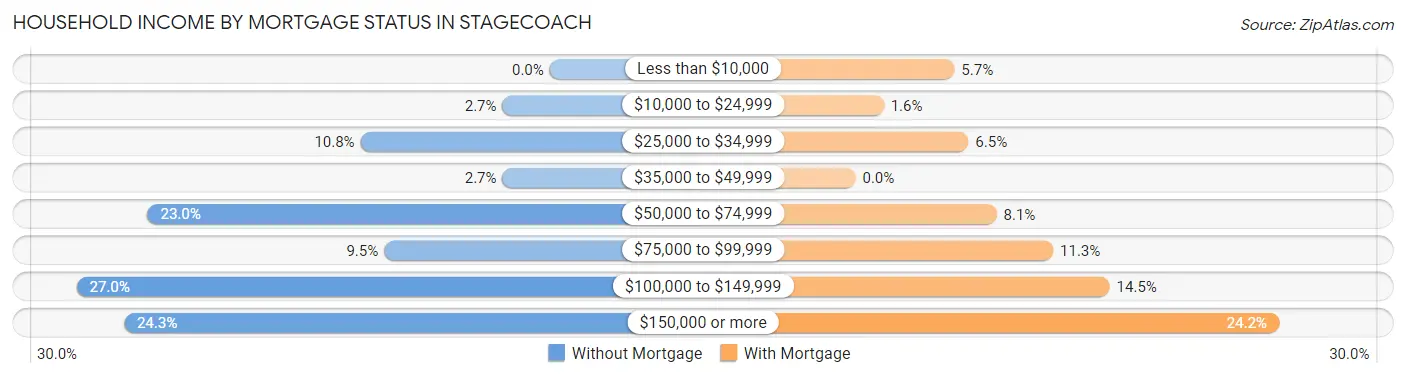
| Household Income | Without Mortgage | With Mortgage |
| Less than $10,000 | 0 (0.0%) | 7 (5.7%) |
| $10,000 to $24,999 | 2 (2.7%) | 2 (1.6%) |
| $25,000 to $34,999 | 8 (10.8%) | 8 (6.5%) |
| $35,000 to $49,999 | 2 (2.7%) | 0 (0.0%) |
| $50,000 to $74,999 | 17 (23.0%) | 10 (8.1%) |
| $75,000 to $99,999 | 7 (9.5%) | 14 (11.3%) |
| $100,000 to $149,999 | 20 (27.0%) | 18 (14.5%) |
| $150,000 or more | 18 (24.3%) | 30 (24.2%) |
| Total | 74 (100.0%) | 124 (100.0%) |
Property Value to Household Income Ratio in Stagecoach
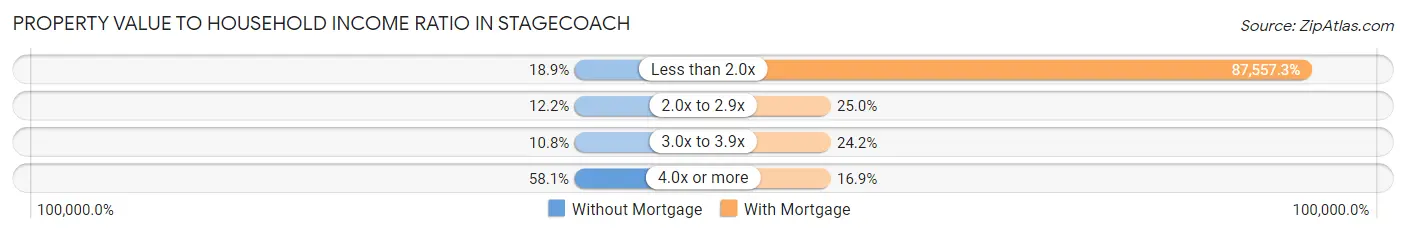
| Value-to-Income Ratio | Without Mortgage | With Mortgage |
| Less than 2.0x | 14 (18.9%) | 108,571 (87,557.3%) |
| 2.0x to 2.9x | 9 (12.2%) | 31 (25.0%) |
| 3.0x to 3.9x | 8 (10.8%) | 30 (24.2%) |
| 4.0x or more | 43 (58.1%) | 21 (16.9%) |
| Total | 74 (100.0%) | 124 (100.0%) |
Real Estate Taxes by Mortgage Status in Stagecoach

| Property Taxes | Without Mortgage | With Mortgage |
| Less than $800 | 3 (4.1%) | 0 (0.0%) |
| $800 to $1,499 | 0 (0.0%) | 0 (0.0%) |
| $800 to $1,499 | 71 (96.0%) | 9 (7.3%) |
| Total | 74 (100.0%) | 124 (100.0%) |
Health & Disability in Stagecoach
Health Insurance Coverage by Age in Stagecoach
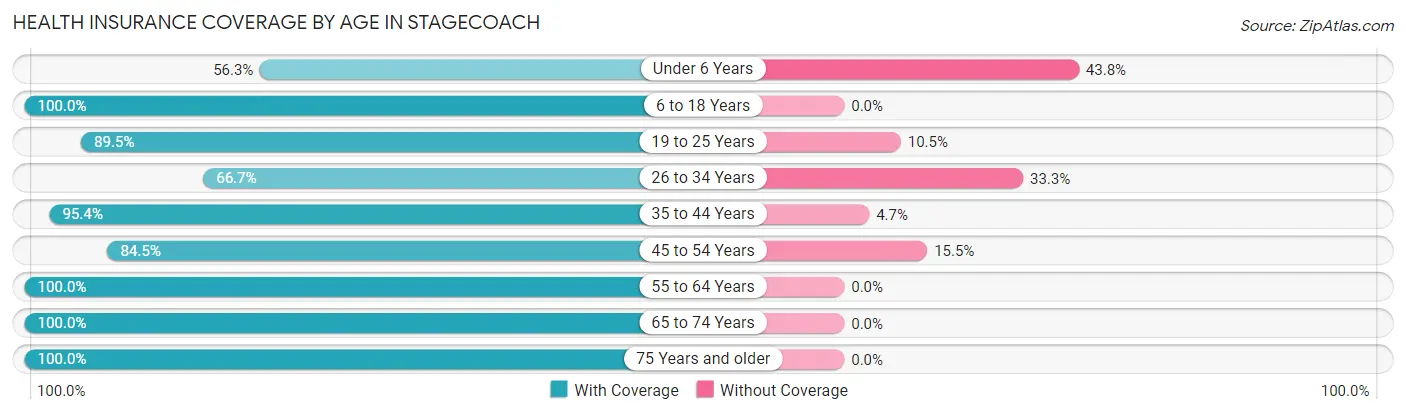
| Age Bracket | With Coverage | Without Coverage |
| Under 6 Years | 9 (56.2%) | 7 (43.8%) |
| 6 to 18 Years | 112 (100.0%) | 0 (0.0%) |
| 19 to 25 Years | 17 (89.5%) | 2 (10.5%) |
| 26 to 34 Years | 14 (66.7%) | 7 (33.3%) |
| 35 to 44 Years | 41 (95.4%) | 2 (4.6%) |
| 45 to 54 Years | 82 (84.5%) | 15 (15.5%) |
| 55 to 64 Years | 116 (100.0%) | 0 (0.0%) |
| 65 to 74 Years | 57 (100.0%) | 0 (0.0%) |
| 75 Years and older | 73 (100.0%) | 0 (0.0%) |
| Total | 521 (94.0%) | 33 (6.0%) |
Health Insurance Coverage by Citizenship Status in Stagecoach

| Citizenship Status | With Coverage | Without Coverage |
| Native Born | 9 (56.2%) | 7 (43.8%) |
| Foreign Born, Citizen | 112 (100.0%) | 0 (0.0%) |
| Foreign Born, not a Citizen | 17 (89.5%) | 2 (10.5%) |
Health Insurance Coverage by Household Income in Stagecoach
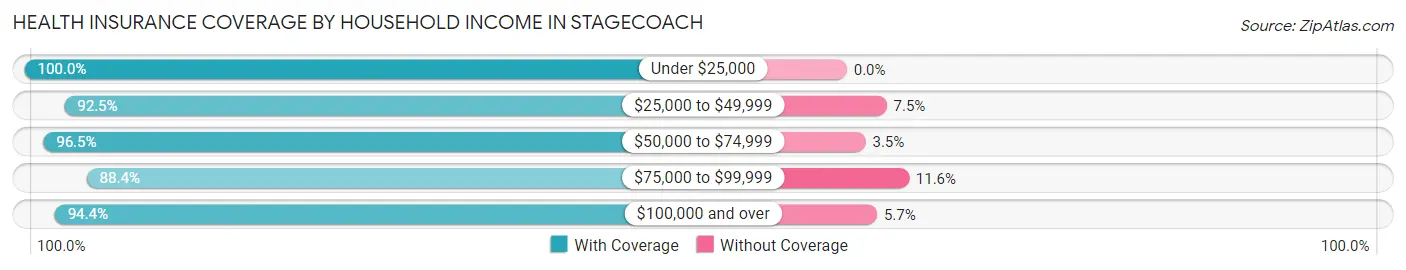
| Household Income | With Coverage | Without Coverage |
| Under $25,000 | 15 (100.0%) | 0 (0.0%) |
| $25,000 to $49,999 | 62 (92.5%) | 5 (7.5%) |
| $50,000 to $74,999 | 55 (96.5%) | 2 (3.5%) |
| $75,000 to $99,999 | 38 (88.4%) | 5 (11.6%) |
| $100,000 and over | 351 (94.4%) | 21 (5.7%) |
Public vs Private Health Insurance Coverage by Age in Stagecoach
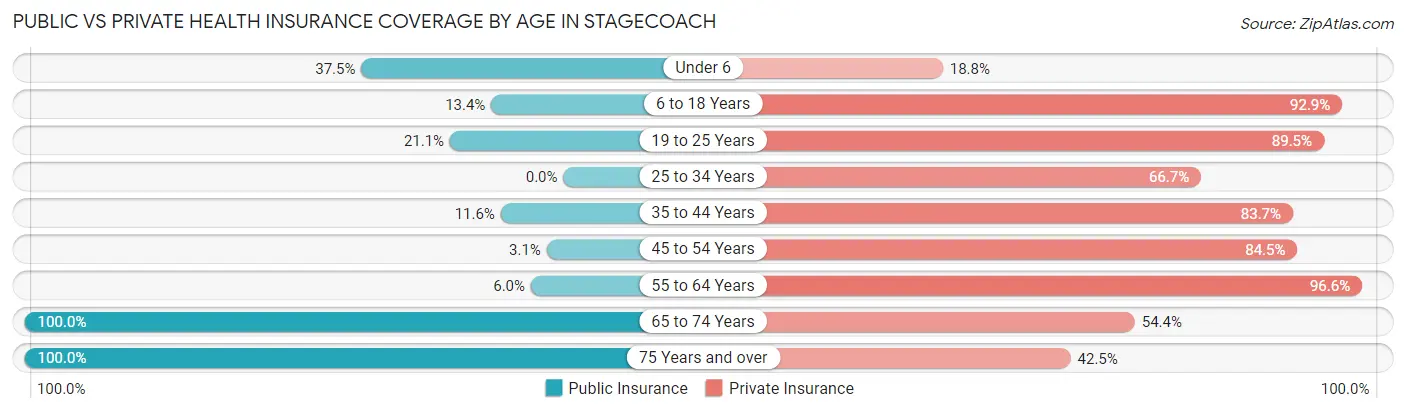
| Age Bracket | Public Insurance | Private Insurance |
| Under 6 | 6 (37.5%) | 3 (18.8%) |
| 6 to 18 Years | 15 (13.4%) | 104 (92.9%) |
| 19 to 25 Years | 4 (21.0%) | 17 (89.5%) |
| 25 to 34 Years | 0 (0.0%) | 14 (66.7%) |
| 35 to 44 Years | 5 (11.6%) | 36 (83.7%) |
| 45 to 54 Years | 3 (3.1%) | 82 (84.5%) |
| 55 to 64 Years | 7 (6.0%) | 112 (96.6%) |
| 65 to 74 Years | 57 (100.0%) | 31 (54.4%) |
| 75 Years and over | 73 (100.0%) | 31 (42.5%) |
| Total | 170 (30.7%) | 430 (77.6%) |
Disability Status by Sex by Age in Stagecoach
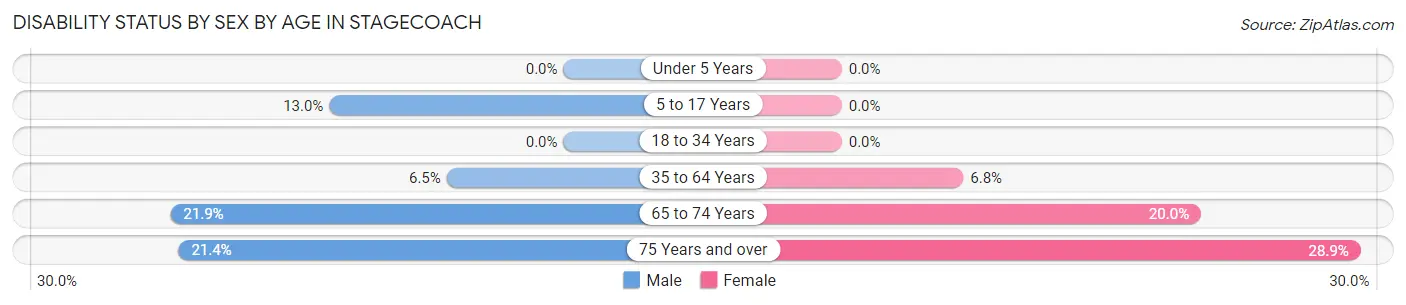
| Age Bracket | Male | Female |
| Under 5 Years | 0 (0.0%) | 0 (0.0%) |
| 5 to 17 Years | 9 (13.0%) | 0 (0.0%) |
| 18 to 34 Years | 0 (0.0%) | 0 (0.0%) |
| 35 to 64 Years | 8 (6.5%) | 9 (6.8%) |
| 65 to 74 Years | 7 (21.9%) | 5 (20.0%) |
| 75 Years and over | 6 (21.4%) | 13 (28.9%) |
Disability Class by Sex by Age in Stagecoach
Disability Class: Hearing Difficulty
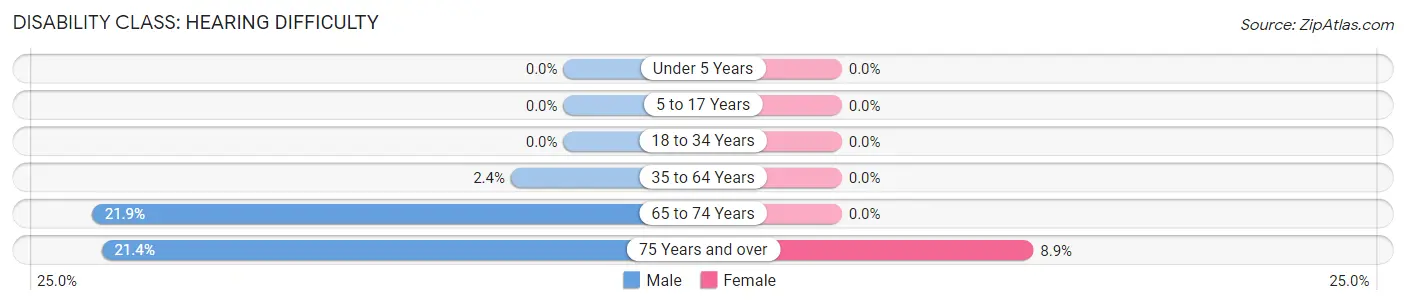
| Age Bracket | Male | Female |
| Under 5 Years | 0 (0.0%) | 0 (0.0%) |
| 5 to 17 Years | 0 (0.0%) | 0 (0.0%) |
| 18 to 34 Years | 0 (0.0%) | 0 (0.0%) |
| 35 to 64 Years | 3 (2.4%) | 0 (0.0%) |
| 65 to 74 Years | 7 (21.9%) | 0 (0.0%) |
| 75 Years and over | 6 (21.4%) | 4 (8.9%) |
Disability Class: Vision Difficulty
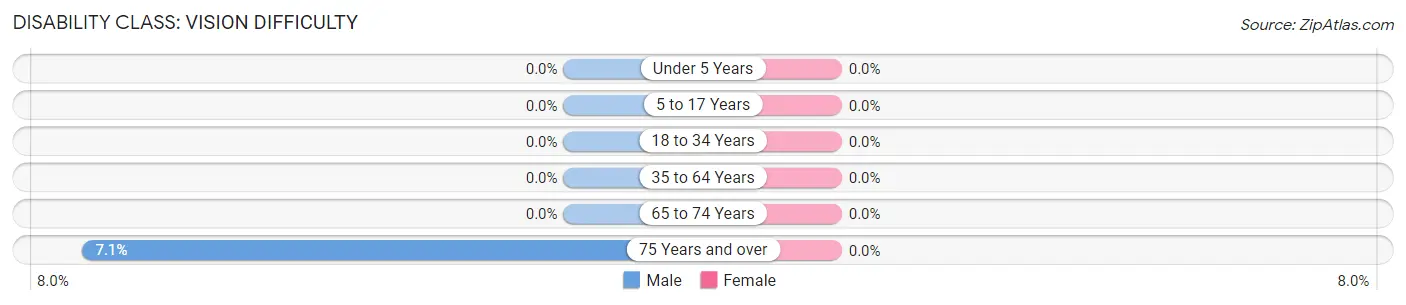
| Age Bracket | Male | Female |
| Under 5 Years | 0 (0.0%) | 0 (0.0%) |
| 5 to 17 Years | 0 (0.0%) | 0 (0.0%) |
| 18 to 34 Years | 0 (0.0%) | 0 (0.0%) |
| 35 to 64 Years | 0 (0.0%) | 0 (0.0%) |
| 65 to 74 Years | 0 (0.0%) | 0 (0.0%) |
| 75 Years and over | 2 (7.1%) | 0 (0.0%) |
Disability Class: Cognitive Difficulty
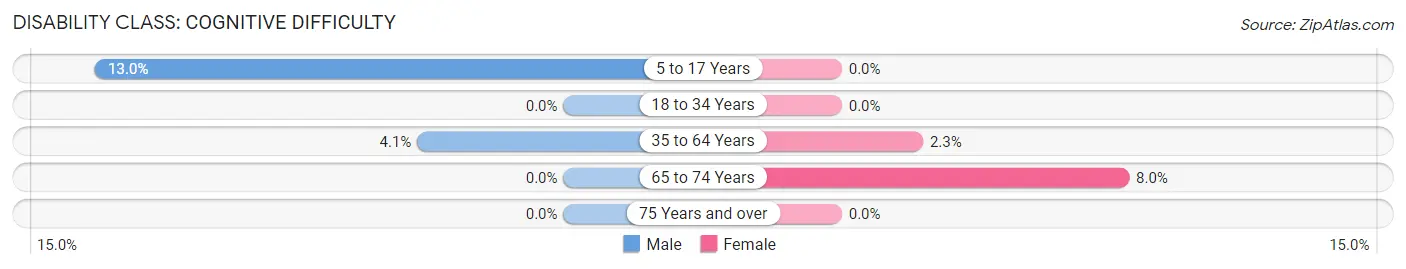
| Age Bracket | Male | Female |
| 5 to 17 Years | 9 (13.0%) | 0 (0.0%) |
| 18 to 34 Years | 0 (0.0%) | 0 (0.0%) |
| 35 to 64 Years | 5 (4.1%) | 3 (2.3%) |
| 65 to 74 Years | 0 (0.0%) | 2 (8.0%) |
| 75 Years and over | 0 (0.0%) | 0 (0.0%) |
Disability Class: Ambulatory Difficulty
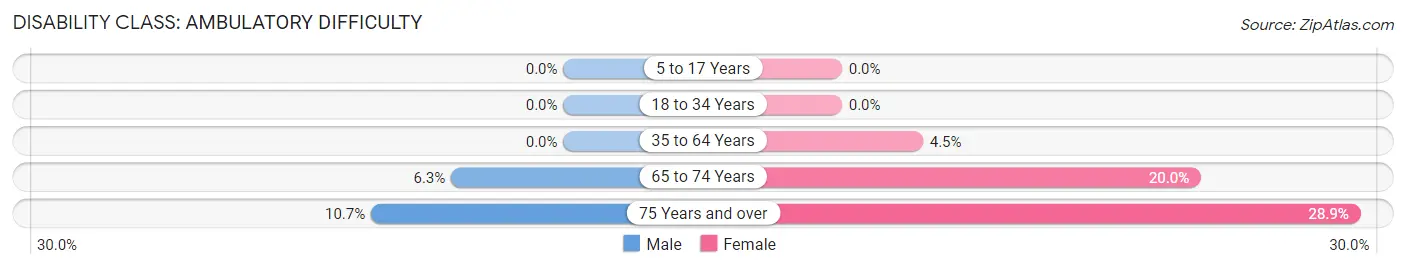
| Age Bracket | Male | Female |
| 5 to 17 Years | 0 (0.0%) | 0 (0.0%) |
| 18 to 34 Years | 0 (0.0%) | 0 (0.0%) |
| 35 to 64 Years | 0 (0.0%) | 6 (4.5%) |
| 65 to 74 Years | 2 (6.2%) | 5 (20.0%) |
| 75 Years and over | 3 (10.7%) | 13 (28.9%) |
Disability Class: Self-Care Difficulty
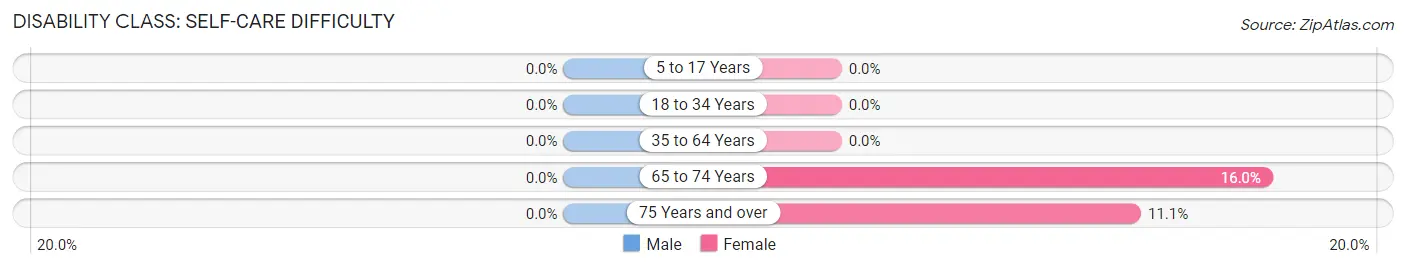
| Age Bracket | Male | Female |
| 5 to 17 Years | 0 (0.0%) | 0 (0.0%) |
| 18 to 34 Years | 0 (0.0%) | 0 (0.0%) |
| 35 to 64 Years | 0 (0.0%) | 0 (0.0%) |
| 65 to 74 Years | 0 (0.0%) | 4 (16.0%) |
| 75 Years and over | 0 (0.0%) | 5 (11.1%) |
Technology Access in Stagecoach
Computing Device Access in Stagecoach
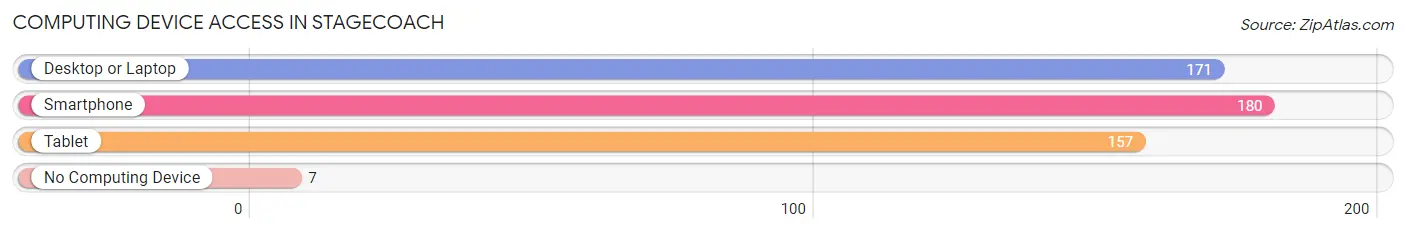
| Device Type | # Households | % Households |
| Desktop or Laptop | 171 | 84.2% |
| Smartphone | 180 | 88.7% |
| Tablet | 157 | 77.3% |
| No Computing Device | 7 | 3.5% |
| Total | 203 | 100.0% |
Internet Access in Stagecoach
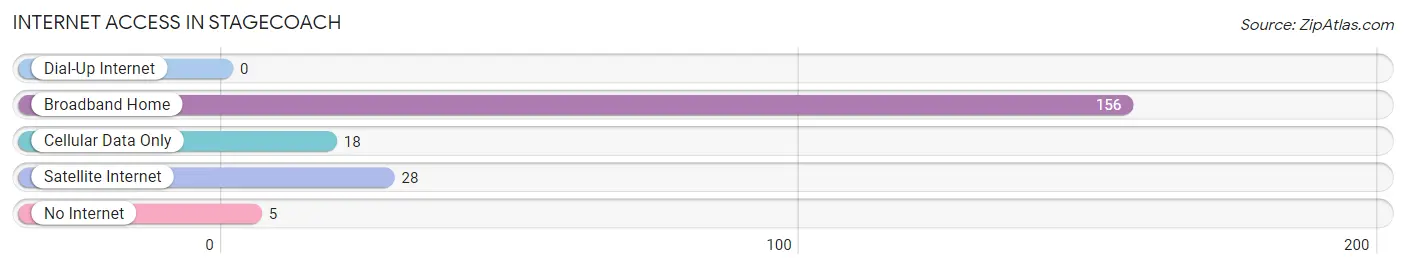
| Internet Type | # Households | % Households |
| Dial-Up Internet | 0 | 0.0% |
| Broadband Home | 156 | 76.8% |
| Cellular Data Only | 18 | 8.9% |
| Satellite Internet | 28 | 13.8% |
| No Internet | 5 | 2.5% |
| Total | 203 | 100.0% |
Stagecoach Summary
Stagecoach, Texas is a small unincorporated community located in Montgomery County, Texas. It is situated about 25 miles north of Houston and is part of the Houston–The Woodlands–Sugar Land metropolitan area. The population of Stagecoach was estimated to be around 1,000 in 2020.
History
Stagecoach was founded in the late 1800s by a group of settlers who were looking for a place to settle down and start a new life. The town was named after the stagecoaches that used to travel through the area. The first post office was established in 1891 and the town was officially incorporated in 1895.
Stagecoach was a thriving community in the early 1900s, with a population of over 1,000 people. The town had a school, a general store, a blacksmith shop, a cotton gin, and a few other businesses. The town was also home to a number of churches, including the First Baptist Church of Stagecoach, which was founded in 1891.
In the 1920s, the town began to decline as the railroad bypassed it and the population began to move away. By the 1940s, the population had dropped to around 500 people. The town continued to decline until the 1970s, when it began to experience a resurgence.
Geography
Stagecoach is located in Montgomery County, Texas, about 25 miles north of Houston. The town is situated on the banks of the San Jacinto River and is surrounded by rolling hills and wooded areas. The climate in Stagecoach is humid subtropical, with hot summers and mild winters.
Economy
Stagecoach is a small, rural community with a limited economy. The town is home to a few small businesses, including a general store, a gas station, and a few restaurants. The town also has a few churches and a post office.
The main economic activity in Stagecoach is agriculture. The town is home to several farms, which produce a variety of crops, including cotton, corn, and soybeans. The town also has a few small businesses, such as a sawmill and a feed store.
Demographics
The population of Stagecoach was estimated to be around 1,000 in 2020. The town is predominantly white, with a small Hispanic population. The median household income in Stagecoach is around $50,000, which is slightly lower than the national average.
Conclusion
Stagecoach, Texas is a small unincorporated community located in Montgomery County, Texas. It is situated about 25 miles north of Houston and is part of the Houston–The Woodlands–Sugar Land metropolitan area. The population of Stagecoach was estimated to be around 1,000 in 2020. The town is predominantly white, with a small Hispanic population. The main economic activity in Stagecoach is agriculture, with a few small businesses and churches. The median household income in Stagecoach is around $50,000, which is slightly lower than the national average.
Common Questions
What is Per Capita Income in Stagecoach?
Per Capita income in Stagecoach is $45,304.
What is the Median Family Income in Stagecoach?
Median Family Income in Stagecoach is $113,229.
What is the Median Household income in Stagecoach?
Median Household Income in Stagecoach is $109,107.
What is Income or Wage Gap in Stagecoach?
Income or Wage Gap in Stagecoach is 2.4%.
Women in Stagecoach earn 97.6 cents for every dollar earned by a man.
What is Inequality or Gini Index in Stagecoach?
Inequality or Gini Index in Stagecoach is 0.37.
What is the Total Population of Stagecoach?
Total Population of Stagecoach is 554.
What is the Total Male Population of Stagecoach?
Total Male Population of Stagecoach is 296.
What is the Total Female Population of Stagecoach?
Total Female Population of Stagecoach is 258.
What is the Ratio of Males per 100 Females in Stagecoach?
There are 114.73 Males per 100 Females in Stagecoach.
What is the Ratio of Females per 100 Males in Stagecoach?
There are 87.16 Females per 100 Males in Stagecoach.
What is the Median Population Age in Stagecoach?
Median Population Age in Stagecoach is 53.0 Years.
What is the Average Family Size in Stagecoach
Average Family Size in Stagecoach is 3.2 People.
What is the Average Household Size in Stagecoach
Average Household Size in Stagecoach is 2.7 People.
How Large is the Labor Force in Stagecoach?
There are 240 People in the Labor Forcein in Stagecoach.
What is the Percentage of People in the Labor Force in Stagecoach?
52.5% of People are in the Labor Force in Stagecoach.
What is the Unemployment Rate in Stagecoach?
Unemployment Rate in Stagecoach is 4.6%.