Uvalde Estates, TX Map & Demographics
Uvalde Estates Map
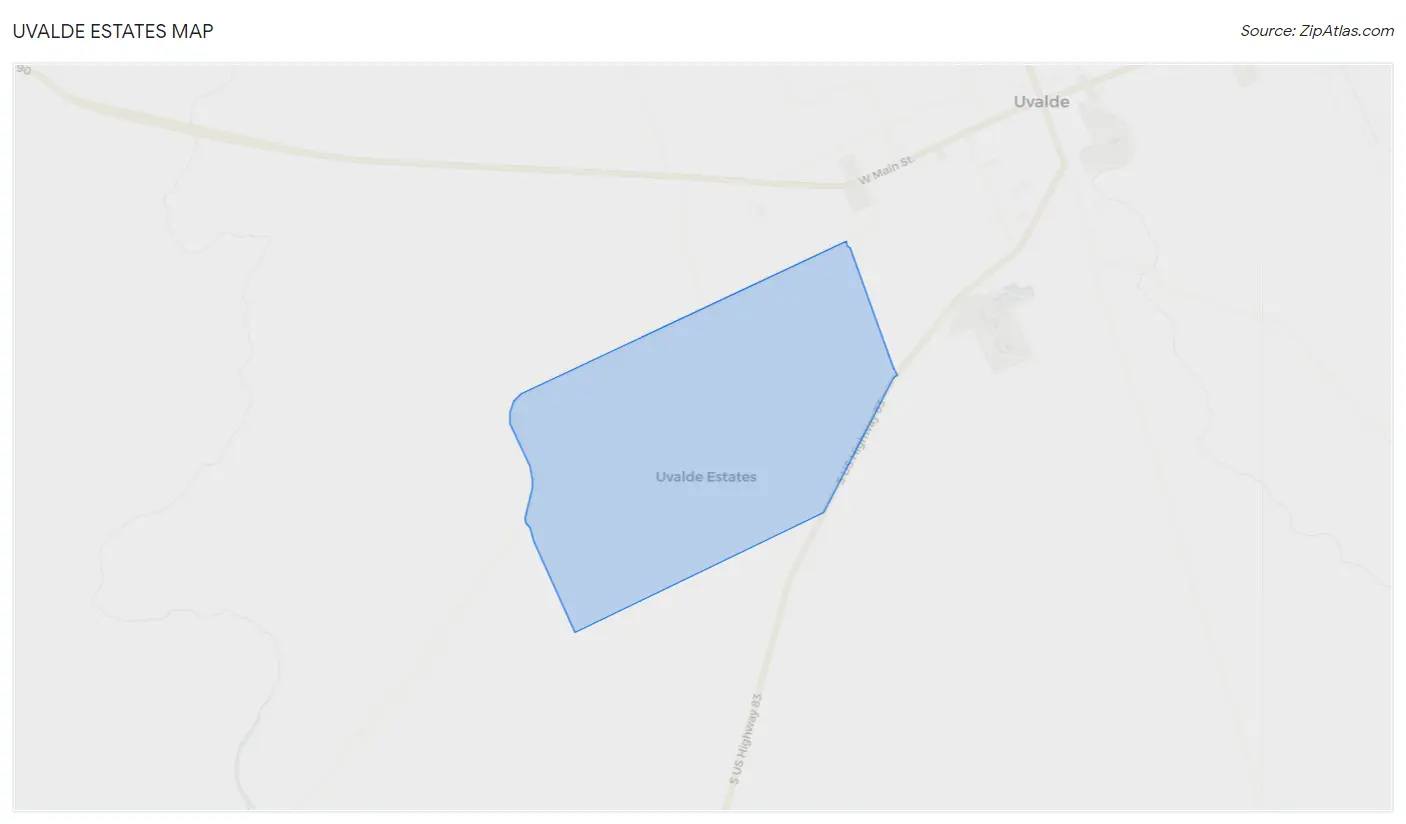
Uvalde Estates Overview
$16,997
PER CAPITA INCOME
0.50
INEQUALITY / GINI INDEX
2,819
TOTAL POPULATION
1,651
MALE POPULATION
1,168
FEMALE POPULATION
141.35
MALES / 100 FEMALES
70.75
FEMALES / 100 MALES
33.7
MEDIAN AGE
4.0
AVG FAMILY SIZE
3.3
AVG HOUSEHOLD SIZE
1,022
LABOR FORCE [ PEOPLE ]
44.2%
PERCENT IN LABOR FORCE
16.3%
UNEMPLOYMENT RATE
Income in Uvalde Estates
Income Overview in Uvalde Estates
| Characteristic | Number | Measure |
| Per Capita Income | 2,819 | $16,997 |
| Median Family Income | 665 | $0 |
| Mean Family Income | 665 | $63,407 |
| Median Household Income | 846 | $0 |
| Mean Household Income | 846 | $58,211 |
| Income Deficit | 665 | $0 |
| Wage / Income Gap (%) | 2,819 | 0.00% |
| Wage / Income Gap ($) | 2,819 | 100.00¢ per $1 |
| Gini / Inequality Index | 2,819 | 0.50 |
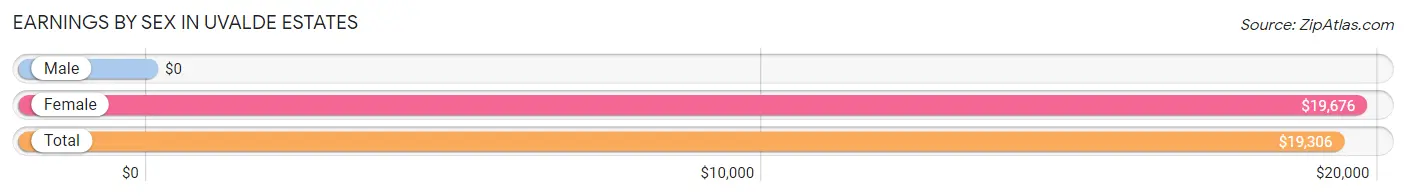
Earnings by Sex in Uvalde Estates
| Sex | Number | Average Earnings |
| Male | 524 (51.2%) | $0 |
| Female | 499 (48.8%) | $19,676 |
| Total | 1,023 (100.0%) | $19,306 |
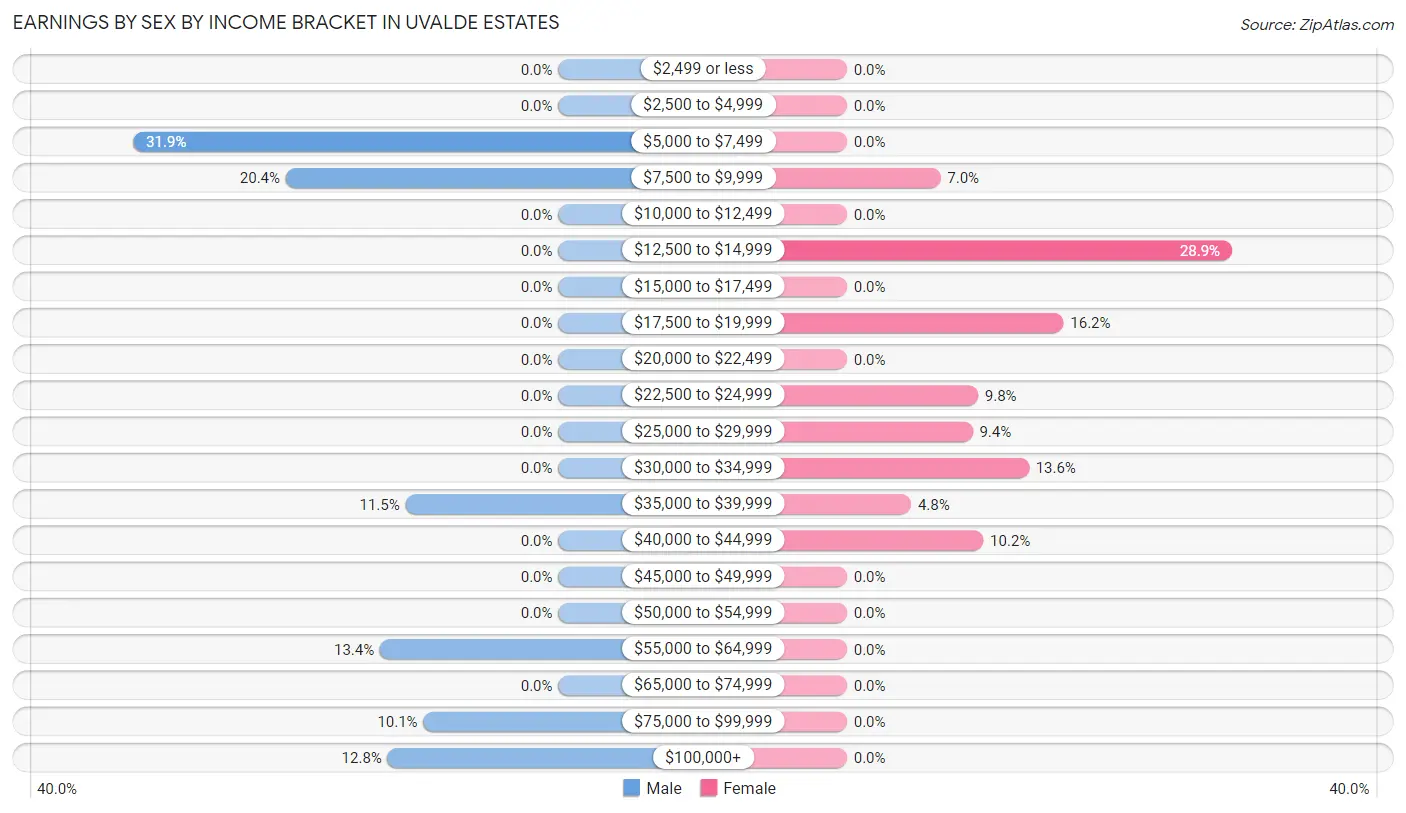
Earnings by Sex by Income Bracket in Uvalde Estates
The most common earnings brackets in Uvalde Estates are $5,000 to $7,499 for men (167 | 31.9%) and $12,500 to $14,999 for women (144 | 28.9%).
| Income | Male | Female |
| $2,499 or less | 0 (0.0%) | 0 (0.0%) |
| $2,500 to $4,999 | 0 (0.0%) | 0 (0.0%) |
| $5,000 to $7,499 | 167 (31.9%) | 0 (0.0%) |
| $7,500 to $9,999 | 107 (20.4%) | 35 (7.0%) |
| $10,000 to $12,499 | 0 (0.0%) | 0 (0.0%) |
| $12,500 to $14,999 | 0 (0.0%) | 144 (28.9%) |
| $15,000 to $17,499 | 0 (0.0%) | 0 (0.0%) |
| $17,500 to $19,999 | 0 (0.0%) | 81 (16.2%) |
| $20,000 to $22,499 | 0 (0.0%) | 0 (0.0%) |
| $22,500 to $24,999 | 0 (0.0%) | 49 (9.8%) |
| $25,000 to $29,999 | 0 (0.0%) | 47 (9.4%) |
| $30,000 to $34,999 | 0 (0.0%) | 68 (13.6%) |
| $35,000 to $39,999 | 60 (11.5%) | 24 (4.8%) |
| $40,000 to $44,999 | 0 (0.0%) | 51 (10.2%) |
| $45,000 to $49,999 | 0 (0.0%) | 0 (0.0%) |
| $50,000 to $54,999 | 0 (0.0%) | 0 (0.0%) |
| $55,000 to $64,999 | 70 (13.4%) | 0 (0.0%) |
| $65,000 to $74,999 | 0 (0.0%) | 0 (0.0%) |
| $75,000 to $99,999 | 53 (10.1%) | 0 (0.0%) |
| $100,000+ | 67 (12.8%) | 0 (0.0%) |
| Total | 524 (100.0%) | 499 (100.0%) |
Earnings by Sex by Educational Attainment in Uvalde Estates
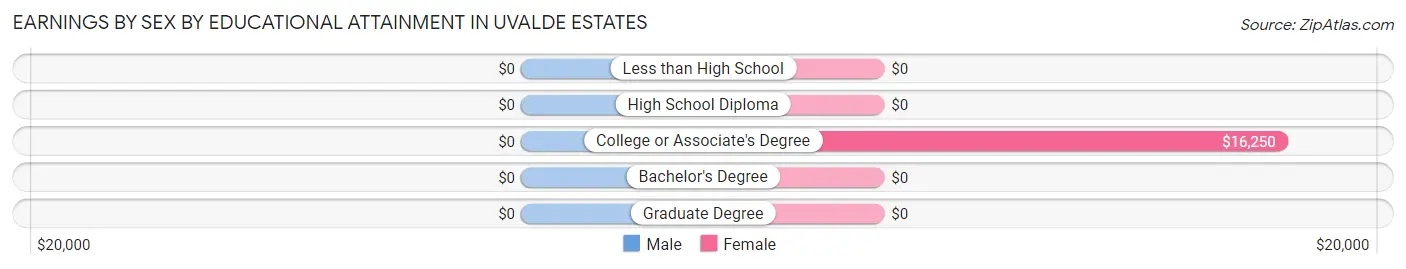
| Educational Attainment | Male Income | Female Income |
| Less than High School | - | - |
| High School Diploma | - | - |
| College or Associate's Degree | - | - |
| Bachelor's Degree | - | - |
| Graduate Degree | - | - |
| Total | $55,411 | $19,167 |
Family Income in Uvalde Estates
Family Income Brackets in Uvalde Estates
According to the Uvalde Estates family income data, there are 199 families falling into the $10,000 to $14,999 income range, which is the most common income bracket and makes up 29.9% of all families.
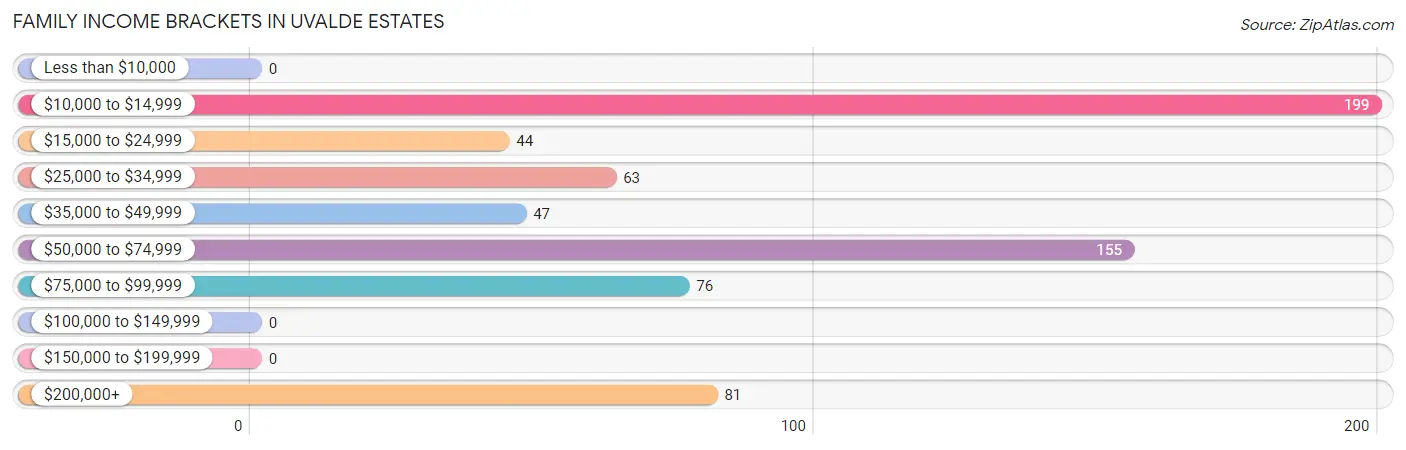
| Income Bracket | # Families | % Families |
| Less than $10,000 | 0 | 0.0% |
| $10,000 to $14,999 | 199 | 29.9% |
| $15,000 to $24,999 | 44 | 6.6% |
| $25,000 to $34,999 | 63 | 9.5% |
| $35,000 to $49,999 | 47 | 7.1% |
| $50,000 to $74,999 | 155 | 23.3% |
| $75,000 to $99,999 | 76 | 11.4% |
| $100,000 to $149,999 | 0 | 0.0% |
| $150,000 to $199,999 | 0 | 0.0% |
| $200,000+ | 81 | 12.2% |
Family Income by Famaliy Size in Uvalde Estates
2-person families (247 | 37.1%) account for the highest median family income in Uvalde Estates with $25,099 per family, while 2-person families (247 | 37.1%) have the highest median income of $12,550 per family member.
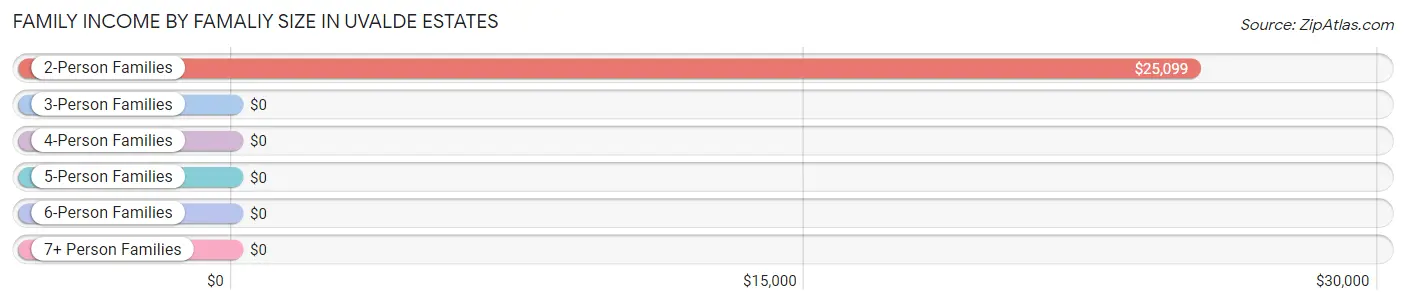
| Income Bracket | # Families | Median Income |
| 2-Person Families | 247 (37.1%) | $25,099 |
| 3-Person Families | 230 (34.6%) | $0 |
| 4-Person Families | 0 (0.0%) | $0 |
| 5-Person Families | 81 (12.2%) | $0 |
| 6-Person Families | 42 (6.3%) | $0 |
| 7+ Person Families | 65 (9.8%) | $0 |
| Total | 665 (100.0%) | $0 |
Family Income by Number of Earners in Uvalde Estates
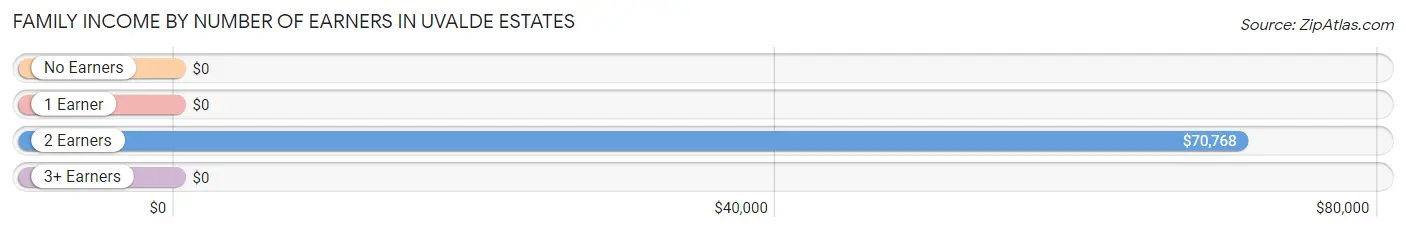
| Number of Earners | # Families | Median Income |
| No Earners | 219 (32.9%) | $0 |
| 1 Earner | 139 (20.9%) | $0 |
| 2 Earners | 119 (17.9%) | $70,768 |
| 3+ Earners | 188 (28.3%) | $0 |
| Total | 665 (100.0%) | $0 |
Household Income in Uvalde Estates
Household Income Brackets in Uvalde Estates
With 312 households falling in the category, the $10,000 to $14,999 income range is the most frequent in Uvalde Estates, accounting for 36.9% of all households.
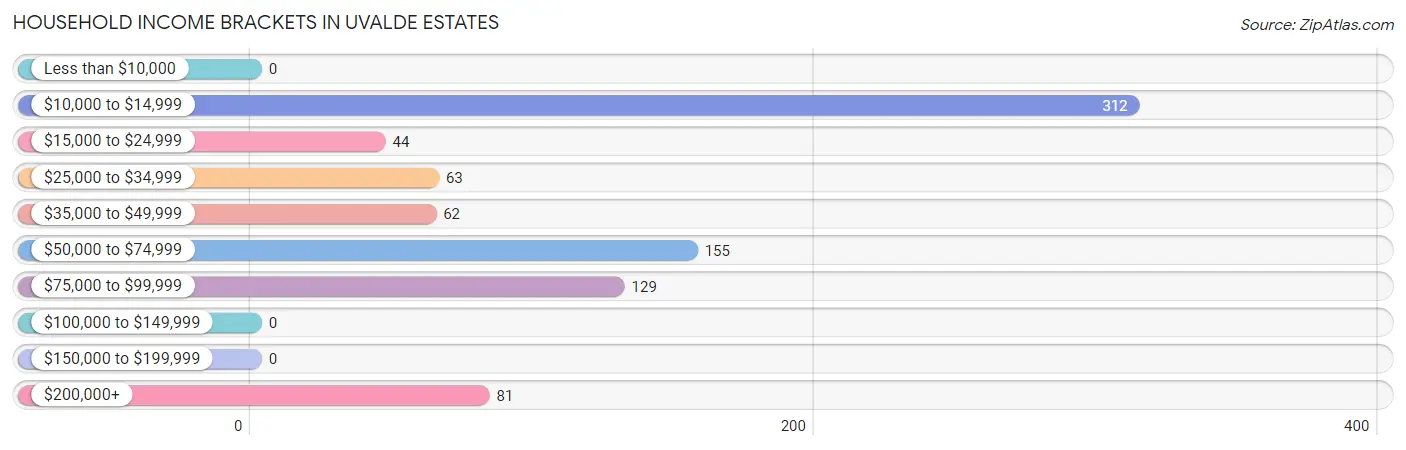
| Income Bracket | # Households | % Households |
| Less than $10,000 | 0 | 0.0% |
| $10,000 to $14,999 | 312 | 36.9% |
| $15,000 to $24,999 | 44 | 5.2% |
| $25,000 to $34,999 | 63 | 7.4% |
| $35,000 to $49,999 | 62 | 7.3% |
| $50,000 to $74,999 | 155 | 18.3% |
| $75,000 to $99,999 | 129 | 15.2% |
| $100,000 to $149,999 | 0 | 0.0% |
| $150,000 to $199,999 | 0 | 0.0% |
| $200,000+ | 81 | 9.6% |
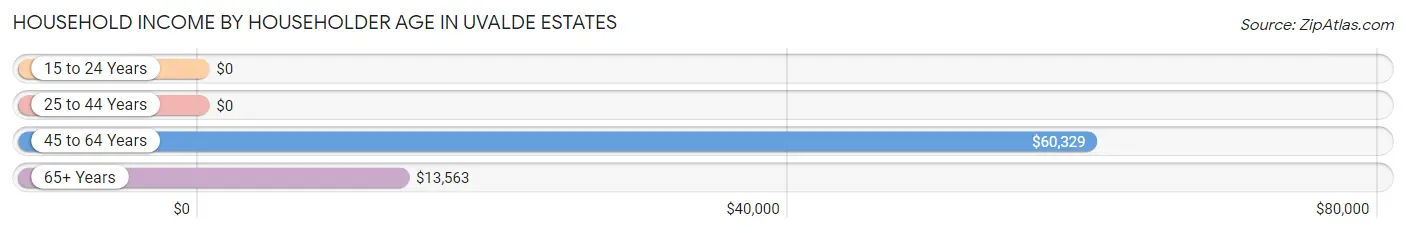
Household Income by Householder Age in Uvalde Estates
The median household income in Uvalde Estates is $0, with the highest median household income of $60,329 found in the 45 to 64 years age bracket for the primary householder. A total of 474 households (56.0%) fall into this category.
| Income Bracket | # Households | Median Income |
| 15 to 24 Years | 0 (0.0%) | $0 |
| 25 to 44 Years | 107 (12.7%) | $0 |
| 45 to 64 Years | 474 (56.0%) | $60,329 |
| 65+ Years | 265 (31.3%) | $13,563 |
| Total | 846 (100.0%) | $0 |
Poverty in Uvalde Estates
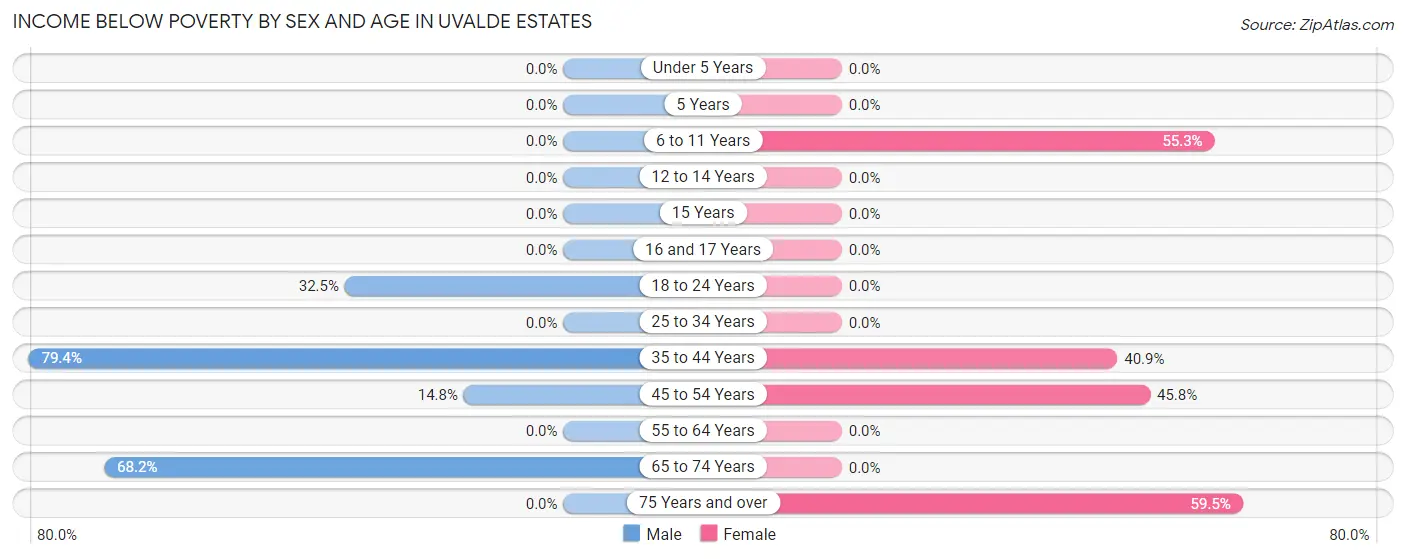
Income Below Poverty by Sex and Age in Uvalde Estates
With 25.3% poverty level for males and 26.6% for females among the residents of Uvalde Estates, 35 to 44 year old males and 75 year old and over females are the most vulnerable to poverty, with 162 males (79.4%) and 100 females (59.5%) in their respective age groups living below the poverty level.
| Age Bracket | Male | Female |
| Under 5 Years | 0 (0.0%) | 0 (0.0%) |
| 5 Years | 0 (0.0%) | 0 (0.0%) |
| 6 to 11 Years | 0 (0.0%) | 83 (55.3%) |
| 12 to 14 Years | 0 (0.0%) | 0 (0.0%) |
| 15 Years | 0 (0.0%) | 0 (0.0%) |
| 16 and 17 Years | 0 (0.0%) | 0 (0.0%) |
| 18 to 24 Years | 135 (32.5%) | 0 (0.0%) |
| 25 to 34 Years | 0 (0.0%) | 0 (0.0%) |
| 35 to 44 Years | 162 (79.4%) | 36 (40.9%) |
| 45 to 54 Years | 30 (14.8%) | 92 (45.8%) |
| 55 to 64 Years | 0 (0.0%) | 0 (0.0%) |
| 65 to 74 Years | 90 (68.2%) | 0 (0.0%) |
| 75 Years and over | 0 (0.0%) | 100 (59.5%) |
| Total | 417 (25.3%) | 311 (26.6%) |
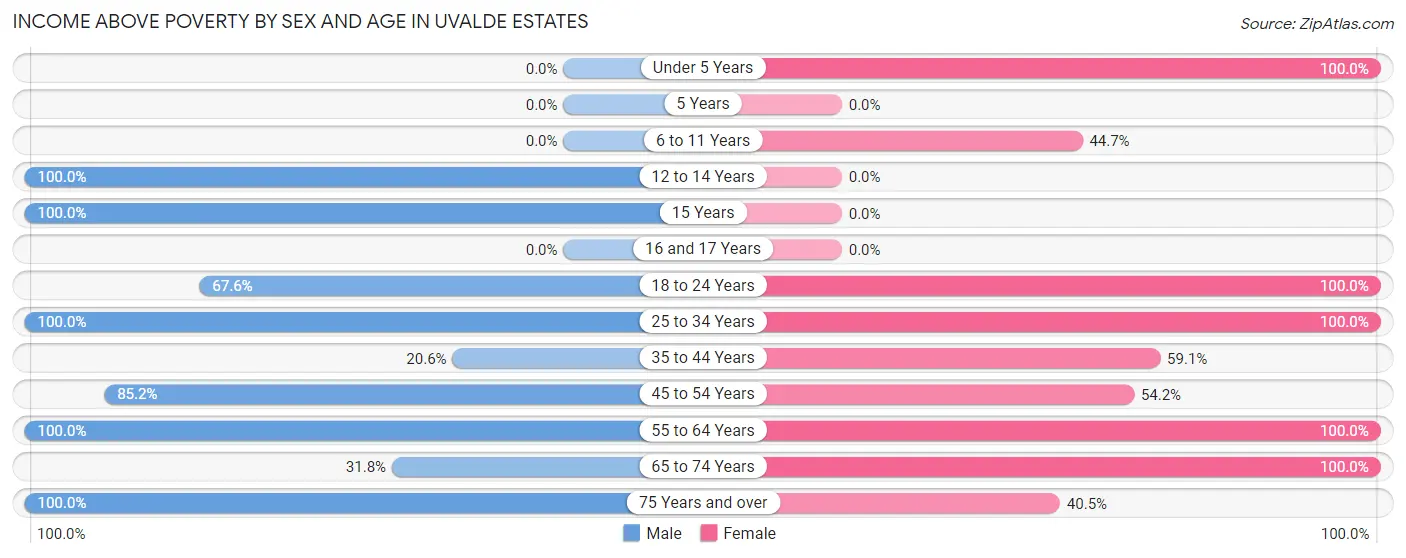
Income Above Poverty by Sex and Age in Uvalde Estates
According to the poverty statistics in Uvalde Estates, males aged 12 to 14 years and females aged under 5 years are the age groups that are most secure financially, with 100.0% of males and 100.0% of females in these age groups living above the poverty line.
| Age Bracket | Male | Female |
| Under 5 Years | 0 (0.0%) | 140 (100.0%) |
| 5 Years | 0 (0.0%) | 0 (0.0%) |
| 6 to 11 Years | 0 (0.0%) | 67 (44.7%) |
| 12 to 14 Years | 139 (100.0%) | 0 (0.0%) |
| 15 Years | 77 (100.0%) | 0 (0.0%) |
| 16 and 17 Years | 0 (0.0%) | 0 (0.0%) |
| 18 to 24 Years | 281 (67.5%) | 103 (100.0%) |
| 25 to 34 Years | 286 (100.0%) | 114 (100.0%) |
| 35 to 44 Years | 42 (20.6%) | 52 (59.1%) |
| 45 to 54 Years | 173 (85.2%) | 109 (54.2%) |
| 55 to 64 Years | 157 (100.0%) | 144 (100.0%) |
| 65 to 74 Years | 42 (31.8%) | 60 (100.0%) |
| 75 Years and over | 37 (100.0%) | 68 (40.5%) |
| Total | 1,234 (74.7%) | 857 (73.4%) |
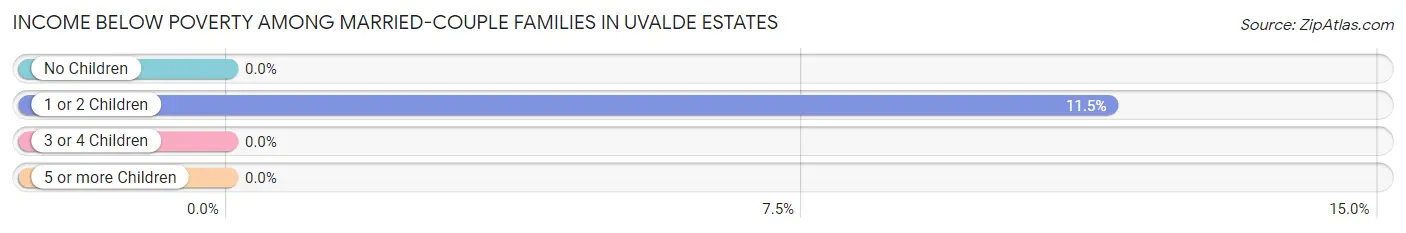
Income Below Poverty Among Married-Couple Families in Uvalde Estates
The poverty statistics for married-couple families in Uvalde Estates show that 6.9% or 30 of the total 438 families live below the poverty line. Families with 1 or 2 children have the highest poverty rate of 11.5%, comprising of 30 families. On the other hand, families with no children have the lowest poverty rate of 0.0%, which includes 0 families.
| Children | Above Poverty | Below Poverty |
| No Children | 112 (100.0%) | 0 (0.0%) |
| 1 or 2 Children | 231 (88.5%) | 30 (11.5%) |
| 3 or 4 Children | 65 (100.0%) | 0 (0.0%) |
| 5 or more Children | 0 (0.0%) | 0 (0.0%) |
| Total | 408 (93.1%) | 30 (6.9%) |
Income Below Poverty Among Single-Parent Households in Uvalde Estates
According to the poverty data in Uvalde Estates, 100.0% or 77 single-father households and 61.3% or 92 single-mother households are living below the poverty line. Among single-father households, those with no children have the highest poverty rate, with 77 households (100.0%) experiencing poverty. Likewise, among single-mother households, those with 1 or 2 children have the highest poverty rate, with 92 households (100.0%) falling below the poverty line.
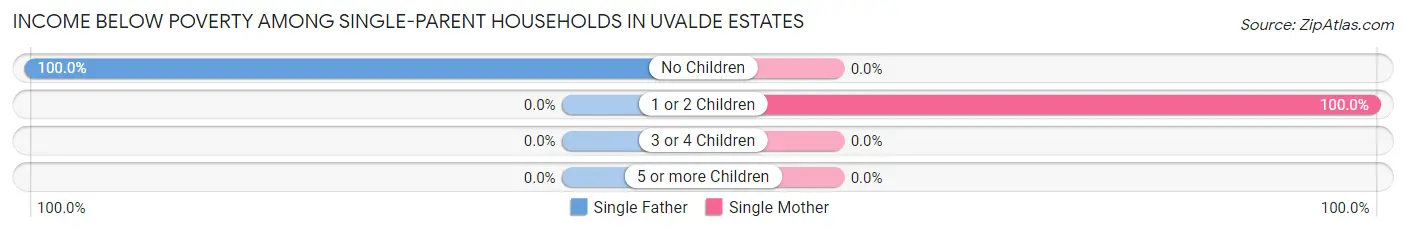
| Children | Single Father | Single Mother |
| No Children | 77 (100.0%) | 0 (0.0%) |
| 1 or 2 Children | 0 (0.0%) | 92 (100.0%) |
| 3 or 4 Children | 0 (0.0%) | 0 (0.0%) |
| 5 or more Children | 0 (0.0%) | 0 (0.0%) |
| Total | 77 (100.0%) | 92 (61.3%) |
Income Below Poverty Among Married-Couple vs Single-Parent Households in Uvalde Estates
The poverty data for Uvalde Estates shows that 30 of the married-couple family households (6.9%) and 169 of the single-parent households (74.5%) are living below the poverty level. Within the married-couple family households, those with 1 or 2 children have the highest poverty rate, with 30 households (11.5%) falling below the poverty line. Among the single-parent households, those with 1 or 2 children have the highest poverty rate, with 92 household (100.0%) living below poverty.
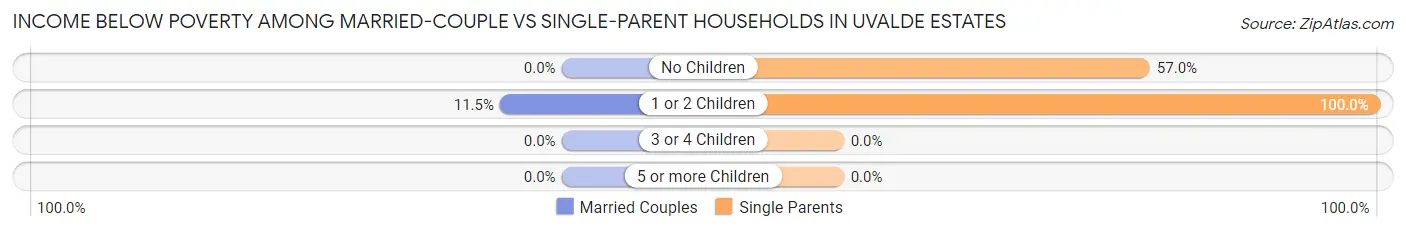
| Children | Married-Couple Families | Single-Parent Households |
| No Children | 0 (0.0%) | 77 (57.0%) |
| 1 or 2 Children | 30 (11.5%) | 92 (100.0%) |
| 3 or 4 Children | 0 (0.0%) | 0 (0.0%) |
| 5 or more Children | 0 (0.0%) | 0 (0.0%) |
| Total | 30 (6.9%) | 169 (74.5%) |
Race in Uvalde Estates
The most populous races in Uvalde Estates are Hispanic or Latino (2,720 | 96.5%), White / Caucasian (2,296 | 81.5%), and Some other Race (289 | 10.2%).
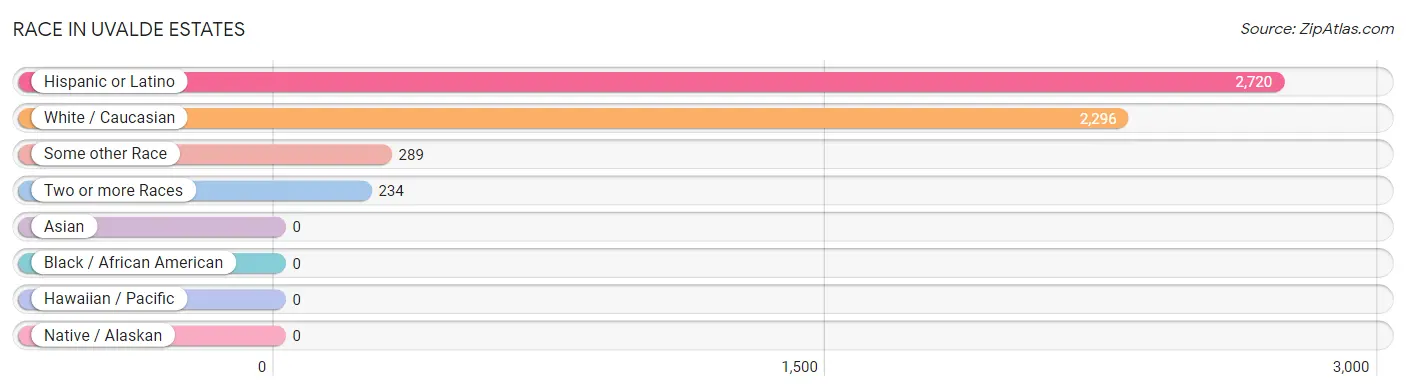
| Race | # Population | % Population |
| Asian | 0 | 0.0% |
| Black / African American | 0 | 0.0% |
| Hawaiian / Pacific | 0 | 0.0% |
| Hispanic or Latino | 2,720 | 96.5% |
| Native / Alaskan | 0 | 0.0% |
| White / Caucasian | 2,296 | 81.5% |
| Two or more Races | 234 | 8.3% |
| Some other Race | 289 | 10.2% |
| Total | 2,819 | 100.0% |
Ancestry in Uvalde Estates
The most populous ancestries reported in Uvalde Estates are Mexican (2,720 | 96.5%), English (94 | 3.3%), German (36 | 1.3%), Irish (28 | 1.0%), and Welsh (13 | 0.5%), together accounting for 102.5% of all Uvalde Estates residents.
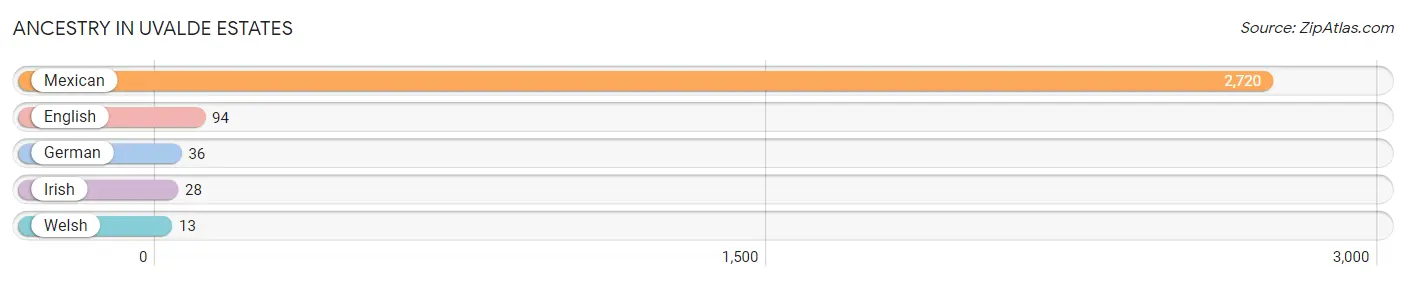
| Ancestry | # Population | % Population |
| English | 94 | 3.3% |
| German | 36 | 1.3% |
| Irish | 28 | 1.0% |
| Mexican | 2,720 | 96.5% |
| Welsh | 13 | 0.5% | View All 5 Rows |
Immigrants in Uvalde Estates
The most numerous immigrant groups reported in Uvalde Estates came from Central America (392 | 13.9%), Latin America (392 | 13.9%), and Mexico (392 | 13.9%), together accounting for 41.7% of all Uvalde Estates residents.
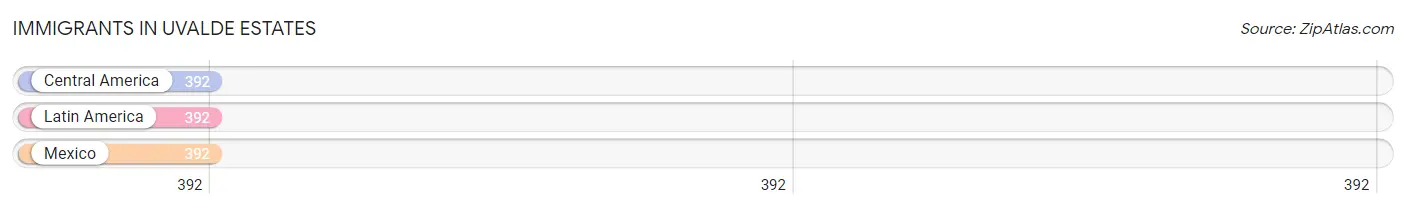
| Immigration Origin | # Population | % Population |
| Central America | 392 | 13.9% |
| Latin America | 392 | 13.9% |
| Mexico | 392 | 13.9% | View All 3 Rows |
Sex and Age in Uvalde Estates
Sex and Age in Uvalde Estates
The most populous age groups in Uvalde Estates are 20 to 24 Years (302 | 18.3%) for men and 55 to 59 Years (144 | 12.3%) for women.
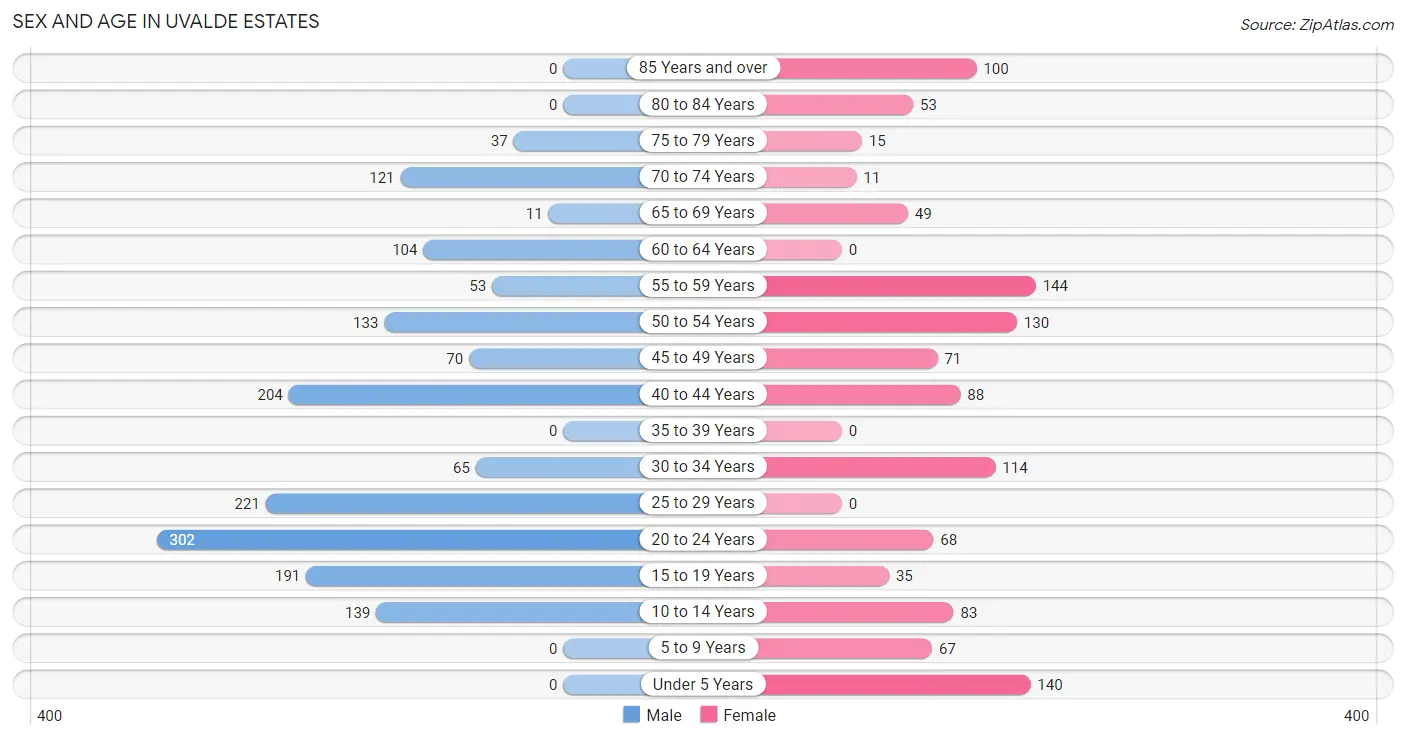
| Age Bracket | Male | Female |
| Under 5 Years | 0 (0.0%) | 140 (12.0%) |
| 5 to 9 Years | 0 (0.0%) | 67 (5.7%) |
| 10 to 14 Years | 139 (8.4%) | 83 (7.1%) |
| 15 to 19 Years | 191 (11.6%) | 35 (3.0%) |
| 20 to 24 Years | 302 (18.3%) | 68 (5.8%) |
| 25 to 29 Years | 221 (13.4%) | 0 (0.0%) |
| 30 to 34 Years | 65 (3.9%) | 114 (9.8%) |
| 35 to 39 Years | 0 (0.0%) | 0 (0.0%) |
| 40 to 44 Years | 204 (12.4%) | 88 (7.5%) |
| 45 to 49 Years | 70 (4.2%) | 71 (6.1%) |
| 50 to 54 Years | 133 (8.1%) | 130 (11.1%) |
| 55 to 59 Years | 53 (3.2%) | 144 (12.3%) |
| 60 to 64 Years | 104 (6.3%) | 0 (0.0%) |
| 65 to 69 Years | 11 (0.7%) | 49 (4.2%) |
| 70 to 74 Years | 121 (7.3%) | 11 (0.9%) |
| 75 to 79 Years | 37 (2.2%) | 15 (1.3%) |
| 80 to 84 Years | 0 (0.0%) | 53 (4.5%) |
| 85 Years and over | 0 (0.0%) | 100 (8.6%) |
| Total | 1,651 (100.0%) | 1,168 (100.0%) |
Families and Households in Uvalde Estates
Median Family Size in Uvalde Estates
The median family size in Uvalde Estates is 3.97 persons per family, with married-couple families (438 | 65.9%) accounting for the largest median family size of 4.39 persons per family. On the other hand, single male/father families (77 | 11.6%) represent the smallest median family size with 3.10 persons per family.
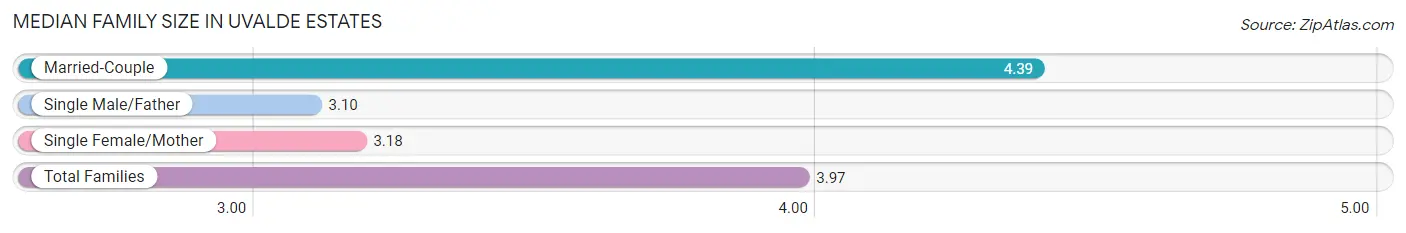
| Family Type | # Families | Family Size |
| Married-Couple | 438 (65.9%) | 4.39 |
| Single Male/Father | 77 (11.6%) | 3.10 |
| Single Female/Mother | 150 (22.6%) | 3.18 |
| Total Families | 665 (100.0%) | 3.97 |
Median Household Size in Uvalde Estates
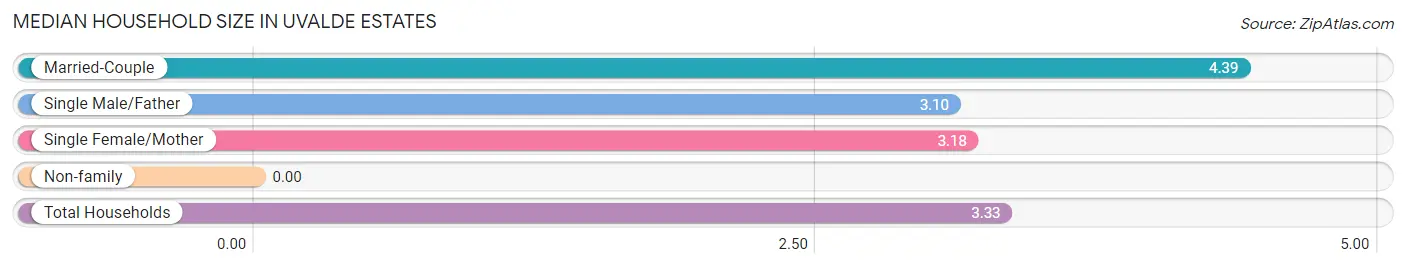
| Household Type | # Households | Household Size |
| Married-Couple | 438 (51.8%) | 4.39 |
| Single Male/Father | 77 (9.1%) | 3.10 |
| Single Female/Mother | 150 (17.7%) | 3.18 |
| Non-family | 181 (21.4%) | - |
| Total Households | 846 (100.0%) | 3.33 |
Household Size by Marriage Status in Uvalde Estates
Out of a total of 846 households in Uvalde Estates, 665 (78.6%) are family households, while 181 (21.4%) are nonfamily households. The most numerous type of family households are 2-person households, comprising 247, and the most common type of nonfamily households are 1-person households, comprising 181.
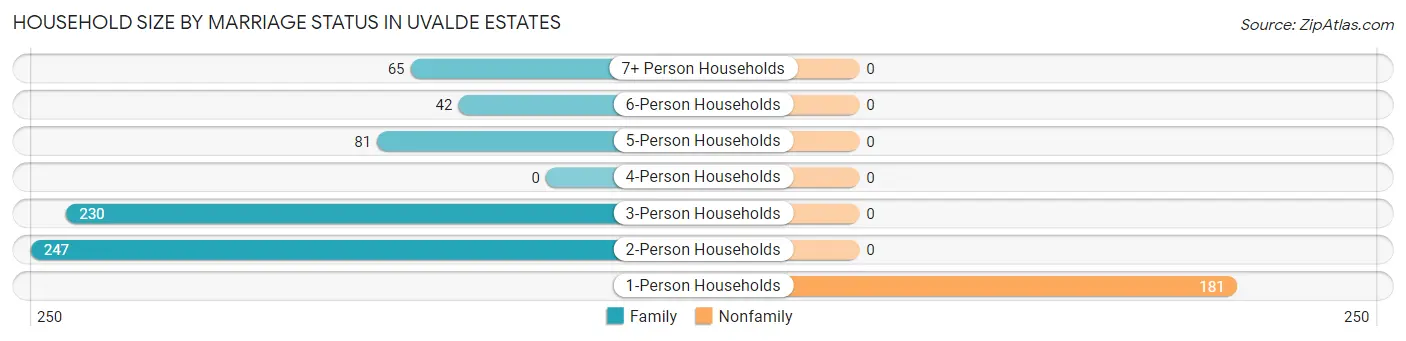
| Household Size | Family Households | Nonfamily Households |
| 1-Person Households | - | 181 (21.4%) |
| 2-Person Households | 247 (29.2%) | 0 (0.0%) |
| 3-Person Households | 230 (27.2%) | 0 (0.0%) |
| 4-Person Households | 0 (0.0%) | 0 (0.0%) |
| 5-Person Households | 81 (9.6%) | 0 (0.0%) |
| 6-Person Households | 42 (5.0%) | 0 (0.0%) |
| 7+ Person Households | 65 (7.7%) | 0 (0.0%) |
| Total | 665 (78.6%) | 181 (21.4%) |
Female Fertility in Uvalde Estates
Fertility by Age in Uvalde Estates
| Age Bracket | Women with Births | Births / 1,000 Women |
| 15 to 19 years | 0 (0.0%) | 0.0 |
| 20 to 34 years | 0 (0.0%) | 0.0 |
| 35 to 50 years | 0 (0.0%) | 0.0 |
| Total | 0 (0.0%) | 0.0 |
Fertility by Age by Marriage Status in Uvalde Estates
| Age Bracket | Married | Unmarried |
| 15 to 19 years | 0 (0.0%) | 0 (0.0%) |
| 20 to 34 years | 0 (0.0%) | 0 (0.0%) |
| 35 to 50 years | 0 (0.0%) | 0 (0.0%) |
| Total | 0 (0.0%) | 0 (0.0%) |
Fertility by Education in Uvalde Estates
| Educational Attainment | Women with Births | Births / 1,000 Women |
| Less than High School | 0 (0.0%) | 0.0 |
| High School Diploma | 0 (0.0%) | 0.0 |
| College or Associate's Degree | 0 (0.0%) | 0.0 |
| Bachelor's Degree | 0 (0.0%) | 0.0 |
| Graduate Degree | 0 (0.0%) | 0.0 |
| Total | 0 (0.0%) | 0.0 |
Fertility by Education by Marriage Status in Uvalde Estates
| Educational Attainment | Married | Unmarried |
| Less than High School | 0 (0.0%) | 0 (0.0%) |
| High School Diploma | 0 (0.0%) | 0 (0.0%) |
| College or Associate's Degree | 0 (0.0%) | 0 (0.0%) |
| Bachelor's Degree | 0 (0.0%) | 0 (0.0%) |
| Graduate Degree | 0 (0.0%) | 0 (0.0%) |
| Total | 0 (0.0%) | 0 (0.0%) |
Employment Characteristics in Uvalde Estates
Employment by Class of Employer in Uvalde Estates
Among the 856 employed individuals in Uvalde Estates, private company employees (538 | 62.8%), local government employees (270 | 31.5%), and state government employees (48 | 5.6%) make up the most common classes of employment.
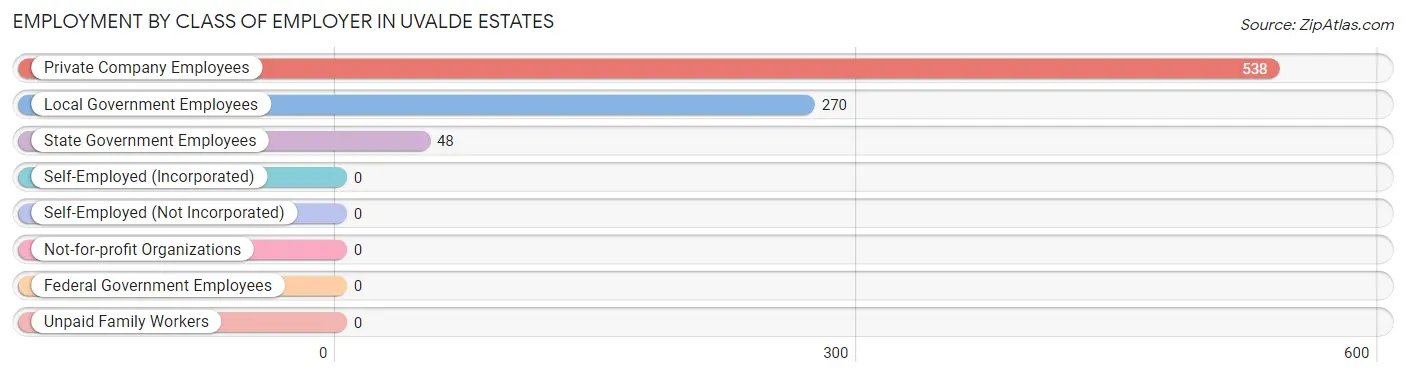
| Employer Class | # Employees | % Employees |
| Private Company Employees | 538 | 62.8% |
| Self-Employed (Incorporated) | 0 | 0.0% |
| Self-Employed (Not Incorporated) | 0 | 0.0% |
| Not-for-profit Organizations | 0 | 0.0% |
| Local Government Employees | 270 | 31.5% |
| State Government Employees | 48 | 5.6% |
| Federal Government Employees | 0 | 0.0% |
| Unpaid Family Workers | 0 | 0.0% |
| Total | 856 | 100.0% |
Employment Status by Age in Uvalde Estates
According to the labor force statistics for Uvalde Estates, out of the total population over 16 years of age (2,313), 44.2% or 1,022 individuals are in the labor force, with 16.3% or 167 of them unemployed. The age group with the highest labor force participation rate is 45 to 54 years, with 92.6% or 374 individuals in the labor force. Within the labor force, the 20 to 24 years age range has the highest percentage of unemployed individuals, with 71.1% or 167 of them being unemployed.
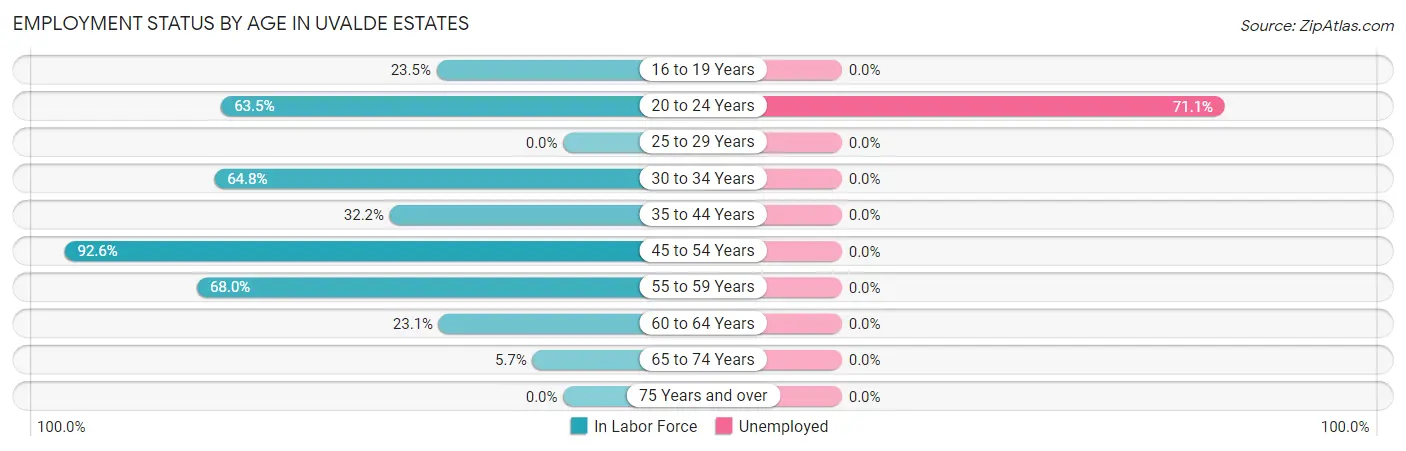
| Age Bracket | In Labor Force | Unemployed |
| 16 to 19 Years | 35 (23.5%) | 0 (0.0%) |
| 20 to 24 Years | 235 (63.5%) | 167 (71.1%) |
| 25 to 29 Years | 0 (0.0%) | 0 (0.0%) |
| 30 to 34 Years | 116 (64.8%) | 0 (0.0%) |
| 35 to 44 Years | 94 (32.2%) | 0 (0.0%) |
| 45 to 54 Years | 374 (92.6%) | 0 (0.0%) |
| 55 to 59 Years | 134 (68.0%) | 0 (0.0%) |
| 60 to 64 Years | 24 (23.1%) | 0 (0.0%) |
| 65 to 74 Years | 11 (5.7%) | 0 (0.0%) |
| 75 Years and over | 0 (0.0%) | 0 (0.0%) |
| Total | 1,022 (44.2%) | 167 (16.3%) |
Employment Status by Educational Attainment in Uvalde Estates
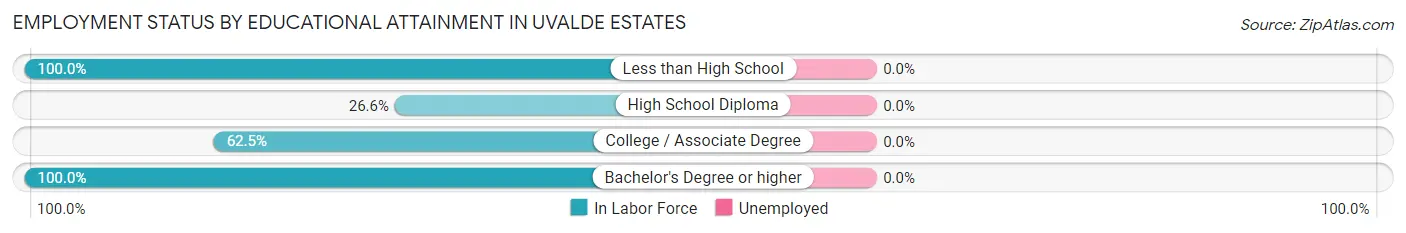
| Educational Attainment | In Labor Force | Unemployed |
| Less than High School | 126 (100.0%) | 0 (0.0%) |
| High School Diploma | 186 (26.6%) | 0 (0.0%) |
| College / Associate Degree | 238 (62.5%) | 0 (0.0%) |
| Bachelor's Degree or higher | 192 (100.0%) | 0 (0.0%) |
| Total | 742 (53.1%) | 0 (0.0%) |
Employment Occupations by Sex in Uvalde Estates
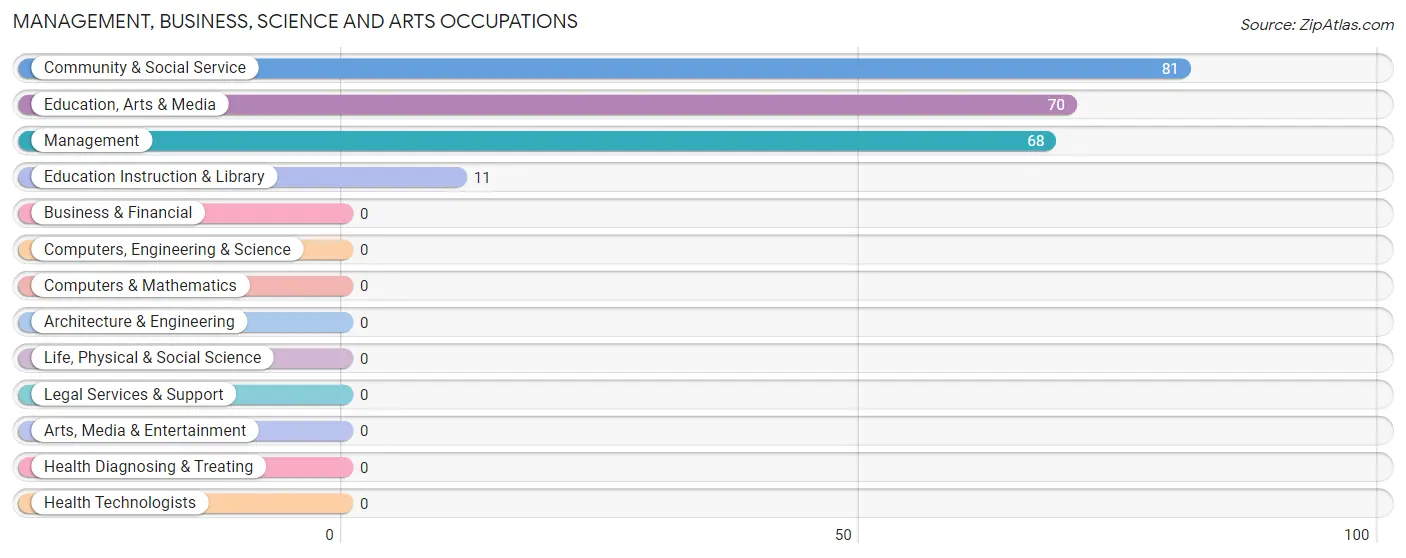
Management, Business, Science and Arts Occupations
The most common Management, Business, Science and Arts occupations in Uvalde Estates are Community & Social Service (81 | 9.5%), Education, Arts & Media (70 | 8.2%), Management (68 | 7.9%), and Education Instruction & Library (11 | 1.3%).
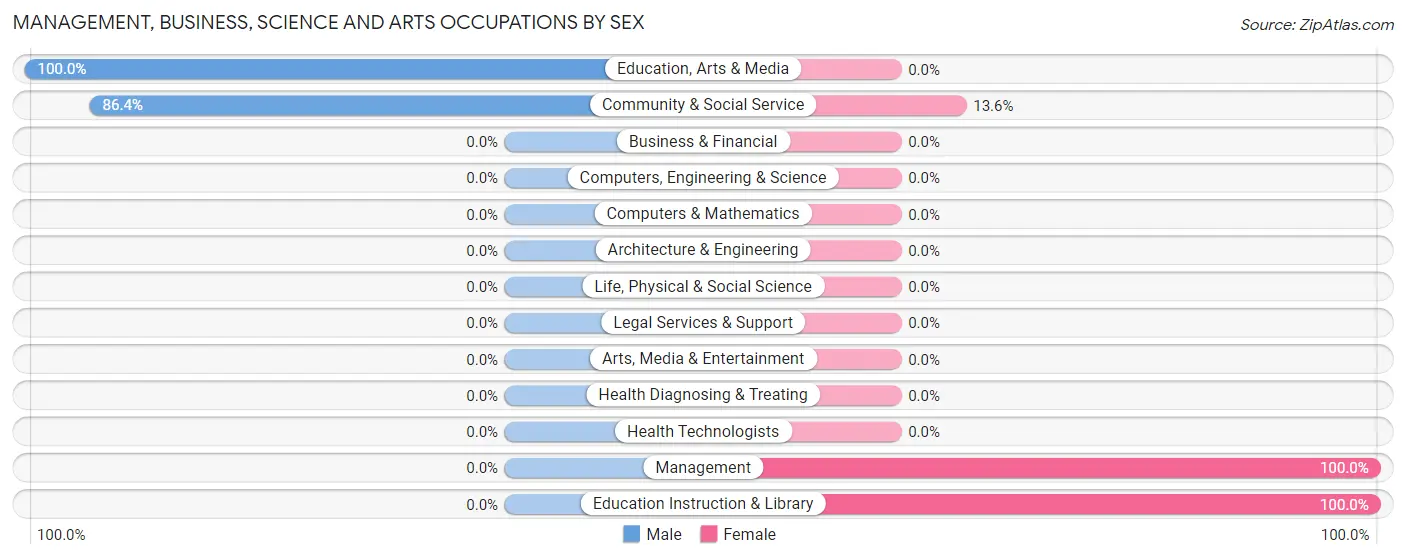
Management, Business, Science and Arts Occupations by Sex
Within the Management, Business, Science and Arts occupations in Uvalde Estates, the most male-oriented occupations are Education, Arts & Media (100.0%), and Community & Social Service (86.4%), while the most female-oriented occupations are Management (100.0%), Education Instruction & Library (100.0%), and Community & Social Service (13.6%).
| Occupation | Male | Female |
| Management | 0 (0.0%) | 68 (100.0%) |
| Business & Financial | 0 (0.0%) | 0 (0.0%) |
| Computers, Engineering & Science | 0 (0.0%) | 0 (0.0%) |
| Computers & Mathematics | 0 (0.0%) | 0 (0.0%) |
| Architecture & Engineering | 0 (0.0%) | 0 (0.0%) |
| Life, Physical & Social Science | 0 (0.0%) | 0 (0.0%) |
| Community & Social Service | 70 (86.4%) | 11 (13.6%) |
| Education, Arts & Media | 70 (100.0%) | 0 (0.0%) |
| Legal Services & Support | 0 (0.0%) | 0 (0.0%) |
| Education Instruction & Library | 0 (0.0%) | 11 (100.0%) |
| Arts, Media & Entertainment | 0 (0.0%) | 0 (0.0%) |
| Health Diagnosing & Treating | 0 (0.0%) | 0 (0.0%) |
| Health Technologists | 0 (0.0%) | 0 (0.0%) |
| Total (Category) | 70 (47.0%) | 79 (53.0%) |
| Total (Overall) | 357 (41.7%) | 499 (58.3%) |
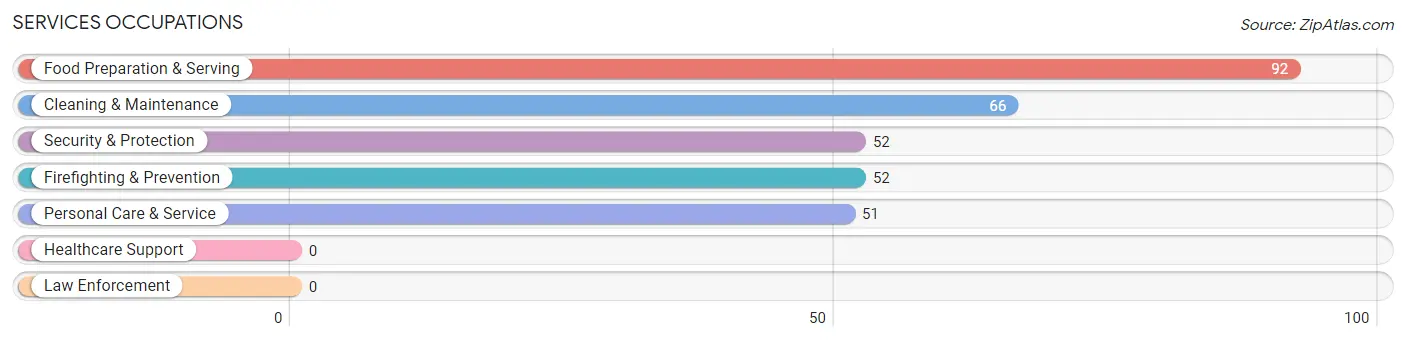
Services Occupations
The most common Services occupations in Uvalde Estates are Food Preparation & Serving (92 | 10.7%), Cleaning & Maintenance (66 | 7.7%), Security & Protection (52 | 6.1%), Firefighting & Prevention (52 | 6.1%), and Personal Care & Service (51 | 6.0%).
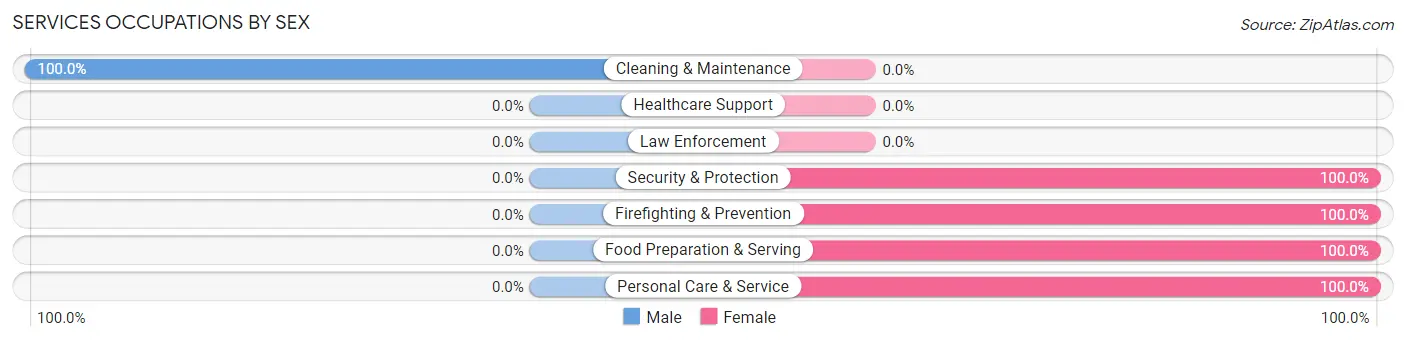
Services Occupations by Sex
| Occupation | Male | Female |
| Healthcare Support | 0 (0.0%) | 0 (0.0%) |
| Security & Protection | 0 (0.0%) | 52 (100.0%) |
| Firefighting & Prevention | 0 (0.0%) | 52 (100.0%) |
| Law Enforcement | 0 (0.0%) | 0 (0.0%) |
| Food Preparation & Serving | 0 (0.0%) | 92 (100.0%) |
| Cleaning & Maintenance | 66 (100.0%) | 0 (0.0%) |
| Personal Care & Service | 0 (0.0%) | 51 (100.0%) |
| Total (Category) | 66 (25.3%) | 195 (74.7%) |
| Total (Overall) | 357 (41.7%) | 499 (58.3%) |
Sales and Office Occupations
The most common Sales and Office occupations in Uvalde Estates are , and Office & Administration (187 | 21.8%).
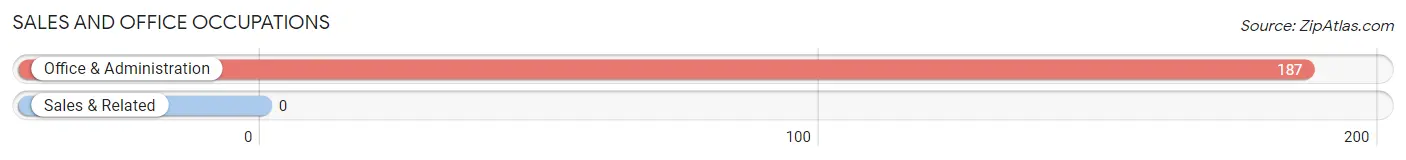
Sales and Office Occupations by Sex

| Occupation | Male | Female |
| Sales & Related | 0 (0.0%) | 0 (0.0%) |
| Office & Administration | 0 (0.0%) | 187 (100.0%) |
| Total (Category) | 0 (0.0%) | 187 (100.0%) |
| Total (Overall) | 357 (41.7%) | 499 (58.3%) |
Natural Resources, Construction and Maintenance Occupations
The most common Natural Resources, Construction and Maintenance occupations in Uvalde Estates are Construction & Extraction (120 | 14.0%), and Installation, Maintenance & Repair (65 | 7.6%).
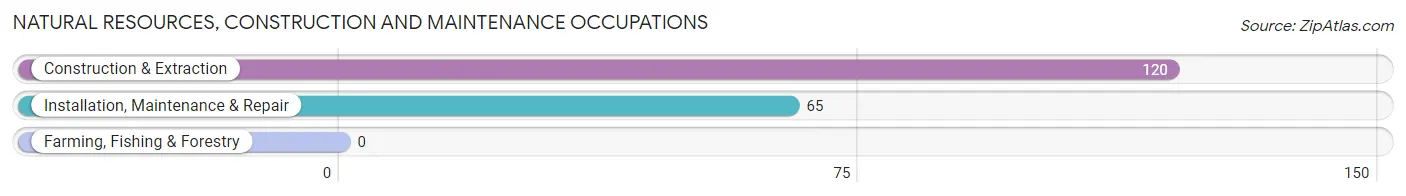
Natural Resources, Construction and Maintenance Occupations by Sex
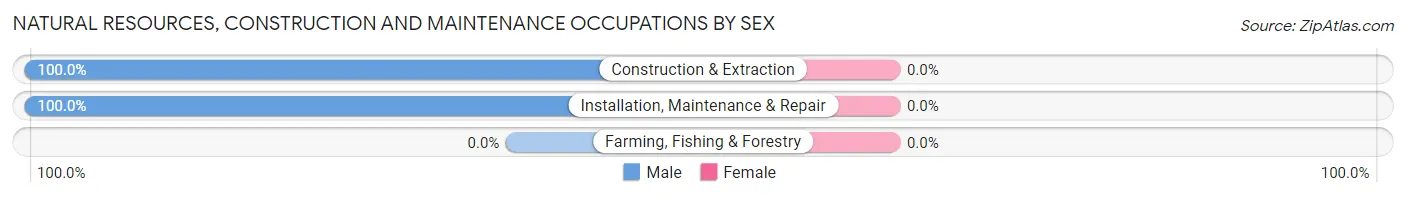
| Occupation | Male | Female |
| Farming, Fishing & Forestry | 0 (0.0%) | 0 (0.0%) |
| Construction & Extraction | 120 (100.0%) | 0 (0.0%) |
| Installation, Maintenance & Repair | 65 (100.0%) | 0 (0.0%) |
| Total (Category) | 185 (100.0%) | 0 (0.0%) |
| Total (Overall) | 357 (41.7%) | 499 (58.3%) |
Production, Transportation and Moving Occupations
The most common Production, Transportation and Moving occupations in Uvalde Estates are Production (38 | 4.4%), and Transportation (36 | 4.2%).
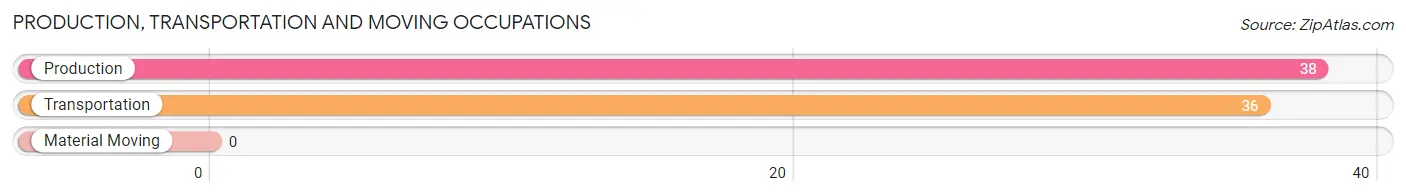
Production, Transportation and Moving Occupations by Sex
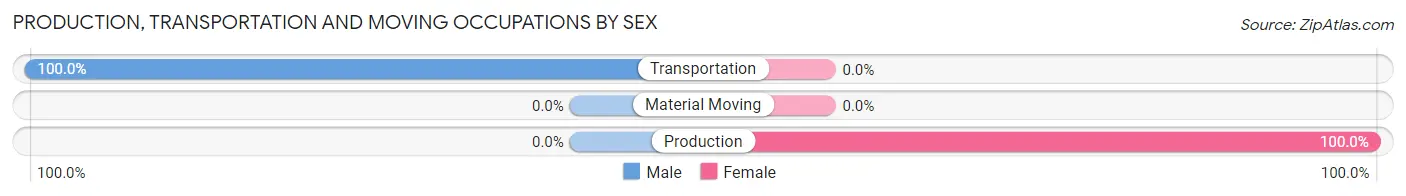
| Occupation | Male | Female |
| Production | 0 (0.0%) | 38 (100.0%) |
| Transportation | 36 (100.0%) | 0 (0.0%) |
| Material Moving | 0 (0.0%) | 0 (0.0%) |
| Total (Category) | 36 (48.6%) | 38 (51.3%) |
| Total (Overall) | 357 (41.7%) | 499 (58.3%) |
Employment Industries by Sex in Uvalde Estates
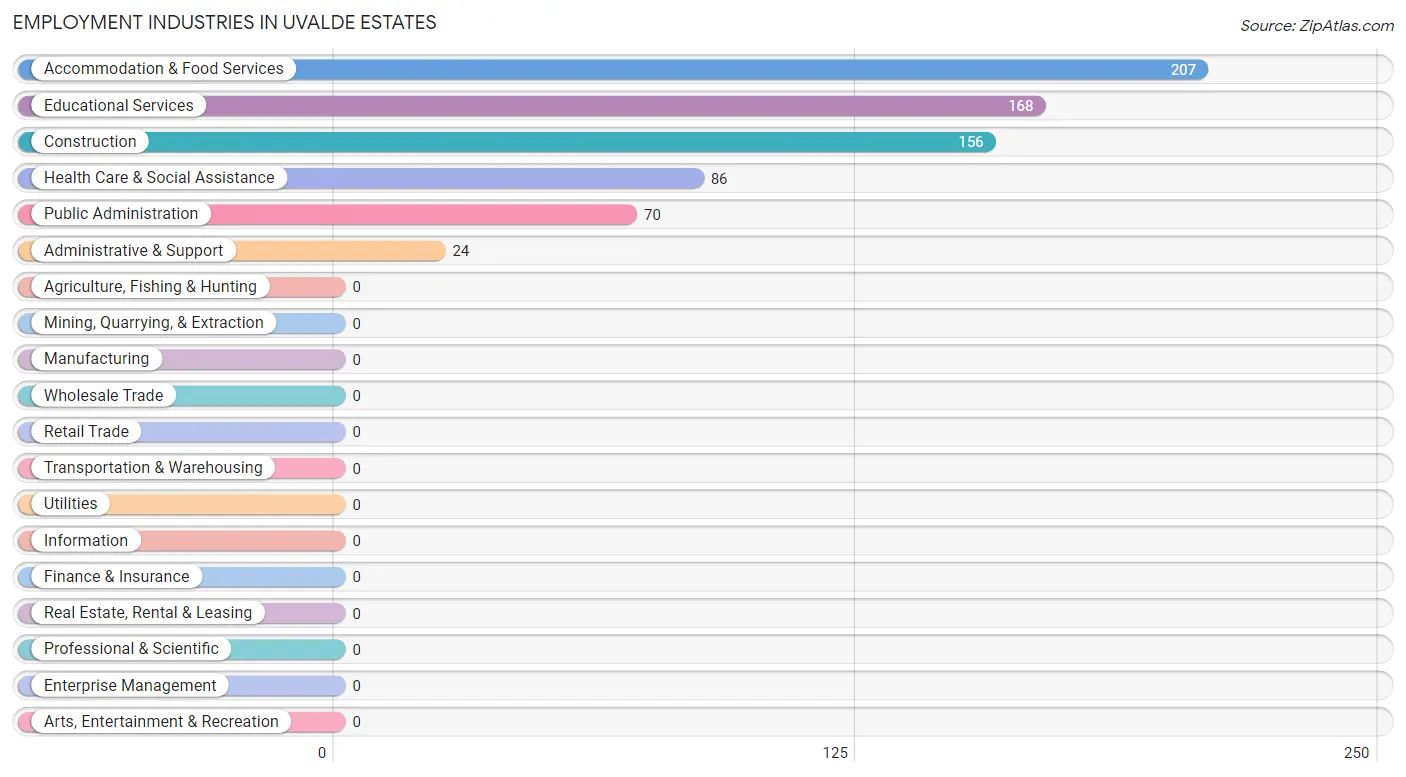
Employment Industries in Uvalde Estates
The major employment industries in Uvalde Estates include Accommodation & Food Services (207 | 24.2%), Educational Services (168 | 19.6%), Construction (156 | 18.2%), Health Care & Social Assistance (86 | 10.1%), and Public Administration (70 | 8.2%).
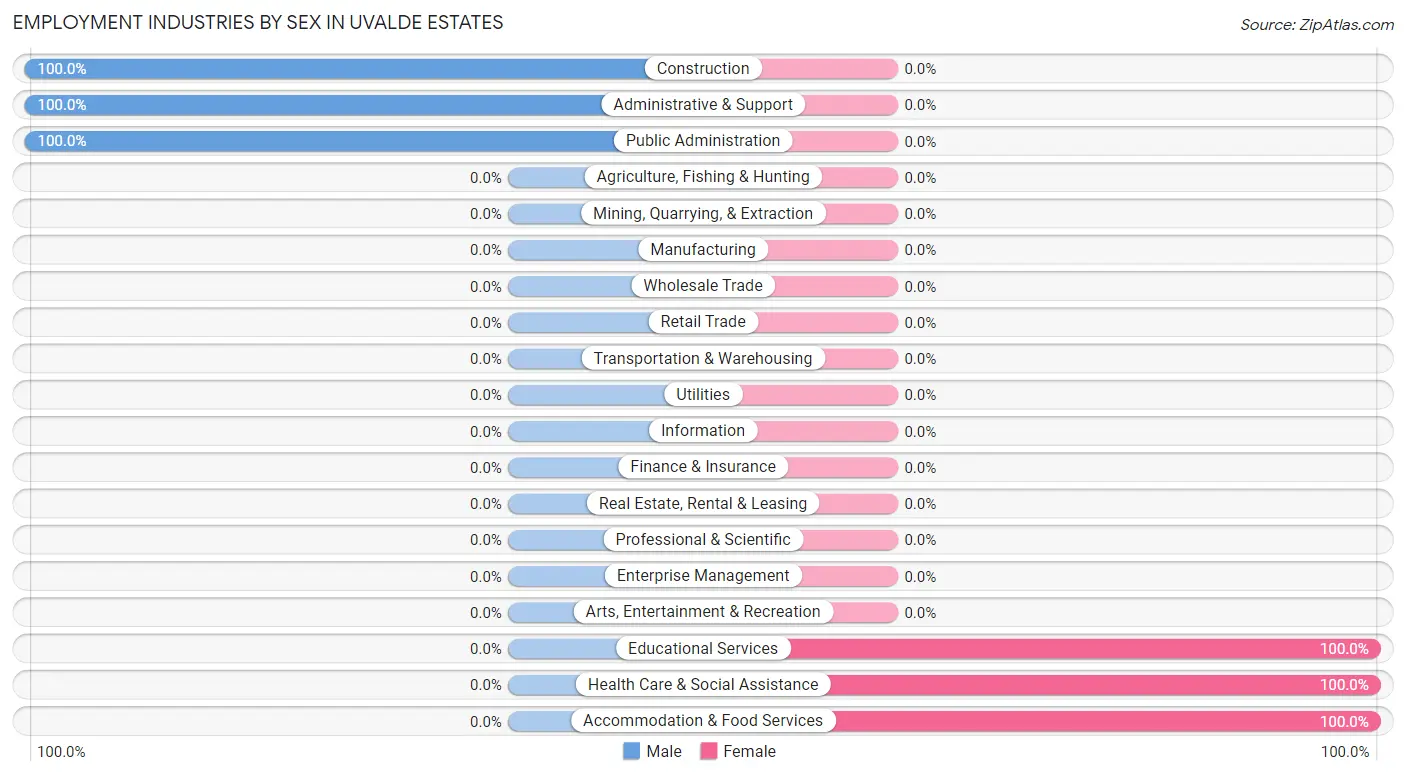
Employment Industries by Sex in Uvalde Estates
The Uvalde Estates industries that see more men than women are Construction (100.0%), Administrative & Support (100.0%), and Public Administration (100.0%), whereas the industries that tend to have a higher number of women are Educational Services (100.0%), Health Care & Social Assistance (100.0%), and Accommodation & Food Services (100.0%).
| Industry | Male | Female |
| Agriculture, Fishing & Hunting | 0 (0.0%) | 0 (0.0%) |
| Mining, Quarrying, & Extraction | 0 (0.0%) | 0 (0.0%) |
| Construction | 156 (100.0%) | 0 (0.0%) |
| Manufacturing | 0 (0.0%) | 0 (0.0%) |
| Wholesale Trade | 0 (0.0%) | 0 (0.0%) |
| Retail Trade | 0 (0.0%) | 0 (0.0%) |
| Transportation & Warehousing | 0 (0.0%) | 0 (0.0%) |
| Utilities | 0 (0.0%) | 0 (0.0%) |
| Information | 0 (0.0%) | 0 (0.0%) |
| Finance & Insurance | 0 (0.0%) | 0 (0.0%) |
| Real Estate, Rental & Leasing | 0 (0.0%) | 0 (0.0%) |
| Professional & Scientific | 0 (0.0%) | 0 (0.0%) |
| Enterprise Management | 0 (0.0%) | 0 (0.0%) |
| Administrative & Support | 24 (100.0%) | 0 (0.0%) |
| Educational Services | 0 (0.0%) | 168 (100.0%) |
| Health Care & Social Assistance | 0 (0.0%) | 86 (100.0%) |
| Arts, Entertainment & Recreation | 0 (0.0%) | 0 (0.0%) |
| Accommodation & Food Services | 0 (0.0%) | 207 (100.0%) |
| Public Administration | 70 (100.0%) | 0 (0.0%) |
| Total | 357 (41.7%) | 499 (58.3%) |
Education in Uvalde Estates
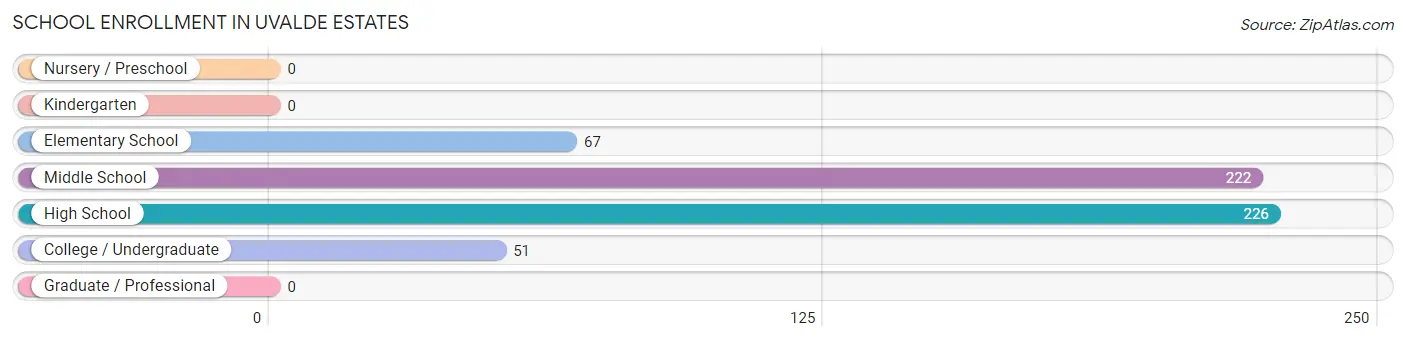
School Enrollment in Uvalde Estates
The most common levels of schooling among the 566 students in Uvalde Estates are high school (226 | 39.9%), middle school (222 | 39.2%), and elementary school (67 | 11.8%).
| School Level | # Students | % Students |
| Nursery / Preschool | 0 | 0.0% |
| Kindergarten | 0 | 0.0% |
| Elementary School | 67 | 11.8% |
| Middle School | 222 | 39.2% |
| High School | 226 | 39.9% |
| College / Undergraduate | 51 | 9.0% |
| Graduate / Professional | 0 | 0.0% |
| Total | 566 | 100.0% |
School Enrollment by Age by Funding Source in Uvalde Estates
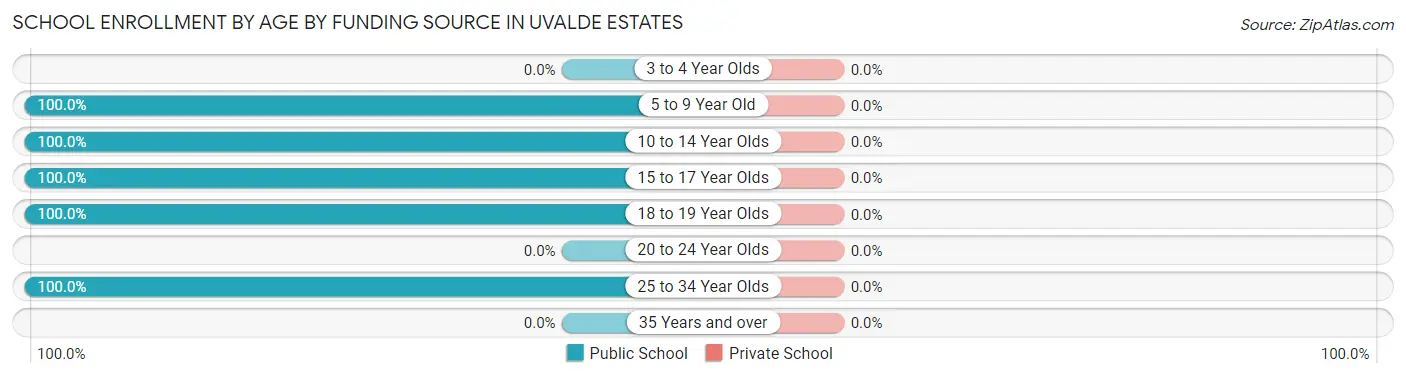
| Age Bracket | Public School | Private School |
| 3 to 4 Year Olds | 0 (0.0%) | 0 (0.0%) |
| 5 to 9 Year Old | 67 (100.0%) | 0 (0.0%) |
| 10 to 14 Year Olds | 222 (100.0%) | 0 (0.0%) |
| 15 to 17 Year Olds | 77 (100.0%) | 0 (0.0%) |
| 18 to 19 Year Olds | 149 (100.0%) | 0 (0.0%) |
| 20 to 24 Year Olds | 0 (0.0%) | 0 (0.0%) |
| 25 to 34 Year Olds | 51 (100.0%) | 0 (0.0%) |
| 35 Years and over | 0 (0.0%) | 0 (0.0%) |
| Total | 566 (100.0%) | 0 (0.0%) |
Educational Attainment by Field of Study in Uvalde Estates
Business (71 | 37.0%), arts & humanities (70 | 36.5%), and psychology (51 | 26.6%) are the most common fields of study among 192 individuals in Uvalde Estates who have obtained a bachelor's degree or higher.
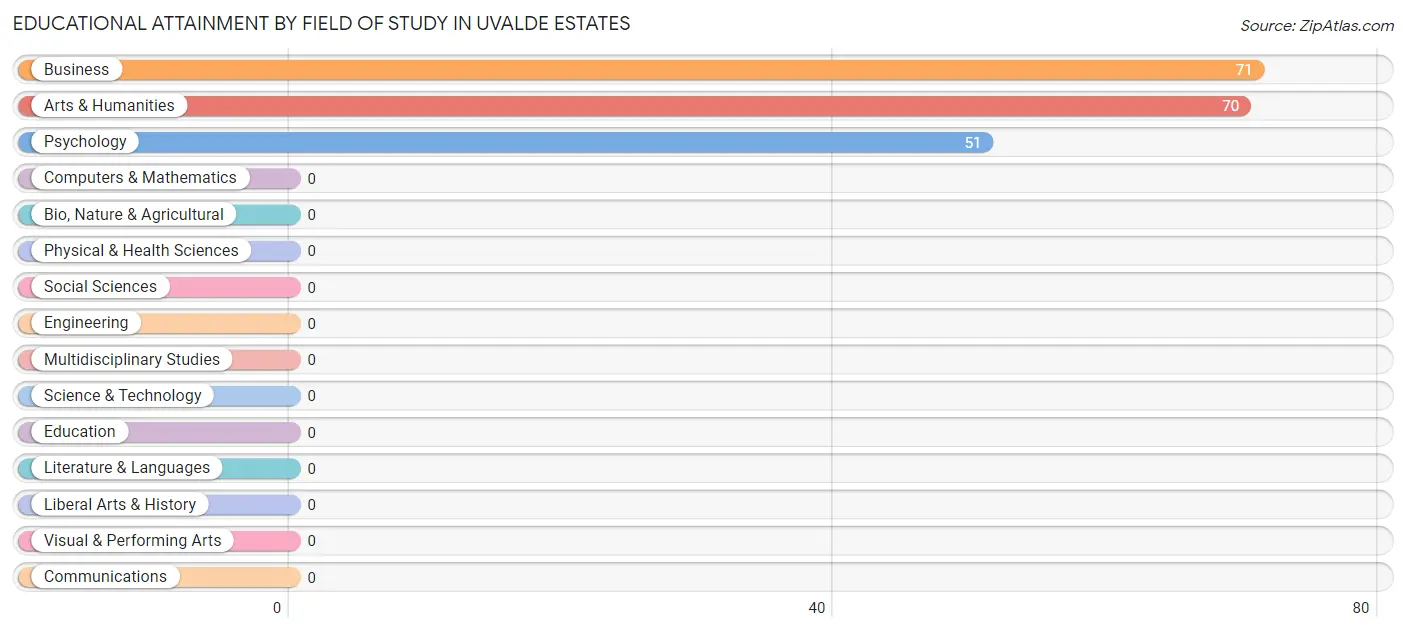
| Field of Study | # Graduates | % Graduates |
| Computers & Mathematics | 0 | 0.0% |
| Bio, Nature & Agricultural | 0 | 0.0% |
| Physical & Health Sciences | 0 | 0.0% |
| Psychology | 51 | 26.6% |
| Social Sciences | 0 | 0.0% |
| Engineering | 0 | 0.0% |
| Multidisciplinary Studies | 0 | 0.0% |
| Science & Technology | 0 | 0.0% |
| Business | 71 | 37.0% |
| Education | 0 | 0.0% |
| Literature & Languages | 0 | 0.0% |
| Liberal Arts & History | 0 | 0.0% |
| Visual & Performing Arts | 0 | 0.0% |
| Communications | 0 | 0.0% |
| Arts & Humanities | 70 | 36.5% |
| Total | 192 | 100.0% |
Transportation & Commute in Uvalde Estates
Vehicle Availability by Sex in Uvalde Estates
The most prevalent vehicle ownership categories in Uvalde Estates are males with 2 vehicles (183, accounting for 51.3%) and females with 2 vehicles (148, making up 36.7%).
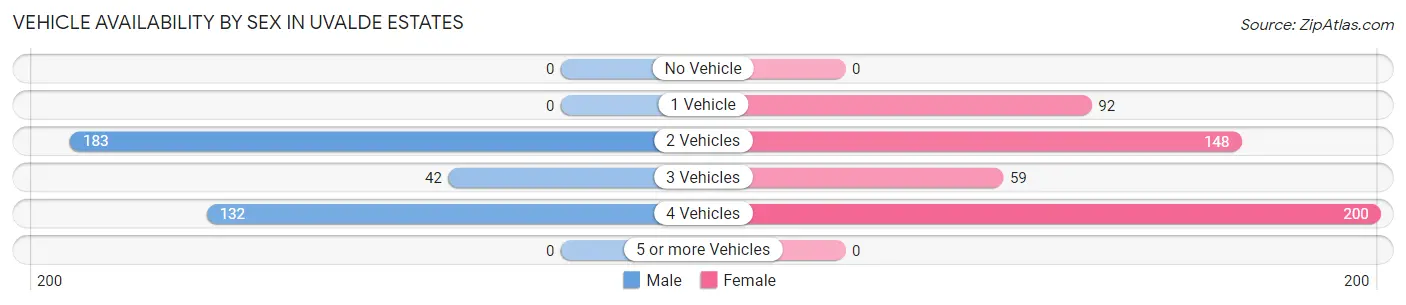
| Vehicles Available | Male | Female |
| No Vehicle | 0 (0.0%) | 0 (0.0%) |
| 1 Vehicle | 0 (0.0%) | 92 (18.4%) |
| 2 Vehicles | 183 (51.3%) | 148 (29.7%) |
| 3 Vehicles | 42 (11.8%) | 59 (11.8%) |
| 4 Vehicles | 132 (37.0%) | 200 (40.1%) |
| 5 or more Vehicles | 0 (0.0%) | 0 (0.0%) |
| Total | 357 (100.0%) | 499 (100.0%) |
Commute Time in Uvalde Estates
The most frequently occuring commute durations in Uvalde Estates are 10 to 14 minutes (254 commuters, 29.7%), 20 to 24 minutes (169 commuters, 19.7%), and 15 to 19 minutes (158 commuters, 18.5%).
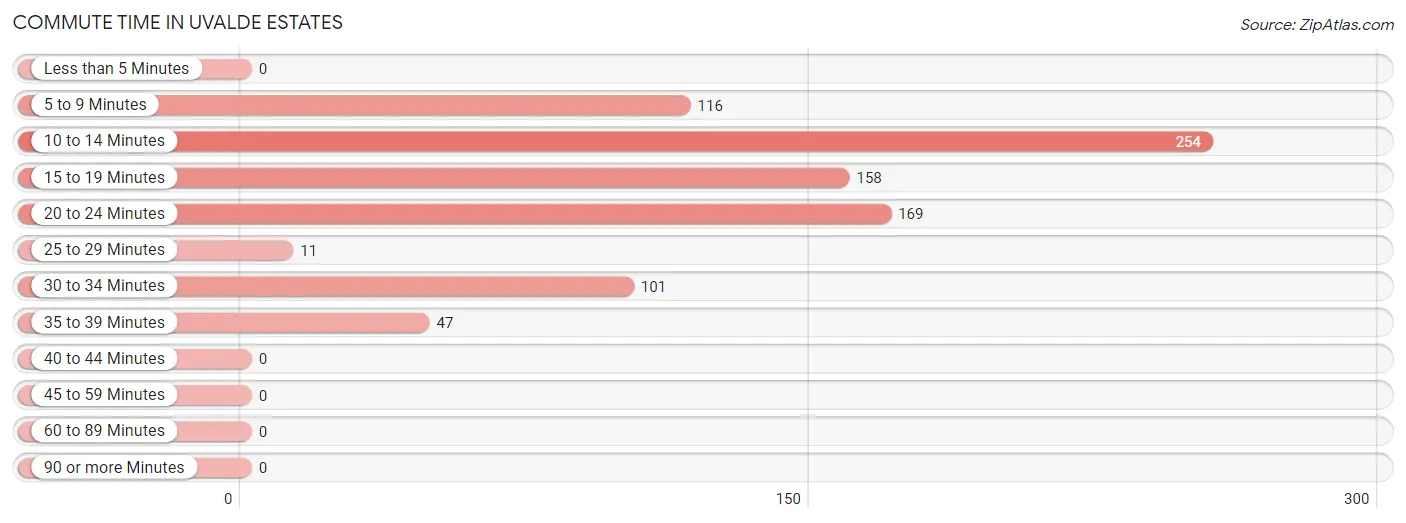
| Commute Time | # Commuters | % Commuters |
| Less than 5 Minutes | 0 | 0.0% |
| 5 to 9 Minutes | 116 | 13.6% |
| 10 to 14 Minutes | 254 | 29.7% |
| 15 to 19 Minutes | 158 | 18.5% |
| 20 to 24 Minutes | 169 | 19.7% |
| 25 to 29 Minutes | 11 | 1.3% |
| 30 to 34 Minutes | 101 | 11.8% |
| 35 to 39 Minutes | 47 | 5.5% |
| 40 to 44 Minutes | 0 | 0.0% |
| 45 to 59 Minutes | 0 | 0.0% |
| 60 to 89 Minutes | 0 | 0.0% |
| 90 or more Minutes | 0 | 0.0% |
Commute Time by Sex in Uvalde Estates
The most common commute times in Uvalde Estates are 15 to 19 minutes (106 commuters, 29.7%) for males and 10 to 14 minutes (187 commuters, 37.5%) for females.
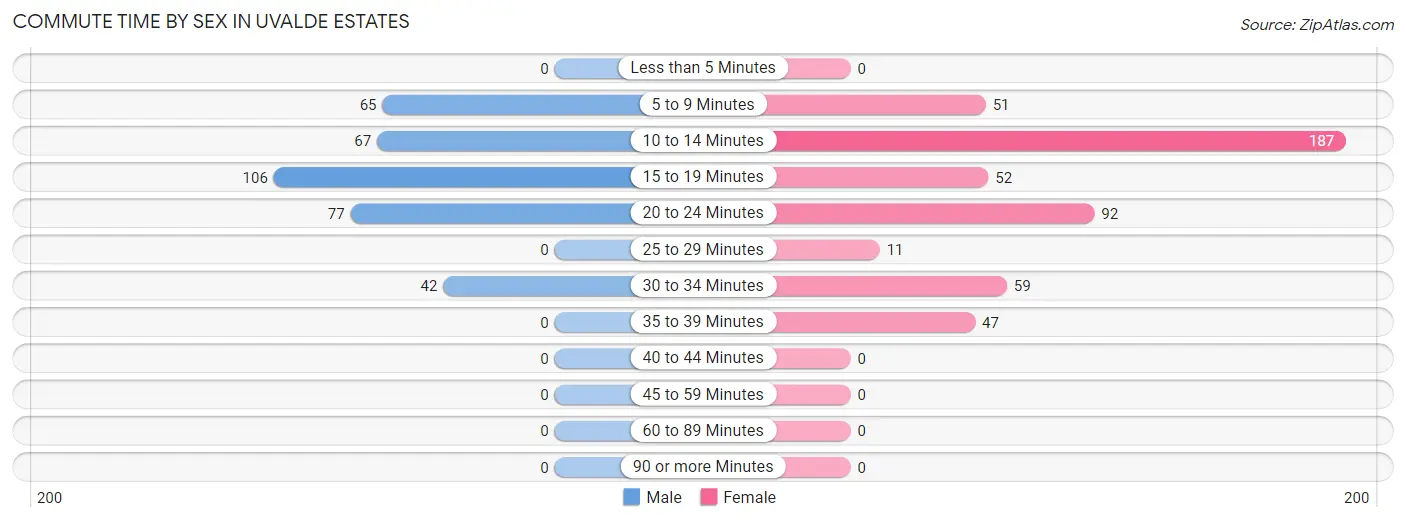
| Commute Time | Male | Female |
| Less than 5 Minutes | 0 (0.0%) | 0 (0.0%) |
| 5 to 9 Minutes | 65 (18.2%) | 51 (10.2%) |
| 10 to 14 Minutes | 67 (18.8%) | 187 (37.5%) |
| 15 to 19 Minutes | 106 (29.7%) | 52 (10.4%) |
| 20 to 24 Minutes | 77 (21.6%) | 92 (18.4%) |
| 25 to 29 Minutes | 0 (0.0%) | 11 (2.2%) |
| 30 to 34 Minutes | 42 (11.8%) | 59 (11.8%) |
| 35 to 39 Minutes | 0 (0.0%) | 47 (9.4%) |
| 40 to 44 Minutes | 0 (0.0%) | 0 (0.0%) |
| 45 to 59 Minutes | 0 (0.0%) | 0 (0.0%) |
| 60 to 89 Minutes | 0 (0.0%) | 0 (0.0%) |
| 90 or more Minutes | 0 (0.0%) | 0 (0.0%) |
Time of Departure to Work by Sex in Uvalde Estates
The most frequent times of departure to work in Uvalde Estates are 7:00 AM to 7:29 AM (177, 49.6%) for males and 7:00 AM to 7:29 AM (110, 22.0%) for females.
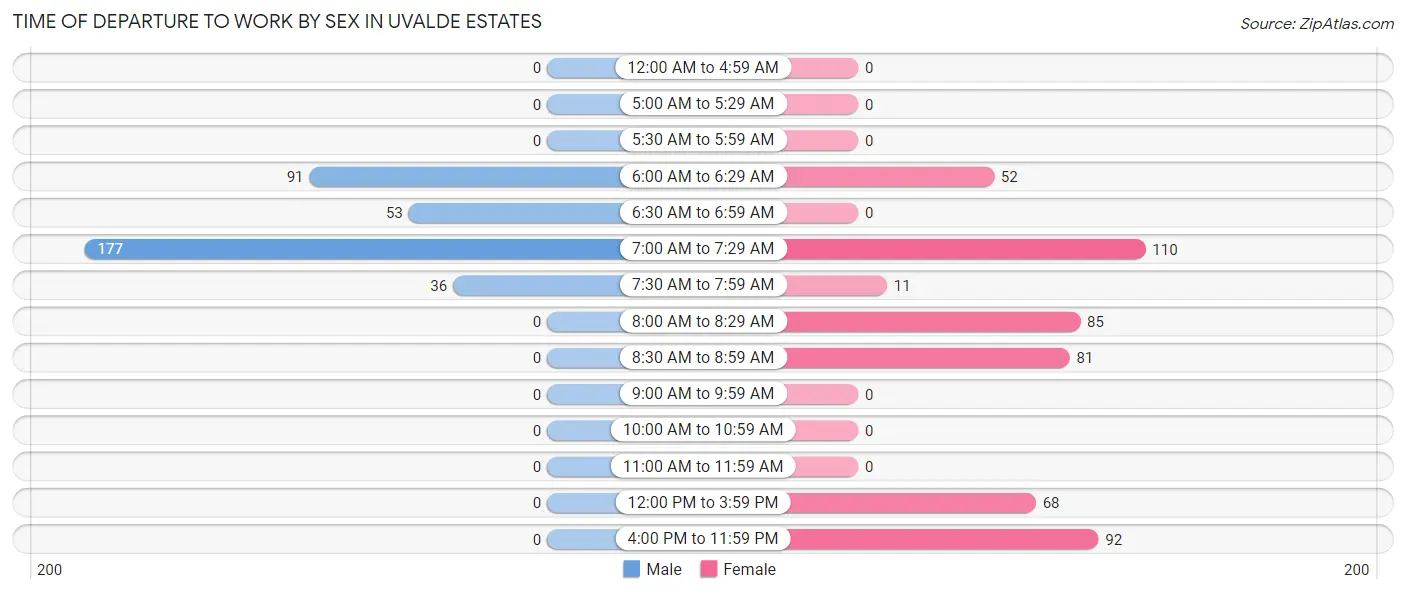
| Time of Departure | Male | Female |
| 12:00 AM to 4:59 AM | 0 (0.0%) | 0 (0.0%) |
| 5:00 AM to 5:29 AM | 0 (0.0%) | 0 (0.0%) |
| 5:30 AM to 5:59 AM | 0 (0.0%) | 0 (0.0%) |
| 6:00 AM to 6:29 AM | 91 (25.5%) | 52 (10.4%) |
| 6:30 AM to 6:59 AM | 53 (14.8%) | 0 (0.0%) |
| 7:00 AM to 7:29 AM | 177 (49.6%) | 110 (22.0%) |
| 7:30 AM to 7:59 AM | 36 (10.1%) | 11 (2.2%) |
| 8:00 AM to 8:29 AM | 0 (0.0%) | 85 (17.0%) |
| 8:30 AM to 8:59 AM | 0 (0.0%) | 81 (16.2%) |
| 9:00 AM to 9:59 AM | 0 (0.0%) | 0 (0.0%) |
| 10:00 AM to 10:59 AM | 0 (0.0%) | 0 (0.0%) |
| 11:00 AM to 11:59 AM | 0 (0.0%) | 0 (0.0%) |
| 12:00 PM to 3:59 PM | 0 (0.0%) | 68 (13.6%) |
| 4:00 PM to 11:59 PM | 0 (0.0%) | 92 (18.4%) |
| Total | 357 (100.0%) | 499 (100.0%) |
Housing Occupancy in Uvalde Estates
Occupancy by Ownership in Uvalde Estates
Of the total 846 dwellings in Uvalde Estates, owner-occupied units account for 786 (92.9%), while renter-occupied units make up 60 (7.1%).
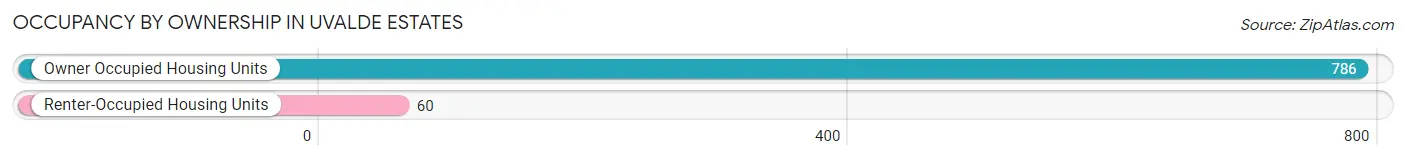
| Occupancy | # Housing Units | % Housing Units |
| Owner Occupied Housing Units | 786 | 92.9% |
| Renter-Occupied Housing Units | 60 | 7.1% |
| Total Occupied Housing Units | 846 | 100.0% |
Occupancy by Household Size in Uvalde Estates
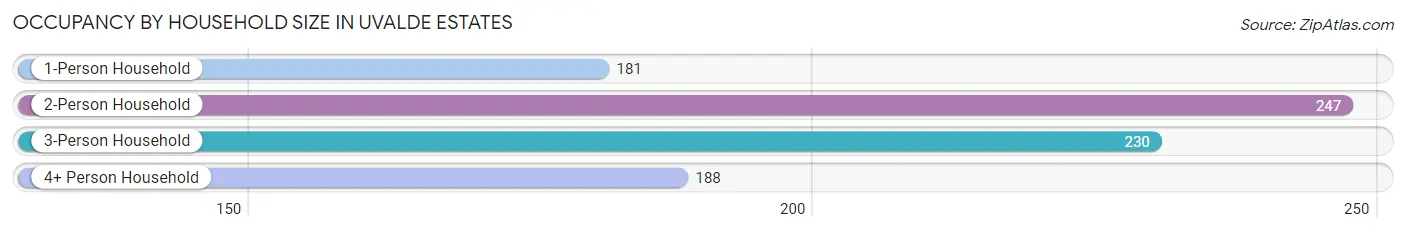
| Household Size | # Housing Units | % Housing Units |
| 1-Person Household | 181 | 21.4% |
| 2-Person Household | 247 | 29.2% |
| 3-Person Household | 230 | 27.2% |
| 4+ Person Household | 188 | 22.2% |
| Total Housing Units | 846 | 100.0% |
Occupancy by Ownership by Household Size in Uvalde Estates
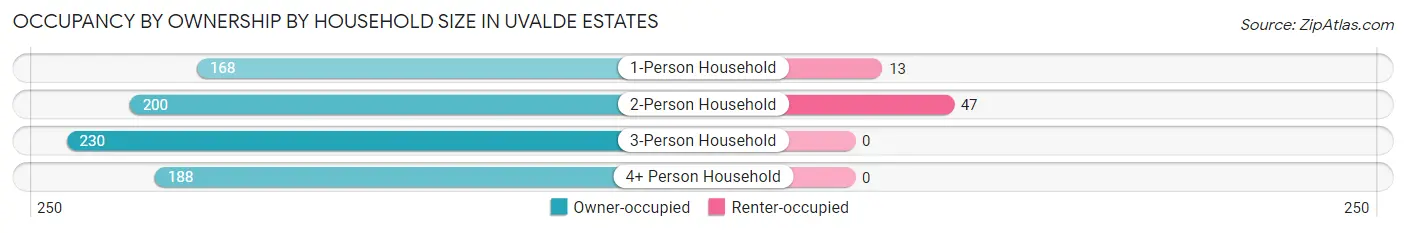
| Household Size | Owner-occupied | Renter-occupied |
| 1-Person Household | 168 (92.8%) | 13 (7.2%) |
| 2-Person Household | 200 (81.0%) | 47 (19.0%) |
| 3-Person Household | 230 (100.0%) | 0 (0.0%) |
| 4+ Person Household | 188 (100.0%) | 0 (0.0%) |
| Total Housing Units | 786 (92.9%) | 60 (7.1%) |
Occupancy by Educational Attainment in Uvalde Estates
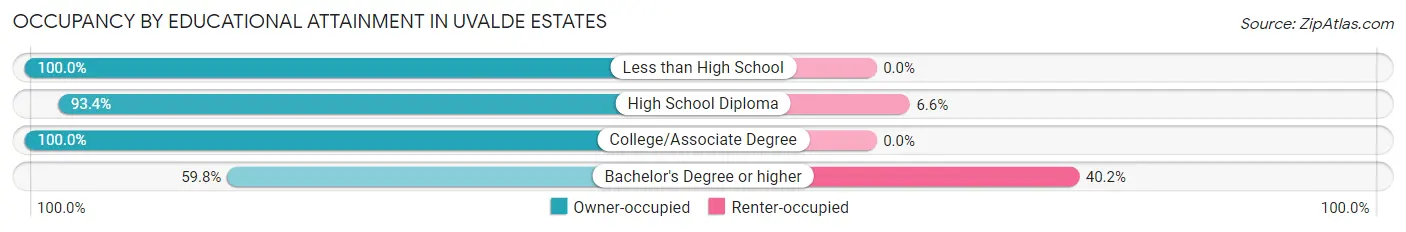
| Household Size | Owner-occupied | Renter-occupied |
| Less than High School | 220 (100.0%) | 0 (0.0%) |
| High School Diploma | 184 (93.4%) | 13 (6.6%) |
| College/Associate Degree | 312 (100.0%) | 0 (0.0%) |
| Bachelor's Degree or higher | 70 (59.8%) | 47 (40.2%) |
Occupancy by Age of Householder in Uvalde Estates
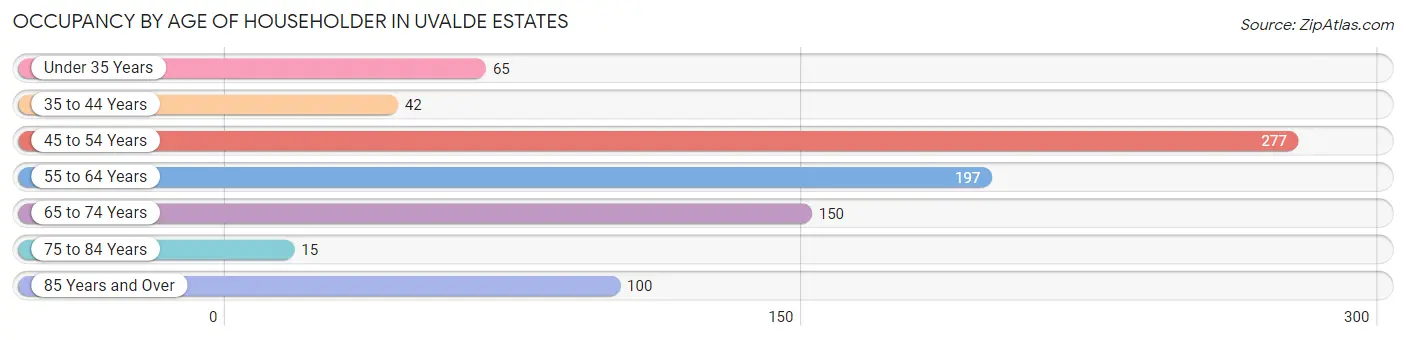
| Age Bracket | # Households | % Households |
| Under 35 Years | 65 | 7.7% |
| 35 to 44 Years | 42 | 5.0% |
| 45 to 54 Years | 277 | 32.7% |
| 55 to 64 Years | 197 | 23.3% |
| 65 to 74 Years | 150 | 17.7% |
| 75 to 84 Years | 15 | 1.8% |
| 85 Years and Over | 100 | 11.8% |
| Total | 846 | 100.0% |
Housing Finances in Uvalde Estates
Median Income by Occupancy in Uvalde Estates
| Occupancy Type | # Households | Median Income |
| Owner-Occupied | 786 (92.9%) | $0 |
| Renter-Occupied | 60 (7.1%) | $0 |
| Average | 846 (100.0%) | $0 |
Occupancy by Householder Income Bracket in Uvalde Estates
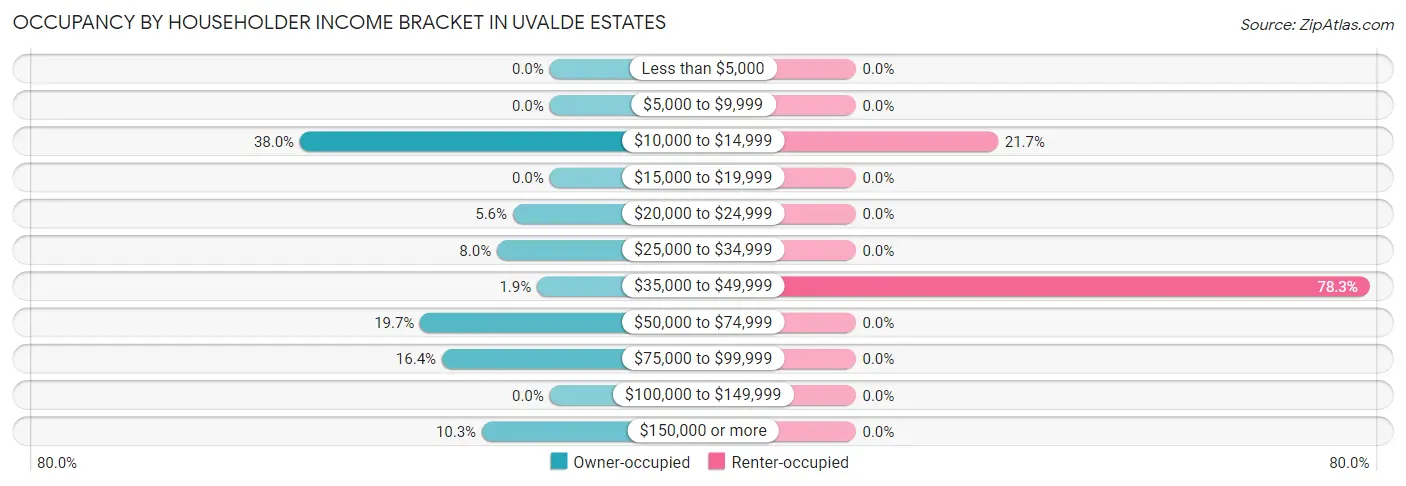
| Income Bracket | Owner-occupied | Renter-occupied |
| Less than $5,000 | 0 (0.0%) | 0 (0.0%) |
| $5,000 to $9,999 | 0 (0.0%) | 0 (0.0%) |
| $10,000 to $14,999 | 299 (38.0%) | 13 (21.7%) |
| $15,000 to $19,999 | 0 (0.0%) | 0 (0.0%) |
| $20,000 to $24,999 | 44 (5.6%) | 0 (0.0%) |
| $25,000 to $34,999 | 63 (8.0%) | 0 (0.0%) |
| $35,000 to $49,999 | 15 (1.9%) | 47 (78.3%) |
| $50,000 to $74,999 | 155 (19.7%) | 0 (0.0%) |
| $75,000 to $99,999 | 129 (16.4%) | 0 (0.0%) |
| $100,000 to $149,999 | 0 (0.0%) | 0 (0.0%) |
| $150,000 or more | 81 (10.3%) | 0 (0.0%) |
| Total | 786 (100.0%) | 60 (100.0%) |
Monthly Housing Cost Tiers in Uvalde Estates
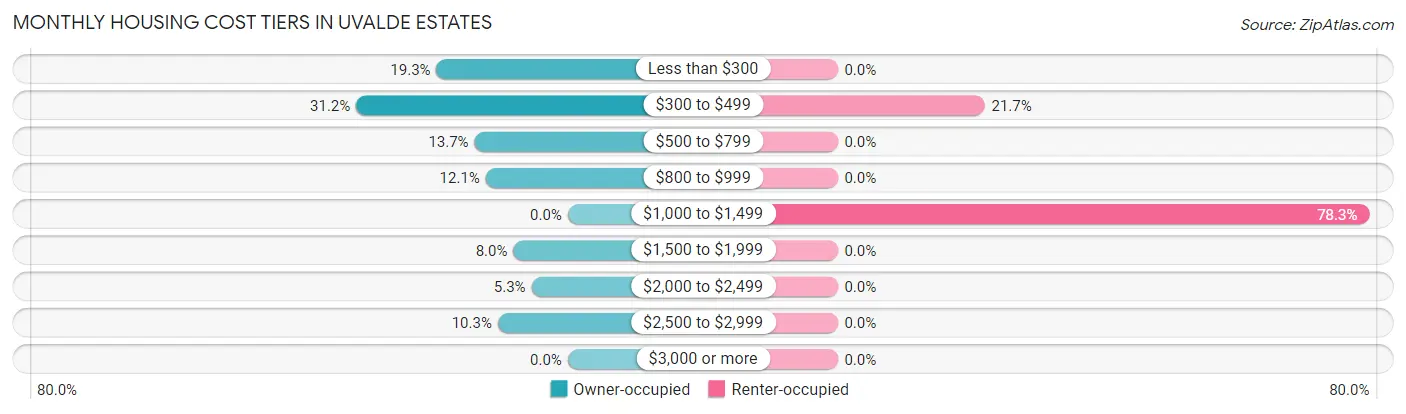
| Monthly Cost | Owner-occupied | Renter-occupied |
| Less than $300 | 152 (19.3%) | 0 (0.0%) |
| $300 to $499 | 245 (31.2%) | 13 (21.7%) |
| $500 to $799 | 108 (13.7%) | 0 (0.0%) |
| $800 to $999 | 95 (12.1%) | 0 (0.0%) |
| $1,000 to $1,499 | 0 (0.0%) | 47 (78.3%) |
| $1,500 to $1,999 | 63 (8.0%) | 0 (0.0%) |
| $2,000 to $2,499 | 42 (5.3%) | 0 (0.0%) |
| $2,500 to $2,999 | 81 (10.3%) | 0 (0.0%) |
| $3,000 or more | 0 (0.0%) | 0 (0.0%) |
| Total | 786 (100.0%) | 60 (100.0%) |
Physical Housing Characteristics in Uvalde Estates
Housing Structures in Uvalde Estates
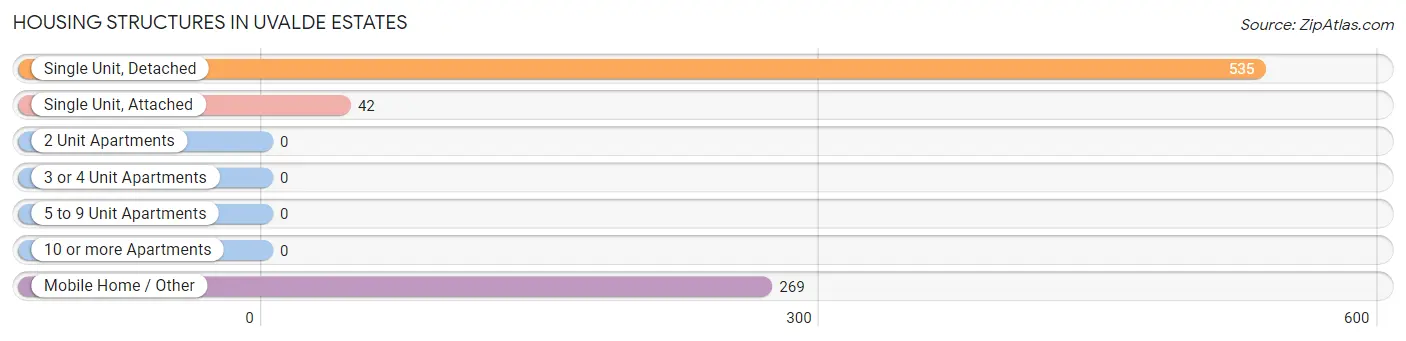
| Structure Type | # Housing Units | % Housing Units |
| Single Unit, Detached | 535 | 63.2% |
| Single Unit, Attached | 42 | 5.0% |
| 2 Unit Apartments | 0 | 0.0% |
| 3 or 4 Unit Apartments | 0 | 0.0% |
| 5 to 9 Unit Apartments | 0 | 0.0% |
| 10 or more Apartments | 0 | 0.0% |
| Mobile Home / Other | 269 | 31.8% |
| Total | 846 | 100.0% |
Housing Structures by Occupancy in Uvalde Estates
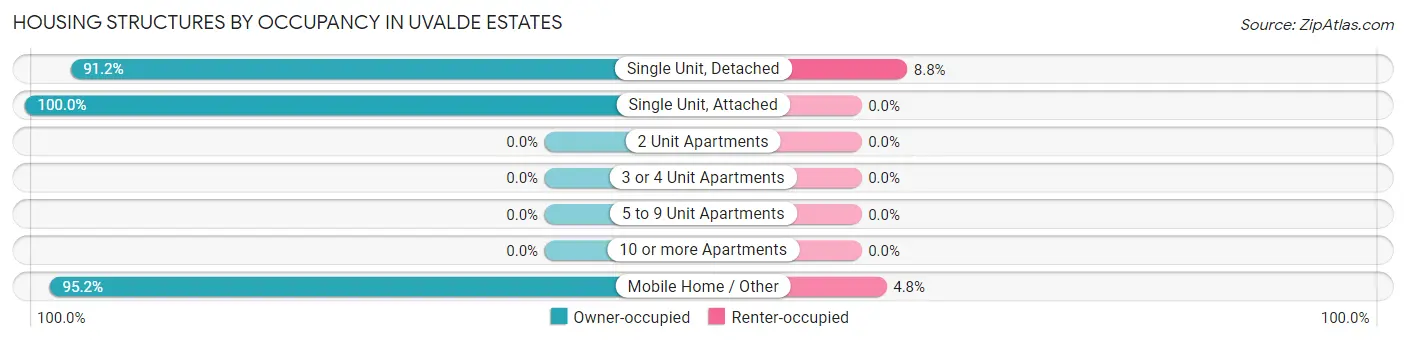
| Structure Type | Owner-occupied | Renter-occupied |
| Single Unit, Detached | 488 (91.2%) | 47 (8.8%) |
| Single Unit, Attached | 42 (100.0%) | 0 (0.0%) |
| 2 Unit Apartments | 0 (0.0%) | 0 (0.0%) |
| 3 or 4 Unit Apartments | 0 (0.0%) | 0 (0.0%) |
| 5 to 9 Unit Apartments | 0 (0.0%) | 0 (0.0%) |
| 10 or more Apartments | 0 (0.0%) | 0 (0.0%) |
| Mobile Home / Other | 256 (95.2%) | 13 (4.8%) |
| Total | 786 (92.9%) | 60 (7.1%) |
Housing Structures by Number of Rooms in Uvalde Estates
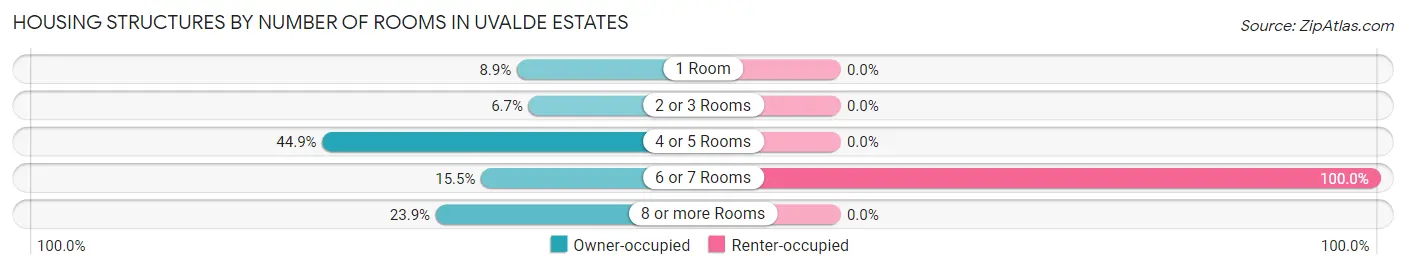
| Number of Rooms | Owner-occupied | Renter-occupied |
| 1 Room | 70 (8.9%) | 0 (0.0%) |
| 2 or 3 Rooms | 53 (6.7%) | 0 (0.0%) |
| 4 or 5 Rooms | 353 (44.9%) | 0 (0.0%) |
| 6 or 7 Rooms | 122 (15.5%) | 60 (100.0%) |
| 8 or more Rooms | 188 (23.9%) | 0 (0.0%) |
| Total | 786 (100.0%) | 60 (100.0%) |
Housing Structure by Heating Type in Uvalde Estates
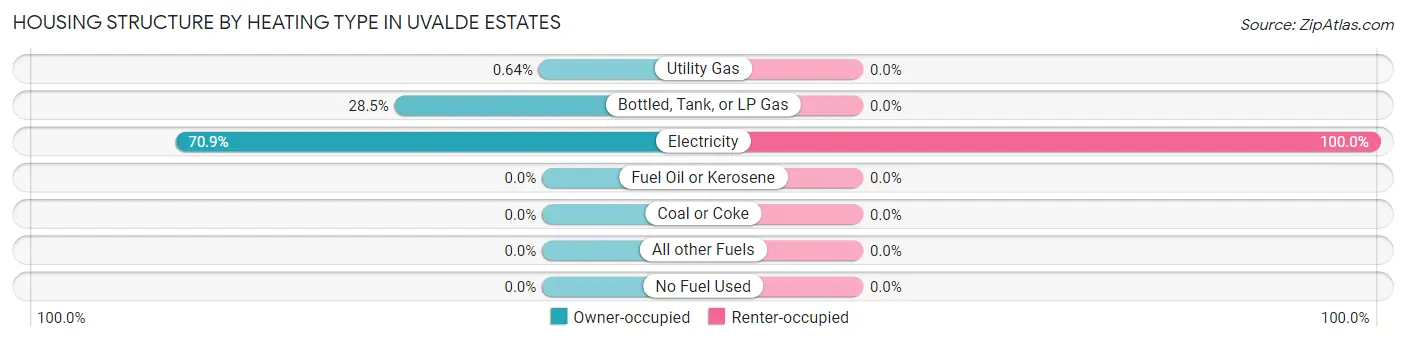
| Heating Type | Owner-occupied | Renter-occupied |
| Utility Gas | 5 (0.6%) | 0 (0.0%) |
| Bottled, Tank, or LP Gas | 224 (28.5%) | 0 (0.0%) |
| Electricity | 557 (70.9%) | 60 (100.0%) |
| Fuel Oil or Kerosene | 0 (0.0%) | 0 (0.0%) |
| Coal or Coke | 0 (0.0%) | 0 (0.0%) |
| All other Fuels | 0 (0.0%) | 0 (0.0%) |
| No Fuel Used | 0 (0.0%) | 0 (0.0%) |
| Total | 786 (100.0%) | 60 (100.0%) |
Household Vehicle Usage in Uvalde Estates
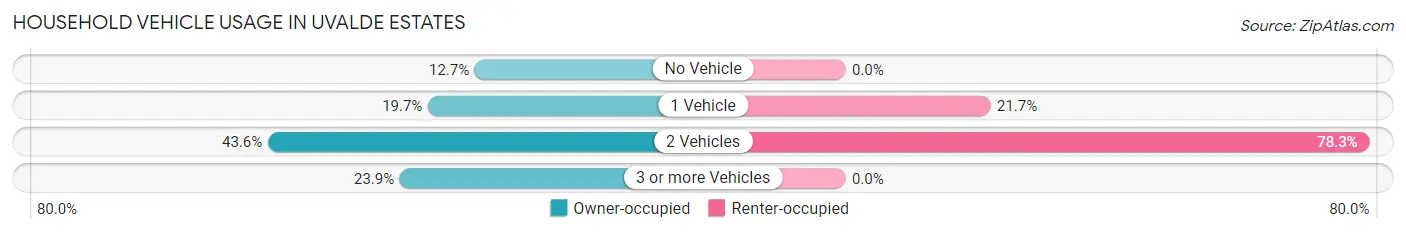
| Vehicles per Household | Owner-occupied | Renter-occupied |
| No Vehicle | 100 (12.7%) | 0 (0.0%) |
| 1 Vehicle | 155 (19.7%) | 13 (21.7%) |
| 2 Vehicles | 343 (43.6%) | 47 (78.3%) |
| 3 or more Vehicles | 188 (23.9%) | 0 (0.0%) |
| Total | 786 (100.0%) | 60 (100.0%) |
Real Estate & Mortgages in Uvalde Estates
Real Estate and Mortgage Overview in Uvalde Estates
| Characteristic | Without Mortgage | With Mortgage |
| Housing Units | 523 | 263 |
| Median Property Value | $56,900 | $222,200 |
| Median Household Income | - | - |
| Monthly Housing Costs | $407 | $0 |
| Real Estate Taxes | - | - |
Property Value by Mortgage Status in Uvalde Estates
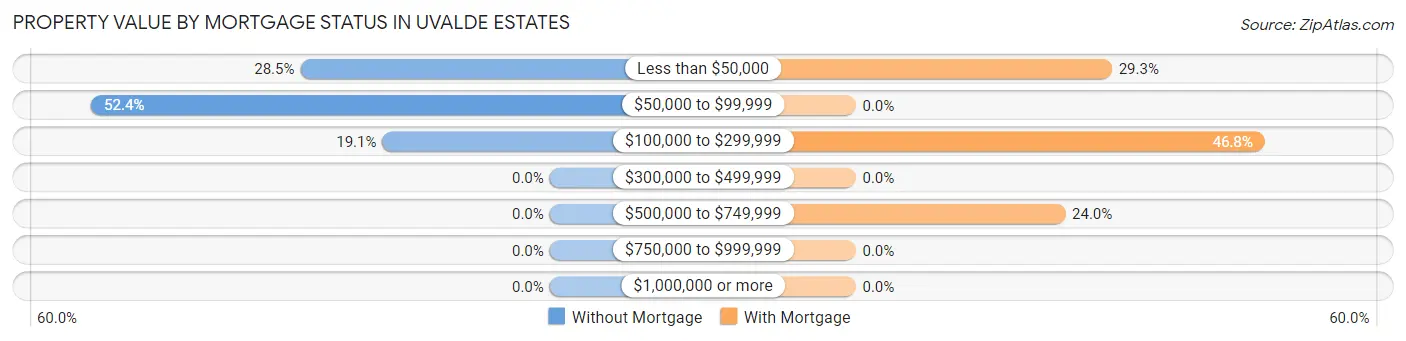
| Property Value | Without Mortgage | With Mortgage |
| Less than $50,000 | 149 (28.5%) | 77 (29.3%) |
| $50,000 to $99,999 | 274 (52.4%) | 0 (0.0%) |
| $100,000 to $299,999 | 100 (19.1%) | 123 (46.8%) |
| $300,000 to $499,999 | 0 (0.0%) | 0 (0.0%) |
| $500,000 to $749,999 | 0 (0.0%) | 63 (23.9%) |
| $750,000 to $999,999 | 0 (0.0%) | 0 (0.0%) |
| $1,000,000 or more | 0 (0.0%) | 0 (0.0%) |
| Total | 523 (100.0%) | 263 (100.0%) |
Household Income by Mortgage Status in Uvalde Estates
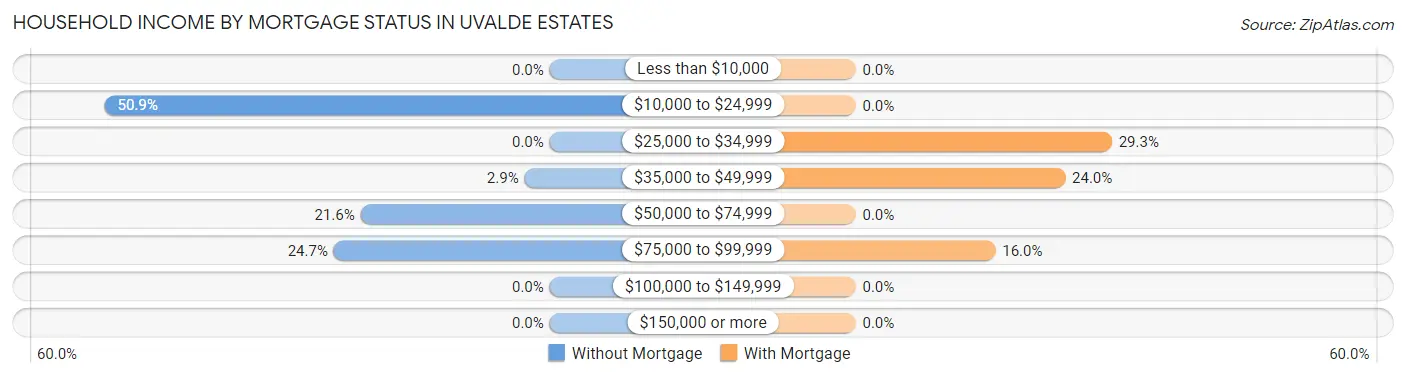
| Household Income | Without Mortgage | With Mortgage |
| Less than $10,000 | 0 (0.0%) | 0 (0.0%) |
| $10,000 to $24,999 | 266 (50.9%) | 0 (0.0%) |
| $25,000 to $34,999 | 0 (0.0%) | 77 (29.3%) |
| $35,000 to $49,999 | 15 (2.9%) | 63 (23.9%) |
| $50,000 to $74,999 | 113 (21.6%) | 0 (0.0%) |
| $75,000 to $99,999 | 129 (24.7%) | 42 (16.0%) |
| $100,000 to $149,999 | 0 (0.0%) | 0 (0.0%) |
| $150,000 or more | 0 (0.0%) | 0 (0.0%) |
| Total | 523 (100.0%) | 263 (100.0%) |
Property Value to Household Income Ratio in Uvalde Estates
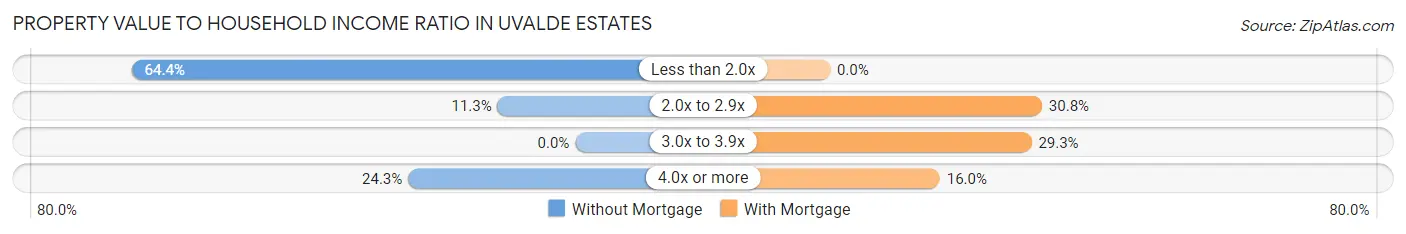
| Value-to-Income Ratio | Without Mortgage | With Mortgage |
| Less than 2.0x | 337 (64.4%) | 0 (0.0%) |
| 2.0x to 2.9x | 59 (11.3%) | 81 (30.8%) |
| 3.0x to 3.9x | 0 (0.0%) | 77 (29.3%) |
| 4.0x or more | 127 (24.3%) | 42 (16.0%) |
| Total | 523 (100.0%) | 263 (100.0%) |
Real Estate Taxes by Mortgage Status in Uvalde Estates
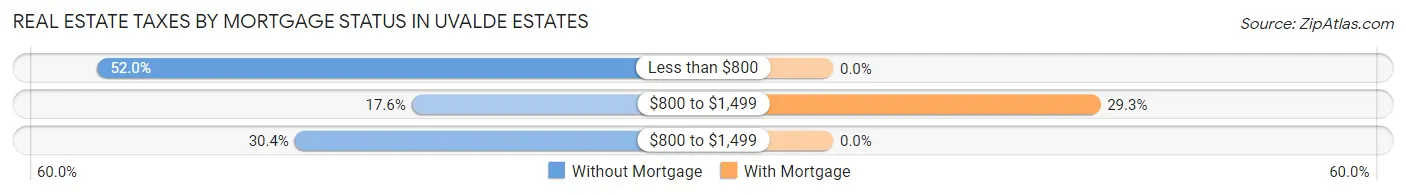
| Property Taxes | Without Mortgage | With Mortgage |
| Less than $800 | 272 (52.0%) | 0 (0.0%) |
| $800 to $1,499 | 92 (17.6%) | 77 (29.3%) |
| $800 to $1,499 | 159 (30.4%) | 0 (0.0%) |
| Total | 523 (100.0%) | 263 (100.0%) |
Health & Disability in Uvalde Estates
Health Insurance Coverage by Age in Uvalde Estates
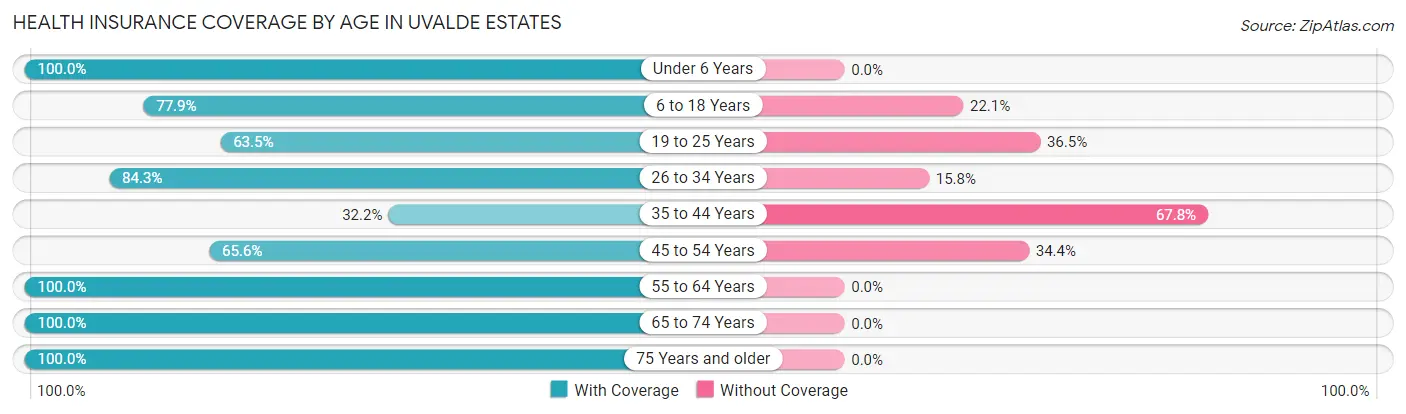
| Age Bracket | With Coverage | Without Coverage |
| Under 6 Years | 140 (100.0%) | 0 (0.0%) |
| 6 to 18 Years | 401 (77.9%) | 114 (22.1%) |
| 19 to 25 Years | 235 (63.5%) | 135 (36.5%) |
| 26 to 34 Years | 337 (84.3%) | 63 (15.8%) |
| 35 to 44 Years | 94 (32.2%) | 198 (67.8%) |
| 45 to 54 Years | 265 (65.6%) | 139 (34.4%) |
| 55 to 64 Years | 301 (100.0%) | 0 (0.0%) |
| 65 to 74 Years | 192 (100.0%) | 0 (0.0%) |
| 75 Years and older | 205 (100.0%) | 0 (0.0%) |
| Total | 2,170 (77.0%) | 649 (23.0%) |
Health Insurance Coverage by Citizenship Status in Uvalde Estates
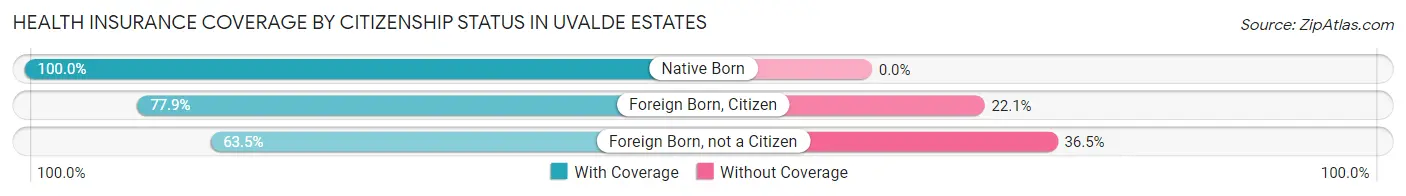
| Citizenship Status | With Coverage | Without Coverage |
| Native Born | 140 (100.0%) | 0 (0.0%) |
| Foreign Born, Citizen | 401 (77.9%) | 114 (22.1%) |
| Foreign Born, not a Citizen | 235 (63.5%) | 135 (36.5%) |
Health Insurance Coverage by Household Income in Uvalde Estates
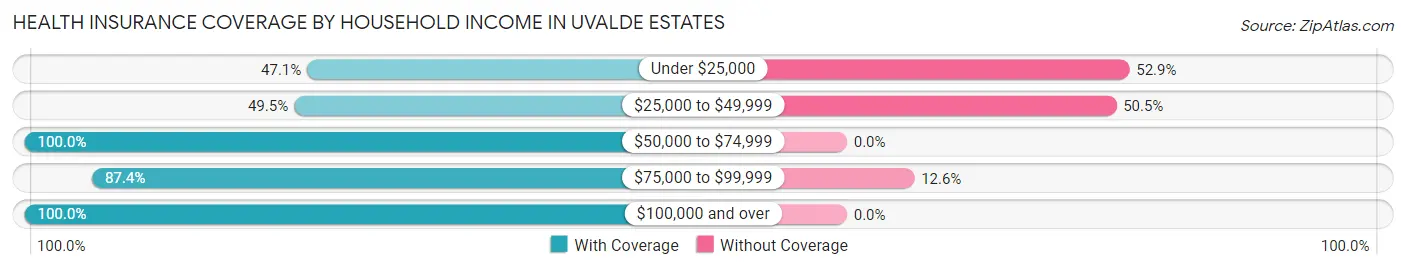
| Household Income | With Coverage | Without Coverage |
| Under $25,000 | 378 (47.1%) | 425 (52.9%) |
| $25,000 to $49,999 | 158 (49.5%) | 161 (50.5%) |
| $50,000 to $74,999 | 572 (100.0%) | 0 (0.0%) |
| $75,000 to $99,999 | 436 (87.4%) | 63 (12.6%) |
| $100,000 and over | 626 (100.0%) | 0 (0.0%) |
Public vs Private Health Insurance Coverage by Age in Uvalde Estates
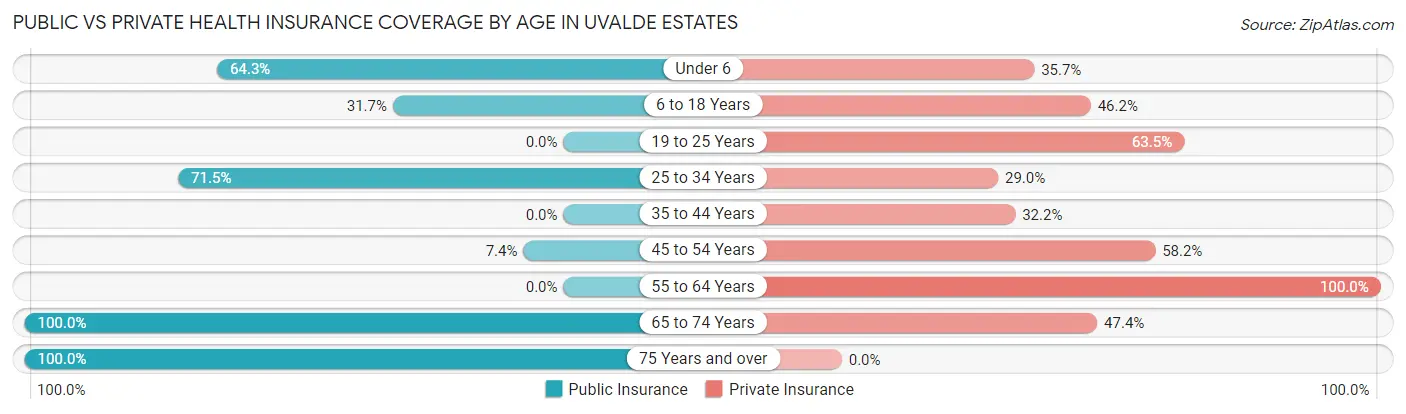
| Age Bracket | Public Insurance | Private Insurance |
| Under 6 | 90 (64.3%) | 50 (35.7%) |
| 6 to 18 Years | 163 (31.7%) | 238 (46.2%) |
| 19 to 25 Years | 0 (0.0%) | 235 (63.5%) |
| 25 to 34 Years | 286 (71.5%) | 116 (29.0%) |
| 35 to 44 Years | 0 (0.0%) | 94 (32.2%) |
| 45 to 54 Years | 30 (7.4%) | 235 (58.2%) |
| 55 to 64 Years | 0 (0.0%) | 301 (100.0%) |
| 65 to 74 Years | 192 (100.0%) | 91 (47.4%) |
| 75 Years and over | 205 (100.0%) | 0 (0.0%) |
| Total | 966 (34.3%) | 1,360 (48.2%) |
Disability Status by Sex by Age in Uvalde Estates
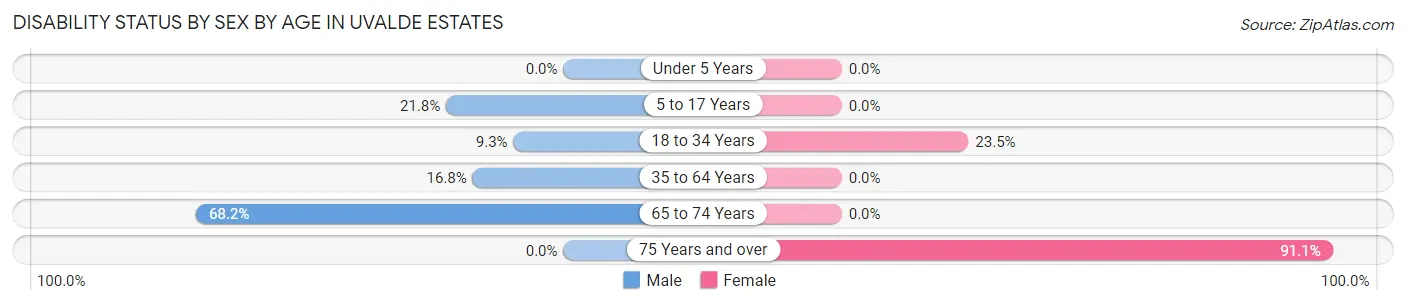
| Age Bracket | Male | Female |
| Under 5 Years | 0 (0.0%) | 0 (0.0%) |
| 5 to 17 Years | 47 (21.8%) | 0 (0.0%) |
| 18 to 34 Years | 65 (9.3%) | 51 (23.5%) |
| 35 to 64 Years | 95 (16.8%) | 0 (0.0%) |
| 65 to 74 Years | 90 (68.2%) | 0 (0.0%) |
| 75 Years and over | 0 (0.0%) | 153 (91.1%) |
Disability Class by Sex by Age in Uvalde Estates
Disability Class: Hearing Difficulty
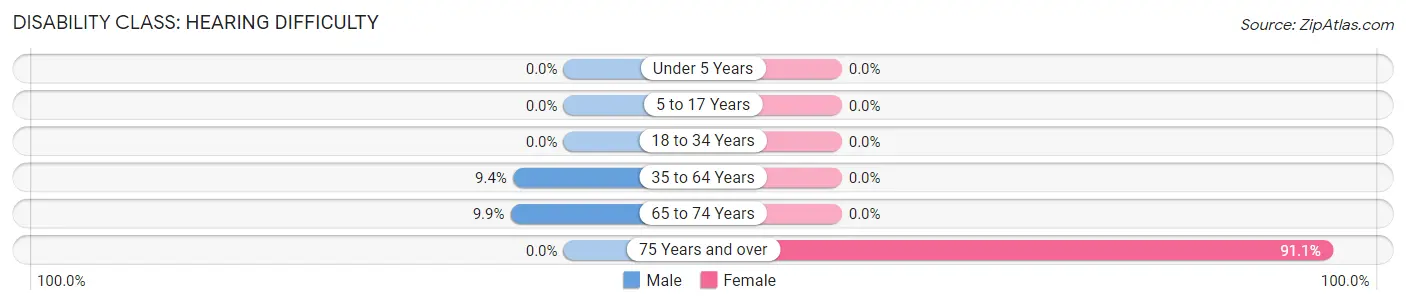
| Age Bracket | Male | Female |
| Under 5 Years | 0 (0.0%) | 0 (0.0%) |
| 5 to 17 Years | 0 (0.0%) | 0 (0.0%) |
| 18 to 34 Years | 0 (0.0%) | 0 (0.0%) |
| 35 to 64 Years | 53 (9.4%) | 0 (0.0%) |
| 65 to 74 Years | 13 (9.9%) | 0 (0.0%) |
| 75 Years and over | 0 (0.0%) | 153 (91.1%) |
Disability Class: Vision Difficulty
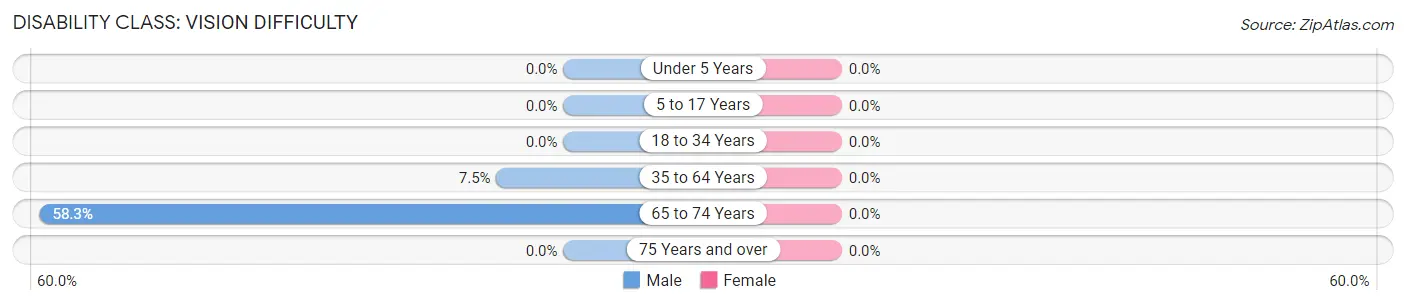
| Age Bracket | Male | Female |
| Under 5 Years | 0 (0.0%) | 0 (0.0%) |
| 5 to 17 Years | 0 (0.0%) | 0 (0.0%) |
| 18 to 34 Years | 0 (0.0%) | 0 (0.0%) |
| 35 to 64 Years | 42 (7.4%) | 0 (0.0%) |
| 65 to 74 Years | 77 (58.3%) | 0 (0.0%) |
| 75 Years and over | 0 (0.0%) | 0 (0.0%) |
Disability Class: Cognitive Difficulty
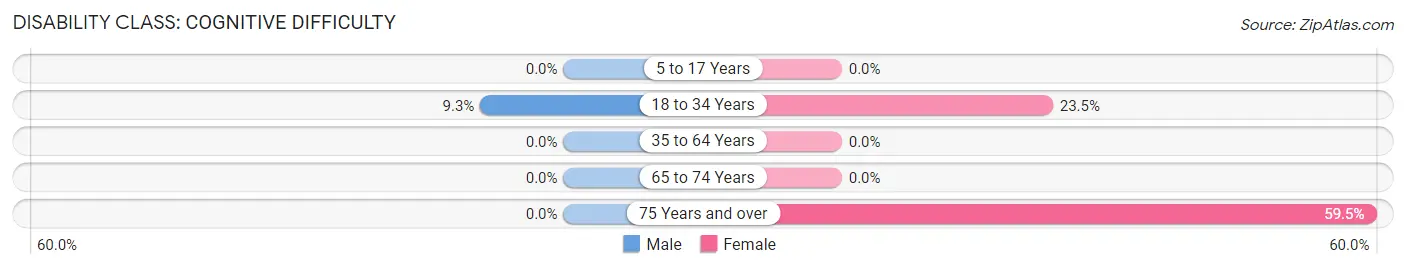
| Age Bracket | Male | Female |
| 5 to 17 Years | 0 (0.0%) | 0 (0.0%) |
| 18 to 34 Years | 65 (9.3%) | 51 (23.5%) |
| 35 to 64 Years | 0 (0.0%) | 0 (0.0%) |
| 65 to 74 Years | 0 (0.0%) | 0 (0.0%) |
| 75 Years and over | 0 (0.0%) | 100 (59.5%) |
Disability Class: Ambulatory Difficulty
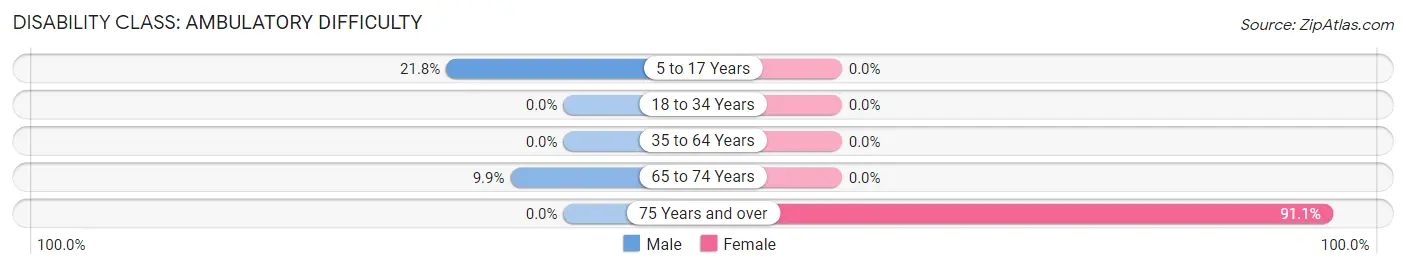
| Age Bracket | Male | Female |
| 5 to 17 Years | 47 (21.8%) | 0 (0.0%) |
| 18 to 34 Years | 0 (0.0%) | 0 (0.0%) |
| 35 to 64 Years | 0 (0.0%) | 0 (0.0%) |
| 65 to 74 Years | 13 (9.9%) | 0 (0.0%) |
| 75 Years and over | 0 (0.0%) | 153 (91.1%) |
Disability Class: Self-Care Difficulty
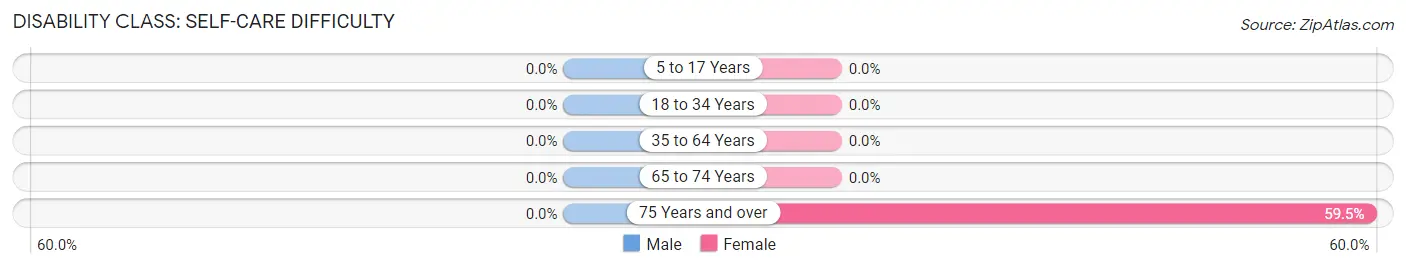
| Age Bracket | Male | Female |
| 5 to 17 Years | 0 (0.0%) | 0 (0.0%) |
| 18 to 34 Years | 0 (0.0%) | 0 (0.0%) |
| 35 to 64 Years | 0 (0.0%) | 0 (0.0%) |
| 65 to 74 Years | 0 (0.0%) | 0 (0.0%) |
| 75 Years and over | 0 (0.0%) | 100 (59.5%) |
Technology Access in Uvalde Estates
Computing Device Access in Uvalde Estates
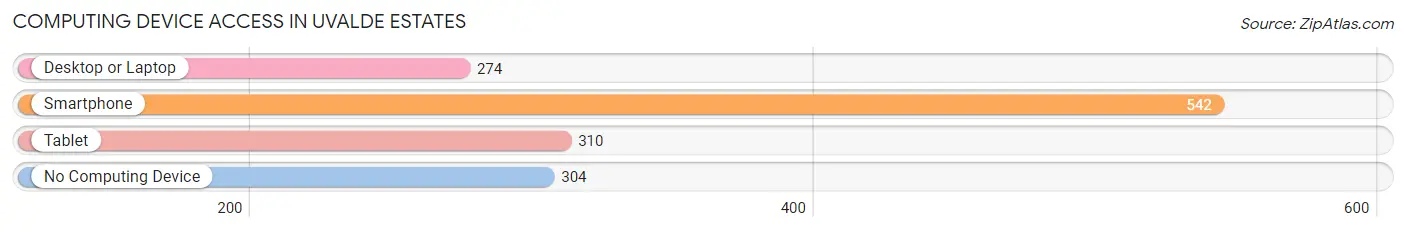
| Device Type | # Households | % Households |
| Desktop or Laptop | 274 | 32.4% |
| Smartphone | 542 | 64.1% |
| Tablet | 310 | 36.6% |
| No Computing Device | 304 | 35.9% |
| Total | 846 | 100.0% |
Internet Access in Uvalde Estates
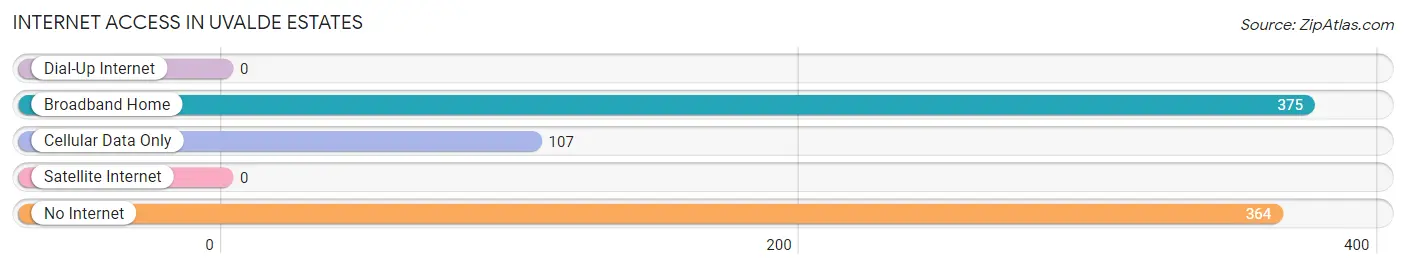
| Internet Type | # Households | % Households |
| Dial-Up Internet | 0 | 0.0% |
| Broadband Home | 375 | 44.3% |
| Cellular Data Only | 107 | 12.7% |
| Satellite Internet | 0 | 0.0% |
| No Internet | 364 | 43.0% |
| Total | 846 | 100.0% |
Uvalde Estates Summary
Uvalde Estates is a census-designated place (CDP) located in Uvalde County, Texas, United States. The population was 1,845 at the 2000 census.
History
Uvalde Estates was founded in the late 1950s by a group of ranchers and farmers who wanted to create a community that was close to the city of Uvalde, but still had the rural feel of the surrounding area. The community was originally known as Uvalde Estates, but the name was changed to Uvalde Estates in the early 1960s.
The community was built on land that was originally part of the Uvalde Ranch, which was owned by the Uvalde Land and Cattle Company. The company sold off parcels of land to the ranchers and farmers who wanted to create the community.
Geography
Uvalde Estates is located at 29 14 25 North 99 45 45 West 29 240278 99 7625
According to the United States Census Bureau, the CDP has a total area of 4.2 square miles (10.8 km2), all of it land.
Economy
The economy of Uvalde Estates is largely based on agriculture and ranching. The area is home to several large ranches, as well as smaller farms and orchards. The community also has a few small businesses, including a grocery store, a gas station, and a few restaurants.
Demographics
As of the census of 2000, there were 1,845 people, 645 households, and 517 families residing in the CDP. The population density was 441.3 people per square mile (170.3/km2). There were 690 housing units at an average density of 165.3/sq mi (63.7/km2). The racial makeup of the CDP was 81.45% White, 0.11% African American, 0.43% Native American, 0.05% Asian, 0.05% Pacific Islander, 16.45% from other races, and 1.46% from two or more races. Hispanic or Latino of any race were 81.45% of the population.
There were 645 households, out of which 37.2% had children under the age of 18 living with them, 63.2% were married couples living together, 11.2% had a female householder with no husband present, and 20.2% were non-families. 17.2% of all households were made up of individuals, and 8.2% had someone living alone who was 65 years of age or older. The average household size was 2.86 and the average family size was 3.20.
In the CDP, the population was spread out, with 28.7% under the age of 18, 8.2% from 18 to 24, 25.7% from 25 to 44, 24.2% from 45 to 64, and 13.2% who were 65 years of age or older. The median age was 36 years. For every 100 females, there were 97.2 males. For every 100 females age 18 and over, there were 94.2 males.
The median income for a household in the CDP was $25,938, and the median income for a family was $27,917. Males had a median income of $25,000 versus $17,500 for females. The per capita income for the CDP was $11,845. About 20.2% of families and 22.7% of the population were below the poverty line, including 28.2% of those under age 18 and 16.7% of those age 65 or over.
Common Questions
What is Per Capita Income in Uvalde Estates?
Per Capita income in Uvalde Estates is $16,997.
What is Inequality or Gini Index in Uvalde Estates?
Inequality or Gini Index in Uvalde Estates is 0.50.
What is the Total Population of Uvalde Estates?
Total Population of Uvalde Estates is 2,819.
What is the Total Male Population of Uvalde Estates?
Total Male Population of Uvalde Estates is 1,651.
What is the Total Female Population of Uvalde Estates?
Total Female Population of Uvalde Estates is 1,168.
What is the Ratio of Males per 100 Females in Uvalde Estates?
There are 141.35 Males per 100 Females in Uvalde Estates.
What is the Ratio of Females per 100 Males in Uvalde Estates?
There are 70.75 Females per 100 Males in Uvalde Estates.
What is the Median Population Age in Uvalde Estates?
Median Population Age in Uvalde Estates is 33.7 Years.
What is the Average Family Size in Uvalde Estates
Average Family Size in Uvalde Estates is 4.0 People.
What is the Average Household Size in Uvalde Estates
Average Household Size in Uvalde Estates is 3.3 People.
How Large is the Labor Force in Uvalde Estates?
There are 1,022 People in the Labor Forcein in Uvalde Estates.
What is the Percentage of People in the Labor Force in Uvalde Estates?
44.2% of People are in the Labor Force in Uvalde Estates.
What is the Unemployment Rate in Uvalde Estates?
Unemployment Rate in Uvalde Estates is 16.3%.