Haskell, TX Map & Demographics
Haskell Map
Haskell Overview
$48,120
PER CAPITA INCOME
$67,465
AVG FAMILY INCOME
$59,333
AVG HOUSEHOLD INCOME
14.8%
WAGE / INCOME GAP [ % ]
85.2¢/ $1
WAGE / INCOME GAP [ $ ]
0.61
INEQUALITY / GINI INDEX
2,956
TOTAL POPULATION
1,597
MALE POPULATION
1,359
FEMALE POPULATION
117.51
MALES / 100 FEMALES
85.10
FEMALES / 100 MALES
41.7
MEDIAN AGE
2.9
AVG FAMILY SIZE
2.5
AVG HOUSEHOLD SIZE
1,352
LABOR FORCE [ PEOPLE ]
52.6%
PERCENT IN LABOR FORCE
8.1%
UNEMPLOYMENT RATE
Haskell Zip Codes
Haskell Area Codes
Income in Haskell
Income Overview in Haskell
Per Capita Income in Haskell is $48,120, while median incomes of families and households are $67,465 and $59,333 respectively.
| Characteristic | Number | Measure |
| Per Capita Income | 2,956 | $48,120 |
| Median Family Income | 745 | $67,465 |
| Mean Family Income | 745 | $89,590 |
| Median Household Income | 1,074 | $59,333 |
| Mean Household Income | 1,074 | $122,538 |
| Income Deficit | 745 | $0 |
| Wage / Income Gap (%) | 2,956 | 14.84% |
| Wage / Income Gap ($) | 2,956 | 85.16¢ per $1 |
| Gini / Inequality Index | 2,956 | 0.61 |
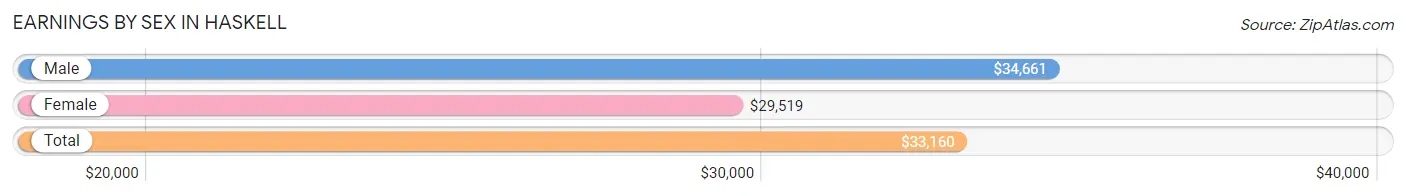
Earnings by Sex in Haskell
Average Earnings in Haskell are $33,160, $34,661 for men and $29,519 for women, a difference of 14.8%.
| Sex | Number | Average Earnings |
| Male | 893 (59.3%) | $34,661 |
| Female | 612 (40.7%) | $29,519 |
| Total | 1,505 (100.0%) | $33,160 |
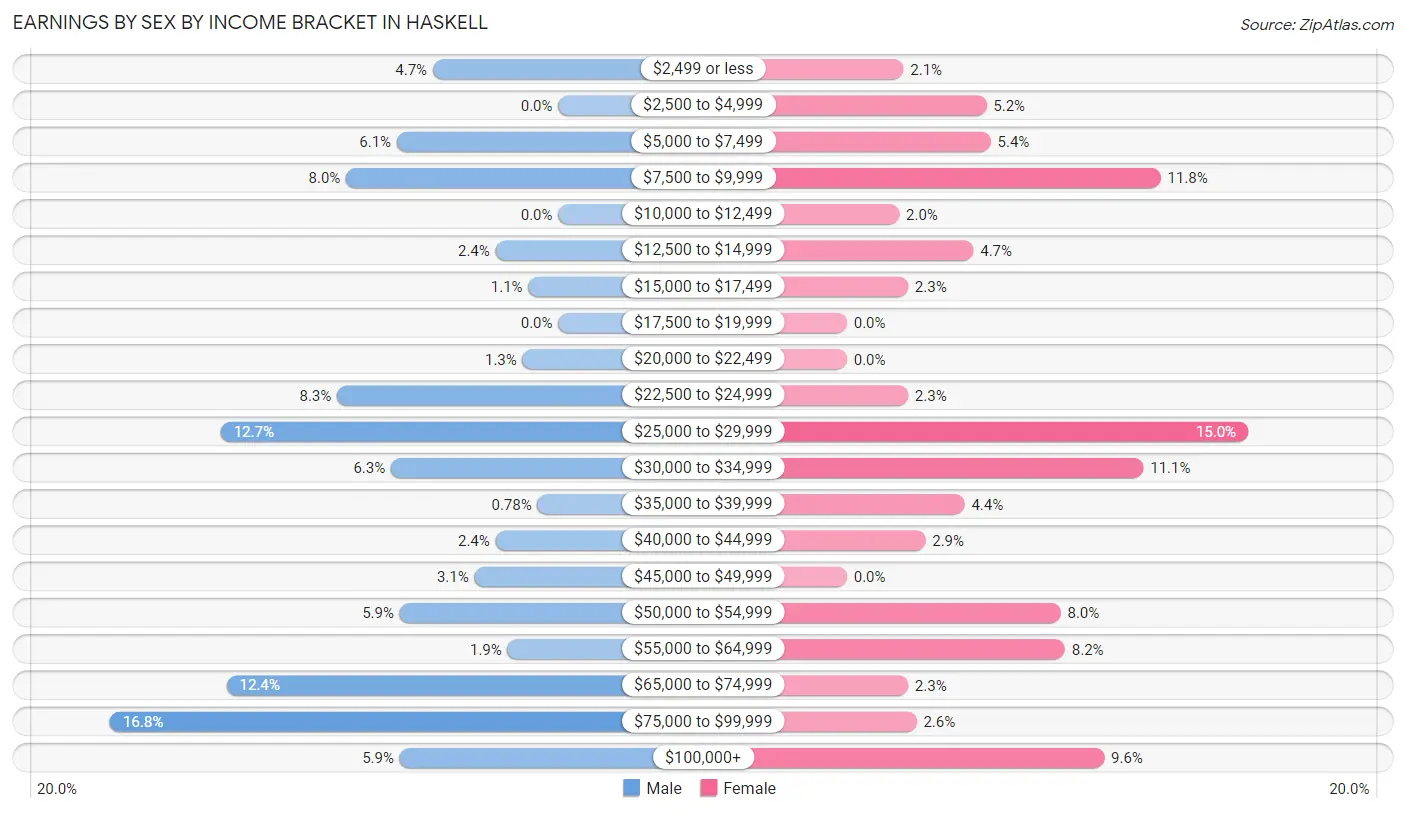
Earnings by Sex by Income Bracket in Haskell
The most common earnings brackets in Haskell are $75,000 to $99,999 for men (150 | 16.8%) and $25,000 to $29,999 for women (92 | 15.0%).
| Income | Male | Female |
| $2,499 or less | 42 (4.7%) | 13 (2.1%) |
| $2,500 to $4,999 | 0 (0.0%) | 32 (5.2%) |
| $5,000 to $7,499 | 54 (6.0%) | 33 (5.4%) |
| $7,500 to $9,999 | 71 (8.0%) | 72 (11.8%) |
| $10,000 to $12,499 | 0 (0.0%) | 12 (2.0%) |
| $12,500 to $14,999 | 21 (2.4%) | 29 (4.7%) |
| $15,000 to $17,499 | 10 (1.1%) | 14 (2.3%) |
| $17,500 to $19,999 | 0 (0.0%) | 0 (0.0%) |
| $20,000 to $22,499 | 12 (1.3%) | 0 (0.0%) |
| $22,500 to $24,999 | 74 (8.3%) | 14 (2.3%) |
| $25,000 to $29,999 | 113 (12.7%) | 92 (15.0%) |
| $30,000 to $34,999 | 56 (6.3%) | 68 (11.1%) |
| $35,000 to $39,999 | 7 (0.8%) | 27 (4.4%) |
| $40,000 to $44,999 | 21 (2.4%) | 18 (2.9%) |
| $45,000 to $49,999 | 28 (3.1%) | 0 (0.0%) |
| $50,000 to $54,999 | 53 (5.9%) | 49 (8.0%) |
| $55,000 to $64,999 | 17 (1.9%) | 50 (8.2%) |
| $65,000 to $74,999 | 111 (12.4%) | 14 (2.3%) |
| $75,000 to $99,999 | 150 (16.8%) | 16 (2.6%) |
| $100,000+ | 53 (5.9%) | 59 (9.6%) |
| Total | 893 (100.0%) | 612 (100.0%) |
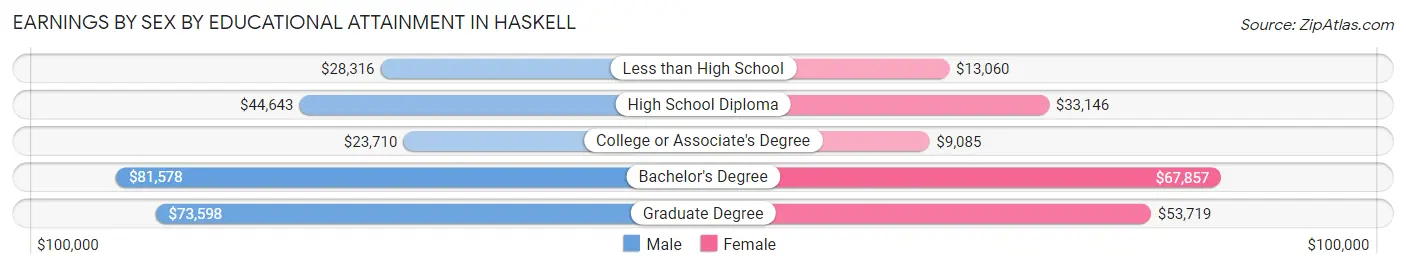
Earnings by Sex by Educational Attainment in Haskell
Average earnings in Haskell are $40,625 for men and $32,625 for women, a difference of 19.7%. Men with an educational attainment of bachelor's degree enjoy the highest average annual earnings of $81,578, while those with college or associate's degree education earn the least with $23,710. Women with an educational attainment of bachelor's degree earn the most with the average annual earnings of $67,857, while those with college or associate's degree education have the smallest earnings of $9,085.
| Educational Attainment | Male Income | Female Income |
| Less than High School | $28,316 | $13,060 |
| High School Diploma | $44,643 | $33,146 |
| College or Associate's Degree | $23,710 | $9,085 |
| Bachelor's Degree | $81,578 | $67,857 |
| Graduate Degree | $73,598 | $53,719 |
| Total | $40,625 | $32,625 |
Family Income in Haskell
Family Income Brackets in Haskell
According to the Haskell family income data, there are 165 families falling into the $50,000 to $74,999 income range, which is the most common income bracket and makes up 22.2% of all families. Conversely, the less than $10,000 income bracket is the least frequent group with only 6 families (0.8%) belonging to this category.
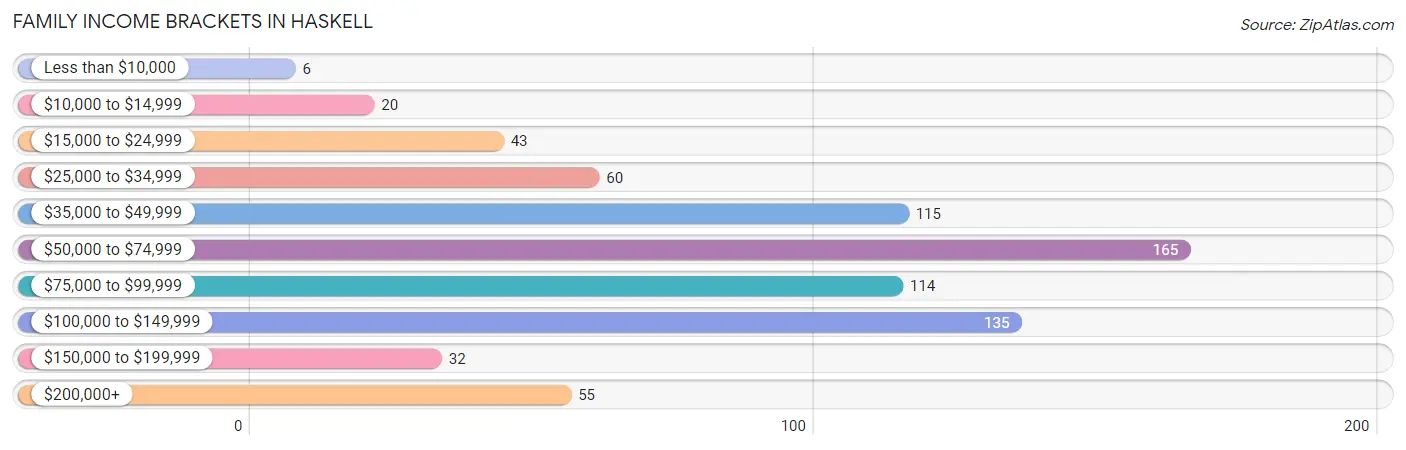
| Income Bracket | # Families | % Families |
| Less than $10,000 | 6 | 0.8% |
| $10,000 to $14,999 | 20 | 2.7% |
| $15,000 to $24,999 | 43 | 5.8% |
| $25,000 to $34,999 | 60 | 8.1% |
| $35,000 to $49,999 | 115 | 15.4% |
| $50,000 to $74,999 | 165 | 22.1% |
| $75,000 to $99,999 | 114 | 15.3% |
| $100,000 to $149,999 | 135 | 18.1% |
| $150,000 to $199,999 | 32 | 4.3% |
| $200,000+ | 55 | 7.4% |
Family Income by Famaliy Size in Haskell
2-person families (526 | 70.6%) account for the highest median family income in Haskell with $72,885 per family, while 2-person families (526 | 70.6%) have the highest median income of $36,442 per family member.
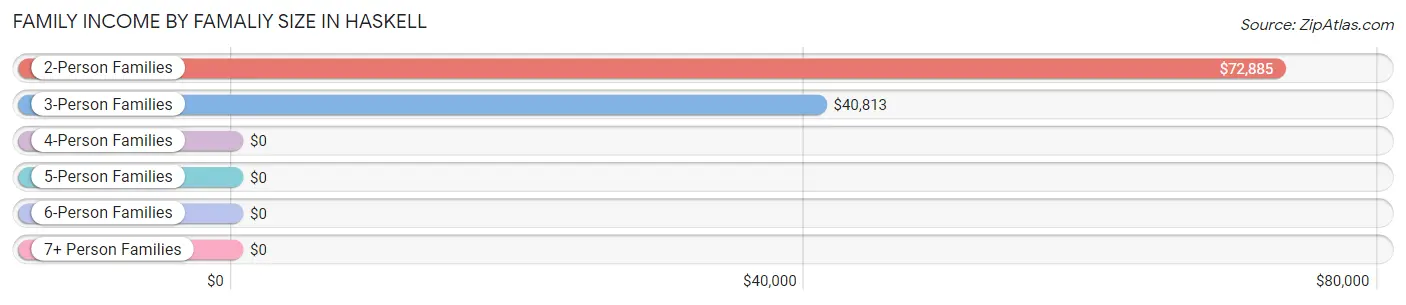
| Income Bracket | # Families | Median Income |
| 2-Person Families | 526 (70.6%) | $72,885 |
| 3-Person Families | 49 (6.6%) | $40,813 |
| 4-Person Families | 79 (10.6%) | $0 |
| 5-Person Families | 49 (6.6%) | $0 |
| 6-Person Families | 16 (2.1%) | $0 |
| 7+ Person Families | 26 (3.5%) | $0 |
| Total | 745 (100.0%) | $67,465 |
Family Income by Number of Earners in Haskell
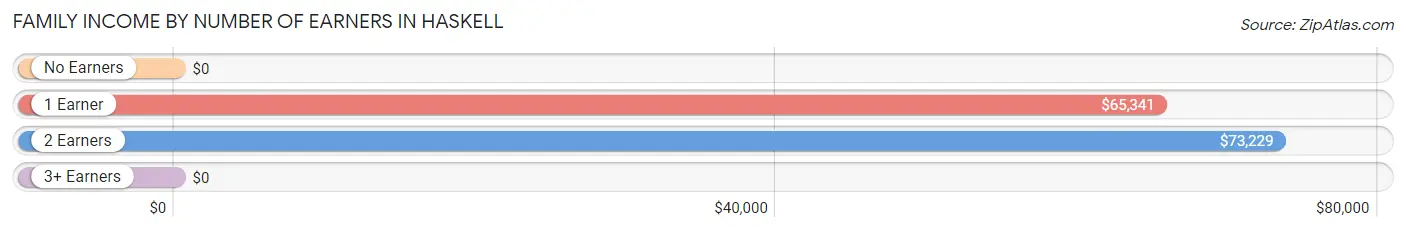
| Number of Earners | # Families | Median Income |
| No Earners | 121 (16.2%) | $0 |
| 1 Earner | 236 (31.7%) | $65,341 |
| 2 Earners | 295 (39.6%) | $73,229 |
| 3+ Earners | 93 (12.5%) | $0 |
| Total | 745 (100.0%) | $67,465 |
Household Income in Haskell
Household Income Brackets in Haskell
With 205 households falling in the category, the $50,000 to $74,999 income range is the most frequent in Haskell, accounting for 19.1% of all households. In contrast, only 39 households (3.6%) fall into the $150,000 to $199,999 income bracket, making it the least populous group.
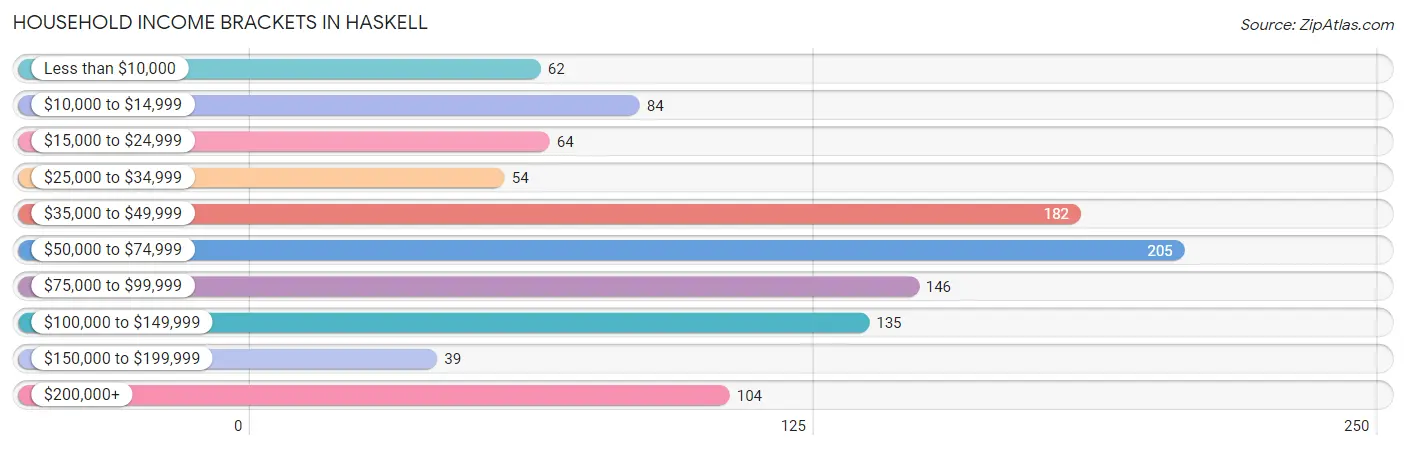
| Income Bracket | # Households | % Households |
| Less than $10,000 | 62 | 5.8% |
| $10,000 to $14,999 | 84 | 7.8% |
| $15,000 to $24,999 | 64 | 6.0% |
| $25,000 to $34,999 | 54 | 5.0% |
| $35,000 to $49,999 | 182 | 16.9% |
| $50,000 to $74,999 | 205 | 19.1% |
| $75,000 to $99,999 | 146 | 13.6% |
| $100,000 to $149,999 | 135 | 12.6% |
| $150,000 to $199,999 | 39 | 3.6% |
| $200,000+ | 104 | 9.7% |
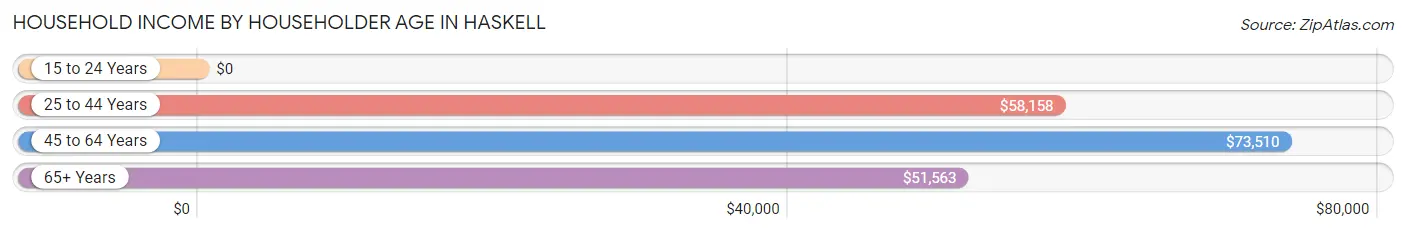
Household Income by Householder Age in Haskell
The median household income in Haskell is $59,333, with the highest median household income of $73,510 found in the 45 to 64 years age bracket for the primary householder. A total of 425 households (39.6%) fall into this category. Meanwhile, the 15 to 24 years age bracket for the primary householder has the lowest median household income of $0, with 11 households (1.0%) in this group.
| Income Bracket | # Households | Median Income |
| 15 to 24 Years | 11 (1.0%) | $0 |
| 25 to 44 Years | 304 (28.3%) | $58,158 |
| 45 to 64 Years | 425 (39.6%) | $73,510 |
| 65+ Years | 334 (31.1%) | $51,563 |
| Total | 1,074 (100.0%) | $59,333 |
Poverty in Haskell
Income Below Poverty by Sex and Age in Haskell
With 11.8% poverty level for males and 15.0% for females among the residents of Haskell, under 5 year old males and 25 to 34 year old females are the most vulnerable to poverty, with 5 males (100.0%) and 64 females (31.7%) in their respective age groups living below the poverty level.
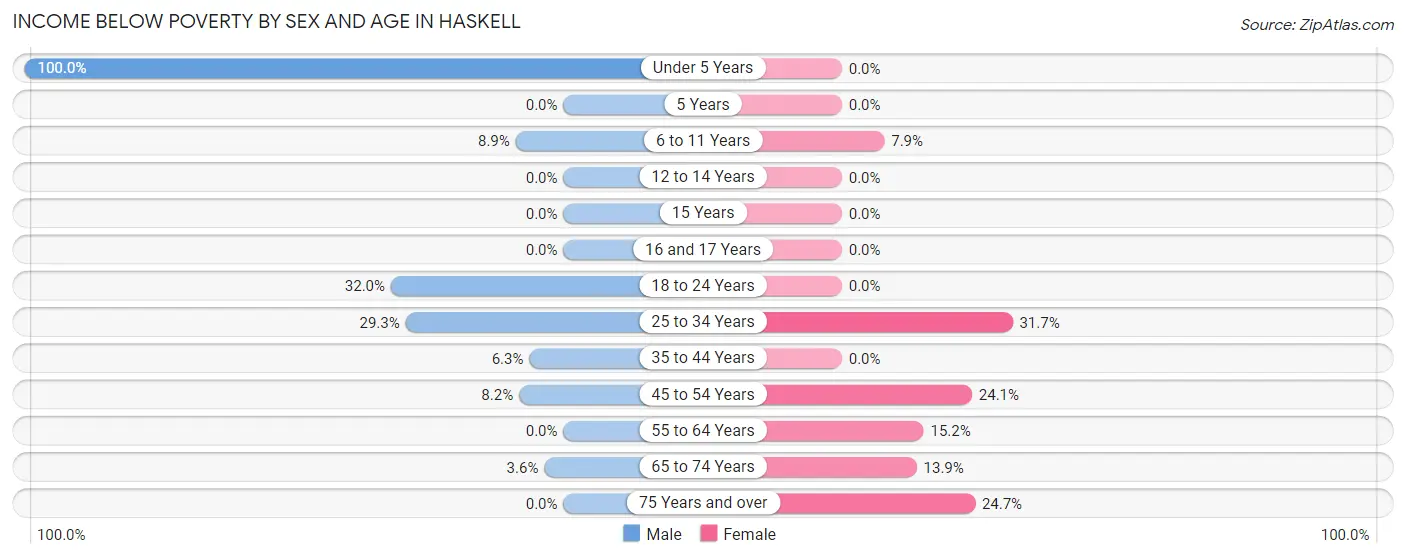
| Age Bracket | Male | Female |
| Under 5 Years | 5 (100.0%) | 0 (0.0%) |
| 5 Years | 0 (0.0%) | 0 (0.0%) |
| 6 to 11 Years | 7 (8.9%) | 6 (7.9%) |
| 12 to 14 Years | 0 (0.0%) | 0 (0.0%) |
| 15 Years | 0 (0.0%) | 0 (0.0%) |
| 16 and 17 Years | 0 (0.0%) | 0 (0.0%) |
| 18 to 24 Years | 81 (32.0%) | 0 (0.0%) |
| 25 to 34 Years | 41 (29.3%) | 64 (31.7%) |
| 35 to 44 Years | 12 (6.3%) | 0 (0.0%) |
| 45 to 54 Years | 13 (8.2%) | 21 (24.1%) |
| 55 to 64 Years | 0 (0.0%) | 39 (15.2%) |
| 65 to 74 Years | 6 (3.5%) | 20 (13.9%) |
| 75 Years and over | 0 (0.0%) | 43 (24.7%) |
| Total | 165 (11.8%) | 193 (15.0%) |
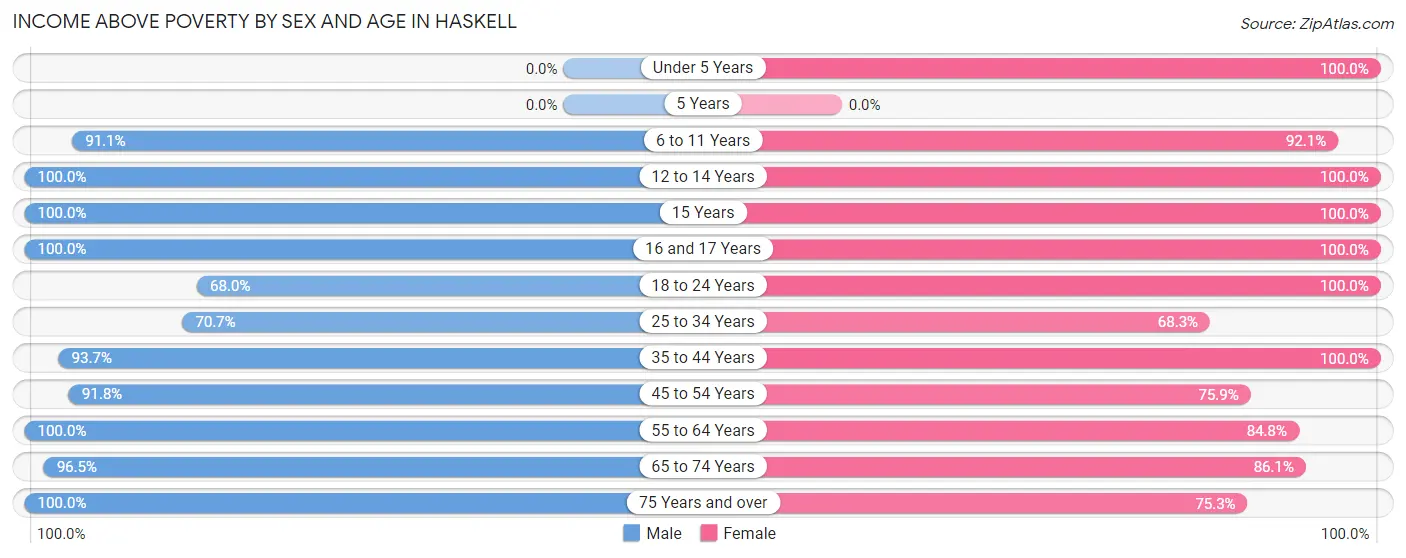
Income Above Poverty by Sex and Age in Haskell
According to the poverty statistics in Haskell, males aged 12 to 14 years and females aged under 5 years are the age groups that are most secure financially, with 100.0% of males and 100.0% of females in these age groups living above the poverty line.
| Age Bracket | Male | Female |
| Under 5 Years | 0 (0.0%) | 63 (100.0%) |
| 5 Years | 0 (0.0%) | 0 (0.0%) |
| 6 to 11 Years | 72 (91.1%) | 70 (92.1%) |
| 12 to 14 Years | 46 (100.0%) | 63 (100.0%) |
| 15 Years | 30 (100.0%) | 23 (100.0%) |
| 16 and 17 Years | 38 (100.0%) | 29 (100.0%) |
| 18 to 24 Years | 172 (68.0%) | 36 (100.0%) |
| 25 to 34 Years | 99 (70.7%) | 138 (68.3%) |
| 35 to 44 Years | 178 (93.7%) | 133 (100.0%) |
| 45 to 54 Years | 145 (91.8%) | 66 (75.9%) |
| 55 to 64 Years | 211 (100.0%) | 218 (84.8%) |
| 65 to 74 Years | 163 (96.5%) | 124 (86.1%) |
| 75 Years and over | 82 (100.0%) | 131 (75.3%) |
| Total | 1,236 (88.2%) | 1,094 (85.0%) |
Income Below Poverty Among Married-Couple Families in Haskell
The poverty statistics for married-couple families in Haskell show that 2.5% or 13 of the total 510 families live below the poverty line. Families with no children have the highest poverty rate of 3.4%, comprising of 13 families. On the other hand, families with 1 or 2 children have the lowest poverty rate of 0.0%, which includes 0 families.
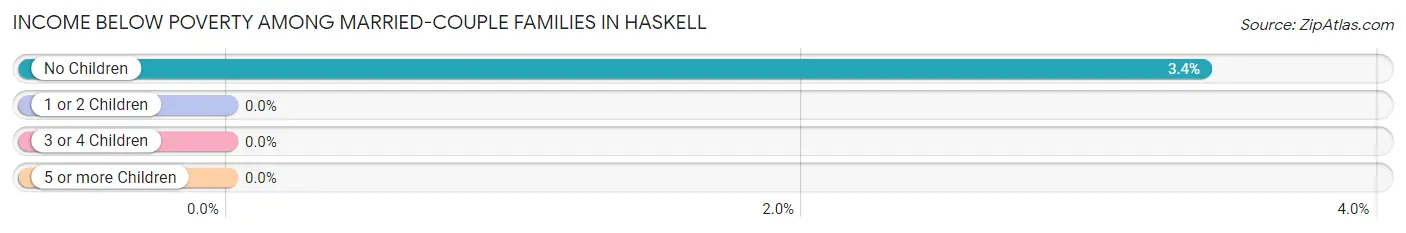
| Children | Above Poverty | Below Poverty |
| No Children | 371 (96.6%) | 13 (3.4%) |
| 1 or 2 Children | 84 (100.0%) | 0 (0.0%) |
| 3 or 4 Children | 42 (100.0%) | 0 (0.0%) |
| 5 or more Children | 0 (0.0%) | 0 (0.0%) |
| Total | 497 (97.5%) | 13 (2.5%) |
Income Below Poverty Among Single-Parent Households in Haskell
According to the poverty data in Haskell, 32.1% or 34 single-father households and 10.1% or 13 single-mother households are living below the poverty line. Among single-father households, those with no children have the highest poverty rate, with 34 households (52.3%) experiencing poverty. Likewise, among single-mother households, those with 1 or 2 children have the highest poverty rate, with 13 households (12.1%) falling below the poverty line.
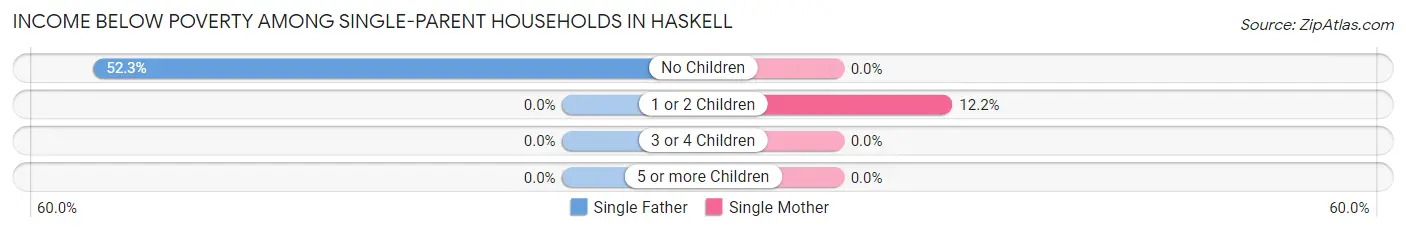
| Children | Single Father | Single Mother |
| No Children | 34 (52.3%) | 0 (0.0%) |
| 1 or 2 Children | 0 (0.0%) | 13 (12.1%) |
| 3 or 4 Children | 0 (0.0%) | 0 (0.0%) |
| 5 or more Children | 0 (0.0%) | 0 (0.0%) |
| Total | 34 (32.1%) | 13 (10.1%) |
Income Below Poverty Among Married-Couple vs Single-Parent Households in Haskell
The poverty data for Haskell shows that 13 of the married-couple family households (2.5%) and 47 of the single-parent households (20.0%) are living below the poverty level. Within the married-couple family households, those with no children have the highest poverty rate, with 13 households (3.4%) falling below the poverty line. Among the single-parent households, those with no children have the highest poverty rate, with 34 household (42.5%) living below poverty.
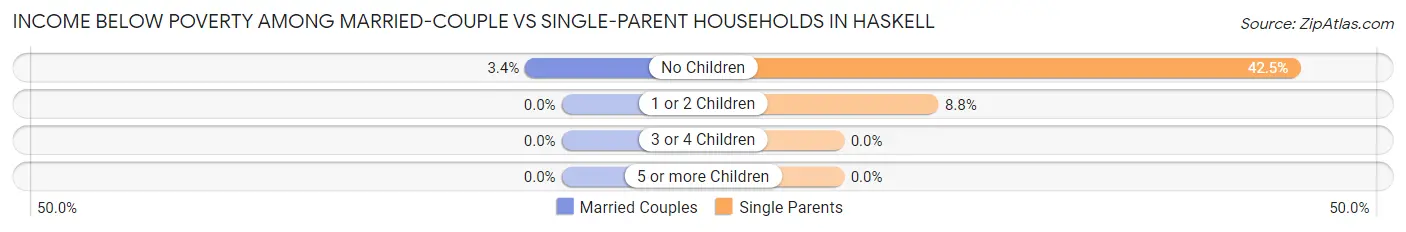
| Children | Married-Couple Families | Single-Parent Households |
| No Children | 13 (3.4%) | 34 (42.5%) |
| 1 or 2 Children | 0 (0.0%) | 13 (8.8%) |
| 3 or 4 Children | 0 (0.0%) | 0 (0.0%) |
| 5 or more Children | 0 (0.0%) | 0 (0.0%) |
| Total | 13 (2.5%) | 47 (20.0%) |
Race in Haskell
The most populous races in Haskell are White / Caucasian (2,345 | 79.3%), Hispanic or Latino (829 | 28.0%), and Some other Race (252 | 8.5%).
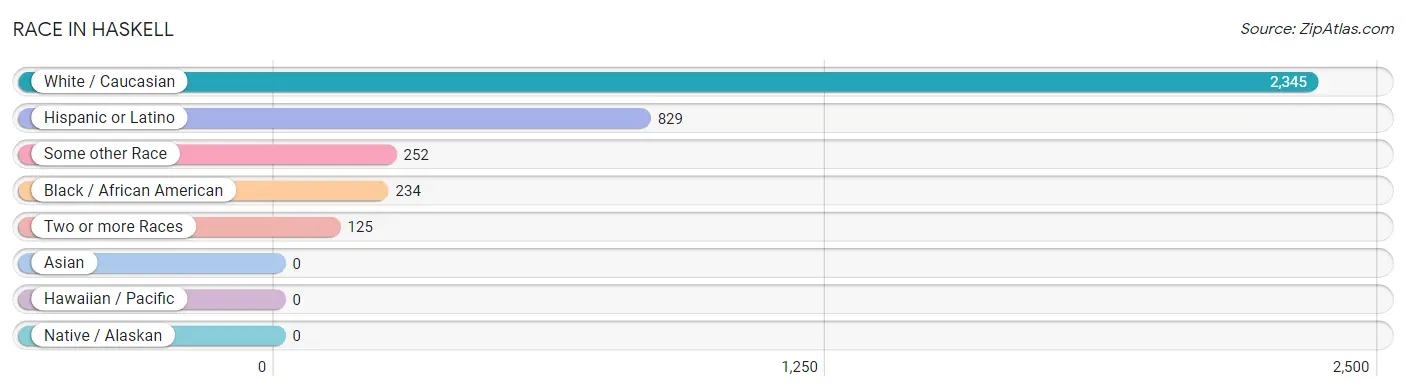
| Race | # Population | % Population |
| Asian | 0 | 0.0% |
| Black / African American | 234 | 7.9% |
| Hawaiian / Pacific | 0 | 0.0% |
| Hispanic or Latino | 829 | 28.0% |
| Native / Alaskan | 0 | 0.0% |
| White / Caucasian | 2,345 | 79.3% |
| Two or more Races | 125 | 4.2% |
| Some other Race | 252 | 8.5% |
| Total | 2,956 | 100.0% |
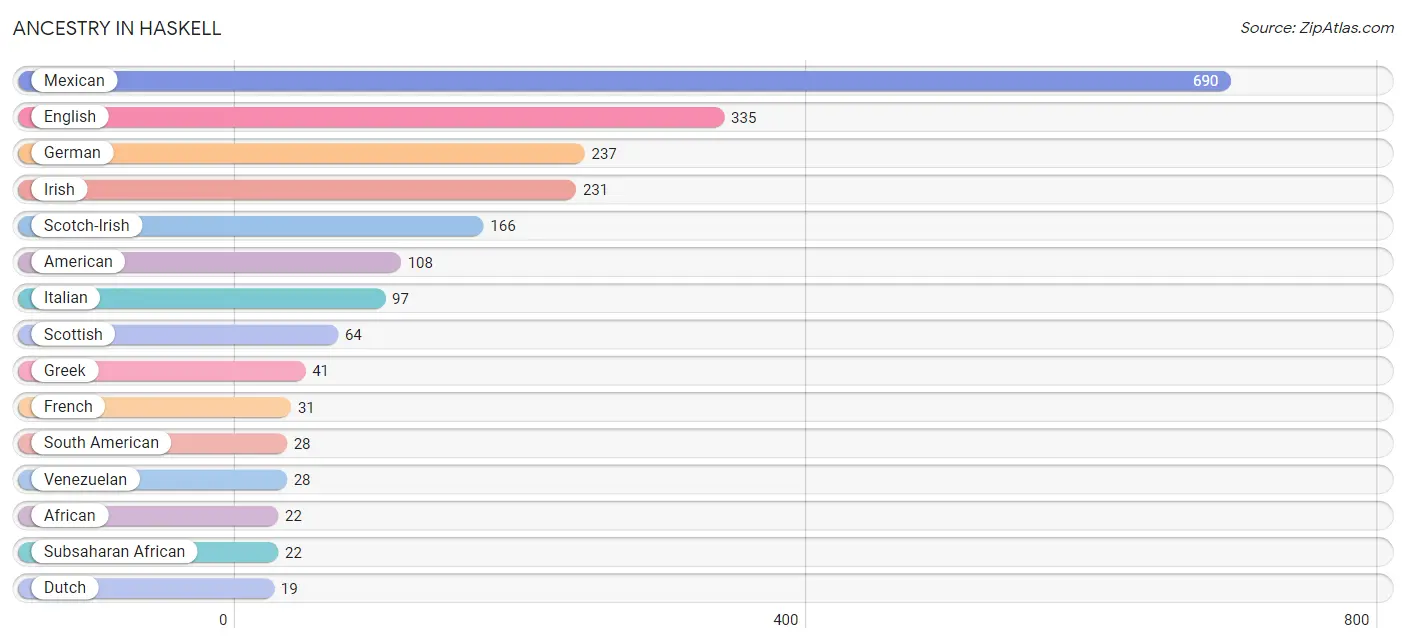
Ancestry in Haskell
The most populous ancestries reported in Haskell are Mexican (690 | 23.3%), English (335 | 11.3%), German (237 | 8.0%), Irish (231 | 7.8%), and Scotch-Irish (166 | 5.6%), together accounting for 56.1% of all Haskell residents.
| Ancestry | # Population | % Population |
| African | 22 | 0.7% |
| American | 108 | 3.6% |
| Arab | 9 | 0.3% |
| Bhutanese | 9 | 0.3% |
| British | 5 | 0.2% |
| Central American | 13 | 0.4% |
| Cherokee | 3 | 0.1% |
| Danish | 3 | 0.1% |
| Dutch | 19 | 0.6% |
| English | 335 | 11.3% |
| French | 31 | 1.1% |
| German | 237 | 8.0% |
| Greek | 41 | 1.4% |
| Honduran | 13 | 0.4% |
| Irish | 231 | 7.8% |
| Italian | 97 | 3.3% |
| Korean | 9 | 0.3% |
| Lebanese | 9 | 0.3% |
| Mexican | 690 | 23.3% |
| Norwegian | 11 | 0.4% |
| Puerto Rican | 18 | 0.6% |
| Scandinavian | 8 | 0.3% |
| Scotch-Irish | 166 | 5.6% |
| Scottish | 64 | 2.2% |
| South American | 28 | 0.9% |
| Spanish | 3 | 0.1% |
| Subsaharan African | 22 | 0.7% |
| Swiss | 3 | 0.1% |
| Ukrainian | 16 | 0.5% |
| Venezuelan | 28 | 0.9% |
| Welsh | 14 | 0.5% | View All 31 Rows |
Immigrants in Haskell
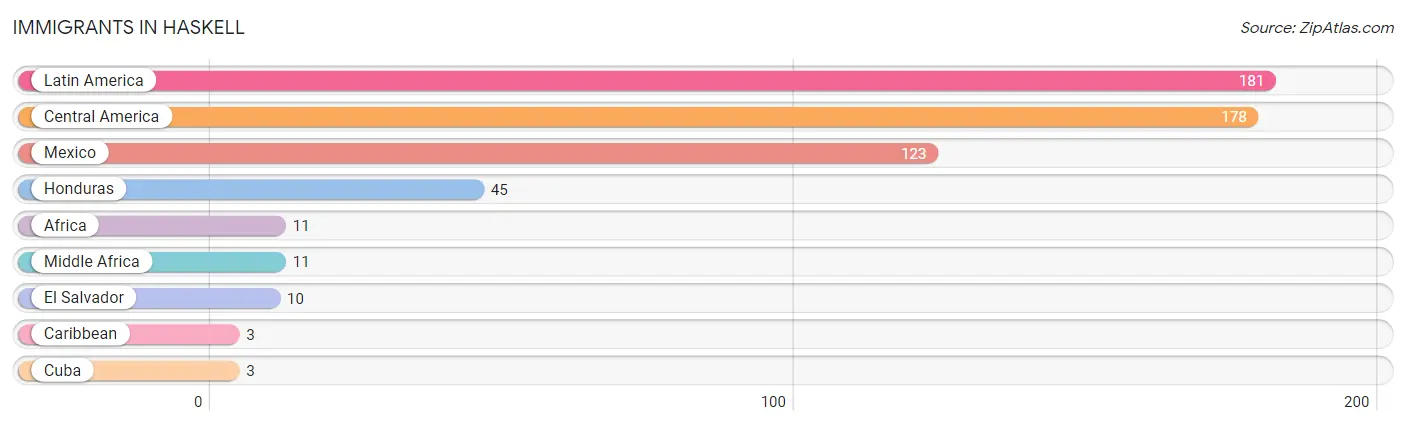
The most numerous immigrant groups reported in Haskell came from Latin America (181 | 6.1%), Central America (178 | 6.0%), Mexico (123 | 4.2%), Honduras (45 | 1.5%), and Africa (11 | 0.4%), together accounting for 18.2% of all Haskell residents.
| Immigration Origin | # Population | % Population |
| Africa | 11 | 0.4% |
| Caribbean | 3 | 0.1% |
| Central America | 178 | 6.0% |
| Cuba | 3 | 0.1% |
| El Salvador | 10 | 0.3% |
| Honduras | 45 | 1.5% |
| Latin America | 181 | 6.1% |
| Mexico | 123 | 4.2% |
| Middle Africa | 11 | 0.4% | View All 9 Rows |
Sex and Age in Haskell
Sex and Age in Haskell
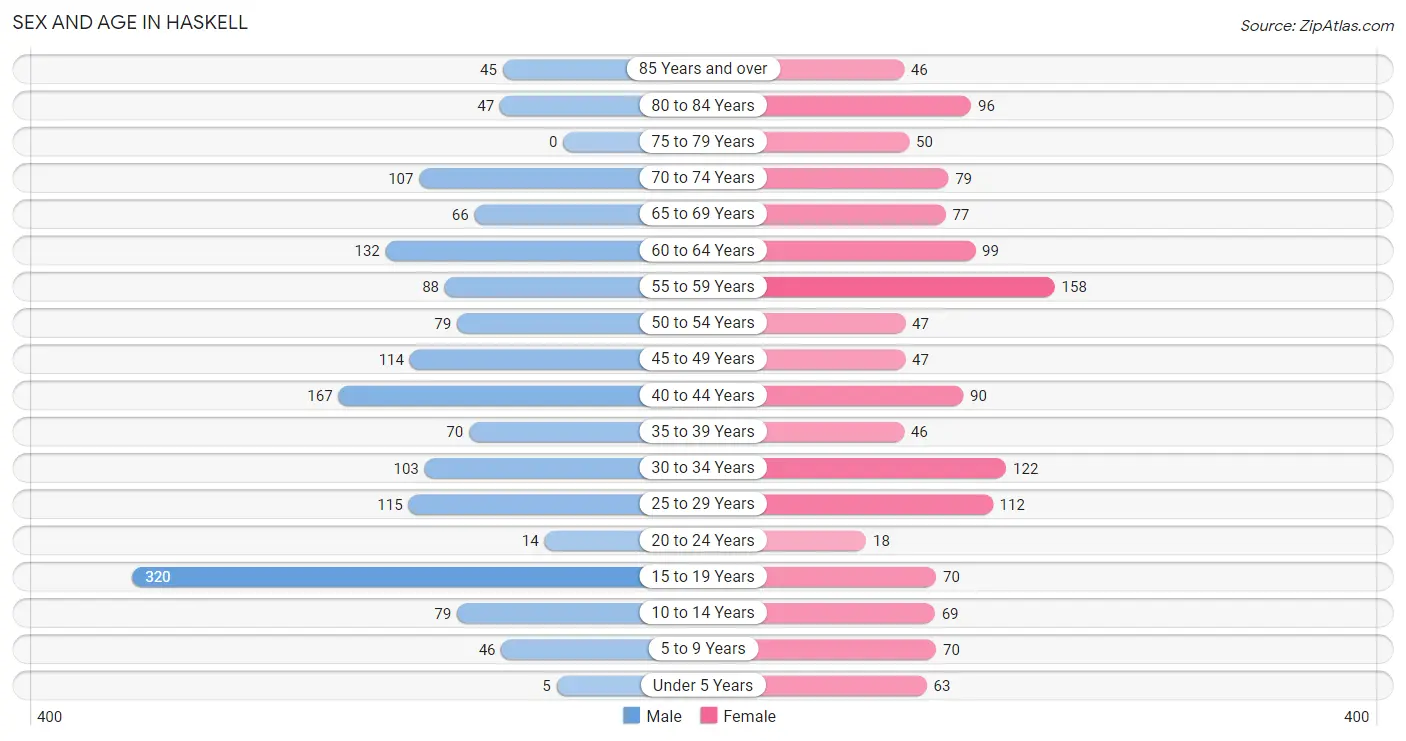
The most populous age groups in Haskell are 15 to 19 Years (320 | 20.0%) for men and 55 to 59 Years (158 | 11.6%) for women.
| Age Bracket | Male | Female |
| Under 5 Years | 5 (0.3%) | 63 (4.6%) |
| 5 to 9 Years | 46 (2.9%) | 70 (5.1%) |
| 10 to 14 Years | 79 (5.0%) | 69 (5.1%) |
| 15 to 19 Years | 320 (20.0%) | 70 (5.1%) |
| 20 to 24 Years | 14 (0.9%) | 18 (1.3%) |
| 25 to 29 Years | 115 (7.2%) | 112 (8.2%) |
| 30 to 34 Years | 103 (6.5%) | 122 (9.0%) |
| 35 to 39 Years | 70 (4.4%) | 46 (3.4%) |
| 40 to 44 Years | 167 (10.5%) | 90 (6.6%) |
| 45 to 49 Years | 114 (7.1%) | 47 (3.5%) |
| 50 to 54 Years | 79 (5.0%) | 47 (3.5%) |
| 55 to 59 Years | 88 (5.5%) | 158 (11.6%) |
| 60 to 64 Years | 132 (8.3%) | 99 (7.3%) |
| 65 to 69 Years | 66 (4.1%) | 77 (5.7%) |
| 70 to 74 Years | 107 (6.7%) | 79 (5.8%) |
| 75 to 79 Years | 0 (0.0%) | 50 (3.7%) |
| 80 to 84 Years | 47 (2.9%) | 96 (7.1%) |
| 85 Years and over | 45 (2.8%) | 46 (3.4%) |
| Total | 1,597 (100.0%) | 1,359 (100.0%) |
Families and Households in Haskell
Median Family Size in Haskell
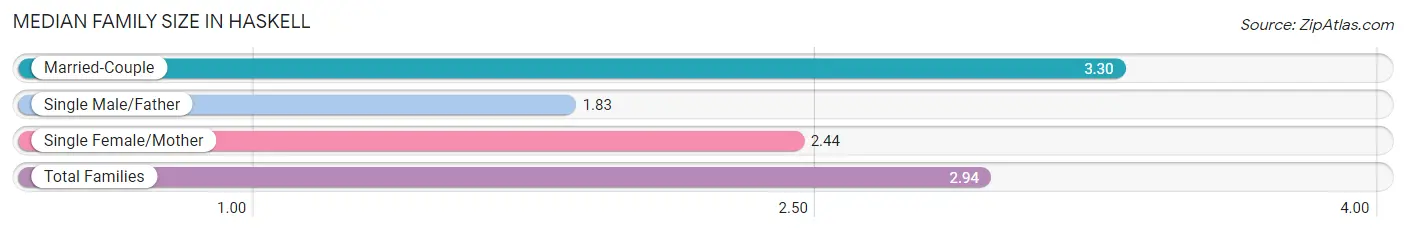
The median family size in Haskell is 2.94 persons per family, with married-couple families (510 | 68.5%) accounting for the largest median family size of 3.3 persons per family. On the other hand, single male/father families (106 | 14.2%) represent the smallest median family size with 1.83 persons per family.
| Family Type | # Families | Family Size |
| Married-Couple | 510 (68.5%) | 3.30 |
| Single Male/Father | 106 (14.2%) | 1.83 |
| Single Female/Mother | 129 (17.3%) | 2.44 |
| Total Families | 745 (100.0%) | 2.94 |
Median Household Size in Haskell
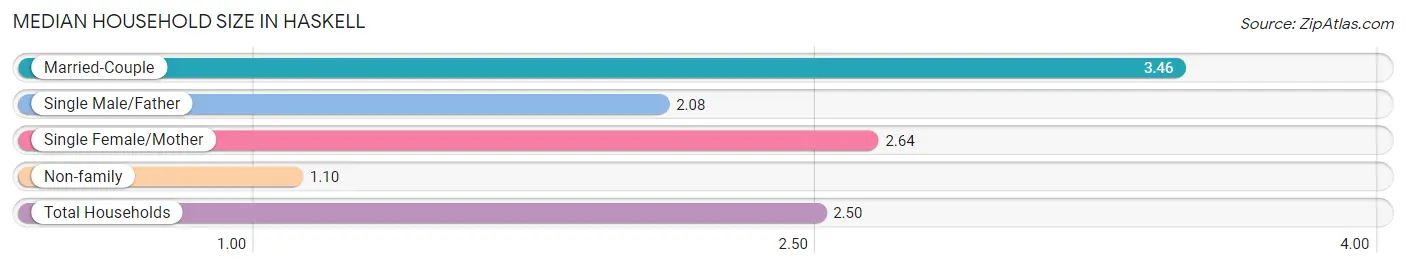
The median household size in Haskell is 2.50 persons per household, with married-couple households (510 | 47.5%) accounting for the largest median household size of 3.46 persons per household. non-family households (329 | 30.6%) represent the smallest median household size with 1.10 persons per household.
| Household Type | # Households | Household Size |
| Married-Couple | 510 (47.5%) | 3.46 |
| Single Male/Father | 106 (9.9%) | 2.08 |
| Single Female/Mother | 129 (12.0%) | 2.64 |
| Non-family | 329 (30.6%) | 1.10 |
| Total Households | 1,074 (100.0%) | 2.50 |
Household Size by Marriage Status in Haskell
Out of a total of 1,074 households in Haskell, 745 (69.4%) are family households, while 329 (30.6%) are nonfamily households. The most numerous type of family households are 2-person households, comprising 479, and the most common type of nonfamily households are 1-person households, comprising 296.
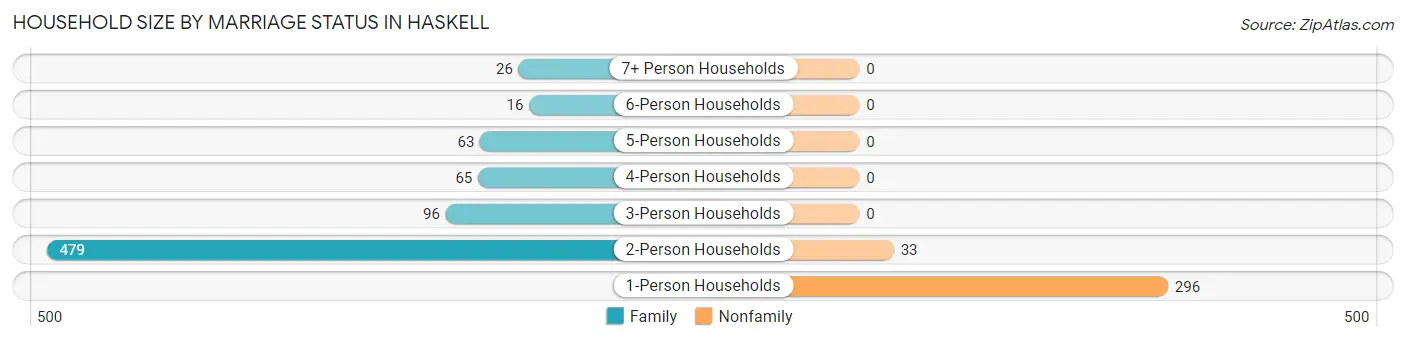
| Household Size | Family Households | Nonfamily Households |
| 1-Person Households | - | 296 (27.6%) |
| 2-Person Households | 479 (44.6%) | 33 (3.1%) |
| 3-Person Households | 96 (8.9%) | 0 (0.0%) |
| 4-Person Households | 65 (6.0%) | 0 (0.0%) |
| 5-Person Households | 63 (5.9%) | 0 (0.0%) |
| 6-Person Households | 16 (1.5%) | 0 (0.0%) |
| 7+ Person Households | 26 (2.4%) | 0 (0.0%) |
| Total | 745 (69.4%) | 329 (30.6%) |
Female Fertility in Haskell
Fertility by Age in Haskell
| Age Bracket | Women with Births | Births / 1,000 Women |
| 15 to 19 years | 0 (0.0%) | 0.0 |
| 20 to 34 years | 0 (0.0%) | 0.0 |
| 35 to 50 years | 0 (0.0%) | 0.0 |
| Total | 0 (0.0%) | 0.0 |
Fertility by Age by Marriage Status in Haskell
| Age Bracket | Married | Unmarried |
| 15 to 19 years | 0 (0.0%) | 0 (0.0%) |
| 20 to 34 years | 0 (0.0%) | 0 (0.0%) |
| 35 to 50 years | 0 (0.0%) | 0 (0.0%) |
| Total | 0 (0.0%) | 0 (0.0%) |
Fertility by Education in Haskell
| Educational Attainment | Women with Births | Births / 1,000 Women |
| Less than High School | 0 (0.0%) | 0.0 |
| High School Diploma | 0 (0.0%) | 0.0 |
| College or Associate's Degree | 0 (0.0%) | 0.0 |
| Bachelor's Degree | 0 (0.0%) | 0.0 |
| Graduate Degree | 0 (0.0%) | 0.0 |
| Total | 0 (0.0%) | 0.0 |
Fertility by Education by Marriage Status in Haskell
| Educational Attainment | Married | Unmarried |
| Less than High School | 0 (0.0%) | 0 (0.0%) |
| High School Diploma | 0 (0.0%) | 0 (0.0%) |
| College or Associate's Degree | 0 (0.0%) | 0 (0.0%) |
| Bachelor's Degree | 0 (0.0%) | 0 (0.0%) |
| Graduate Degree | 0 (0.0%) | 0 (0.0%) |
| Total | 0 (0.0%) | 0 (0.0%) |
Employment Characteristics in Haskell
Employment by Class of Employer in Haskell
Among the 1,243 employed individuals in Haskell, private company employees (683 | 54.9%), state government employees (223 | 17.9%), and not-for-profit organizations (155 | 12.5%) make up the most common classes of employment.
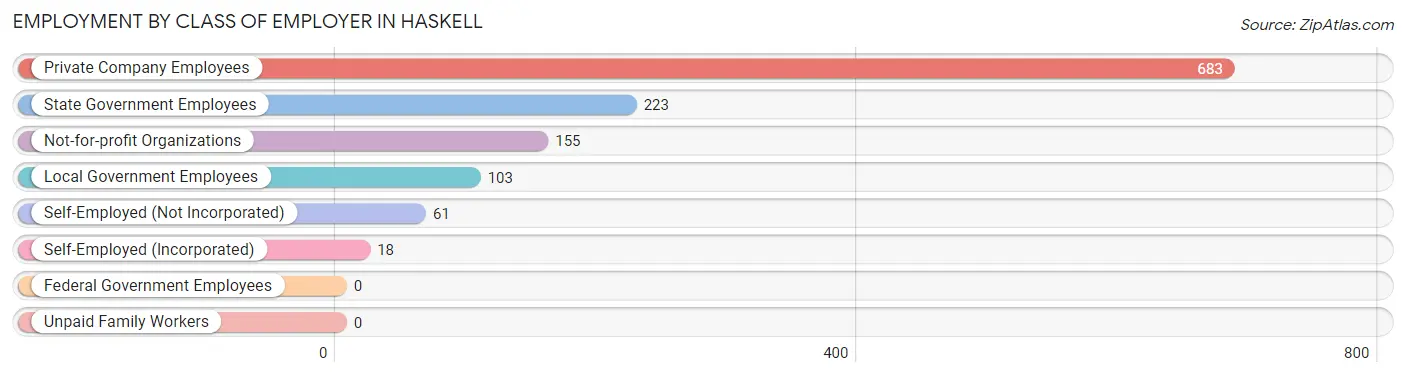
| Employer Class | # Employees | % Employees |
| Private Company Employees | 683 | 54.9% |
| Self-Employed (Incorporated) | 18 | 1.5% |
| Self-Employed (Not Incorporated) | 61 | 4.9% |
| Not-for-profit Organizations | 155 | 12.5% |
| Local Government Employees | 103 | 8.3% |
| State Government Employees | 223 | 17.9% |
| Federal Government Employees | 0 | 0.0% |
| Unpaid Family Workers | 0 | 0.0% |
| Total | 1,243 | 100.0% |
Employment Status by Age in Haskell
According to the labor force statistics for Haskell, out of the total population over 16 years of age (2,571), 52.6% or 1,352 individuals are in the labor force, with 8.1% or 110 of them unemployed. The age group with the highest labor force participation rate is 20 to 24 years, with 90.6% or 29 individuals in the labor force. Within the labor force, the 20 to 24 years age range has the highest percentage of unemployed individuals, with 62.1% or 18 of them being unemployed.
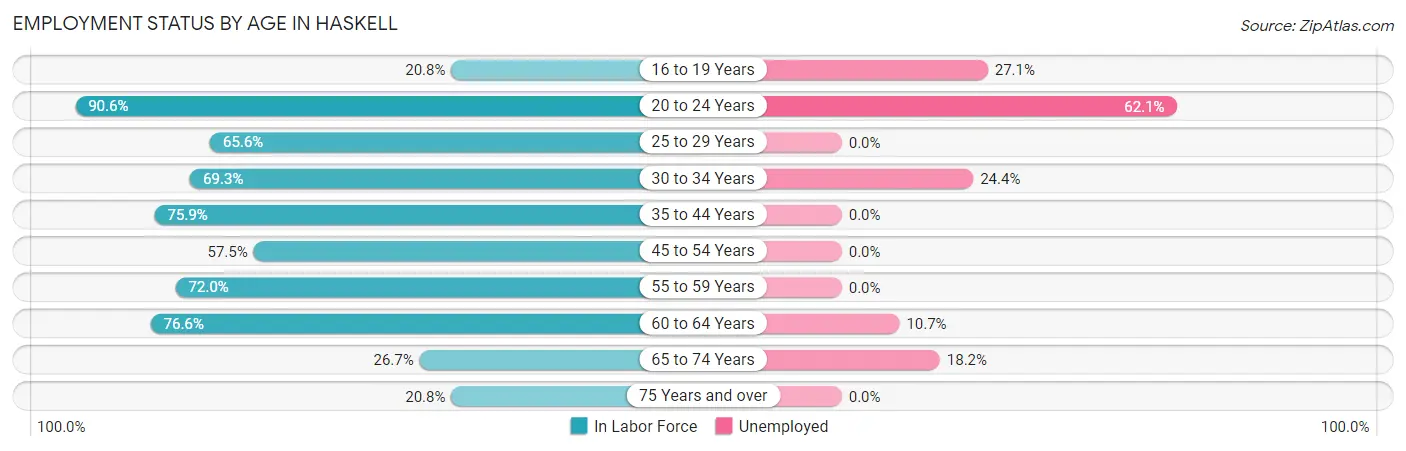
| Age Bracket | In Labor Force | Unemployed |
| 16 to 19 Years | 70 (20.8%) | 19 (27.1%) |
| 20 to 24 Years | 29 (90.6%) | 18 (62.1%) |
| 25 to 29 Years | 149 (65.6%) | 0 (0.0%) |
| 30 to 34 Years | 156 (69.3%) | 38 (24.4%) |
| 35 to 44 Years | 283 (75.9%) | 0 (0.0%) |
| 45 to 54 Years | 165 (57.5%) | 0 (0.0%) |
| 55 to 59 Years | 177 (72.0%) | 0 (0.0%) |
| 60 to 64 Years | 177 (76.6%) | 19 (10.7%) |
| 65 to 74 Years | 88 (26.7%) | 16 (18.2%) |
| 75 Years and over | 59 (20.8%) | 0 (0.0%) |
| Total | 1,352 (52.6%) | 110 (8.1%) |
Employment Status by Educational Attainment in Haskell
According to labor force statistics for Haskell, 69.7% of individuals (1,108) out of the total population between 25 and 64 years of age (1,589) are in the labor force, with 5.1% or 57 of them being unemployed. The group with the highest labor force participation rate are those with the educational attainment of bachelor's degree or higher, with 93.3% or 336 individuals in the labor force. Within the labor force, individuals with college / associate degree education have the highest percentage of unemployment, with 39.6% or 57 of them being unemployed.
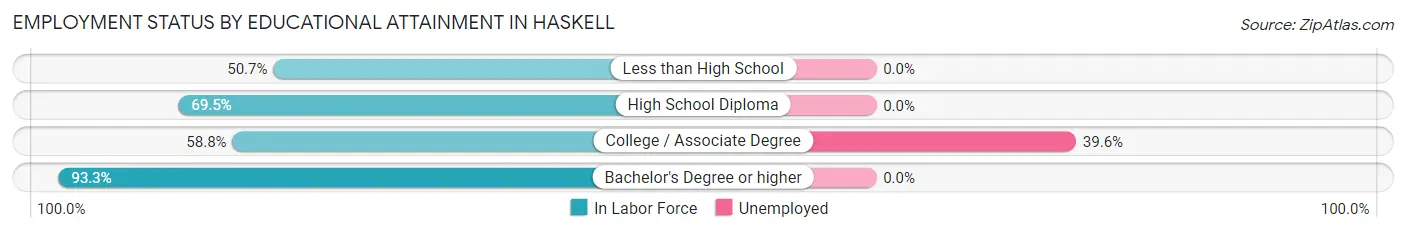
| Educational Attainment | In Labor Force | Unemployed |
| Less than High School | 153 (50.7%) | 0 (0.0%) |
| High School Diploma | 474 (69.5%) | 0 (0.0%) |
| College / Associate Degree | 144 (58.8%) | 97 (39.6%) |
| Bachelor's Degree or higher | 336 (93.3%) | 0 (0.0%) |
| Total | 1,108 (69.7%) | 81 (5.1%) |
Employment Occupations by Sex in Haskell
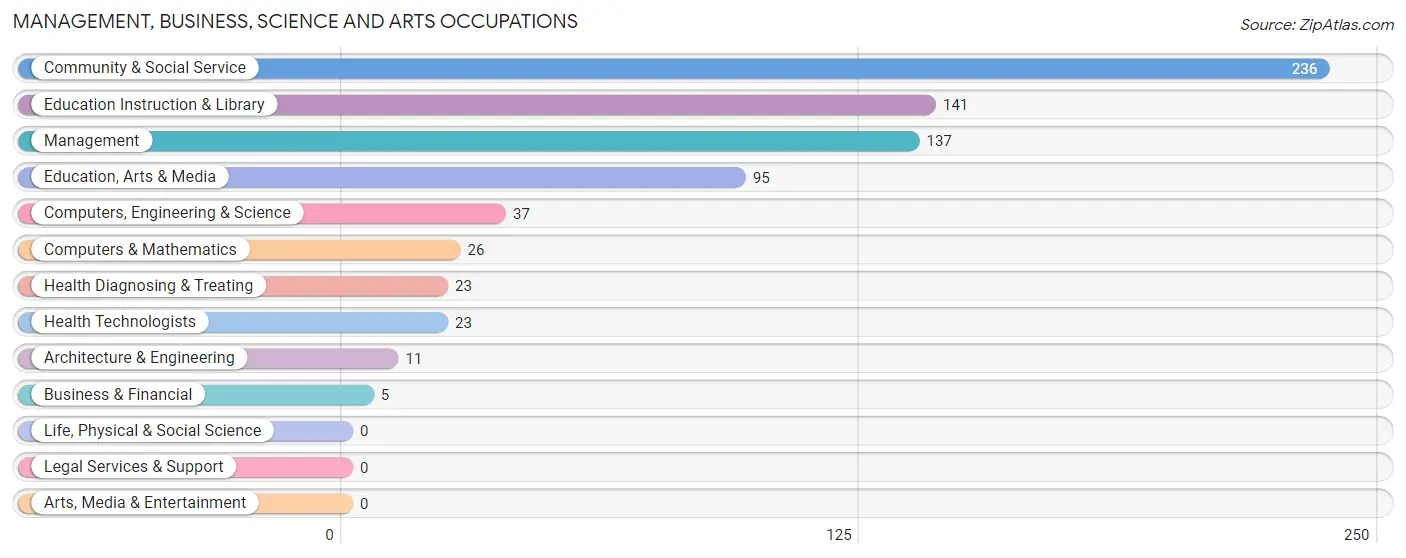
Management, Business, Science and Arts Occupations
The most common Management, Business, Science and Arts occupations in Haskell are Community & Social Service (236 | 19.0%), Education Instruction & Library (141 | 11.3%), Management (137 | 11.0%), Education, Arts & Media (95 | 7.6%), and Computers, Engineering & Science (37 | 3.0%).
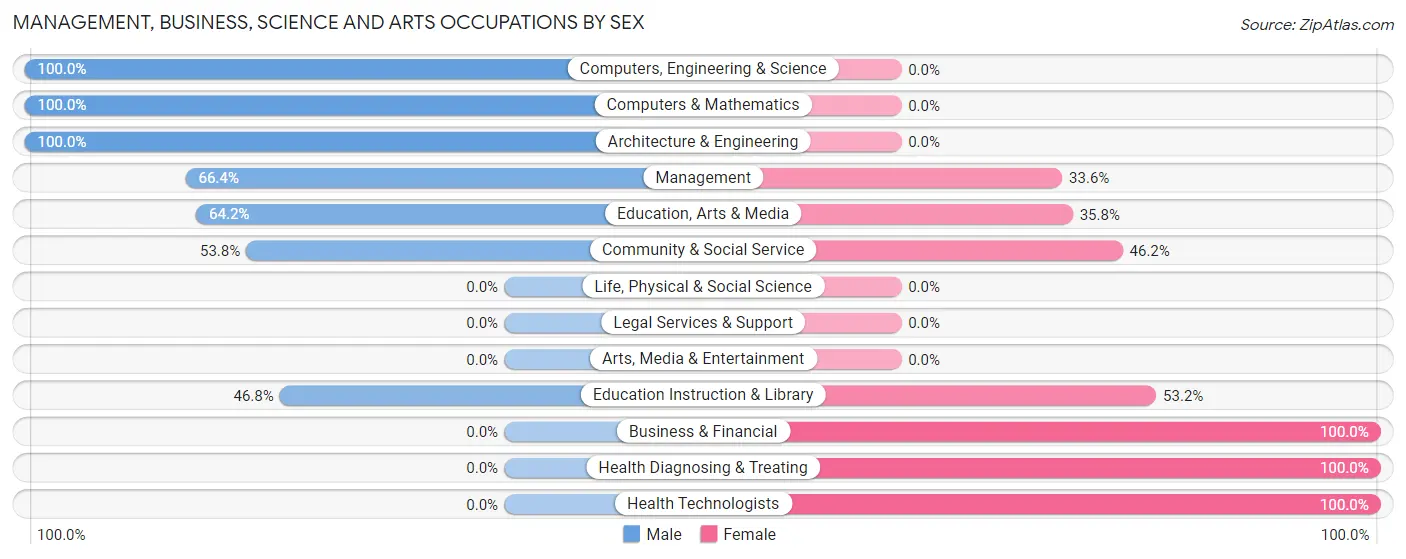
Management, Business, Science and Arts Occupations by Sex
Within the Management, Business, Science and Arts occupations in Haskell, the most male-oriented occupations are Computers, Engineering & Science (100.0%), Computers & Mathematics (100.0%), and Architecture & Engineering (100.0%), while the most female-oriented occupations are Business & Financial (100.0%), Health Diagnosing & Treating (100.0%), and Health Technologists (100.0%).
| Occupation | Male | Female |
| Management | 91 (66.4%) | 46 (33.6%) |
| Business & Financial | 0 (0.0%) | 5 (100.0%) |
| Computers, Engineering & Science | 37 (100.0%) | 0 (0.0%) |
| Computers & Mathematics | 26 (100.0%) | 0 (0.0%) |
| Architecture & Engineering | 11 (100.0%) | 0 (0.0%) |
| Life, Physical & Social Science | 0 (0.0%) | 0 (0.0%) |
| Community & Social Service | 127 (53.8%) | 109 (46.2%) |
| Education, Arts & Media | 61 (64.2%) | 34 (35.8%) |
| Legal Services & Support | 0 (0.0%) | 0 (0.0%) |
| Education Instruction & Library | 66 (46.8%) | 75 (53.2%) |
| Arts, Media & Entertainment | 0 (0.0%) | 0 (0.0%) |
| Health Diagnosing & Treating | 0 (0.0%) | 23 (100.0%) |
| Health Technologists | 0 (0.0%) | 23 (100.0%) |
| Total (Category) | 255 (58.2%) | 183 (41.8%) |
| Total (Overall) | 699 (56.2%) | 544 (43.8%) |
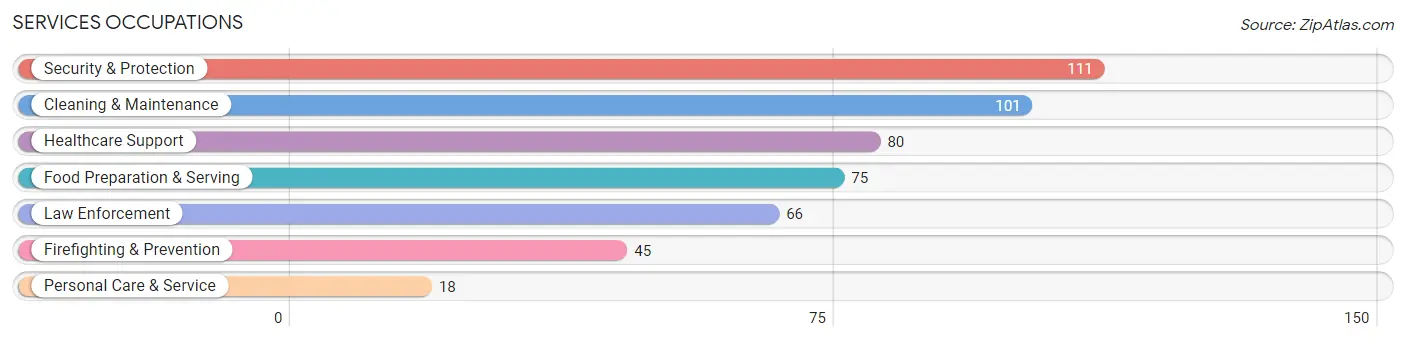
Services Occupations
The most common Services occupations in Haskell are Security & Protection (111 | 8.9%), Cleaning & Maintenance (101 | 8.1%), Healthcare Support (80 | 6.4%), Food Preparation & Serving (75 | 6.0%), and Law Enforcement (66 | 5.3%).
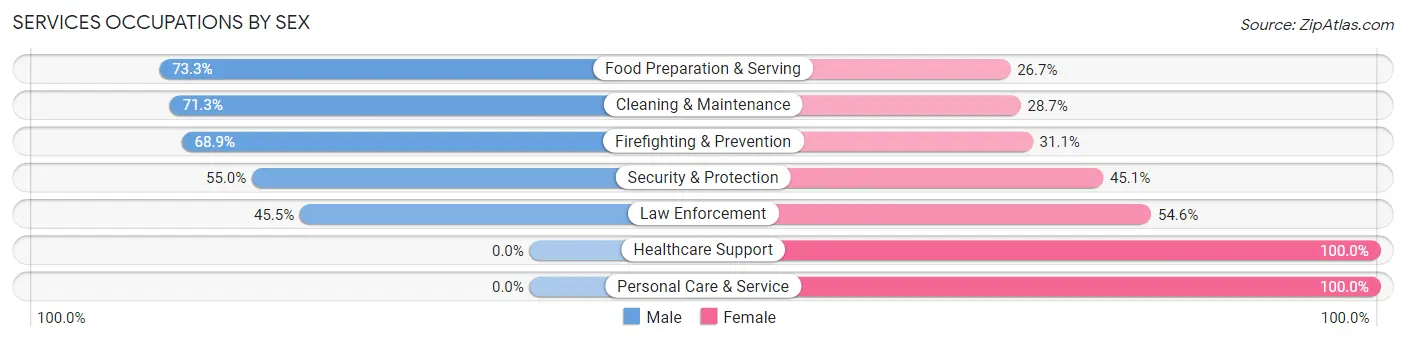
Services Occupations by Sex
Within the Services occupations in Haskell, the most male-oriented occupations are Food Preparation & Serving (73.3%), Cleaning & Maintenance (71.3%), and Firefighting & Prevention (68.9%), while the most female-oriented occupations are Healthcare Support (100.0%), Personal Care & Service (100.0%), and Law Enforcement (54.5%).
| Occupation | Male | Female |
| Healthcare Support | 0 (0.0%) | 80 (100.0%) |
| Security & Protection | 61 (54.9%) | 50 (45.1%) |
| Firefighting & Prevention | 31 (68.9%) | 14 (31.1%) |
| Law Enforcement | 30 (45.5%) | 36 (54.5%) |
| Food Preparation & Serving | 55 (73.3%) | 20 (26.7%) |
| Cleaning & Maintenance | 72 (71.3%) | 29 (28.7%) |
| Personal Care & Service | 0 (0.0%) | 18 (100.0%) |
| Total (Category) | 188 (48.8%) | 197 (51.2%) |
| Total (Overall) | 699 (56.2%) | 544 (43.8%) |
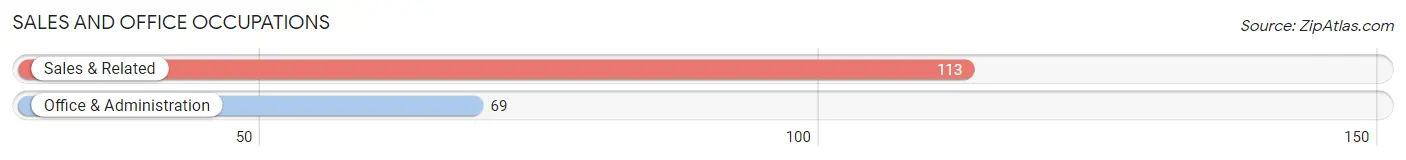
Sales and Office Occupations
The most common Sales and Office occupations in Haskell are Sales & Related (113 | 9.1%), and Office & Administration (69 | 5.6%).
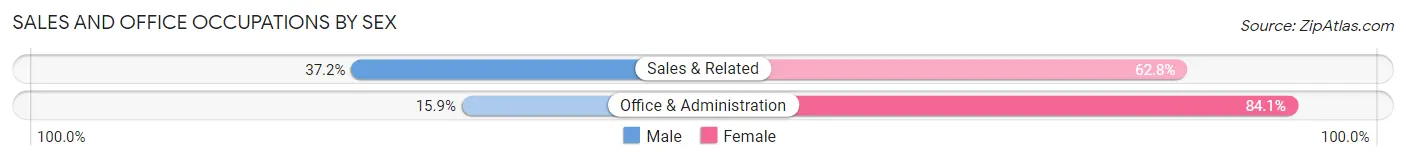
Sales and Office Occupations by Sex
| Occupation | Male | Female |
| Sales & Related | 42 (37.2%) | 71 (62.8%) |
| Office & Administration | 11 (15.9%) | 58 (84.1%) |
| Total (Category) | 53 (29.1%) | 129 (70.9%) |
| Total (Overall) | 699 (56.2%) | 544 (43.8%) |
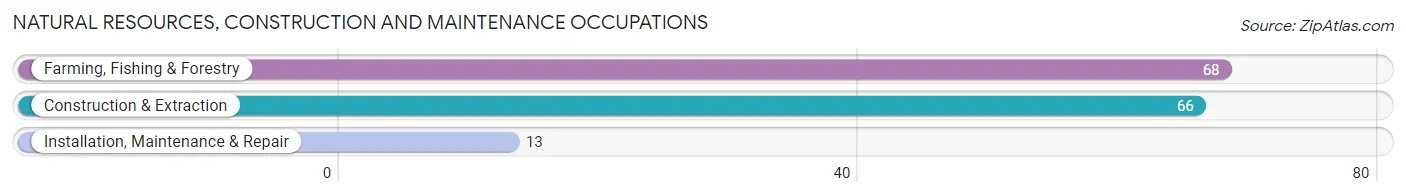
Natural Resources, Construction and Maintenance Occupations
The most common Natural Resources, Construction and Maintenance occupations in Haskell are Farming, Fishing & Forestry (68 | 5.5%), Construction & Extraction (66 | 5.3%), and Installation, Maintenance & Repair (13 | 1.1%).
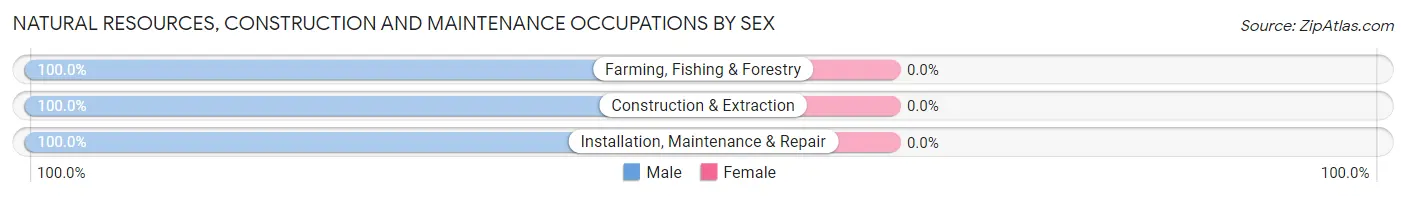
Natural Resources, Construction and Maintenance Occupations by Sex
| Occupation | Male | Female |
| Farming, Fishing & Forestry | 68 (100.0%) | 0 (0.0%) |
| Construction & Extraction | 66 (100.0%) | 0 (0.0%) |
| Installation, Maintenance & Repair | 13 (100.0%) | 0 (0.0%) |
| Total (Category) | 147 (100.0%) | 0 (0.0%) |
| Total (Overall) | 699 (56.2%) | 544 (43.8%) |
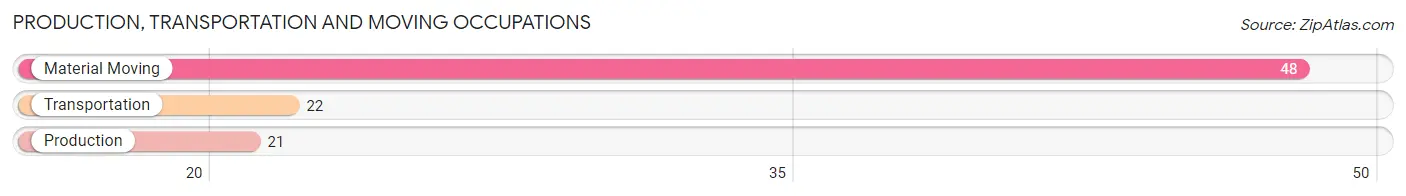
Production, Transportation and Moving Occupations
The most common Production, Transportation and Moving occupations in Haskell are Material Moving (48 | 3.9%), Transportation (22 | 1.8%), and Production (21 | 1.7%).
Production, Transportation and Moving Occupations by Sex
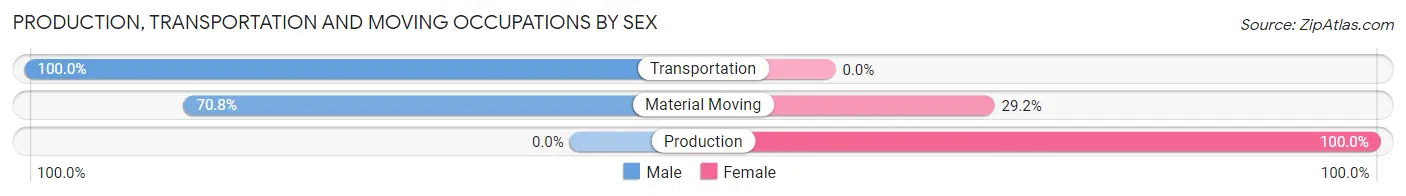
| Occupation | Male | Female |
| Production | 0 (0.0%) | 21 (100.0%) |
| Transportation | 22 (100.0%) | 0 (0.0%) |
| Material Moving | 34 (70.8%) | 14 (29.2%) |
| Total (Category) | 56 (61.5%) | 35 (38.5%) |
| Total (Overall) | 699 (56.2%) | 544 (43.8%) |
Employment Industries by Sex in Haskell
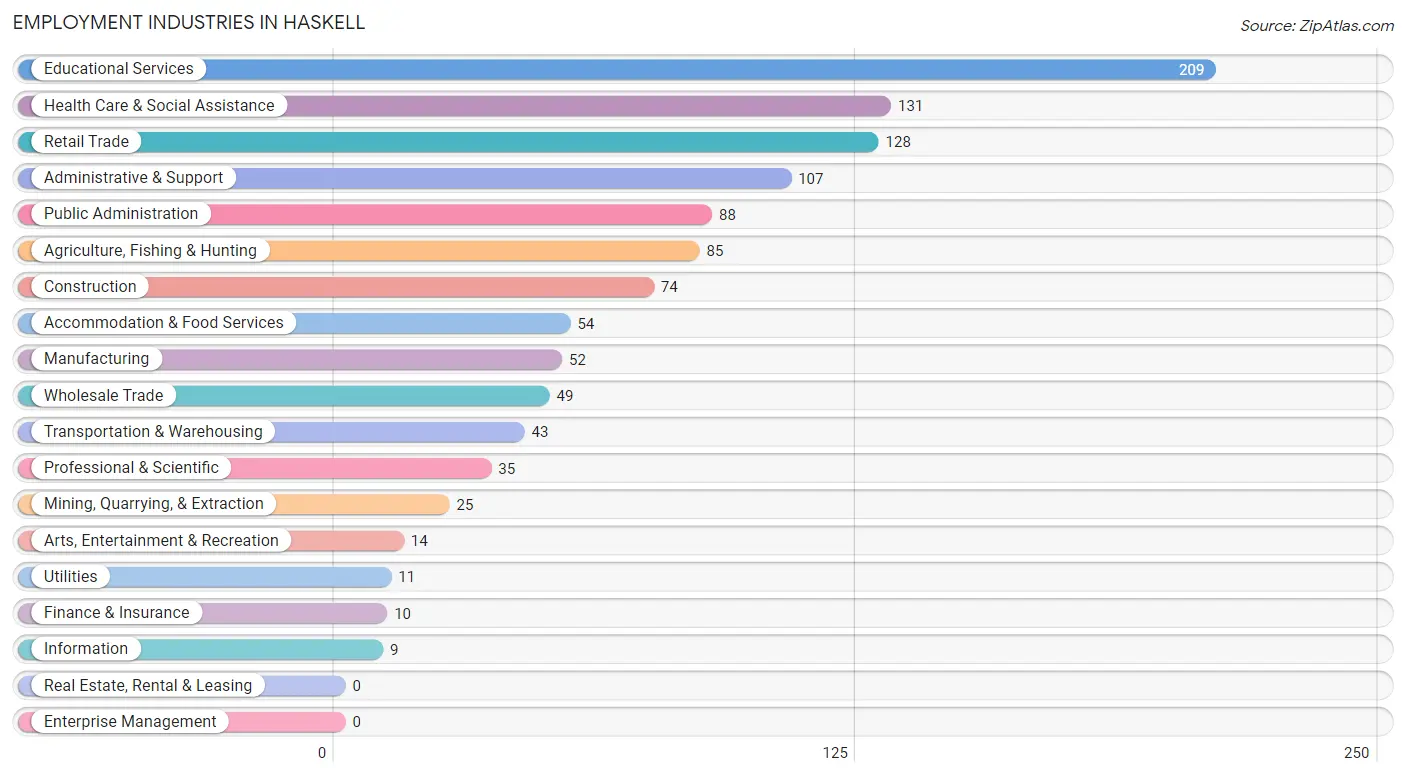
Employment Industries in Haskell
The major employment industries in Haskell include Educational Services (209 | 16.8%), Health Care & Social Assistance (131 | 10.5%), Retail Trade (128 | 10.3%), Administrative & Support (107 | 8.6%), and Public Administration (88 | 7.1%).
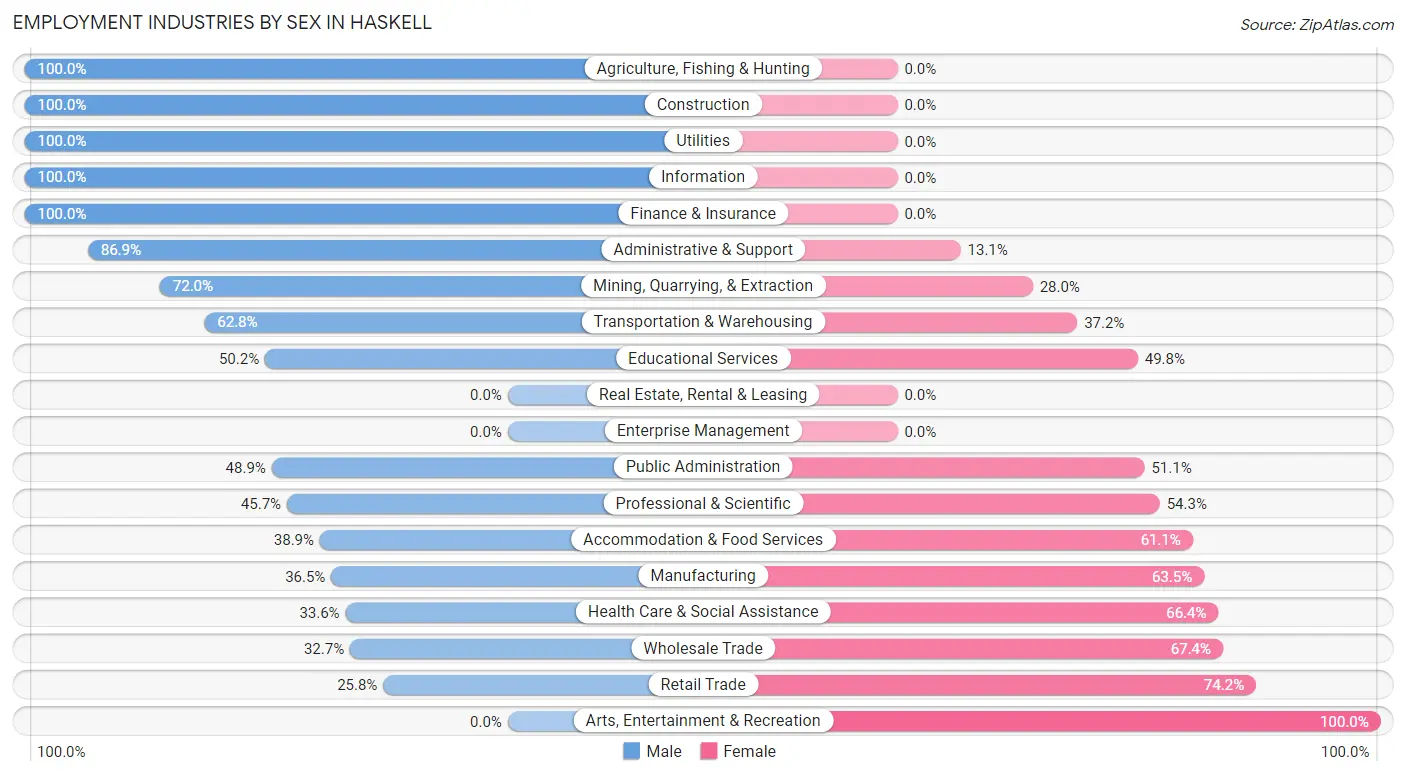
Employment Industries by Sex in Haskell
The Haskell industries that see more men than women are Agriculture, Fishing & Hunting (100.0%), Construction (100.0%), and Utilities (100.0%), whereas the industries that tend to have a higher number of women are Arts, Entertainment & Recreation (100.0%), Retail Trade (74.2%), and Wholesale Trade (67.3%).
| Industry | Male | Female |
| Agriculture, Fishing & Hunting | 85 (100.0%) | 0 (0.0%) |
| Mining, Quarrying, & Extraction | 18 (72.0%) | 7 (28.0%) |
| Construction | 74 (100.0%) | 0 (0.0%) |
| Manufacturing | 19 (36.5%) | 33 (63.5%) |
| Wholesale Trade | 16 (32.7%) | 33 (67.3%) |
| Retail Trade | 33 (25.8%) | 95 (74.2%) |
| Transportation & Warehousing | 27 (62.8%) | 16 (37.2%) |
| Utilities | 11 (100.0%) | 0 (0.0%) |
| Information | 9 (100.0%) | 0 (0.0%) |
| Finance & Insurance | 10 (100.0%) | 0 (0.0%) |
| Real Estate, Rental & Leasing | 0 (0.0%) | 0 (0.0%) |
| Professional & Scientific | 16 (45.7%) | 19 (54.3%) |
| Enterprise Management | 0 (0.0%) | 0 (0.0%) |
| Administrative & Support | 93 (86.9%) | 14 (13.1%) |
| Educational Services | 105 (50.2%) | 104 (49.8%) |
| Health Care & Social Assistance | 44 (33.6%) | 87 (66.4%) |
| Arts, Entertainment & Recreation | 0 (0.0%) | 14 (100.0%) |
| Accommodation & Food Services | 21 (38.9%) | 33 (61.1%) |
| Public Administration | 43 (48.9%) | 45 (51.1%) |
| Total | 699 (56.2%) | 544 (43.8%) |
Education in Haskell
School Enrollment in Haskell
The most common levels of schooling among the 640 students in Haskell are high school (301 | 47.0%), middle school (137 | 21.4%), and elementary school (112 | 17.5%).
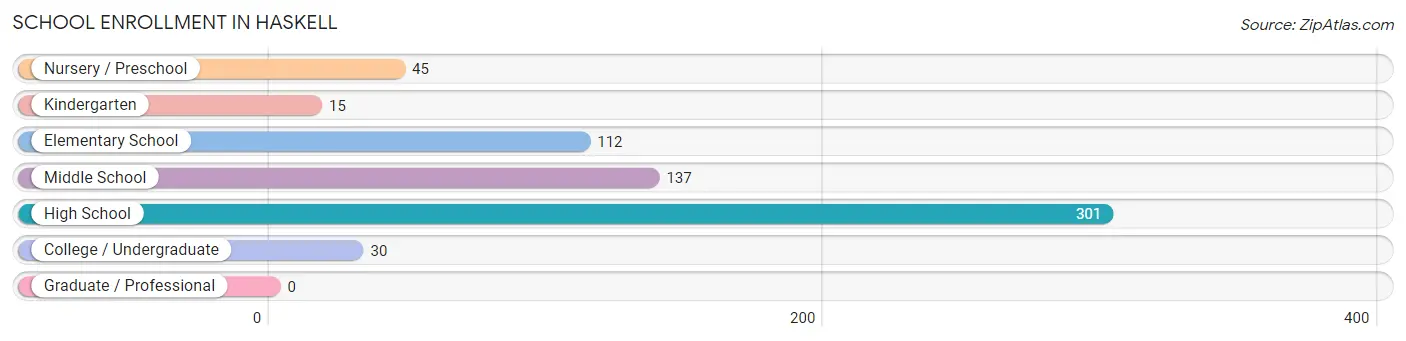
| School Level | # Students | % Students |
| Nursery / Preschool | 45 | 7.0% |
| Kindergarten | 15 | 2.3% |
| Elementary School | 112 | 17.5% |
| Middle School | 137 | 21.4% |
| High School | 301 | 47.0% |
| College / Undergraduate | 30 | 4.7% |
| Graduate / Professional | 0 | 0.0% |
| Total | 640 | 100.0% |
School Enrollment by Age by Funding Source in Haskell
Out of a total of 640 students who are enrolled in schools in Haskell, 48 (7.5%) attend a private institution, while the remaining 592 (92.5%) are enrolled in public schools. The age group of 3 to 4 year olds has the highest likelihood of being enrolled in private schools, with 40 (88.9% in the age bracket) enrolled. Conversely, the age group of 5 to 9 year old has the lowest likelihood of being enrolled in a private school, with 116 (100.0% in the age bracket) attending a public institution.
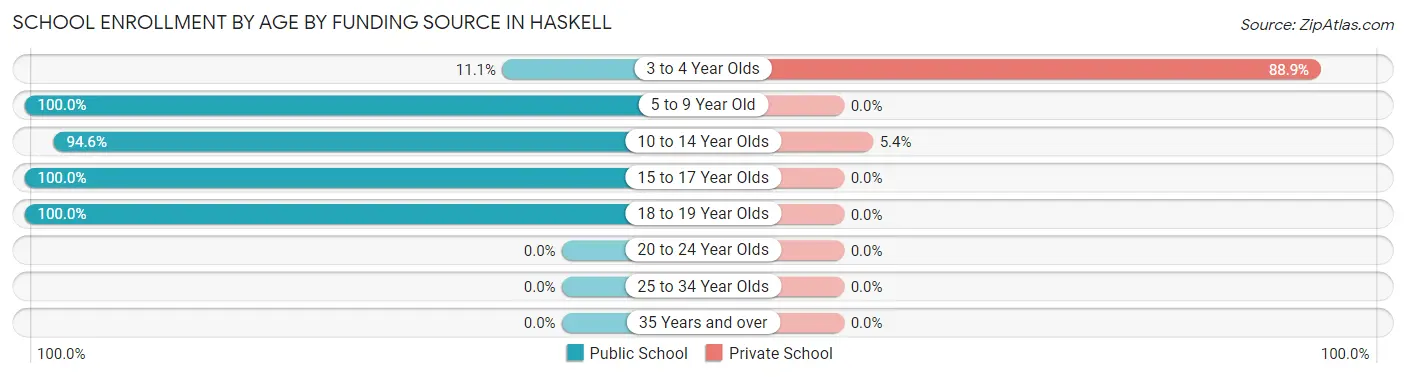
| Age Bracket | Public School | Private School |
| 3 to 4 Year Olds | 5 (11.1%) | 40 (88.9%) |
| 5 to 9 Year Old | 116 (100.0%) | 0 (0.0%) |
| 10 to 14 Year Olds | 140 (94.6%) | 8 (5.4%) |
| 15 to 17 Year Olds | 120 (100.0%) | 0 (0.0%) |
| 18 to 19 Year Olds | 211 (100.0%) | 0 (0.0%) |
| 20 to 24 Year Olds | 0 (0.0%) | 0 (0.0%) |
| 25 to 34 Year Olds | 0 (0.0%) | 0 (0.0%) |
| 35 Years and over | 0 (0.0%) | 0 (0.0%) |
| Total | 592 (92.5%) | 48 (7.5%) |
Educational Attainment by Field of Study in Haskell
Business (117 | 25.1%), education (116 | 24.8%), liberal arts & history (53 | 11.4%), bio, nature & agricultural (51 | 10.9%), and engineering (42 | 9.0%) are the most common fields of study among 467 individuals in Haskell who have obtained a bachelor's degree or higher.
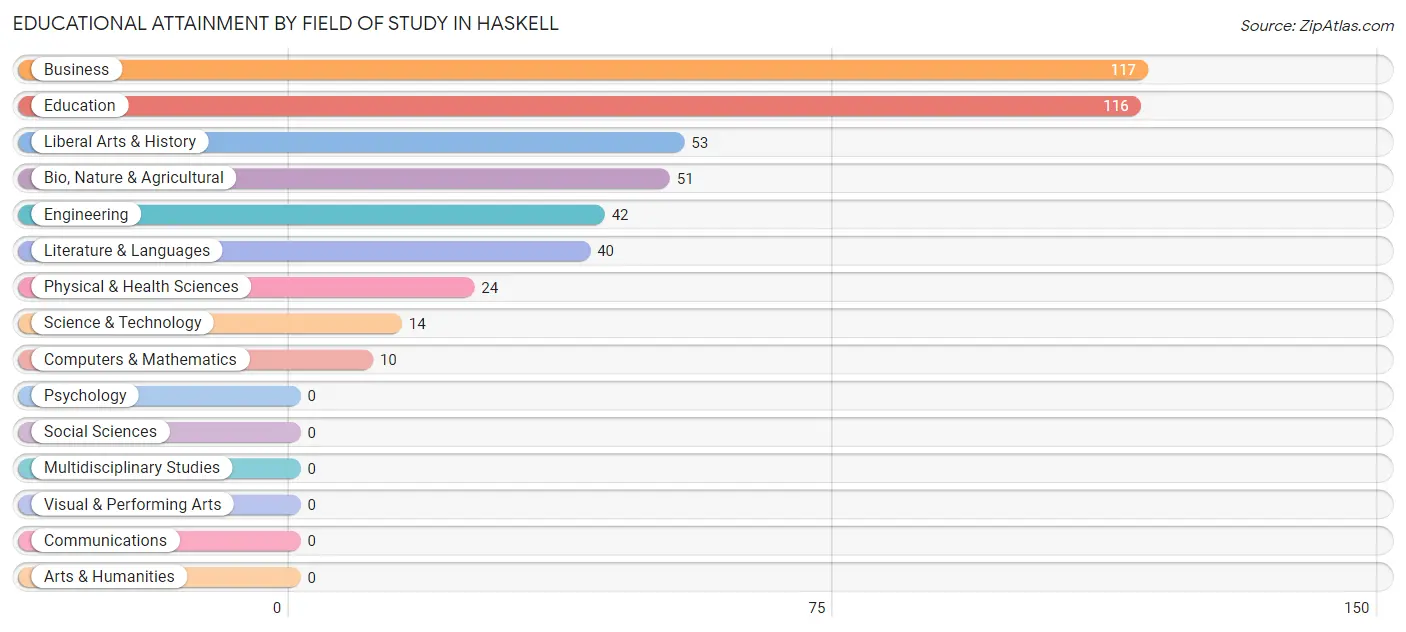
| Field of Study | # Graduates | % Graduates |
| Computers & Mathematics | 10 | 2.1% |
| Bio, Nature & Agricultural | 51 | 10.9% |
| Physical & Health Sciences | 24 | 5.1% |
| Psychology | 0 | 0.0% |
| Social Sciences | 0 | 0.0% |
| Engineering | 42 | 9.0% |
| Multidisciplinary Studies | 0 | 0.0% |
| Science & Technology | 14 | 3.0% |
| Business | 117 | 25.1% |
| Education | 116 | 24.8% |
| Literature & Languages | 40 | 8.6% |
| Liberal Arts & History | 53 | 11.4% |
| Visual & Performing Arts | 0 | 0.0% |
| Communications | 0 | 0.0% |
| Arts & Humanities | 0 | 0.0% |
| Total | 467 | 100.0% |
Transportation & Commute in Haskell
Vehicle Availability by Sex in Haskell
The most prevalent vehicle ownership categories in Haskell are males with 2 vehicles (315, accounting for 45.1%) and females with 2 vehicles (164, making up 57.9%).
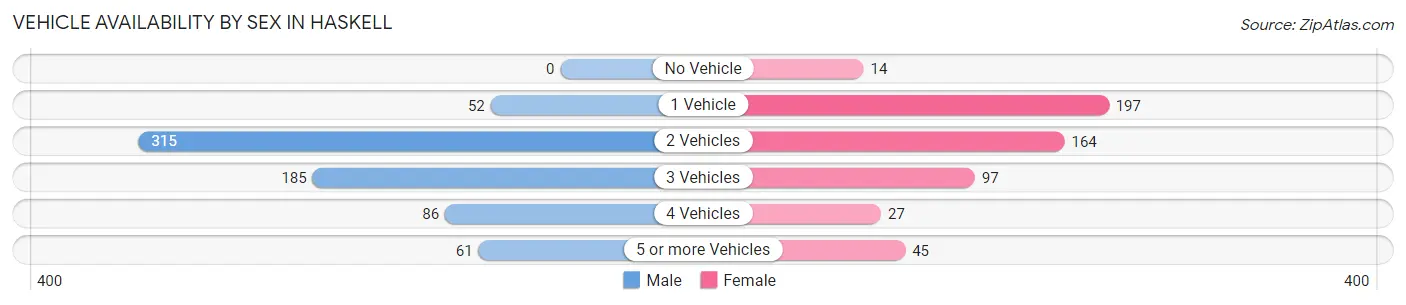
| Vehicles Available | Male | Female |
| No Vehicle | 0 (0.0%) | 14 (2.6%) |
| 1 Vehicle | 52 (7.4%) | 197 (36.2%) |
| 2 Vehicles | 315 (45.1%) | 164 (30.1%) |
| 3 Vehicles | 185 (26.5%) | 97 (17.8%) |
| 4 Vehicles | 86 (12.3%) | 27 (5.0%) |
| 5 or more Vehicles | 61 (8.7%) | 45 (8.3%) |
| Total | 699 (100.0%) | 544 (100.0%) |
Commute Time in Haskell
The most frequently occuring commute durations in Haskell are 5 to 9 minutes (340 commuters, 30.4%), 20 to 24 minutes (164 commuters, 14.6%), and 30 to 34 minutes (116 commuters, 10.4%).
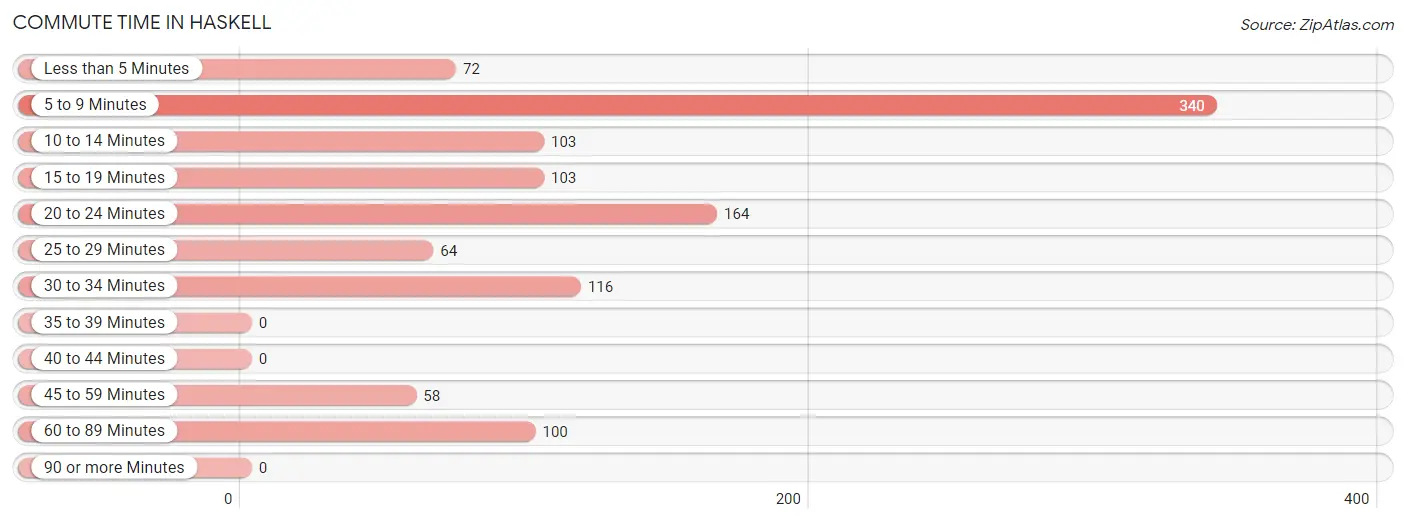
| Commute Time | # Commuters | % Commuters |
| Less than 5 Minutes | 72 | 6.4% |
| 5 to 9 Minutes | 340 | 30.4% |
| 10 to 14 Minutes | 103 | 9.2% |
| 15 to 19 Minutes | 103 | 9.2% |
| 20 to 24 Minutes | 164 | 14.6% |
| 25 to 29 Minutes | 64 | 5.7% |
| 30 to 34 Minutes | 116 | 10.4% |
| 35 to 39 Minutes | 0 | 0.0% |
| 40 to 44 Minutes | 0 | 0.0% |
| 45 to 59 Minutes | 58 | 5.2% |
| 60 to 89 Minutes | 100 | 8.9% |
| 90 or more Minutes | 0 | 0.0% |
Commute Time by Sex in Haskell
The most common commute times in Haskell are 5 to 9 minutes (237 commuters, 37.4%) for males and 5 to 9 minutes (103 commuters, 21.1%) for females.
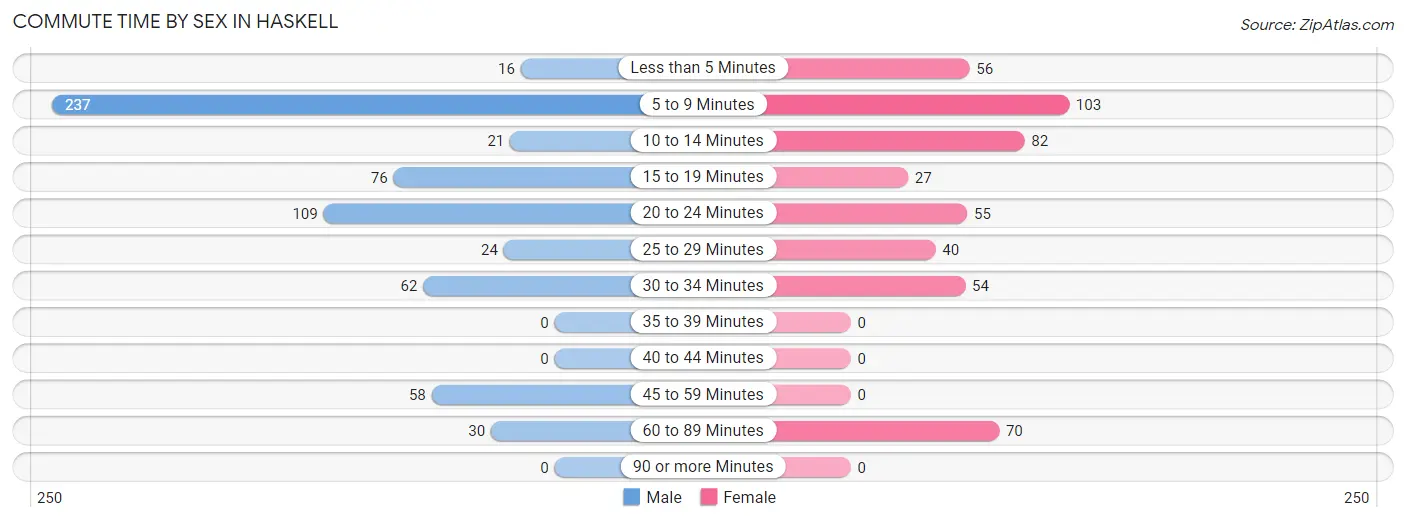
| Commute Time | Male | Female |
| Less than 5 Minutes | 16 (2.5%) | 56 (11.5%) |
| 5 to 9 Minutes | 237 (37.4%) | 103 (21.1%) |
| 10 to 14 Minutes | 21 (3.3%) | 82 (16.8%) |
| 15 to 19 Minutes | 76 (12.0%) | 27 (5.5%) |
| 20 to 24 Minutes | 109 (17.2%) | 55 (11.3%) |
| 25 to 29 Minutes | 24 (3.8%) | 40 (8.2%) |
| 30 to 34 Minutes | 62 (9.8%) | 54 (11.1%) |
| 35 to 39 Minutes | 0 (0.0%) | 0 (0.0%) |
| 40 to 44 Minutes | 0 (0.0%) | 0 (0.0%) |
| 45 to 59 Minutes | 58 (9.2%) | 0 (0.0%) |
| 60 to 89 Minutes | 30 (4.7%) | 70 (14.4%) |
| 90 or more Minutes | 0 (0.0%) | 0 (0.0%) |
Time of Departure to Work by Sex in Haskell
The most frequent times of departure to work in Haskell are 7:30 AM to 7:59 AM (187, 29.5%) for males and 7:30 AM to 7:59 AM (151, 31.0%) for females.
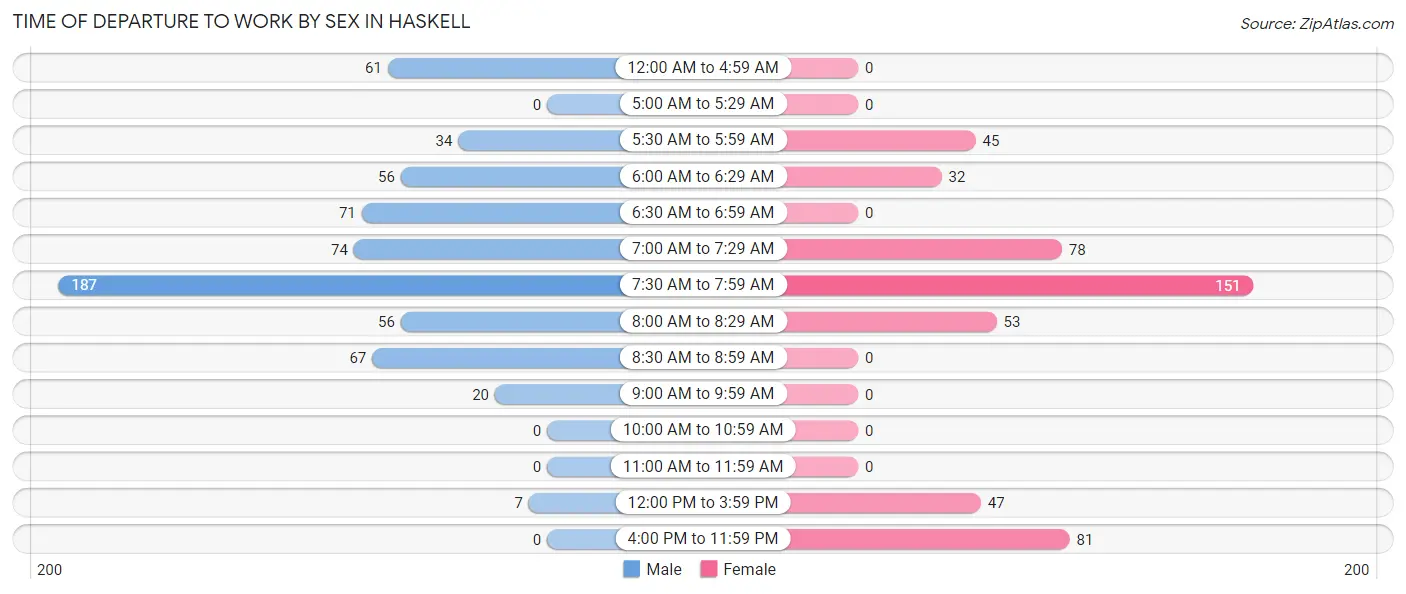
| Time of Departure | Male | Female |
| 12:00 AM to 4:59 AM | 61 (9.6%) | 0 (0.0%) |
| 5:00 AM to 5:29 AM | 0 (0.0%) | 0 (0.0%) |
| 5:30 AM to 5:59 AM | 34 (5.4%) | 45 (9.2%) |
| 6:00 AM to 6:29 AM | 56 (8.8%) | 32 (6.6%) |
| 6:30 AM to 6:59 AM | 71 (11.2%) | 0 (0.0%) |
| 7:00 AM to 7:29 AM | 74 (11.7%) | 78 (16.0%) |
| 7:30 AM to 7:59 AM | 187 (29.5%) | 151 (31.0%) |
| 8:00 AM to 8:29 AM | 56 (8.8%) | 53 (10.9%) |
| 8:30 AM to 8:59 AM | 67 (10.6%) | 0 (0.0%) |
| 9:00 AM to 9:59 AM | 20 (3.2%) | 0 (0.0%) |
| 10:00 AM to 10:59 AM | 0 (0.0%) | 0 (0.0%) |
| 11:00 AM to 11:59 AM | 0 (0.0%) | 0 (0.0%) |
| 12:00 PM to 3:59 PM | 7 (1.1%) | 47 (9.7%) |
| 4:00 PM to 11:59 PM | 0 (0.0%) | 81 (16.6%) |
| Total | 633 (100.0%) | 487 (100.0%) |
Housing Occupancy in Haskell
Occupancy by Ownership in Haskell
Of the total 1,074 dwellings in Haskell, owner-occupied units account for 655 (61.0%), while renter-occupied units make up 419 (39.0%).
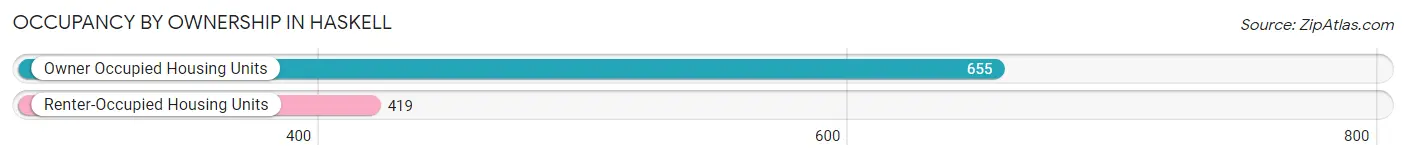
| Occupancy | # Housing Units | % Housing Units |
| Owner Occupied Housing Units | 655 | 61.0% |
| Renter-Occupied Housing Units | 419 | 39.0% |
| Total Occupied Housing Units | 1,074 | 100.0% |
Occupancy by Household Size in Haskell
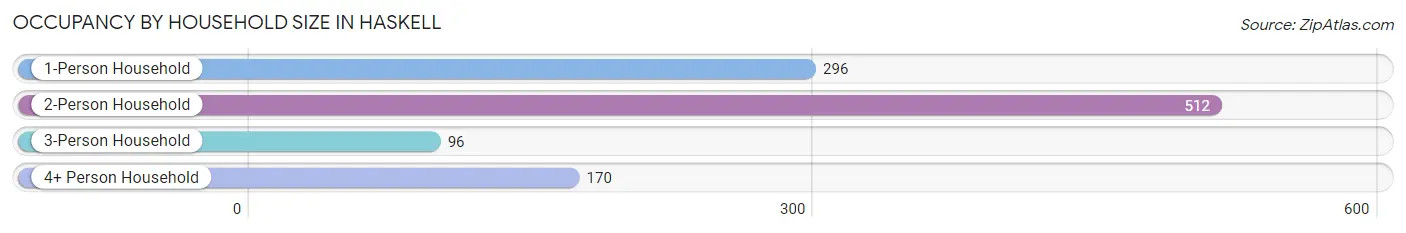
| Household Size | # Housing Units | % Housing Units |
| 1-Person Household | 296 | 27.6% |
| 2-Person Household | 512 | 47.7% |
| 3-Person Household | 96 | 8.9% |
| 4+ Person Household | 170 | 15.8% |
| Total Housing Units | 1,074 | 100.0% |
Occupancy by Ownership by Household Size in Haskell
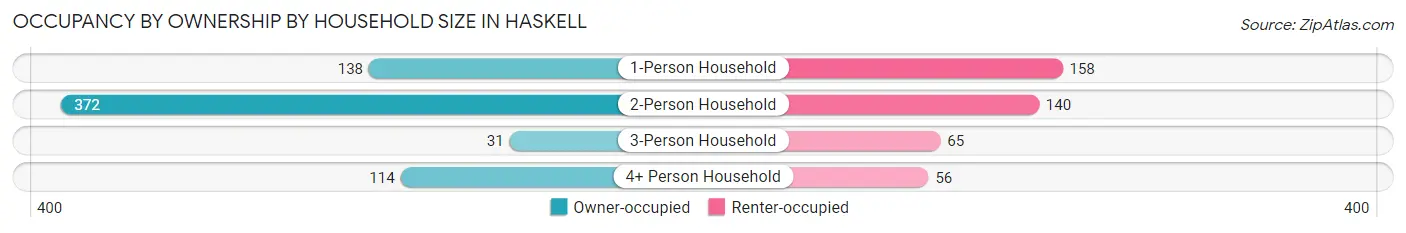
| Household Size | Owner-occupied | Renter-occupied |
| 1-Person Household | 138 (46.6%) | 158 (53.4%) |
| 2-Person Household | 372 (72.7%) | 140 (27.3%) |
| 3-Person Household | 31 (32.3%) | 65 (67.7%) |
| 4+ Person Household | 114 (67.1%) | 56 (32.9%) |
| Total Housing Units | 655 (61.0%) | 419 (39.0%) |
Occupancy by Educational Attainment in Haskell
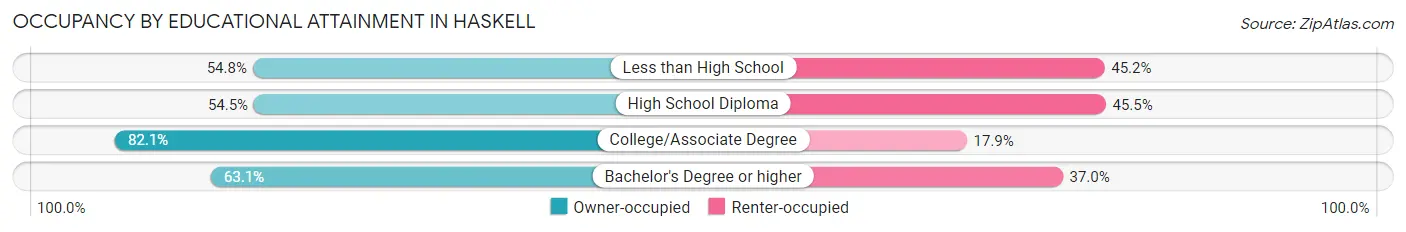
| Household Size | Owner-occupied | Renter-occupied |
| Less than High School | 109 (54.8%) | 90 (45.2%) |
| High School Diploma | 247 (54.5%) | 206 (45.5%) |
| College/Associate Degree | 142 (82.1%) | 31 (17.9%) |
| Bachelor's Degree or higher | 157 (63.0%) | 92 (36.9%) |
Occupancy by Age of Householder in Haskell
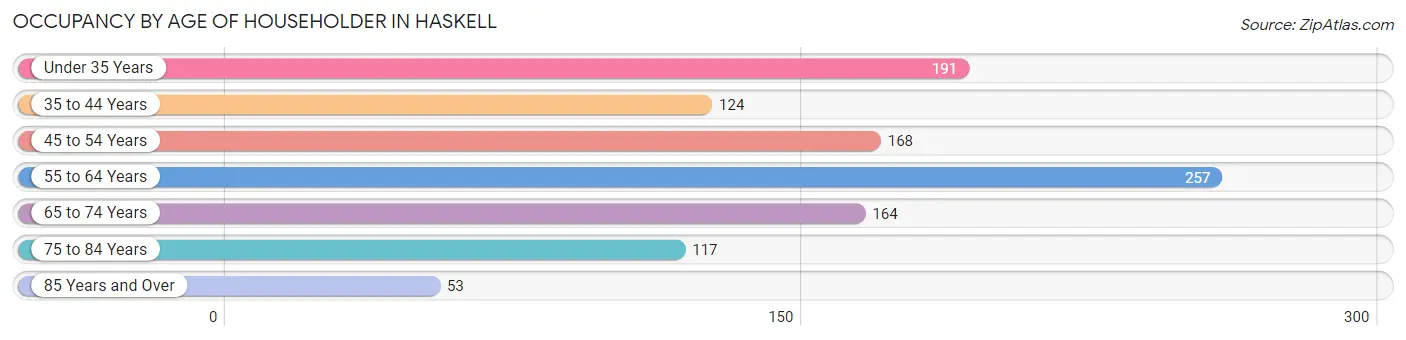
| Age Bracket | # Households | % Households |
| Under 35 Years | 191 | 17.8% |
| 35 to 44 Years | 124 | 11.6% |
| 45 to 54 Years | 168 | 15.6% |
| 55 to 64 Years | 257 | 23.9% |
| 65 to 74 Years | 164 | 15.3% |
| 75 to 84 Years | 117 | 10.9% |
| 85 Years and Over | 53 | 4.9% |
| Total | 1,074 | 100.0% |
Housing Finances in Haskell
Median Income by Occupancy in Haskell
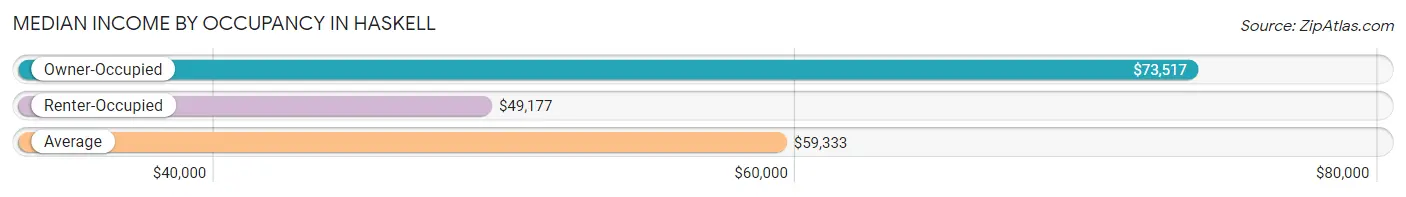
| Occupancy Type | # Households | Median Income |
| Owner-Occupied | 655 (61.0%) | $73,517 |
| Renter-Occupied | 419 (39.0%) | $49,177 |
| Average | 1,074 (100.0%) | $59,333 |
Occupancy by Householder Income Bracket in Haskell
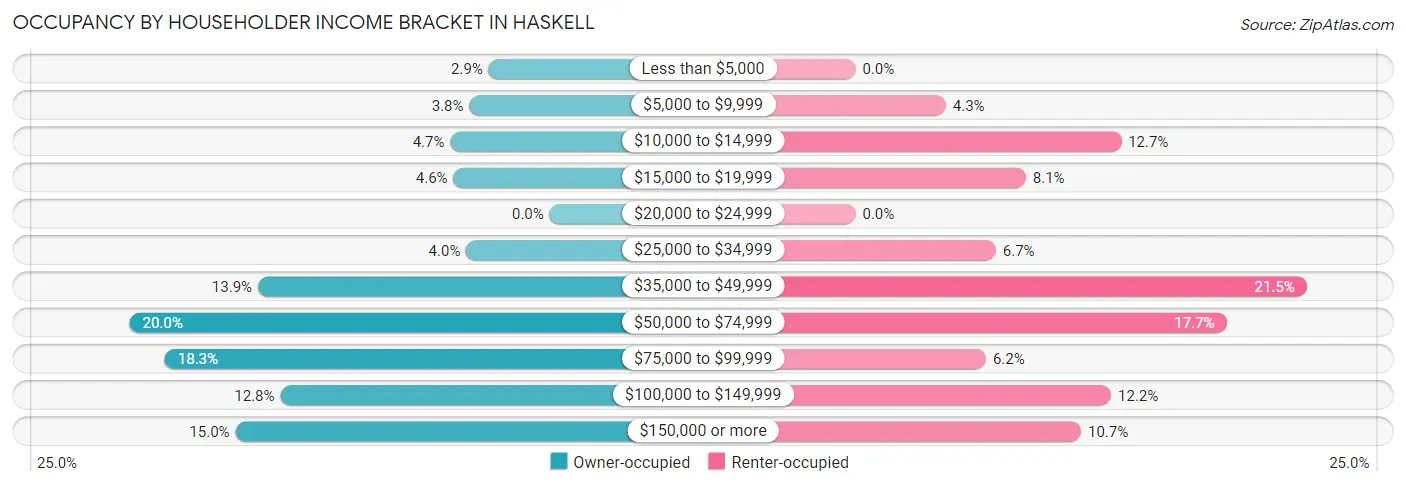
| Income Bracket | Owner-occupied | Renter-occupied |
| Less than $5,000 | 19 (2.9%) | 0 (0.0%) |
| $5,000 to $9,999 | 25 (3.8%) | 18 (4.3%) |
| $10,000 to $14,999 | 31 (4.7%) | 53 (12.7%) |
| $15,000 to $19,999 | 30 (4.6%) | 34 (8.1%) |
| $20,000 to $24,999 | 0 (0.0%) | 0 (0.0%) |
| $25,000 to $34,999 | 26 (4.0%) | 28 (6.7%) |
| $35,000 to $49,999 | 91 (13.9%) | 90 (21.5%) |
| $50,000 to $74,999 | 131 (20.0%) | 74 (17.7%) |
| $75,000 to $99,999 | 120 (18.3%) | 26 (6.2%) |
| $100,000 to $149,999 | 84 (12.8%) | 51 (12.2%) |
| $150,000 or more | 98 (15.0%) | 45 (10.7%) |
| Total | 655 (100.0%) | 419 (100.0%) |
Monthly Housing Cost Tiers in Haskell
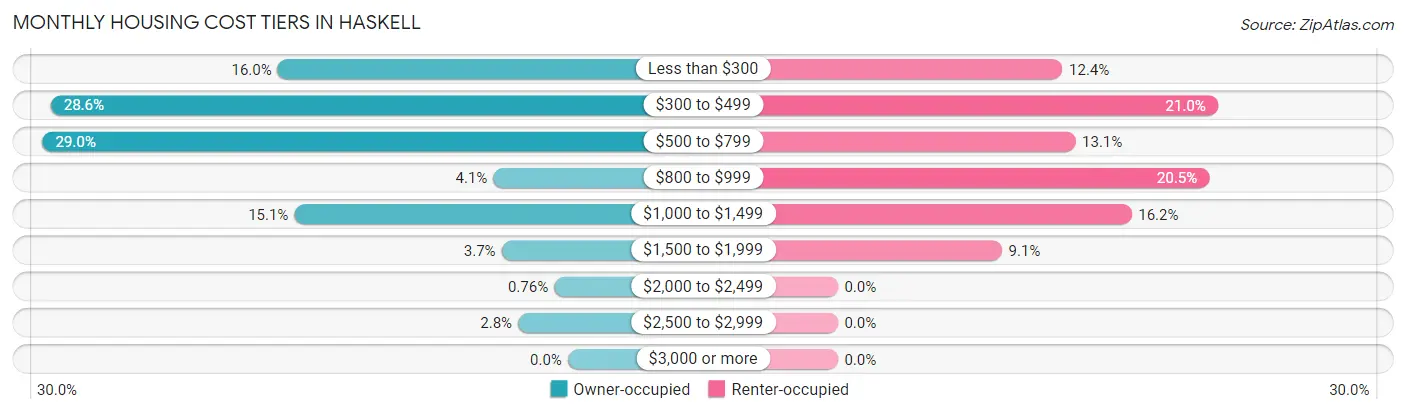
| Monthly Cost | Owner-occupied | Renter-occupied |
| Less than $300 | 105 (16.0%) | 52 (12.4%) |
| $300 to $499 | 187 (28.5%) | 88 (21.0%) |
| $500 to $799 | 190 (29.0%) | 55 (13.1%) |
| $800 to $999 | 27 (4.1%) | 86 (20.5%) |
| $1,000 to $1,499 | 99 (15.1%) | 68 (16.2%) |
| $1,500 to $1,999 | 24 (3.7%) | 38 (9.1%) |
| $2,000 to $2,499 | 5 (0.8%) | 0 (0.0%) |
| $2,500 to $2,999 | 18 (2.8%) | 0 (0.0%) |
| $3,000 or more | 0 (0.0%) | 0 (0.0%) |
| Total | 655 (100.0%) | 419 (100.0%) |
Physical Housing Characteristics in Haskell
Housing Structures in Haskell
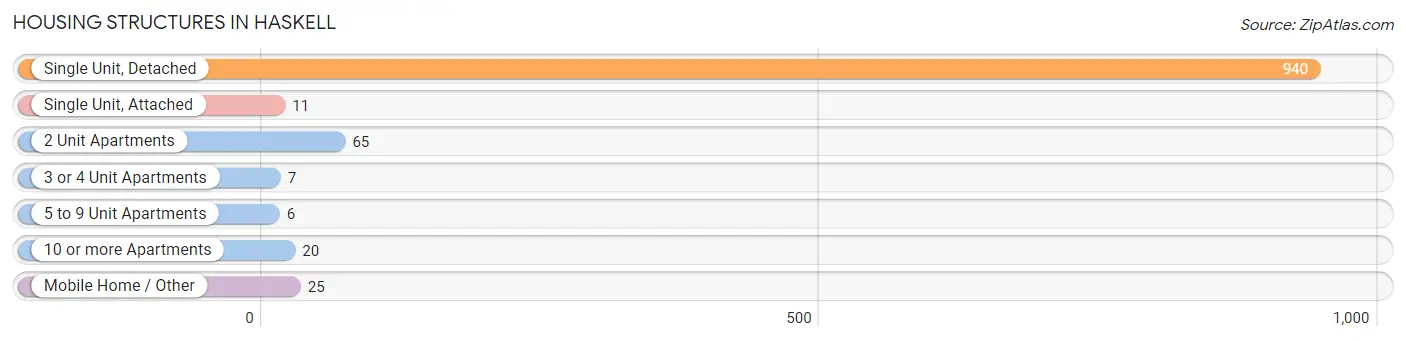
| Structure Type | # Housing Units | % Housing Units |
| Single Unit, Detached | 940 | 87.5% |
| Single Unit, Attached | 11 | 1.0% |
| 2 Unit Apartments | 65 | 6.0% |
| 3 or 4 Unit Apartments | 7 | 0.6% |
| 5 to 9 Unit Apartments | 6 | 0.6% |
| 10 or more Apartments | 20 | 1.9% |
| Mobile Home / Other | 25 | 2.3% |
| Total | 1,074 | 100.0% |
Housing Structures by Occupancy in Haskell
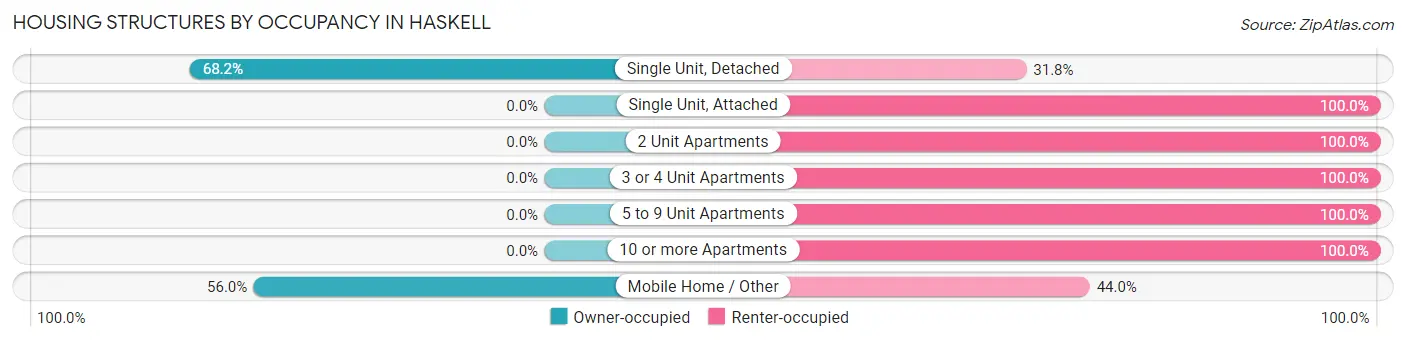
| Structure Type | Owner-occupied | Renter-occupied |
| Single Unit, Detached | 641 (68.2%) | 299 (31.8%) |
| Single Unit, Attached | 0 (0.0%) | 11 (100.0%) |
| 2 Unit Apartments | 0 (0.0%) | 65 (100.0%) |
| 3 or 4 Unit Apartments | 0 (0.0%) | 7 (100.0%) |
| 5 to 9 Unit Apartments | 0 (0.0%) | 6 (100.0%) |
| 10 or more Apartments | 0 (0.0%) | 20 (100.0%) |
| Mobile Home / Other | 14 (56.0%) | 11 (44.0%) |
| Total | 655 (61.0%) | 419 (39.0%) |
Housing Structures by Number of Rooms in Haskell
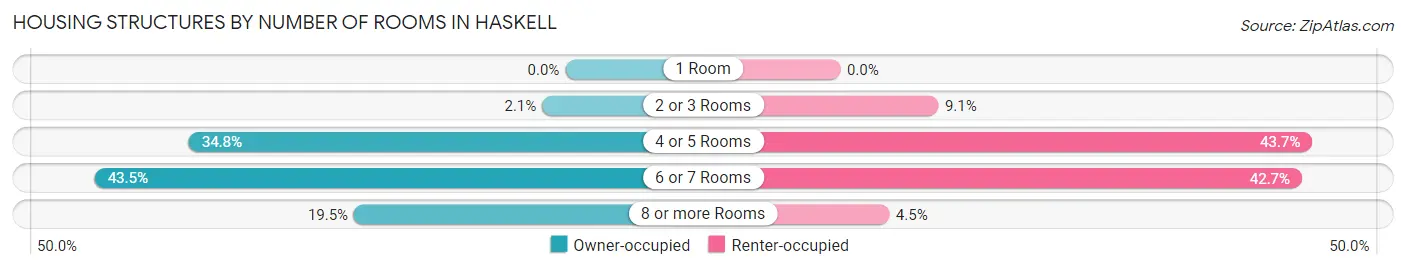
| Number of Rooms | Owner-occupied | Renter-occupied |
| 1 Room | 0 (0.0%) | 0 (0.0%) |
| 2 or 3 Rooms | 14 (2.1%) | 38 (9.1%) |
| 4 or 5 Rooms | 228 (34.8%) | 183 (43.7%) |
| 6 or 7 Rooms | 285 (43.5%) | 179 (42.7%) |
| 8 or more Rooms | 128 (19.5%) | 19 (4.5%) |
| Total | 655 (100.0%) | 419 (100.0%) |
Housing Structure by Heating Type in Haskell
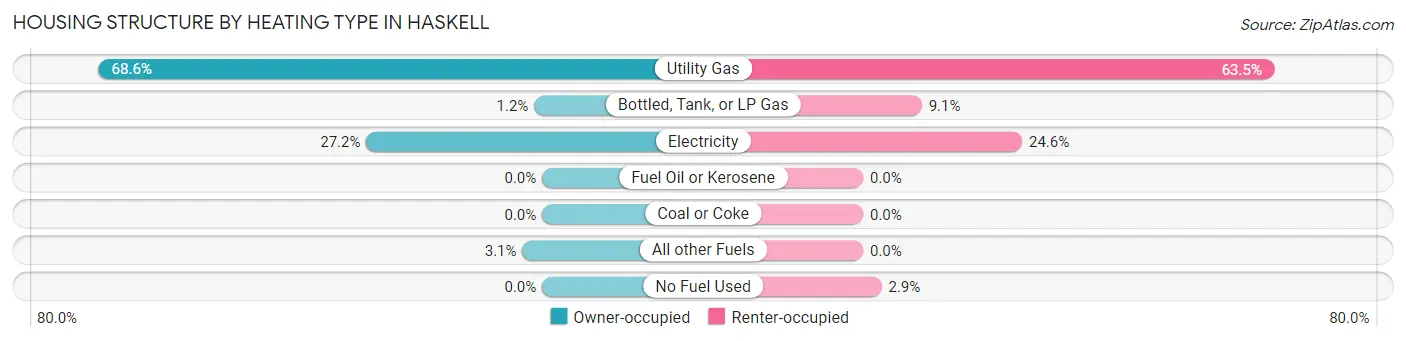
| Heating Type | Owner-occupied | Renter-occupied |
| Utility Gas | 449 (68.5%) | 266 (63.5%) |
| Bottled, Tank, or LP Gas | 8 (1.2%) | 38 (9.1%) |
| Electricity | 178 (27.2%) | 103 (24.6%) |
| Fuel Oil or Kerosene | 0 (0.0%) | 0 (0.0%) |
| Coal or Coke | 0 (0.0%) | 0 (0.0%) |
| All other Fuels | 20 (3.0%) | 0 (0.0%) |
| No Fuel Used | 0 (0.0%) | 12 (2.9%) |
| Total | 655 (100.0%) | 419 (100.0%) |
Household Vehicle Usage in Haskell
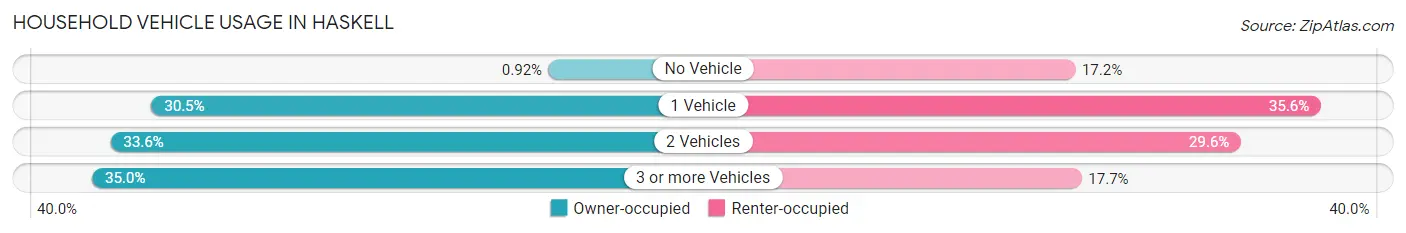
| Vehicles per Household | Owner-occupied | Renter-occupied |
| No Vehicle | 6 (0.9%) | 72 (17.2%) |
| 1 Vehicle | 200 (30.5%) | 149 (35.6%) |
| 2 Vehicles | 220 (33.6%) | 124 (29.6%) |
| 3 or more Vehicles | 229 (35.0%) | 74 (17.7%) |
| Total | 655 (100.0%) | 419 (100.0%) |
Real Estate & Mortgages in Haskell
Real Estate and Mortgage Overview in Haskell
| Characteristic | Without Mortgage | With Mortgage |
| Housing Units | 497 | 158 |
| Median Property Value | $51,600 | $128,400 |
| Median Household Income | $59,831 | $50 |
| Monthly Housing Costs | $462 | $0 |
| Real Estate Taxes | $1,325 | $16 |
Property Value by Mortgage Status in Haskell
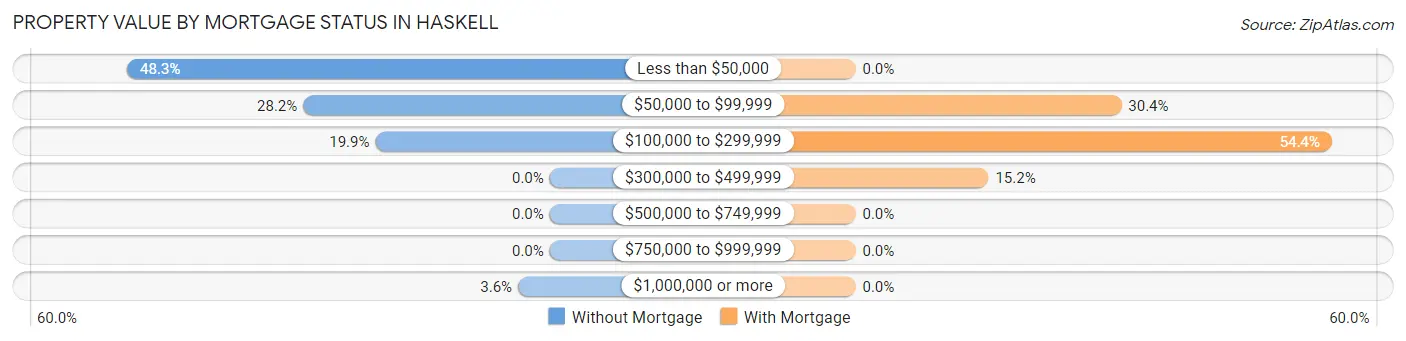
| Property Value | Without Mortgage | With Mortgage |
| Less than $50,000 | 240 (48.3%) | 0 (0.0%) |
| $50,000 to $99,999 | 140 (28.2%) | 48 (30.4%) |
| $100,000 to $299,999 | 99 (19.9%) | 86 (54.4%) |
| $300,000 to $499,999 | 0 (0.0%) | 24 (15.2%) |
| $500,000 to $749,999 | 0 (0.0%) | 0 (0.0%) |
| $750,000 to $999,999 | 0 (0.0%) | 0 (0.0%) |
| $1,000,000 or more | 18 (3.6%) | 0 (0.0%) |
| Total | 497 (100.0%) | 158 (100.0%) |
Household Income by Mortgage Status in Haskell
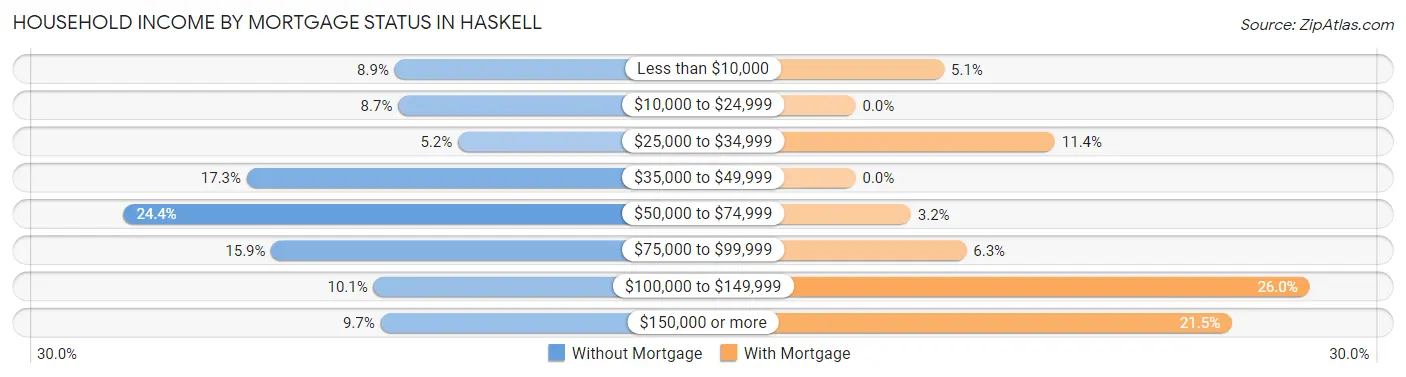
| Household Income | Without Mortgage | With Mortgage |
| Less than $10,000 | 44 (8.8%) | 8 (5.1%) |
| $10,000 to $24,999 | 43 (8.6%) | 0 (0.0%) |
| $25,000 to $34,999 | 26 (5.2%) | 18 (11.4%) |
| $35,000 to $49,999 | 86 (17.3%) | 0 (0.0%) |
| $50,000 to $74,999 | 121 (24.3%) | 5 (3.2%) |
| $75,000 to $99,999 | 79 (15.9%) | 10 (6.3%) |
| $100,000 to $149,999 | 50 (10.1%) | 41 (26.0%) |
| $150,000 or more | 48 (9.7%) | 34 (21.5%) |
| Total | 497 (100.0%) | 158 (100.0%) |
Property Value to Household Income Ratio in Haskell
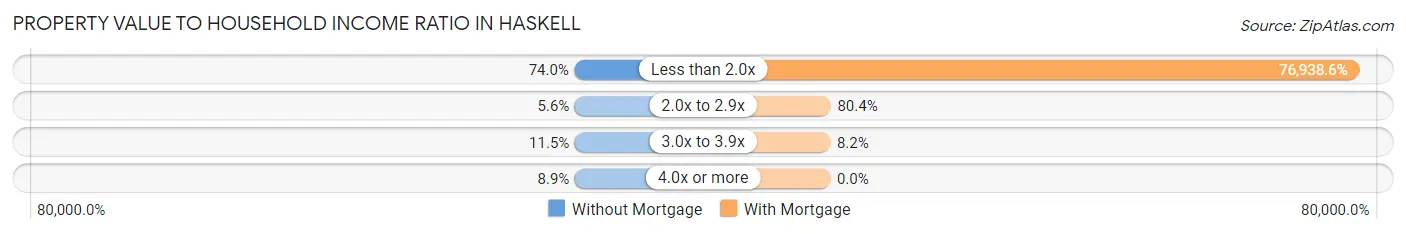
| Value-to-Income Ratio | Without Mortgage | With Mortgage |
| Less than 2.0x | 368 (74.0%) | 121,563 (76,938.6%) |
| 2.0x to 2.9x | 28 (5.6%) | 127 (80.4%) |
| 3.0x to 3.9x | 57 (11.5%) | 13 (8.2%) |
| 4.0x or more | 44 (8.8%) | 0 (0.0%) |
| Total | 497 (100.0%) | 158 (100.0%) |
Real Estate Taxes by Mortgage Status in Haskell
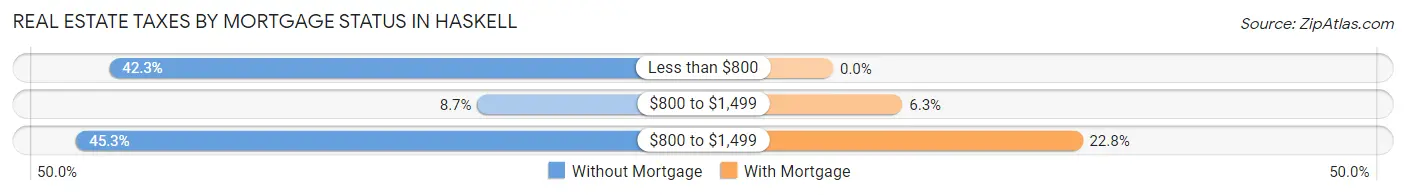
| Property Taxes | Without Mortgage | With Mortgage |
| Less than $800 | 210 (42.2%) | 0 (0.0%) |
| $800 to $1,499 | 43 (8.6%) | 10 (6.3%) |
| $800 to $1,499 | 225 (45.3%) | 36 (22.8%) |
| Total | 497 (100.0%) | 158 (100.0%) |
Health & Disability in Haskell
Health Insurance Coverage by Age in Haskell
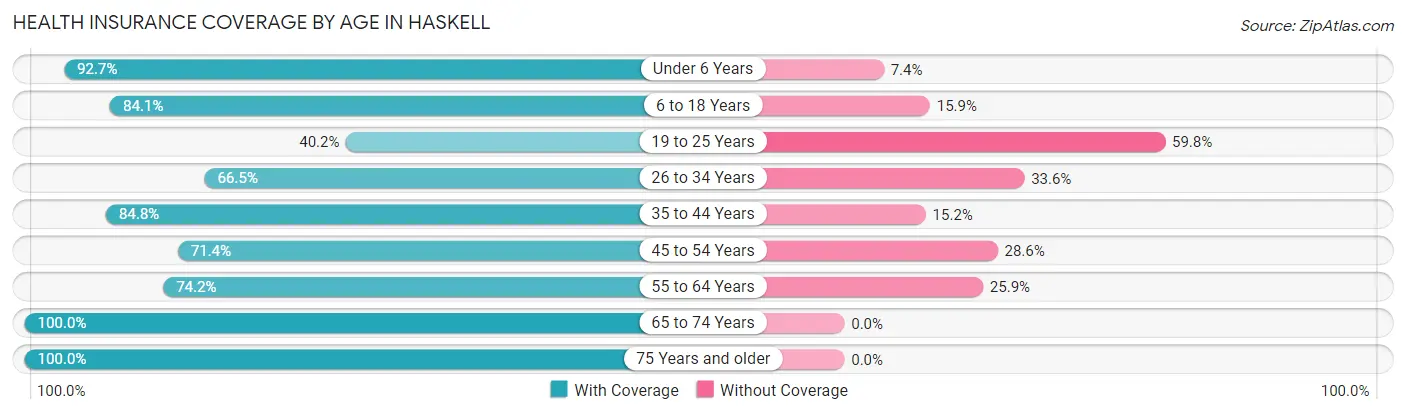
| Age Bracket | With Coverage | Without Coverage |
| Under 6 Years | 63 (92.6%) | 5 (7.3%) |
| 6 to 18 Years | 422 (84.1%) | 80 (15.9%) |
| 19 to 25 Years | 84 (40.2%) | 125 (59.8%) |
| 26 to 34 Years | 202 (66.4%) | 102 (33.6%) |
| 35 to 44 Years | 274 (84.8%) | 49 (15.2%) |
| 45 to 54 Years | 175 (71.4%) | 70 (28.6%) |
| 55 to 64 Years | 347 (74.2%) | 121 (25.9%) |
| 65 to 74 Years | 313 (100.0%) | 0 (0.0%) |
| 75 Years and older | 256 (100.0%) | 0 (0.0%) |
| Total | 2,136 (79.5%) | 552 (20.5%) |
Health Insurance Coverage by Citizenship Status in Haskell
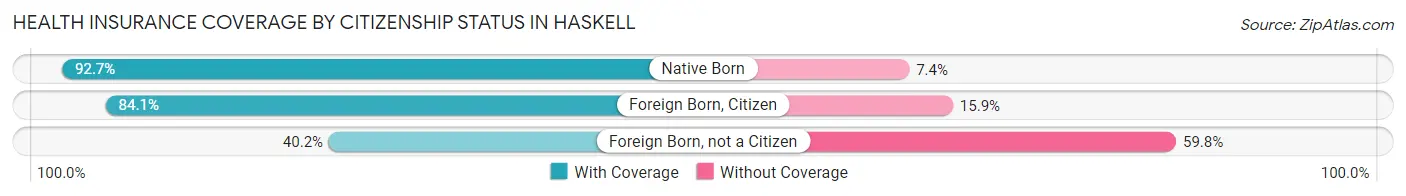
| Citizenship Status | With Coverage | Without Coverage |
| Native Born | 63 (92.6%) | 5 (7.3%) |
| Foreign Born, Citizen | 422 (84.1%) | 80 (15.9%) |
| Foreign Born, not a Citizen | 84 (40.2%) | 125 (59.8%) |
Health Insurance Coverage by Household Income in Haskell
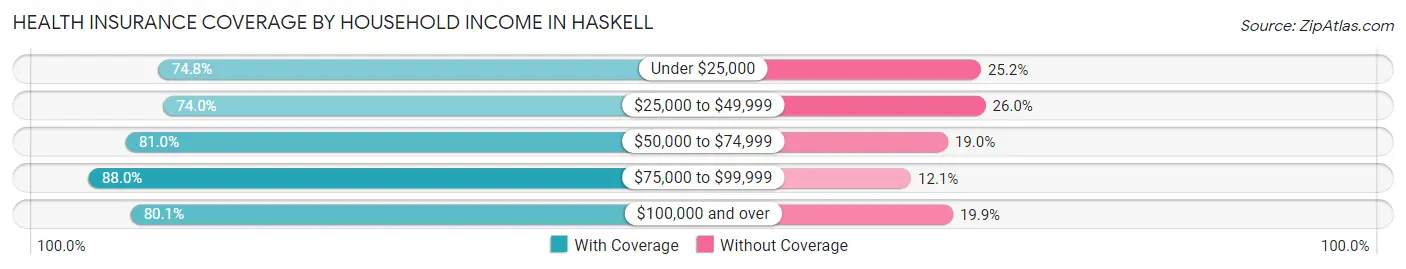
| Household Income | With Coverage | Without Coverage |
| Under $25,000 | 229 (74.8%) | 77 (25.2%) |
| $25,000 to $49,999 | 361 (74.0%) | 127 (26.0%) |
| $50,000 to $74,999 | 406 (81.0%) | 95 (19.0%) |
| $75,000 to $99,999 | 270 (87.9%) | 37 (12.0%) |
| $100,000 and over | 870 (80.1%) | 216 (19.9%) |
Public vs Private Health Insurance Coverage by Age in Haskell
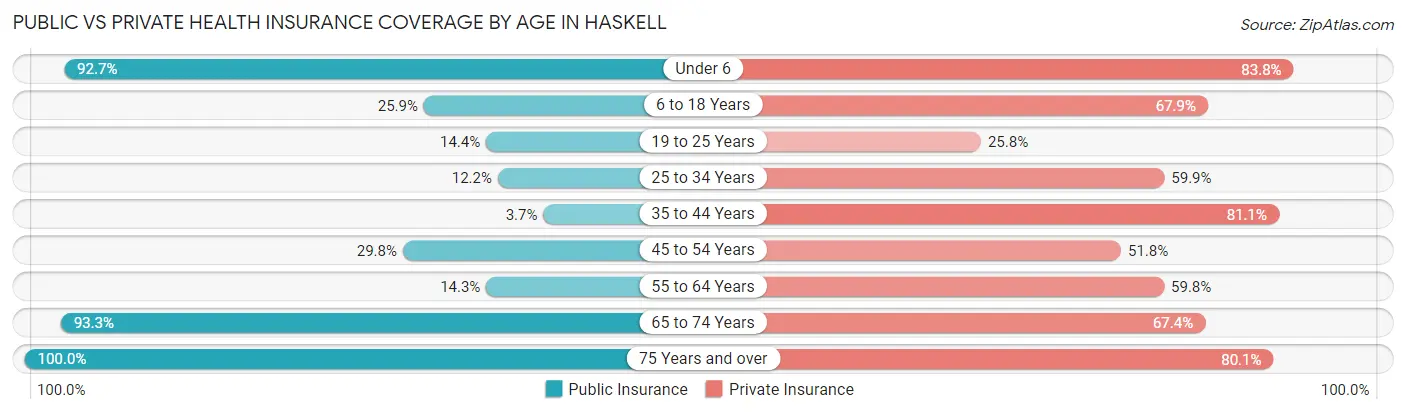
| Age Bracket | Public Insurance | Private Insurance |
| Under 6 | 63 (92.6%) | 57 (83.8%) |
| 6 to 18 Years | 130 (25.9%) | 341 (67.9%) |
| 19 to 25 Years | 30 (14.3%) | 54 (25.8%) |
| 25 to 34 Years | 37 (12.2%) | 182 (59.9%) |
| 35 to 44 Years | 12 (3.7%) | 262 (81.1%) |
| 45 to 54 Years | 73 (29.8%) | 127 (51.8%) |
| 55 to 64 Years | 67 (14.3%) | 280 (59.8%) |
| 65 to 74 Years | 292 (93.3%) | 211 (67.4%) |
| 75 Years and over | 256 (100.0%) | 205 (80.1%) |
| Total | 960 (35.7%) | 1,719 (63.9%) |
Disability Status by Sex by Age in Haskell
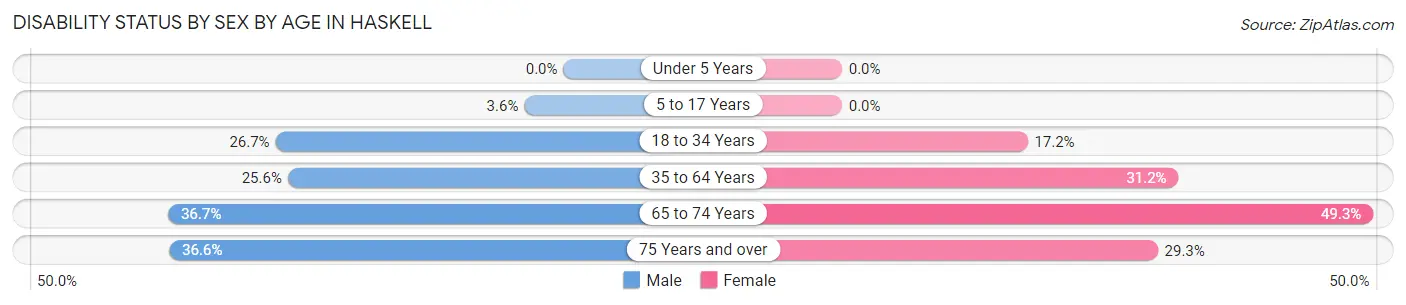
| Age Bracket | Male | Female |
| Under 5 Years | 0 (0.0%) | 0 (0.0%) |
| 5 to 17 Years | 7 (3.6%) | 0 (0.0%) |
| 18 to 34 Years | 105 (26.7%) | 41 (17.2%) |
| 35 to 64 Years | 143 (25.6%) | 149 (31.2%) |
| 65 to 74 Years | 62 (36.7%) | 71 (49.3%) |
| 75 Years and over | 30 (36.6%) | 51 (29.3%) |
Disability Class by Sex by Age in Haskell
Disability Class: Hearing Difficulty
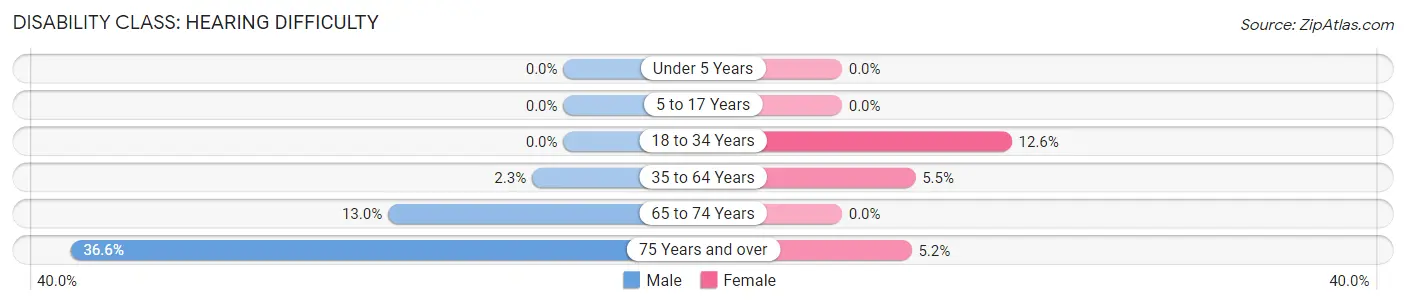
| Age Bracket | Male | Female |
| Under 5 Years | 0 (0.0%) | 0 (0.0%) |
| 5 to 17 Years | 0 (0.0%) | 0 (0.0%) |
| 18 to 34 Years | 0 (0.0%) | 30 (12.6%) |
| 35 to 64 Years | 13 (2.3%) | 26 (5.4%) |
| 65 to 74 Years | 22 (13.0%) | 0 (0.0%) |
| 75 Years and over | 30 (36.6%) | 9 (5.2%) |
Disability Class: Vision Difficulty
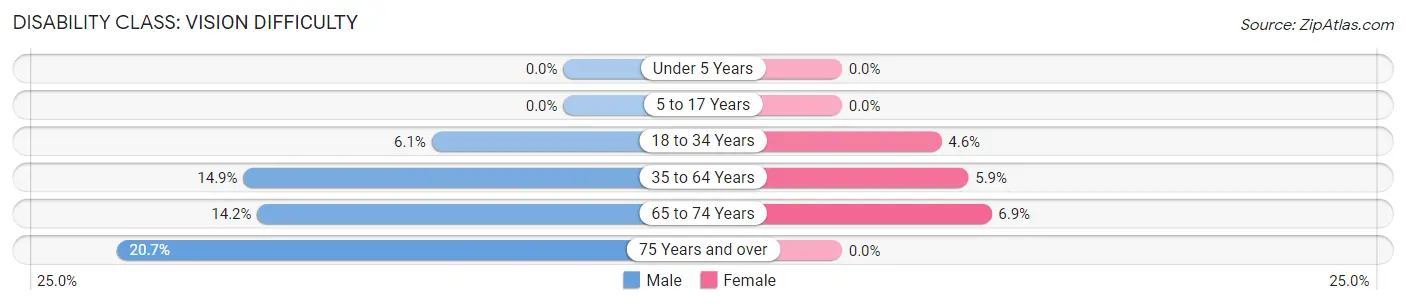
| Age Bracket | Male | Female |
| Under 5 Years | 0 (0.0%) | 0 (0.0%) |
| 5 to 17 Years | 0 (0.0%) | 0 (0.0%) |
| 18 to 34 Years | 24 (6.1%) | 11 (4.6%) |
| 35 to 64 Years | 83 (14.8%) | 28 (5.9%) |
| 65 to 74 Years | 24 (14.2%) | 10 (6.9%) |
| 75 Years and over | 17 (20.7%) | 0 (0.0%) |
Disability Class: Cognitive Difficulty
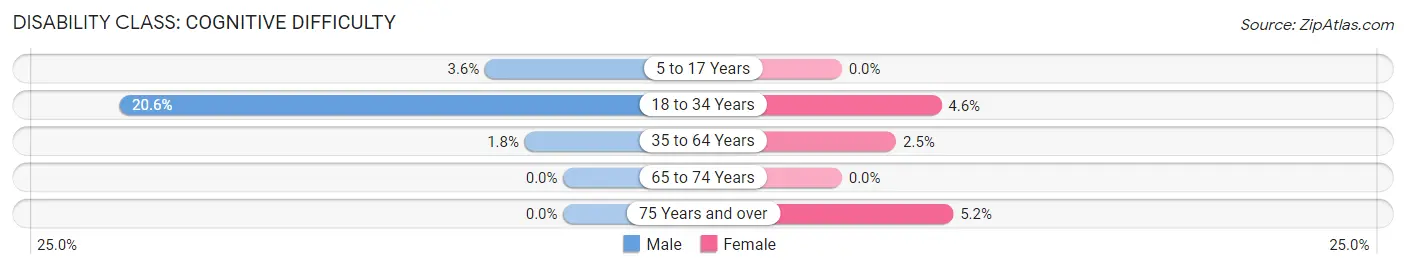
| Age Bracket | Male | Female |
| 5 to 17 Years | 7 (3.6%) | 0 (0.0%) |
| 18 to 34 Years | 81 (20.6%) | 11 (4.6%) |
| 35 to 64 Years | 10 (1.8%) | 12 (2.5%) |
| 65 to 74 Years | 0 (0.0%) | 0 (0.0%) |
| 75 Years and over | 0 (0.0%) | 9 (5.2%) |
Disability Class: Ambulatory Difficulty
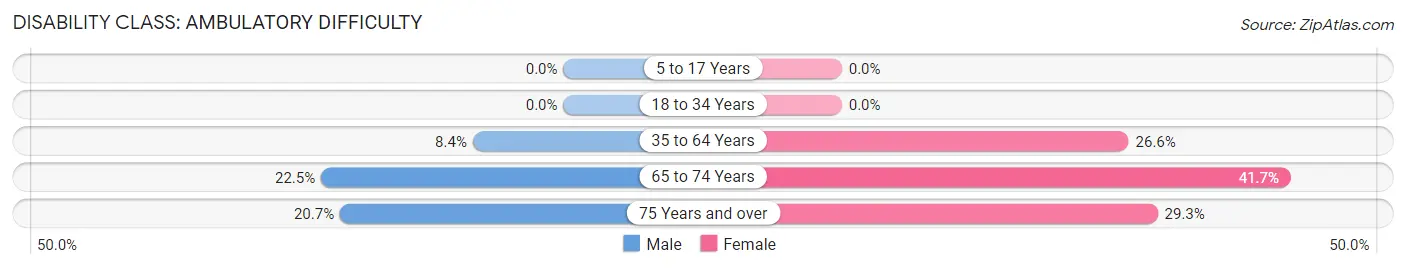
| Age Bracket | Male | Female |
| 5 to 17 Years | 0 (0.0%) | 0 (0.0%) |
| 18 to 34 Years | 0 (0.0%) | 0 (0.0%) |
| 35 to 64 Years | 47 (8.4%) | 127 (26.6%) |
| 65 to 74 Years | 38 (22.5%) | 60 (41.7%) |
| 75 Years and over | 17 (20.7%) | 51 (29.3%) |
Disability Class: Self-Care Difficulty
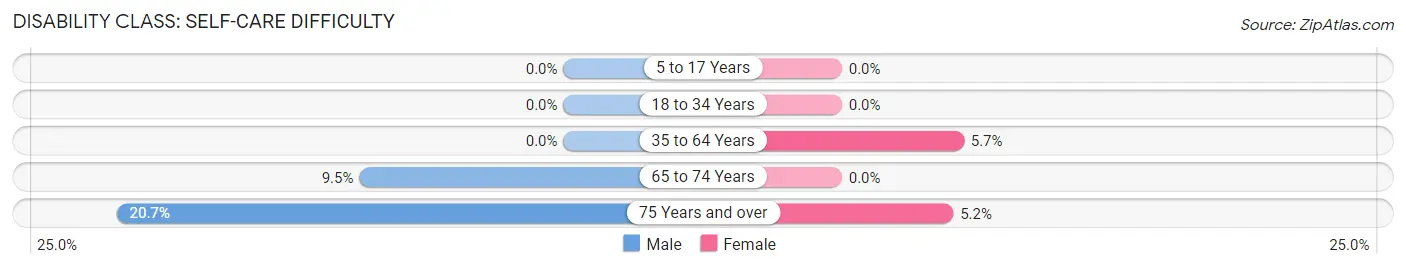
| Age Bracket | Male | Female |
| 5 to 17 Years | 0 (0.0%) | 0 (0.0%) |
| 18 to 34 Years | 0 (0.0%) | 0 (0.0%) |
| 35 to 64 Years | 0 (0.0%) | 27 (5.7%) |
| 65 to 74 Years | 16 (9.5%) | 0 (0.0%) |
| 75 Years and over | 17 (20.7%) | 9 (5.2%) |
Technology Access in Haskell
Computing Device Access in Haskell
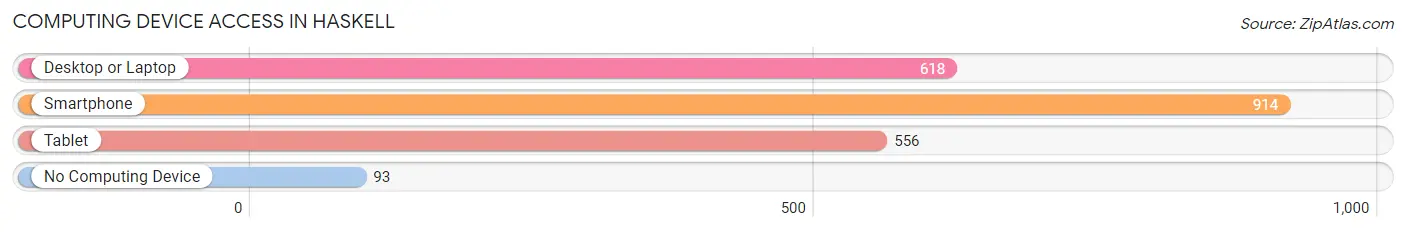
| Device Type | # Households | % Households |
| Desktop or Laptop | 618 | 57.5% |
| Smartphone | 914 | 85.1% |
| Tablet | 556 | 51.8% |
| No Computing Device | 93 | 8.7% |
| Total | 1,074 | 100.0% |
Internet Access in Haskell
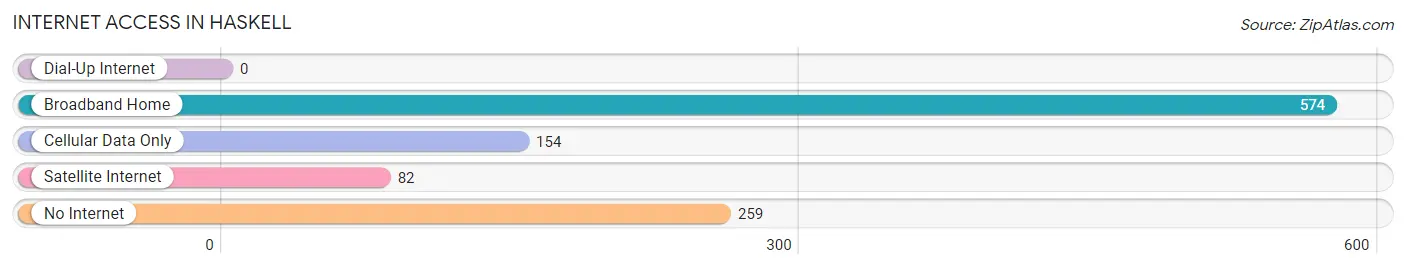
| Internet Type | # Households | % Households |
| Dial-Up Internet | 0 | 0.0% |
| Broadband Home | 574 | 53.4% |
| Cellular Data Only | 154 | 14.3% |
| Satellite Internet | 82 | 7.6% |
| No Internet | 259 | 24.1% |
| Total | 1,074 | 100.0% |
Haskell Summary
Haskell, Texas is a small town located in Haskell County, Texas. It is situated in the northwest corner of the state, about 90 miles southeast of Abilene and about 100 miles northwest of Fort Worth. The population of Haskell was 2,731 in the 2010 census, making it the county seat of Haskell County.
Geography
Haskell is located at 33°11'25" North, 99°45'25" West (33.1903, -99.7569). It is situated in the northwest corner of the state, about 90 miles southeast of Abilene and about 100 miles northwest of Fort Worth. The town is situated on the banks of the Salt Fork of the Brazos River. The terrain is mostly flat, with some rolling hills in the area. The climate is semi-arid, with hot summers and mild winters.
Economy
The economy of Haskell is largely based on agriculture and oil production. The town is home to several large farms, as well as several oil and gas wells. The town also has a few small businesses, including a grocery store, a hardware store, and a few restaurants.
Demographics
As of the 2010 census, the population of Haskell was 2,731. The racial makeup of the town was 79.3% White, 0.3% African American, 0.2% Native American, 0.2% Asian, 0.1% Pacific Islander, 18.3% from other races, and 1.7% from two or more races. Hispanic or Latino of any race were 33.2% of the population.
The median income for a household in Haskell was $30,938, and the median income for a family was $35,938. The per capita income for the town was $15,938. About 18.3% of families and 22.3% of the population were below the poverty line, including 28.3% of those under age 18 and 16.3% of those age 65 or over.
Education
Haskell is served by the Haskell Independent School District. The district has one elementary school, one middle school, and one high school. The town is also home to the Haskell County Library, which offers a variety of books, magazines, and other materials.
Conclusion
Haskell, Texas is a small town located in Haskell County, Texas. It is situated in the northwest corner of the state, about 90 miles southeast of Abilene and about 100 miles northwest of Fort Worth. The population of Haskell was 2,731 in the 2010 census, making it the county seat of Haskell County. The economy of Haskell is largely based on agriculture and oil production, and the town is home to several large farms, as well as several oil and gas wells. The racial makeup of the town was 79.3% White, 0.3% African American, 0.2% Native American, 0.2% Asian, 0.1% Pacific Islander, 18.3% from other races, and 1.7% from two or more races. The median income for a household in Haskell was $30,938, and the median income for a family was $35,938. The town is served by the Haskell Independent School District, and is home to the Haskell County Library.
Common Questions
What is Per Capita Income in Haskell?
Per Capita income in Haskell is $48,120.
What is the Median Family Income in Haskell?
Median Family Income in Haskell is $67,465.
What is the Median Household income in Haskell?
Median Household Income in Haskell is $59,333.
What is Income or Wage Gap in Haskell?
Income or Wage Gap in Haskell is 14.8%.
Women in Haskell earn 85.2 cents for every dollar earned by a man.
What is Inequality or Gini Index in Haskell?
Inequality or Gini Index in Haskell is 0.61.
What is the Total Population of Haskell?
Total Population of Haskell is 2,956.
What is the Total Male Population of Haskell?
Total Male Population of Haskell is 1,597.
What is the Total Female Population of Haskell?
Total Female Population of Haskell is 1,359.
What is the Ratio of Males per 100 Females in Haskell?
There are 117.51 Males per 100 Females in Haskell.
What is the Ratio of Females per 100 Males in Haskell?
There are 85.10 Females per 100 Males in Haskell.
What is the Median Population Age in Haskell?
Median Population Age in Haskell is 41.7 Years.
What is the Average Family Size in Haskell
Average Family Size in Haskell is 2.9 People.
What is the Average Household Size in Haskell
Average Household Size in Haskell is 2.5 People.
How Large is the Labor Force in Haskell?
There are 1,352 People in the Labor Forcein in Haskell.
What is the Percentage of People in the Labor Force in Haskell?
52.6% of People are in the Labor Force in Haskell.
What is the Unemployment Rate in Haskell?
Unemployment Rate in Haskell is 8.1%.