Salvadoran vs American Married-Couple Family Poverty
COMPARE
Salvadoran
American
Married-Couple Family Poverty
Married-Couple Family Poverty Comparison
Salvadorans
Americans
6.5%
MARRIED-COUPLE FAMILY POVERTY
0.0/ 100
METRIC RATING
288th/ 347
METRIC RANK
5.3%
MARRIED-COUPLE FAMILY POVERTY
35.4/ 100
METRIC RATING
185th/ 347
METRIC RANK
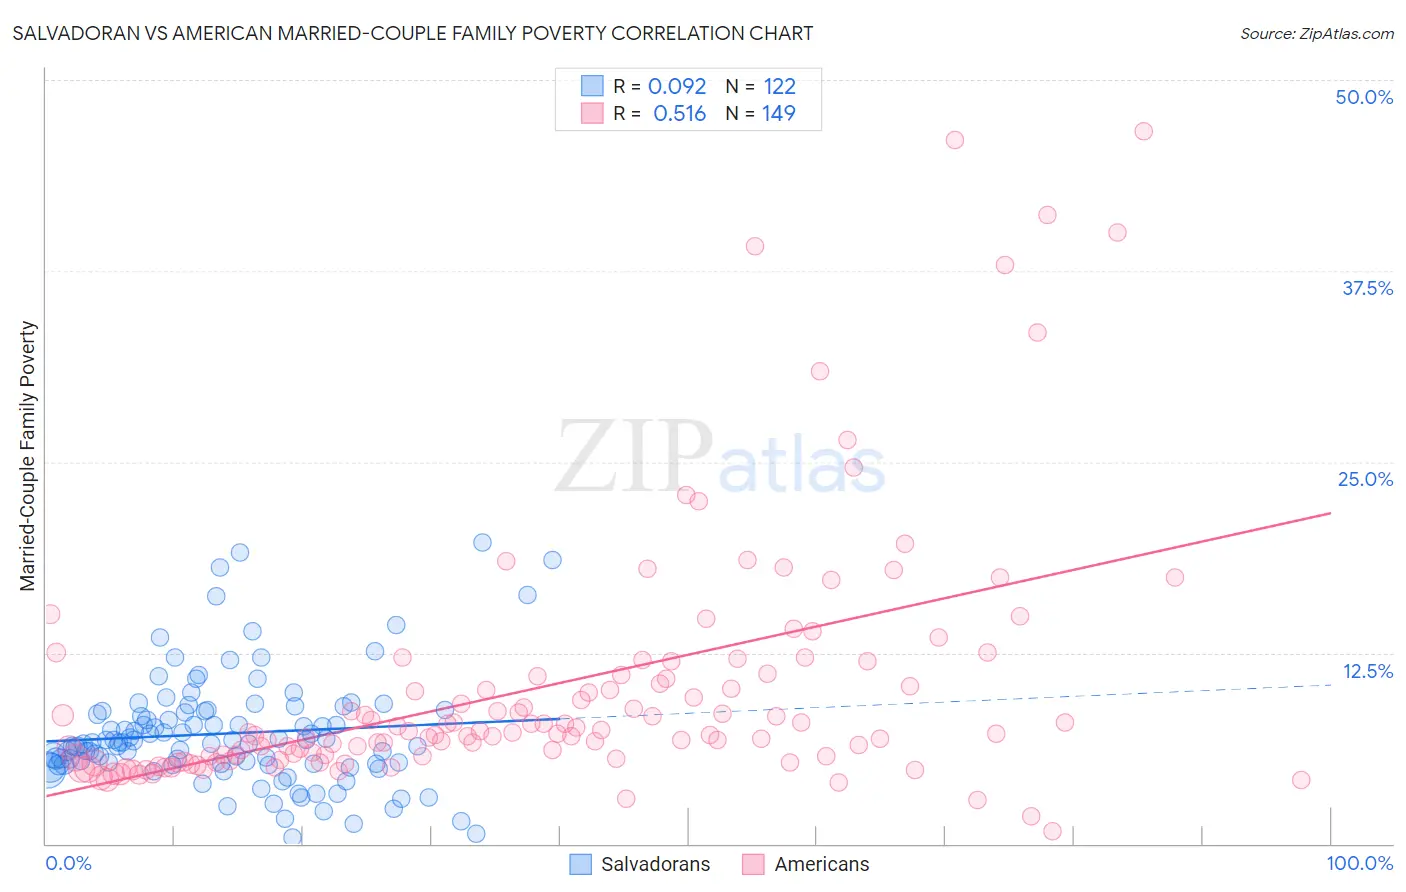
Salvadoran vs American Married-Couple Family Poverty Correlation Chart
The statistical analysis conducted on geographies consisting of 395,885,602 people shows a slight positive correlation between the proportion of Salvadorans and poverty level among married-couple families in the United States with a correlation coefficient (R) of 0.092 and weighted average of 6.5%. Similarly, the statistical analysis conducted on geographies consisting of 565,642,626 people shows a substantial positive correlation between the proportion of Americans and poverty level among married-couple families in the United States with a correlation coefficient (R) of 0.516 and weighted average of 5.3%, a difference of 22.8%.
Married-Couple Family Poverty Correlation Summary
| Measurement | Salvadoran | American |
| Minimum | 0.40% | 0.81% |
| Maximum | 19.7% | 46.7% |
| Range | 19.3% | 45.9% |
| Mean | 7.2% | 10.2% |
| Median | 6.6% | 7.2% |
| Interquartile 25% (IQ1) | 5.3% | 5.6% |
| Interquartile 75% (IQ3) | 8.7% | 11.0% |
| Interquartile Range (IQR) | 3.4% | 5.4% |
| Standard Deviation (Sample) | 3.6% | 8.4% |
| Standard Deviation (Population) | 3.6% | 8.3% |
Similar Demographics by Married-Couple Family Poverty
Demographics Similar to Salvadorans by Married-Couple Family Poverty
In terms of married-couple family poverty, the demographic groups most similar to Salvadorans are Nepalese (6.5%, a difference of 0.17%), Ecuadorian (6.5%, a difference of 0.19%), Immigrants from Barbados (6.5%, a difference of 0.40%), Belizean (6.5%, a difference of 0.44%), and Guyanese (6.5%, a difference of 0.56%).
| Demographics | Rating | Rank | Married-Couple Family Poverty |
| Mexican American Indians | 0.0 /100 | #281 | Tragic 6.4% |
| Seminole | 0.0 /100 | #282 | Tragic 6.4% |
| Ute | 0.0 /100 | #283 | Tragic 6.4% |
| Dutch West Indians | 0.0 /100 | #284 | Tragic 6.4% |
| Blacks/African Americans | 0.0 /100 | #285 | Tragic 6.5% |
| Guyanese | 0.0 /100 | #286 | Tragic 6.5% |
| Ecuadorians | 0.0 /100 | #287 | Tragic 6.5% |
| Salvadorans | 0.0 /100 | #288 | Tragic 6.5% |
| Nepalese | 0.0 /100 | #289 | Tragic 6.5% |
| Immigrants | Barbados | 0.0 /100 | #290 | Tragic 6.5% |
| Belizeans | 0.0 /100 | #291 | Tragic 6.5% |
| Immigrants | Lebanon | 0.0 /100 | #292 | Tragic 6.6% |
| Arapaho | 0.0 /100 | #293 | Tragic 6.6% |
| Bahamians | 0.0 /100 | #294 | Tragic 6.6% |
| Immigrants | Uzbekistan | 0.0 /100 | #295 | Tragic 6.6% |
Demographics Similar to Americans by Married-Couple Family Poverty
In terms of married-couple family poverty, the demographic groups most similar to Americans are Nonimmigrants (5.3%, a difference of 0.060%), Hungarian (5.3%, a difference of 0.080%), Immigrants from Albania (5.3%, a difference of 0.19%), Peruvian (5.3%, a difference of 0.28%), and Israeli (5.3%, a difference of 0.28%).
| Demographics | Rating | Rank | Married-Couple Family Poverty |
| Immigrants | Ukraine | 44.9 /100 | #178 | Average 5.2% |
| Spanish | 41.4 /100 | #179 | Average 5.3% |
| Immigrants | Sierra Leone | 39.3 /100 | #180 | Fair 5.3% |
| Immigrants | Chile | 38.8 /100 | #181 | Fair 5.3% |
| Immigrants | Vietnam | 37.7 /100 | #182 | Fair 5.3% |
| Peruvians | 37.6 /100 | #183 | Fair 5.3% |
| Immigrants | Nonimmigrants | 35.8 /100 | #184 | Fair 5.3% |
| Americans | 35.4 /100 | #185 | Fair 5.3% |
| Hungarians | 34.7 /100 | #186 | Fair 5.3% |
| Immigrants | Albania | 33.8 /100 | #187 | Fair 5.3% |
| Israelis | 33.1 /100 | #188 | Fair 5.3% |
| South American Indians | 32.5 /100 | #189 | Fair 5.3% |
| Ugandans | 31.6 /100 | #190 | Fair 5.3% |
| Immigrants | Cabo Verde | 30.9 /100 | #191 | Fair 5.3% |
| Cape Verdeans | 30.7 /100 | #192 | Fair 5.3% |