Salvadoran vs Immigrants from Senegal Married-Couple Family Poverty
COMPARE
Salvadoran
Immigrants from Senegal
Married-Couple Family Poverty
Married-Couple Family Poverty Comparison
Salvadorans
Immigrants from Senegal
6.5%
MARRIED-COUPLE FAMILY POVERTY
0.0/ 100
METRIC RATING
288th/ 347
METRIC RANK
6.1%
MARRIED-COUPLE FAMILY POVERTY
0.3/ 100
METRIC RATING
263rd/ 347
METRIC RANK
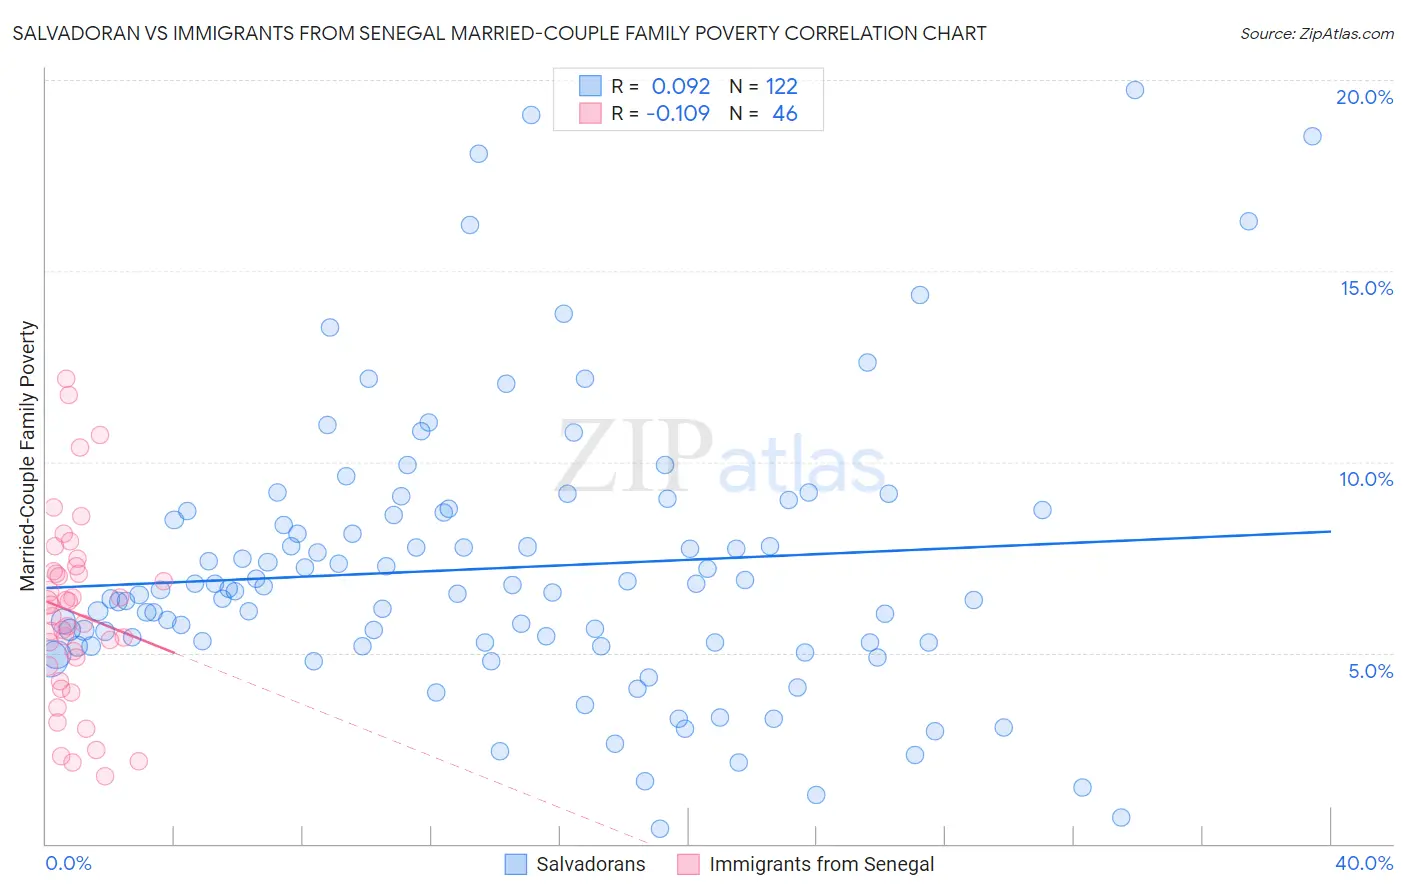
Salvadoran vs Immigrants from Senegal Married-Couple Family Poverty Correlation Chart
The statistical analysis conducted on geographies consisting of 395,885,602 people shows a slight positive correlation between the proportion of Salvadorans and poverty level among married-couple families in the United States with a correlation coefficient (R) of 0.092 and weighted average of 6.5%. Similarly, the statistical analysis conducted on geographies consisting of 89,915,851 people shows a poor negative correlation between the proportion of Immigrants from Senegal and poverty level among married-couple families in the United States with a correlation coefficient (R) of -0.109 and weighted average of 6.1%, a difference of 6.4%.
Married-Couple Family Poverty Correlation Summary
| Measurement | Salvadoran | Immigrants from Senegal |
| Minimum | 0.40% | 1.8% |
| Maximum | 19.7% | 12.2% |
| Range | 19.3% | 10.4% |
| Mean | 7.2% | 6.1% |
| Median | 6.6% | 6.1% |
| Interquartile 25% (IQ1) | 5.3% | 4.7% |
| Interquartile 75% (IQ3) | 8.7% | 7.1% |
| Interquartile Range (IQR) | 3.4% | 2.5% |
| Standard Deviation (Sample) | 3.6% | 2.4% |
| Standard Deviation (Population) | 3.6% | 2.4% |
Similar Demographics by Married-Couple Family Poverty
Demographics Similar to Salvadorans by Married-Couple Family Poverty
In terms of married-couple family poverty, the demographic groups most similar to Salvadorans are Nepalese (6.5%, a difference of 0.17%), Ecuadorian (6.5%, a difference of 0.19%), Immigrants from Barbados (6.5%, a difference of 0.40%), Belizean (6.5%, a difference of 0.44%), and Guyanese (6.5%, a difference of 0.56%).
| Demographics | Rating | Rank | Married-Couple Family Poverty |
| Mexican American Indians | 0.0 /100 | #281 | Tragic 6.4% |
| Seminole | 0.0 /100 | #282 | Tragic 6.4% |
| Ute | 0.0 /100 | #283 | Tragic 6.4% |
| Dutch West Indians | 0.0 /100 | #284 | Tragic 6.4% |
| Blacks/African Americans | 0.0 /100 | #285 | Tragic 6.5% |
| Guyanese | 0.0 /100 | #286 | Tragic 6.5% |
| Ecuadorians | 0.0 /100 | #287 | Tragic 6.5% |
| Salvadorans | 0.0 /100 | #288 | Tragic 6.5% |
| Nepalese | 0.0 /100 | #289 | Tragic 6.5% |
| Immigrants | Barbados | 0.0 /100 | #290 | Tragic 6.5% |
| Belizeans | 0.0 /100 | #291 | Tragic 6.5% |
| Immigrants | Lebanon | 0.0 /100 | #292 | Tragic 6.6% |
| Arapaho | 0.0 /100 | #293 | Tragic 6.6% |
| Bahamians | 0.0 /100 | #294 | Tragic 6.6% |
| Immigrants | Uzbekistan | 0.0 /100 | #295 | Tragic 6.6% |
Demographics Similar to Immigrants from Senegal by Married-Couple Family Poverty
In terms of married-couple family poverty, the demographic groups most similar to Immigrants from Senegal are Immigrants from Congo (6.1%, a difference of 0.22%), Shoshone (6.1%, a difference of 0.39%), Senegalese (6.1%, a difference of 0.60%), Blackfeet (6.2%, a difference of 0.66%), and Creek (6.2%, a difference of 0.73%).
| Demographics | Rating | Rank | Married-Couple Family Poverty |
| Bangladeshis | 0.5 /100 | #256 | Tragic 6.0% |
| Immigrants | Burma/Myanmar | 0.5 /100 | #257 | Tragic 6.0% |
| Immigrants | Immigrants | 0.5 /100 | #258 | Tragic 6.0% |
| Alaskan Athabascans | 0.4 /100 | #259 | Tragic 6.1% |
| Jamaicans | 0.3 /100 | #260 | Tragic 6.1% |
| Senegalese | 0.3 /100 | #261 | Tragic 6.1% |
| Shoshone | 0.3 /100 | #262 | Tragic 6.1% |
| Immigrants | Senegal | 0.3 /100 | #263 | Tragic 6.1% |
| Immigrants | Congo | 0.2 /100 | #264 | Tragic 6.1% |
| Blackfeet | 0.2 /100 | #265 | Tragic 6.2% |
| Creek | 0.2 /100 | #266 | Tragic 6.2% |
| Spanish Americans | 0.2 /100 | #267 | Tragic 6.2% |
| Alaska Natives | 0.2 /100 | #268 | Tragic 6.2% |
| Immigrants | West Indies | 0.1 /100 | #269 | Tragic 6.2% |
| Immigrants | Jamaica | 0.1 /100 | #270 | Tragic 6.2% |