Salvadoran vs Sri Lankan Married-Couple Family Poverty
COMPARE
Salvadoran
Sri Lankan
Married-Couple Family Poverty
Married-Couple Family Poverty Comparison
Salvadorans
Sri Lankans
6.5%
MARRIED-COUPLE FAMILY POVERTY
0.0/ 100
METRIC RATING
288th/ 347
METRIC RANK
5.1%
MARRIED-COUPLE FAMILY POVERTY
72.2/ 100
METRIC RATING
156th/ 347
METRIC RANK
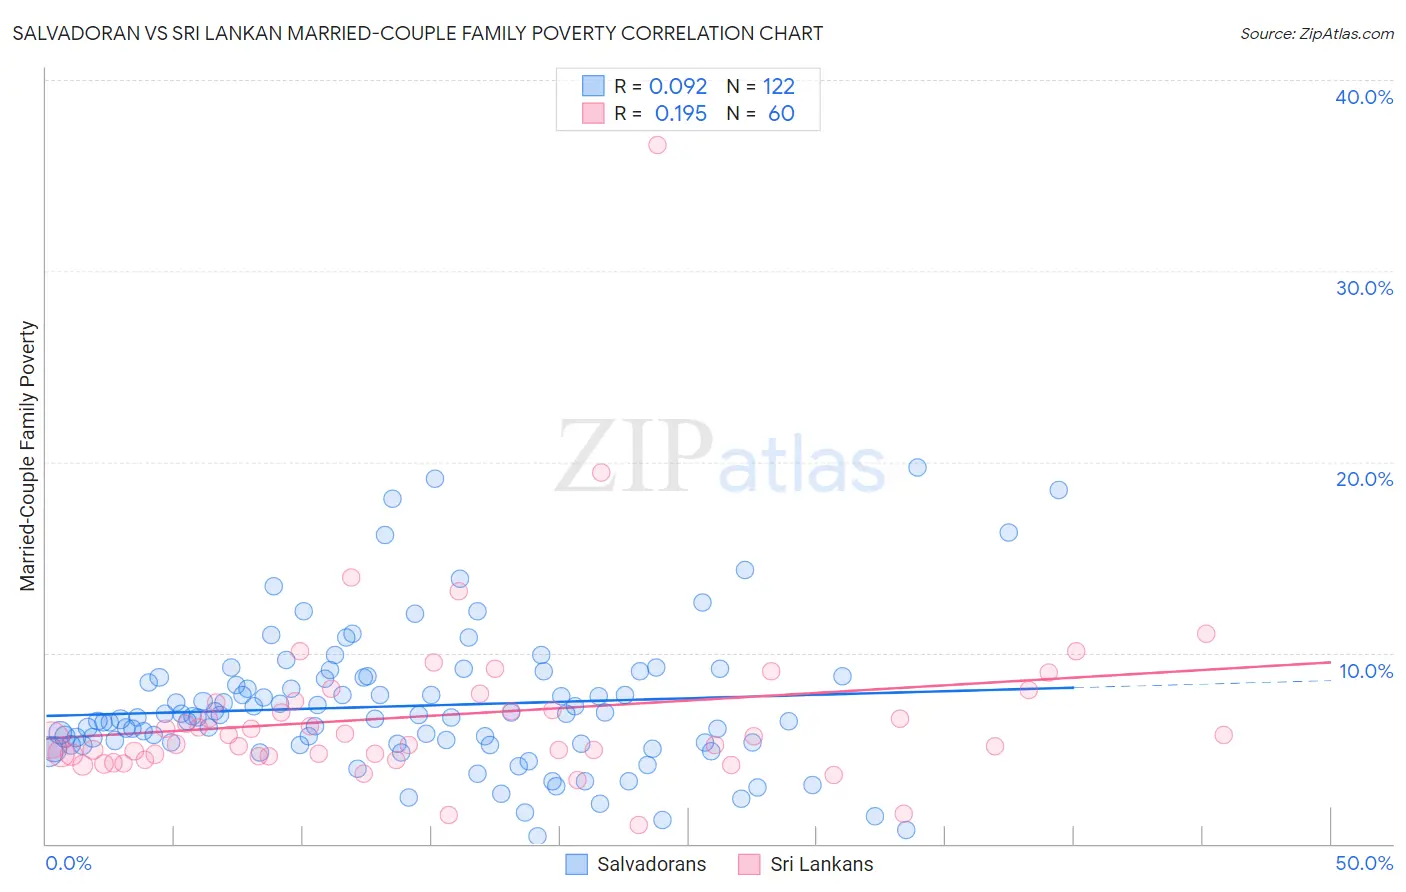
Salvadoran vs Sri Lankan Married-Couple Family Poverty Correlation Chart
The statistical analysis conducted on geographies consisting of 395,885,602 people shows a slight positive correlation between the proportion of Salvadorans and poverty level among married-couple families in the United States with a correlation coefficient (R) of 0.092 and weighted average of 6.5%. Similarly, the statistical analysis conducted on geographies consisting of 436,204,277 people shows a poor positive correlation between the proportion of Sri Lankans and poverty level among married-couple families in the United States with a correlation coefficient (R) of 0.195 and weighted average of 5.1%, a difference of 28.5%.
Married-Couple Family Poverty Correlation Summary
| Measurement | Salvadoran | Sri Lankan |
| Minimum | 0.40% | 0.96% |
| Maximum | 19.7% | 36.6% |
| Range | 19.3% | 35.6% |
| Mean | 7.2% | 6.8% |
| Median | 6.6% | 5.5% |
| Interquartile 25% (IQ1) | 5.3% | 4.6% |
| Interquartile 75% (IQ3) | 8.7% | 7.4% |
| Interquartile Range (IQR) | 3.4% | 2.8% |
| Standard Deviation (Sample) | 3.6% | 4.9% |
| Standard Deviation (Population) | 3.6% | 4.9% |
Similar Demographics by Married-Couple Family Poverty
Demographics Similar to Salvadorans by Married-Couple Family Poverty
In terms of married-couple family poverty, the demographic groups most similar to Salvadorans are Nepalese (6.5%, a difference of 0.17%), Ecuadorian (6.5%, a difference of 0.19%), Immigrants from Barbados (6.5%, a difference of 0.40%), Belizean (6.5%, a difference of 0.44%), and Guyanese (6.5%, a difference of 0.56%).
| Demographics | Rating | Rank | Married-Couple Family Poverty |
| Mexican American Indians | 0.0 /100 | #281 | Tragic 6.4% |
| Seminole | 0.0 /100 | #282 | Tragic 6.4% |
| Ute | 0.0 /100 | #283 | Tragic 6.4% |
| Dutch West Indians | 0.0 /100 | #284 | Tragic 6.4% |
| Blacks/African Americans | 0.0 /100 | #285 | Tragic 6.5% |
| Guyanese | 0.0 /100 | #286 | Tragic 6.5% |
| Ecuadorians | 0.0 /100 | #287 | Tragic 6.5% |
| Salvadorans | 0.0 /100 | #288 | Tragic 6.5% |
| Nepalese | 0.0 /100 | #289 | Tragic 6.5% |
| Immigrants | Barbados | 0.0 /100 | #290 | Tragic 6.5% |
| Belizeans | 0.0 /100 | #291 | Tragic 6.5% |
| Immigrants | Lebanon | 0.0 /100 | #292 | Tragic 6.6% |
| Arapaho | 0.0 /100 | #293 | Tragic 6.6% |
| Bahamians | 0.0 /100 | #294 | Tragic 6.6% |
| Immigrants | Uzbekistan | 0.0 /100 | #295 | Tragic 6.6% |
Demographics Similar to Sri Lankans by Married-Couple Family Poverty
In terms of married-couple family poverty, the demographic groups most similar to Sri Lankans are Immigrants from Ethiopia (5.1%, a difference of 0.040%), Argentinean (5.1%, a difference of 0.22%), Delaware (5.1%, a difference of 0.23%), Immigrants from South Eastern Asia (5.1%, a difference of 0.27%), and Immigrants from Saudi Arabia (5.1%, a difference of 0.27%).
| Demographics | Rating | Rank | Married-Couple Family Poverty |
| Immigrants | Oceania | 78.6 /100 | #149 | Good 5.0% |
| Brazilians | 78.3 /100 | #150 | Good 5.0% |
| Immigrants | Cameroon | 77.3 /100 | #151 | Good 5.0% |
| Albanians | 77.2 /100 | #152 | Good 5.0% |
| Immigrants | Kuwait | 76.3 /100 | #153 | Good 5.0% |
| Delaware | 73.7 /100 | #154 | Good 5.1% |
| Immigrants | Ethiopia | 72.4 /100 | #155 | Good 5.1% |
| Sri Lankans | 72.2 /100 | #156 | Good 5.1% |
| Argentineans | 70.7 /100 | #157 | Good 5.1% |
| Immigrants | South Eastern Asia | 70.4 /100 | #158 | Good 5.1% |
| Immigrants | Saudi Arabia | 70.3 /100 | #159 | Good 5.1% |
| Pennsylvania Germans | 68.5 /100 | #160 | Good 5.1% |
| Ethiopians | 68.1 /100 | #161 | Good 5.1% |
| Immigrants | Jordan | 66.5 /100 | #162 | Good 5.1% |
| Sierra Leoneans | 64.1 /100 | #163 | Good 5.1% |