Pennsylvania German Disability Age 5 to 17
COMPARE
Pennsylvania German
Select to Compare
Disability Age 5 to 17
Pennsylvania German Disability Age 5 to 17
6.6%
DISABILITY | AGE 5 TO 17
0.0/ 100
METRIC RATING
328th/ 347
METRIC RANK
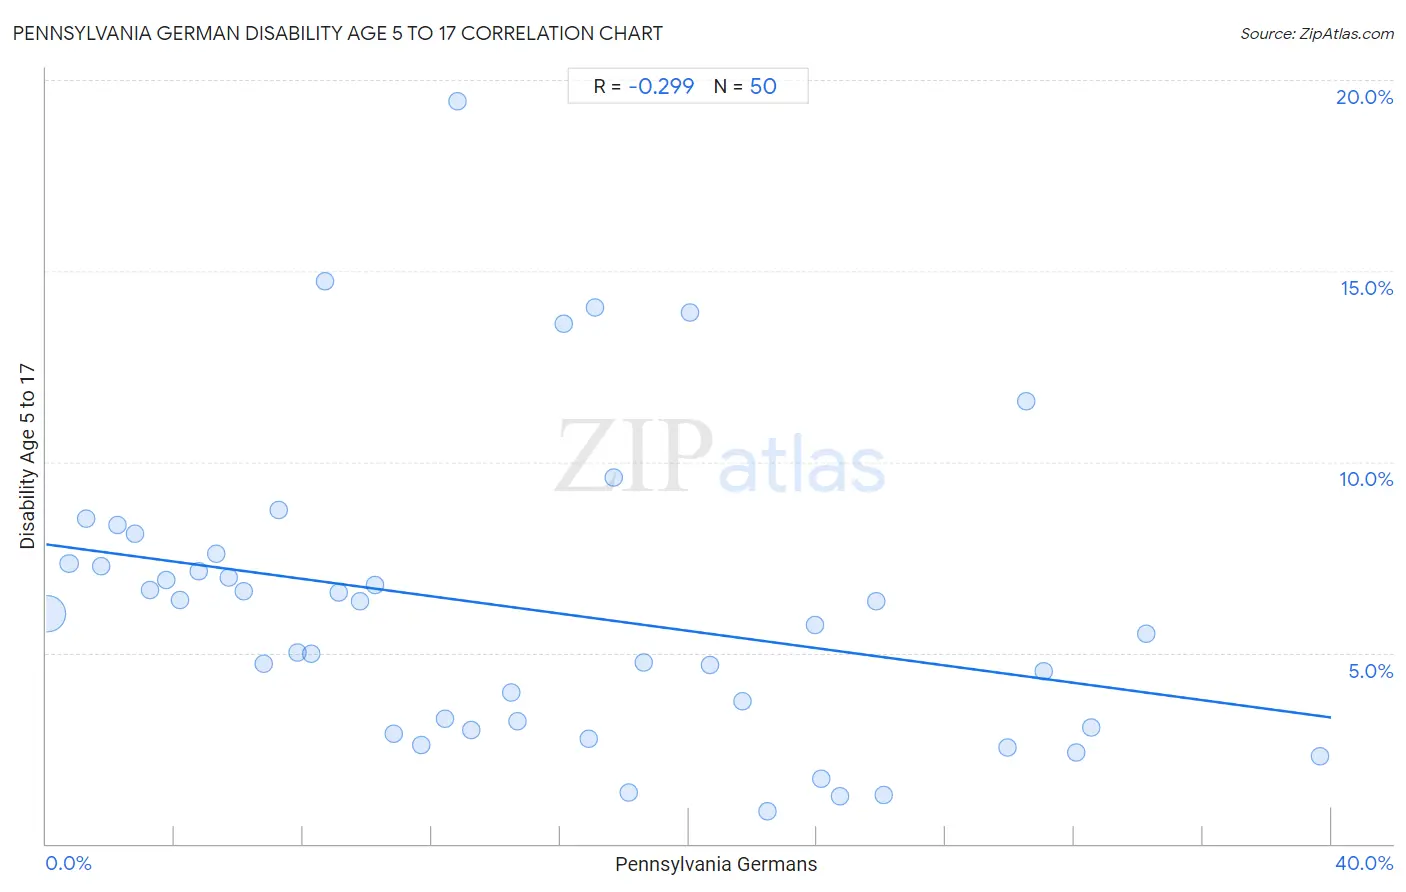
Pennsylvania German Disability Age 5 to 17 Correlation Chart
The statistical analysis conducted on geographies consisting of 232,166,833 people shows a weak negative correlation between the proportion of Pennsylvania Germans and percentage of population with a disability between the ages 5 and 17 in the United States with a correlation coefficient (R) of -0.299 and weighted average of 6.6%. On average, for every 1% (one percent) increase in Pennsylvania Germans within a typical geography, there is a decrease of 0.11% in percentage of population with a disability between the ages 5 and 17.
It is essential to understand that the correlation between the percentage of Pennsylvania Germans and percentage of population with a disability between the ages 5 and 17 does not imply a direct cause-and-effect relationship. It remains uncertain whether the presence of Pennsylvania Germans influences an upward or downward trend in the level of percentage of population with a disability between the ages 5 and 17 within an area, or if Pennsylvania Germans simply ended up residing in those areas with higher or lower levels of percentage of population with a disability between the ages 5 and 17 due to other factors.
Demographics Similar to Pennsylvania Germans by Disability Age 5 to 17
In terms of disability age 5 to 17, the demographic groups most similar to Pennsylvania Germans are Blackfeet (6.6%, a difference of 0.17%), French American Indian (6.6%, a difference of 0.23%), Potawatomi (6.5%, a difference of 0.67%), American (6.5%, a difference of 0.81%), and Dominican (6.5%, a difference of 0.86%).
| Demographics | Rating | Rank | Disability Age 5 to 17 |
| Tohono O'odham | 0.0 /100 | #321 | Tragic 6.5% |
| Slovaks | 0.0 /100 | #322 | Tragic 6.5% |
| Osage | 0.0 /100 | #323 | Tragic 6.5% |
| Dominicans | 0.0 /100 | #324 | Tragic 6.5% |
| Americans | 0.0 /100 | #325 | Tragic 6.5% |
| Potawatomi | 0.0 /100 | #326 | Tragic 6.5% |
| French American Indians | 0.0 /100 | #327 | Tragic 6.6% |
| Pennsylvania Germans | 0.0 /100 | #328 | Tragic 6.6% |
| Blackfeet | 0.0 /100 | #329 | Tragic 6.6% |
| Dutch West Indians | 0.0 /100 | #330 | Tragic 6.7% |
| French Canadians | 0.0 /100 | #331 | Tragic 6.7% |
| Immigrants from the Azores | 0.0 /100 | #332 | Tragic 6.7% |
| Blacks/African Americans | 0.0 /100 | #333 | Tragic 6.8% |
| Seminole | 0.0 /100 | #334 | Tragic 6.8% |
| Ottawa | 0.0 /100 | #335 | Tragic 6.8% |
Pennsylvania German Disability Age 5 to 17 Correlation Summary
| Measurement | Pennsylvania German Data | Disability Age 5 to 17 Data |
| Minimum | 0.057% | 0.86% |
| Maximum | 39.7% | 19.5% |
| Range | 39.6% | 18.6% |
| Mean | 14.9% | 6.2% |
| Median | 13.0% | 5.9% |
| Interquartile 25% (IQ1) | 6.1% | 3.1% |
| Interquartile 75% (IQ3) | 22.4% | 7.3% |
| Interquartile Range (IQR) | 16.3% | 4.3% |
| Standard Deviation (Sample) | 10.3% | 3.9% |
| Standard Deviation (Population) | 10.2% | 3.9% |
Correlation Details
| Pennsylvania German Percentile | Sample Size | Disability Age 5 to 17 |
[ 0.0% - 0.5% ] 0.057% | 220,880,404 | 6.0% |
[ 0.5% - 1.0% ] 0.72% | 5,251,786 | 7.3% |
[ 1.0% - 1.5% ] 1.23% | 1,997,702 | 8.5% |
[ 1.5% - 2.0% ] 1.72% | 1,305,026 | 7.3% |
[ 2.0% - 2.5% ] 2.22% | 644,573 | 8.3% |
[ 2.5% - 3.0% ] 2.76% | 457,362 | 8.1% |
[ 3.0% - 3.5% ] 3.22% | 343,019 | 6.6% |
[ 3.5% - 4.0% ] 3.73% | 227,689 | 6.9% |
[ 4.0% - 4.5% ] 4.15% | 259,370 | 6.4% |
[ 4.5% - 5.0% ] 4.75% | 159,781 | 7.1% |
[ 5.0% - 5.5% ] 5.29% | 106,032 | 7.6% |
[ 5.5% - 6.0% ] 5.67% | 74,385 | 7.0% |
[ 6.0% - 6.5% ] 6.14% | 46,229 | 6.6% |
[ 6.5% - 7.0% ] 6.77% | 95,883 | 4.7% |
[ 7.0% - 7.5% ] 7.24% | 24,466 | 8.8% |
[ 7.5% - 8.0% ] 7.83% | 13,698 | 5.0% |
[ 8.0% - 8.5% ] 8.26% | 50,074 | 5.0% |
[ 8.5% - 9.0% ] 8.66% | 36,800 | 14.7% |
[ 9.0% - 9.5% ] 9.12% | 4,486 | 6.6% |
[ 9.5% - 10.0% ] 9.76% | 12,474 | 6.3% |
[ 10.0% - 10.5% ] 10.25% | 19,387 | 6.8% |
[ 10.5% - 11.0% ] 10.81% | 34,227 | 2.9% |
[ 11.5% - 12.0% ] 11.68% | 22,779 | 2.6% |
[ 12.0% - 12.5% ] 12.39% | 13,441 | 3.3% |
[ 12.5% - 13.0% ] 12.81% | 281 | 19.5% |
[ 13.0% - 13.5% ] 13.23% | 11,382 | 3.0% |
[ 14.0% - 14.5% ] 14.48% | 3,688 | 4.0% |
[ 14.5% - 15.0% ] 14.68% | 6,594 | 3.2% |
[ 16.0% - 16.5% ] 16.11% | 1,130 | 13.6% |
[ 16.5% - 17.0% ] 16.90% | 10,985 | 2.8% |
[ 17.0% - 17.5% ] 17.07% | 1,593 | 14.0% |
[ 17.5% - 18.0% ] 17.65% | 663 | 9.6% |
[ 18.0% - 18.5% ] 18.13% | 6,917 | 1.3% |
[ 18.5% - 19.0% ] 18.61% | 704 | 4.8% |
[ 20.0% - 20.5% ] 20.03% | 1,398 | 13.9% |
[ 20.5% - 21.0% ] 20.66% | 847 | 4.7% |
[ 21.5% - 22.0% ] 21.69% | 4,699 | 3.7% |
[ 22.0% - 22.5% ] 22.45% | 3,145 | 0.86% |
[ 23.5% - 24.0% ] 23.92% | 1,522 | 5.7% |
[ 24.0% - 24.5% ] 24.12% | 2,156 | 1.7% |
[ 24.5% - 25.0% ] 24.71% | 3,419 | 1.3% |
[ 25.5% - 26.0% ] 25.83% | 302 | 6.3% |
[ 26.0% - 26.5% ] 26.07% | 560 | 1.3% |
[ 29.5% - 30.0% ] 29.92% | 1,514 | 2.5% |
[ 30.5% - 31.0% ] 30.50% | 318 | 11.6% |
[ 31.0% - 31.5% ] 31.04% | 1,034 | 4.5% |
[ 32.0% - 32.5% ] 32.06% | 499 | 2.4% |
[ 32.5% - 33.0% ] 32.54% | 16,090 | 3.1% |
[ 34.0% - 34.5% ] 34.24% | 2,030 | 5.5% |
[ 39.5% - 40.0% ] 39.65% | 2,290 | 2.3% |