Pennsylvania German College, Under 1 year
COMPARE
Pennsylvania German
Select to Compare
College, Under 1 year
Pennsylvania German College, Under 1 year
54.5%
COLLEGE, UNDER 1 YEAR
0.0/ 100
METRIC RATING
336th/ 347
METRIC RANK
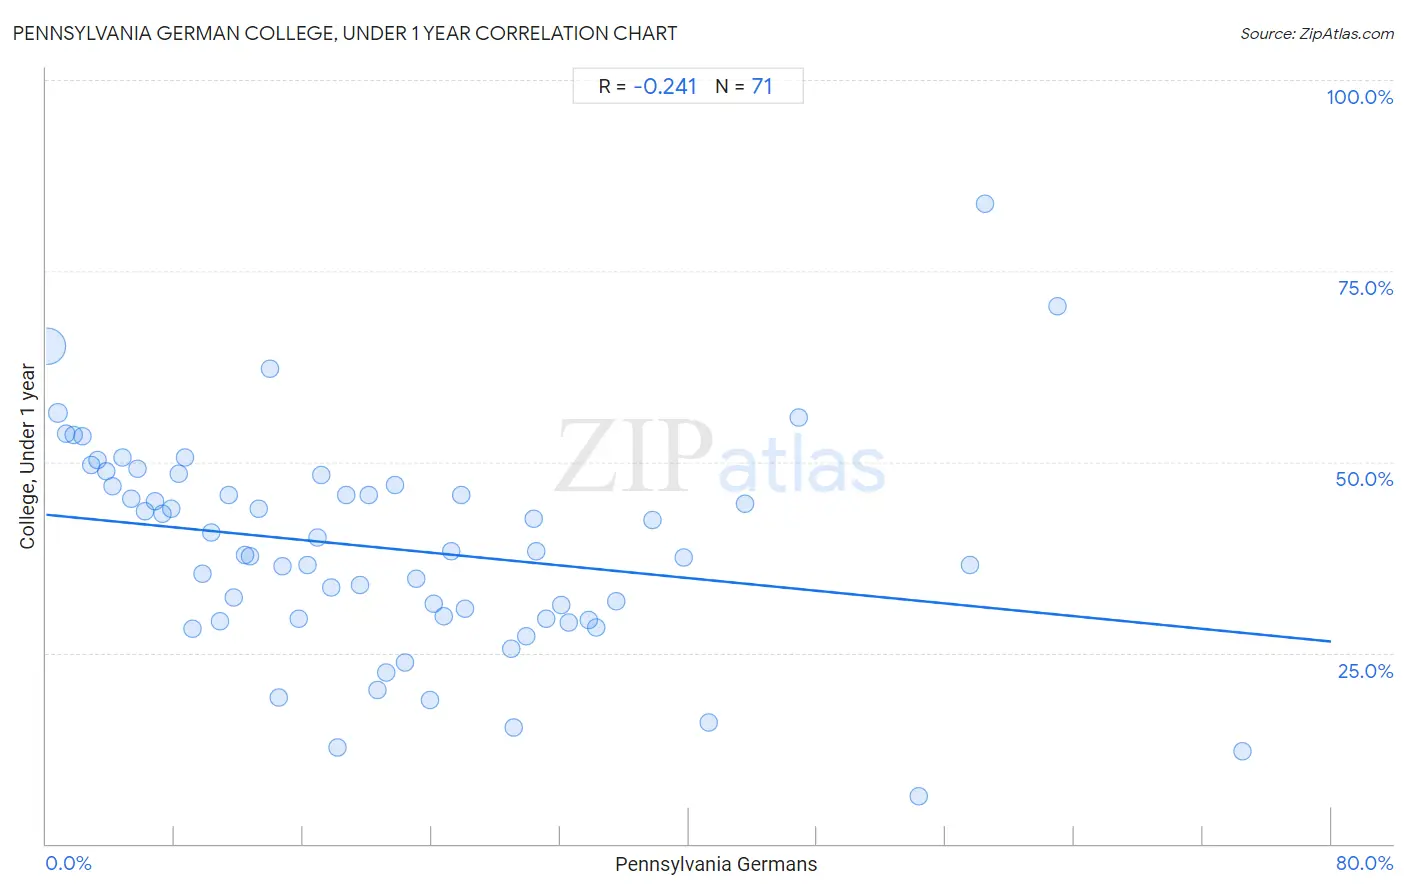
Pennsylvania German College, Under 1 year Correlation Chart
The statistical analysis conducted on geographies consisting of 234,102,446 people shows a weak negative correlation between the proportion of Pennsylvania Germans and percentage of population with at least college, under 1 year education in the United States with a correlation coefficient (R) of -0.241 and weighted average of 54.5%. On average, for every 1% (one percent) increase in Pennsylvania Germans within a typical geography, there is a decrease of 0.21% in percentage of population with at least college, under 1 year education.
It is essential to understand that the correlation between the percentage of Pennsylvania Germans and percentage of population with at least college, under 1 year education does not imply a direct cause-and-effect relationship. It remains uncertain whether the presence of Pennsylvania Germans influences an upward or downward trend in the level of percentage of population with at least college, under 1 year education within an area, or if Pennsylvania Germans simply ended up residing in those areas with higher or lower levels of percentage of population with at least college, under 1 year education due to other factors.
Demographics Similar to Pennsylvania Germans by College, Under 1 year
In terms of college, under 1 year, the demographic groups most similar to Pennsylvania Germans are Immigrants from Central America (54.4%, a difference of 0.15%), Inupiat (54.6%, a difference of 0.17%), Immigrants from the Azores (54.7%, a difference of 0.30%), Lumbee (54.2%, a difference of 0.56%), and Immigrants from Dominican Republic (54.0%, a difference of 0.96%).
| Demographics | Rating | Rank | College, Under 1 year |
| Immigrants from Cuba | 0.0 /100 | #329 | Tragic 55.7% |
| Mexicans | 0.0 /100 | #330 | Tragic 55.6% |
| Dominicans | 0.0 /100 | #331 | Tragic 55.5% |
| Immigrants from Yemen | 0.0 /100 | #332 | Tragic 55.3% |
| Yuman | 0.0 /100 | #333 | Tragic 55.1% |
| Immigrants from the Azores | 0.0 /100 | #334 | Tragic 54.7% |
| Inupiat | 0.0 /100 | #335 | Tragic 54.6% |
| Pennsylvania Germans | 0.0 /100 | #336 | Tragic 54.5% |
| Immigrants from Central America | 0.0 /100 | #337 | Tragic 54.4% |
| Lumbee | 0.0 /100 | #338 | Tragic 54.2% |
| Immigrants from Dominican Republic | 0.0 /100 | #339 | Tragic 54.0% |
| Spanish American Indians | 0.0 /100 | #340 | Tragic 54.0% |
| Immigrants from Cabo Verde | 0.0 /100 | #341 | Tragic 53.7% |
| Immigrants from Mexico | 0.0 /100 | #342 | Tragic 53.7% |
| Tohono O'odham | 0.0 /100 | #343 | Tragic 52.8% |
Pennsylvania German College, Under 1 year Correlation Summary
| Measurement | Pennsylvania German Data | College, Under 1 year Data |
| Minimum | 0.058% | 6.2% |
| Maximum | 74.5% | 83.9% |
| Range | 74.4% | 77.6% |
| Mean | 21.2% | 38.7% |
| Median | 18.1% | 38.2% |
| Interquartile 25% (IQ1) | 8.7% | 29.4% |
| Interquartile 75% (IQ3) | 30.4% | 46.9% |
| Interquartile Range (IQR) | 21.7% | 17.5% |
| Standard Deviation (Sample) | 16.1% | 13.9% |
| Standard Deviation (Population) | 16.0% | 13.8% |
Correlation Details
| Pennsylvania German Percentile | Sample Size | College, Under 1 year |
[ 0.0% - 0.5% ] 0.058% | 222,154,919 | 65.2% |
[ 0.5% - 1.0% ] 0.72% | 5,488,372 | 56.4% |
[ 1.0% - 1.5% ] 1.23% | 2,116,944 | 53.8% |
[ 1.5% - 2.0% ] 1.72% | 1,379,822 | 53.6% |
[ 2.0% - 2.5% ] 2.22% | 670,299 | 53.4% |
[ 2.5% - 3.0% ] 2.76% | 487,154 | 49.6% |
[ 3.0% - 3.5% ] 3.23% | 363,928 | 50.2% |
[ 3.5% - 4.0% ] 3.74% | 239,229 | 48.7% |
[ 4.0% - 4.5% ] 4.15% | 269,222 | 46.8% |
[ 4.5% - 5.0% ] 4.75% | 174,550 | 50.6% |
[ 5.0% - 5.5% ] 5.28% | 114,012 | 45.2% |
[ 5.5% - 6.0% ] 5.67% | 83,739 | 49.1% |
[ 6.0% - 6.5% ] 6.14% | 60,248 | 43.6% |
[ 6.5% - 7.0% ] 6.75% | 104,521 | 44.8% |
[ 7.0% - 7.5% ] 7.25% | 27,414 | 43.2% |
[ 7.5% - 8.0% ] 7.81% | 23,099 | 43.9% |
[ 8.0% - 8.5% ] 8.26% | 52,911 | 48.4% |
[ 8.5% - 9.0% ] 8.66% | 39,534 | 50.6% |
[ 9.0% - 9.5% ] 9.14% | 16,523 | 28.2% |
[ 9.5% - 10.0% ] 9.74% | 17,973 | 35.3% |
[ 10.0% - 10.5% ] 10.25% | 25,045 | 40.8% |
[ 10.5% - 11.0% ] 10.81% | 35,137 | 29.1% |
[ 11.0% - 11.5% ] 11.38% | 4,629 | 45.6% |
[ 11.5% - 12.0% ] 11.68% | 23,395 | 32.3% |
[ 12.0% - 12.5% ] 12.37% | 19,489 | 37.8% |
[ 12.5% - 13.0% ] 12.70% | 2,221 | 37.6% |
[ 13.0% - 13.5% ] 13.24% | 11,634 | 43.8% |
[ 13.5% - 14.0% ] 13.95% | 803 | 62.2% |
[ 14.0% - 14.5% ] 14.44% | 4,474 | 19.2% |
[ 14.5% - 15.0% ] 14.68% | 6,708 | 36.3% |
[ 15.5% - 16.0% ] 15.68% | 1,524 | 29.4% |
[ 16.0% - 16.5% ] 16.27% | 2,753 | 36.4% |
[ 16.5% - 17.0% ] 16.89% | 11,314 | 40.2% |
[ 17.0% - 17.5% ] 17.14% | 3,658 | 48.2% |
[ 17.5% - 18.0% ] 17.73% | 976 | 33.5% |
[ 18.0% - 18.5% ] 18.13% | 6,917 | 12.7% |
[ 18.5% - 19.0% ] 18.65% | 1,008 | 45.6% |
[ 19.5% - 20.0% ] 19.54% | 1,034 | 33.8% |
[ 20.0% - 20.5% ] 20.06% | 1,899 | 45.6% |
[ 20.5% - 21.0% ] 20.66% | 847 | 20.1% |
[ 21.0% - 21.5% ] 21.17% | 463 | 22.5% |
[ 21.5% - 22.0% ] 21.69% | 4,763 | 46.9% |
[ 22.0% - 22.5% ] 22.31% | 4,576 | 23.8% |
[ 23.0% - 23.5% ] 23.06% | 2,090 | 34.7% |
[ 23.5% - 24.0% ] 23.92% | 1,522 | 18.8% |
[ 24.0% - 24.5% ] 24.12% | 2,156 | 31.4% |
[ 24.5% - 25.0% ] 24.71% | 3,419 | 29.7% |
[ 25.0% - 25.5% ] 25.24% | 5,376 | 38.3% |
[ 25.5% - 26.0% ] 25.83% | 302 | 45.7% |
[ 26.0% - 26.5% ] 26.07% | 560 | 30.7% |
[ 28.5% - 29.0% ] 28.96% | 259 | 25.6% |
[ 29.0% - 29.5% ] 29.09% | 55 | 15.2% |
[ 29.5% - 30.0% ] 29.88% | 1,824 | 27.1% |
[ 30.0% - 30.5% ] 30.38% | 79 | 42.6% |
[ 30.5% - 31.0% ] 30.50% | 318 | 38.2% |
[ 31.0% - 31.5% ] 31.12% | 1,417 | 29.5% |
[ 32.0% - 32.5% ] 32.10% | 539 | 31.3% |
[ 32.5% - 33.0% ] 32.54% | 16,090 | 28.9% |
[ 33.5% - 34.0% ] 33.78% | 370 | 29.3% |
[ 34.0% - 34.5% ] 34.24% | 2,030 | 28.3% |
[ 35.0% - 35.5% ] 35.47% | 406 | 31.8% |
[ 37.5% - 38.0% ] 37.73% | 432 | 42.3% |
[ 39.5% - 40.0% ] 39.65% | 2,290 | 37.4% |
[ 41.0% - 41.5% ] 41.27% | 63 | 15.9% |
[ 43.0% - 43.5% ] 43.48% | 23 | 44.4% |
[ 46.5% - 47.0% ] 46.84% | 316 | 55.9% |
[ 54.0% - 54.5% ] 54.29% | 70 | 6.2% |
[ 57.5% - 58.0% ] 57.53% | 146 | 36.5% |
[ 58.0% - 58.5% ] 58.44% | 450 | 83.9% |
[ 62.5% - 63.0% ] 62.96% | 27 | 70.4% |
[ 74.0% - 74.5% ] 74.45% | 137 | 12.1% |