Pennsylvania German Disability
COMPARE
Pennsylvania German
Select to Compare
Disability
Pennsylvania German Disability
13.2%
DISABILITY
0.0/ 100
METRIC RATING
300th/ 347
METRIC RANK
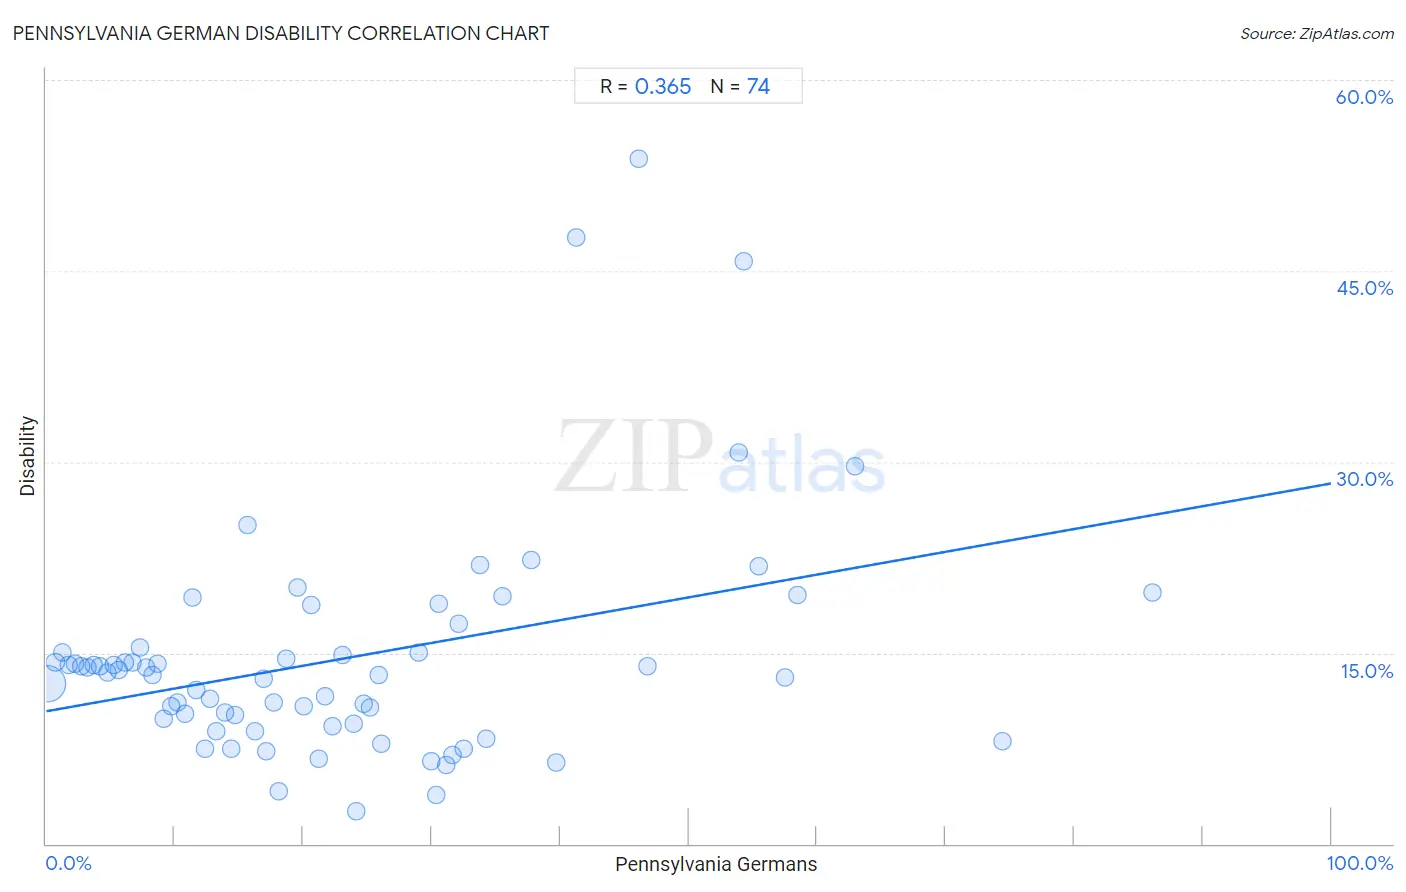
Pennsylvania German Disability Correlation Chart
The statistical analysis conducted on geographies consisting of 234,103,630 people shows a mild positive correlation between the proportion of Pennsylvania Germans and percentage of population with a disability in the United States with a correlation coefficient (R) of 0.365 and weighted average of 13.2%. On average, for every 1% (one percent) increase in Pennsylvania Germans within a typical geography, there is an increase of 0.18% in percentage of population with a disability.
It is essential to understand that the correlation between the percentage of Pennsylvania Germans and percentage of population with a disability does not imply a direct cause-and-effect relationship. It remains uncertain whether the presence of Pennsylvania Germans influences an upward or downward trend in the level of percentage of population with a disability within an area, or if Pennsylvania Germans simply ended up residing in those areas with higher or lower levels of percentage of population with a disability due to other factors.
Demographics Similar to Pennsylvania Germans by Disability
In terms of disability, the demographic groups most similar to Pennsylvania Germans are French (13.2%, a difference of 0.050%), Hopi (13.2%, a difference of 0.070%), Alaska Native (13.2%, a difference of 0.070%), Immigrants from Micronesia (13.2%, a difference of 0.090%), and Central American Indian (13.2%, a difference of 0.13%).
| Demographics | Rating | Rank | Disability |
| Marshallese | 0.0 /100 | #293 | Tragic 13.1% |
| Celtics | 0.0 /100 | #294 | Tragic 13.1% |
| Nonimmigrants | 0.0 /100 | #295 | Tragic 13.2% |
| Central American Indians | 0.0 /100 | #296 | Tragic 13.2% |
| Hopi | 0.0 /100 | #297 | Tragic 13.2% |
| Alaska Natives | 0.0 /100 | #298 | Tragic 13.2% |
| French | 0.0 /100 | #299 | Tragic 13.2% |
| Pennsylvania Germans | 0.0 /100 | #300 | Tragic 13.2% |
| Immigrants from Micronesia | 0.0 /100 | #301 | Tragic 13.2% |
| Arapaho | 0.0 /100 | #302 | Tragic 13.2% |
| Scotch-Irish | 0.0 /100 | #303 | Tragic 13.3% |
| Yakama | 0.0 /100 | #304 | Tragic 13.4% |
| French Canadians | 0.0 /100 | #305 | Tragic 13.4% |
| Cape Verdeans | 0.0 /100 | #306 | Tragic 13.5% |
| Shoshone | 0.0 /100 | #307 | Tragic 13.5% |
Pennsylvania German Disability Correlation Summary
| Measurement | Pennsylvania German Data | Disability Data |
| Minimum | 0.058% | 2.6% |
| Maximum | 86.0% | 53.8% |
| Range | 86.0% | 51.3% |
| Mean | 23.1% | 14.5% |
| Median | 19.1% | 13.4% |
| Interquartile 25% (IQ1) | 9.1% | 9.5% |
| Interquartile 75% (IQ3) | 31.6% | 15.1% |
| Interquartile Range (IQR) | 22.4% | 5.6% |
| Standard Deviation (Sample) | 18.3% | 9.0% |
| Standard Deviation (Population) | 18.2% | 8.9% |
Correlation Details
| Pennsylvania German Percentile | Sample Size | Disability |
[ 0.0% - 0.5% ] 0.058% | 222,159,679 | 12.6% |
[ 0.5% - 1.0% ] 0.72% | 5,488,372 | 14.3% |
[ 1.0% - 1.5% ] 1.23% | 2,116,944 | 15.1% |
[ 1.5% - 2.0% ] 1.72% | 1,377,700 | 14.0% |
[ 2.0% - 2.5% ] 2.22% | 670,299 | 14.2% |
[ 2.5% - 3.0% ] 2.76% | 487,154 | 13.9% |
[ 3.0% - 3.5% ] 3.23% | 363,928 | 13.8% |
[ 3.5% - 4.0% ] 3.74% | 239,229 | 14.0% |
[ 4.0% - 4.5% ] 4.15% | 268,370 | 14.0% |
[ 4.5% - 5.0% ] 4.75% | 174,550 | 13.5% |
[ 5.0% - 5.5% ] 5.28% | 114,012 | 14.0% |
[ 5.5% - 6.0% ] 5.67% | 83,619 | 13.7% |
[ 6.0% - 6.5% ] 6.14% | 60,248 | 14.2% |
[ 6.5% - 7.0% ] 6.75% | 104,521 | 14.3% |
[ 7.0% - 7.5% ] 7.25% | 27,414 | 15.4% |
[ 7.5% - 8.0% ] 7.81% | 23,099 | 13.8% |
[ 8.0% - 8.5% ] 8.26% | 52,911 | 13.3% |
[ 8.5% - 9.0% ] 8.66% | 39,534 | 14.2% |
[ 9.0% - 9.5% ] 9.14% | 16,523 | 9.8% |
[ 9.5% - 10.0% ] 9.74% | 17,973 | 10.8% |
[ 10.0% - 10.5% ] 10.25% | 25,045 | 11.1% |
[ 10.5% - 11.0% ] 10.81% | 35,137 | 10.2% |
[ 11.0% - 11.5% ] 11.38% | 4,629 | 19.4% |
[ 11.5% - 12.0% ] 11.68% | 23,395 | 12.1% |
[ 12.0% - 12.5% ] 12.37% | 19,489 | 7.5% |
[ 12.5% - 13.0% ] 12.70% | 2,221 | 11.4% |
[ 13.0% - 13.5% ] 13.23% | 11,508 | 8.8% |
[ 13.5% - 14.0% ] 13.95% | 803 | 10.3% |
[ 14.0% - 14.5% ] 14.44% | 4,474 | 7.4% |
[ 14.5% - 15.0% ] 14.68% | 6,594 | 10.1% |
[ 15.5% - 16.0% ] 15.68% | 1,524 | 25.1% |
[ 16.0% - 16.5% ] 16.27% | 2,753 | 8.8% |
[ 16.5% - 17.0% ] 16.89% | 11,314 | 13.0% |
[ 17.0% - 17.5% ] 17.14% | 3,559 | 7.2% |
[ 17.5% - 18.0% ] 17.73% | 976 | 11.1% |
[ 18.0% - 18.5% ] 18.13% | 6,917 | 4.1% |
[ 18.5% - 19.0% ] 18.65% | 976 | 14.5% |
[ 19.5% - 20.0% ] 19.54% | 1,034 | 20.1% |
[ 20.0% - 20.5% ] 20.06% | 1,899 | 10.8% |
[ 20.5% - 21.0% ] 20.66% | 847 | 18.8% |
[ 21.0% - 21.5% ] 21.17% | 392 | 6.6% |
[ 21.5% - 22.0% ] 21.69% | 4,763 | 11.6% |
[ 22.0% - 22.5% ] 22.31% | 4,576 | 9.2% |
[ 23.0% - 23.5% ] 23.06% | 2,090 | 14.8% |
[ 23.5% - 24.0% ] 23.92% | 1,522 | 9.5% |
[ 24.0% - 24.5% ] 24.12% | 2,156 | 2.6% |
[ 24.5% - 25.0% ] 24.71% | 3,419 | 11.0% |
[ 25.0% - 25.5% ] 25.24% | 5,376 | 10.7% |
[ 25.5% - 26.0% ] 25.83% | 302 | 13.2% |
[ 26.0% - 26.5% ] 26.07% | 560 | 7.9% |
[ 28.5% - 29.0% ] 28.96% | 259 | 15.1% |
[ 29.5% - 30.0% ] 29.92% | 1,514 | 6.5% |
[ 30.0% - 30.5% ] 30.38% | 79 | 3.8% |
[ 30.5% - 31.0% ] 30.50% | 318 | 18.9% |
[ 31.0% - 31.5% ] 31.12% | 1,417 | 6.2% |
[ 31.5% - 32.0% ] 31.58% | 57 | 7.0% |
[ 32.0% - 32.5% ] 32.10% | 539 | 17.3% |
[ 32.5% - 33.0% ] 32.54% | 16,090 | 7.4% |
[ 33.5% - 34.0% ] 33.78% | 370 | 21.9% |
[ 34.0% - 34.5% ] 34.24% | 2,030 | 8.2% |
[ 35.0% - 35.5% ] 35.47% | 406 | 19.5% |
[ 37.5% - 38.0% ] 37.73% | 432 | 22.3% |
[ 39.5% - 40.0% ] 39.65% | 2,290 | 6.4% |
[ 41.0% - 41.5% ] 41.27% | 63 | 47.6% |
[ 46.0% - 46.5% ] 46.15% | 78 | 53.8% |
[ 46.5% - 47.0% ] 46.84% | 316 | 13.9% |
[ 53.5% - 54.0% ] 53.85% | 26 | 30.8% |
[ 54.0% - 54.5% ] 54.29% | 70 | 45.7% |
[ 55.0% - 55.5% ] 55.45% | 101 | 21.8% |
[ 57.5% - 58.0% ] 57.53% | 146 | 13.0% |
[ 58.0% - 58.5% ] 58.44% | 450 | 19.6% |
[ 62.5% - 63.0% ] 62.96% | 27 | 29.6% |
[ 74.0% - 74.5% ] 74.45% | 137 | 8.0% |
[ 86.0% - 86.5% ] 86.05% | 86 | 19.8% |