Pennsylvania German Disability Age Under 5
COMPARE
Pennsylvania German
Select to Compare
Disability Age Under 5
Pennsylvania German Disability Age Under 5
1.9%
DISABILITY | AGE UNDER 5
0.0/ 100
METRIC RATING
335th/ 347
METRIC RANK
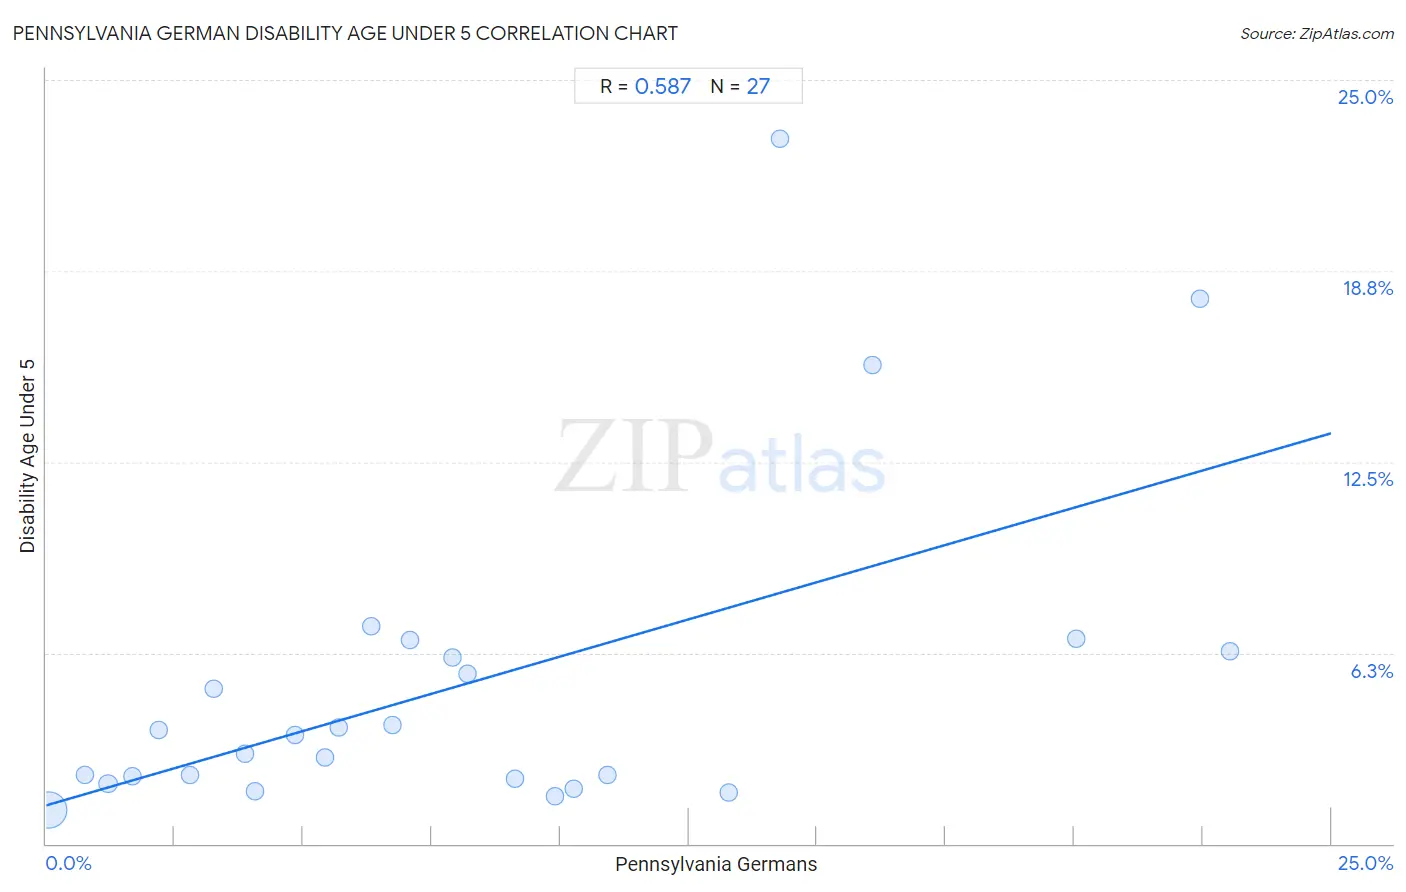
Pennsylvania German Disability Age Under 5 Correlation Chart
The statistical analysis conducted on geographies consisting of 141,367,234 people shows a substantial positive correlation between the proportion of Pennsylvania Germans and percentage of population with a disability under the age of 5 in the United States with a correlation coefficient (R) of 0.587 and weighted average of 1.9%. On average, for every 1% (one percent) increase in Pennsylvania Germans within a typical geography, there is an increase of 0.49% in percentage of population with a disability under the age of 5.
It is essential to understand that the correlation between the percentage of Pennsylvania Germans and percentage of population with a disability under the age of 5 does not imply a direct cause-and-effect relationship. It remains uncertain whether the presence of Pennsylvania Germans influences an upward or downward trend in the level of percentage of population with a disability under the age of 5 within an area, or if Pennsylvania Germans simply ended up residing in those areas with higher or lower levels of percentage of population with a disability under the age of 5 due to other factors.
Demographics Similar to Pennsylvania Germans by Disability Age Under 5
In terms of disability age under 5, the demographic groups most similar to Pennsylvania Germans are Native/Alaskan (1.9%, a difference of 0.38%), Dutch West Indian (1.9%, a difference of 0.78%), Paraguayan (2.0%, a difference of 1.3%), Chippewa (1.9%, a difference of 3.7%), and French Canadian (1.9%, a difference of 3.8%).
| Demographics | Rating | Rank | Disability Age Under 5 |
| Americans | 0.0 /100 | #328 | Tragic 1.9% |
| Houma | 0.0 /100 | #329 | Tragic 1.9% |
| Choctaw | 0.0 /100 | #330 | Tragic 1.9% |
| French Canadians | 0.0 /100 | #331 | Tragic 1.9% |
| Chippewa | 0.0 /100 | #332 | Tragic 1.9% |
| Dutch West Indians | 0.0 /100 | #333 | Tragic 1.9% |
| Natives/Alaskans | 0.0 /100 | #334 | Tragic 1.9% |
| Pennsylvania Germans | 0.0 /100 | #335 | Tragic 1.9% |
| Paraguayans | 0.0 /100 | #336 | Tragic 2.0% |
| Apache | 0.0 /100 | #337 | Tragic 2.0% |
| Tohono O'odham | 0.0 /100 | #338 | Tragic 2.2% |
| Immigrants from the Azores | 0.0 /100 | #339 | Tragic 2.2% |
| Menominee | 0.0 /100 | #340 | Tragic 2.3% |
| Tsimshian | 0.0 /100 | #341 | Tragic 2.4% |
| Alaska Natives | 0.0 /100 | #342 | Tragic 2.9% |
Pennsylvania German Disability Age Under 5 Correlation Summary
| Measurement | Pennsylvania German Data | Disability Age Under 5 Data |
| Minimum | 0.038% | 1.1% |
| Maximum | 23.0% | 23.1% |
| Range | 23.0% | 22.0% |
| Mean | 8.2% | 5.3% |
| Median | 6.7% | 3.5% |
| Interquartile 25% (IQ1) | 3.3% | 2.1% |
| Interquartile 75% (IQ3) | 10.9% | 6.3% |
| Interquartile Range (IQR) | 7.7% | 4.2% |
| Standard Deviation (Sample) | 6.4% | 5.3% |
| Standard Deviation (Population) | 6.3% | 5.2% |
Correlation Details
| Pennsylvania German Percentile | Sample Size | Disability Age Under 5 |
[ 0.0% - 0.5% ] 0.038% | 138,529,300 | 1.1% |
[ 0.5% - 1.0% ] 0.76% | 1,341,413 | 2.3% |
[ 1.0% - 1.5% ] 1.20% | 632,594 | 2.0% |
[ 1.5% - 2.0% ] 1.68% | 436,140 | 2.2% |
[ 2.0% - 2.5% ] 2.19% | 68,571 | 3.7% |
[ 2.5% - 3.0% ] 2.80% | 123,455 | 2.3% |
[ 3.0% - 3.5% ] 3.26% | 39,873 | 5.1% |
[ 3.5% - 4.0% ] 3.86% | 18,667 | 3.0% |
[ 4.0% - 4.5% ] 4.06% | 28,116 | 1.7% |
[ 4.5% - 5.0% ] 4.85% | 22,311 | 3.5% |
[ 5.0% - 5.5% ] 5.42% | 10,717 | 2.8% |
[ 5.5% - 6.0% ] 5.69% | 23,358 | 3.8% |
[ 6.0% - 6.5% ] 6.33% | 3,445 | 7.1% |
[ 6.5% - 7.0% ] 6.75% | 11,070 | 3.9% |
[ 7.0% - 7.5% ] 7.07% | 6,180 | 6.7% |
[ 7.5% - 8.0% ] 7.90% | 6,924 | 6.1% |
[ 8.0% - 8.5% ] 8.19% | 12,594 | 5.6% |
[ 9.0% - 9.5% ] 9.11% | 4,138 | 2.1% |
[ 9.5% - 10.0% ] 9.91% | 3,412 | 1.5% |
[ 10.0% - 10.5% ] 10.26% | 10,199 | 1.8% |
[ 10.5% - 11.0% ] 10.92% | 21,310 | 2.2% |
[ 13.0% - 13.5% ] 13.27% | 6,435 | 1.7% |
[ 14.0% - 14.5% ] 14.29% | 140 | 23.1% |
[ 16.0% - 16.5% ] 16.07% | 666 | 15.7% |
[ 20.0% - 20.5% ] 20.03% | 1,398 | 6.7% |
[ 22.0% - 22.5% ] 22.45% | 3,145 | 17.9% |
[ 23.0% - 23.5% ] 23.03% | 1,663 | 6.3% |