Pennsylvania German Married-couple Households
COMPARE
Pennsylvania German
Select to Compare
Married-couple Households
Pennsylvania German Married-couple Households
50.4%
MARRIED-COUPLE HOUSEHOLDS
100.0/ 100
METRIC RATING
9th/ 347
METRIC RANK
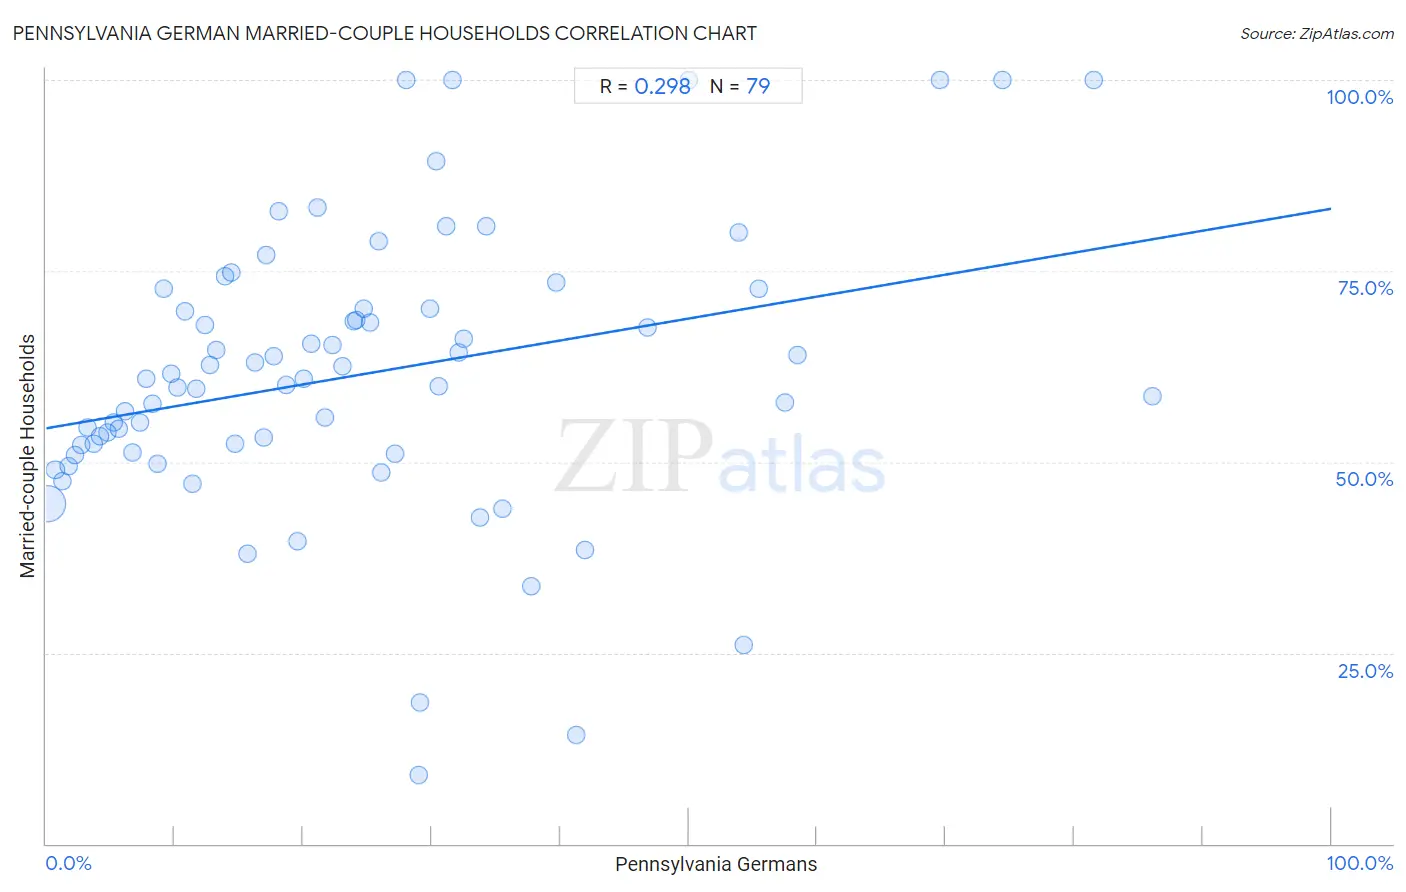
Pennsylvania German Married-couple Households Correlation Chart
The statistical analysis conducted on geographies consisting of 234,055,760 people shows a weak positive correlation between the proportion of Pennsylvania Germans and percentage of married-couple family households in the United States with a correlation coefficient (R) of 0.298 and weighted average of 50.4%. On average, for every 1% (one percent) increase in Pennsylvania Germans within a typical geography, there is an increase of 0.29% in percentage of married-couple family households.
It is essential to understand that the correlation between the percentage of Pennsylvania Germans and percentage of married-couple family households does not imply a direct cause-and-effect relationship. It remains uncertain whether the presence of Pennsylvania Germans influences an upward or downward trend in the level of percentage of married-couple family households within an area, or if Pennsylvania Germans simply ended up residing in those areas with higher or lower levels of percentage of married-couple family households due to other factors.
Demographics Similar to Pennsylvania Germans by Married-couple Households
In terms of married-couple households, the demographic groups most similar to Pennsylvania Germans are Chinese (50.4%, a difference of 0.0%), Immigrants from Pakistan (50.1%, a difference of 0.44%), Immigrants from South Central Asia (50.6%, a difference of 0.55%), Swiss (49.9%, a difference of 0.81%), and Immigrants from Korea (49.9%, a difference of 0.98%).
| Demographics | Rating | Rank | Married-couple Households |
| Immigrants from Taiwan | 100.0 /100 | #2 | Exceptional 52.4% |
| Thais | 100.0 /100 | #3 | Exceptional 51.9% |
| Assyrians/Chaldeans/Syriacs | 100.0 /100 | #4 | Exceptional 51.8% |
| Tongans | 100.0 /100 | #5 | Exceptional 51.6% |
| Danes | 100.0 /100 | #6 | Exceptional 51.1% |
| Filipinos | 100.0 /100 | #7 | Exceptional 51.0% |
| Immigrants from South Central Asia | 100.0 /100 | #8 | Exceptional 50.6% |
| Pennsylvania Germans | 100.0 /100 | #9 | Exceptional 50.4% |
| Chinese | 100.0 /100 | #10 | Exceptional 50.4% |
| Immigrants from Pakistan | 100.0 /100 | #11 | Exceptional 50.1% |
| Swiss | 100.0 /100 | #12 | Exceptional 49.9% |
| Immigrants from Korea | 100.0 /100 | #13 | Exceptional 49.9% |
| Burmese | 100.0 /100 | #14 | Exceptional 49.8% |
| Koreans | 99.9 /100 | #15 | Exceptional 49.7% |
| Swedes | 99.9 /100 | #16 | Exceptional 49.7% |
Pennsylvania German Married-couple Households Correlation Summary
| Measurement | Pennsylvania German Data | Married-couple Households Data |
| Minimum | 0.058% | 9.0% |
| Maximum | 86.0% | 100.0% |
| Range | 86.0% | 91.0% |
| Mean | 24.4% | 61.4% |
| Median | 20.7% | 60.8% |
| Interquartile 25% (IQ1) | 9.7% | 51.2% |
| Interquartile 75% (IQ3) | 32.1% | 70.0% |
| Interquartile Range (IQR) | 22.4% | 18.8% |
| Standard Deviation (Sample) | 19.3% | 18.6% |
| Standard Deviation (Population) | 19.2% | 18.5% |
Correlation Details
| Pennsylvania German Percentile | Sample Size | Married-couple Households |
[ 0.0% - 0.5% ] 0.058% | 222,107,563 | 44.6% |
[ 0.5% - 1.0% ] 0.72% | 5,488,372 | 49.0% |
[ 1.0% - 1.5% ] 1.23% | 2,116,944 | 47.4% |
[ 1.5% - 2.0% ] 1.72% | 1,379,822 | 49.5% |
[ 2.0% - 2.5% ] 2.22% | 670,299 | 50.9% |
[ 2.5% - 3.0% ] 2.76% | 487,154 | 52.3% |
[ 3.0% - 3.5% ] 3.23% | 363,928 | 54.5% |
[ 3.5% - 4.0% ] 3.74% | 239,229 | 52.3% |
[ 4.0% - 4.5% ] 4.15% | 269,222 | 53.4% |
[ 4.5% - 5.0% ] 4.75% | 174,550 | 53.8% |
[ 5.0% - 5.5% ] 5.28% | 114,012 | 55.1% |
[ 5.5% - 6.0% ] 5.67% | 83,739 | 54.3% |
[ 6.0% - 6.5% ] 6.14% | 60,248 | 56.6% |
[ 6.5% - 7.0% ] 6.75% | 104,521 | 51.2% |
[ 7.0% - 7.5% ] 7.25% | 27,414 | 55.2% |
[ 7.5% - 8.0% ] 7.81% | 23,099 | 60.9% |
[ 8.0% - 8.5% ] 8.26% | 52,911 | 57.7% |
[ 8.5% - 9.0% ] 8.66% | 39,534 | 49.7% |
[ 9.0% - 9.5% ] 9.14% | 16,425 | 72.6% |
[ 9.5% - 10.0% ] 9.74% | 17,973 | 61.6% |
[ 10.0% - 10.5% ] 10.25% | 25,045 | 59.7% |
[ 10.5% - 11.0% ] 10.81% | 35,137 | 69.8% |
[ 11.0% - 11.5% ] 11.38% | 4,629 | 47.2% |
[ 11.5% - 12.0% ] 11.68% | 23,395 | 59.7% |
[ 12.0% - 12.5% ] 12.37% | 19,489 | 67.9% |
[ 12.5% - 13.0% ] 12.70% | 2,221 | 62.6% |
[ 13.0% - 13.5% ] 13.24% | 11,634 | 64.6% |
[ 13.5% - 14.0% ] 13.95% | 803 | 74.3% |
[ 14.0% - 14.5% ] 14.44% | 4,474 | 74.7% |
[ 14.5% - 15.0% ] 14.68% | 6,708 | 52.4% |
[ 15.5% - 16.0% ] 15.68% | 1,524 | 38.0% |
[ 16.0% - 16.5% ] 16.27% | 2,753 | 62.9% |
[ 16.5% - 17.0% ] 16.89% | 11,356 | 53.1% |
[ 17.0% - 17.5% ] 17.14% | 3,658 | 77.1% |
[ 17.5% - 18.0% ] 17.73% | 976 | 63.8% |
[ 18.0% - 18.5% ] 18.13% | 6,917 | 82.9% |
[ 18.5% - 19.0% ] 18.65% | 1,008 | 60.1% |
[ 19.5% - 20.0% ] 19.54% | 1,034 | 39.6% |
[ 20.0% - 20.5% ] 20.06% | 1,899 | 60.8% |
[ 20.5% - 21.0% ] 20.66% | 847 | 65.5% |
[ 21.0% - 21.5% ] 21.15% | 539 | 83.2% |
[ 21.5% - 22.0% ] 21.69% | 4,763 | 55.8% |
[ 22.0% - 22.5% ] 22.31% | 4,576 | 65.3% |
[ 23.0% - 23.5% ] 23.06% | 2,090 | 62.4% |
[ 23.5% - 24.0% ] 23.92% | 1,522 | 68.4% |
[ 24.0% - 24.5% ] 24.12% | 2,156 | 68.5% |
[ 24.5% - 25.0% ] 24.71% | 3,419 | 70.0% |
[ 25.0% - 25.5% ] 25.24% | 5,376 | 68.2% |
[ 25.5% - 26.0% ] 25.83% | 302 | 78.9% |
[ 26.0% - 26.5% ] 26.07% | 560 | 48.6% |
[ 27.0% - 27.5% ] 27.17% | 92 | 51.0% |
[ 28.0% - 28.5% ] 28.00% | 200 | 100.0% |
[ 28.5% - 29.0% ] 28.96% | 259 | 9.0% |
[ 29.0% - 29.5% ] 29.09% | 55 | 18.4% |
[ 29.5% - 30.0% ] 29.88% | 1,824 | 70.0% |
[ 30.0% - 30.5% ] 30.38% | 79 | 89.3% |
[ 30.5% - 31.0% ] 30.50% | 318 | 59.8% |
[ 31.0% - 31.5% ] 31.12% | 1,417 | 80.9% |
[ 31.5% - 32.0% ] 31.58% | 57 | 100.0% |
[ 32.0% - 32.5% ] 32.10% | 539 | 64.4% |
[ 32.5% - 33.0% ] 32.54% | 16,090 | 66.2% |
[ 33.5% - 34.0% ] 33.78% | 370 | 42.7% |
[ 34.0% - 34.5% ] 34.24% | 2,030 | 80.9% |
[ 35.0% - 35.5% ] 35.47% | 406 | 43.8% |
[ 37.5% - 38.0% ] 37.73% | 432 | 33.7% |
[ 39.5% - 40.0% ] 39.66% | 2,335 | 73.5% |
[ 41.0% - 41.5% ] 41.27% | 63 | 14.3% |
[ 41.5% - 42.0% ] 41.94% | 31 | 38.5% |
[ 46.5% - 47.0% ] 46.84% | 316 | 67.6% |
[ 50.0% - 50.5% ] 50.00% | 12 | 100.0% |
[ 53.5% - 54.0% ] 53.85% | 26 | 80.0% |
[ 54.0% - 54.5% ] 54.29% | 70 | 26.1% |
[ 55.0% - 55.5% ] 55.45% | 101 | 72.7% |
[ 57.5% - 58.0% ] 57.53% | 146 | 57.8% |
[ 58.0% - 58.5% ] 58.44% | 450 | 63.9% |
[ 69.5% - 70.0% ] 69.57% | 23 | 100.0% |
[ 74.0% - 74.5% ] 74.45% | 137 | 100.0% |
[ 81.0% - 81.5% ] 81.48% | 27 | 100.0% |
[ 86.0% - 86.5% ] 86.05% | 86 | 58.6% |