Osage vs Immigrants from Iran Married-Couple Family Poverty
COMPARE
Osage
Immigrants from Iran
Married-Couple Family Poverty
Married-Couple Family Poverty Comparison
Osage
Immigrants from Iran
5.4%
MARRIED-COUPLE FAMILY POVERTY
18.4/ 100
METRIC RATING
206th/ 347
METRIC RANK
4.5%
MARRIED-COUPLE FAMILY POVERTY
99.0/ 100
METRIC RATING
79th/ 347
METRIC RANK
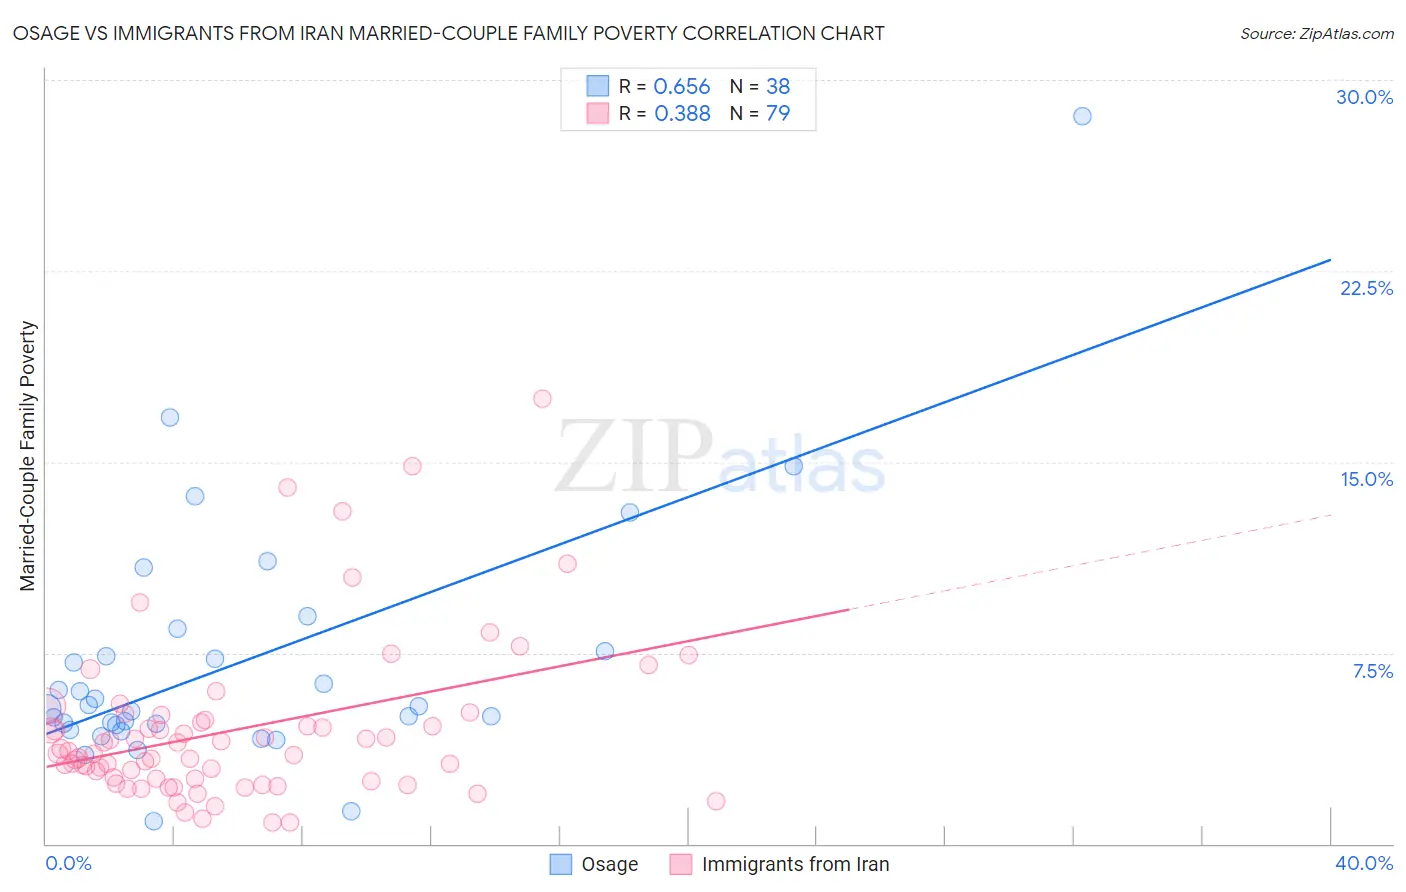
Osage vs Immigrants from Iran Married-Couple Family Poverty Correlation Chart
The statistical analysis conducted on geographies consisting of 91,686,169 people shows a significant positive correlation between the proportion of Osage and poverty level among married-couple families in the United States with a correlation coefficient (R) of 0.656 and weighted average of 5.4%. Similarly, the statistical analysis conducted on geographies consisting of 278,379,218 people shows a mild positive correlation between the proportion of Immigrants from Iran and poverty level among married-couple families in the United States with a correlation coefficient (R) of 0.388 and weighted average of 4.5%, a difference of 20.4%.
Married-Couple Family Poverty Correlation Summary
| Measurement | Osage | Immigrants from Iran |
| Minimum | 0.88% | 0.82% |
| Maximum | 28.6% | 17.5% |
| Range | 27.7% | 16.7% |
| Mean | 7.1% | 4.5% |
| Median | 5.3% | 3.5% |
| Interquartile 25% (IQ1) | 4.7% | 2.5% |
| Interquartile 75% (IQ3) | 7.6% | 4.9% |
| Interquartile Range (IQR) | 2.9% | 2.3% |
| Standard Deviation (Sample) | 5.0% | 3.2% |
| Standard Deviation (Population) | 4.9% | 3.2% |
Similar Demographics by Married-Couple Family Poverty
Demographics Similar to Osage by Married-Couple Family Poverty
In terms of married-couple family poverty, the demographic groups most similar to Osage are Chippewa (5.4%, a difference of 0.10%), Immigrants from Africa (5.5%, a difference of 0.14%), Immigrants from Costa Rica (5.4%, a difference of 0.19%), French American Indian (5.5%, a difference of 0.45%), and Immigrants from Syria (5.5%, a difference of 0.59%).
| Demographics | Rating | Rank | Married-Couple Family Poverty |
| Uruguayans | 25.0 /100 | #199 | Fair 5.4% |
| Immigrants | Morocco | 24.3 /100 | #200 | Fair 5.4% |
| Lebanese | 24.1 /100 | #201 | Fair 5.4% |
| Immigrants | Middle Africa | 23.8 /100 | #202 | Fair 5.4% |
| Immigrants | Peru | 21.8 /100 | #203 | Fair 5.4% |
| Immigrants | Costa Rica | 19.4 /100 | #204 | Poor 5.4% |
| Chippewa | 18.9 /100 | #205 | Poor 5.4% |
| Osage | 18.4 /100 | #206 | Poor 5.4% |
| Immigrants | Africa | 17.6 /100 | #207 | Poor 5.5% |
| French American Indians | 16.1 /100 | #208 | Poor 5.5% |
| Immigrants | Syria | 15.4 /100 | #209 | Poor 5.5% |
| Immigrants | Micronesia | 14.4 /100 | #210 | Poor 5.5% |
| Nigerians | 14.3 /100 | #211 | Poor 5.5% |
| Immigrants | Thailand | 14.0 /100 | #212 | Poor 5.5% |
| Immigrants | Liberia | 13.3 /100 | #213 | Poor 5.5% |
Demographics Similar to Immigrants from Iran by Married-Couple Family Poverty
In terms of married-couple family poverty, the demographic groups most similar to Immigrants from Iran are Icelander (4.5%, a difference of 0.060%), Immigrants from Greece (4.5%, a difference of 0.20%), Scotch-Irish (4.5%, a difference of 0.23%), Immigrants from Latvia (4.5%, a difference of 0.31%), and Canadian (4.5%, a difference of 0.45%).
| Demographics | Rating | Rank | Married-Couple Family Poverty |
| Immigrants | England | 99.3 /100 | #72 | Exceptional 4.5% |
| Ukrainians | 99.2 /100 | #73 | Exceptional 4.5% |
| Immigrants | Austria | 99.2 /100 | #74 | Exceptional 4.5% |
| Cambodians | 99.2 /100 | #75 | Exceptional 4.5% |
| Immigrants | South Africa | 99.1 /100 | #76 | Exceptional 4.5% |
| Immigrants | Latvia | 99.1 /100 | #77 | Exceptional 4.5% |
| Scotch-Irish | 99.1 /100 | #78 | Exceptional 4.5% |
| Immigrants | Iran | 99.0 /100 | #79 | Exceptional 4.5% |
| Icelanders | 99.0 /100 | #80 | Exceptional 4.5% |
| Immigrants | Greece | 98.9 /100 | #81 | Exceptional 4.5% |
| Canadians | 98.8 /100 | #82 | Exceptional 4.5% |
| Immigrants | Denmark | 98.8 /100 | #83 | Exceptional 4.6% |
| Immigrants | Croatia | 98.7 /100 | #84 | Exceptional 4.6% |
| South Africans | 98.7 /100 | #85 | Exceptional 4.6% |
| Immigrants | Turkey | 98.6 /100 | #86 | Exceptional 4.6% |