Osage GED/Equivalency
COMPARE
Osage
Select to Compare
GED/Equivalency
Osage GED/Equivalency
84.8%
GED/EQUIVALENCY
9.5/ 100
METRIC RATING
214th/ 347
METRIC RANK
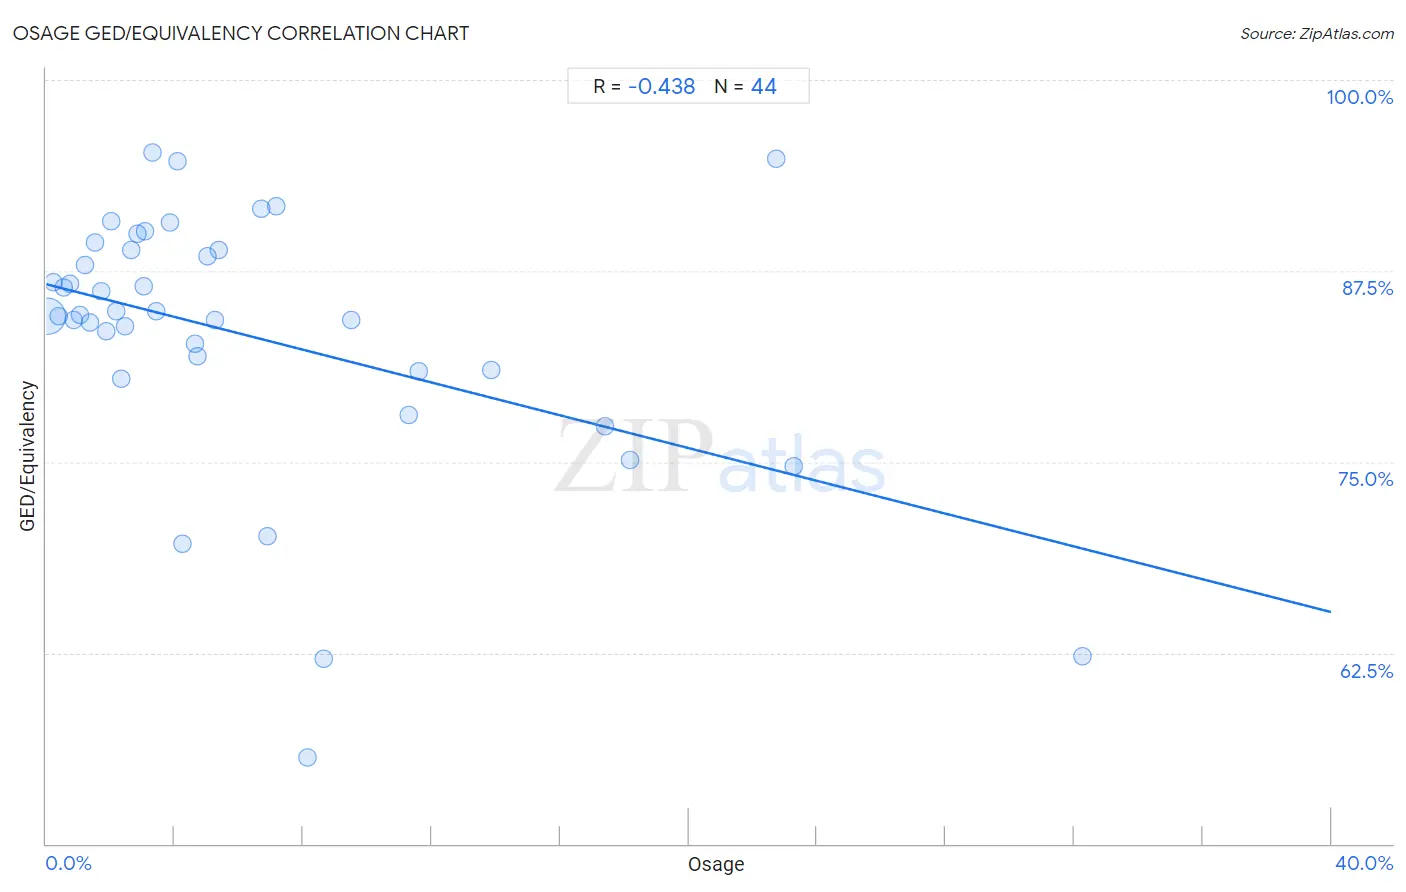
Osage GED/Equivalency Correlation Chart
The statistical analysis conducted on geographies consisting of 91,808,913 people shows a moderate negative correlation between the proportion of Osage and percentage of population with at least ged/equivalency education in the United States with a correlation coefficient (R) of -0.438 and weighted average of 84.8%. On average, for every 1% (one percent) increase in Osage within a typical geography, there is a decrease of 0.54% in percentage of population with at least ged/equivalency education.
It is essential to understand that the correlation between the percentage of Osage and percentage of population with at least ged/equivalency education does not imply a direct cause-and-effect relationship. It remains uncertain whether the presence of Osage influences an upward or downward trend in the level of percentage of population with at least ged/equivalency education within an area, or if Osage simply ended up residing in those areas with higher or lower levels of percentage of population with at least ged/equivalency education due to other factors.
Demographics Similar to Osage by GED/Equivalency
In terms of ged/equivalency, the demographic groups most similar to Osage are Peruvian (84.7%, a difference of 0.020%), Immigrants from Philippines (84.8%, a difference of 0.030%), Immigrants from Micronesia (84.7%, a difference of 0.050%), Nigerian (84.7%, a difference of 0.050%), and Immigrants from Somalia (84.8%, a difference of 0.060%).
| Demographics | Rating | Rank | GED/Equivalency |
| Hmong | 13.1 /100 | #207 | Poor 84.9% |
| Marshallese | 12.5 /100 | #208 | Poor 84.9% |
| Colombians | 12.3 /100 | #209 | Poor 84.9% |
| Immigrants from Cameroon | 12.1 /100 | #210 | Poor 84.9% |
| South Americans | 10.9 /100 | #211 | Poor 84.8% |
| Immigrants from Somalia | 10.6 /100 | #212 | Poor 84.8% |
| Immigrants from Philippines | 10.0 /100 | #213 | Poor 84.8% |
| Osage | 9.5 /100 | #214 | Tragic 84.8% |
| Peruvians | 9.2 /100 | #215 | Tragic 84.7% |
| Immigrants from Micronesia | 8.7 /100 | #216 | Tragic 84.7% |
| Nigerians | 8.6 /100 | #217 | Tragic 84.7% |
| Alaska Natives | 8.6 /100 | #218 | Tragic 84.7% |
| Potawatomi | 8.2 /100 | #219 | Tragic 84.7% |
| Americans | 8.2 /100 | #220 | Tragic 84.7% |
| Taiwanese | 8.1 /100 | #221 | Tragic 84.7% |
Osage GED/Equivalency Correlation Summary
| Measurement | Osage Data | GED/Equivalency Data |
| Minimum | 0.021% | 55.6% |
| Maximum | 32.3% | 95.3% |
| Range | 32.2% | 39.6% |
| Mean | 6.2% | 83.3% |
| Median | 3.6% | 84.6% |
| Interquartile 25% (IQ1) | 1.8% | 81.0% |
| Interquartile 75% (IQ3) | 7.7% | 88.9% |
| Interquartile Range (IQR) | 5.9% | 7.9% |
| Standard Deviation (Sample) | 7.0% | 8.6% |
| Standard Deviation (Population) | 6.9% | 8.5% |
Correlation Details
| Osage Percentile | Sample Size | GED/Equivalency |
[ 0.0% - 0.5% ] 0.021% | 86,865,417 | 84.5% |
[ 0.0% - 0.5% ] 0.23% | 3,083,960 | 86.8% |
[ 0.0% - 0.5% ] 0.39% | 828,674 | 84.6% |
[ 0.5% - 1.0% ] 0.55% | 259,895 | 86.4% |
[ 0.5% - 1.0% ] 0.73% | 174,180 | 86.6% |
[ 0.5% - 1.0% ] 0.86% | 127,054 | 84.3% |
[ 1.0% - 1.5% ] 1.04% | 159,619 | 84.6% |
[ 1.0% - 1.5% ] 1.21% | 55,912 | 87.8% |
[ 1.0% - 1.5% ] 1.34% | 43,058 | 84.1% |
[ 1.5% - 2.0% ] 1.51% | 26,487 | 89.3% |
[ 1.5% - 2.0% ] 1.71% | 65,772 | 86.2% |
[ 1.5% - 2.0% ] 1.87% | 5,815 | 83.5% |
[ 2.0% - 2.5% ] 2.04% | 21,909 | 90.8% |
[ 2.0% - 2.5% ] 2.18% | 8,659 | 84.8% |
[ 2.0% - 2.5% ] 2.32% | 4,011 | 80.5% |
[ 2.0% - 2.5% ] 2.46% | 1,384 | 83.9% |
[ 2.5% - 3.0% ] 2.63% | 4,758 | 88.8% |
[ 2.5% - 3.0% ] 2.83% | 1,095 | 90.0% |
[ 3.0% - 3.5% ] 3.03% | 6,727 | 86.5% |
[ 3.0% - 3.5% ] 3.08% | 389 | 90.1% |
[ 3.0% - 3.5% ] 3.30% | 3,027 | 95.3% |
[ 3.0% - 3.5% ] 3.42% | 14,990 | 84.8% |
[ 3.5% - 4.0% ] 3.84% | 1,486 | 90.7% |
[ 4.0% - 4.5% ] 4.10% | 6,733 | 94.6% |
[ 4.0% - 4.5% ] 4.25% | 424 | 69.7% |
[ 4.5% - 5.0% ] 4.62% | 715 | 82.8% |
[ 4.5% - 5.0% ] 4.72% | 106 | 81.9% |
[ 5.0% - 5.5% ] 5.00% | 40 | 88.5% |
[ 5.0% - 5.5% ] 5.26% | 11,832 | 84.3% |
[ 5.0% - 5.5% ] 5.38% | 93 | 88.9% |
[ 6.5% - 7.0% ] 6.70% | 895 | 91.6% |
[ 6.5% - 7.0% ] 6.90% | 87 | 70.1% |
[ 7.0% - 7.5% ] 7.17% | 1,130 | 91.7% |
[ 8.0% - 8.5% ] 8.15% | 3,327 | 55.6% |
[ 8.5% - 9.0% ] 8.62% | 4,140 | 62.1% |
[ 9.0% - 9.5% ] 9.48% | 2,058 | 84.3% |
[ 11.0% - 11.5% ] 11.27% | 3,009 | 78.1% |
[ 11.5% - 12.0% ] 11.60% | 4,905 | 80.9% |
[ 13.5% - 14.0% ] 13.84% | 1,662 | 81.0% |
[ 17.0% - 17.5% ] 17.40% | 1,592 | 77.4% |
[ 18.0% - 18.5% ] 18.17% | 1,172 | 75.2% |
[ 22.5% - 23.0% ] 22.72% | 493 | 94.8% |
[ 23.0% - 23.5% ] 23.26% | 129 | 74.7% |
[ 32.0% - 32.5% ] 32.26% | 93 | 62.3% |