Moroccan Disability Age 5 to 17

COMPARE

Moroccan
Race
Ancestry
AfghanAfricanAlaska NativeAlaskan AthabascanAlbanianAleutAlsatianAmericanApacheArabArapahoArgentineanArmenianAssyrian/Chaldean/SyriacAustralianAustrianBahamianBangladeshiBarbadianBasqueBelgianBelizeanBermudanBhutaneseBlackfeetBolivianBrazilianBritishBritish West IndianBulgarianBurmeseCajunCambodianCanadianCape VerdeanCarpatho RusynCelticCentral AmericanCentral American IndianCherokeeCheyenneChickasawChileanChineseChippewaChoctawColombianColvilleComancheCosta RicanCreeCreekCroatianCrowCubanCypriotCzechCzechoslovakianDanishDelawareDominicanDutchDutch West IndianEastern EuropeanEcuadorianEgyptianEnglishEstonianEthiopianEuropeanFijianFilipinoFinnishFrenchFrench American IndianFrench CanadianGermanGerman RussianGhanaianGreekGuamanian/ChamorroGuatemalanGuyaneseHaitianHmongHonduranHopiHoumaHungarianIcelanderIndian (Asian)IndonesianInupiatIranianIraqiIrishIroquoisIsraeliItalianJamaicanJapaneseJordanianKenyanKiowaKoreanLaotianLatvianLebaneseLiberianLithuanianLumbeeLuxembourgerMacedonianMalaysianMalteseMarshalleseMenomineeMexicanMexican American IndianMongolianMoroccanNative HawaiianNavajoNepaleseNew ZealanderNicaraguanNigerianNorthern EuropeanNorwegianOkinawanOsageOttawaPaiutePakistaniPalestinianPanamanianParaguayanPennsylvania GermanPeruvianPimaPolishPortuguesePotawatomiPuebloPuerto RicanPuget Sound SalishRomanianRussianSalvadoranSamoanScandinavianScotch-IrishScottishSeminoleSenegaleseSerbianShoshoneSierra LeoneanSiouxSlavicSlovakSloveneSomaliSouth AfricanSouth AmericanSouth American IndianSoviet UnionSpaniardSpanishSpanish AmericanSpanish American IndianSri LankanSubsaharan AfricanSudaneseSwedishSwissSyrianTaiwaneseThaiTlingit-HaidaTohono O'OdhamTonganTrinidadian and TobagonianTsimshianTurkishU.S. Virgin IslanderUgandanUkrainianUruguayanUteVenezuelanVietnameseWelshWest IndianYakamaYaquiYugoslavianYumanYup'ikZimbabwean
Immigration
NonimmigrantsImmigrantsAfghanistanAfricaAlbaniaArgentinaArmeniaAsiaAustraliaAustriaBahamasBangladeshBarbadosBelarusBelgiumBelizeBoliviaBosnia and HerzegovinaBrazilBulgariaBurma/MyanmarCabo VerdeCambodiaCameroonCanadaCaribbeanCentral AmericaChileChinaColombiaCongoCosta RicaCroatiaCubaCzechoslovakiaDenmarkDominicaDominican RepublicEastern AfricaEastern AsiaEastern EuropeEcuadorEgyptEl SalvadorEnglandEritreaEthiopiaEuropeFijiFranceGermanyGhanaGreeceGrenadaGuatemalaGuyanaHaitiHondurasHong KongHungaryIndiaIndonesiaIranIraqIrelandIsraelItalyJamaicaJapanJordanKazakhstanKenyaKoreaKuwaitLaosLatin AmericaLatviaLebanonLiberiaLithuaniaMalaysiaMexicoMicronesiaMiddle AfricaMoldovaMoroccoNepalNetherlandsNicaraguaNigeriaNorth AmericaNorth MacedoniaNorthern AfricaNorthern EuropeNorwayOceaniaPakistanPanamaPeruPhilippinesPolandPortugalRomaniaRussiaSaudi ArabiaScotlandSenegalSerbiaSierra LeoneSingaporeSomaliaSouth AfricaSouth AmericaSouth Central AsiaSouth Eastern AsiaSouthern EuropeSpainSri LankaSt. Vincent and the GrenadinesSudanSwedenSwitzerlandSyriaTaiwanThailandTrinidad and TobagoTurkeyUgandaUkraineUruguayUzbekistanVenezuelaVietnamWest IndiesWestern AfricaWestern AsiaWestern EuropeYemenZaireZimbabweAzores
Select to Compare
Race
Ancestry
AfghanAfricanAlaska NativeAlaskan AthabascanAlbanianAleutAlsatianAmericanApacheArabArapahoArgentineanArmenianAssyrian/Chaldean/SyriacAustralianAustrianBahamianBangladeshiBarbadianBasqueBelgianBelizeanBermudanBhutaneseBlackfeetBolivianBrazilianBritishBritish West IndianBulgarianBurmeseCajunCambodianCanadianCape VerdeanCarpatho RusynCelticCentral AmericanCentral American IndianCherokeeCheyenneChickasawChileanChineseChippewaChoctawColombianColvilleComancheCosta RicanCreeCreekCroatianCrowCubanCypriotCzechCzechoslovakianDanishDelawareDominicanDutchDutch West IndianEastern EuropeanEcuadorianEgyptianEnglishEstonianEthiopianEuropeanFijianFilipinoFinnishFrenchFrench American IndianFrench CanadianGermanGerman RussianGhanaianGreekGuamanian/ChamorroGuatemalanGuyaneseHaitianHmongHonduranHopiHoumaHungarianIcelanderIndian (Asian)IndonesianInupiatIranianIraqiIrishIroquoisIsraeliItalianJamaicanJapaneseJordanianKenyanKiowaKoreanLaotianLatvianLebaneseLiberianLithuanianLumbeeLuxembourgerMacedonianMalaysianMalteseMarshalleseMenomineeMexicanMexican American IndianMongolianNative HawaiianNavajoNepaleseNew ZealanderNicaraguanNigerianNorthern EuropeanNorwegianOkinawanOsageOttawaPaiutePakistaniPalestinianPanamanianParaguayanPennsylvania GermanPeruvianPimaPolishPortuguesePotawatomiPuebloPuerto RicanPuget Sound SalishRomanianRussianSalvadoranSamoanScandinavianScotch-IrishScottishSeminoleSenegaleseSerbianShoshoneSierra LeoneanSiouxSlavicSlovakSloveneSomaliSouth AfricanSouth AmericanSouth American IndianSoviet UnionSpaniardSpanishSpanish AmericanSpanish American IndianSri LankanSubsaharan AfricanSudaneseSwedishSwissSyrianTaiwaneseThaiTlingit-HaidaTohono O'OdhamTonganTrinidadian and TobagonianTsimshianTurkishU.S. Virgin IslanderUgandanUkrainianUruguayanUteVenezuelanVietnameseWelshWest IndianYakamaYaquiYugoslavianYumanYup'ikZimbabwean
Immigration
NonimmigrantsImmigrantsAfghanistanAfricaAlbaniaArgentinaArmeniaAsiaAustraliaAustriaBahamasBangladeshBarbadosBelarusBelgiumBelizeBoliviaBosnia and HerzegovinaBrazilBulgariaBurma/MyanmarCabo VerdeCambodiaCameroonCanadaCaribbeanCentral AmericaChileChinaColombiaCongoCosta RicaCroatiaCubaCzechoslovakiaDenmarkDominicaDominican RepublicEastern AfricaEastern AsiaEastern EuropeEcuadorEgyptEl SalvadorEnglandEritreaEthiopiaEuropeFijiFranceGermanyGhanaGreeceGrenadaGuatemalaGuyanaHaitiHondurasHong KongHungaryIndiaIndonesiaIranIraqIrelandIsraelItalyJamaicaJapanJordanKazakhstanKenyaKoreaKuwaitLaosLatin AmericaLatviaLebanonLiberiaLithuaniaMalaysiaMexicoMicronesiaMiddle AfricaMoldovaMoroccoNepalNetherlandsNicaraguaNigeriaNorth AmericaNorth MacedoniaNorthern AfricaNorthern EuropeNorwayOceaniaPakistanPanamaPeruPhilippinesPolandPortugalRomaniaRussiaSaudi ArabiaScotlandSenegalSerbiaSierra LeoneSingaporeSomaliaSouth AfricaSouth AmericaSouth Central AsiaSouth Eastern AsiaSouthern EuropeSpainSri LankaSt. Vincent and the GrenadinesSudanSwedenSwitzerlandSyriaTaiwanThailandTrinidad and TobagoTurkeyUgandaUkraineUruguayUzbekistanVenezuelaVietnamWest IndiesWestern AfricaWestern AsiaWestern EuropeYemenZaireZimbabweAzores
Disability Age 5 to 17
Income
Poverty
Unemployment
Labor Participation
Family Structure
Vehicle Availability
Education Level
Disability

Moroccan Disability Age 5 to 17
Poor

5.7%
DISABILITY | AGE 5 TO 17
10.4/ 100
METRIC RATING
207th/ 347
METRIC RANK

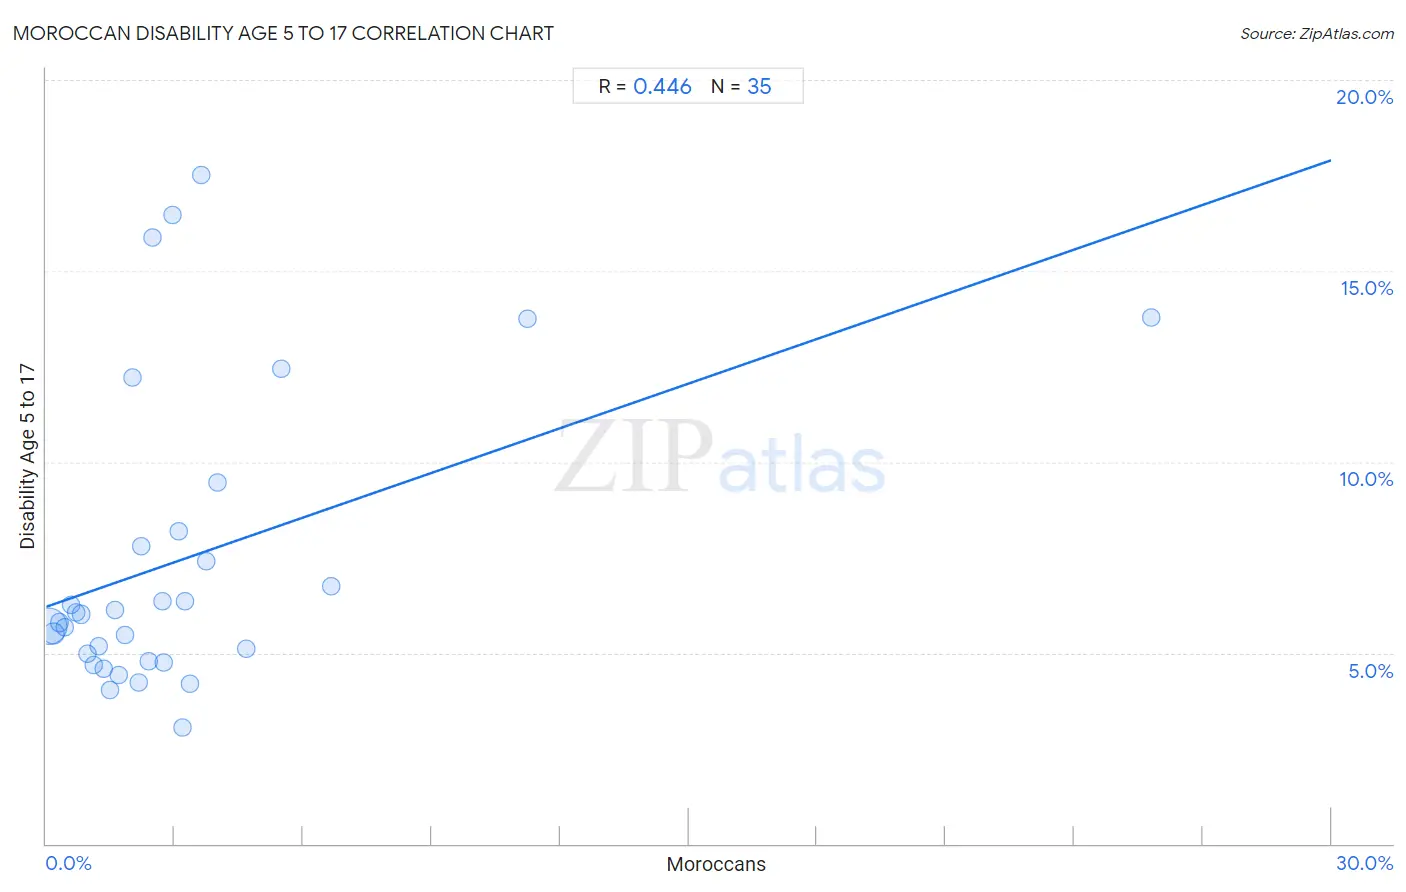
Moroccan Disability Age 5 to 17 Correlation Chart

The statistical analysis conducted on geographies consisting of 201,086,973 people shows a moderate positive correlation between the proportion of Moroccans and percentage of population with a disability between the ages 5 and 17 in the United States with a correlation coefficient (R) of 0.446 and weighted average of 5.7%. On average, for every 1% (one percent) increase in Moroccans within a typical geography, there is an increase of 0.39% in percentage of population with a disability between the ages 5 and 17.
Moroccan Disability Age 5 to 17
It is essential to understand that the correlation between the percentage of Moroccans and percentage of population with a disability between the ages 5 and 17 does not imply a direct cause-and-effect relationship. It remains uncertain whether the presence of Moroccans influences an upward or downward trend in the level of percentage of population with a disability between the ages 5 and 17 within an area, or if Moroccans simply ended up residing in those areas with higher or lower levels of percentage of population with a disability between the ages 5 and 17 due to other factors.

Demographics Similar to Moroccans by Disability Age 5 to 17

In terms of disability age 5 to 17, the demographic groups most similar to Moroccans are Trinidadian and Tobagonian (5.7%, a difference of 0.050%), Immigrants from Africa (5.7%, a difference of 0.050%), Kenyan (5.8%, a difference of 0.050%), Immigrants from Uganda (5.8%, a difference of 0.090%), and Paiute (5.7%, a difference of 0.10%).
DemographicsRating | RankDisability Age 5 to 17
Icelanders
14.6
/100
|
#200
Poor
5.7%
Basques
13.7
/100
|
#201
Poor
5.7%
Austrians
13.2
/100
|
#202
Poor
5.7%
Spanish American Indians
12.8
/100
|
#203
Poor
5.7%
Paiute
11.2
/100
|
#204
Poor
5.7%
Trinidadians and Tobagonians
10.8
/100
|
#205
Poor
5.7%
Immigrants from Africa
10.8
/100
|
#206
Poor
5.7%
Moroccans
10.4
/100
|
#207
Poor
5.7%
Kenyans
10.0
/100
|
#208
Poor
5.8%
Immigrants from Uganda
9.7
/100
|
#209
Tragic
5.8%
Immigrants from Haiti
9.5
/100
|
#210
Tragic
5.8%
Yugoslavians
9.1
/100
|
#211
Tragic
5.8%
Immigrants from Panama
8.7
/100
|
#212
Tragic
5.8%
Immigrants from Cameroon
8.3
/100
|
#213
Tragic
5.8%
Immigrants from Morocco
8.3
/100
|
#214
Tragic
5.8%

Moroccan Disability Age 5 to 17 Correlation Summary

MeasurementMoroccan DataDisability Age 5 to 17 Data
Minimum0.046%3.0%
Maximum25.8%17.5%
Range25.7%14.5%
Mean3.2%7.5%
Median2.2%6.0%
Interquartile 25% (IQ1)1.1%4.8%
Interquartile 75% (IQ3)3.4%8.2%
Interquartile Range (IQR)2.3%3.4%
Standard Deviation (Sample)4.5%3.9%
Standard Deviation (Population)4.4%3.9%

Correlation Details

Moroccan PercentileSample SizeDisability Age 5 to 17
[
0.0%
-
0.5%
]
0.046%
147,379,1015.7%
[
0.0%
-
0.5%
]
0.17%
33,239,9715.5%
[
0.0%
-
0.5%
]
0.31%
8,770,1795.8%
[
0.0%
-
0.5%
]
0.44%
4,264,9475.7%
[
0.5%
-
1.0%
]
0.57%
2,404,2076.2%
[
0.5%
-
1.0%
]
0.70%
1,604,0076.1%
[
0.5%
-
1.0%
]
0.82%
1,042,2316.0%
[
0.5%
-
1.0%
]
0.95%
541,8345.0%
[
1.0%
-
1.5%
]
1.10%
284,8474.7%
[
1.0%
-
1.5%
]
1.22%
461,5115.2%
[
1.0%
-
1.5%
]
1.34%
148,6154.6%
[
1.0%
-
1.5%
]
1.48%
246,6794.0%
[
1.5%
-
2.0%
]
1.59%
132,2996.1%
[
1.5%
-
2.0%
]
1.70%
17,7584.4%
[
1.5%
-
2.0%
]
1.85%
111,1655.5%
[
2.0%
-
2.5%
]
2.01%
13,28412.2%
[
2.0%
-
2.5%
]
2.15%
64,6434.2%
[
2.0%
-
2.5%
]
2.23%
213,1327.8%
[
2.0%
-
2.5%
]
2.39%
36,5174.8%
[
2.0%
-
2.5%
]
2.48%
12,45915.9%
[
2.5%
-
3.0%
]
2.70%
5,6296.4%
[
2.5%
-
3.0%
]
2.73%
31,7714.7%
[
2.5%
-
3.0%
]
2.94%
6,46616.5%
[
3.0%
-
3.5%
]
3.09%
5,9178.2%
[
3.0%
-
3.5%
]
3.19%
1883.0%
[
3.0%
-
3.5%
]
3.24%
5,3716.3%
[
3.0%
-
3.5%
]
3.37%
19,5314.2%
[
3.5%
-
4.0%
]
3.63%
8,20717.5%
[
3.5%
-
4.0%
]
3.74%
9357.4%
[
4.0%
-
4.5%
]
4.00%
8249.5%
[
4.5%
-
5.0%
]
4.67%
2,5085.1%
[
5.0%
-
5.5%
]
5.48%
2,49912.4%
[
6.5%
-
7.0%
]
6.67%
4656.7%
[
11.0%
-
11.5%
]
11.23%
6,96213.8%
[
25.5%
-
26.0%
]
25.80%
31413.8%