Moroccan Unemployment Among Women with Children Ages 6 to 17 years
COMPARE
Moroccan
Select to Compare
Unemployment Among Women with Children Ages 6 to 17 years
Moroccan Unemployment Among Women with Children Ages 6 to 17 years
8.9%
UNEMPLOYMENT | WOMEN W/ CHILDREN 6 TO 17
58.3/ 100
METRIC RATING
166th/ 347
METRIC RANK
Moroccan Unemployment Among Women with Children Ages 6 to 17 years Correlation Chart
The statistical analysis conducted on geographies consisting of 164,501,208 people shows a significant positive correlation between the proportion of Moroccans and unemployment rate among women with children between the ages 6 and 17 in the United States with a correlation coefficient (R) of 0.699 and weighted average of 8.9%. On average, for every 1% (one percent) increase in Moroccans within a typical geography, there is an increase of 9.9% in unemployment rate among women with children between the ages 6 and 17.
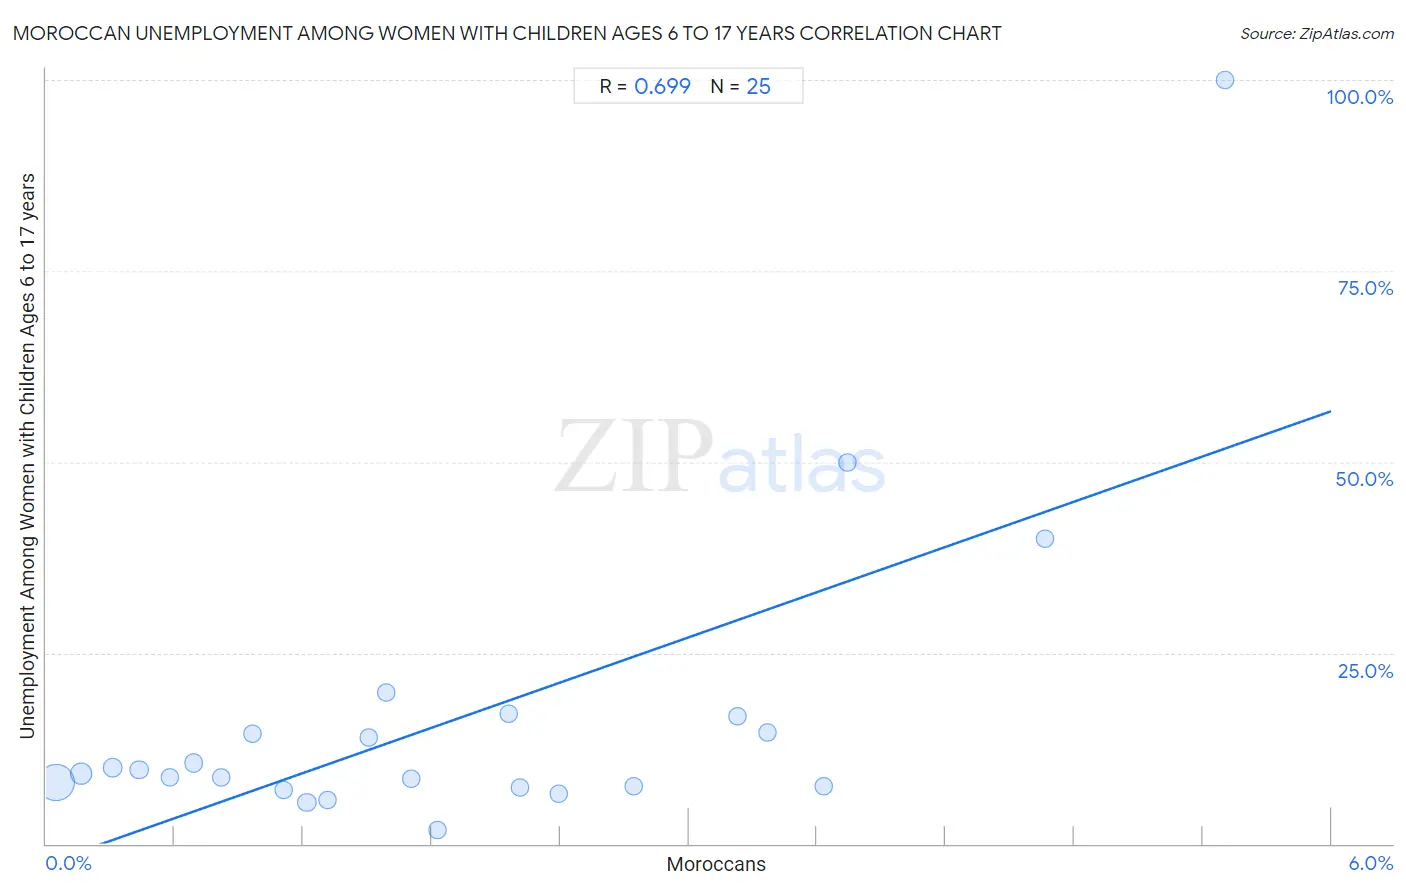
It is essential to understand that the correlation between the percentage of Moroccans and unemployment rate among women with children between the ages 6 and 17 does not imply a direct cause-and-effect relationship. It remains uncertain whether the presence of Moroccans influences an upward or downward trend in the level of unemployment rate among women with children between the ages 6 and 17 within an area, or if Moroccans simply ended up residing in those areas with higher or lower levels of unemployment rate among women with children between the ages 6 and 17 due to other factors.
Demographics Similar to Moroccans by Unemployment Among Women with Children Ages 6 to 17 years
In terms of unemployment among women with children ages 6 to 17 years, the demographic groups most similar to Moroccans are Immigrants from England (8.9%, a difference of 0.030%), Immigrants from Micronesia (8.9%, a difference of 0.040%), Ukrainian (8.9%, a difference of 0.060%), Immigrants from Croatia (8.9%, a difference of 0.060%), and Mexican American Indian (8.9%, a difference of 0.10%).
| Demographics | Rating | Rank | Unemployment Among Women with Children Ages 6 to 17 years |
| Spanish | 63.8 /100 | #159 | Good 8.9% |
| Immigrants from Hungary | 63.4 /100 | #160 | Good 8.9% |
| Immigrants from Guyana | 63.0 /100 | #161 | Good 8.9% |
| Immigrants from Netherlands | 60.8 /100 | #162 | Good 8.9% |
| Mexican American Indians | 60.6 /100 | #163 | Good 8.9% |
| Ukrainians | 59.7 /100 | #164 | Average 8.9% |
| Immigrants from Micronesia | 59.2 /100 | #165 | Average 8.9% |
| Moroccans | 58.3 /100 | #166 | Average 8.9% |
| Immigrants from England | 57.7 /100 | #167 | Average 8.9% |
| Immigrants from Croatia | 57.1 /100 | #168 | Average 8.9% |
| British | 55.2 /100 | #169 | Average 8.9% |
| Turks | 54.1 /100 | #170 | Average 8.9% |
| Jordanians | 52.2 /100 | #171 | Average 9.0% |
| Immigrants from West Indies | 52.2 /100 | #172 | Average 9.0% |
| Immigrants from Brazil | 51.0 /100 | #173 | Average 9.0% |
Moroccan Unemployment Among Women with Children Ages 6 to 17 years Correlation Summary
| Measurement | Moroccan Data | Unemployment Among Women with Children Ages 6 to 17 years Data |
| Minimum | 0.044% | 1.8% |
| Maximum | 5.5% | 100.0% |
| Range | 5.5% | 98.2% |
| Mean | 1.9% | 16.3% |
| Median | 1.6% | 9.1% |
| Interquartile 25% (IQ1) | 0.75% | 7.4% |
| Interquartile 75% (IQ3) | 3.0% | 15.6% |
| Interquartile Range (IQR) | 2.2% | 8.2% |
| Standard Deviation (Sample) | 1.4% | 20.4% |
| Standard Deviation (Population) | 1.4% | 20.0% |
Correlation Details
| Moroccan Percentile | Sample Size | Unemployment Among Women with Children Ages 6 to 17 years |
[ 0.0% - 0.5% ] 0.044% | 124,494,533 | 8.0% |
[ 0.0% - 0.5% ] 0.16% | 26,150,857 | 9.1% |
[ 0.0% - 0.5% ] 0.31% | 6,182,591 | 10.0% |
[ 0.0% - 0.5% ] 0.43% | 3,102,200 | 9.6% |
[ 0.5% - 1.0% ] 0.58% | 1,687,877 | 8.7% |
[ 0.5% - 1.0% ] 0.69% | 1,064,211 | 10.6% |
[ 0.5% - 1.0% ] 0.82% | 723,208 | 8.7% |
[ 0.5% - 1.0% ] 0.96% | 165,775 | 14.3% |
[ 1.0% - 1.5% ] 1.11% | 136,632 | 7.1% |
[ 1.0% - 1.5% ] 1.22% | 381,802 | 5.4% |
[ 1.0% - 1.5% ] 1.32% | 60,267 | 5.7% |
[ 1.5% - 2.0% ] 1.50% | 56,949 | 14.0% |
[ 1.5% - 2.0% ] 1.59% | 34,126 | 19.8% |
[ 1.5% - 2.0% ] 1.71% | 9,141 | 8.5% |
[ 1.5% - 2.0% ] 1.83% | 24,785 | 1.8% |
[ 2.0% - 2.5% ] 2.16% | 18,541 | 17.0% |
[ 2.0% - 2.5% ] 2.21% | 135,984 | 7.4% |
[ 2.0% - 2.5% ] 2.39% | 36,517 | 6.5% |
[ 2.5% - 3.0% ] 2.74% | 2,955 | 7.6% |
[ 3.0% - 3.5% ] 3.23% | 186 | 16.7% |
[ 3.0% - 3.5% ] 3.37% | 19,531 | 14.5% |
[ 3.5% - 4.0% ] 3.63% | 8,207 | 7.5% |
[ 3.5% - 4.0% ] 3.74% | 935 | 50.0% |
[ 4.5% - 5.0% ] 4.67% | 2,508 | 40.0% |
[ 5.5% - 6.0% ] 5.51% | 890 | 100.0% |