Moroccan Female Disability

COMPARE

Moroccan
Race
Ancestry
AfghanAfricanAlaska NativeAlaskan AthabascanAlbanianAleutAlsatianAmericanApacheArabArapahoArgentineanArmenianAssyrian/Chaldean/SyriacAustralianAustrianBahamianBangladeshiBarbadianBasqueBelgianBelizeanBermudanBhutaneseBlackfeetBolivianBrazilianBritishBritish West IndianBulgarianBurmeseCajunCambodianCanadianCape VerdeanCarpatho RusynCelticCentral AmericanCentral American IndianCherokeeCheyenneChickasawChileanChineseChippewaChoctawColombianColvilleComancheCosta RicanCreeCreekCroatianCrowCubanCypriotCzechCzechoslovakianDanishDelawareDominicanDutchDutch West IndianEastern EuropeanEcuadorianEgyptianEnglishEstonianEthiopianEuropeanFijianFilipinoFinnishFrenchFrench American IndianFrench CanadianGermanGerman RussianGhanaianGreekGuamanian/ChamorroGuatemalanGuyaneseHaitianHmongHonduranHopiHoumaHungarianIcelanderIndian (Asian)IndonesianInupiatIranianIraqiIrishIroquoisIsraeliItalianJamaicanJapaneseJordanianKenyanKiowaKoreanLaotianLatvianLebaneseLiberianLithuanianLumbeeLuxembourgerMacedonianMalaysianMalteseMarshalleseMenomineeMexicanMexican American IndianMongolianMoroccanNative HawaiianNavajoNepaleseNew ZealanderNicaraguanNigerianNorthern EuropeanNorwegianOkinawanOsageOttawaPaiutePakistaniPalestinianPanamanianParaguayanPennsylvania GermanPeruvianPimaPolishPortuguesePotawatomiPuebloPuerto RicanPuget Sound SalishRomanianRussianSalvadoranSamoanScandinavianScotch-IrishScottishSeminoleSenegaleseSerbianShoshoneSierra LeoneanSiouxSlavicSlovakSloveneSomaliSouth AfricanSouth AmericanSouth American IndianSoviet UnionSpaniardSpanishSpanish AmericanSpanish American IndianSri LankanSubsaharan AfricanSudaneseSwedishSwissSyrianTaiwaneseThaiTlingit-HaidaTohono O'OdhamTonganTrinidadian and TobagonianTsimshianTurkishU.S. Virgin IslanderUgandanUkrainianUruguayanUteVenezuelanVietnameseWelshWest IndianYakamaYaquiYugoslavianYumanYup'ikZimbabwean
Immigration
NonimmigrantsImmigrantsAfghanistanAfricaAlbaniaArgentinaArmeniaAsiaAustraliaAustriaBahamasBangladeshBarbadosBelarusBelgiumBelizeBoliviaBosnia and HerzegovinaBrazilBulgariaBurma/MyanmarCabo VerdeCambodiaCameroonCanadaCaribbeanCentral AmericaChileChinaColombiaCongoCosta RicaCroatiaCubaCzechoslovakiaDenmarkDominicaDominican RepublicEastern AfricaEastern AsiaEastern EuropeEcuadorEgyptEl SalvadorEnglandEritreaEthiopiaEuropeFijiFranceGermanyGhanaGreeceGrenadaGuatemalaGuyanaHaitiHondurasHong KongHungaryIndiaIndonesiaIranIraqIrelandIsraelItalyJamaicaJapanJordanKazakhstanKenyaKoreaKuwaitLaosLatin AmericaLatviaLebanonLiberiaLithuaniaMalaysiaMexicoMicronesiaMiddle AfricaMoldovaMoroccoNepalNetherlandsNicaraguaNigeriaNorth AmericaNorth MacedoniaNorthern AfricaNorthern EuropeNorwayOceaniaPakistanPanamaPeruPhilippinesPolandPortugalRomaniaRussiaSaudi ArabiaScotlandSenegalSerbiaSierra LeoneSingaporeSomaliaSouth AfricaSouth AmericaSouth Central AsiaSouth Eastern AsiaSouthern EuropeSpainSri LankaSt. Vincent and the GrenadinesSudanSwedenSwitzerlandSyriaTaiwanThailandTrinidad and TobagoTurkeyUgandaUkraineUruguayUzbekistanVenezuelaVietnamWest IndiesWestern AfricaWestern AsiaWestern EuropeYemenZaireZimbabweAzores
Select to Compare
Race
Ancestry
AfghanAfricanAlaska NativeAlaskan AthabascanAlbanianAleutAlsatianAmericanApacheArabArapahoArgentineanArmenianAssyrian/Chaldean/SyriacAustralianAustrianBahamianBangladeshiBarbadianBasqueBelgianBelizeanBermudanBhutaneseBlackfeetBolivianBrazilianBritishBritish West IndianBulgarianBurmeseCajunCambodianCanadianCape VerdeanCarpatho RusynCelticCentral AmericanCentral American IndianCherokeeCheyenneChickasawChileanChineseChippewaChoctawColombianColvilleComancheCosta RicanCreeCreekCroatianCrowCubanCypriotCzechCzechoslovakianDanishDelawareDominicanDutchDutch West IndianEastern EuropeanEcuadorianEgyptianEnglishEstonianEthiopianEuropeanFijianFilipinoFinnishFrenchFrench American IndianFrench CanadianGermanGerman RussianGhanaianGreekGuamanian/ChamorroGuatemalanGuyaneseHaitianHmongHonduranHopiHoumaHungarianIcelanderIndian (Asian)IndonesianInupiatIranianIraqiIrishIroquoisIsraeliItalianJamaicanJapaneseJordanianKenyanKiowaKoreanLaotianLatvianLebaneseLiberianLithuanianLumbeeLuxembourgerMacedonianMalaysianMalteseMarshalleseMenomineeMexicanMexican American IndianMongolianNative HawaiianNavajoNepaleseNew ZealanderNicaraguanNigerianNorthern EuropeanNorwegianOkinawanOsageOttawaPaiutePakistaniPalestinianPanamanianParaguayanPennsylvania GermanPeruvianPimaPolishPortuguesePotawatomiPuebloPuerto RicanPuget Sound SalishRomanianRussianSalvadoranSamoanScandinavianScotch-IrishScottishSeminoleSenegaleseSerbianShoshoneSierra LeoneanSiouxSlavicSlovakSloveneSomaliSouth AfricanSouth AmericanSouth American IndianSoviet UnionSpaniardSpanishSpanish AmericanSpanish American IndianSri LankanSubsaharan AfricanSudaneseSwedishSwissSyrianTaiwaneseThaiTlingit-HaidaTohono O'OdhamTonganTrinidadian and TobagonianTsimshianTurkishU.S. Virgin IslanderUgandanUkrainianUruguayanUteVenezuelanVietnameseWelshWest IndianYakamaYaquiYugoslavianYumanYup'ikZimbabwean
Immigration
NonimmigrantsImmigrantsAfghanistanAfricaAlbaniaArgentinaArmeniaAsiaAustraliaAustriaBahamasBangladeshBarbadosBelarusBelgiumBelizeBoliviaBosnia and HerzegovinaBrazilBulgariaBurma/MyanmarCabo VerdeCambodiaCameroonCanadaCaribbeanCentral AmericaChileChinaColombiaCongoCosta RicaCroatiaCubaCzechoslovakiaDenmarkDominicaDominican RepublicEastern AfricaEastern AsiaEastern EuropeEcuadorEgyptEl SalvadorEnglandEritreaEthiopiaEuropeFijiFranceGermanyGhanaGreeceGrenadaGuatemalaGuyanaHaitiHondurasHong KongHungaryIndiaIndonesiaIranIraqIrelandIsraelItalyJamaicaJapanJordanKazakhstanKenyaKoreaKuwaitLaosLatin AmericaLatviaLebanonLiberiaLithuaniaMalaysiaMexicoMicronesiaMiddle AfricaMoldovaMoroccoNepalNetherlandsNicaraguaNigeriaNorth AmericaNorth MacedoniaNorthern AfricaNorthern EuropeNorwayOceaniaPakistanPanamaPeruPhilippinesPolandPortugalRomaniaRussiaSaudi ArabiaScotlandSenegalSerbiaSierra LeoneSingaporeSomaliaSouth AfricaSouth AmericaSouth Central AsiaSouth Eastern AsiaSouthern EuropeSpainSri LankaSt. Vincent and the GrenadinesSudanSwedenSwitzerlandSyriaTaiwanThailandTrinidad and TobagoTurkeyUgandaUkraineUruguayUzbekistanVenezuelaVietnamWest IndiesWestern AfricaWestern AsiaWestern EuropeYemenZaireZimbabweAzores
Female Disability
Income
Poverty
Unemployment
Labor Participation
Family Structure
Vehicle Availability
Education Level
Disability

Moroccan Female Disability
Good

12.1%
DISABILITY | FEMALES
72.9/ 100
METRIC RATING
156th/ 347
METRIC RANK

Moroccan Female Disability Correlation Chart

The statistical analysis conducted on geographies consisting of 201,802,269 people shows a mild positive correlation between the proportion of Moroccans and percentage of females with a disability in the United States with a correlation coefficient (R) of 0.363 and weighted average of 12.1%. On average, for every 1% (one percent) increase in Moroccans within a typical geography, there is an increase of 0.43% in percentage of females with a disability.
Moroccan Female Disability
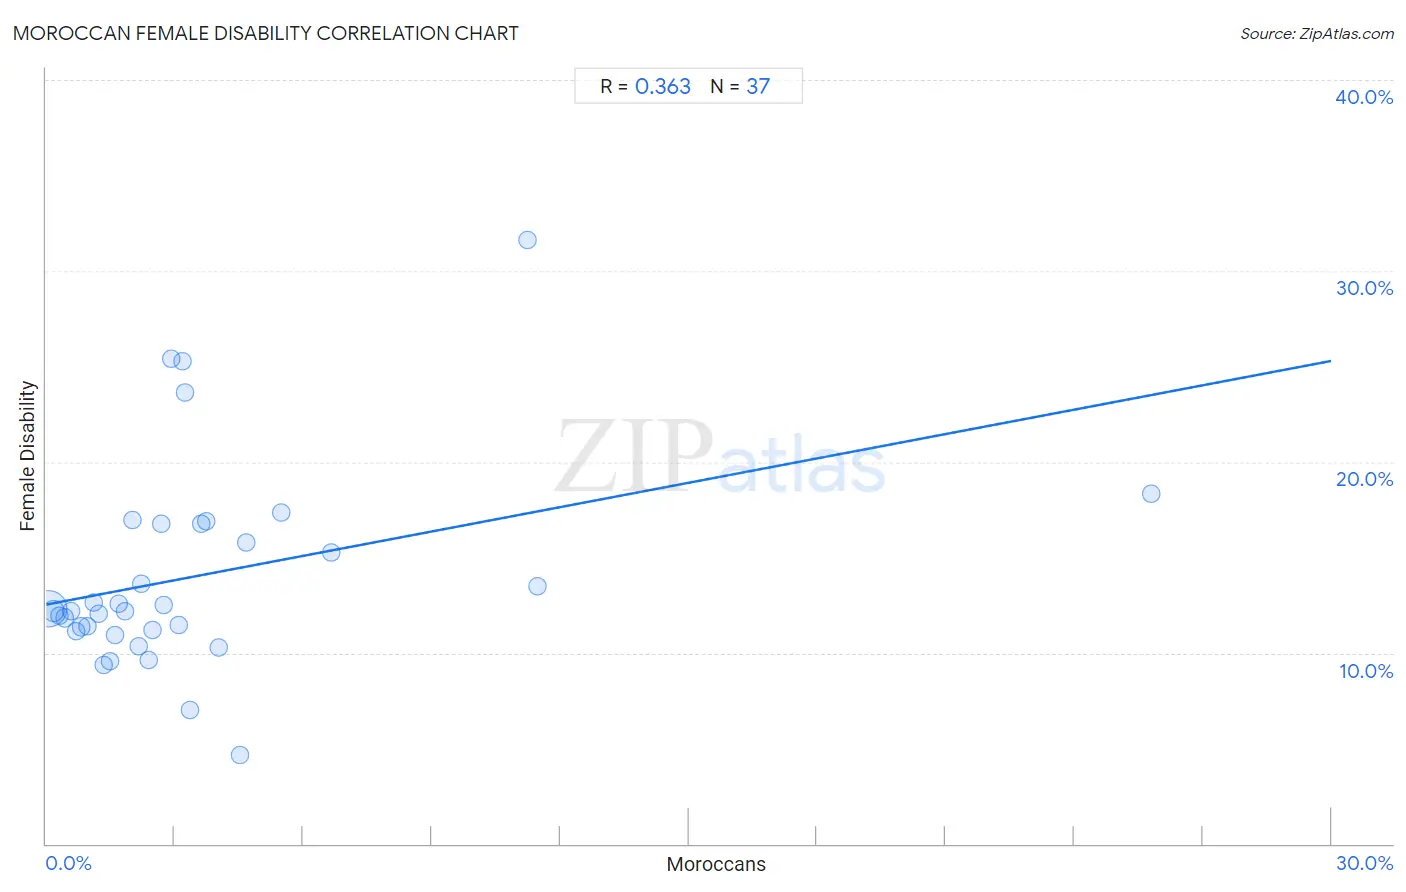
It is essential to understand that the correlation between the percentage of Moroccans and percentage of females with a disability does not imply a direct cause-and-effect relationship. It remains uncertain whether the presence of Moroccans influences an upward or downward trend in the level of percentage of females with a disability within an area, or if Moroccans simply ended up residing in those areas with higher or lower levels of percentage of females with a disability due to other factors.

Demographics Similar to Moroccans by Female Disability

In terms of female disability, the demographic groups most similar to Moroccans are Danish (12.1%, a difference of 0.020%), Immigrants from Middle Africa (12.1%, a difference of 0.020%), Ghanaian (12.1%, a difference of 0.19%), Syrian (12.1%, a difference of 0.20%), and Immigrants from Central America (12.1%, a difference of 0.24%).
DemographicsRating | RankFemale Disability
Greeks
82.0
/100
|
#149
Excellent
12.0%
Immigrants from Moldova
81.4
/100
|
#150
Excellent
12.0%
Icelanders
80.7
/100
|
#151
Excellent
12.0%
Immigrants from Scotland
79.3
/100
|
#152
Good
12.0%
Sudanese
79.1
/100
|
#153
Good
12.0%
Syrians
76.9
/100
|
#154
Good
12.1%
Ghanaians
76.6
/100
|
#155
Good
12.1%
Moroccans
72.9
/100
|
#156
Good
12.1%
Danes
72.5
/100
|
#157
Good
12.1%
Immigrants from Middle Africa
72.4
/100
|
#158
Good
12.1%
Immigrants from Central America
67.7
/100
|
#159
Good
12.1%
Immigrants from Guatemala
66.0
/100
|
#160
Good
12.1%
Guyanese
64.7
/100
|
#161
Good
12.1%
Immigrants from Ukraine
64.3
/100
|
#162
Good
12.1%
Guatemalans
63.8
/100
|
#163
Good
12.1%

Moroccan Female Disability Correlation Summary

MeasurementMoroccan DataFemale Disability Data
Minimum0.046%4.6%
Maximum25.8%31.6%
Range25.7%27.0%
Mean3.5%14.0%
Median2.4%12.2%
Interquartile 25% (IQ1)1.2%11.2%
Interquartile 75% (IQ3)3.7%16.8%
Interquartile Range (IQR)2.5%5.6%
Standard Deviation (Sample)4.6%5.3%
Standard Deviation (Population)4.5%5.3%

Correlation Details

Moroccan PercentileSample SizeFemale Disability
[
0.0%
-
0.5%
]
0.046%
147,568,91312.3%
[
0.0%
-
0.5%
]
0.17%
33,429,40312.2%
[
0.0%
-
0.5%
]
0.31%
8,868,11111.9%
[
0.0%
-
0.5%
]
0.44%
4,356,64611.8%
[
0.5%
-
1.0%
]
0.57%
2,429,65912.2%
[
0.5%
-
1.0%
]
0.70%
1,635,22611.1%
[
0.5%
-
1.0%
]
0.82%
1,060,81311.4%
[
0.5%
-
1.0%
]
0.95%
560,52111.4%
[
1.0%
-
1.5%
]
1.10%
300,12512.7%
[
1.0%
-
1.5%
]
1.22%
472,51212.0%
[
1.0%
-
1.5%
]
1.34%
148,6159.4%
[
1.0%
-
1.5%
]
1.48%
250,4319.5%
[
1.5%
-
2.0%
]
1.60%
132,66411.0%
[
1.5%
-
2.0%
]
1.70%
19,22712.6%
[
1.5%
-
2.0%
]
1.85%
115,69612.2%
[
2.0%
-
2.5%
]
2.02%
16,51617.0%
[
2.0%
-
2.5%
]
2.15%
64,96310.3%
[
2.0%
-
2.5%
]
2.23%
213,40013.6%
[
2.0%
-
2.5%
]
2.39%
37,0659.7%
[
2.0%
-
2.5%
]
2.48%
13,60311.2%
[
2.5%
-
3.0%
]
2.70%
6,37916.7%
[
2.5%
-
3.0%
]
2.73%
31,77112.5%
[
2.5%
-
3.0%
]
2.91%
9,65625.4%
[
3.0%
-
3.5%
]
3.09%
5,91711.5%
[
3.0%
-
3.5%
]
3.19%
18825.3%
[
3.0%
-
3.5%
]
3.24%
5,37123.7%
[
3.0%
-
3.5%
]
3.37%
19,5317.0%
[
3.5%
-
4.0%
]
3.63%
8,20716.8%
[
3.5%
-
4.0%
]
3.74%
93516.9%
[
4.0%
-
4.5%
]
4.02%
1,02010.3%
[
4.5%
-
5.0%
]
4.52%
6,1234.6%
[
4.5%
-
5.0%
]
4.67%
2,50815.8%
[
5.0%
-
5.5%
]
5.48%
2,49917.4%
[
6.5%
-
7.0%
]
6.67%
46515.3%
[
11.0%
-
11.5%
]
11.23%
6,96231.6%
[
11.0%
-
11.5%
]
11.46%
31413.5%
[
25.5%
-
26.0%
]
25.80%
31418.3%