Moroccan 3 or more Vehicles in Household

COMPARE

Moroccan
Race
Ancestry
AfghanAfricanAlaska NativeAlaskan AthabascanAlbanianAleutAlsatianAmericanApacheArabArapahoArgentineanArmenianAssyrian/Chaldean/SyriacAustralianAustrianBahamianBangladeshiBarbadianBasqueBelgianBelizeanBermudanBhutaneseBlackfeetBolivianBrazilianBritishBritish West IndianBulgarianBurmeseCajunCambodianCanadianCape VerdeanCarpatho RusynCelticCentral AmericanCentral American IndianCherokeeCheyenneChickasawChileanChineseChippewaChoctawColombianColvilleComancheCosta RicanCreeCreekCroatianCrowCubanCypriotCzechCzechoslovakianDanishDelawareDominicanDutchDutch West IndianEastern EuropeanEcuadorianEgyptianEnglishEstonianEthiopianEuropeanFijianFilipinoFinnishFrenchFrench American IndianFrench CanadianGermanGerman RussianGhanaianGreekGuamanian/ChamorroGuatemalanGuyaneseHaitianHmongHonduranHopiHoumaHungarianIcelanderIndian (Asian)IndonesianInupiatIranianIraqiIrishIroquoisIsraeliItalianJamaicanJapaneseJordanianKenyanKiowaKoreanLaotianLatvianLebaneseLiberianLithuanianLumbeeLuxembourgerMacedonianMalaysianMalteseMarshalleseMenomineeMexicanMexican American IndianMongolianMoroccanNative HawaiianNavajoNepaleseNew ZealanderNicaraguanNigerianNorthern EuropeanNorwegianOkinawanOsageOttawaPaiutePakistaniPalestinianPanamanianParaguayanPennsylvania GermanPeruvianPimaPolishPortuguesePotawatomiPuebloPuerto RicanPuget Sound SalishRomanianRussianSalvadoranSamoanScandinavianScotch-IrishScottishSeminoleSenegaleseSerbianShoshoneSierra LeoneanSiouxSlavicSlovakSloveneSomaliSouth AfricanSouth AmericanSouth American IndianSoviet UnionSpaniardSpanishSpanish AmericanSpanish American IndianSri LankanSubsaharan AfricanSudaneseSwedishSwissSyrianTaiwaneseThaiTlingit-HaidaTohono O'OdhamTonganTrinidadian and TobagonianTsimshianTurkishU.S. Virgin IslanderUgandanUkrainianUruguayanUteVenezuelanVietnameseWelshWest IndianYakamaYaquiYugoslavianYumanYup'ikZimbabwean
Immigration
NonimmigrantsImmigrantsAfghanistanAfricaAlbaniaArgentinaArmeniaAsiaAustraliaAustriaBahamasBangladeshBarbadosBelarusBelgiumBelizeBoliviaBosnia and HerzegovinaBrazilBulgariaBurma/MyanmarCabo VerdeCambodiaCameroonCanadaCaribbeanCentral AmericaChileChinaColombiaCongoCosta RicaCroatiaCubaCzechoslovakiaDenmarkDominicaDominican RepublicEastern AfricaEastern AsiaEastern EuropeEcuadorEgyptEl SalvadorEnglandEritreaEthiopiaEuropeFijiFranceGermanyGhanaGreeceGrenadaGuatemalaGuyanaHaitiHondurasHong KongHungaryIndiaIndonesiaIranIraqIrelandIsraelItalyJamaicaJapanJordanKazakhstanKenyaKoreaKuwaitLaosLatin AmericaLatviaLebanonLiberiaLithuaniaMalaysiaMexicoMicronesiaMiddle AfricaMoldovaMoroccoNepalNetherlandsNicaraguaNigeriaNorth AmericaNorth MacedoniaNorthern AfricaNorthern EuropeNorwayOceaniaPakistanPanamaPeruPhilippinesPolandPortugalRomaniaRussiaSaudi ArabiaScotlandSenegalSerbiaSierra LeoneSingaporeSomaliaSouth AfricaSouth AmericaSouth Central AsiaSouth Eastern AsiaSouthern EuropeSpainSri LankaSt. Vincent and the GrenadinesSudanSwedenSwitzerlandSyriaTaiwanThailandTrinidad and TobagoTurkeyUgandaUkraineUruguayUzbekistanVenezuelaVietnamWest IndiesWestern AfricaWestern AsiaWestern EuropeYemenZaireZimbabweAzores
Select to Compare
Race
Ancestry
AfghanAfricanAlaska NativeAlaskan AthabascanAlbanianAleutAlsatianAmericanApacheArabArapahoArgentineanArmenianAssyrian/Chaldean/SyriacAustralianAustrianBahamianBangladeshiBarbadianBasqueBelgianBelizeanBermudanBhutaneseBlackfeetBolivianBrazilianBritishBritish West IndianBulgarianBurmeseCajunCambodianCanadianCape VerdeanCarpatho RusynCelticCentral AmericanCentral American IndianCherokeeCheyenneChickasawChileanChineseChippewaChoctawColombianColvilleComancheCosta RicanCreeCreekCroatianCrowCubanCypriotCzechCzechoslovakianDanishDelawareDominicanDutchDutch West IndianEastern EuropeanEcuadorianEgyptianEnglishEstonianEthiopianEuropeanFijianFilipinoFinnishFrenchFrench American IndianFrench CanadianGermanGerman RussianGhanaianGreekGuamanian/ChamorroGuatemalanGuyaneseHaitianHmongHonduranHopiHoumaHungarianIcelanderIndian (Asian)IndonesianInupiatIranianIraqiIrishIroquoisIsraeliItalianJamaicanJapaneseJordanianKenyanKiowaKoreanLaotianLatvianLebaneseLiberianLithuanianLumbeeLuxembourgerMacedonianMalaysianMalteseMarshalleseMenomineeMexicanMexican American IndianMongolianNative HawaiianNavajoNepaleseNew ZealanderNicaraguanNigerianNorthern EuropeanNorwegianOkinawanOsageOttawaPaiutePakistaniPalestinianPanamanianParaguayanPennsylvania GermanPeruvianPimaPolishPortuguesePotawatomiPuebloPuerto RicanPuget Sound SalishRomanianRussianSalvadoranSamoanScandinavianScotch-IrishScottishSeminoleSenegaleseSerbianShoshoneSierra LeoneanSiouxSlavicSlovakSloveneSomaliSouth AfricanSouth AmericanSouth American IndianSoviet UnionSpaniardSpanishSpanish AmericanSpanish American IndianSri LankanSubsaharan AfricanSudaneseSwedishSwissSyrianTaiwaneseThaiTlingit-HaidaTohono O'OdhamTonganTrinidadian and TobagonianTsimshianTurkishU.S. Virgin IslanderUgandanUkrainianUruguayanUteVenezuelanVietnameseWelshWest IndianYakamaYaquiYugoslavianYumanYup'ikZimbabwean
Immigration
NonimmigrantsImmigrantsAfghanistanAfricaAlbaniaArgentinaArmeniaAsiaAustraliaAustriaBahamasBangladeshBarbadosBelarusBelgiumBelizeBoliviaBosnia and HerzegovinaBrazilBulgariaBurma/MyanmarCabo VerdeCambodiaCameroonCanadaCaribbeanCentral AmericaChileChinaColombiaCongoCosta RicaCroatiaCubaCzechoslovakiaDenmarkDominicaDominican RepublicEastern AfricaEastern AsiaEastern EuropeEcuadorEgyptEl SalvadorEnglandEritreaEthiopiaEuropeFijiFranceGermanyGhanaGreeceGrenadaGuatemalaGuyanaHaitiHondurasHong KongHungaryIndiaIndonesiaIranIraqIrelandIsraelItalyJamaicaJapanJordanKazakhstanKenyaKoreaKuwaitLaosLatin AmericaLatviaLebanonLiberiaLithuaniaMalaysiaMexicoMicronesiaMiddle AfricaMoldovaMoroccoNepalNetherlandsNicaraguaNigeriaNorth AmericaNorth MacedoniaNorthern AfricaNorthern EuropeNorwayOceaniaPakistanPanamaPeruPhilippinesPolandPortugalRomaniaRussiaSaudi ArabiaScotlandSenegalSerbiaSierra LeoneSingaporeSomaliaSouth AfricaSouth AmericaSouth Central AsiaSouth Eastern AsiaSouthern EuropeSpainSri LankaSt. Vincent and the GrenadinesSudanSwedenSwitzerlandSyriaTaiwanThailandTrinidad and TobagoTurkeyUgandaUkraineUruguayUzbekistanVenezuelaVietnamWest IndiesWestern AfricaWestern AsiaWestern EuropeYemenZaireZimbabweAzores
3 or more Vehicles in Household
Income
Poverty
Unemployment
Labor Participation
Family Structure
Vehicle Availability
Education Level
Disability

Moroccan 3 or more Vehicles in Household
Tragic

15.9%
3+ VEHICLES AVAILABLE
0.0/ 100
METRIC RATING
310th/ 347
METRIC RANK

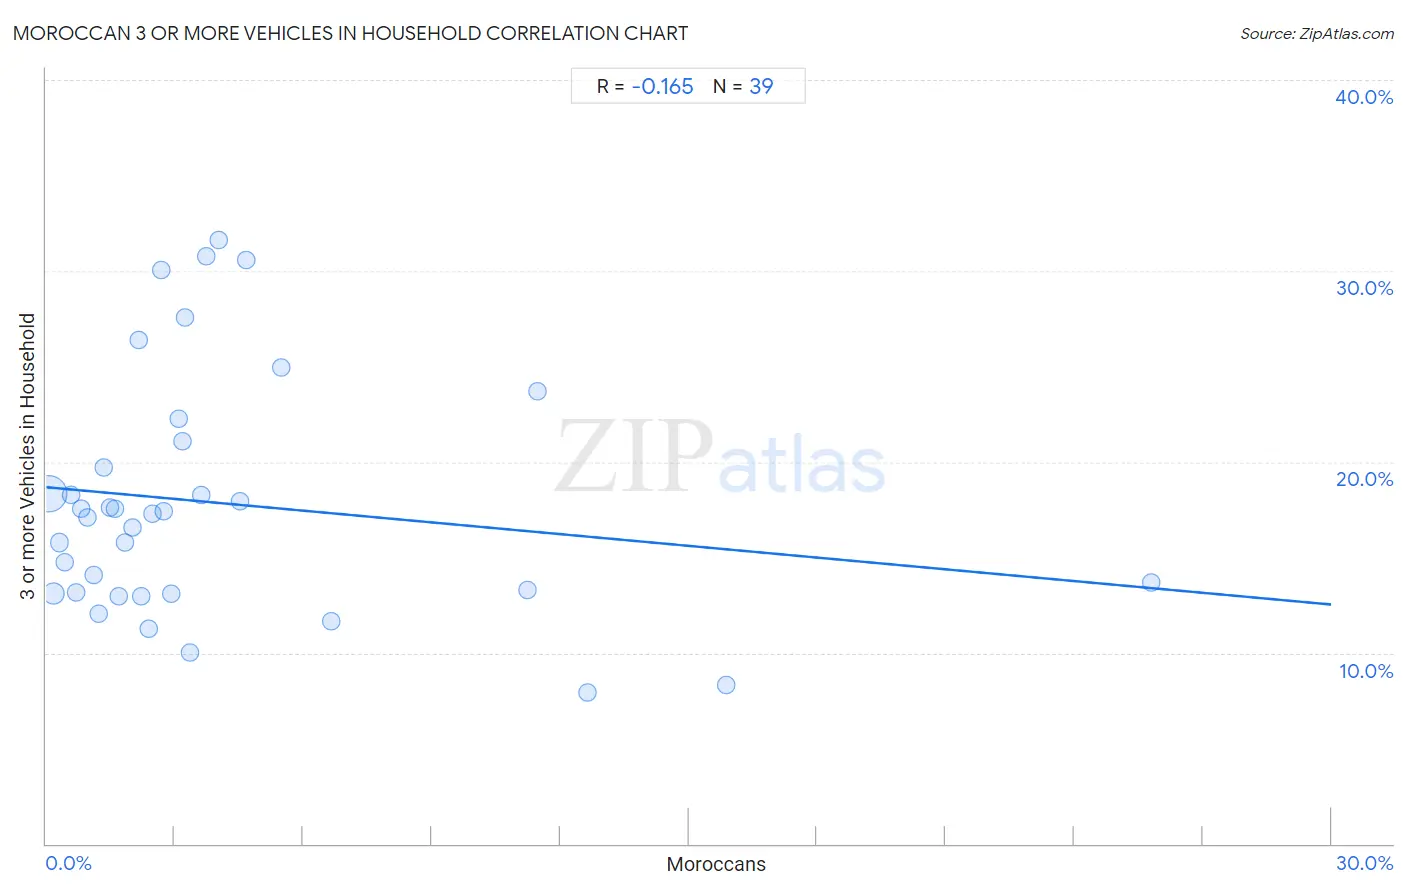
Moroccan 3 or more Vehicles in Household Correlation Chart

The statistical analysis conducted on geographies consisting of 201,717,590 people shows a poor negative correlation between the proportion of Moroccans and percentage of households with 3 or more vehicles available in the United States with a correlation coefficient (R) of -0.165 and weighted average of 15.9%. On average, for every 1% (one percent) increase in Moroccans within a typical geography, there is a decrease of 0.20% in percentage of households with 3 or more vehicles available.
Moroccan 3 or more Vehicles in Household
It is essential to understand that the correlation between the percentage of Moroccans and percentage of households with 3 or more vehicles available does not imply a direct cause-and-effect relationship. It remains uncertain whether the presence of Moroccans influences an upward or downward trend in the level of percentage of households with 3 or more vehicles available within an area, or if Moroccans simply ended up residing in those areas with higher or lower levels of percentage of households with 3 or more vehicles available due to other factors.

Demographics Similar to Moroccans by 3 or more Vehicles in Household

In terms of 3 or more vehicles in household, the demographic groups most similar to Moroccans are Immigrants from Somalia (15.9%, a difference of 0.24%), Albanian (15.8%, a difference of 0.50%), Houma (16.1%, a difference of 1.2%), Puerto Rican (15.6%, a difference of 1.6%), and Immigrants from Israel (15.6%, a difference of 1.7%).
DemographicsRating | Rank3 or more Vehicles in Household
Immigrants from Serbia
0.0
/100
|
#303
Tragic
16.4%
Ghanaians
0.0
/100
|
#304
Tragic
16.4%
Immigrants from Morocco
0.0
/100
|
#305
Tragic
16.3%
Somalis
0.0
/100
|
#306
Tragic
16.2%
Immigrants from Ghana
0.0
/100
|
#307
Tragic
16.2%
Houma
0.0
/100
|
#308
Tragic
16.1%
Immigrants from Somalia
0.0
/100
|
#309
Tragic
15.9%
Moroccans
0.0
/100
|
#310
Tragic
15.9%
Albanians
0.0
/100
|
#311
Tragic
15.8%
Puerto Ricans
0.0
/100
|
#312
Tragic
15.6%
Immigrants from Israel
0.0
/100
|
#313
Tragic
15.6%
Immigrants from Belarus
0.0
/100
|
#314
Tragic
15.5%
Haitians
0.0
/100
|
#315
Tragic
15.5%
U.S. Virgin Islanders
0.0
/100
|
#316
Tragic
15.4%
Jamaicans
0.0
/100
|
#317
Tragic
15.2%

Moroccan 3 or more Vehicles in Household Correlation Summary

MeasurementMoroccan Data3 or more Vehicles in Household Data
Minimum0.046%7.9%
Maximum25.8%31.7%
Range25.7%23.7%
Mean4.0%17.9%
Median2.5%17.3%
Interquartile 25% (IQ1)1.2%13.1%
Interquartile 75% (IQ3)4.0%21.1%
Interquartile Range (IQR)2.8%8.0%
Standard Deviation (Sample)5.1%6.3%
Standard Deviation (Population)5.0%6.2%

Correlation Details

Moroccan PercentileSample Size3 or more Vehicles in Household
[
0.0%
-
0.5%
]
0.046%
147,546,60018.3%
[
0.0%
-
0.5%
]
0.17%
33,401,20613.1%
[
0.0%
-
0.5%
]
0.31%
8,852,26015.7%
[
0.0%
-
0.5%
]
0.44%
4,347,88114.7%
[
0.5%
-
1.0%
]
0.57%
2,425,87518.3%
[
0.5%
-
1.0%
]
0.70%
1,635,22613.2%
[
0.5%
-
1.0%
]
0.82%
1,060,81317.5%
[
0.5%
-
1.0%
]
0.95%
560,52117.1%
[
1.0%
-
1.5%
]
1.10%
293,38214.1%
[
1.0%
-
1.5%
]
1.22%
472,51212.0%
[
1.0%
-
1.5%
]
1.34%
148,61519.7%
[
1.0%
-
1.5%
]
1.48%
250,43117.6%
[
1.5%
-
2.0%
]
1.60%
132,66417.5%
[
1.5%
-
2.0%
]
1.70%
19,22712.9%
[
1.5%
-
2.0%
]
1.85%
115,69615.8%
[
2.0%
-
2.5%
]
2.02%
16,51616.6%
[
2.0%
-
2.5%
]
2.15%
64,96326.4%
[
2.0%
-
2.5%
]
2.23%
213,40012.9%
[
2.0%
-
2.5%
]
2.39%
37,06511.2%
[
2.0%
-
2.5%
]
2.48%
13,60317.3%
[
2.5%
-
3.0%
]
2.70%
6,37930.0%
[
2.5%
-
3.0%
]
2.73%
31,77117.4%
[
2.5%
-
3.0%
]
2.91%
9,65613.1%
[
3.0%
-
3.5%
]
3.09%
5,91722.2%
[
3.0%
-
3.5%
]
3.19%
18821.1%
[
3.0%
-
3.5%
]
3.24%
5,37127.5%
[
3.0%
-
3.5%
]
3.37%
19,53110.0%
[
3.5%
-
4.0%
]
3.63%
8,20718.3%
[
3.5%
-
4.0%
]
3.74%
93530.8%
[
4.0%
-
4.5%
]
4.02%
1,02031.7%
[
4.5%
-
5.0%
]
4.52%
6,12318.0%
[
4.5%
-
5.0%
]
4.67%
2,50830.6%
[
5.0%
-
5.5%
]
5.48%
2,49924.9%
[
6.5%
-
7.0%
]
6.67%
46511.7%
[
11.0%
-
11.5%
]
11.23%
6,96213.3%
[
11.0%
-
11.5%
]
11.46%
31423.7%
[
12.5%
-
13.0%
]
12.65%
3327.9%
[
15.5%
-
16.0%
]
15.89%
6428.3%
[
25.5%
-
26.0%
]
25.80%
31413.7%