Moroccan Self-Care Disability

COMPARE

Moroccan
Race
Ancestry
AfghanAfricanAlaska NativeAlaskan AthabascanAlbanianAleutAlsatianAmericanApacheArabArapahoArgentineanArmenianAssyrian/Chaldean/SyriacAustralianAustrianBahamianBangladeshiBarbadianBasqueBelgianBelizeanBermudanBhutaneseBlackfeetBolivianBrazilianBritishBritish West IndianBulgarianBurmeseCajunCambodianCanadianCape VerdeanCarpatho RusynCelticCentral AmericanCentral American IndianCherokeeCheyenneChickasawChileanChineseChippewaChoctawColombianColvilleComancheCosta RicanCreeCreekCroatianCrowCubanCypriotCzechCzechoslovakianDanishDelawareDominicanDutchDutch West IndianEastern EuropeanEcuadorianEgyptianEnglishEstonianEthiopianEuropeanFijianFilipinoFinnishFrenchFrench American IndianFrench CanadianGermanGerman RussianGhanaianGreekGuamanian/ChamorroGuatemalanGuyaneseHaitianHmongHonduranHopiHoumaHungarianIcelanderIndian (Asian)IndonesianInupiatIranianIraqiIrishIroquoisIsraeliItalianJamaicanJapaneseJordanianKenyanKiowaKoreanLaotianLatvianLebaneseLiberianLithuanianLumbeeLuxembourgerMacedonianMalaysianMalteseMarshalleseMenomineeMexicanMexican American IndianMongolianMoroccanNative HawaiianNavajoNepaleseNew ZealanderNicaraguanNigerianNorthern EuropeanNorwegianOkinawanOsageOttawaPaiutePakistaniPalestinianPanamanianParaguayanPennsylvania GermanPeruvianPimaPolishPortuguesePotawatomiPuebloPuerto RicanPuget Sound SalishRomanianRussianSalvadoranSamoanScandinavianScotch-IrishScottishSeminoleSenegaleseSerbianShoshoneSierra LeoneanSiouxSlavicSlovakSloveneSomaliSouth AfricanSouth AmericanSouth American IndianSoviet UnionSpaniardSpanishSpanish AmericanSpanish American IndianSri LankanSubsaharan AfricanSudaneseSwedishSwissSyrianTaiwaneseThaiTlingit-HaidaTohono O'OdhamTonganTrinidadian and TobagonianTsimshianTurkishU.S. Virgin IslanderUgandanUkrainianUruguayanUteVenezuelanVietnameseWelshWest IndianYakamaYaquiYugoslavianYumanYup'ikZimbabwean
Immigration
NonimmigrantsImmigrantsAfghanistanAfricaAlbaniaArgentinaArmeniaAsiaAustraliaAustriaBahamasBangladeshBarbadosBelarusBelgiumBelizeBoliviaBosnia and HerzegovinaBrazilBulgariaBurma/MyanmarCabo VerdeCambodiaCameroonCanadaCaribbeanCentral AmericaChileChinaColombiaCongoCosta RicaCroatiaCubaCzechoslovakiaDenmarkDominicaDominican RepublicEastern AfricaEastern AsiaEastern EuropeEcuadorEgyptEl SalvadorEnglandEritreaEthiopiaEuropeFijiFranceGermanyGhanaGreeceGrenadaGuatemalaGuyanaHaitiHondurasHong KongHungaryIndiaIndonesiaIranIraqIrelandIsraelItalyJamaicaJapanJordanKazakhstanKenyaKoreaKuwaitLaosLatin AmericaLatviaLebanonLiberiaLithuaniaMalaysiaMexicoMicronesiaMiddle AfricaMoldovaMoroccoNepalNetherlandsNicaraguaNigeriaNorth AmericaNorth MacedoniaNorthern AfricaNorthern EuropeNorwayOceaniaPakistanPanamaPeruPhilippinesPolandPortugalRomaniaRussiaSaudi ArabiaScotlandSenegalSerbiaSierra LeoneSingaporeSomaliaSouth AfricaSouth AmericaSouth Central AsiaSouth Eastern AsiaSouthern EuropeSpainSri LankaSt. Vincent and the GrenadinesSudanSwedenSwitzerlandSyriaTaiwanThailandTrinidad and TobagoTurkeyUgandaUkraineUruguayUzbekistanVenezuelaVietnamWest IndiesWestern AfricaWestern AsiaWestern EuropeYemenZaireZimbabweAzores
Select to Compare
Race
Ancestry
AfghanAfricanAlaska NativeAlaskan AthabascanAlbanianAleutAlsatianAmericanApacheArabArapahoArgentineanArmenianAssyrian/Chaldean/SyriacAustralianAustrianBahamianBangladeshiBarbadianBasqueBelgianBelizeanBermudanBhutaneseBlackfeetBolivianBrazilianBritishBritish West IndianBulgarianBurmeseCajunCambodianCanadianCape VerdeanCarpatho RusynCelticCentral AmericanCentral American IndianCherokeeCheyenneChickasawChileanChineseChippewaChoctawColombianColvilleComancheCosta RicanCreeCreekCroatianCrowCubanCypriotCzechCzechoslovakianDanishDelawareDominicanDutchDutch West IndianEastern EuropeanEcuadorianEgyptianEnglishEstonianEthiopianEuropeanFijianFilipinoFinnishFrenchFrench American IndianFrench CanadianGermanGerman RussianGhanaianGreekGuamanian/ChamorroGuatemalanGuyaneseHaitianHmongHonduranHopiHoumaHungarianIcelanderIndian (Asian)IndonesianInupiatIranianIraqiIrishIroquoisIsraeliItalianJamaicanJapaneseJordanianKenyanKiowaKoreanLaotianLatvianLebaneseLiberianLithuanianLumbeeLuxembourgerMacedonianMalaysianMalteseMarshalleseMenomineeMexicanMexican American IndianMongolianNative HawaiianNavajoNepaleseNew ZealanderNicaraguanNigerianNorthern EuropeanNorwegianOkinawanOsageOttawaPaiutePakistaniPalestinianPanamanianParaguayanPennsylvania GermanPeruvianPimaPolishPortuguesePotawatomiPuebloPuerto RicanPuget Sound SalishRomanianRussianSalvadoranSamoanScandinavianScotch-IrishScottishSeminoleSenegaleseSerbianShoshoneSierra LeoneanSiouxSlavicSlovakSloveneSomaliSouth AfricanSouth AmericanSouth American IndianSoviet UnionSpaniardSpanishSpanish AmericanSpanish American IndianSri LankanSubsaharan AfricanSudaneseSwedishSwissSyrianTaiwaneseThaiTlingit-HaidaTohono O'OdhamTonganTrinidadian and TobagonianTsimshianTurkishU.S. Virgin IslanderUgandanUkrainianUruguayanUteVenezuelanVietnameseWelshWest IndianYakamaYaquiYugoslavianYumanYup'ikZimbabwean
Immigration
NonimmigrantsImmigrantsAfghanistanAfricaAlbaniaArgentinaArmeniaAsiaAustraliaAustriaBahamasBangladeshBarbadosBelarusBelgiumBelizeBoliviaBosnia and HerzegovinaBrazilBulgariaBurma/MyanmarCabo VerdeCambodiaCameroonCanadaCaribbeanCentral AmericaChileChinaColombiaCongoCosta RicaCroatiaCubaCzechoslovakiaDenmarkDominicaDominican RepublicEastern AfricaEastern AsiaEastern EuropeEcuadorEgyptEl SalvadorEnglandEritreaEthiopiaEuropeFijiFranceGermanyGhanaGreeceGrenadaGuatemalaGuyanaHaitiHondurasHong KongHungaryIndiaIndonesiaIranIraqIrelandIsraelItalyJamaicaJapanJordanKazakhstanKenyaKoreaKuwaitLaosLatin AmericaLatviaLebanonLiberiaLithuaniaMalaysiaMexicoMicronesiaMiddle AfricaMoldovaMoroccoNepalNetherlandsNicaraguaNigeriaNorth AmericaNorth MacedoniaNorthern AfricaNorthern EuropeNorwayOceaniaPakistanPanamaPeruPhilippinesPolandPortugalRomaniaRussiaSaudi ArabiaScotlandSenegalSerbiaSierra LeoneSingaporeSomaliaSouth AfricaSouth AmericaSouth Central AsiaSouth Eastern AsiaSouthern EuropeSpainSri LankaSt. Vincent and the GrenadinesSudanSwedenSwitzerlandSyriaTaiwanThailandTrinidad and TobagoTurkeyUgandaUkraineUruguayUzbekistanVenezuelaVietnamWest IndiesWestern AfricaWestern AsiaWestern EuropeYemenZaireZimbabweAzores
Self-Care Disability
Income
Poverty
Unemployment
Labor Participation
Family Structure
Vehicle Availability
Education Level
Disability

Moroccan Self-Care Disability
Fair

2.5%
SELF-CARE DISABILITY
22.9/ 100
METRIC RATING
191st/ 347
METRIC RANK

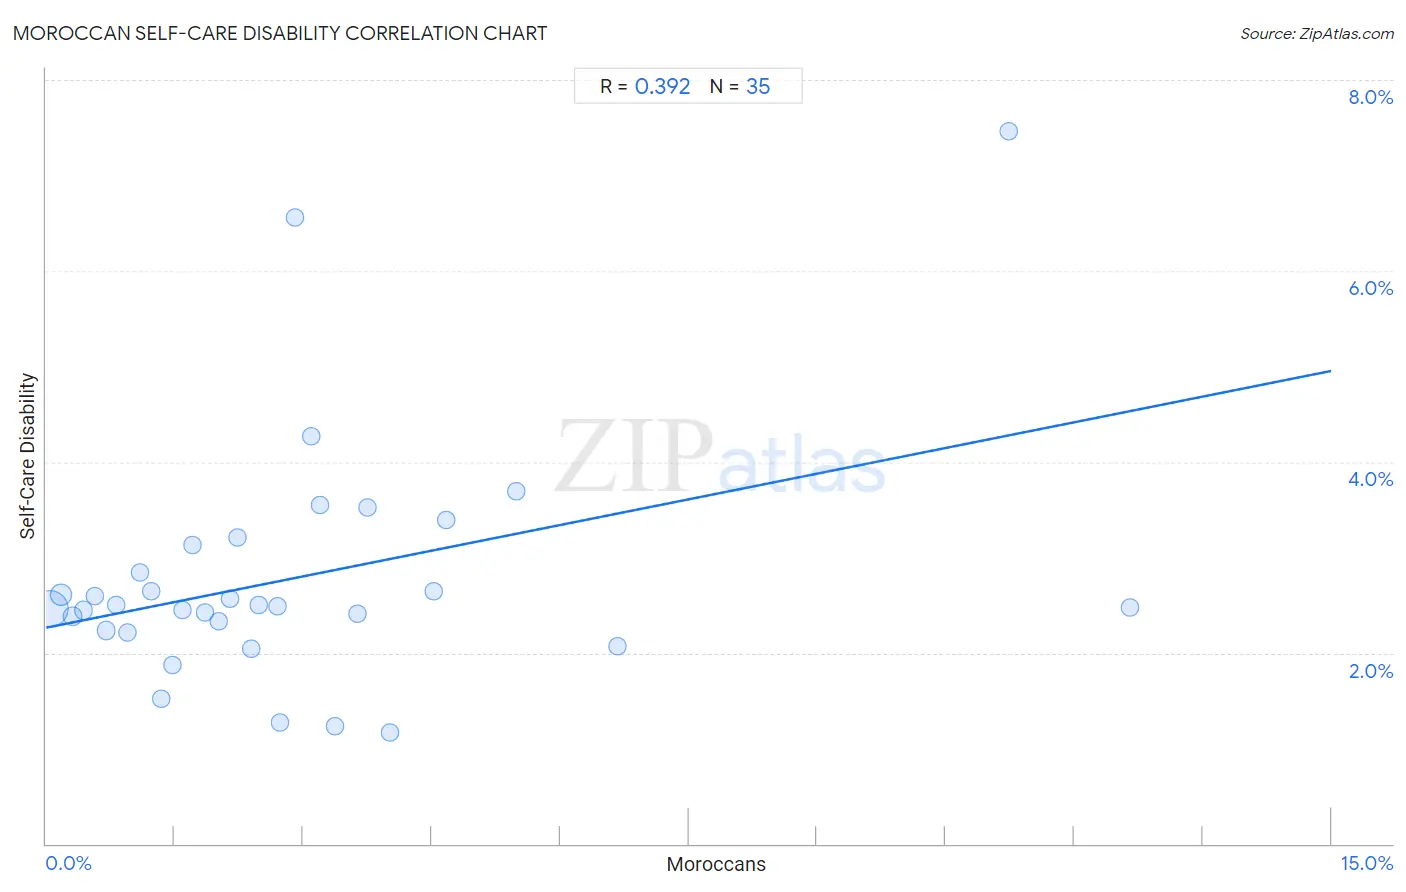
Moroccan Self-Care Disability Correlation Chart

The statistical analysis conducted on geographies consisting of 201,730,975 people shows a mild positive correlation between the proportion of Moroccans and percentage of population with self-care disability in the United States with a correlation coefficient (R) of 0.392 and weighted average of 2.5%. On average, for every 1% (one percent) increase in Moroccans within a typical geography, there is an increase of 0.18% in percentage of population with self-care disability.
Moroccan Self-Care Disability
It is essential to understand that the correlation between the percentage of Moroccans and percentage of population with self-care disability does not imply a direct cause-and-effect relationship. It remains uncertain whether the presence of Moroccans influences an upward or downward trend in the level of percentage of population with self-care disability within an area, or if Moroccans simply ended up residing in those areas with higher or lower levels of percentage of population with self-care disability due to other factors.

Demographics Similar to Moroccans by Self-Care Disability

In terms of self-care disability, the demographic groups most similar to Moroccans are Soviet Union (2.5%, a difference of 0.050%), Sioux (2.5%, a difference of 0.11%), Ukrainian (2.5%, a difference of 0.11%), Immigrants from Eastern Europe (2.5%, a difference of 0.32%), and Immigrants from Oceania (2.5%, a difference of 0.33%).
DemographicsRating | RankSelf-Care Disability
Yugoslavians
36.1
/100
|
#184
Fair
2.5%
Slavs
34.3
/100
|
#185
Fair
2.5%
Immigrants from El Salvador
33.0
/100
|
#186
Fair
2.5%
Irish
28.7
/100
|
#187
Fair
2.5%
Immigrants from Oceania
28.3
/100
|
#188
Fair
2.5%
Immigrants from Eastern Europe
28.0
/100
|
#189
Fair
2.5%
Sioux
24.6
/100
|
#190
Fair
2.5%
Moroccans
22.9
/100
|
#191
Fair
2.5%
Soviet Union
22.2
/100
|
#192
Fair
2.5%
Ukrainians
21.4
/100
|
#193
Fair
2.5%
Immigrants from Germany
17.9
/100
|
#194
Poor
2.5%
Immigrants from Southern Europe
15.6
/100
|
#195
Poor
2.5%
Koreans
15.5
/100
|
#196
Poor
2.5%
Crow
15.2
/100
|
#197
Poor
2.5%
Immigrants
15.0
/100
|
#198
Poor
2.5%

Moroccan Self-Care Disability Correlation Summary

MeasurementMoroccan DataSelf-Care Disability Data
Minimum0.046%1.2%
Maximum12.7%7.5%
Range12.6%6.3%
Mean2.9%2.8%
Median2.2%2.5%
Interquartile 25% (IQ1)1.1%2.2%
Interquartile 75% (IQ3)3.6%3.1%
Interquartile Range (IQR)2.5%0.89%
Standard Deviation (Sample)2.8%1.3%
Standard Deviation (Population)2.7%1.2%

Correlation Details

Moroccan PercentileSample SizeSelf-Care Disability
[
0.0%
-
0.5%
]
0.046%
147,533,0572.5%
[
0.0%
-
0.5%
]
0.17%
33,418,8722.6%
[
0.0%
-
0.5%
]
0.31%
8,870,7232.4%
[
0.0%
-
0.5%
]
0.44%
4,349,2322.4%
[
0.5%
-
1.0%
]
0.57%
2,425,1442.6%
[
0.5%
-
1.0%
]
0.70%
1,629,1722.2%
[
0.5%
-
1.0%
]
0.82%
1,060,8132.5%
[
0.5%
-
1.0%
]
0.95%
560,5212.2%
[
1.0%
-
1.5%
]
1.10%
297,5542.8%
[
1.0%
-
1.5%
]
1.22%
472,5122.6%
[
1.0%
-
1.5%
]
1.34%
148,6151.5%
[
1.0%
-
1.5%
]
1.48%
250,4311.9%
[
1.5%
-
2.0%
]
1.60%
132,6642.4%
[
1.5%
-
2.0%
]
1.70%
19,2273.1%
[
1.5%
-
2.0%
]
1.85%
115,6962.4%
[
2.0%
-
2.5%
]
2.02%
16,5162.3%
[
2.0%
-
2.5%
]
2.15%
64,9632.6%
[
2.0%
-
2.5%
]
2.23%
213,4003.2%
[
2.0%
-
2.5%
]
2.39%
36,5172.0%
[
2.0%
-
2.5%
]
2.48%
13,6032.5%
[
2.5%
-
3.0%
]
2.70%
5,6292.5%
[
2.5%
-
3.0%
]
2.73%
31,7711.3%
[
2.5%
-
3.0%
]
2.91%
9,6566.6%
[
3.0%
-
3.5%
]
3.09%
5,9174.3%
[
3.0%
-
3.5%
]
3.19%
1883.6%
[
3.0%
-
3.5%
]
3.37%
19,5311.2%
[
3.5%
-
4.0%
]
3.63%
8,2072.4%
[
3.5%
-
4.0%
]
3.74%
9353.5%
[
4.0%
-
4.5%
]
4.02%
1,0201.2%
[
4.5%
-
5.0%
]
4.52%
6,1232.6%
[
4.5%
-
5.0%
]
4.67%
2,5083.4%
[
5.0%
-
5.5%
]
5.48%
2,4993.7%
[
6.5%
-
7.0%
]
6.67%
4652.1%
[
11.0%
-
11.5%
]
11.23%
6,9627.5%
[
12.5%
-
13.0%
]
12.65%
3322.5%